identification of tmem206 proteins as pore of …...yang et al., 2008) ca2+-activated cl-channels,...
TRANSCRIPT

*For correspondence:
Competing interests: The
authors declare that no
competing interests exist.
Funding: See page 22
Received: 10 June 2019
Accepted: 17 July 2019
Published: 18 July 2019
Reviewing editor: Reinhard
Jahn, Max Planck Institute for
Biophysical Chemistry, Germany
Copyright Ullrich et al. This
article is distributed under the
terms of the Creative Commons
Attribution License, which
permits unrestricted use and
redistribution provided that the
original author and source are
credited.
Identification of TMEM206 proteins aspore of PAORAC/ASOR acid-sensitivechloride channelsFlorian Ullrich1,2, Sandy Blin1,2, Katina Lazarow1, Tony Daubitz1,2,Jens Peter von Kries1, Thomas J Jentsch1,2,3*
1Leibniz-Forschungsinstitut fur Molekulare Pharmakologie (FMP), Berlin, Germany;2Max-Delbruck-Centrum fur Molekulare Medizin (MDC), Berlin, Germany;3NeuroCure Cluster of Excellence, Charite Universitatsmedizin, Berlin, Germany
Abstract Acid-sensing ion channels have important functions in physiology and pathology, but
the molecular composition of acid-activated chloride channels had remained unclear. We now used
a genome-wide siRNA screen to molecularly identify the widely expressed acid-sensitive outwardly-
rectifying anion channel PAORAC/ASOR. ASOR is formed by TMEM206 proteins which display two
transmembrane domains (TMs) and are expressed at the plasma membrane. Ion permeation-
changing mutations along the length of TM2 and at the end of TM1 suggest that these segments
line ASOR’s pore. While not belonging to a gene family, TMEM206 has orthologs in probably all
vertebrates. Currents from evolutionarily distant orthologs share activation by protons, a feature
essential for ASOR’s role in acid-induced cell death. TMEM206 defines a novel class of ion channels.
Its identification will help to understand its physiological roles and the diverse ways by which anion-
selective pores can be formed.
DOI: https://doi.org/10.7554/eLife.49187.001
IntroductionChloride is by far the most abundant anion in animals. Its concentration can vary substantially
between the extracellular space, the cytoplasm and various intracellular organelles, resulting in con-
centration gradients across membranes separating these compartments. Negatively charged chlo-
ride can cross biological membranes only with the help of membrane-spanning proteins such as Cl-
channels, which allow passive diffusion of Cl- along its electrochemical gradient, or transporter pro-
teins that couple the movement of Cl- to that of other ions and can thereby establish electrochemical
gradients.
Chloride channels fulfill a broad range of biological functions, including the homeostasis of cell
volume, vesicular acidification, transepithelial transport and cellular signaling (Jentsch and Pusch,
2018; Jentsch et al., 2002). Elucidation of these roles has been greatly facilitated by the molecular
identification of the underlying channel proteins, a discovery process that began in the late 1980’s
and is still ongoing. Chloride channels are molecularly and structurally very diverse and lack a defin-
ing ‘signature’ pattern. More than six unrelated Cl- channel families are known, prominently includ-
ing voltage-regulated CLC channels (Jentsch and Pusch, 2018; Jentsch et al., 1990), bestrophin
(Hartzell et al., 2008; Sun et al., 2002) and TMEM16 (Caputo et al., 2008; Schroeder et al., 2008;
Yang et al., 2008) Ca2+-activated Cl- channels, as well as LRRC8/VRAC volume-regulated anion
channels (Qiu et al., 2014; Voss et al., 2014). However, several Cl- currents biophysically character-
ized in mammalian cells still lack molecular correlates, severely hindering the elucidation of their cel-
lular and organismal functions.
Ullrich et al. eLife 2019;8:e49187. DOI: https://doi.org/10.7554/eLife.49187 1 of 25
RESEARCH ARTICLE
We set out to identify the protein(s) mediating a widely expressed, strongly outwardly-rectifying
plasma membrane Cl- current ICl,H that is detectable only upon marked extracellular acidification and
which may play a role in acid-induced cell death (Auzanneau et al., 2003; Capurro et al., 2015;
Lambert and Oberwinkler, 2005; Sato-Numata et al., 2013; Wang et al., 2007). The underlying
channel is most frequently called ASOR (for Acid-Sensitive Outwardly Rectifying anion channel;
Wang et al., 2007), although the earlier name PAORAC (Proton-Activated Outwardly Rectifying
Anion Channel; Lambert and Oberwinkler, 2005; Ma et al., 2008) provides a better description. At
room temperature, ASOR currents are only observable when external pH (pHo) drops below 5.5, but
the threshold of activation shifts to ~6.0 at 37˚C (Sato-Numata et al., 2013). Analysis of the steep
pH-dependence suggests that 3–4 protons are required to open the channel (Capurro et al., 2015;
Lambert and Oberwinkler, 2005). ASOR currents are strongly outwardly rectifying with almost no
currents being observable at negative-inside voltages. This rectification results both from voltage-
dependent gating that operates on a 100 ms time scale and from an outwardly-rectifying single
channel conductance (Lambert and Oberwinkler, 2005) (although others described that single
ASOR channels are not rectifying, for example Wang et al., 2007). ASOR currents (ICl,H) display an
SCN->I->NO3->Br->Cl- permeability sequence. The channel can be blocked by various Cl- transport
inhibitors such as DIDS (4,4’-diisothiocyano-2,2’-stilbenedisulfonic acid) and niflumic acid
(Capurro et al., 2015; Lambert and Oberwinkler, 2005) and by other compounds such as phloretin
(Wang et al., 2007) and pregnenolone sulfate (PS) (Drews et al., 2014). However, none of these
inhibitors is specific for ASOR.
The observation of ICl,H currents in every investigated mammalian cell type (Auzanneau et al.,
2003; Capurro et al., 2015; Fu et al., 2013; Lambert and Oberwinkler, 2005; Ma et al., 2008;
Nobles et al., 2004; Sato-Numata et al., 2013; Valinsky et al., 2017; Wang et al., 2007;
Yamamoto and Ehara, 2006) suggests that ASOR may be expressed in all tissues. Such a wide
expression pattern indicates that this channel has important physiological functions. However, only
few mammalian cells are physiologically exposed to an extracellular pH that is acidic enough to
open ASOR. It was therefore proposed (Wang et al., 2007) that the channel rather plays a role in
pathologies such as cancer or ischemic stroke in which pHo can drop to pH 6.5 or below
(Gillies et al., 2018; Kato et al., 2013; Nedergaard et al., 1991; Thews and Riemann, 2019;
Xiong et al., 2004). Indeed, ASOR inhibitors blunted cell swelling and cell death provoked by pro-
longed exposure to acidic pHo (Sato-Numata et al., 2014; Wang et al., 2007), suggesting that
ASOR-mediated chloride influx may worsen the outcome of ischemic stroke. It seems, however,
counterintuitive that a channel that enhances cell death under pathological conditions confers an
evolutionary advantage. Alternatively, ASOR might not only be present at the plasma membrane,
but also in intracellular compartments such as lysosomes where it would be exposed to an appropri-
ate acidic pH (Lambert and Oberwinkler, 2005).
The molecular identity of ASOR had remained unknown, with several candidates such as LRRC8/
VRAC anion channels or ClC-3 Cl-/H+ exchangers having been excluded previously (Lambert and
Oberwinkler, 2005; Sato-Numata et al., 2016; Sato-Numata et al., 2013). Using a genome-wide
siRNA screen we now identified TMEM206 as essential ASOR component. TMEM206, which has two
transmembrane domains, was necessary and sufficient for the formation of functional ASOR chan-
nels. All tested TMEM206 orthologs from other vertebrates form acid-activated channels which,
however, differ moderately in their biophysical properties. Ion-selectivity changing mutations sug-
gest that TMEM206’s transmembrane domains, in particular TM2, form ASOR’s pore. Finally, partial
protection of TMEM206�/� cells from acid-induced cell death indicates that ASOR/TMEM206 chan-
nels play a detrimental role in pathological conditions that are associated with tissue acidosis.
Results
Identification of TMEM206 as crucial ASOR componentTo identify the protein(s) constituting ASOR, we performed a genome-wide siRNA screen using an
optical assay for acute ASOR-mediated iodide influx into HeLa cells (Figure 1A). Intracellular iodide
was detected by fluorescence quenching of inducibly expressed, halide-sensitive and relatively pH-
insensitive E2GFP (Arosio et al., 2007). We activated ASOR by exposing cells to acidic extracellular
pH (5.0) and simultaneously depolarized their plasma membrane to maximize ASOR currents. To this
Ullrich et al. eLife 2019;8:e49187. DOI: https://doi.org/10.7554/eLife.49187 2 of 25
Research article Cell Biology Structural Biology and Molecular Biophysics

end, we used an approach which we had used previously (Scheel et al., 2005) to activate ClC-5, a
Cl-/H+-exchanger that displays a similarly strong outward rectification. In HeLa cells we stably co-
expressed E2GFP with FaNaC (Lingueglia et al., 1995), a ligand-gated Na+ channel from the snail
Cornu aspersum that is closed until it is activated by the cognate neurotransmitter peptide Phe-Met-
A
1.5
1.0
0.5log
10(T
PM
+1
)
Adipo
se ti
ssue
Adren
al g
land
Artery
Cer
ebel
lum
Cor
tex
Hip
poca
mpu
s
Col
on
Hea
rt
Live
r
Lung
Pancr
eas
Smal
l int
estin
e
Who
le b
lood
H. sapiens
H. glaber (90.3%)
A. carolinensis (71.1%)
G. gallus (73.3%)
S. kowalevskii (28.2%)
D. rerio (53.4%)
A
Candidate number
Media
n Z
-score
0 5000 10000
-4
-2
0
2
4TMEM206
0 20 40 600
50
100
Time (s)
No
rm.
fluo
resce
nce (
%)
Gluc- pH 5 FMRFa
I- pH 5 FMRFa
I- pH 7.4 FMRFa
I- pH 5
20 40 600
50
100
Time (s)
No
rm.
flu
ore
scen
ce
(%
)
ctrl
TMEM206 siRNA
candidate siRNAs
control siRNA
I- pH 5 FMRFa
B
C
E F
D
Figure 1. Identification of TMEM206 as ASOR component. (A) Screening assay. Engineered HeLa cells inducibly expressing iodide-sensitive E2GFP and
FRMFamide-gated Na+ channel FaNaC were acutely exposed to an acidic solution (pH 5) containing 20 mM FMRFamide and 100 mM I-. Iodide influx
through ASOR is stimulated both by acidic pH and the depolarization caused by FaNaC-mediated Na+-influx and induces quenching of E2GFP
fluorescence. Fluorescence quenching is reduced by ASOR knock-down. (B) Assay verification under the conditions used for screening. Addition of I-
and FRMFamide at pH 5 (arrow) induces rapid quenching of fluorescence. Less rapid quenching upon omission of either I-, FMRFamide or acidic pH
suggests that it is caused by I- influx through ASOR, as further supported by inhibition by PS (pregnenolone sulfate) and DIDS (4,4’-diisothiocyano-2,2’-
stilbenedisulfonic acid) (Figure 1—figure supplement 1). (C) Fluorescence curves from a 384-well plate treated with siRNA against 280 genes,
including TMEM206. Fluorescence quenching is specifically slowed by siRNA against TMEM206. (D) Distribution of median Z-scores (mean of 3
replicates) from filtered hits (see Materials and methods). TMEM206 was the top hit. (E) Tissue expression of TMEM206 extracted from the GTEx
database (https://gtexportal.org/home/; TPM, transcripts per million). (F) Dendrogram depicting similarity between TMEM206 orthologs from human
(Homo sapiens), African naked mole-rat (Heterocephalus glaber), chicken (Gallus gallus), green anole lizard (Anolis carolinensis), zebrafish (Danio rerio)
and from the hemichordate acorn worm (Saccoglossus kowalewski). Amino-acid sequence identity to human TMEM206 given in brackets. Dendrogram
based on a Clustal Omega protein alignment fed into the Simple Phylogeny tool at EMBL-EBI (https://www.ebi.ac.uk/services).
DOI: https://doi.org/10.7554/eLife.49187.002
The following source data and figure supplement are available for figure 1:
Source data 1. Raw data for Figure 1B-E.
DOI: https://doi.org/10.7554/eLife.49187.004
Figure supplement 1. Verification of the assay for the genome-wide siRNA screen.
DOI: https://doi.org/10.7554/eLife.49187.003
Ullrich et al. eLife 2019;8:e49187. DOI: https://doi.org/10.7554/eLife.49187 3 of 25
Research article Cell Biology Structural Biology and Molecular Biophysics
Arg-Phe-NH2 (FMRFamide). FMRFamide application leads to Na+ influx that acutely depolarizes the
membrane to inside-positive voltages. Concomitant application of 100 mM iodide, pH 5.0 and 20
mM FMRFamide to our engineered HeLa cells induced fast quenching of E2GFP fluorescence
(Figure 1B). Control experiments omitting either iodide, acidic pHo, or FMRFamide indicated that a
major component of quenching is owed to iodide influx through an acidic pH- and depolarization-
dependent process such as ASOR (Figure 1B, Figure 1—figure supplement 1A–D). This notion was
further supported by applying the inhibitors pregnenolone sulfate and DIDS (Drews et al., 2014)
(Figure 1—figure supplement 1E,F).
Having established a sensitive assay for ASOR function, we performed a genome-wide siRNA
screen using a commercial library containing pools of four siRNAs per gene (Figure 1C). The screen
was carried out in triplicate and results were ranked according to the maximal slope of quenching.
The top hit was TMEM206, a so far uncharacterized membrane protein (Figure 1D). The wide tissue
expression pattern of TMEM206 indicated by public databases (Figure 1E) agreed with the finding
that ICl,H has been found in every cell studied so far (Auzanneau et al., 2003; Capurro et al., 2015;
Fu et al., 2013; Lambert and Oberwinkler, 2005; Ma et al., 2008; Nobles et al., 2004; Sato-
Numata et al., 2013; Valinsky et al., 2017; Wang et al., 2007). TMEM206 has orthologs in verte-
brates and in the hemichordate Saccoglossus kowalevskii (acorn worm) (Figure 1F), but there are no
homologs in simpler animals or other kingdoms of life. In contrast to many other ion channels,
TMEM206 does not form a gene family because it lacks paralogs within the same species (i.e. it is a
‘single gene’).
After transfection of GFP-tagged human TMEM206 (hTMEM206) into HeLa cells a significant frac-
tion of the protein was found at the plasma membrane (Figure 2A). Additionally, TMEM206
appeared to be expressed in intracellular membranes, which, however, might result from heterolo-
gous overexpression. Hydropathy analysis suggested the presence of two transmembrane spans
(Figure 2B). To determine the transmembrane topology of TMEM206, we tested the accessibility of
added epitopes by immunofluorescence. Detection of both N- or C-terminally added GFP required
permeabilization of the plasma membrane (Figure 2C,D), suggesting that both the amino- and the
carboxy-terminus of TMEM206 face the cytosol.
A cytosolic localization of the N-terminus is further supported by public databases showing that
the amino-terminus of human and rodent TMEM206 can be phosphorylated (Figure 2G). An extra-
cellular localization of the TM1-TM2 stretch was suggested by the immunofluorescent detection in
non-permeabilized cells of an HA-epitope inserted at position 271 (Figure 2E,G). The observation
that this stretch is glycosylated further supports its extracellular localization (Figure 2F). Only this
segment displays consensus sites (N148, N155, N162, N190) for N-linked glycosylation (Figure 2G,
Figure 6—figure supplement 2). Deglycosylation of WT and mutant TMEM206(Dglyc), in which all
four consensus sites were eliminated, demonstrated that at least one of these sites are used
(Figure 2F) and hence face the lumen of the ER during biogenesis. We conclude that both N- and
C-termini of TMEM206 reside in the cytosol, whereas the TM1-TM2 loop faces the extracellular
space (Figure 2G).
Human TMEM206 mediates typical ASOR currentsOverexpression of human TMEM206 in HEK cells increased acid-activated Cl- currents about 10-fold
(Figure 3A,B). Addition of GFP to either the amino- or carboxy-terminus of TMEM206 only moder-
ately decreased current amplitudes compared to the untagged construct (Figure 3B). Currents from
overexpressed hTMEM206, irrespective of whether fused to GFP, resembled native ICl,H. To confirm
that TMEM206 is essential for the generation of ICl,H, we disrupted the TMEM206 gene in both HEK
and HeLa cells using CRISPR-Cas9 genomic editing. To exclude off-target effects, we used three dif-
ferent gRNAs to generate independent KO clones. None of the clonal HEK or HeLa KO cell lines dis-
played measurable ICl,H currents (Figure 3C–E, Figure 3—figure supplement 1). Hence, TMEM206
is an indispensable component of ASOR.
Transfection of hTMEM206 rescued ICl,H currents of TMEM206�/� (KO) HEK and HeLa cells
(Figure 3F–H, Figure 3—figure supplement 1E). Current characteristics did not differ between
transfected WT or KO cells (Figure 3A,F). TMEM206�/� HEK cells were used to further characterize
hTMEM206 in transient overexpression.
Currents of overexpressed hTMEM206 (measured at acidic pHo) showed the typical outward-rec-
tification and activation kinetics of ASOR (Capurro et al., 2015; Lambert and Oberwinkler, 2005;
Ullrich et al. eLife 2019;8:e49187. DOI: https://doi.org/10.7554/eLife.49187 4 of 25
Research article Cell Biology Structural Biology and Molecular Biophysics

A
C GFP-TMEM206
GFP anti-GFP merge
no
n p
erm
ea
bili
ze
dp
erm
ea
bili
ze
d
TMEM206-GFP
GFP anti-GFP merge
F G
TMEM206-GFP B
D
PNGase F - +
70 WB : GFP
TMEM206-GFP
B
TMEM206(Δglyc)-GFP
- +
TMEM206-exHA
anti-HA
N
C
TM1 TM2
NN
N
N
P
PP
P
N
P
N-linked
glycosylation
Phosphorylation
HA
GFP
GFP
55
100WB :
Na/K ATPase
E
100
Figure 2. Subcellular localization and transmembrane topology of TMEM206. (A) Subcellular localization of TMEM206 (fused to GFP at the C-terminus)
in transfected HeLa cells. A similar localization was observed when the tag was attached to the N-terminus. Scale bar: 10 mm (B) Hydropathy analysis of
TMEM206 using the TMpred server (https://embnet.vital-it.ch/software/TMPRED_form.html) suggests the presence of two transmembrane domains. (C,
D) Detection of GFP by its fluorescence (green) or immunocytochemistry (red) in cells transfected with GFP-TMEM206 (C) or TMEM206-GFP (D), without
(top panels) or with (lower panels) plasma membrane permeabilization. Scale bars: 10 mm. (E) A HA-epitope inserted after residue 271 between TM1
and TM2 (G) in the TMEM206-exHA mutant was detected in non-permeabilized cells. (F) Western blot of membranes from HEK cells transfected with
TMEM206-GFP or TMEM206(Dglyc)-GFP in which all four predicted N-linked glycosylation sites between TM1 and TM2 were disrupted by mutagenesis.
Note the lower molecular weight of TMEM206(Dglyc)-GFP. Deglycosylation of membrane proteins by PNGaseF reduced the molecular weight of the
Figure 2 continued on next page
Ullrich et al. eLife 2019;8:e49187. DOI: https://doi.org/10.7554/eLife.49187 5 of 25
Research article Cell Biology Structural Biology and Molecular Biophysics

Wang et al., 2007) after depolarizing voltage steps (Figure 3C,F). However, I/V curves for these
measurements must be interpreted with some care since the very large currents (>15 nA) and the
absence of series resistance compensation may have resulted in confounding voltage clamp errors.
The pHo-dependence of native ICl,H was indistinguishable from that of TMEM206-transfected KO
HEK cells (Figure 3I,H). The extent of acidification needed for half-activation of ICl,H (pHo ~5.3)
agrees with previous studies (Capurro et al., 2015; Lambert and Oberwinkler, 2005; Sato-
Numata et al., 2013; Wang et al., 2007).
Measurements of reversal potentials of hTMEM206-transfected cells (Figure 4A,B) revealed a
SCN->I->NO3->Br->Cl- permeability sequence that is typical for ASOR (Capurro et al., 2015;
Lambert and Oberwinkler, 2005). Replacement of extracellular Cl- by either gluconate- (Figure 4C)
or SO42- (Figure 4D) not only abolished outward, but also inward currents which are carried by anion
efflux. Since we had replaced extracellular, but not intracellular Cl-, these observations suggest that
gluconate- and SO42- (or HSO4
-, a minor species with which SO42- is at equilibrium and whose abun-
dance will be increased by the acidic pH) block the outward movement of Cl- through ASOR/
TMEM206 channels. Alternatively, ASOR may require activation by extracellular chloride. Native ICl,His inhibited by several compounds (Capurro et al., 2015; Drews et al., 2014; Lambert and Ober-
winkler, 2005), but none of these is specific for ASOR. Acid-activated currents from overexpressed
TMEM206 were efficiently blocked by DIDS, niflumic acid, and pregnenolone sulfate (PS, Figure 4E–
H). As described for native ICl,H (Drews et al., 2014), the block by PS was fast and reversible
(Figure 4F) and affected both outward and inward currents (Figure 4G). We conclude that overex-
pressed TMEM206 shares all essential properties with native ASOR currents (ICl,H).
TMEM206 proteins from other species mediate moderately differentICl,H currentsWe asked whether TMEM206 proteins from other clades also function as ASORs and transfected
orthologs from the green anole lizard (Anolis carolinensis), chicken (Gallus gallus), zebrafish (Danio
rerio) and from the hemichordate acorn worm (Saccoglossus kowalewski) into TMEM206�/� HEK
cells. We also tested TMEM206 from naked mole-rats (Heterocephalus glaber), mammals displaying
various unusual properties including insensitivity to acidic pain (Browe et al., 2018; Edrey et al.,
2011; Park et al., 2008) and decreased acid-induced neuronal cell death (Husson and Smith,
2018).
Except for the evolutionarily distant hemichordate protein, which was retained in the endoplasmic
reticulum (ER), all orthologs were expressed at the plasma membrane (Figure 5—figure supplement
1). All plasma-membrane expressed orthologs mediated robust acid-activated outwardly rectifying
ICl,H currents (Figure 5A,C). These currents, however, differed in detail. Strikingly, TMEM206 from
the reptile Anolis carolinensis mediated outwardly-rectifying currents already at pHo 7.4. These cur-
rents were further steeply activated when pHo dropped below 6 (Figure 5A–D). Whereas currents
from all orthologs activated at a threshold of ~pHo 6, their currents decreased differently at pHo <5
(Figure 5D). The current decrease at more acidic pH questions the reliability of determining Hill
coefficients for the activation of ASOR by H+ ions (Capurro et al., 2015; Lambert and Oberwinkler,
2005; Yang et al., 2019). Differences between orthologs were also observed in depolarization-acti-
vated gating and current rectification (Figure 5A,D), and most importantly in anion permeability
(Figure 5E–I). Whereas all orthologs displayed the same Cl- permeability (Figure 5E,I), the mamma-
lian ASORs (human and naked mole-rat) showed a higher iodide/chloride permeability ratio than
their chicken, anole and zebrafish orthologs (Figure 5F,I). ASORs from green anole and zebrafish
displayed a significant SO42- (or HSO4
-) permeability which was undetectable with the other tested
orthologs (Figure 5G–I). These results suggest that all vertebrate TMEM206 proteins mediate ASOR
currents and participate in forming its ion-selective pore.
Figure 2 continued
WT, but not the TMEM206(Dglyc)-GFP protein. (G) Schematic topology of TMEM206. Predicted glycosylation sites (N), and phosphorylated sites (P)
identified in mass spectrometry (https://www.phosphosite.org/) are indicated, as well as the location of added epitopes.
DOI: https://doi.org/10.7554/eLife.49187.005
Ullrich et al. eLife 2019;8:e49187. DOI: https://doi.org/10.7554/eLife.49187 6 of 25
Research article Cell Biology Structural Biology and Molecular Biophysics
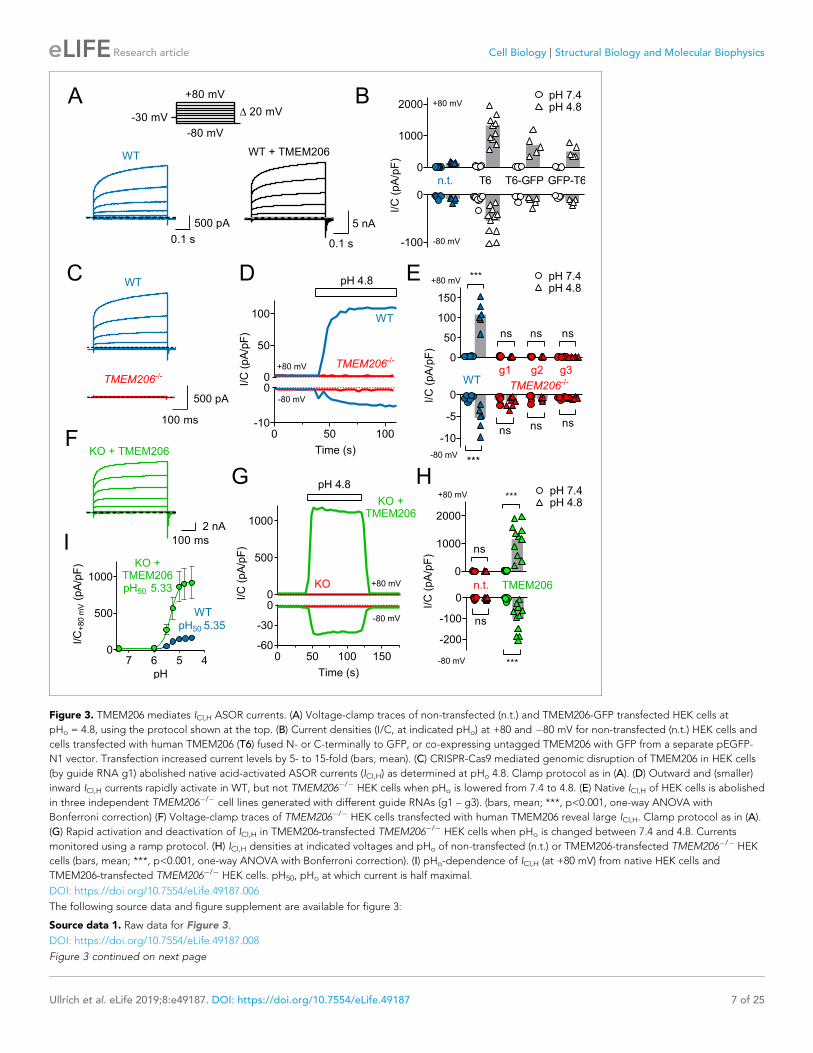
Figure 3. TMEM206 mediates ICl,H ASOR currents. (A) Voltage-clamp traces of non-transfected (n.t.) and TMEM206-GFP transfected HEK cells at
pHo = 4.8, using the protocol shown at the top. (B) Current densities (I/C, at indicated pHo) at +80 and �80 mV for non-transfected (n.t.) HEK cells and
cells transfected with human TMEM206 (T6) fused N- or C-terminally to GFP, or co-expressing untagged TMEM206 with GFP from a separate pEGFP-
N1 vector. Transfection increased current levels by 5- to 15-fold (bars, mean). (C) CRISPR-Cas9 mediated genomic disruption of TMEM206 in HEK cells
(by guide RNA g1) abolished native acid-activated ASOR currents (ICl,H) as determined at pHo 4.8. Clamp protocol as in (A). (D) Outward and (smaller)
inward ICl,H currents rapidly activate in WT, but not TMEM206�/� HEK cells when pHo is lowered from 7.4 to 4.8. (E) Native ICl,H of HEK cells is abolished
in three independent TMEM206�/� cell lines generated with different guide RNAs (g1 – g3). (bars, mean; ***, p<0.001, one-way ANOVA with
Bonferroni correction) (F) Voltage-clamp traces of TMEM206�/� HEK cells transfected with human TMEM206 reveal large ICl,H. Clamp protocol as in (A).
(G) Rapid activation and deactivation of ICl,H in TMEM206-transfected TMEM206�/� HEK cells when pHo is changed between 7.4 and 4.8. Currents
monitored using a ramp protocol. (H) ICl,H densities at indicated voltages and pHo of non-transfected (n.t.) or TMEM206-transfected TMEM206�/� HEK
cells (bars, mean; ***, p<0.001, one-way ANOVA with Bonferroni correction). (I) pHo-dependence of ICl,H (at +80 mV) from native HEK cells and
TMEM206-transfected TMEM206�/� HEK cells. pH50, pHo at which current is half maximal.
DOI: https://doi.org/10.7554/eLife.49187.006
The following source data and figure supplement are available for figure 3:
Source data 1. Raw data for Figure 3.
DOI: https://doi.org/10.7554/eLife.49187.008
Figure 3 continued on next page
Ullrich et al. eLife 2019;8:e49187. DOI: https://doi.org/10.7554/eLife.49187 7 of 25
Research article Cell Biology Structural Biology and Molecular Biophysics

Cysteine-scanning mutagenesis reveals pore-lining residues ofTMEM206To identify pore-lining residues of ASOR we used a systematic substituted-cysteine accessibility
approach (Holmgren et al., 1996). After having ascertained that the cysteine reagent MTSES lacks
significant effects on human WT channels (Figure 6A,B), we generated point mutants in which all
residues of both hTMEM206 transmembrane spans were singly replaced by cysteines (Figure 6B).
Except for two mutants in TM2 (L309C and K319C), all constructs elicited acid-activated ICl,H currents
when transfected into TMEM206�/� HEK cells (Figure 6B,C, Figure 6—figure supplement 1). How-
ever, current amplitudes and properties were often changed (Figure 6—figure supplement 1). Only
one mutant in TM1 (L84C) showed a marked response to cysteine modification (Figure 6B,C). Appli-
cation of MTSES to this mutant, which changes a residue close to the predicted external end of
TM1, increased currents selectively at negative voltages (Figure 6B,C). TM2, which is less hydropho-
bic than TM1 (Figure 2B) and may form an amphipathic a-helix (Figure 6—figure supplement 2),
contained a larger number of responsive cysteine-substituted residues (Figure 6B,C). These residues
were not only found close to the external end of TM2 (W304), but also close to the center (G312)
and more towards the cytoplasmic end of TM2 (L315, A316) (Figure 6B,C). These residues failed to
clearly cluster on one side of the postulated a-helix (Figure 6—figure supplement 2A). Depending
Figure 3 continued
Figure supplement 1. TMEM206 mediates ICl,H ASOR currents in HeLa cells.
DOI: https://doi.org/10.7554/eLife.49187.007
Figure 4. Ion selectivity and inhibitor sensitivity of TMEM206/ASOR channels. (A) Example traces of ICl,H (elicited by voltage ramps) from TMEM206-
transfected TMEM206�/� HEK cells upon equimolar replacement of extracellular NaCl (150 mM) by the sodium salts of the indicated anions. The
intracellular solution contained 150 mM CsCl. The voltage at which I = 0 defines the reversal potential. (B) Reversal potentials Erev. (C) Upon
replacement of extracellular Cl- by gluconate, or (D) by HSO4-/SO4
2-, no currents discernible from background were detected (at pHo 4.8). (E) Mean
inhibition (%) of ICl,H from TMEM206-transfected TMEM206�/� HEK cells (measured at +80 mV, pHo 4.8) by various inhibitors of ASOR. PS,
pregnenolone sulfate; DIDS, 4,4’-diisothiocyano-2,2’-stilbenedisulfonic acid; NFA, niflumic acid. (F) Fast and reversible block of ICl,H by PS. (G) Example
I/V curves of ICl,H from TMEM206-transfected TMEM206�/� HEK cells exposed to different PS concentrations. (H) Same for block by DIDS.
DOI: https://doi.org/10.7554/eLife.49187.010
The following source data is available for figure 4:
Source data 1. Raw data for Figure 4.
DOI: https://doi.org/10.7554/eLife.49187.011
Ullrich et al. eLife 2019;8:e49187. DOI: https://doi.org/10.7554/eLife.49187 8 of 25
Research article Cell Biology Structural Biology and Molecular Biophysics

Figure 5. Properties of TMEM206 orthologs. (A) Typical voltage clamp-traces of indicated TMEM206 orthologs transiently expressed in TMEM206�/�
HEK cells at pHo 7.4 (top traces) or pHo 5.0 (bottom traces). Clamp protocol as in Figure 3A. (B) Mean current amplitudes of tested orthologs at pHo7.4
and (C) pHo 5.0. The ortholog from acorn worm failed to give currents because of its retention in the endoplasmic reticulum (Figure 5—figure
supplement 1F). (D) pHo-dependence of currents from various orthologs at +80 mV (top) and –80 mV (bottom) as determined from voltage ramps. (E–
Figure 5 continued on next page
Ullrich et al. eLife 2019;8:e49187. DOI: https://doi.org/10.7554/eLife.49187 9 of 25
Research article Cell Biology Structural Biology and Molecular Biophysics
on the mutant, MTSES exposure increased or decreased ICl,H amplitudes (Figure 6A–C) or changed
current rectification (Figure 6B–C). Consistent with a covalent modification of cysteine residues, the
effects of MTSES appeared irreversible (Figure 6A). Strikingly, several cysteine mutants showed
robust outwardly-rectifying currents already at pHo 7.4 (Figure 6D,E). These could be further stimu-
lated by exposure to acidic pHo (Figure 6F).
Of note, some cysteine mutants displayed changed ion selectivity (Figure 7A,B,F–H). Whereas
changes in I- permeability were relatively small (most evident for L84C and R87C, Figure 7B,F), the
same two mutants in TM1 displayed a small sulfate permeability that was undetectable in WT
hTMEM206, allowing us to determine reversal potentials (Figure 7A,B,G–H). Residues giving an
interesting effect upon cysteine modification were further mutated to other, mostly charged, resi-
dues. This yielded detectable ICl,H in many cases (Figure 7—figure supplement 1), with a number of
mutants displaying slightly changed iodide permeability (Figure 7C,D,F) or marked increases in
SO42-/HSO4
- conductance (Figure 7C,G–H). Strikingly, replacement of L315 by negatively charged
aspartate introduced a large ~22 mV shift of the reversal potential in NaCl medium (Figure 7D,E),
indicative of a loss of anion selectivity. Together with the strong MTSES effects on the L315C mutant
(Figure 6A–C) these data suggest that this TM2 residue importantly determines pore properties of
ASOR. Of note, with the exception of R87, all functionally important residues identified here in TM1
and TM2 are highly conserved (Figure 6—figure supplement 2B). In conclusion, residues along the
length of TM2 and towards the external end of TM1 may be close to, or line, the pore of ASOR
channels.
Role of TMEM206/ASOR channels in acidotoxicityASOR was suggested (Sato-Numata et al., 2014; Wang et al., 2007) to play a role in acidotoxicity
because DIDS and phloretin, compounds inhibiting ASOR but also several other channels or trans-
porters, reduced acid-induced necrotic cell death of HeLa cells (Wang et al., 2007) and cultured cor-
tical neurons (Sato-Numata et al., 2014). We exposed both WT HEK cells, and two separately
derived TMEM206�/� clones, for 2 hr to acidic medium (pHo 4.5) in the absence and presence of PS.
Cell death was assessed by propidium iodide staining and normalized to the total number of cells as
determined by Hoechst 33342 labeling. Indeed, disruption of TMEM206 partially protected against
acid-induced cell death (Figure 8A,B). A roughly similar protection was seen with PS in WT but not
in TMEM206�/� cells (Figure 8A,B), suggesting that the effect of PS on cell viability results from its
ability to block ASOR (Drews et al., 2014). In conclusion, ASOR/TMEM206 channels enhance
acidotoxicity.
This form of cell death had been attributed to cell swelling caused by osmotic gradients gener-
ated by ASOR-mediated Cl- influx (Sato-Numata et al., 2014; Wang et al., 2007). When exposed
to pHo 4.2, both WT and TMEM206�/� HEK cells increased their volume within the first three
minutes as indicated by increased calcein fluorescence (Figure 8C). Agreeing with the hypothesis
(Sato-Numata et al., 2014; Wang et al., 2007) that the parallel opening of ASOR and ASICs (acid-
sensitive Na+-channels; Grunder and Pusch, 2015; Waldmann et al., 1997) leads to an electrically
coupled influx of osmotically active Na+ and Cl-, WT cells swelled faster than TMEM206�/� cells.
Whereas WT cells subsequently decreased their volume, TMEM206�/� cells failed to shrink
(Figure 8C). Likewise, the ASOR inhibitor pregnenolone sulfate (100 mM) (Drews et al., 2014)
Figure 5 continued
G) Reversal potentials Erev of indicated orthologs with external NaCl (E), Nal (F) and Na2SO4 (G). Significant currents with Na2SO4 could be measured
only for green anole and zebrafish. DErev, difference to Erev for NaCl. All currents measured at pHo 5.25. (H) Current densities (at +80 mV, pHo 5.25) with
external Na2SO4 (I) Example traces showing determination of Erev (indicated by arrows) for human, chicken and zebrafish orthologs. bg, background
current at pHo 7.4 (n = 8–13 cells; *, p<0.033; ***, p<0.001; Kruskal-Wallis test, Dunn’s multiple comparison correction; error bars, SD (B,C) or SEM (D–
H)).
DOI: https://doi.org/10.7554/eLife.49187.012
The following source data and figure supplement are available for figure 5:
Source data 1. Raw data for Figure 5.
DOI: https://doi.org/10.7554/eLife.49187.014
Figure supplement 1. Subcellular localization of different GFP-tagged TMEM206 orthologs after transfection into HeLa TMEM206�/� cells.
DOI: https://doi.org/10.7554/eLife.49187.013
Ullrich et al. eLife 2019;8:e49187. DOI: https://doi.org/10.7554/eLife.49187 10 of 25
Research article Cell Biology Structural Biology and Molecular Biophysics

Figure 6. Substituted cysteine accessibility scan of TMEM206 transmembrane domains. (A) Effect of MTSES on currents from WT and mutant
TMEM206-transfected TMEM206�/� cells. MTSES had no effect on WT TMEM206, but acutely and irreversibly decreased or increased ICl,H of I307C and
L315C mutants, respectively. Note that acidic pHo does not interfere with MTSES reactivity. The protocol was designed to be able to detect potential
effects of MTSES at pH 7.4. (B) Ratio of current before (Ictrl) and after (IMTSES) exposure to MTSES, at +80 and �80 mV. Mutants are grouped by location
within the two TMDs of TMEM206. For current amplitudes of non-modified cysteine mutants, see Figure 6—figure supplement 1. (C) Current traces of
selected mutants elicited by voltage ramps (top) before and after MTSES-application. (D–F) Cysteine mutants showing currents at pHo 7.4. (D) Voltage-
clamp traces of WT TMEM206 and indicated mutants at pH 7.4. Clamp protocol as in Figure 3A. (E) Mean current densities at pH 7.4. (F) All mutants
still responded to low pHo.
Figure 6 continued on next page
Ullrich et al. eLife 2019;8:e49187. DOI: https://doi.org/10.7554/eLife.49187 11 of 25
Research article Cell Biology Structural Biology and Molecular Biophysics

slowed the initial swelling and inhibited the subsequent shrinkage (Figure 8D). Similar effects of
ASOR disruption or block were observed with HeLa cells (Figure 8—figure supplement 1). Hence,
contrasting with the conclusion of Wang et al. (2007), our data suggest that the role of ASOR/
TMEM206 in acidotoxicity cannot be explained by a sustained volume increase of acid-exposed
cells.
DiscussionWe have identified TMEM206 as essential, pore-forming subunit of ASOR, a widely expressed acid-
sensitive outwardly rectifying anion channel. TMEM206 lacks homologous proteins within any given
species. Both transmembrane domains of TMEM206, most importantly TM2, likely participate in
forming its anion-selective pore. TMEM206/ASOR channels are apparently present in all vertebrates
and share activation by markedly acidic pH as prominent feature. TMEM206/ASOR channels play a
role in pathologies associated with a marked decrease in extracellular pH. Although their wide
expression pattern across tissues and vertebrates suggests important physiological functions for all
cells, these roles remain to be determined. The identification of TMEM206 as ASOR channel-forming
protein in this work and in a recently published independent study by Qiu and coworkers
(Yang et al., 2019) is an essential step forward towards the elucidation of these roles.
TMEM206 fully constitutes ASORThe dissimilar biophysical characteristics of currents elicited by TMEM206 orthologs and the changes
observed with mutants demonstrate that TMEM206 proteins constitute the pore of ASOR channels.
With only two exceptions, all cysteine-substituted channels gave currents. However, their amplitudes
were reduced by several mutations which were distributed along the length of either TM1 or TM2
(Figure 6—figure supplement 2). Whereas this result only shows that TMEM206 is (somehow)
important for ASOR currents, the observed functional effects of MTSES on various cysteine mutants
additionally indicate that the respective cysteines are accessible from the aqueous phase. If such res-
idues are located in a membrane-embedded region, they are probably close to, or line, the pore.
More convincing evidence that TMEM206 proteins form the channel comes from mutations that
change intrinsic channel properties such as rectification or ion selectivity (a property of the pore).
Several mutations, both at the extracellular end of TM1 and at various positions along TM2, moder-
ately changed ASOR’s I- permeability. Moreover, whereas WT hTMEM206 lacked measurable cur-
rents with extracellular Na2SO4, TMEM206 from anole and zebrafish, and a surprisingly large
number of mutants, displayed robust currents with extracellular sulfate. These mutations may
markedly increase the channel’s SO42- (or HSO4
-) permeability, or relieve a channel block that was
indicated by the absence of inward currents (efflux of Cl-) in the presence of extracellular sulfate.
The most striking evidence for TMEM206 forming ASOR’s pore comes from the loss of anion selec-
tivity with the L315D mutant. The ~22 mV positive shift of the reversal potential indicates a marked
increase in cation conductance (Erev for Na+ or H+ are >+120 mV and +113 mV, respectively) that
might be due to electrostatic interactions of the newly introduced negatively charged aspartate with
the permeant ion. Our data suggest that the whole length of TM2, with a participation of the outer
end of TM1, lines the pore of ASOR. This is reminiscent of crystallographically resolved pore struc-
tures of ASIC channels with which ASOR shares the transmembrane topology, but no obvious
sequence homology. Intriguingly, ASICs and other ENaC/Deg channels display a glycine residue (in
the ‘GxS’ motif) in TM2 that plays an important role in determining pore properties and gating
Figure 6 continued
DOI: https://doi.org/10.7554/eLife.49187.015
The following source data and figure supplements are available for figure 6:
Source data 1. Raw data for Figure 6.
DOI: https://doi.org/10.7554/eLife.49187.018
Figure supplement 1. Acid-induced current densities of cysteine mutants.
DOI: https://doi.org/10.7554/eLife.49187.016
Figure supplement 2. Localization of studied TMEM206 residues.
DOI: https://doi.org/10.7554/eLife.49187.017
Ullrich et al. eLife 2019;8:e49187. DOI: https://doi.org/10.7554/eLife.49187 12 of 25
Research article Cell Biology Structural Biology and Molecular Biophysics
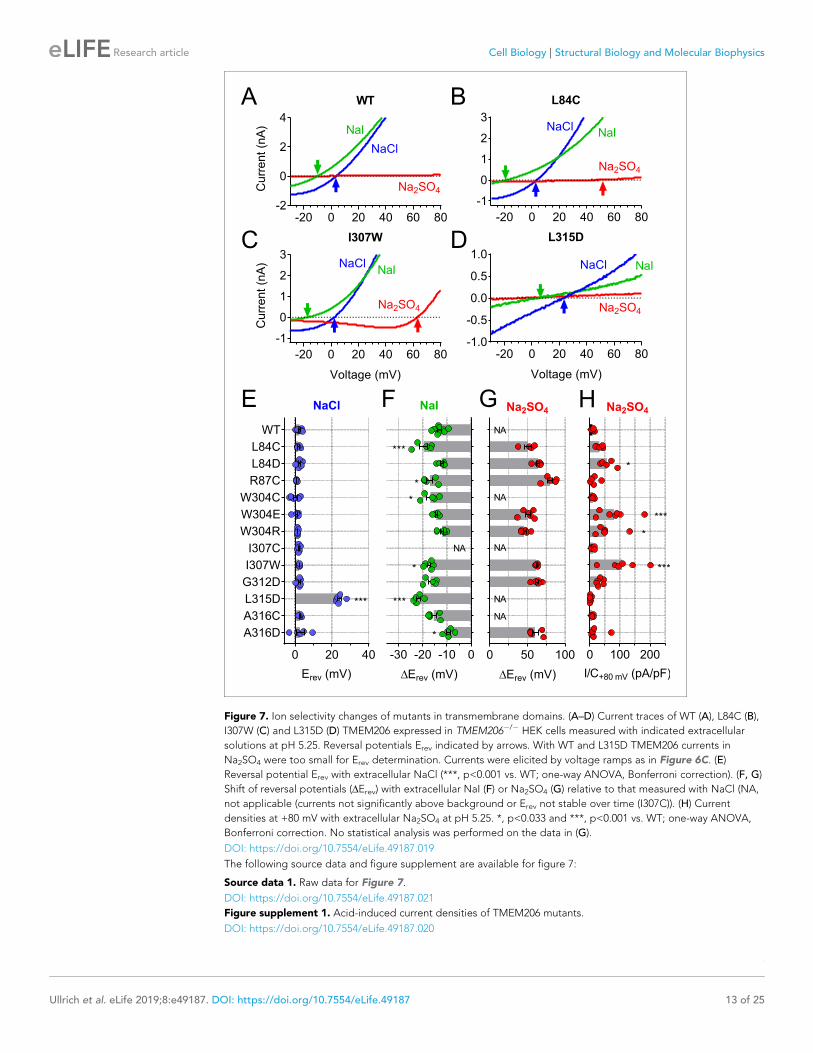
Figure 7. Ion selectivity changes of mutants in transmembrane domains. (A–D) Current traces of WT (A), L84C (B),
I307W (C) and L315D (D) TMEM206 expressed in TMEM206�/� HEK cells measured with indicated extracellular
solutions at pH 5.25. Reversal potentials Erev indicated by arrows. With WT and L315D TMEM206 currents in
Na2SO4 were too small for Erev determination. Currents were elicited by voltage ramps as in Figure 6C. (E)
Reversal potential Erev with extracellular NaCl (***, p<0.001 vs. WT; one-way ANOVA, Bonferroni correction). (F, G)
Shift of reversal potentials (DErev) with extracellular NaI (F) or Na2SO4 (G) relative to that measured with NaCl (NA,
not applicable (currents not significantly above background or Erev not stable over time (I307C)). (H) Current
densities at +80 mV with extracellular Na2SO4 at pH 5.25. *, p<0.033 and ***, p<0.001 vs. WT; one-way ANOVA,
Bonferroni correction. No statistical analysis was performed on the data in (G).
DOI: https://doi.org/10.7554/eLife.49187.019
The following source data and figure supplement are available for figure 7:
Source data 1. Raw data for Figure 7.
DOI: https://doi.org/10.7554/eLife.49187.021
Figure supplement 1. Acid-induced current densities of TMEM206 mutants.
DOI: https://doi.org/10.7554/eLife.49187.020
Ullrich et al. eLife 2019;8:e49187. DOI: https://doi.org/10.7554/eLife.49187 13 of 25
Research article Cell Biology Structural Biology and Molecular Biophysics

(Baconguis et al., 2014; Li et al., 2011). Whether G212, which is located at a similar distances from
the ends of TM2, plays a comparable role must await determination of TMEM206/ASOR channel
structures.
Heterologous expression of all tested vertebrate orthologs led to large acid-induced currents. As
shown with human TMEM206, biophysical properties of these currents did not differ significantly
from native ICl,H. Hence completely functional ASOR channels may only require TMEM206. However,
our results cannot strictly exclude that TMEM206 lines the pore together with other, unknown pro-
teins. This scenario would require that such proteins are produced in excess endogenously since
overexpression of hTMEM206 or its orthologs elicited currents > 10 fold larger than native ICl,H. It
Time (s)
Rela
tive
volu
me
(F/F
0)
0 200 400 600
1.00
1.05
1.10
TMEM206-/- pH 7.4
WT pH 7.4
TMEM206-/- pH 4.2
WT pH 4.2
Time (s)
Rela
tive
volu
me
(F/F
0)
0 200 400 600
1.00
1.05
1.10
100 µM PS pH 7.4
pH 7.4
100 µM PS pH 4.2
pH 4.2
B
C D
ApH 7.4 pH 4.5 pH 4.5 + PS
WT
TM
EM
206
-/-
WT
KO
g2
KO
g3W
T
KO
g2
KO
g3 WT
KO
g2
KO
g3W
T
KO
g2
KO
g3
0
10
20
30
PI
+/
Ho
ech
st+
(%)
pH 7.4 pH 7.4+ PS
pH 4.5+ PS
pH 4.5
******
******
Figure 8. Role of TMEM206/ASOR channels in acid-induced cell death and volume regulation. (A) Representative pictures of WT and TMEM206�/�
HEK293 cells (clone 2E5) double stained with propidium iodide (PI, red) and Hoechst 33342 (blue) after incubation for 2 hr with control (pH 7.4) or acidic
(pH 4.5) solution, also containing the potent inhibitor of TMEM206 pregnenolone sulfate (PS) at 100 mM or not. In this assay, dead cells are stained with
PI, membrane impermeant, whereas Hoechst 33342, which is permeant, stains nuclei of all cells. Scale bars: 100 mm (B) Quantification of PI positive cells
over the total number of cells, determined by Hoechst staining, in WT and two independent TMEM206�/� HEK clones generated with different guide
RNAs (g2, g3). For quantification, 10x objective microscopic fields were randomly chosen. Bars represent mean ± SEM. Data were acquired in three
independent experiments and analyzed by using one-way ANOVA with post hoc multiple comparisons using the Tukey’s test: ***p<0.001 (C,D)
Influence of TMEM206 ablation (C) or block by 100 mM pregnenolone sulfate (PS) (D) on acid-induced cell volume changes of HEK293 cells as
monitored by calcein fluorescence. Mean of eight measurements; error range, SEM. Similar results were obtained in three experiments, and similar
effects were observed with HeLa cells (Figure 8—figure supplement 1).
DOI: https://doi.org/10.7554/eLife.49187.022
The following source data and figure supplement are available for figure 8:
Source data 1. Raw data for Figure 8.
DOI: https://doi.org/10.7554/eLife.49187.024
Figure supplement 1. Role of TMEM206/ASOR ablation or block on acid-induced cell volume changes in HeLa cells.
DOI: https://doi.org/10.7554/eLife.49187.023
Ullrich et al. eLife 2019;8:e49187. DOI: https://doi.org/10.7554/eLife.49187 14 of 25
Research article Cell Biology Structural Biology and Molecular Biophysics
further requires that such a putative additional pore-forming protein from HEK cells is able to associ-
ate with all the vertebrate orthologs tested. If ASOR’s pore is exclusively constituted by TMEM206
proteins that cross the membrane only twice, TMEM206 must form at least a dimer to build a pro-
tein-enclosed pore. ASICs and other members of the DEG/ENaC channel family, which display a
transmembrane topology similar to TMEM206, form trimeric homo- or heteromeric channels
(Jasti et al., 2007). Likewise ASOR channels might be formed by TMEM206 trimers.
Role of acid-activated chloride currentWith the exception of the hemichordate TMEM206, which shows marked sequence divergence and
was retained in the ER, all tested TMEM206 proteins gave strongly outwardly rectifying Cl- currents
that were activated by extracellular acidification in excess of ~pHo 6. The strong rectification might
be physiologically irrelevant since all orthologs gave currents also at negative voltages and because
inside-positive voltages are rarely reached in vivo, in particular in non-excitable cells. By contrast, the
conserved activation by acidic pHo appears crucial and poses the question where and when such pH
values might be reached. Mammalian ASORs require slightly less acidic pH for activation at physio-
logical temperatures (37˚C) (Sato-Numata et al., 2013; Sato-Numata et al., 2014), but this consid-
eration seems irrelevant for the reptile and fish orthologs.
Only a few cell types in the mammalian organism are physiologically exposed to an extracellular
pH that is more acidic than pH 6.0. These include cells in the stomach and duodenum, renal medul-
lary collecting duct (Bengele et al., 1983) and acid-secreting osteoclasts and macrophages
(Silver et al., 1988), but it is unclear whether ASOR is expressed in the relevant membranes of these
polarized cells. Moreover, it is unlikely that an important function in a small subset of cells has
resulted in an almost ubiquitous expression of ASOR during evolution. On the other hand, intracellu-
lar compartments such as endosomes and lysosomes, which can be acidified down to pH 4.5, would
provide an ideal environment for ASOR activity. Here ASOR might facilitate luminal acidification by
shunting currents of the proton-ATPase as described for endosomal CLC Cl- transporters
(Gunther et al., 1998; Jentsch, 2007; Piwon et al., 2000). Interestingly, vesicular CLCs also show
strong outward-rectification, but unlike ASOR are 2Cl-/H+-exchangers that are inhibited by luminal
(or extracellular) acidification (Jentsch, 2007; Jentsch and Pusch, 2018; Scheel et al., 2005). Hence
presence of both ASOR and CLCs on endolysosomes might allow for a differential regulation of
vesicular membrane voltage and ion concentrations. However, ClC-7 is believed to be the main Cl-
transporter of lysosomes (Graves et al., 2008; Kornak et al., 2001) and immunocytochemistry
showed prominent plasma membrane expression of all examined vertebrate ASOR orthologs.
Although the variable cytoplasmic labeling observed upon TMEM206 overexpression may have
resulted from overexpression and showed no obvious co-localization with the lysosomal marker
lamp-1 in preliminary experiments, we feel that a more thorough investigation of an additional locali-
zation of ASOR in intracellular compartments may be warranted.
When speculating about biological roles of ASOR it is instructive to compare it to acid-sensitive
ASIC channels (Waldmann et al., 1997; Wemmie et al., 2013). Besides being cation channels,
ASICs differ from ASOR by their larger molecular diversity (four different subunits can assemble to
various homo- and hetero-trimers), rapid inactivation and the degree of pH-sensitivity. Depending
on the isoform, their pH50 for activation ranges between ~4.8 and ~6.6 (Grunder and Pusch, 2015;
Wemmie et al., 2013), values that are up to more than 1 pH unit more alkaline than that of ASOR
(pH50 ~5.3). Hence several physiological functions of ASICs are unlikely to have equivalents with
ASOR. For instance, postsynaptic ASICs may enhance excitatory synaptic transmission by opening in
response to a drop in pH in the synaptic cleft that is caused by exocytosis of the acidic contents of
synaptic vesicles (Chu and Xiong, 2012; Grunder and Pusch, 2015; Huang et al., 2015). Even if
ASOR would be expressed postsynaptically, the estimated drop in pHo (Grunder and Pusch, 2015)
seems to be too small for its activation. ASICs also have roles in peripheral pain sensation
(Waldmann et al., 1997; Wemmie et al., 2013). If expressed on appropriate sensory neurons, such
a function is imaginable also for ASOR because the high intracellular Cl- concentration of peripheral
neurons would allow for a depolarizing Cl--efflux (Funk et al., 2008). Strikingly, naked mole-rats are
insensitive to acid-induced pain, but their ASIC channels show normal pH-sensitivity (Smith et al.,
2011). We likewise found here that TMEM206/ASOR channels of that species display normal pH-
sensitivity. The pH-insensitivity of mole-rats may rather be due to a changed pH-sensitivity of the
Na+-channel Nav1.7 (Eigenbrod et al., 2019; Smith et al., 2011).
Ullrich et al. eLife 2019;8:e49187. DOI: https://doi.org/10.7554/eLife.49187 15 of 25
Research article Cell Biology Structural Biology and Molecular Biophysics

Of note, ASIC channels are involved in various neurological pathologies that are associated with
acidic pHo (Huang et al., 2015; Wemmie et al., 2013), including stroke (Xiong et al., 2004) and
multiple sclerosis (Friese et al., 2007). Likewise, based on protective effects of non-specific ASOR
inhibitors, Okada and colleagues proposed that ASOR plays a role in acid-induced cell death of epi-
thelial cells (Wang et al., 2007) and neurons (Sato-Numata et al., 2014). Using TMEM206�/� cells,
we now ascertained that genetic ablation of TMEM206/ASOR channels partially protects cells from
cell death provoked by strongly acidic pHo (4.5). Interestingly, when compared to mice, cortical neu-
rons of naked mole rats are resistant to acid-induced cell death (at pH 5.0) (Husson and Smith,
2018). Since neither the pH-response of ASICs (Smith et al., 2011) nor of ASOR (this work) is
changed in that species, the explanation for this resistance may be due to channel expression levels
or other factors.
It has been proposed (Wang et al., 2007) that ASOR-dependent, acid-induced cell death results
from sustained cell swelling owed to the parallel influx of Na+ and Cl- through acid-activated ASIC
and ASOR channels, respectively. Whereas in our experiments WT cells initially swelled faster than
TMEM206�/� cells, they subsequently recovered their volume and even shrank. Initial swelling may
indeed be owed to the opening of both ASIC and ASOR, with ASIC-mediated Na+-influx mediating
the depolarization required for passive Cl- influx. In contrast to ASOR, however, ASIC channels inac-
tivate (Grunder and Pusch, 2015), leading to a reversal of the Cl- electrochemical potential, passive
efflux of Cl- through ASOR, and subsequent osmotic cell shrinkage. Although there is now little
doubt that TMEM206/ASOR channels foster acid-induced cell death, the underlying signal transduc-
tion cascade likely is complex.
Recently, while the present work was being completed, Yang et al. reported on their independent
identification and characterization of TMEM206 as integral component of the ASOR channel (which
the authors renamed PAC for Proton-Activated Channel) (Yang et al., 2019). They likewise reported
protective effects of TMEM206 disruption on acid-induced cell death of HEK cells or cultured pri-
mary cortical neurons. Intriguingly, these authors showed that Tmem206�/� mice showed smaller
stroke areas in a middle cerebral artery occlusion model (Yang et al., 2019), although the previously
reported decrease of pHo in the stroke area (down to ~6.4) (Nedergaard et al., 1991) is slightly
above the value needed for ASOR activation. In a cysteine modification scan restricted to the extra-
cellular half of TM2, they also found that reaction of I307C with MTSES reduces ASOR currents, and
showed that the I307A mutant displayed moderately decreased iodide permeability. These results
agree with our conclusion that the entire TM2 and the extracellular end of TM1 line ASOR’s pore in
an oligomeric complex.
ConclusionWe have identified TMEM206 as essential subunit of the acid-sensitive outwardly rectifying anion
channel ASOR. TMEM206 proteins constitute the pore of ASOR, probably in a homo-oligomeric
complex. TMEM206, which lacks paralogs in any given species, defines a structurally novel class of
ion channels. TMEM206/ASOR channels are involved in acid-induced cell death, but this role in
pathology cannot explain its wide and possibly ubiquitous expression across tissues and vertebrate
species. Its molecular identification in this work and in the parallel study of Yang et al. (2019) is an
important step to identify its physiological roles and to mechanistically understand the diverse ways
by which anion-selective channels can be formed.
Materials and methods
Key resources table
Reagent type(species) or resource Designation Source or reference Identifiers
Additionalinformation
Cell line(Homo sapiens)
HEK293 WT Deutsche Sammlungvon Mikroorganismenund Zellkulturen, Germany
ACC No. 305;RRID: CVCL_0045
Cell line(Homo sapiens)
HEK293 TMEM206-/- this paper generated from WT HEK293,different clones (Table 1)
Continued on next page
Ullrich et al. eLife 2019;8:e49187. DOI: https://doi.org/10.7554/eLife.49187 16 of 25
Research article Cell Biology Structural Biology and Molecular Biophysics

Continued
Reagent type(species) or resource Designation Source or reference Identifiers
Additionalinformation
Cell line(Homo sapiens)
HeLa WT Deutsche Sammlungvon Mikroorganismenund Zellkulturen, Germany
ACC No. 57;RRID: CVCL_0030
Cell line(Homo sapiens)
HeLa TREx Thermo Fisher Cat. No. R71407;RRID: CVCL_D587
Cell line(Homo sapiens)
HeLa-E2GFP-2A-FaNaC this paper see below forFaNaC/E2GFP
generated from HeLaTREx, clone E2F-5
Cell line(Homo sapiens)
HeLa TMEM206-/- this paper generated from HeLa-E2GFP-2A-FaNaC,different clones (Table 1)
Transfectedconstruct(S. pyogenes)
pSpCas9(BB)�2A-GFP (PX458) PMID: 24157548 RRID: Addgene_48138
Gene(Homo sapiens)
Human TMEM206 this paper RefSeq: NM_018252.2;UniProtKB: Q9H813
Cloned from humanbrain cDNA library(Clontech)
Gene(Heterocephalusglaber)
Naked mole-ratTMEM206
this paper RefSeq: XM_004853543.3;UniProtKB: A0A0N8ETT8
human codon-optimized,synthesized by LifeTechnologies
Gene(Gallus gallus)
Chicken TMEM206 this paper RefSeq: XM_419431.6;UniProtKB: A0A1D5PSZ0
human codon-optimized,synthesized by LifeTechnologies
Gene(Anolis carolinensis)
Green anoleTMEM206
this paper RefSeq: XM_003216011.3;UniProtKB: G1KFB8
human codon-optimized,synthesized by LifeTechnologies
Gene(Danio rerio)
ZebrafishTMEM206
this paper RefSeq: NM_001291762.1;UniProtKB: X1WG42
human codon-optimized,synthesized by LifeTechnologies
Gene(Saccoglossuskowalevskii)
Acorn wormTMEM206-like
this paper RefSeq: XM_006811230.1 human codon-optimized,synthesized by LifeTechnologies
Gene(Cornu aspersum)
FaNaC PMID: 7501021;PMID: 16034422
GenBank: X92113.1;UniProtKB: Q25011
Gene(Aequorea victoria)
E2GFP(GFP S65T/T203Y)
PMID: 17434942,PMID: 20581829
subcloned fromClopHensor(Addgene #25938)
Antibody anti-GFP
(chicken polyclonal)
Aves Lab Cat. No. GFP-1020;RRID: AB_10000240
(1/1,000)
Antibody anti-HA(rabbit monoclonal)
Cell Signaling Cat. No. 3724;RRID: AB_1549585
(1/1,000)
Antibody anti-GFP(rabbit polyclonal)
Thermo Fisher Cat. No. A-11122;RRID: AB_221569
(1/1,000)
Antibody anti-Na/K-ATPase(mouse monoclonal)
Millipore Cat. No. 05–369;RRID: AB_309699
(1/10,000)
Antibody anti-rabbitAlexaFluor633 (goat polyclonal)
Invitrogen Cat. No. A21071;RRID: AB_2535732
(1/2,000)
Antibody anti-chickenHRP (rabbitpolyclonal)
Sigma Cat. No. A-9792;RRID: AB_258473
(1/10,000)
Antibody anti-mouseHRP Affinipure(goat polyclonal)
JacksonImmunoResearch
Cat. No. 115-035-003;RRID: AB_10015289
(1/10,000)
Sequence-based reagent
DharmaconON-TARGETplus human siRNA library
HorizonDiscovery
Cat. No.G-105005-E2-025
arrayed in 384-well plates
Continued on next page
Ullrich et al. eLife 2019;8:e49187. DOI: https://doi.org/10.7554/eLife.49187 17 of 25
Research article Cell Biology Structural Biology and Molecular Biophysics
Continued
Reagent type(species) or resource Designation Source or reference Identifiers
Additionalinformation
Chemicalcompound, drug
FMRFamide(H-Phe-Met-Arg-Phe-NH2)
Bachem Cat. No. 4001566 5 mM stock in ddH2O,stored at �20˚C forup to 6 months
Chemicalcompound, drug
MTSES(2-Sulfonatoethylmethanethiosulfonate)
Biotium Cat. No. 91020 250 mM stock in ddH2O,freshly prepared, kepton ice for up to 4 hr
Chemicalcompound, drug
Pregnenolonesulfate (PS)
Sigma Cat. No. P162 50 mM stock in DMSO(stored at �20˚C for upto 6 months) forelectrophysiologyexperimentsor freshly diluted in PBS forcell death analysis
Chemicalcompound, drug
4,40-Diisothiocyanatostilbene-2,20-disulfonicacid (DIDS)
Sigma Cat. No. D3514 100 mM stock in DMSO,stored at �20˚C forup to 6 months
Chemicalcompound, drug
Niflumic acid (NFA) Sigma Cat. No. N0630 300 mM stock in DMSO,stored at �20˚C forup to 6 months
Chemicalcompound, drug
Hoechst 33342 ImmunoChemistryTechnologies
Cat. No. ICT-639
Chemicalcompound, drug
Propidium iodide Thermo Fisher Cat. No. P3566
Chemicalcompound, drug
Calcein AM Thermo Fisher Cat. No. 65-0853-39 10 mM stock in DMSO,stored at �20˚C forup to 6 months
HeLa-E2GFP-2A-FaNaC Cell Line used in the siRNA ScreenThe T-REx system (Life Technologies) was used to generate a stable HeLa cell line inducibly co-
expressing the halide-sensitive E2GFP variant (GFP S65T/T203Y) (Arosio et al., 2007) and the
FMRFamide-gated cation channel FaNaC (Lingueglia et al., 1995) (UniProtKB Q25011). A pcDNA5/
FRT/TO-based plasmid containing the cDNAs encoding E2GFP and FaNaC, separated by a self-
cleaving 2A peptide was generated for this purpose. Resulting clones were selected using 200 mg/
ml hygromycin B (Santa Cruz) and 4 mg/ml blasticidin (InvivoGen). Monoclonal cell lines were tested
for robust expression of E2GFP and FaNaC by fluorescence microscopy and patch clamp electro-
physiology, respectively. Clone E2F-5 was chosen for the genome-wide screen. Cells were kept in
DMEM supplemented with 10% tetracycline-free Hyclone FCS (Fisher Scientific) and the above-men-
tioned antibiotics.
Genome-wide siRNA screenThe genome-wide siRNA screen was performed at the FMP Screening Unit using the Dharmacon
ON-TARGETplus human siRNA library (Horizon Discovery) arrayed in 66 384-well plates, targeting
18090 genes by four pooled siRNAs each. The screen was performed three times.
For siRNA transfection, on a Freedom EVO 200 workstation (Tecan) 4 ml of a 500 nM library-
siRNA-OptiMEM solution was mixed in each well of the 384-well assay-plate with 0.125 ml Lipofect-
amine RNAiMAX transfection reagent (Life Technologies) previously diluted in 5.875 ml OptiMEM
(Life Technologies). Subsequently, 3,000 cells/well in phenol red-free DMEM (PAN Biotech) were
seeded onto the pre-dispensed transfection mixture using an EL406TM dispenser (BioTek) resulting
in a final concentration of 50 nM siRNA SMARTpool in a total volume of 40 ml per well. To induce
E2GFP-2A-FaNaC expression after 24 hr, 10 ml phenol red-free DMEM containing 5 mg/ml doxycy-
cline were added resulting in a final concentration of 1 mg/ml doxycycline.
The quenching assay was performed 72 hr post-transfection. First, using an EL406 washer dis-
penser (BioTek), cells were washed three times with 120 ml/well of a bath solution containing (in
mM): 145 NaCl, 5 KCl, 1 MgCl2, 2 CaCl2, 10 glucose, 10 HEPES, pH 7.4 with NaOH, 320 mOsm/kg.
Ullrich et al. eLife 2019;8:e49187. DOI: https://doi.org/10.7554/eLife.49187 18 of 25
Research article Cell Biology Structural Biology and Molecular Biophysics

Subsequently, wells were aspirated to 10 ml residual volume. The plates were transferred into the
FLIPR Tetra High Throughput Cellular Screening System (Molecular Devices) for measurements. All
wells of the plate were simultaneously illuminated at l = 470–549 nm with an exposure time of 0.53
s and E2GFP-fluorescence was measured at l = 515–575 nm. Measurements were taken in intervals
of 1 s for 300 s. After recording the baseline fluorescence for 10 s, parallel pipetting added 25 ml
acidic iodide-containing solution with the following composition (in mM): 145 NaCI, 5 KCl, 1 MgCl2,
2 CaCl2, 10 glucose, 5 Na3citrate and 30 mM FMRFamide (H-Phe-Met-Arg-Phe-NH2 acetate salt,
Bachem), pH 4.83, 320 mOsm/kg. The mixture of this solution with remaining bath solution resulted
in approximately 100 mM iodide, 20 mM FMRFamide and pH 5. Control wells received the same
solution without FMRFamide.
Analysis and processing of data obtained in the genome-wide screen were performed with the
KNIME Analytics Platform (KNIME). The maximal slope of fluorescence change was determined by
linear regression of 10 points in a sliding window between 20 s and 100 s. Slope was normalized to
the averaged baseline and background fluorescence.
For plate-wise normalization a Z-score was calculated from the normalized slope value as follows:
Z ¼xi� x
~
MADx
where xi is the normalized slope from well i, x~is the median and MADx the median absolute devi-
ation of all candidate wells in the plate.
The median of the three replicate Z-scores per target gene was used to rank the data. As a mea-
sure of cell viability, an additional Z-score was calculated from the baseline fluorescence. We filtered
out all candidates in which the median Baseline START Z-score was lower than �0.5, indicating a sig-
nificantly reduced cell number.
ElectrophysiologyCells were plated onto poly-L-lysine-coated coverslips and transfected using the Xfect (Clontech)
transfection reagent. Whole-cell patch-clamp recordings were performed 1 day after transfection
using an EPC-10 USB patch-clamp amplifier and PatchMaster software (HEKA Elektronik). All experi-
ments were performed at 20–22˚C. Patch pipettes had a resistance of 1–3 MW in NaCl/CsCl-based
solutions. The holding potential was �30 mV. Cells with a series resistance above 8 MW were dis-
carded, and series resistance was not compensated for. Currents were sampled at 1 kHz and low-
pass filtered at 10 kHz. In some cases, a notch filter was applied to current traces post-recording to
minimize line noise.
The standard pipette solution contained (in mM): 150 CsCl, 10 EGTA, 10 HEPES, 5 MgCl2, pH 7.2
with CsOH (320 mOsm/kg). The standard pH 7.4 bath solution in which cells were kept before acti-
vation of acid-induced currents contained (in mM): 145 NaCl, 5 KCl, 1 MgCl2, 2 CaCl2, 10 glucose,
Table 1. TMEM206 Knockout Cell Lines.
Cell line Clone sgRNA sequence Genetic modification Protein modification Figures
HEK293TMEM206�/
�
1D4 CAGCTGTAAGCACCATTACG a1: duplication of a395a2: Da395
1: Y132stop between TMD1 andTMD22: Y132S-fs between TMD1 andTMD2
3E
2E5 GGACCGAGAAGACGTTCTTC Homozygous D2nt (g189-a190) N64R-fs before TMD1 3 C-H; 4; 5; 6; 6-S1; 7; 7-S1; 8;
3D9 AAGGAGACGGTCAGAGTCCA Homozygous duplication of t110 Q38P-fs before TMD1 3E; 8A-B
HeLaTMEM206�/
�
1G1 CAGCTGTAAGCACCATTACG duplication of a395 Y132stop between TMD1 andTMD2
3-S1
2C6 GGACCGAGAAGACGTTCTTC a1: D11nt (g178-a188) a2: duplicationof g189
1: A60E-fs2: N64E-fs before TMD1
3-S1
3F8 AAGGAGACGGTCAGAGTCCA duplication of t110 Q38P-fs before TMD1 2A,C,D; 8C,D; 3-S1
a = allele; fs = frameshift; nt = nucleotide; TMD = transmembrane domain; D deletion.
DOI: https://doi.org/10.7554/eLife.49187.009
Ullrich et al. eLife 2019;8:e49187. DOI: https://doi.org/10.7554/eLife.49187 19 of 25
Research article Cell Biology Structural Biology and Molecular Biophysics

10 HEPES, pH 7.4 with NaOH (320 mOsm/kg). Solutions with a pH between 4.0 and 5.25 were iden-
tical in composition, but buffered with 5 mM Na3citrate instead of HEPES. pH of these solutions was
adjusted using citrate. Likewise, solutions with a pH between 5.5 and 6.0 were buffered with 10 mM
MES and adjusted with NaOH. To determine anion selectivities (Figure 4A), NaCl in the pH 4.8 bath
solution was replaced by equimolar amounts of NaBr, NaI, NaNO3 and NaSCN. The control bath
solution for the ion selectivity experiments shown in Figure 5E–I and Figure 7 contained (in mM)
150 NaCl, 2 Ca(OH)2, 1 EGTA, five citric acid, pH 5.25 with NMDG-OH (320 mOsm/kg). To deter-
mine relative permeabilities, NaCl was replaced by an equimolar amount of NaI, or with 100 mM
Na2SO4. In these experiments the pipette solution contained (in mM): 140 NMDG-Cl, 10 EGTA, 10
HEPES, 5 MgCl2, pH 7.2 with NMDG-OH (320 mOsm/kg). Osmolarities of all solutions were assessed
with an Osmomat 030 freezing point osmometer (Gonotec) and adjusted using mannitol.
MTSES was purchased from Biotium and stored at �20˚C as powder. MTSES stock solutions (250
mM in water) were freshly prepared on each day and kept on ice until final dilution in recording solu-
tions right before experiments.
The standard protocol for measuring the time course of acid activated currents, applied every 4 s
after membrane rupture, consisted of a 100 ms step to �80 mV followed by a 500 ms ramp from
�80 to +80 mV. The read-out for current amplitudes was the current at �80 mV and +80 mV normal-
ized to cell capacitance (current density, I/C). The voltage protocol, applied after complete activa-
tion of ASOR, consisted of 1 s steps starting from �80 mV to +80 mV in 20 mV intervals preceded
and followed by a 0.5 s step to �80 mV every 4 s.
An agar bridge was used in all electrophysiological experiments. Solution was exchanged in the
entire bath chamber using a custom gravity-fed perfusion system under TTL control, achieving full
exchange in <5 s. Liquid junction potentials (LJPs) were only considered in ion selectivity experi-
ments (Figures 5 and 7). LJPs were measured experimentally for all solutions used in these experi-
ments with reference to NMDG-Cl pipette solution according to Neher (1992) and corrected for
after data acquisition. The measured values (mean ± SD) were: 4.5 ± 0.3 mV (NaCl, n = 4), 4.3 ± 0.3
mV (NaI, n = 4), and 9.5 ± 0.1 mV (Na2SO4, n = 4).
Molecular biologyHuman TMEM206 was cloned from cDNA obtained from a human brain cDNA library (Clontech)
using the following primers:
Forward: AGAAGCTTCCACCATGATCCGGCAGGAGCGCTCCAC
Reverse: GAGGATCCTCAGCTTATGTGGCTCGTTGCCTG
HindIII and BamHI restriction sites on the primers were used to clone the PCR product into
pcDNA3.1(+) (Invitrogen). Sequencing of the entire ORF confirmed the sequence was identical to
NCBI RefSeq NM_018252.2. Subsequently, the cDNA was subcloned into other vectors such as
pEGFP-N1/C1 using PCR-based strategies. Point mutations were introduced using the QuikChange
Kit (Agilent). All clones were verified by sequencing the entire ORF. TMEM206 ortholog cDNA
clones (human codon-optimized) were synthesized by Life Technologies. The cDNAs were subcloned
into pEGFP-C1 for fusion of an N-terminal GFP tag.
Cell cultureHEK293 and HeLa cells were maintained in DMEM (PAN Biotech) supplemented with 10% FBS (PAN
Biotech) and 1% penicillin/streptomycin at 37˚C and 5% CO2. Cells were regularly tested for myco-
plasma contamination.
Generation of monoclonal knockout cell linesCell lines with disruptions in the TMEM206 gene were generated using CRISPR-Cas9 as described
previously (Voss et al., 2014). Briefly, target sgRNAs were cloned into the pSpCas9(BB)�2A-GFP
(PX458, gift from Feng Zhang, MIT) vector and transfected into HEK293 and HeLa cells. 2–5 days
post-transfection single GFP-positive cells were FACS-sorted into 96-well plates containing pre-con-
ditioned DMEM medium. Monoclonal cell lines were raised and tested for sequence alterations
using target-site-specific PCR on genomic DNA followed by Sanger-sequencing. sgRNA sequences,
genetic modifications and resulting protein mutations are listed for each clone in Table 1.
Ullrich et al. eLife 2019;8:e49187. DOI: https://doi.org/10.7554/eLife.49187 20 of 25
Research article Cell Biology Structural Biology and Molecular Biophysics

ImmunocytochemistryTo determine the transmembrane topology of TMEM206, TMEM206�/� HeLa cells (clone 3F8) were
transfected with plasmids encoding GFP-TMEM206, TMEM206-GFP or TMEM206 containing a HA
tag (YPYDVPDYA) after residue 271 using Lipofectamine 2000. 24 hr after transfection, cells were
fixed with 2% PFA for 10 min and permeabilized with 0.1% Triton X-100 as indicated. Cells were
incubated with chicken anti-GFP (1/1000, Aves Lab) or rabbit anti-HA (1/1000, Cell Signaling) for 2
hr and subsequently with secondary antibodies coupled to AlexaFluor633 for 1 hr. For the non-per-
meabilized conditions, no Triton X-100 was added to the antibody solutions.
Images were acquired with a confocal microscope with a 63x NA1.4 oil-immersion lens (LSM880,
Zeiss).
Deglycosylation and western blotTo determine glycosylation of TMEM206, TMEM206�/� HEK cells (clone 2E5) were transfected with
plasmids coding for GFP-TMEM206 or mutants of putative glycosylation sites (GFP-TMEM206
N148A, N155A, N162A, N190A) using polyethylenimine (PEI). One day after transfection, cells were
scrapped in homogenization buffer containing (in mM): 140 NaCl, 20 Tris HCl pH 7.4, 2 EDTA, 4
Pefabloc (Roth) and Complete proteinase inhibitor cocktail (Roche). Cell debris were removed by
centrifugation at 1000 g for 10 min and the supernatant was ultracentrifuged at 269,000 g for 30
min. Pellets containing the membrane fractions were resuspended in lysis buffer containing (in mM):
140 NaCl, 50 Tris HCl pH 6.8, 0.05 EDTA, 1% SDS, 1% Triton X-100, 2 EDTA, 4 Pefabloc (Roth) and
Complete proteinase inhibitor cocktail (Roche). Protein concentration of the membrane fractions
was determined by BCA.
40 mg of membrane protein were denaturated by adding 2 ml of denaturation buffer (New Eng-
land Biolabs), for a final volume of 20 ml, and heating the reaction at 55˚C for 15 min. 4 ml of 10xG7
Buffer (NEB), 4 ml of 10% NP-40 (NEB) and 8 ml of PNGase F (NEB) were added, for a total volume
of 40 ml. After 2 hr incubation at 37˚C, the deglycosylation reaction was terminated by adding 10 ml
of La€mmli sample buffer. Samples were separated by SDS-PAGE and analyzed by Western blot using
rabbit anti-GFP antibody (1/1000, Thermo Fisher). Na/K-ATPase was used as loading control and
detected using a mouse antibody (1/10,000, Millipore).
Acid-Induced cell death assayAcid-induced cell death of WT and TMEM206�/� HEK293 cells (clones 2E5 and 3D9) was assessed
by double staining with Hoechst 33342 and propidium iodide (PI). WT and KO cells were incubated
for 2 hr at 37˚C with solution at pH 7.4 (HEPES) or 4.5 (citrate, see Electrophysiology). Experimental
solutions were subsequently replaced with pH 7.4 solution containing Hoechst 33342 (1 mg/ml,
ImmunoChemistry Technologies) and PI (5 mg/ml, Thermo Fischer) and cells were incubated for 15
min at 37˚C. After washing, cells were fixed and analyzed using a confocal microscope (LSM880,
Zeiss). For quantification, several 10x microscopic fields were randomly chosen. Percentage of PI
positive cells over the total number of cells, identified with Hoechst 33342, was determined using
Fiji.
Cell volume measurementsCell volume was measured semi-quantitatively using the calcein fluorescence method (Capo-
Aponte et al., 2005). HEK293 cells were plated 2 days before measurements in a 96-well-plate at a
density of 45,000 cells per well, HeLa cells were plated 1 day before measurements at a density of
35,000 cells per well. Cells were loaded with 10 mM calcein-AM (eBioscience) in DMEM for 1 hr at
37˚C. Subsequently, cells were washed 3 times with 100 ml of a pH 7.4 (HEPES, see Electrophysiol-
ogy) bath solution. After washing, each well contained 50 ml bath solution. Following a 5 min incuba-
tion period the plate was transferred into Safire2 Multimode Microplate Reader (Tecan) and
fluorescence measurements at l = 495 nm were initiated. After baseline recording for 30 s, 125 ml of
a pH 4.0 (citrate, see Electrophysiology) solution, or pH 7.4 bath solution were added to the wells
resulting in a final pH of 4.2 or 7.4 respectively. Calcein fluorescence was measured every 10 s for 10
min. Wells containing cells of the respective cell line not loaded with calcein-AM (but otherwise
treated equally) were used for background subtraction, and fluorescence values were normalized to
t = 0 s (after the pipetting procedure).
Ullrich et al. eLife 2019;8:e49187. DOI: https://doi.org/10.7554/eLife.49187 21 of 25
Research article Cell Biology Structural Biology and Molecular Biophysics

AcknowledgementsWe thank Sabrina Kleissle for excellent help with the genome-wide siRNA screen, Marc Wippich for
help with data analysis, and Judith von Sivers for technical assistance. This work was supported by
the European Research Council (ERC) Advanced Grant VOLSIGNAL (#740537) to TJJ and an EMBO
Long-Term Fellowship (ALTF 665-2017) to SB.
Additional information
Funding
Funder Grant reference number Author
H2020 European ResearchCouncil
Advanced GrantVOLSIGNAL (#740537)
Thomas J Jentsch
EMBO Long-Term Fellowship ALTF665-2017
Sandy Blin
The funders had no role in study design, data collection and interpretation, or the
decision to submit the work for publication.
Author contributions
Florian Ullrich, Conceptualization, Formal analysis, Validation, Investigation, Visualization, Writing—
review and editing, Developed the genomic siRNA screening procedure, Optimized, performed and
evaluated it together with KL, Performed all electrophysiology experiments; Sandy Blin, Formal
analysis, Validation, Investigation, Visualization, Writing—review and editing, Performed IHC,
topology, and cell death experiments; Katina Lazarow, Formal analysis, Validation, Investigation,
Writing—review and editing, Together with FU evaluated the genomic siRNA screening procedure;
Tony Daubitz, Formal analysis, Validation, Investigation, Visualization, Writing—review and editing,
Performed cell volume measurements; Jens Peter von Kries, Resources, Supervision, Funding
acquisition, Supervised siRNA screen; Thomas J Jentsch, Conceptualization, Resources, Formal
analysis, Supervision, Funding acquisition, Validation, Writing—original draft, Writing—review and
editing, Planned and evaluated experiments, Wrote the paper
Author ORCIDs
Florian Ullrich https://orcid.org/0000-0002-1153-2040
Sandy Blin https://orcid.org/0000-0001-5762-5149
Thomas J Jentsch https://orcid.org/0000-0002-3509-2553
Decision letter and Author response
Decision letter https://doi.org/10.7554/eLife.49187.027
Author response https://doi.org/10.7554/eLife.49187.028
Additional files
Supplementary files. Transparent reporting form
DOI: https://doi.org/10.7554/eLife.49187.025
Data availability
Raw data are in part presented in the manuscript (e.g. IHC, Western, clamp traces), and as source
data files where data points (such as current densities, ratios of permeability etc) have been
extracted from original electrophysiological recordings.
Ullrich et al. eLife 2019;8:e49187. DOI: https://doi.org/10.7554/eLife.49187 22 of 25
Research article Cell Biology Structural Biology and Molecular Biophysics

ReferencesArosio D, Garau G, Ricci F, Marchetti L, Bizzarri R, Nifosı R, Beltram F. 2007. Spectroscopic and structural studyof proton and halide ion cooperative binding to gfp. Biophysical Journal 93:232–244. DOI: https://doi.org/10.1529/biophysj.106.102319, PMID: 17434942
Auzanneau C, Thoreau V, Kitzis A, Becq F. 2003. A novel voltage-dependent chloride current activated byextracellular acidic pH in cultured rat Sertoli cells. Journal of Biological Chemistry 278:19230–19236.DOI: https://doi.org/10.1074/jbc.M301096200, PMID: 12637509
Baconguis I, Bohlen CJ, Goehring A, Julius D, Gouaux E. 2014. X-ray structure of acid-sensing ion channel 1-snake toxin complex reveals open state of a Na+-selective channel. Cell 156:717–729. DOI: https://doi.org/10.1016/j.cell.2014.01.011, PMID: 24507937
Bengele HH, Graber ML, Alexander EA. 1983. Effect of respiratory acidosis on acidification by the medullarycollecting duct. American Journal of Physiology-Renal Physiology 244:F89–F94. DOI: https://doi.org/10.1152/ajprenal.1983.244.1.F89
Browe BM, Vice EN, Park TJ. 2018. Naked Mole-Rats: blind, naked, and feeling no pain. The Anatomical Record.DOI: https://doi.org/10.1002/ar.23996
Capo-Aponte JE, Iserovich P, Reinach PS. 2005. Characterization of regulatory volume behavior by fluorescencequenching in human corneal epithelial cells. Journal of Membrane Biology 207:11–22. DOI: https://doi.org/10.1007/s00232-005-0800-5, PMID: 16463139
Capurro V, Gianotti A, Caci E, Ravazzolo R, Galietta LJV, Zegarra-Moran O. 2015. Functional analysis of acid-activated cl� channels: properties and mechanisms of regulation. Biochimica Et Biophysica Acta (BBA) -Biomembranes 1848:105–114. DOI: https://doi.org/10.1016/j.bbamem.2014.10.008
Caputo A, Caci E, Ferrera L, Pedemonte N, Barsanti C, Sondo E, Pfeffer U, Ravazzolo R, Zegarra-Moran O,Galietta LJ. 2008. TMEM16A, a membrane protein associated with calcium-dependent chloride channelactivity. Science 322:590–594. DOI: https://doi.org/10.1126/science.1163518, PMID: 18772398
Chu XP, Xiong ZG. 2012. Physiological and pathological functions of acid-sensing ion channels in the centralnervous system. Current Drug Targets 13:263–271. DOI: https://doi.org/10.2174/138945012799201685,PMID: 22204324
Drews A, Mohr F, Rizun O, Wagner TF, Dembla S, Rudolph S, Lambert S, Konrad M, Philipp SE, Behrendt M,Marchais-Oberwinkler S, Covey DF, Oberwinkler J. 2014. Structural requirements of steroidal agonists oftransient receptor potential melastatin 3 (TRPM3) cation channels. British Journal of Pharmacology 171:1019–1032. DOI: https://doi.org/10.1111/bph.12521, PMID: 24251620
Edrey YH, Park TJ, Kang H, Biney A, Buffenstein R. 2011. Endocrine function and neurobiology of the longest-living rodent, the naked mole-rat. Experimental Gerontology 46:116–123. DOI: https://doi.org/10.1016/j.exger.2010.09.005, PMID: 20888895
Eigenbrod O, Debus KY, Reznick J, Bennett NC, Sanchez-Carranza O, Omerbasic D, Hart DW, Barker AJ, ZhongW, Lutermann H, Katandukila JV, Mgode G, Park TJ, Lewin GR. 2019. Rapid molecular evolution of paininsensitivity in multiple African rodents. Science 364:852–859. DOI: https://doi.org/10.1126/science.aau0236,PMID: 31147513
Friese MA, Craner MJ, Etzensperger R, Vergo S, Wemmie JA, Welsh MJ, Vincent A, Fugger L. 2007. Acid-sensing ion channel-1 contributes to axonal degeneration in autoimmune inflammation of the central nervoussystem. Nature Medicine 13:1483–1489. DOI: https://doi.org/10.1038/nm1668, PMID: 17994101
Fu ZJ, Li XZ, Wang QR, Shi L, Zhang LQ, Pan XL. 2013. Extracellular acidic pH-activated, outward rectifyingchloride currents can be regulated by reactive oxygen species in human THP-1 monocytes. Biochemical andBiophysical Research Communications 432:701–706. DOI: https://doi.org/10.1016/j.bbrc.2013.01.090,PMID: 23376719
Funk K, Woitecki A, Franjic-Wurtz C, Gensch T, Mohrlen F, Frings S. 2008. Modulation of chloride homeostasisby inflammatory mediators in dorsal root ganglion neurons. Molecular Pain 4:1744-8069-4-32. DOI: https://doi.org/10.1186/1744-8069-4-32
Gillies RJ, Brown JS, Anderson ARA, Gatenby RA. 2018. Eco-evolutionary causes and consequences of temporalchanges in intratumoural blood flow. Nature Reviews Cancer 18:576–585. DOI: https://doi.org/10.1038/s41568-018-0030-7, PMID: 29891961
Graves AR, Curran PK, Smith CL, Mindell JA. 2008. The Cl-/H+ antiporter ClC-7 is the primary chloridepermeation pathway in lysosomes. Nature 453:788–792. DOI: https://doi.org/10.1038/nature06907, PMID: 18449189
Grunder S, Pusch M. 2015. Biophysical properties of acid-sensing ion channels (ASICs). Neuropharmacology 94:9–18. DOI: https://doi.org/10.1016/j.neuropharm.2014.12.016, PMID: 25585135
Gunther W, Luchow A, Cluzeaud F, Vandewalle A, Jentsch TJ. 1998. ClC-5, the chloride channel mutated inDent’s disease, colocalizes with the proton pump in endocytotically active kidney cells. PNAS 95:8075–8080.DOI: https://doi.org/10.1073/pnas.95.14.8075, PMID: 9653142
Hartzell HC, Qu Z, Yu K, Xiao Q, Chien LT. 2008. Molecular physiology of bestrophins: multifunctionalmembrane proteins linked to Best disease and other retinopathies. Physiological Reviews 88:639–672.DOI: https://doi.org/10.1152/physrev.00022.2007, PMID: 18391176
Holmgren M, Liu Y, Xu Y, Yellen G. 1996. On the use of thiol-modifying agents to determine channel topology.Neuropharmacology 35:797–804. DOI: https://doi.org/10.1016/0028-3908(96)00129-3, PMID: 8938712
Ullrich et al. eLife 2019;8:e49187. DOI: https://doi.org/10.7554/eLife.49187 23 of 25
Research article Cell Biology Structural Biology and Molecular Biophysics
Huang Y, Jiang N, Li J, Ji YH, Xiong ZG, Zha XM. 2015. Two aspects of ASIC function: synaptic plasticity andneuronal injury. Neuropharmacology 94:42–48. DOI: https://doi.org/10.1016/j.neuropharm.2014.12.010,PMID: 25582290
Husson Z, Smith ESJ. 2018. Naked mole-rat cortical neurons are resistant to acid-induced cell death. MolecularBrain 11:26. DOI: https://doi.org/10.1186/s13041-018-0369-4, PMID: 29739425
Jasti J, Furukawa H, Gonzales EB, Gouaux E. 2007. Structure of acid-sensing ion channel 1 at 1.9 A resolutionand low pH. Nature 449:316–323. DOI: https://doi.org/10.1038/nature06163, PMID: 17882215
Jentsch TJ, Steinmeyer K, Schwarz G. 1990. Primary structure of Torpedo marmorata chloride channel isolatedby expression cloning in Xenopus oocytes. Nature 348:510–514. DOI: https://doi.org/10.1038/348510a0,PMID: 2174129
Jentsch TJ, Stein V, Weinreich F, Zdebik AA. 2002. Molecular structure and physiological function of chloridechannels. Physiological Reviews 82:503–568. DOI: https://doi.org/10.1152/physrev.00029.2001, PMID: 11917096
Jentsch TJ. 2007. Chloride and the endosomal-lysosomal pathway: emerging roles of CLC chloride transporters.The Journal of Physiology 578:633–640. DOI: https://doi.org/10.1113/jphysiol.2006.124719, PMID: 17110406
Jentsch TJ, Pusch M. 2018. CLC chloride channels and transporters: structure, function, physiology, and disease.Physiological Reviews 98:1493–1590. DOI: https://doi.org/10.1152/physrev.00047.2017, PMID: 29845874
Kato Y, Ozawa S, Miyamoto C, Maehata Y, Suzuki A, Maeda T, Baba Y. 2013. Acidic extracellularmicroenvironment and cancer. Cancer Cell International 13:89. DOI: https://doi.org/10.1186/1475-2867-13-89,PMID: 24004445
Kornak U, Kasper D, Bosl MR, Kaiser E, Schweizer M, Schulz A, Friedrich W, Delling G, Jentsch TJ. 2001. Loss ofthe ClC-7 chloride channel leads to osteopetrosis in mice and man. Cell 104:205–215. DOI: https://doi.org/10.1016/S0092-8674(01)00206-9, PMID: 11207362
Lambert S, Oberwinkler J. 2005. Characterization of a proton-activated, outwardly rectifying anion channel. TheJournal of Physiology 567:191–213. DOI: https://doi.org/10.1113/jphysiol.2005.089888, PMID: 15961423
Li T, Yang Y, Canessa CM. 2011. Outlines of the pore in open and closed conformations describe the gatingmechanism of ASIC1. Nature Communications 2:399. DOI: https://doi.org/10.1038/ncomms1409,PMID: 21772270
Lingueglia E, Champigny G, Lazdunski M, Barbry P. 1995. Cloning of the amiloride-sensitive FMRFamidepeptide-gated sodium channel. Nature 378:730–733. DOI: https://doi.org/10.1038/378730a0, PMID: 7501021
Ma ZY, Zhang W, Chen L, Wang R, Kan XH, Sun GZ, Liu CX, Li L, Zhang Y. 2008. A proton-activated, outwardlyrectifying chloride channel in human umbilical vein endothelial cells. Biochemical and Biophysical ResearchCommunications 371:437–440. DOI: https://doi.org/10.1016/j.bbrc.2008.04.090, PMID: 18442470
Nedergaard M, Kraig RP, Tanabe J, Pulsinelli WA. 1991. Dynamics of interstitial and intracellular pH in evolvingbrain infarct. American Journal of Physiology-Regulatory, Integrative and Comparative Physiology 260:R581–R588. DOI: https://doi.org/10.1152/ajpregu.1991.260.3.R581
Neher E. 1992. Correction for liquid junction potentials in patch clamp experiments. Methods in Enzymology207:123–131. DOI: https://doi.org/10.1016/0076-6879(92)07008-c, PMID: 1528115
Nobles M, Higgins CF, Sardini A. 2004. Extracellular acidification elicits a chloride current that sharescharacteristics with ICl(swell). American Journal of Physiology. Cell Physiology 287:C1426–C1435. DOI: https://doi.org/10.1152/ajpcell.00549.2002, PMID: 15306547
Park TJ, Lu Y, Juttner R, Smith ES, Hu J, Brand A, Wetzel C, Milenkovic N, Erdmann B, Heppenstall PA, LauritoCE, Wilson SP, Lewin GR. 2008. Selective inflammatory pain insensitivity in the African naked mole-rat(Heterocephalus glaber). PLOS Biology 6:e13. DOI: https://doi.org/10.1371/journal.pbio.0060013, PMID: 18232734
Piwon N, Gunther W, Schwake M, Bosl MR, Jentsch TJ. 2000. ClC-5 Cl- channel disruption impairs endocytosis ina mouse model for Dent’s disease. Nature 408:369–373. DOI: https://doi.org/10.1038/35042597, PMID: 11099045
Qiu Z, Dubin AE, Mathur J, Tu B, Reddy K, Miraglia LJ, Reinhardt J, Orth AP, Patapoutian A. 2014. SWELL1, aplasma membrane protein, is an essential component of volume-regulated anion channel. Cell 157:447–458.DOI: https://doi.org/10.1016/j.cell.2014.03.024, PMID: 24725410
Sato-Numata K, Numata T, Okada T, Okada Y. 2013. Acid-sensitive outwardly rectifying (ASOR) anion channelsin human epithelial cells are highly sensitive to temperature and independent of ClC-3. Pflugers Archiv -European Journal of Physiology 465:1535–1543. DOI: https://doi.org/10.1007/s00424-013-1296-y
Sato-Numata K, Numata T, Okada Y. 2014. Temperature sensitivity of acid-sensitive outwardly rectifying (ASOR)anion channels in cortical neurons is involved in hypothermic neuroprotection against acidotoxic necrosis.Channels 8:278–283. DOI: https://doi.org/10.4161/chan.27748, PMID: 24476793
Sato-Numata K, Numata T, Inoue R, Okada Y. 2016. Distinct pharmacological and molecular properties of theacid-sensitive outwardly rectifying (ASOR) anion channel from those of the volume-sensitive outwardlyrectifying (VSOR) anion channel. Pflugers Archiv - European Journal of Physiology 468:795–803. DOI: https://doi.org/10.1007/s00424-015-1786-1
Scheel O, Zdebik AA, Lourdel S, Jentsch TJ. 2005. Voltage-dependent electrogenic chloride/proton exchange byendosomal CLC proteins. Nature 436:424–427. DOI: https://doi.org/10.1038/nature03860, PMID: 16034422
Schroeder BC, Cheng T, Jan YN, Jan LY. 2008. Expression cloning of TMEM16A as a calcium-activated chloridechannel subunit. Cell 134:1019–1029. DOI: https://doi.org/10.1016/j.cell.2008.09.003, PMID: 18805094
Ullrich et al. eLife 2019;8:e49187. DOI: https://doi.org/10.7554/eLife.49187 24 of 25
Research article Cell Biology Structural Biology and Molecular Biophysics

Silver IA, Murrills RJ, Etherington DJ. 1988. Microelectrode studies on the acid microenvironment beneathadherent macrophages and osteoclasts. Experimental Cell Research 175:266–276. DOI: https://doi.org/10.1016/0014-4827(88)90191-7, PMID: 3360056
Smith ES, Omerbasic D, Lechner SG, Anirudhan G, Lapatsina L, Lewin GR. 2011. The molecular basis of acidinsensitivity in the African naked mole-rat. Science 334:1557–1560. DOI: https://doi.org/10.1126/science.1213760, PMID: 22174253
Sun H, Tsunenari T, Yau KW, Nathans J. 2002. The vitelliform macular dystrophy protein defines a new family ofchloride channels. PNAS 99:4008–4013. DOI: https://doi.org/10.1073/pnas.052692999, PMID: 11904445
Thews O, Riemann A. 2019. Tumor pH and metastasis: a malignant process beyond hypoxia. Cancer andMetastasis Reviews 38:113–129. DOI: https://doi.org/10.1007/s10555-018-09777-y, PMID: 30607627
Valinsky WC, Touyz RM, Shrier A. 2017. Characterization of constitutive and acid-induced outwardly rectifyingchloride currents in immortalized mouse distal tubular cells. Biochimica Et Biophysica Acta (BBA) - GeneralSubjects 1861:2007–2019. DOI: https://doi.org/10.1016/j.bbagen.2017.05.004
Voss FK, Ullrich F, Munch J, Lazarow K, Lutter D, Mah N, Andrade-Navarro MA, von Kries JP, Stauber T, JentschTJ. 2014. Identification of LRRC8 heteromers as an essential component of the volume-regulated anion channelVRAC. Science 344:634–638. DOI: https://doi.org/10.1126/science.1252826, PMID: 24790029
Waldmann R, Champigny G, Bassilana F, Heurteaux C, Lazdunski M. 1997. A proton-gated cation channelinvolved in acid-sensing. Nature 386:173–177. DOI: https://doi.org/10.1038/386173a0, PMID: 9062189
Wang H-Y, Shimizu T, Numata T, Okada Y. 2007. Role of acid-sensitive outwardly rectifying anion channels inacidosis-induced cell death in human epithelial cells. Pflugers Archiv - European Journal of Physiology 454:223–233. DOI: https://doi.org/10.1007/s00424-006-0193-z
Wemmie JA, Taugher RJ, Kreple CJ. 2013. Acid-sensing ion channels in pain and disease. Nature ReviewsNeuroscience 14:461–471. DOI: https://doi.org/10.1038/nrn3529, PMID: 23783197
Xiong ZG, Zhu XM, Chu XP, Minami M, Hey J, Wei WL, MacDonald JF, Wemmie JA, Price MP, Welsh MJ, SimonRP. 2004. Neuroprotection in ischemia: blocking calcium-permeable acid-sensing ion channels. Cell 118:687–698. DOI: https://doi.org/10.1016/j.cell.2004.08.026, PMID: 15369669
Yamamoto S, Ehara T. 2006. Acidic extracellular pH-activated outwardly rectifying chloride current in mammaliancardiac myocytes. American Journal of Physiology-Heart and Circulatory Physiology 290:H1905–H1914.DOI: https://doi.org/10.1152/ajpheart.00965.2005, PMID: 16339831
Yang YD, Cho H, Koo JY, Tak MH, Cho Y, Shim WS, Park SP, Lee J, Lee B, Kim BM, Raouf R, Shin YK, Oh U.2008. TMEM16A confers receptor-activated calcium-dependent chloride conductance. Nature 455:1210–1215.DOI: https://doi.org/10.1038/nature07313, PMID: 18724360
Yang J, Chen J, Del Carmen Vitery M, Osei-Owusu J, Chu J, Yu H, Sun S, Qiu Z. 2019. PAC, an evolutionarilyconserved membrane protein, is a proton-activated chloride channel. Science 364:395–399. DOI: https://doi.org/10.1126/science.aav9739, PMID: 31023925
Ullrich et al. eLife 2019;8:e49187. DOI: https://doi.org/10.7554/eLife.49187 25 of 25
Research article Cell Biology Structural Biology and Molecular Biophysics