identifying and evaluating the internet opinion leader community based on k-clique clustering
TRANSCRIPT

ORIGINAL ARTICLE
Identifying and evaluating the internet opinion leader communitybased on k-clique clustering
Weizhe Zhang • Hui He • Boran Cao
Received: 15 February 2013 / Accepted: 4 December 2013
� Springer-Verlag London 2013
Abstract With the rapid development of the Internet, the
Internet has become an important place for producing and
spreading public sentiment. Opinion leaders play an
important role in leading the public opinion. In this paper,
we extract the communities by analyzing the replies of
each post in the bulletin board system. Then, an opinion
leader community mining method is proposed based on the
level structure. Thus, the communities have better overlaps
and multiple relations. Also, we analyze the revolution of
the opinion leader communities and put forward a time-
dividing method. With this method, we divided whole
communities into different pieces based on the character of
the post and the duration of the time. And we come up with
suitable parameters to receive the evolution results of the
communities. Finally, our experiments prove the efficiency
of the opinion leader community mining method, and we
summarize the properties of the opinion leader community
in revolution.
Keywords Public sentiment � Opinion leader �Discovery of the community � Revolution of the
community
1 Introduction
With the rapid cross-discipline between modern computing
technology and social sciences, social computing has
become more and more important. Social computing is an
area of research at the crossroads of social sciences and
computer science, facing the social activities, structures,
and functions. On one side, it focuses on the computer
applications and information technology in the society. On
the other hand, it is based on social science knowledge,
theory and approaches. It uses the computing and infor-
mation technology to research and enhance the efficiency
of human social activities.
A bulletin board system (BBS) has been a popular
communication platform where people reflect the phe-
nomenon and status of current society by showing trends in
the development of the society. People called opinion
leaders, who have the ability of leadership, are in a central
role of the community. The opinion leaders are activists that
often provide information, opinions, comments, and influ-
ence to others in interpersonal communication networks;
they serve as the intermediaries for the formation of the
mass effect or filter links. By analyzing their comments, we
can understand the general trends of each post in advance.
Therefore, it is important for us to identify the community’s
opinion leaders according to public sentiment.
Besides, it is helpful for people to understand the
dynamic law of the whole network by finding the evolution
of the opinion leader community in the public sentiment.
Therefore, we can achieve optimal network structure,
resources, search, and resources, with the basis for such
recommendation. However, existing community discovery
methods often just extract the parallel relationship between
community structures. These communities are either
independent of each other or overlap. They do not consider
the level relations that may exist between the communities.
What is more, it is not reasonable to partition the types of
the evolution of the communities. Since community change
is often complex, it is difficult to describe a community in
an accurate way only with increasing, reducing, combining
and so on [1, 2].
W. Zhang (&) � H. He � B. Cao
School of Computer Science and Technology, Harbin Institute of
Technology, Harbin 150001, China
e-mail: [email protected]
123
Neural Comput & Applic
DOI 10.1007/s00521-013-1529-1

This paper is organized as follows. In Sect. 2, the related
works are introduced. In Sect. 3, the method of mining the
opinion leader community and how to evaluate the evolu-
tion of the community are presented. The experimental
results and the analysis in this paper are also presented in
Sect. 4. Finally, our work of this paper is summarized in
the last section.
2 Related works
Kemighan and Lin [3] used Java Forum Q&A network as
the objects of researches, HITS and other algorithms was
used to evaluate the authority of the users. Matsumura et al.
[4] studied emotional tendencies opinions network and
identified the opinion leaders based on the sentiment analysis
of operator Law. Zhang et al. [5] studied the BBS network
leaders to identify problems. Based on the right to forward
network assumptions, they proposed an interest-based page
rank algorithm, and measured Tsinghua Forum data.
Among all the methods of the mining community, the
Kernighan–Lin method [6] is a greedy algorithm that divides
the net into two known pieces. It requires knowing the size of
the community in advance. The complexity of the algorithm is
based on the Laplace matrix eigenvalue [7], while the tradi-
tional method is based on a spectral split resistor network
voltage spectrum. The complexity of the Huberman algorithm
is low, but it requires the knowledge of the number of com-
munity networks. However, in the actual network, the number
of communities is unknown. Some of the parameters in the
methods are not very clear, so they are not convenient to use.
The GN (abbreviation for Girvan and Newman who
proposed the algorithm) algorithm [8] is representative of a
splitting algorithm. The idea is to constantly derive the
largest referral number from the network side. The GN
algorithm has two main shortcomings, namely the lack of
definition in the amount of community structures and the
second is the need for double counting. Newman et al. [9]
proposed a fast algorithm based on greedy algorithm ideo-
logical cohesion, which applies to large-scale complex net-
works. The defect in Newman’s algorithm is that when using
either a split or clustering algorithm, the network can be
divided into separate communities. However, the networks
of a community are often interrelated and overlapping. And
the methods are not community-based.
The existing deterministic methods are used for large
networks find separated communities. But most of the actual
networks are made of highly overlapping cohesive groups of
nodes. Palla et al. [10] introduced an approach to analyze the
main statistical features of the interwoven sets of overlap-
ping communities making a step toward the uncovering of
the modular structure of complex systems. After defining a
set of new characteristic quantities for the statistics of
communities, they apply an efficient technique to explore
overlapping communities on a large scale and find that
overlaps are significant, and the distributions we introduce
reveal universal features of networks.
In order to extract a reasonable structure from the com-
munity, the community discovery method introduces time
properties. Toyoda studied the evolution of the Web com-
munity [11]. A Web community is constituted by a number
of Web pages. The Web pages are connected by hyperlinks
which connect to the mass. These pages are usually on the
same subject; the changes of the community directly
respond to changes in the Web topic. Using the respective
Web pages from 1999, 2000, 2001, and 2002, we built the
network and extracted the communities from the archives,
creating community maps, analyzing the evolution of Web
communities, and the emergence of the phenomenon. In
analyzing the evolution of the community, the introduction
of a series of metrics, such as growth, stability, novelty,
disappearance rate, fusion rate, and cleavage rate, is used to
describe the complex changes in the community [12].
Therefore, we have adopted a community-based level
discovery method and introduced a number of algorithms
to find opinion leaders in the extraction of the community,
analyzing the evolution of the network community
according to the different nature of the forum posts using
different length of time division and proposed measure-
ment mechanisms.
3 Parallel proving algorithm based on semi-extension
rule
In this section, we use a level-based community extraction
method when extracting an opinion leader of a community.
Moreover, we come up with some approaches based on the
longest common sequences (LCS) and depth-first-search
(DFS) algorithm in mining the opinion leaders.
Community definition is based on the observation that a
typical node (person) in a community is linked to many
other nodes (persons), but not necessarily to all other nodes
in the community. In other words, a community can be
interpreted as a union of smaller complete (fully con-
nected) sub-graphs that share nodes. We believe that a
community can be seen as a collection of connected groups
in some sense where a group is defined as a fully connected
network diagram. Groups consisting of k nodes are called
the k-cliques. And the value of k is greater than or equals to
2. Here, we do not consider 2-clique which only contains 2
members. Each node presents an individual in a clique or
post. We get the relationship between the individuals from
the graph which consists of the nodes above. If there are
k - 1 common nodes between two groups, we called them
adjacent. If a k-clique can reach another k-clique through a
Neural Comput & Applic
123
number of adjacent k-cliques, then we called the two k-
cliques as connected. K-clique communities in the network
can be seen as a collection consisting of mutually con-
nected k-cliques. We can define a k-clique chain as the
union of adjacent k-cliques and introduce the k-clique
connectivity: two k-cliques are connected if they are a part
of k-clique chain.
Clustering all of the k-cliques is a necessary condition to
find a k-clique community. At first, we should estimate the
maximum k from the network according to the degree of
each node; then, find the k-clique which contains the cer-
tain node; delete the edge related with or neighbored with
the node in last step, and repeat the second step until
finding all of the k-cliques. At last, let k be k - 1 to repeat
the same thing above to find the whole community [13].
The method to cluster the k-clique community is as
follows: We define a certain node v, two sets A and B. Set
A contains all of the nodes related to the node v. Set
B consists of all the neighbor nodes of set A. For a certain
S, the largest possible clique size is determined by the max
degree in the community.
(1) Initialize set A and set B;
(2) Move a node of B to set A, and delete the nodes that
are not connected with the nodes in set A;
(3) If |A| \ S and |B| = 0, or set A and B are the subset of
clique whose size is smaller than S, stop computing
and return to the second step;
(4) If |A| = S, record the clique, and return to the second
step.
First, the algorithm mines all the values of k to get to the
largest complete sub-graph. The largest complete sub-graph
is called as a clique. The distinction between k-clique and
the clique is that k-clique can be a subset of a larger com-
plete sub-graph. Once the clique has been identified, we can
get the clique overlap matrix. Each row or column of the
matrix corresponds to a group. Each element in the matrix
presents the number of public nodes between the corre-
sponding cliques. We think the k-clique community equals
the connected component of the k-clique. We can find a k-
clique community using the overlap matrix of the clique.
The element in the matrix which has a value less than k - 1
is set to 0 and the remaining elements are set to 1, resulting
in the k-clique connection matrix. Each connected part
constitutes a k-clique community. In this way, we can get a
k-clique community from node v with certain size. The time
complexity of the above method is O(CNDlnN) in where
C and D are fitting parameters.
One of the advantages of this method is: the group–
group overlap matrix contains all the necessary information
for an arbitrary value of k communities. Therefore, once
the overlap matrix is constructed, any k-group community
can be very fast. Without using this method, a simple
k-clique searching method to find each of different k-clique
has to search by starting over.
In addition, when we find opinion leaders in the com-
munity we have found above, we should analyze the nodes
in the cliques.
There are two types of nodes in the community, which
are in no clique or at least in one clique. We should analyze
them in both.
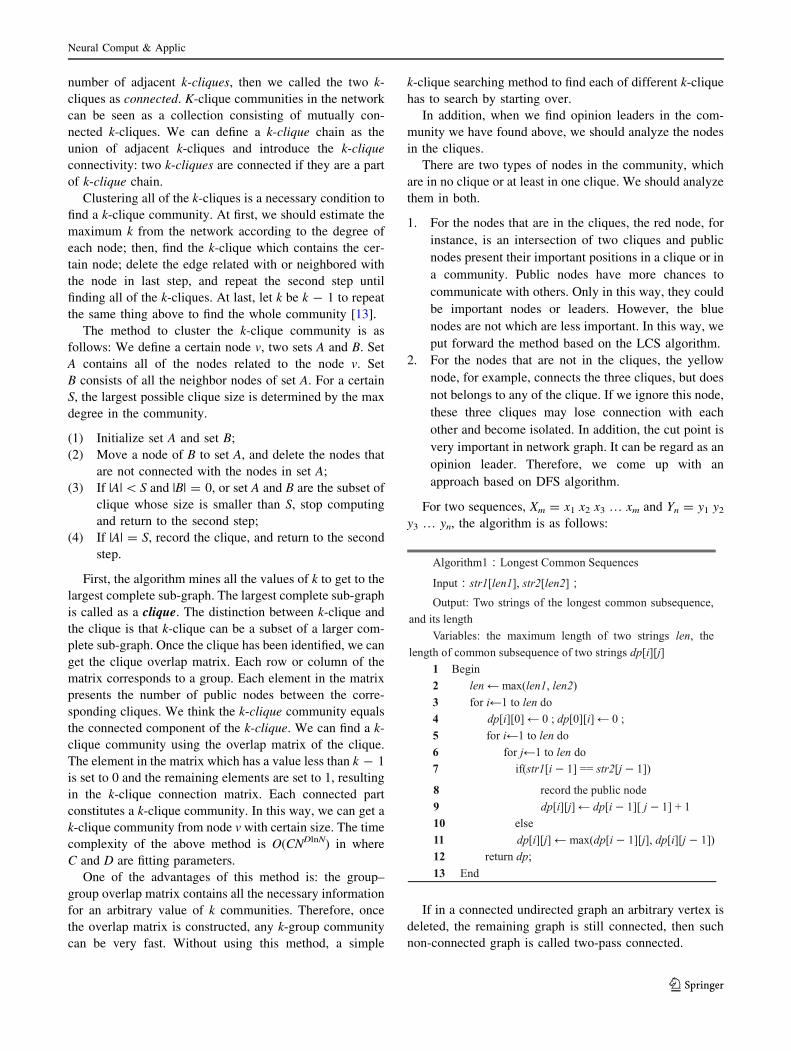
1. For the nodes that are in the cliques, the red node, for
instance, is an intersection of two cliques and public
nodes present their important positions in a clique or in
a community. Public nodes have more chances to
communicate with others. Only in this way, they could
be important nodes or leaders. However, the blue
nodes are not which are less important. In this way, we
put forward the method based on the LCS algorithm.
2. For the nodes that are not in the cliques, the yellow
node, for example, connects the three cliques, but does
not belongs to any of the clique. If we ignore this node,
these three cliques may lose connection with each
other and become isolated. In addition, the cut point is
very important in network graph. It can be regard as an
opinion leader. Therefore, we come up with an
approach based on DFS algorithm.
For two sequences, Xm = x1 x2 x3 … xm and Yn = y1 y2
y3 … yn, the algorithm is as follows:
If in a connected undirected graph an arbitrary vertex is
deleted, the remaining graph is still connected, then such
non-connected graph is called two-pass connected.
Neural Comput & Applic
123

If a node in a bi-connected graph is compared to a
computer, then, if a computer is faulty and cannot run, the
network e-mail will not be affected, but if the network
graph is not connected, then removing a certain point will
cause the failure of the entire network, which means it
cannot function properly. We find that cut points and
bridges have obvious military significance and economic
significance. Therefore, we need to find the community
network cut point or bridge.
Finding a common cut-point algorithm is based on the
DFS algorithm; record the depth (dep) of each node in the
DFS algorithm and the shallowest depth its descendants
can achieve. For each of node m: (1) If node m is the root
node and has two or more sons, then m is a cut point; (2) If
m is not a root and there is a son v, and low[v] ] dep[m],
then m is the cut point in which low[v] presents the shal-
lowest depth node v can arrive, and dep[m] presents the
visit order of node m in DFS algorithm.
We can know the importance and the position of each
node by finding the cut point in the community. And we
can find the importance in the connection of the node in the
certain community.
When we analyze the revolution of the community
which we have found above, we introduce time properties.
A reasonably selected time period has a great impact on
the evaluation of the community revolution; one needs to
consider the reality of the characteristics of the system
itself on how to determine the length of the time period. If
the divided time period is too long, it is difficult to find
the emergence of the network phenomenon. If the divided
time period is too short, the number of unstable network
nodes and edges may be greatly increased; the results of
the community revolution are more susceptible to noise
interference, and it will increase computational cost [14,
15].
Then, we put forward some parameters to measure the
community revolution. We define ci and cj that represent
the number of the nodes (persons) in the community i and
j.
Definition 1. Stability Stability is the ratio of the static
members in the revolution of the community. The higher
the stability is, the more of the stable members in the
community. If the stability is one, then the whole com-
munity keeps unchanged.
Rstabilityðci; cjÞ ¼jci \ cjjjcij
ð1Þ
Definition 2. Disappearance Disappearance is the
number of the members that disappeared which is in
proportion to the members that have disappeared and
inversely proportional to the size of the community itself.
Rdisappearðci; cjÞ ¼jci � cjjjcij
ð2Þ
Definition 3. Growth Growth is the ratio of the members
that increased in the community revolution which is in
proportion to the members that are new born and inversely
proportional to the size of the community itself.
Rgrowðci; cjÞ ¼jcj � cijjcij
ð3Þ
Definition 4. Alteration Alteration reflects the extension
of the changes of the members in the community
revolution.
Ralterationðci; cjÞ ¼jcj � cijjcjj
ð4Þ
Definition 5. Correlation Correlation shows the
relationship between two communities. It is defined as
follows:
CRðci; cjÞ ¼jci � cjjjci � cjj
ð5Þ
If ci and cj are the same structure of one community in
an adjacent time status, then the relevance between them is
called self-correlation. It is obvious that the range of the
correlation is [0, 1]. If CR(ci,cj) = 1, the members in the
community keep unchanged, if CR(ci,cj) = 0, the members
in the community are totally different.
Neural Comput & Applic
123

4 Experiments
In this section, the data are collected from the TianYa
forum and the start time of the posts is from December,
2010. We chose posts that contained between 10,000 and
20,000 replies, with long time spans of about 1–2 years.
We use the methods that have been described above to find
opinion leaders and evaluate the community revolution.1
The environment of the experiments is shown as
follows:
• CPU: Intel(R) Core(TM)2 CPU 1.67 GHz
• Cache size: 512 KB
• Memory: 2074492 KB
• Operation System: Windows7, Linux9.04
For instance, if the time span of the post is 2 months,
and the time division is 1 month for only 2 months, then
we cannot get the desired results. If the time is divided into
day segments, then we will require larger amounts of data
analysis. The results are messy and difficult to clearly
reflect the results of the evolution of the community. In
each network diagram extracted, we count the number of
nodes, edges, average degrees of nodes, and other features.
Based on the level extraction method and the LCS
algorithm, we get several public nodes in the posts and
analyze that during the 8 weeks, there are 81 individuals
who are active speakers. The 81 nodes in the community
structure are rather stable. These people are in a more
central location during the 8 weeks.
Later, among the 81 individuals, we find that 40 out of
81 nodes can be a cut point with the DFS-based method.
Thus, we get the connectivity of the certain cut point in the
community graph. Therefore, we can say that these 40
individuals found within the 81 total individuals are more
important.
Through this extraction method and the discovery of the
opinion leaders approach, we can effectively find the
opinion leaders in the post.
Table 1 shows the result of the method proposed in the
previous section with definition (1)–(5). From Table 1, we
notice the node is changing rapidly. Sometimes the
increasing speed is high and sometimes low. The disap-
pearance is at a high speed between 0.6 and 0.9. Therefore,
the change is also high, resulting in the correlation between
0.1 and 0.2.
Table 2 shows the statistics of a single post, including
the new nodes, the disappearance of nodes, and the public
nodes. We can draw from the table an increase of 1,920
new born nodes in the post. However, the disappearance of
2,026 nodes is more than the number of new born nodes.
The number of participants decreases very fast after
4 weeks. This explains that as time goes by, the posts’
popularity gradually decreases and the number of people
who respond reduce.
Table 3 shows the total number of communities, the
number of large communities, the number of small com-
munities, and the number of cliques in the single post.
According to the post kinds, the communities’ size, and the
number of the communities, we define a community as a
large community if the number of nodes in the community
is greater than or equal to 4. Small communities are defined
by having a number of nodes fewer than 4. And we justify
the results for all kinds of posts. From this table we have a
small number, eleven, of large communities, while the
number of small communities is 42. Therefore, the
emergence number of small communities is more than
large communities and small communities change faster
(Fig. 1).
To get the number of nodes in the post over time, Fig. 2
shows the number of nodes in the distribution of the single
post in each week. A trend can be seen from the figure that
the number of nodes is decreasing overall. But in the third
week there is a small increase. We get the number distri-
bution of the responses between people (see Fig. 3) in a
single post. In the third week it reaches the maximum
Table 1 The changes of the parameters in measuring the
communities
Time Stability Disappearance Growth Alteration Correlation
Week 1 – – – – –
Week 2 0.24 0.76 0.90 1.66 0.13
Week 3 0.37 0.63 0.97 1.70 0.19
Week 4 0.28 0.72 0.49 1.21 0.22
Week 5 0.01 0.99 0.01 1.00 0.01
Week 6 0.14 0.86 0.71 1.57 0.08
Week 7 0.08 0.92 0.17 1.19 0.07
Week 8 0.33 0.67 1.13 1.80 0.14
Table 2 The initial information of the communities and the changes
of the nodes
Time Increased
number
Disappeared
number
Public nodes
number
Week 1 – – –
Week 2 708 592 188
Week 3 867 562 334
Week 4 322 869 332
Week 5 7 587 7
Week 6 10 12 2
Week 7 2 2 1
Week 8 4 2 1
1 http://www.tianya.cn/publicforum/content/funinfo/1/2193160.shtml.
Neural Comput & Applic
123
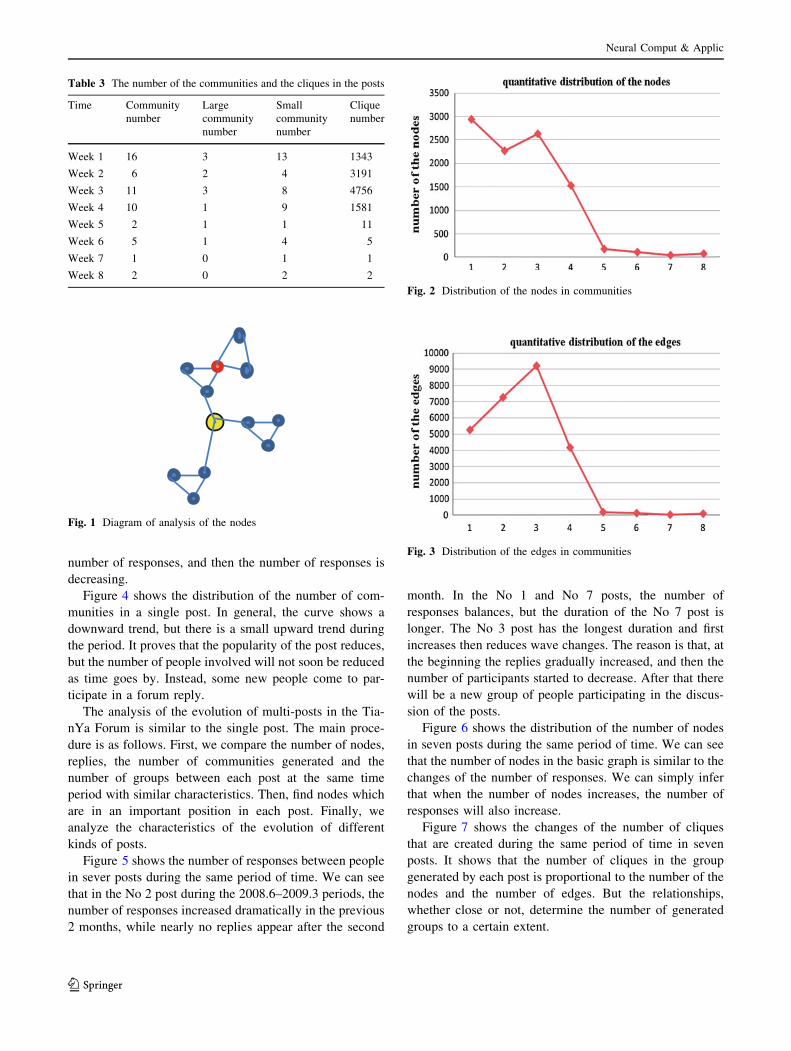
number of responses, and then the number of responses is
decreasing.
Figure 4 shows the distribution of the number of com-
munities in a single post. In general, the curve shows a
downward trend, but there is a small upward trend during
the period. It proves that the popularity of the post reduces,
but the number of people involved will not soon be reduced
as time goes by. Instead, some new people come to par-
ticipate in a forum reply.
The analysis of the evolution of multi-posts in the Tia-
nYa Forum is similar to the single post. The main proce-
dure is as follows. First, we compare the number of nodes,
replies, the number of communities generated and the
number of groups between each post at the same time
period with similar characteristics. Then, find nodes which
are in an important position in each post. Finally, we
analyze the characteristics of the evolution of different
kinds of posts.
Figure 5 shows the number of responses between people
in sever posts during the same period of time. We can see
that in the No 2 post during the 2008.6–2009.3 periods, the
number of responses increased dramatically in the previous
2 months, while nearly no replies appear after the second
month. In the No 1 and No 7 posts, the number of
responses balances, but the duration of the No 7 post is
longer. The No 3 post has the longest duration and first
increases then reduces wave changes. The reason is that, at
the beginning the replies gradually increased, and then the
number of participants started to decrease. After that there
will be a new group of people participating in the discus-
sion of the posts.
Figure 6 shows the distribution of the number of nodes
in seven posts during the same period of time. We can see
that the number of nodes in the basic graph is similar to the
changes of the number of responses. We can simply infer
that when the number of nodes increases, the number of
responses will also increase.
Figure 7 shows the changes of the number of cliques
that are created during the same period of time in seven
posts. It shows that the number of cliques in the group
generated by each post is proportional to the number of the
nodes and the number of edges. But the relationships,
whether close or not, determine the number of generated
groups to a certain extent.
Table 3 The number of the communities and the cliques in the posts
Time Community
number
Large
community
number
Small
community
number
Clique
number
Week 1 16 3 13 1343
Week 2 6 2 4 3191
Week 3 11 3 8 4756
Week 4 10 1 9 1581
Week 5 2 1 1 11
Week 6 5 1 4 5
Week 7 1 0 1 1
Week 8 2 0 2 2
Fig. 1 Diagram of analysis of the nodes
Fig. 2 Distribution of the nodes in communities
Fig. 3 Distribution of the edges in communities
Neural Comput & Applic
123

Through the analysis of multi-posts, the evolution of
different posts is different. Boring and unattractive posts,
such as news, can get only few responses during the early
time and a small number of communities are generated.
The number of important roles is also rather small. For
those attractive posts which can cause attention, such as
emotional life, entertainment, politics, can last for a long
time. The number of communities is large.
Finally, we took more than 1 year (from December 2010
to May 2012) to add a strong evaluation–human validation,
whose main idea is to compare the leaders found by our k-
clique clustering with the ones given by communities
through polls. We initiated a vote, which is ‘‘Who are the
leaders of public opinion in the TianYa forum; please elect
the top ten of them’’. In total, 32,279 persons volunteered
to vote. We collected and ranked the top 40 leaders
according to the number of the polls. Table 4 shows that
among 40 leaders found by our k-clique clustering, about
31 ones are also given through polls. The precision rate is
77.5 %.
5 Conclusions
Because the traditional extraction methods are not adaptive
for community social networks, we use the level-based
method to extract the opinion leader community. The data
from the TianYa Forum are analyzed. The nodes with high
betweenness can be cut points, which have more chances to
communicate with others. This paper analyzes the evolu-
tion of the community according to different network
characteristics by dividing it into different timepieces.
Then, we introduce a measuring method and k-clustering
algorithms for mining opinion leaders and evaluating the
community revolution. In the experiment, the level-based
Fig. 4 Distribution of the number in communities
Fig. 5 The number of the edges in each of the post
Fig. 6 The number of the nodes in each of the post
Fig. 7 The number of the cliques in each of the post
Table 4 The human validation results by comparing the leaders
found by our k-clique clustering with those given through polls
Leaders found by k-clique
clustering
Leaders given
through polls
Rate of
success (%)
40 31 77.5
Neural Comput & Applic
123

community extraction method and the opinion leaders
finding algorithm are effective. The association between
communities on the TianYa Forum is around 0.3 in gen-
eral. There are a few large communities, which are stable.
However, there are many small communities, which are not
stable, easy to burst and disappear. Overall, the results are
more in accord with the real scenes.
Acknowledgments This work was supported by the National Basic
Research Program of China under Grant No. G2011CB302605, the
National Natural Science Foundation of China (NSFC) under Grant
No. 61173145, and the National High Technology Research and
Development Program of China under Grant No. 2011AA010705.
References
1. Changai H, Zhu L (2010) The analysis and the evaluation of
complicated network software. Digit Libr Forum 5:33–39
2. Wang Y, Xia H, Yan R (2008) The analysis of the social network
and the study of the application cases of NetDraw. Mod Edu
Technol 18(4):85–89
3. Kemighan BW, Lin S (1970) An efficient heuristic procedure for
partitioning graphs. Bell Syst Tech 49(2):212–230
4. Matsumura N, Ohsawa Y, Ishizuka M (2002) Influence diffusion
model in text-based communication. Trans Jpn Soc Artif Intell
17:259–267
5. Zhang J, Ackerman MS, Adamic L (2007) Expertise networks in
online communities: structure and algorithms. In: Proceedings of
the 16th international conference on World Wide Web. ACM
6. Zhou H, Daniel Z, Changli Z (2009) Finding leaders from opinion
networks. In: IEEE international conference on intelligence and
security informatics, 2009. ISI’09. IEEE
7. Pothen A, Simon HD, Liou K-P (1990) Partitioning sparse
matrices with eigenvectors of graphs. SIAM J Matrix Anal Appl
11(3):430–452
8. Michelle G, Newman MEJ (2002) Community structure in social
and biological networks. Proc Natl Acad Sci USA
99(12):7821–7826
9. Newman MEJ, Michelle G (2004) Finding and evaluating com-
munity structure in networks. Phys Rev E 69(2):026113
10. Palla G et al (2005) Uncovering the overlapping community
structure of complex networks in nature and society. Nature
435(7043):814–818
11. Toyoda M, Kitsuregawa M (2003) Extracting evolution of web
communities from a series of web archives. In: Proceedings of the
fourteenth ACM conference on hypertext and hypermedia. ACM
12. Capocci A et al (2005) Detecting communities in large networks.
Phys A Stat Mech Appl 352(2):669–676
13. Palla G, Derenyi I, Vicsek T (2007) The critical point of k-Clique
percolation in the Erd}os–Renyi graph. J Stat Phys
128(1–2):219–227
14. Palla G, Barabasi A-L, Vicsek T (2007) Community dynamics in
social networks. Fluctuat Noise Lett 7(03):L273–L287
15. Palla G, Barabasi A-L, Vicsek T (2007) Quantifying social group
evolution. Nature 446(7136):664–667
Neural Comput & Applic
123