identifying built barriers - evergreen.ca · typology of an “active core” as defined and...
TRANSCRIPT

SAMANTHA BIGLIERI, UNIVERSITY OF WATERLOO & MAXWELL HARTT, CARDIFF UNIVERSITY
IDENTIFYING BUILT BARRIERS WHERE DO OUR MOST VULNERABLE OLDER ADULTS LIVE IN ONTARIO’S MID-SIZED CITIES?
Samantha Biglieri, School of Planning, University of Waterloo and Maxwell Hartt, School of Geography and Planning, Cardiff University

2
IDENTIFYING BUILT BARRIERS
I N T R O D U C T I O N
Rapid population aging and mass migration to cities are the greatest demographic shifts of our time. In Canada, older adults outnumbered children for the first time in 2015 (Statistics Canada, 2015), and pop-ulation projections indicate that all municipalities over 10,000 people in Ontario will see an increase in their older adult populations (Hartt & Biglieri, 2017). Overwhelmingly, older adults in this coun-try have expressed a desire to age-in-place, but this begs the question: how well do the places we live support the health and wellbeing of older adults? To begin to answer this question, this research seeks to understand the “double risk” that many older adults live with: the potential of being disad-vantaged by social determinants of health and being further disadvantaged by living in a non-support-ive neighbourhood. This paper seeks to under-stand where older adults in mid-sized cities (MSCs) with more vulnerability risk factors (poverty, living alone, aged 85+, etc.) are living, and if those neigh-bourhoods can be classified as unsupportive or supportive built environments. Research on the impact of the built environment for older adults tends to focus on major cities like Toronto and Montreal, rather than MSCs. MSCs tend to be treated as single entities, as opposed to having diverse neighbourhood types, which impact health and wellbeing in diverse ways. We know that MSCs are not homogenous, and neither should be their policy responses—which is why this research examines vulnerability risk factors through a neighbourhood-by-neighbourhood lens. Overall, we found that an extremely large proportion
of vulnerable older adults are living in unsupportive built environments in MSCs. This means a substan-tial portion of our potentially most vulnerable older adults are also being limited by, and facing significant barriers in, their physical surroundings. This “double risk” must be identified, measured, and taking into consideration to ensure the health and wellbeing of older Canadians.
A G I N G A N D T H E B U I LT E N V I R O N M E N T
The importance of the built environment and place in the health and wellbeing of older adults has been recognized through the decade-old World Health Organization policy on Age-Friendly Cities (AFCs). AFC policies have been endorsed by federal and pro-vincial levels of government in Canada to encourage municipalities to plan for their aging populations by conducting extensive public consultation and assessing eight domains of age-friendliness (the eight domains are: outdoor spaces and public build-ings; transportation; housing; social participation; respect and social inclusion; civic participation and employment; communication and information; and community supports and health services) (Ontario Seniors Secretariat, 2013). See figure one. However, criticism of the policy remains, primarily because it tends to be applied in a uniform way that lacks important context-specific detail (Buffel, Philipson, & Scharf, 2012; Scheidt & Windley, 2006). Research
Research on population projections and AFC policy uptake in Ontario shows that cities with the greatest projected demographic share of older adults are the least likely to have started age-friendly planning

3
SAMANTHA BIGLIERI, UNIVERSITY OF WATERLOO & MAXWELL HARTT, CARDIFF UNIVERSITY
on population projections and AFC policy uptake in Ontario shows that cities with the greatest projected demographic share of older adults are the least likely to have started age-friendly planning (Hartt & Biglieri, 2017). Fortunately, 89% of MSCs have started AFC planning, however the quality and status of those plans are unknown (Hartt & Biglieri, 2017).
Figure 1: The eight domains of age-friendliness
Older adults are more likely than other age groups to spend more time in their immediate neighbour-hoods (Glass & Balfour, 2008; Kerr, Rosenberg & Frank, 2012). Research on activity/ life spaces indi-cates that as we age, so too do our life spaces—they effectively shrink, making it important to understand the impact of one’s immediate built environment on the wellbeing of the individual (Rosso, Auchincloss & Michael, 2011). The Chief Public Health Officer of Canada (2017) recently released a report highlight-ing the need to focus more research on the built environment’s impacts on health—specifically, the importance of encouraging physical activity, pro-moting healthy food options, and supporting mental wellness, especially for vulnerable populations like older adults. While there is still much to be learned on how the places we live impact our health, research shows that walkable, mixed-use neighbourhoods with good public transport and easy access to ser-vices/family/friends tend to produce higher levels of physical activity in older adults (Kerr, Rosenberg & Frank, 2012) as well as higher levels of social inter-action and social capital (Leyden, 2003; Chief Pub-lic Health Officer of Canada, 2017). In addition, the Improving Health By Design Report done by the Chief Medical Officers of Health in the Greater Toronto and Hamilton Area called on public health policymakers and planners to encourage the creation of walkable mixed-use neighbourhoods as a way to combat chronic disease and encourage active transporta-tion (2014). The concept of a supportive, walkable, and widely accessible neighbourhoods is particularly salient when considering the transportation options for older adults who have lost their driver’s licenses and live in places with poor public transit and faraway amenities. With this concept in mind, the following research defines a supportive built environment as a neighbourhood with an assessed neighbourhood typology of an “active core” as defined and identified by Gordon & Janzen’s (2013) classification system.
OUTDOOR SPACES & PUBLIC BUILDINGS
TRANSPORTATION
HOUSING
SOCIAL PARTICIPATION
RESPECT & SOCIAL INCLUSION
CIVIC PARTICIPATION & EMPLOYMENT
COMMUNICATION & INFORMATION
COMMUNITY SUPPORTS & HEALTH SERVICES
1
2
3
4
5
6
7
8

4
IDENTIFYING BUILT BARRIERS
C AT E G O R I Z I N G S U P P O R T I V E V S . U N S U P P O R T I V E B U I LT E N V I R O N M E N T S I N C A N A D A
Classifying neighbourhood types allows practitioners and researchers to (1) better understand macro-level impacts of planning policies and make recommendations about future policy updates, and upgrades in infra-structure investments (e.g. community centres, public transit improvements, sidewalk upgrades, etc.). And (2) understand the interactions between the social determinants of health and the built environment to develop more responsive policies for all municipal departments. For example, this exercise could identify if there are particular types of services/policies that might be needed for certain neighbourhoods based on the interaction between area demographics and built environment type and be combined with other data sources (like exten-sive public consultation) in order to make better municipal policies.
The question becomes – how do we classify built environments in Canada? After dozens of empirical experiments, Gordon & Janzen (2013) found that the most effective and precise way to define the Canadian urban and suburban landscape was through transportation behaviour models. Their extensive study, which took over five years and examined every neighbourhood in all 33 census metropolitan areas (CMAs), resulted in a four-part typology. Generally1, the four types can be defined as:
Table 1: The four types of neighbourhoods
EXURBS AUTO SUBURBS
TRANSIT SUBURBS
ACTIVE CORES
very low-density rural areas
neighbourhoods where almost all travel is done by automobile; there is negligible transit, walking or cycling
neighbourhoods where a higher proportion of people travel by transit
neighbourhoods where a higher proportion of people use active transportation (walk or cycle)
unsupportive unsupportive unsupportive supportive
1 See Gordon & Shirokoff (2014, p. 10) for technical definitions.

5
SAMANTHA BIGLIERI, UNIVERSITY OF WATERLOO & MAXWELL HARTT, CARDIFF UNIVERSITY
In this paper, we use Gordon et al.’s (2013, 2014) neighbourhood analysis of Ontario MSCs as oper-ational variables of levels of built environment sup-port. We consider active core neighbourhoods to be supportive built environments, while transit suburbs, auto suburbs, and exurbs are considered unsupport-ive built environments: trips are more likely to be accomplished on foot within active cores, whereas the other typologies are automobile dependant. As demonstrated previously, research on older adults have indicated that walkable neighbourhoods (which are identified as ‘active cores’ by Gordon & Janzen, 2013) are more likely than suburban neighbourhoods to be supportive by encouraging active transpor-tation, social interaction, and facilitating mobility. In addition, this model allows us to identify support-ive neighbourhoods that are not necessarily in the centre of the city—often as a result of policies like Transit-Oriented Development (Gordon & Janzen, 2013, p. 214).
C A P T U R I N G T H E V U L N E R A B I L I T Y O F
O L D E R A D U LT S
The overaching goal of our research is to better understand the “double risk” of aging for many older Canadians. So far, we have discussed the importance of the built environment for aging individuals, but what about the vulnerability of the individuals themselves? Before outlining how we measured vulnerability, it is important to unpack the term itself. “The concept of vulnerability differs from other social science concepts that describe ‘nega-tive states’, such as poverty, neglect and exclusion, in its potentiality and therefore the avoidability of its undesirable outcomes,” (Schröder-Butterfil & Marian-ti, 2006, p. 14).
We use this term because it underscores that while this research identifies where the most vulnerable may live, there is a strong opportunity to change their out-comes through interventions in the built environment and through policy in programs/services (for exam-ple, through the AFC framework). Our operational defi-nition of vulnerability for this work is based on three demographic factors:
1. being over 85 (which is associated with greater risk for issues with mobility/illness and is a good indication of activity space size [Hodge, 2008])
2. living in poverty (which is a risk factor for mortality)
3. living alone (which has been associated with social isolation and therefore decreased physical and mental health [Cornwell & Waite, 2009]).
Social scientists have cautioned that the study-ing of vulnerability is quite complex, and should be understood as a confluence of a whole history of life experiences and coping mechanisms requiring detailed qualitative review (Schröder-Butterfil & Marianti, 2006, p.14). However, from a public policy perspective, Klinenberg’s (2002) social autopsy of the heat wave disaster in Chicago in 1995 (in which an estimated 739 people died from heat-related causes, the majority of whom were elderly, poor residents) tells us that studying proxy measures of vulnera-bility are vital to avoid risking the undercounting of vulnerable older adults. Klinenberg (2002) notes that the surveying of vulnerable older adults is a nearly impossible task, as those who come out to public meetings and participate in research are likely to be older adults who are considered quite active in the community. The concept of staying in one’s own home has been glorified in society, and many older adults fear losing their independence. As a result,

6
IDENTIFYING BUILT BARRIERS
those struggling with issues living at home may be less likely to ask for help or become politically involved. This research is not arguing that an 86-year-old individual living alone and below the poverty line is not capable of staying in her house. Rather, that we as policy makers need to be aware of where people live so that services can be targeted and retrofits to unsupportive neighbourhoods can be prioritized.
M E T H O D O LO G Y
Our study examined every neighbourhood in 14 of Ontario’s Mid-Sized Cities (as defined by their CMA): Ottawa, Hamilton, London, Kitchener-Cambridge- Waterloo, St. Catharines-Niagara, Oshawa, Windsor, Barrie, Greater Sudbury, Kingston, Guelph, Brantford, Thunder Bay, and Peterborough. Following Gordon & Janzen (2013), all data was collected at the cen-sus tract level from Statistics Canada as a proxy for
neighbourhoods. In total, we examined 2,267 census tracts (1,116 from MSCs and 1,151 from Toronto). Data for the built environment type (supportive or unsupportive) was compiled from Gordon & Shirokoff (2014). All other variables were collected from the 2016 Census.
Overall, we found that an extremely large proportion of vulnerable older adults are living in unsupportive built environments in MSCs. Table 1 shows the absolute number of vulnerable residents living in all 14 MSCs examined. In total, we found that there were over 160,000 adults 65 years of age or older living alone (81%) and over 60,000 (77%) living in low income were living in unsupportive built environments. For older adults 85 years of age and above, a more likely to be vulnerable group, the results were similar. Over 30,000 (84%) were living alone in unsupportive built envi-ronments and over 8,000 (75%) were living with low incomes in unsupportive built environments.

7
SAMANTHA BIGLIERI, UNIVERSITY OF WATERLOO & MAXWELL HARTT, CARDIFF UNIVERSITY
Table 2: Number of vulnerable MSC and Toronto older adults in unsupportive built environments
# OF ONTARIO MSC RESIDENTS # OF TORONTO RESIDENTS
SUPPORTIVE BUILT ENVIRONMENT
UNSUPPORTIVE BUILT ENVIRONMENT
SUPPORTIVE BUILT ENVIRONMENT
UNSUPPORTIVE BUILT ENVIRONMENT
65+ Living Alone
36,715 161,380 27,640 142,130
65+ Low Income
18,035 60,885 15,205 96,945
85+ Living Alone
5,870 30,105 4,035 26,930
85+ Low Income
2,744 8,372 2,043 13,305
Table 2 also shows the results for Toronto’s neigh-bourhoods for comparison. In Toronto, a city with considerably more active core neighbourhoods, the proportion of vulnerable older adults in unsupport-ive built environments was actually slightly high-er. Unsupportive built environments were found to be home to over 140,000 (84%) adults 65+ living alone, almost 100,000 (86%) adults 65+ living in low income, over 25,000 (87%) adults 85+ living alone, and almost 15,000 (87%) adults 85+ living in low income. Although we cannot say for certain how many older individuals are both living alone and in low income in supportive built environments due to the structure of the census data, the extremely high proportions do suggest that many do fall into this “double risk” cate-gory. Furthermore, the comparison to Toronto shows that the potential risks of vulnerable older adults living in unsupportive environments is not strictly a large or mid-sized city phenomenon, it is a considerable issue across the Canadian urban landscape.
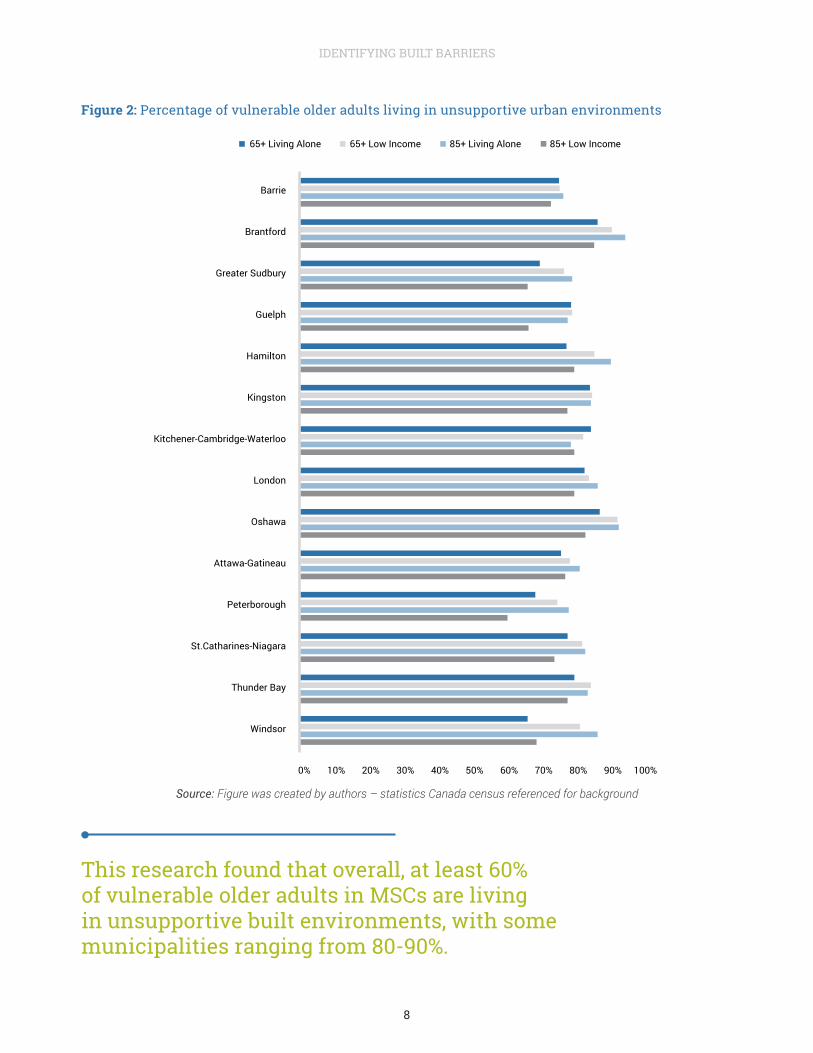
Figure 2 (see next page) shows the percentage of vulnerable older adults living in unsupportive built environments in each of the fourteen MSCs exam-ined in the study. Every single MSC had above 60% of their vulnerable older adults in every category living in unsupportive built environments. In most cities, the proportions of vulnerable adults in unsupportive built environments was close to 80%. Brantford was found to, generally, have the highest proportions, with 84% of low-income adults 85+ (highest), 93% of 85+ adults living alone (highest), 89% of 65+ low-income adults (second highest after Oshawa with 91%), and 85% of 65+ adults living alone (second highest after Osha-wa with 86%) in unsupportive built environments. At the other end of the spectrum, Peterborough gener-ally had the lowest percentages of vulnerable older adults living in unsupportive built environments.
8
IDENTIFYING BUILT BARRIERS
Figure 2: Percentage of vulnerable older adults living in unsupportive urban environments
Source: Figure was created by authors – statistics Canada census referenced for background
Barrie
Brantford
Greater Sudbury
Guelph
Hamilton
Kingston
Kitchener-Cambridge-Waterloo
London
Oshawa
Attawa-Gatineau
Peterborough
St.Catharines-Niagara
Thunder Bay
Windsor
65+ Living Alone 65+ Low Income 85+ Living Alone 85+ Low Income
0% 10% 20% 30% 40% 50% 60% 70% 80% 90% 100%
This research found that overall, at least 60% of vulnerable older adults in MSCs are living in unsupportive built environments, with some municipalities ranging from 80-90%.

9
SAMANTHA BIGLIERI, UNIVERSITY OF WATERLOO & MAXWELL HARTT, CARDIFF UNIVERSITY
D I S C U S S I O N
The built environment domains of the AFC model (transportation, outdoor spaces and buildings, hous-ing) are often cited as the easiest to evaluate, with domains like social inclusion being more complex. However, the built environment domains are often the hardest to change, as they require significant investment, and change tends to happen over lon-ger periods of time. That being said, the difference between living in a supportive versus unsupportive built environment can be mitigated by the targeted delivery of services (Warner, Homsy & Morken, 2017) or through small improvements to the built environment (like improved public transit, more benches, safer traffic crossings, etc.), and the findings from this re-search could be used in decision-making for munic-ipalities and to help decide where to direct services for older adults.
Finally, just because someone lives in an active core, does not mean that he or she is not socially isolat-ed. Being able to know who is vulnerable is a difficult task, even with dedicated researchers. Using census counts as proxy numbers can be a valuable (albeit conservative) data source for monitoring and plan-ning for vulnerable, older populations. Our study iden-tified vulnerable older adults living in unsupportive built environments, individuals facing a “double risk”, and provides important insight to help guide policy interventions.
S T U DY L I M I TAT I O N S
In terms of study limitations, this research does not take into account self-selection of home location nor whether or not an individual has moved to be in that location. The research also is limited in understand-ing what type of housing an individual is living in. For example, someone living in a two-storey home who is unable to climb stairs may find their home inaccessi-ble, while another person lives in an accessible apart-ment in the same neighbourhood. In addition, this study is not a longitudinal or cross-sectional study on the effect of the built environment on an individ-ual’s aging trajectory. Research on the long terms impacts of exposure to certain built environments still needs to be completed. Finally, this research was a bird’s eye view of the types of neighbourhoods the potentially most vulnerable older adults live in MSCs, and subsequent policy work should try to understand qualitative experiences of aging in un/supportive built environments in the respective municipalities.
R E C O M M E N D AT I O N S
“Canada is a suburban nation” (Gordon & Janzen, 2013, p.197), As such, perhaps the findings from this research on Ontario’s MSCs are not surprising. How-ever, we want to highlight how the design of these automobile-dependant neighbourhoods can make older adults more vulnerable; and when combined with other social determinants of health risk factors,
We want to highlight how the design of these automobile-dependent neighbourhoods can
make older adults more vulnerable; and when combined with other social determinants of
health risk factors, the majority of older adults in MSCs are left facing a “double risk”.

10
IDENTIFYING BUILT BARRIERS
the majority of older adults in MSCs are left facing a “double risk.” Consider the life-altering impact of losing your driver’s license while living in an auto-mobile-dependant neighbourhood--your life space shrinks, and likely so too does your independence. But, if you lived in a walkable neighbourhood, perhaps losing your license would have less of an impact because you are able to walk or transit to your desired destinations. However, there is a reason we used the term vulnerability in this paper: because of “its potentiality and therefore the avoidability of its undesirable outcomes” (Schröder-Butterfil & Marian-ti, 2006, p.14). In identifying these populations and areas as potentially more vulnerable than others, we have also opened the door for targeted policy inter-vention and, therefore, the reduction of vulnerability.
Considering the heterogeneity of neighbourhoods in MSCs, targeted policy intervention is crucial. How can we build Age-Friendly Cities if we do not know where our most vulnerable residents live? This research found that overall, at least 60% of vulnerable older adults in MSCs are living in unsupportive built
environments, with some municipalities ranging from 80-90%. This means a substantial portion of our po-tentially most vulnerable older adults are also living in an unsupportive built environment—a “double risk” in terms of health and wellbeing. These findings can offer policymakers some insights in understanding where those who may not attend public consulta-tion meetings live in order to target further research and/or consultation as well as municipal services and programming. This research can also help municipalities target unsupportive built environ-ments as neighbourhoods for retrofitting; update planning policies in these areas to encourage the development of neighbourhood commercial nodes, with more medium density homes (like stacked town-houses, walk-ups, mid-rise buildings); and expand public transportation networks. One way to improve the impact of AFC policies is by helping policymakers assess where the most vulnerable older adults live in their municipalities. This research is but part of a necessary toolkit to begin addressing context-specif-ic issues and improving the lives of our most vulner-able older adults.
How can we build Age- Friendly Cities if we do not know where our most vulnerable residents live?

11
SAMANTHA BIGLIERI, UNIVERSITY OF WATERLOO & MAXWELL HARTT, CARDIFF UNIVERSITY
R E F E R E N C E S
Buffel, T., Phillipson, C., & Scharf, T. (2012). Ageing in urban environments: Developing “age-friendly” cities. Critical Social Policy.
Chief Medical Officers of Health in the GTHA. (2014). Improving Health By Design in the Greater Toronto-Hamilton Area Report. Retrieved from: https://www.peelregion.ca/health/resources/healthbydesign/pdf/moh-report.pdf
Chief Public Health Officer of Canada. (2017). The Chief Public Health Officer’s Report on the State of Public Health in Canada, 2017: Designing Healthy Living. Retrieved from: https://www.canada.ca/en/public-health/services/publications/chief-public-health-officer-reports-state-public-health-canada/2017-design-ing-healthy-living.html
Cornwell, E. Y., & Waite, L. J. (2009). Social Disconnectedness, Perceived Isolation, and Health among Older Adults*. Journal of Health and Social Behavior, 50, 31–48.
Forsyth, A. (2012). Defining Suburbs. Journal of Planning Literature, 27(3), 270–281. https://doi.org/10.1177/ 0885412212448101
Glass TA, B. J. (2003). Neighborhood, aging and functional limitations. In I. Kawachi & L. F. Berkman (Eds.), Neighborhoods and Health (1st ed., pp. 303–335). New York: Oxford University Press.
Gordon, D. L. A., & Janzen, M. (2013). Suburban nation? estimating the size of Canada’s suburban population. Journal of Architectural and Planning Research, 30(3), 197–220. Retrieved from http://citeseerx.ist.psu.edu/viewdoc/download?-doi=10.1.1.634.5060&rep=rep1&type=pdf
Gordon, D. L., & Shirokoff, I. (2014). Suburban nation? Population growth in Canadian suburbs, 2006-2011. Proceedings of the 6th Council for Canadian Urbanism (CanU6) summit: Cities at the Edge, Toronto, Ont, 18-20.
M. Hartt & Biglieri, S. (2017). Prepared for the Silver Tsunami? An Examination of Municipal Old-Age Dependency and Age-Friendly Policy in Ontario, Canada. Journal of Urban Affairs. http://dx.doi.org/10.1080/07352166.2017.1360744
Hodge, G. (2008). The Geography of Aging: preparing communities for the surge in seniors. McGill-Queen’s University Press.
Kerr, J., Rosenberg, D., & Frank, L. (2012). The Role of the Built Environment in Healthy Aging. Journal of Planning Literature, 27(1), 43–60. https://doi.org/10.1177/0885412211415283
Klinenberg, E. (2002). Heat wave : a social autopsy of disaster in Chicago (First). Chicago, Illinois: University of Chicago Press.
Leyden, K. M. (2003). Social Capital and the Built Environment: The Importance of Walkable Neighborhoods. American Journal of Public Health Am J Public Health, 9393(9), 1546–1551. Retrieved from http://ajph.aphapublications.org/doi/pdf/10.2105/AJPH.93.9.1546
Ontario Seniors Secretariat. (2013). Finding the Right Fit: Age-Friendly Community Planning. Ottawa.
Richard, L., Gauvin, L., Gosselin, C. L., & Laforest, S. (2008). Staying connected: neighbourhood correlates of social participation among older adults living in an urban environment in Montréal, Québec. Health Promotion International, 24(1), 46–57. https://doi.org/10.1093/heapro/dan039
Rosso, A. L., Auchincloss, A. H., & Michael, Y. L. (2011). The urban built environment and mobility in older adults: a comprehensive review. Journal of Aging Research. https://doi.org/10.4061/2011/816106
Scheidt, R. J.,& Windley, P. G. (2006). Environmental gerontology: Progress in the post-Lawton era. In J. E. Birren, K. W. Schaie, R. P. Abeles, M. Gatz, & T. A. Salthouse (Eds.), Handbook of Psychology of Aging (pp. 105–125). Boston, MA: Elsevier Academic Press.
Schröder-Butterfill, E., & Marianti, R. (2006). A framework for understanding old-age vulnerabilities. Ageing and Society. https://doi.org/10.1017/S0144686X05004423
Statistics Canada. (2015). Canada’s population estimates: Age and sex, July 1, 2015. The Daily, September 29. Ottawa, ON. Re-trieved from http://www.statcan.gc.ca/daily-quotidien/150929/dq150929b-eng.htm
Warner, M. E., Homsy, G. C., & Morken, L. J. (2017). Planning for Aging in Place: Stimulating a Market and Government Response. Journal of Planning Education and Research, 37(1), 29–42. https://doi.org/10.1177/0739456X16642824