identifying children in need for early intervention
TRANSCRIPT
Identifying Children in Need for
Early Intervention Services in Washington State
An Application of Washington State All Payer Claims Database in Education Research
2019
AUTHOR
Huan ZhaoEducation Research and Data Center
ABOUT THE ERDCThe research presented here uses data from the Education Research and Data Center, located in the Washington Office of Financial Management. ERDC works with partner agencies to conduct powerful analyses of learning that can help inform the decisionmaking of Washington legislators, parents, and education providers. ERDC’s data system is a statewide longitudinal data system that includes de-identified data about people’s preschool, educational and workforce experiences.
ADDRESSEducation Research and Data Center106 11th Ave SW, Suite 2200PO Box 43124Olympia, WA 98504-3113
PHONE360-902-0599
FAX360-725-5174

ESIT and APCD Data | ERDC
Page 3
IntroductionBirth to three are critical years for children’s physical, language, and social emotional development.1 The provision of early intervention services to vulnerable children and their families is of particular economic and social importance.2 Washington State Early Support for Infants and Toddlers (ESIT) program3 provides individualized and quality early intervention services to children birth to three who have disabilities or developmental delays, in accordance with the federal Individuals with Disabilities Education Act (IDEA), Part C4. The goal of this paper is to examine the value of combining ESIT data with medical claims information to identify the magnitude and demographics of the population underserved by ESIT.
Background
The two datasets used for this analysis are ESIT administrative data and the Washington State All Payer Claims Database (APCD). ESIT collects information for the purposes of finding eligible children through screening, tracking, monitoring, and referral services for at risk children in order to provide early intervention services (including developmental and therapeutic services for children who are identified as developmentally delayed or have an established condition for delay). APCD is a large-scale database5 that collects health care claims data from payer sources including Medicaid, private insurers, and Medicare plans.
The timing of this report is crucially important given the lifecycles of the databases being analyzed. ESIT was established in 1986 making it a mature and stable program while APCD reached full operation in 2018. Being a relatively new database, APCD has never before been compared to ESIT thus making this analysis a unique opportunity for policy makers to obtain utilization information of medical services received by the Washington State population and to better understand the potential scope of interventions ESIT could provide and quantify the size of the population as yet unserved by the program.
1 International Perspectives on Early Intervention: A Search for Common Ground; Michael Guralnick; Journal of Early Intervention 2008, 30(2): 90-101
2 Skill Formation and the Economics of Investing in Disadvantaged Children; James Heckman; Science 2006, 312: 1900-1902
3 https://www.dcyf.wa.gov/services/child-development-supports/esit
4 Early Intervention Program for Infants and Toddlers with Disabilities, U.S. Department of Education https://www2.ed.gov/programs/osepeip/index.html
5 https://www.wahealthcarecompare.com/washingtons-apcd

ERDC | ESIT and APCD Data
Page 4
Purpose
Early intervention for children with disabilities is one of the fields Washington’s Education Research & Data Center (ERDC) is charged with analyzing. ERDC integrates early learning, K-12, post-secondary and workforce data, and conducts longitudinal education and cross-sectional research. This study contributes to ERDC’s mission by exploring the application of APCD medical claims data in education research for the purpose of identifying children underserved by ESIT. By identifying the magnitude and demographics of an at-risk population in Washington State who are potentially eligible for early intervention services, ERDC hopes to identify a treatment and control group for future research. This research could help improve our understanding of how these medical conditions might impact the education outcomes of early learners.
Profiling the DataBoth ESIT and APCD databases contain individual identifiers which may be used to directly observe individuals occurring in either database. Eligibility for the ESIT program is determined through evaluations in physical, cognitive, social emotional, communication, and adaptive areas. From 2011 to 2017, 14,508 children have diagnosed medical conditions documented6. The ESIT program records 50 diagnosed conditions related to developmental delay and disability, such as Autism, Blood Disorder, Congenital Anomaly, Diabetes, Down syndrome, and Severe Injury. Table A1 in the Appendix shows the counts of all the children documented with selected diagnosed medical conditions in ESIT data, from 2011 to 2017. Table A1 also reports counts of children in APCD data during the corresponding period.
In Table A5, we listed the International Classification of Diseases (ICD) diagnosis codes for these medical conditions. We mapped these ICD codes to APCD data and extracted medical claims with such diagnosis as the primary diagnosis or one of the first ten diagnoses of the claim, as shown in Table A2. We restricted our data extract to focus on children zero to 36 months old at claim first service time in the APCD claims data and summarized counts of children by year and demographic characteristics including gender, age, insurance coverage type and county of address in Table A3. In Table A4, we examined claims with interested medical conditions as primary diagnosis. The total costs paid by insurance and out of pocket were computed. We then calculated time durations between first service date and last service date of each claim and summarized maximum and average statistics.
6 We have access to 2007-2018 ESIT database where total 96,713 children were referred to the system and 65,411 children enrolled.
ESIT and APCD Data | ERDC
Page 5
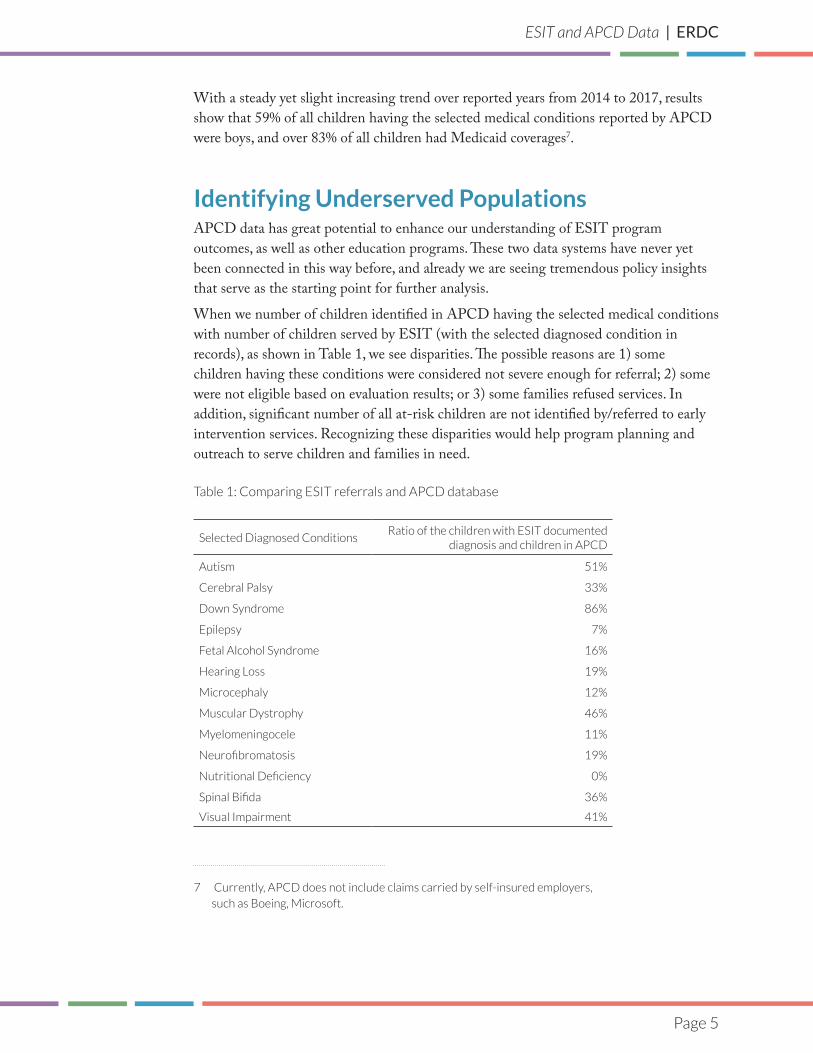
With a steady yet slight increasing trend over reported years from 2014 to 2017, results show that 59% of all children having the selected medical conditions reported by APCD were boys, and over 83% of all children had Medicaid coverages7.
Identifying Underserved PopulationsAPCD data has great potential to enhance our understanding of ESIT program outcomes, as well as other education programs. These two data systems have never yet been connected in this way before, and already we are seeing tremendous policy insights that serve as the starting point for further analysis.
When we number of children identified in APCD having the selected medical conditions with number of children served by ESIT (with the selected diagnosed condition in records), as shown in Table 1, we see disparities. The possible reasons are 1) some children having these conditions were considered not severe enough for referral; 2) some were not eligible based on evaluation results; or 3) some families refused services. In addition, significant number of all at-risk children are not identified by/referred to early intervention services. Recognizing these disparities would help program planning and outreach to serve children and families in need.
Table 1: Comparing ESIT referrals and APCD database
Selected Diagnosed ConditionsRatio of the children with ESIT documented
diagnosis and children in APCD
Autism 51%
Cerebral Palsy 33%
Down Syndrome 86%
Epilepsy 7%
Fetal Alcohol Syndrome 16%
Hearing Loss 19%
Microcephaly 12%
Muscular Dystrophy 46%
Myelomeningocele 11%
Neurofibromatosis 19%
Nutritional Deficiency 0%
Spinal Bifida 36%
Visual Impairment 41%
7 Currently, APCD does not include claims carried by self-insured employers, such as Boeing, Microsoft.

ERDC | ESIT and APCD Data
Page 6
For example, we can see that children in ESIT programs who were treated for epilepsy, microcephaly, hearing loss and other conditions are substantially outnumbered by the total children treated as documented in the APCD. This indicates that many children may be eligible for treatment under ESIT who are not participants of the program, an insight yielded only by comparing the two databases. On the other hand, medical conditions such as autism has high ratio of the children with ESIT documented diagnosis and children in APCD, which indicates concerns in children’s development from behavior disorder in young age. Thirdly, comparing the referral rates in different locations could provide insight into the efficiency of program outreach in each location. Examples like these highlight the tremendous value of connecting these two databases.
Future ResearchIn the future, early learning research would further benefit from linking early intervention services administrative data from ESIT with medical claims data from APCD. The linking results would provide a powerful platform to evaluate the individualized effectiveness of early intervention services to children with different physical, cognitive or behavioral conditions. We would be able to calibrate duration of early intervention service, transition out age, reason and eligibility for subsequent programs. It would be also possible to track a child’s health history together with his education outcomes especially for the at-risk population. In addition to established medical conditions, APCD also provides an opportunity to study the effectiveness of health awareness and decision making in early age using vaccination or safety requirement as a vehicle. We would also be able to identify medical condition specified sub-population and how these conditions might affect children’s education outcomes. Altogether, application of APCD in education research provides a unique opportunity aligning and coordinating early childhood health and early learning systems to establish a solid foundation for school-readiness as well as long- term health for all children especially at-risk groups.8
8 https://www.acf.hhs.gov/sites/default/files/ecd/health_early_learning_statement.pdf

ESIT and APCD Data | ERDC
Page 7
Appendix A: Data
Table A1. Total count of children in ESIT administrative data with selected diagnosed medical
conditions, from 2011 to 2017, comparing with count of Children in APCD
Selected Diagnosed ConditionsNumber of Children with ESIT
Documented Diagnosis Number of Children in APCD
Autism 847 1,647
Cerebral Palsy 186 570
Down Syndrome 832 971
Epilepsy 115 1,674
Fetal Alcohol Syndrome 24 149
Hearing Loss 910 4,788
Microcephaly 95 796
Muscular Dystrophy 17 37
Myelomeningocele 25 238
Neurofibromatosis 20 104
Nutritional Deficiency 13 3,585
Spinal Bifida 89 245
Visual Impairment 219 536
Table A2. Number of children (0-36 months old at claim first service date) reported in APCD
with medical diagnoses in interested conditions.
Diagnosed Conditions
As Primary Diagnosis One of First 10 Diagnoses
2014 2015 2016 2017 2014 2015 2016 2017
Autism 294 420 391 484 411 568 527 619
Cerebral Palsy 195 276 316 271 277 401 434 389
Down Syndrome 290 376 292 310 356 523 376 383
Epilepsy 575 775 725 694 808 1,127 1,016 974
Fetal Alcohol Syndrome 19 27 19 15 50 55 38 29
Hearing Loss 1,168 1,204 1,004 1,039 1,771 1,948 1,720 1,791
Microcephaly 105 107 103 121 234 304 293 291
Muscular Dystrophy * 15 23 14 * 16 28 16
Myelomeningocele 170 222 161 145 205 274 202 177
Neurofibromatosis 32 35 34 24 41 54 42 35
Nutritional Deficiency 459 299 317 287 1,018 867 999 913
Spinal Bifida 105 145 129 115 128 185 169 162
Visual Impairment 39 44 44 35 242 256 236 290
*Specific counts are not reported in these cells according to Cell Suppression Guideline of WA-APCD.

ERDC | ESIT and APCD Data
Page 8
Table A3. Gender, age, insurance type and county of all children (0-36 months old at claim first ser-
vice date) reported in APCD with medical diagnoses in interested conditions.
2014 2015 2016 2017
GenderF 1,848 1,618 1,773 1,840
M 2,545 2,329 2,560 2,632
Total 4,393 3,947 4,333 4,472
Age Group (in months)
0-6 682 706 709 629
7-12 510 532 560 595
13-18 819 920 988 1,018
19-24 832 928 1,033 1,064
25-30 976 1,040 1,199 1,204
31-36 995 1,065 1,228 1,351
Total 4,814 5,191 5,717 5,861
Insurance TypeCommercial 747 659 716 689
Medicaid 3,691 3,321 3,674 3,838
Total 4,438 3,980 4,390 4,527
County*
Adams 25 25 28 13
Benton 190 146 151 144
Chelan 48 44 53 53
Clallam 37 34 29 49
Clark 111 110 260 305
Cowlitz 67 68 81 120
Douglas 30 23 25 23
Franklin 153 107 107 102
Grant 58 64 84 78
Grays Harbor 31 52 40 76
Island 48 25 21 37
King 948 913 1,006 1,039
Kitsap 111 105 116 128
Kittitas 23 26 19 33
Klickitat 14 14 17 12
Lewis 52 50 39 46
Mason 50 36 39 53
Okanogan 27 24 33 33
Pierce 451 495 600 597
Skagit 97 61 70 100
Snohomish 666 418 434 404
Spokane 451 471 470 456
Stevens 28 15 17 18
Thurston 153 136 157 152
Walla Walla 44 53 32 43
Whatcom 119 88 127 128
Whitman 22 22 23 13
Yakima 335 291 221 202
Total 4,434 3,972 4,362 4,526
*The following counties have reported less than 11 children with interested medical conditions reported by APCD, including Asotin, Columbia, Ferry, Garfield, Jefferson, Lincoln, Pacific, Pend Oreille, San Juan, Skamania, and Wahkia-kum. Specific counts are not reported in this table according to Cell Suppression Guideline of WA-APCD.
ESIT and APCD Data | ERDC
Page 9
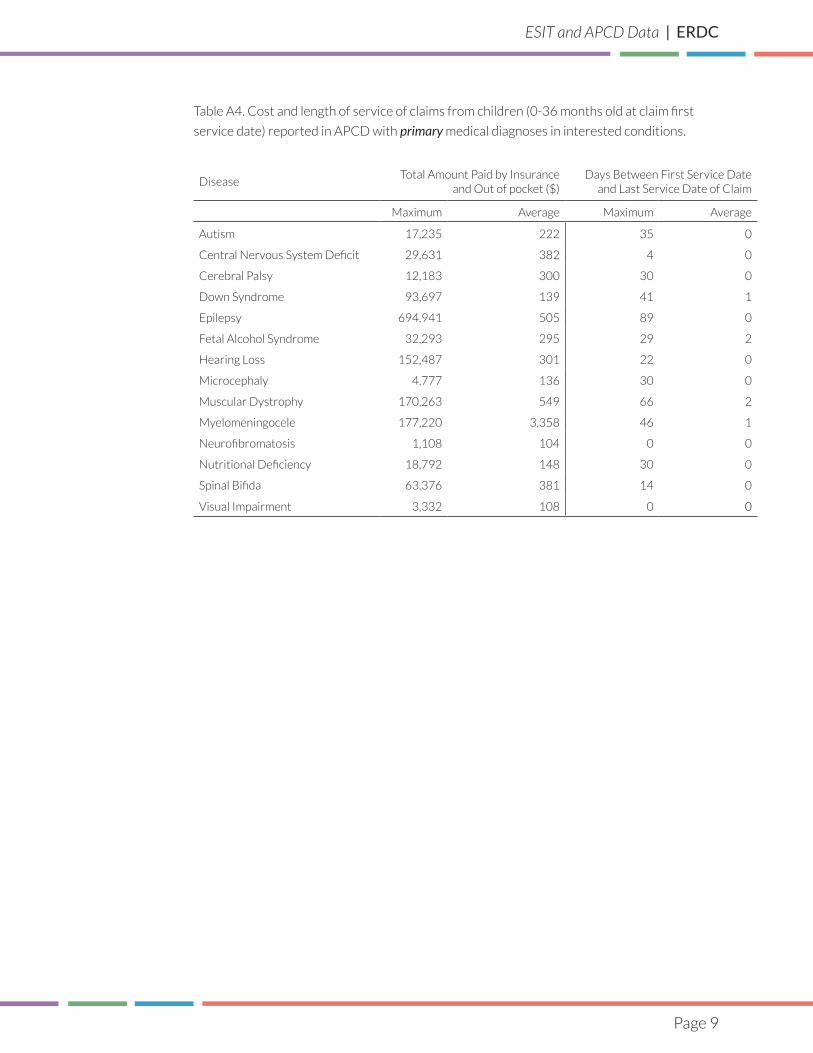
Table A4. Cost and length of service of claims from children (0-36 months old at claim first
service date) reported in APCD with primary medical diagnoses in interested conditions.
DiseaseTotal Amount Paid by Insurance
and Out of pocket ($)Days Between First Service Date
and Last Service Date of Claim
Maximum Average Maximum Average
Autism 17,235 222 35 0
Central Nervous System Deficit 29,631 382 4 0
Cerebral Palsy 12,183 300 30 0
Down Syndrome 93,697 139 41 1
Epilepsy 694,941 505 89 0
Fetal Alcohol Syndrome 32,293 295 29 2
Hearing Loss 152,487 301 22 0
Microcephaly 4,777 136 30 0
Muscular Dystrophy 170,263 549 66 2
Myelomeningocele 177,220 3,358 46 1
Neurofibromatosis 1,108 104 0 0
Nutritional Deficiency 18,792 148 30 0
Spinal Bifida 63,376 381 14 0
Visual Impairment 3,332 108 0 0

ERDC | ESIT and APCD Data
Page 10
Table A5. ICD-9 diagnosis codes (effective before 10/01/2015) and ICD-10 diagnosis codes
(effective from 10/01/2015) of interested medical conditions
Disease ICD-10 ICD-9
Autism F84.0 299.00, 299.01
Central Nervous System Deficit
C72 192.0, 192.2
Cerebral Palsy G80.0, G80.1, G80.2, G80.3, G80.4, G80.8, G80.9
333.71, 343.1, 343.3, 343.4, 343.8, 343.9, 343.0
Cystic Fibrosis E84 277.09, 277.00, 277.01, 277.02, 277.03
Down Syndrome Q90 758.0
Epilepsy G40.001, G40.009, G40.011, G40.019, G40.109, G40.111, G40.119,G40.301, G40.309,G40.801, G40.802,G40.803, G40.804, G40.821, G40.822, G40.823, G40.824, G40.901, G40.909 ,G40.911, G40.919, G40.A11, G40.A19, G40.B01, G40.B09, G40.B11, G40.B19
345.01, 345.10, 345.2, 345.3, 345.50, 345.51, 345.60, 345.61, 345.70, 345.71, 345.80, 345.81, 345.90, 345.91
Fetal Alcohol Syndrome Q86.0 760.71
Hearing Loss H90.0, H90.2, H90.3, H90.5, H90.11, H90.12, H90.41, H90.42, H91.01, H91.02, H91.03, H91.09, H91.8X1, H91.8X2, H91.8X3, H91.8X9
388.11, 389.00, 389.01, 389.02, 389.03, 389.04, 389.05, 389.06, 389.08, 389.10, 389.11, 389.12, 389.13, 389.14, 389.15, 389.16, 389.17, 389.18, 389.8
Microcephaly Q02 742.1
Muscular Dystrophy G71.0, G71.11 359.21
Myelomeningocele Q05.1, Q05.2, Q05.6, Q05.7, Q05.8, Q05.9
741.00, 741.02, 741.03, 741.90, 741.92, 741.93
Neurofibromatosis Q85.01, Q85.09 237.71, 237.79
Nutritional Deficiency E50, E51, E52, E53, E54, E55, E56, E58, E59,E60, E61, E63, E64
269.8, 263.9, 264.0, 264.2, 264.3, 264.4, 264.5, 264.6, 264.7, 264.8, 264.9, 265.0, 265.1, 265.2, 266.0, 266.1, 266.2, 266.9, 267, 268.1, 268.9, 269.0, 269.1, 269.2, 269.3, 269.9
Spinal Bifida Q05.8, Q05.9, Q07.00, Q07.01, Q07.03
741.00, 741.90
Visual Impairment H54 369.15, 369.00, 369.01, 369.03, 369.04, 369.06, 369.07, 369.11

ESIT and APCD Data | ERDC
Page 11
