identifying flood-prone areas due to sea...
TRANSCRIPT

IDENTIFYING FLOOD-PRONE AREAS DUE TO SEA LEVEL RISE IN NEARBY COMMUNITIES OF IMBANG RIVER IN
WESTERN VISAYAS, PHILIPPINES
N. A. Saripada1, C. L. Patino2, J. R. Sinogaya3
1University of the Philippines Cebu Phil-LiDAR 1, Lahug, Cebu City, 6000, Philippines – [email protected]
2University of the Philippines Cebu Phil-LiDAR 1, Lahug, Cebu City, 6000, Philippines – [email protected], 3Program for Environmental Studies,
University of the Philippines Cebu, Lahug, Cebu City, Philippines [email protected]
Abstract
Coastal communities and habitats are always threatened with the continuing rise of sea levels. The consequences of sea level rise worsened by climate change can bring higher and more frequent flooding to low-lying land areas and loss of near shore coastal habitats. Coastal communities are highly vulnerable especially during typhoon events, inevitably leading to loss of properties and ultimately lives. It is important to identify which communities are highly at risk from flooding and submersion. In this study, nearby communities of Imbang River in Western Visayas, Philippines affected by sea level rise are identified and quantified. These communities are quantified by mapping building structures using an automated building extraction approach on LiDAR data and orthoimages. The extraction methodology applied an object-based image analysis to segment, classify and extract buildings. The total area of the extracted buildings using the automated extraction method is 3.16 km2 covering 2.06% of the 153.27 km2 study area. Meanwhile, affected areas are identified by deriving the flood extent due to sea level rise in nearby communities of Imbang River using a thresholding query based approach on digital elevation model. The flood extent was dervied by using different scenarios of sea level rise categorized as low (0.63-meter rise), medium (0.82-meter rise) and high (1-meter rise) level. Almost 25% of the total land area of 153 km2of the study site is flood prone. The largest estimated area of building structures that will be totally submerged by sea level rise is estimated to be about 0.87 km2 on the 1-meter sea level rise, while the lowest is estimated to be about 0.79 km2 on the 0.63-meter sea level rise.
Keywords: Sea level rise, inundation, flood-risk exposure, lidar, building extraction, coastal communities

1. INTRODUCTION
1.1. Background of the Study
Philippines is an archipelagic country composed of 7,641 islands with approximately 36,289 km (DENR-CRMP, n.d.) of coastline, which is the fifth (5th) largest coastline in the world. It is surrounded by prominent bodies of water, namely: South China Sea to the west, Celebes Sea to the south, Sulu Sea to the southwest and to the east, the Philippine Sea and Pacific Ocean. Characterized by its extensive narrow coastal lowlands, the country is home to a big coastal community of more than 70 million people (DENR-CRMP, n.d.) whose livelihoods have been heavily dependent on the coastal areas and seas.
Scientific studies have reported the increasing rates in the global mean sea levels for the past years from late 19th century to early 20th century (Church et al., 2013). In the recent fifth assessment report by Intergovernmental Panel on Climate Change (IPCC), global mean sea levels by the year 2100 are predicted to increase from 0.26 to 0.82 meters while the regional mean sea level(MSL) change is likely to differ from global average rate by more than 100% of the global average rate (Church et al., 2013). This variation in the global and regional scale of mean sea levels along with the accelerating rate of change each year has raised concerns on the potential consequences brought about by sea level rise especially on a regional scale. According to a study by Rietbroek et al. (2015), Philippines has the most extreme case of sea level rise on a regional scale with around 14.7±4.39 mm per year. It has been reported that Philippines is likely to experience sea level rise five (5) times more than the global MSL rate (AFP, 2016). In addition, the country is ranked by an Asian Development Bank (ADB) (2012) study as fifth (5th) in a list of countries most vulnerable to flooding due to sea level rise according to Lowe (2015). In the event of a high sea level rise, Philippines will inevitably be severely vulnerable.
Several studies have investigated the risks and vulnerability of sea level rise in the Philippines using GIS and remote sensing techniques and tools. In a study by Reyes (2012), the socioeconomic vulnerability of coastal communities to sea level rise is assessed using an index. The factors considered to assess for vulnerability of the communities include livelihood, age profile of the local population, the environmental threats, and the historical data changes of the MSL from local tide gauges. The assessment was possible using GIS and remote sensing data and tools such as SRTM Digital Elevation Model, terrestrial laser scanning data and bathymetry. Likewise, on another study by Galgana (2004), a visualization of a sea level rise scenario on a local community was produced by integrating 3D modelling with GIS datasets such as digital elevation model topographic map as reference, and bathymetric data.

Despite the limited numbers of research studies focusing on the risks faced and vulnerability to sea level rise of local coastal communities in the Philippines, the wide use of GIS and remote sensing tools has proven its effectiveness as a platform for modelling, analysis, and understanding site-specific sea level rise potential consequences that will help in disaster mitigation and address site-specific problems. In this study, the researchers aim to simulate possible future sea level rise scenarios to visualize its impacts by identifying areas that are at high risk for flooding. The study will focus on a densely population urban community in an island in the western region of the Philippines. Moreover, the study will employ established Geographic Information System (GIS) and remote sensing techniques and methodologies on Lidar data to identify high risk areas brought about by sea level rise. Most importantly, the study will provide information on the areas potentially at risk which will be important to policy makers and environmental monitoring agencies in order to prompt adaptation practices and prepare for future sea level rise events.
1.2. Area of the study
The study area is the nearby communities of Imbang river which covers three cities in Negros island in the western region of the Philippines. The extent of Imbang river sits at the center of Silay City while its tributaries are in the north-eastern section of Talisay city. The center of the study site which is the city of Silay is located at 10.7528° N, 123.0876° E. The study site has a total area of 153. 27 km2 which was obtained by using the ArcMap 10.4 Calculate Geometry tool on the boundary of the study area. The administrative boundary shapefile of the cities was taken from the Philippine Geographic Information System website. The map of the study area with the three cities and Imbang river is shown in Figure 1.
2. METHODOLOGY
2.1. Data Used
LiDAR data, bathymetric data, a 3-band RGB orthoimage, MSL data, digitized building shapefile, and a point shapefile of geotagged schools were used in the study. The LiDAR data and orthoimages were used to extract building structures while the MSL data was used to simulate flooding over the study area due to sea level rise. The digitized building shapefile were created from by manually digitizing buildings on a digital surface model. It was used to assess the performance of the building extraction method. Lastly, the point shapefile of geotagged schools was used to identify institutions vulnerable to flooding due to sea level rise.
The LiDAR, bathymetric data and orthoimages were obtained from the Philippine national hazard mapping project, Phil-LiDAR 1, which is a government-funded

collaborative work between the country's universities including the University of the Philippines (UP) Diliman and UP Cebu for the Western Visayas Region (Saripada, 2016). The LiDAR data and orthoimages have a resolution of 1 meter and 0.5 meter, respectively, wherein the former has a point density of 2-4 points per square meter . Both datasets have a projection of Universal Transverse Mercator(UTM) Zone 51N.
Figure 1: Map of the study area
The MSL data was obtained from Permanent Service for MSL (PSMSL, 2016) wherein the tide gauge data (Holgate et al, 2013) was from a local sensor in Pulupandan which is the nearest sensor from the study area and is within the same province as the study area.
The digitized building shapefile was created by manually digitizing buildings on a digital surface model (DSM). The point shapefile of geotagged schools was obtained from the Department of Education Region VI.
2.2. Automated Building Extraction
An automated building extraction was employed in order to identify which areas and specifically building structures are flood prone. This study utilized the automated building extraction method of another study entitled “Running To Safety: Analysis Of Disaster Susceptibility Of Neighborhoods And Proximity Of Safety

Facilities In Silay City, Philippines” in which the author is a part of. The specific processes and workflow for the building extraction method of Saripada et al. (2016) will be discussed in detail in the following text of this section.
The methodology employed object based image analysis on Lidar and orthoimage datasets. It is a linear procedure composed of four processes namely preprocessing, segmentation, classification, and regularization. Figure 2 shows the building extraction workflow employed in the study of Saripada et al. (2016)
Figure 2: Automated Building Extraction Workflow
2.2.1. Pre-processing
In pre-processing step, raster layers were generated from Lidar data containing useful information for delineating building structures from other features such as trees, ground, and water bodies. These layers were produced using LASTools, a
Input:Lidar data and 3-band RGB orthoimage
Generate raster layers from Lidar data input
Separate non-ground objects from ground
Separate building objects from non-ground objects
Assign class to objects
Smoothen and reshape classified building objects
Output: Classified building shapefile
PREPROCESSING
SEGMENTATION
CLASSIFICATION
REGULARIZATION

software suite which is a collection of scriptable tools capable of processing and converting Lidar point cloud data into specific data formats.
2.2.2. Segmentation
Using the derived raster layers from pre-processing step, the image data was segmented to produce meaningful objects outlining building structures and other features. In object based image analysis, segmentation is the process of dividing and grouping pixels of an image data which are relatively homogenous or having the same layer properties (Blaschke, 2010). These pixel groups will become objects which can be used to distinguish building structures from others through further processing such as classification.
Multiresolution segmentation was used to group pixels of the image data having significant similarities of the given criteria. This method uses a bottom up region-merging technique which uses scale, color, shape and compactness parameters as heterogeneity criterion (Benz et al., 2004). Multiresolution segmentation was derived using an object-based image analysis software, eCognition. Image data was used with parameter values of 0.2 for shape, 0.5 for compactness and 20 for scale parameter. The raster layers used for the segmentation include nDSM, number of pulse returns, slope layer, intensity image layer and the 3-band RGB orthoimage.
2.2.3. Classification
The segmented objects were identified by assigning these objects to different classes or predefined groups using feature values. These values were numerical information about the different features of the six Lidar generated raster layers. These features include slope from slope layer, elevation from DSM, DTM, nDSM, spectral properties from the orthoimage, Lidar intensity values from intensity image and number of Lidar pulse returns.
The study (Saripada et al., 2016) implemented a ruleset based classification approach using different threshold feature values to classify image objects. Initially, ground objects were removed from non-ground objects and after which, building objects were taken from non-ground objects.
2.2.4. Regularization
The classified building objects output was subjected to smoothening the edges and reshaping the objects to rectangular using the ESRI’s ArcMap 10.44 (Environmental Systems Resource Institute) Regularize tool. Small holes inside a building object were removed using ArcMap 10.4’s Dissolve tool while the reshaping of objects was done using Regularize Building Footprints and Simplify Buildings of ArcMap 10.4.

2.3. Flooding Due to Sea Level Rise
Flood extent due to sea level rise was determined by simulating three levels of scenarios on to the digital terrain model with integrated bathy data. Meanwhile, the risk exposure of total submersion of building structures was identified by estimating the area flooded in a simulation of sea level rise on a digital surface model. The sea level rise was simulated on to the surface model to identify buildings that will likely be submerged.
Three values of MSL rise were obtained based on previous related literature and reports. The reliability of sea level rise estimates is found to be crucial in creating models that produce maps useful in policy making (Cooper et al, 2013). According to IPCC’s recent fifth assessment report, the sea levels by 2100 will likely range from 0.26 to 0.82meters (Church et al, 2013). There are also other prediction estimates by other research studies that are higher than the reports by IPCC which is around 0.75 to 1.9 meters by the end of the 21st century, which was concluded by Rhamsorf (2007) using a semi-empirical model. However, despite differences in values, research studies are converging on a prediction of 32 cm global sea level rise by 2050 and a 1 meter global sea level rise by 2100 (Cooper, 2013). In this study, three MSL rise values of 0.63 m, 0.82 m and 1 m are chosen based on models of previous studies and recent scientific reports.
A query-based thresholding approach was applied to the Lidar generated Digital Elevation Model with integrated bathymetric data. For each scenario level, the MSL value of 6.954 meters was incremented with the corresponding sea level rise value. Using the Raster Calculator in ArcMap 10.4, raster values that fall below the threshold value were flooded. However, some flooded areas were removed to prevent inclusion of areas that were not directly connected to the sea level rise flooding.
2.4. Flood-risk exposure of communities
Communities that are highly at risk to flooding were located and quantified using the extracted building structures and overlaying it to the flood extents produced from the three sea level rise scenarios. For each scenario, the extracted building structures output was overlaid on to the flood extent. The affected building structures were identified using the Intersect Selection tool from ArcMap 10.4. The inundated communities were estimated by calculating the area of the inundated building structures using the Calculate Geometry tool from ArcMap 10.4. Schools within the flood extent were also identified by overlaying the geotagged school data points to the affected building structures. The geotagged schools’ data was from Department of Education Region VI. Moreover, affected specific areas in the communities and population were identified and estimated by overlaying the administrative local boundaries over the flood extents and deriving population data from National Statistics Office 2010 data. The building structures or houses

including the population that will be affected by flooding were derived through the use of standard minimum lot area for houses and average household size.
3. RESULTS AND DISCUSSION
3.1. Automated Building Extraction
The automated building extraction method used in this study was formulated in a previous study in which the author was part of (Saripada et al., 2016). The process and accuracy results of the Saripada et al. (2016)’s automated building extraction will be discussed in the following section.
The implementation of the automated building extraction to the test data was divided into 10 groups for computational efficiency. The extraction method obtained an average of 70.49% accuracy. The overall accuracy for each group was based on the Error Matrix which was produced from eCognition software. The Error Matrix shows the performance of the classification method on the test data set (i.e., classified building objects) against the true values (i.e., manually digitized buildings). An error matrix of one group from the test data is shown in Table 1. The total area of the extracted buildings is 3.16 km2 which covered 2.18% of the 144.76 km2 study area (Saripada et al., 2016).
Table 1: Error Matrix of one group of the study area which obtained an overall accuracy of 80.5%
User\Reference Building Sum
Confusion Matrix
Building 2397131 2397131
unclassified 579187 579187
Sum 2976318
Accuracy
Producer 0.805402
User 1
Hellden 0.892213
Short 0.805402
Totals
Overall Accuracy 0.805402 The building extraction method utilized the six Lidar generated data from the pre-

processing step. These raster layers are CHM (Canopy height Model), DSM (Digital Surface Model) & DTM (Digital Terrain Model), Intensity image layer, nDSM (Normalized Digital Surface Model), number of pulse returns layer, and a slope layer. The nDSM was derived by subtracting DTM from DSM while the slope layer was produced by applying Zevenbergen, Thorne’s (ERDAS) algorithm to the nDSM.
Figure 3: (a) Objects created from segmentation process delineating buildings the (b) building objects smoothened through regularization process and the
(c)digitized buildings used to assess the performance of the building extraction method
(a) (b) (c)
Figure 3 shows output of the segmentation(a) and regularization (b) processes on the test data and the digitized buildings which was used to assess the performance of building extraction output. The building objects were created from the segmentation process as shown in Figure 3(a). The buildings were delineated from other objects despite the relative smaller size of segmented objects compared to the size of the buildings. Further processing was implemented in order to assign classes to segmented objects through classification. The classification process used a combination of the topographical properties of the Lidar generated raster layers and the spectral properties of orthoimages. A series of trial and error resulted to the different threshold values which were used in the classification of objects. The following threshold values were used: DTM >=61 for Non-Water, nDSM > 2 for Non-Ground, mean nDSM slope >=3 30 for steep objects and for non-vegetation and buildings, a mean slope<=120, standard deviation of Blue band > 3.3 for non-vegetation and buildings.
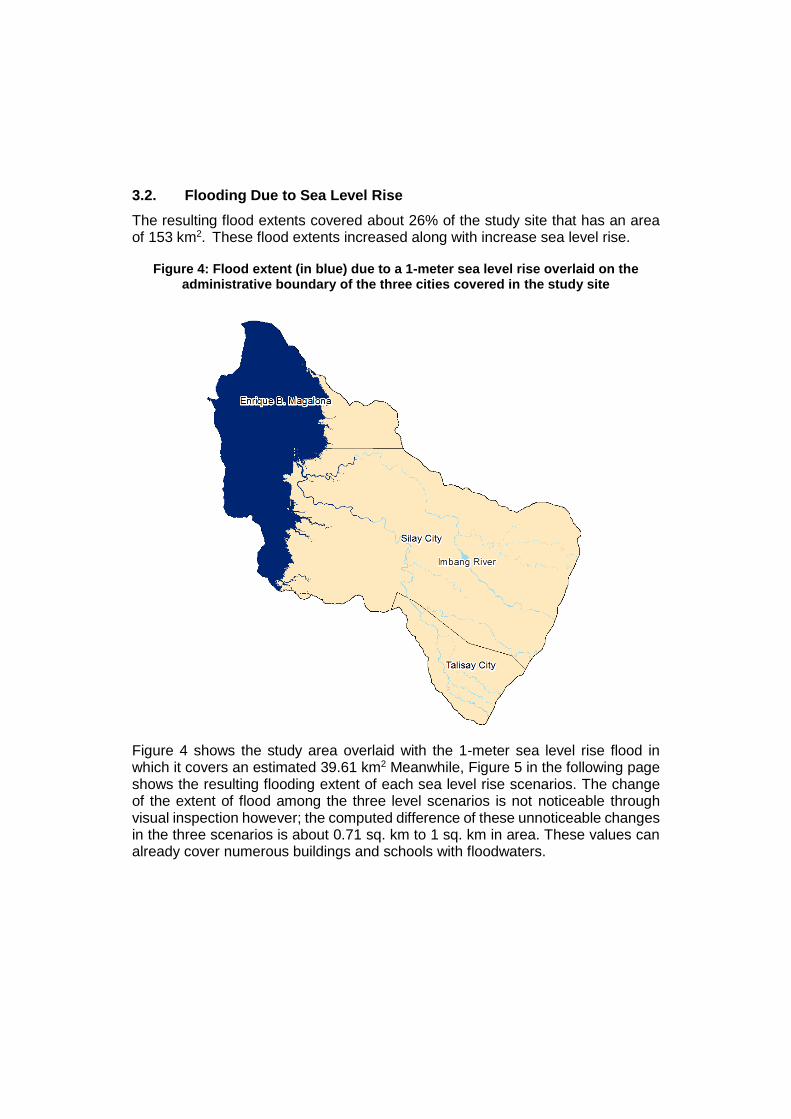
3.2. Flooding Due to Sea Level Rise
The resulting flood extents covered about 26% of the study site that has an area of 153 km2. These flood extents increased along with increase sea level rise.
Figure 4: Flood extent (in blue) due to a 1-meter sea level rise overlaid on the administrative boundary of the three cities covered in the study site
Figure 4 shows the study area overlaid with the 1-meter sea level rise flood in which it covers an estimated 39.61 km2 Meanwhile, Figure 5 in the following page shows the resulting flooding extent of each sea level rise scenarios. The change of the extent of flood among the three level scenarios is not noticeable through visual inspection however; the computed difference of these unnoticeable changes in the three scenarios is about 0.71 sq. km to 1 sq. km in area. These values can already cover numerous buildings and schools with floodwaters.

Figure 5. The flood extent(in blue) of the study area on the 3-band RGB orthophoto in (a) low-level scenario with 0.63 meter increment, (b) medium-level
scenario with 0.82 meter increment and (c) high-level scenario with 1 meter increment
(a) (b)
(c)

3.3. Flood-risk Exposure
The building structures that were flood prone were identified based on its location on the flood extent. Figure 6 shows the resulting flood extent of a 1-meter sea level rise with the buildings including schools that are highly at risk.
Figure 6 shows the schools in the study site in blue and yellow flags. There is a total of 46 schools in the study site wherein 14 of them, symbolized in yellow flags, will be totally submerged based on the three scenarios .
Figure 6: The affected schools (in yellow flags) and building structures (in red) and the 1-meter sea level rise flood extent (in dark blue) of the study site.

In the event of 1-meter flood rise, a coverage of 1.7 sq. km area of building structures will be at risk to flooding which corresponds to more than half (53%) of the total computed area of 3.16 km2 of the building structures.
There is at least 1.61 sq. km estimated area of of building structures that is highly at risk to flooding wherein 49% of these high-risk buildings, corresponding to 0.79 sq. km, will be totally submerged in the event of 0.63 meter sea level rise. A summary of the computed area of the flood extent, flood prone buildings, and totally submerged buildings in the three different scenarios is shown in the Table 2.
Table 2. Estimated area of flood extent and flooded buildings for each scenario
Scenario Level Estimated area of flood extent due to sea level rise(km2)
Estimated area of buildings prone to flooding due to sea level rise(km2)
Estimated area of buildings that will be totally submerged due to sea level rise(km2)
Low (0.63 m) 38.22 1.61 0.79
Medium(0.82m) 38.93 1.65 0.83
High (1m) 39.61 1.7 0.87
*The total area of the study site is 153 sq. km while total area for the extracted building structures is 3.16 sq. km
The standard minimum lot area for single detached houses in the Philippines is 64 sq. m based on the Board Resolution No. R. 700 Series of 2001 of the Housing and Land Use Regulatory Board of the Republic of the Philippines. Using this minimum lot area, a rough estimate of the number of houses or building structures in the study site was derived. A rough estimate of 25 houses or building structures will be at high risk to flooding wherein 52% or roughly 13 of these houses will be totally submerged in all three scenarios.
Meanwhile, affected population was derived by using the average household size in the Philippines which is 4.6 based on the 2010 Census of Population and Housing report by the National Statistics Office. More specifically, the estimate was calculated by multiplying the average household size to the resulting rough estimates of number of houses prone to flooding. Therefore, there is an estimated 115 people from the estimate of 25 houses that will be vulnerable to flooding due to sea level rise.

4. CONCLUSIONS AND RECOMMENDATIONS
Different flood scenarios with varying sea level increase were presented in the study and it was found that nearby communities of Imbang River were highly at risk for flooding due to sea level rise. It has also been observed that the flood extent increases when the sea level rise becomes higher. A 63 cm sea level rise is already capable of submerging a portion of a community which could include schools which serve as evacuation centers, and command centers. Disaster management authorities must look for alternative strategic locations to build evacuation centers and clinics that are less prone to flooding.
The study was limited to identifying the areas in the community that are potentially at exposed to risk of flooding due to sea level rise, excluding other resources that cover the land area such as crops, mangroves, and protected ecological habitats which are equally important as well. Thus, a comprehensive risk exposure on the coastal resources and communities is recommended. Another recommendation for future studies is to investigate the impacts of current coastal management practices on the vulnerability and risk exposure of the communities and natural resources to flooding due to sea level rise. In addition, conducting site specific validation is equally important as well to track changes that may occur if a disaster will occur in the future.
Moreover, the study only considered flooding due to sea level rise however, future studies could take into considerations flooding caused by other factors such as river overflow to completely observe the impacts brought about by these phenomena.
5. ACKNOWLEDGEMENT
This research is conducted by the University of the Philippines Cebu in collaboration with the University of the Philippines Diliman. This research is an output of the “Phil-LiDAR 1: Nationwide Hazard Mapping of the Philippines Using LiDAR: Western Visayas” project. We are grateful to the Department of Science and Technology (DOST) for the financial support. We are also thankful to the local governments of Negros Occidental and Silay City for their continuing assistance.
6. REFERENCES
Agence-France Presse. (2016). Sea level rise from ocean warming underestimated, scientists say at https://www.theguardian.com/environment/2016/jan/26/sea-level-rise- from-ocean-warming-underestimated-scientists-say [accessed 18 August 2016]

Asian disaster Preparedness Center (2014). Living on the bank of a stream in Silay. Asian disaster Preparedness Center
Blaschke, T. (2010). “Object based Image Analysis.” ISPRS Journal of Photogrammetry and Remote Sensing Volume 65, Issue 1, January 2010, pp 2- 16
Church, J.A., P.U. Clark, A. Cazenave, J.M. Gregory, S. Jevrejeva, A. Levermann, M.A. Merrifield, G.A. Milne, R.S.Nerem, P.D. Nunn, A.J. Payne, W.T. Pfeffer, D. Stammer and A.S. Unnikrishnan, 2013: Sea Level Change. In: Climate Change 2013: The Physical Science Basis. Contribution of Working Group I to the Fifth Assessment Report of the Intergovernmental Panel on Climate Change [Stocker, T.F., D. Qin, G.-K. Plattner, M. Tignor, S.K. Allen, J. Boschung, A. Nauels, Y. Xia, V. Bex and P.M. Midgley (eds.)]. Cambridge University Press, Cambridge, United Kingdom and New York, NY, USA.
Department of Environment and Natural Resources Coastal Resource Management Project (.n.d). Understanding the Philippine Coastal Environment at http://www.oneocean.org/about_crmp/where_we_are.html
Demirkesen, A., Evrendilek, F., Berberoglu, S. (2007). Environmental Monitoring and Assessment 138(1-3):101-6.
ESRI (Environmental Systems Resource Institute). 2015. ArcMap 10.2.2. ESRI, Redlands, California.
Galgana, G. A., Abad, S. I. C., Villarin, J. R. T., & Vicente, M. C. T. M. (2004). Visualizing Sea Level Rise in Navotas by GIS and Terrain Modeling. Journal of Environmental Science and Management, 7(1), 1-9.
Housing and Land Use Regulatory Board. (2004). Board Resolution No. R. 700 Series of 2001 at http://hlurb.gov.ph/wp-content/uploads/laws- issuances/irr/Revised_IRR_BP220_2008.pdf [accessed 25 September 2016]
Isenburg, M., LAStools - efficient tools for LiDAR processing. Version 111216, http://lastools.org.
Kemp, A., Horton, B., Donnelly, J., Mann, M., Vermeer, M., and Rahmstorf, S.(2010). "Climate related sea-level variations over the past two millennia", Proceedings of the National Academy of Sciences of the United States of America, March 25, 2011, Center National d'Etudes Spatiales (CNES), Toulouse Cedex 9, France, pp.1-2 vol. 108 no. 27, 11017–11022, doi: 10.1073/pnas.1015619108
Kopp, R., Kemp, A., Bittermann, K., Horton, B., Donnelly, J, Gehrels, W., Hay, C., Mitrovica, J., Morrow, E. Rahmstorf, S. (2016). "Temperature-driven global

sea-level variability in the Common Era", Proceedings of the National Academy of Sciences of the United States of America, January 4, 2016, Centre National d'Etudes Spatiales, Toulouse, France, pp.1-2 vol. 113 no. 6, E1434–E1441, doi: 10.1073/pnas.1517056113
Kumar, M.(2015). Remote sensing and GIS based sea level rise inundation assessment of Bhitarkanika forest and adjacent eco-fragile area, Odisha, International Journal of Geomatics and Geosciences, Volume 5, No 4, 2015
Lowe, A.(2015).Rapid rise in sea levels makes Philippines more vulnerable to natural disasters, Channel News Asia, (May), at http://www.channelnewsasia.com/news/asiapacific/rapid-rise-in-sea-levels/1877242.html [accessed 01 July 2015]
National Statistics Office. (2012). Special Release 2010 Census of Population and Housing -Final Results at http://www.nsoncr.ph/special%20release/2010%20CPH%20Special%20Release_NCR.pdf [accessed 25 September 2016]
Permanent Service for MSL (PSMSL), 2016, "Tide Gauge Data", http://www.psmsl.org/data/obtaining/ [accessed 11 July 2016]
Reyes, S. and Blanco, A. (2012). “Assessment Of Coastal Vulnerability To Sea Level Rise Of Bolinao, Pangasinan Using Remote Sensing And Geographic Information Systems” International Archives of the Photogrammetry, Remote Sensing and Spatial Information Sciences, Volume XXXIX-B6, 2012 XXII ISPRS Congress, 25 August – 01 September 2012, Melbourne, Australia
Rietbroek, R. Brunnabenda, S., Kuschea, J., Schröterb, J, and Dahlec, C(2015). "Revisiting the contemporary sea-level budget on global and regional scales", Proceedings of the National Academy of Sciences of the United States of America, November 30, 2015, Centre National d'Etudes Spatiales, Toulouse, France, pp.1-2 vol. 113 no. 6, 1504–1509, doi: 10.1073/pnas.1519132113
Saripada, N., Patiño, C, Olavides, R. and Sinogaya, J. (2016). “Running To Safety: Analysis Of Disaster Susceptibility Of Neighborhoods And Proximity Of Safety Facilities In Silay City, Philippines”, International Society for Photogrammetry and Remote Sensing, July 12-19, 2016. Prague, Czech Republic, pp. 1-5. Unpublished.
Simon J. Holgate, Andrew Matthews, Philip L. Woodworth, Lesley J. Rickards, Mark E. Tamisiea, Elizabeth Bradshaw, Peter R. Foden, Kathleen M. Gordon, Svetlana Jevrejeva, and Jeff Pugh (2013) New Data Systems and Products at the Permanent Service for Mean Sea Level. Journal of Coastal Research: Volume 29, Issue 3: pp. 493 – 504. doi:10.2112/JCOASTRES-D-12-00175.1.

Upton, J(2016). Study Reveals Stunning Acceleration of Sea Level Rise, Climate Central (February), at http://www.climatecentral.org/news/study-reveals-acceleration-of-sea-level-rise-20055 [accessed 01 July 2016]