identifying genetic variants for complex disorders - duth disorder phenylketonuria ... disorder...
TRANSCRIPT

Identifying genetic variants for complex disorders
Peristera Paschou, PhD
Associate Professor of Population Genetics
Dept. of Molecular Biology and Genetics
Democritus University of Thrace
Marianthi Georgitsi, PhD
Assistant Professor of Medical Biology-Genetics
Dept. of Medicine
Aristotle University of Thessaloniki

The average genome (2x3 billion bp) contains:
– 3-4 million single nucleotide variations, compared to the reference sequence (Single Nucleotide Polymorphisms – SNPs)
– ~0.5 million small insertions or deletions ‘indels’ (1-100bp)
– ~5,000 larger insertions or deletions (>100bp)
We are quite similar, but we are different…
Variation across all (~23,000) genes - the ‘exome’~18,000 variants
~8-9,000 functional variants
~95% of variants are common
~500-1000 genes with new mutations
~100-200 knock-out mutations

Monogenic Disorders
vsComplex Disorders

Single gene disorders
Low impact on public health cost
One gene Mendelian inheritance Rare mutations Classical genetics approaches Examples: Huntington’s disease Cystic fibrosis
Multifactorial disorders(Complex traits)
Serious impact on public health cost
Multiple genes Complex pattern of inheritance Common and rare genetic
variants Genome scans – new
technologies Examples: Stroke Diabetes Schizophrenia

GENETICS ENVIRONMENT
Duchenne muscular dystrophy
Hemophilia
Gastric ulcer
Diabetes Schizophrenia
Bipolar disorder
PhenylketonuriaGalactosemia
Cardiovascular diseaseAnkylosing spondylitis
Car accident
Interaction of genetic and environmental factors
Rare disordersSimple genetic basis
Unifactorial
Common disordersComplex genetic basisMultifactorial

λ = Relative risk of symptom development in relatives (sibs) of affected individuals
Disorder λ
Schizophrenia 12
Autism spectrum disorder 150
Bipolar disorder 7
Type I diabetes 35
Crohn’s disease 25
Multiple sclerosis 24
λ=1 risk in general population
Nussbaum et al: Thompson and Thompson’s Genetics in Medicine, 2007, p 153.

Gene-hunting strategies for multifactorial disorders
Candidate gene approachDisorder → Etiological pathway → Gene → Mapping
Positional cloningDisorder → Mapping → Gene → Etiological pathway

Gene identification
-Size of the human genome≈ 3 x 10⁹ bp
-23,000 genes
-Large portion of the genome function is not known.
Claude Maunet 1891. Haystack at the Sunset near Giverny

Looking for genes in 23 pairs of chromosomes…
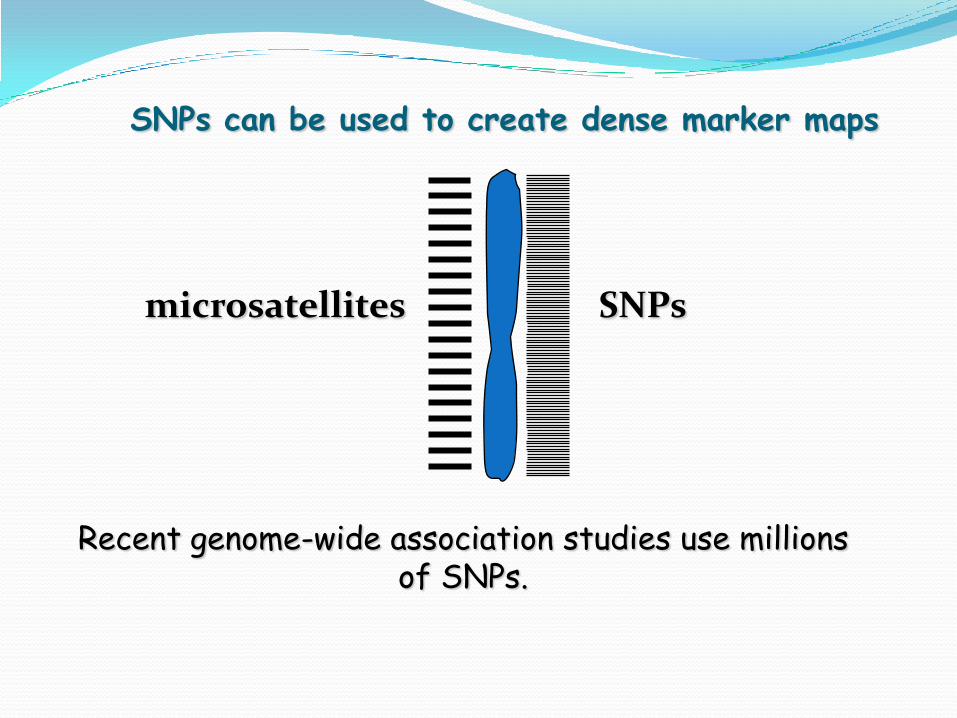
SNPs can be used to create dense marker maps
microsatellites SNPs
Recent genome-wide association studies use millions of SNPs.

Clinical Phenotype
Indications for a genetic basis?
Study design
families Sib pairs Single patients
Sample and data collection
Analysis
Linkage analysis Association studies
Define candidate regions
Physical mapping/ gene identification
Positional cloning…

Linkage analysis
Large families Sib-pair studies

1989 – The cystic fibrosis gene is identifiedFirst successful positional cloning study

Linkage analysis
• What is the probability that the disease-causing mutation and the polymorphism we are studying are linked (at a specific genetic distance) vs non-linked?

gametes
Recombination and linkage•Two loci are linked when little or no recombination occurs among them.
•Recombination: Exchange of DNA segments among homologous regions during meiosis and gamete formation.

Recombination and linkage
• Two loci at different chromosomes cannot be linked.
• Linkage increases as physical distance decreases.
• 1cM distance among two genetic loci, means that 1% of produced gametes will be recombined.

Logarithm of the odds LOD score
Logarithm of the probability of linkage Ratio of the probability that the two loci are linked
vs the probability that they are not linked. likelihood of obtaining the test data if the two loci
are indeed linked, to the likelihood of observing the same data purely by chance.
LOD = 3.0 = odds of 1000/1 for linkage Corresponds to error of 5%

Linkage analysis Great power for gene identification for mendelian
disorders
Limited success when used for multifactorial disorders
1,2 1,2
1,1 1,1 2,2 1,1
1,2 1,2
2,2 2,2 1,1 2,2
1 1
1 2
1 1
1 1
2 2
1 1 2 2
2 2
1 2
1 1 2 22 2 1 2
2 22 2
2 21 2 1 2 1 2 1 1
1 2 1 2 1 2 2 2
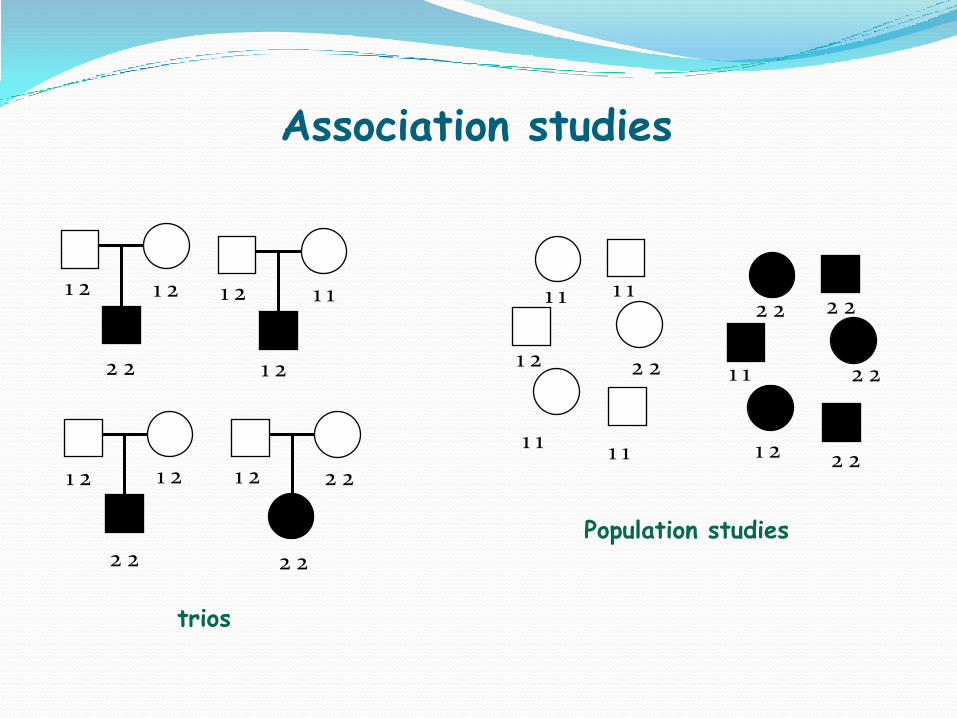
trios
Population studies
Association studies

Genetic Association Studies
Aim: To unravel associations between genetic data (ie alleles or genotypes) of
commonly occurring genetic variants with information regarding a trait or a
medical phenotype (ie disease) under study, using statistical analyses and a large
enough sample size (typically cases versus controls), in order to support the
statistics that these variants contribute to trait/disease risk.
Examples of complex
diseases
Type II Diabetes Mellitus
Obesity
Cardiovascular diseases
Cancer (non-hereditary)
Osteoarthritis
Autoimmune disorders
Alzheimer’s disease
….
Schizophrenia
Autism
Bipolar Disorder
Obsessive Compulsive Disorder
Learning disabilities (Dyslexia)
….13/04/2016

Linkage disequilibrium (LD)
The non random association of alleles at different loci
Essential tool for genetic association studies

Linkage DisequilibriumExample
SNP1: A 50% C 50%
SNP2: A 50% G 50%
SNP1 SNP2 expected frequency of haplotypes
A A 0,5 x 0,5
A G 0,5 x 0,5
C A 0,5 x 0,5
C G 0,5 x 0,5
If total LD exists – only 2 haplotypes will be observed (eg)
A G
C A

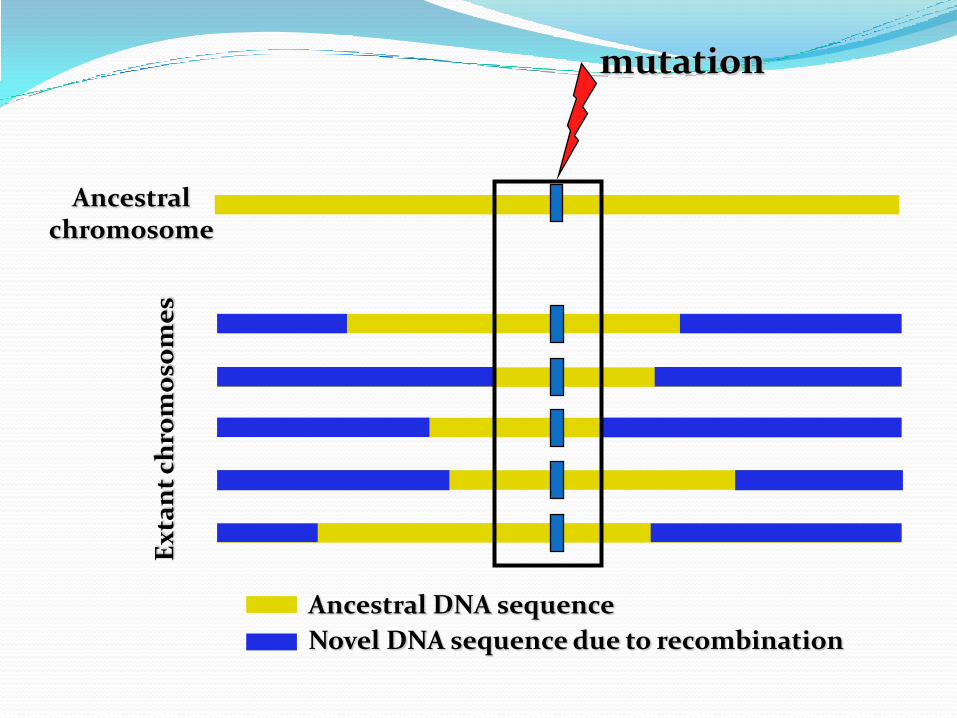
LD around a mutationgenerations
01 1 1 1 1 1 1 1 1 1 1
1 1
k2 2 2 1 1 1 1 1 1 2 2
1 1
2 2 1 1 1 1 1 1 2 2 2
1 1
2 2 2 2 1 1 1 1 1 2 2 2
1 1
.
.
.
11 1 1 1 1 1 1 1 1 2 2
1 1
2 2 1 1 1 1 1 1 1 1 1
1 1
2 2 2 1 1 1 1 1 1 1 1 1
1 1
g2 2 2 2 2 1 1 2 2 2 2 2
1 1
2 2 2 2 2 1 2 2 2 2 2
1
.
.
.2 2 2 2 2 2 1 1 2 2 2 2
1 1

Ancestral chromosome
Ex
tan
t ch
rom
oso
me
s
Ancestral DNA sequence
Novel DNA sequence due to recombination
mutation
Jobling, Hurles & Tyler-Smith. Human Evolutionary Genetics
mutation
Ancestral chromosome
Ex
tan
t ch
rom
oso
me
s
Ancestral DNA sequence
Novel DNA sequence due to recombination

polymorphism mutation
Ancestral chromosome
Ex
tan
t ch
rom
oso
me
s
Ancestral DNA sequence
Novel DNA sequence due to recombination

mutation
Ancestral chromosome
Ex
tan
t ch
rom
oso
me
s
Ancestral DNA sequence
Novel DNA sequence due to recombination
SNPs

Genome-wide Association Studies (GWAS)
Ideally…
Identify all SNPs(eg 15.000.000)
Collect a very large sample(eg 1,000 patients and 1,000 control individuals)
Genotype all individuals for all SNPs
30 billion genotypes!
Cost in 2002: 50 cents/genotype.
$15 billion for each disorder!

Genome structure allows the selection of tagging SNPs
Hirschhorn & Daly, Nat Rev Genet 2005
Candidate gene or GWAS signal
300.000 SNPs suffice for a rough scan of the human genome
Paschou et al. Genome Research 2007De Bakker et al. Nature Genetics 2005
mutationmutation
SNP

13/04/2016 30
Genetic Association Studies versus Linkage studies
Appropriate for complex phenotypes
Increased genetic (locus) heterogeneity (ie
multigenic variance) – many genes, many variants
Common variance (“common disease – common
variants” concept) – modest disease risk per
variant
Inadequate power to detect associations
Large numbers of cases and controls (healthy
individuals), or family-based associations (trios, ie
affected child and both parents) or extreme
phenotypes
Mostly SNPs (taggingSNPs): A single or a few
SNPs within a chromosomal region that
capture(s) (ie “tags”) most of the common DNA
variation in this particular region, owing to the
effect of Linkage Disequilibrium (LD).
Associated SNPs most often not coding (they can
be in LD with the causal variant or have a
regulatory effect)
Appropriate for Mendelian traits
Reduced genetic heterogeneity (one or a few
genes)
Typically rare variants (“rare disease – rare
variants” concept) in all affected individuals
Large, multigenerational pedigrees –
detection power (parametric, non-parametric
linkage analyses)
Typically microsatellite markers, SNPs, or
long stretches of chromosomal
homozygosity (for recessive traits only)
Note: LD is defined as the phenomenon of co-
inheritance (non-random association) of studied
genetic marker (SNPs) alleles, unlikely to be
separated by homologous recombination (“linked”
markers) within a population.


Candidate genes
1$ per SNP
1 -100 SNPs
2007
Technology reduces the cost

Genome genotyping
(GWAS)
250$
1 millionSNPs
Candidate genes
1$ per SNP
1 -100 SNPs
2007
Technology reduces the cost

Genome-wide association studies (GWAS)
Patients Controls
Genotypingeg 600,000 SNPs
Comparison of alleles – Statistical
analysis
Thousands of samples – The more
the better !


September 2012: 1.416 studies7.688 associated SNPs
http://www.genome.gov/gwastudies/

13/04/2016
http://www.lifesciences.sourcebioscience.com/media/426305/genotyping%20image.png
Current status of available SNP genotyping platforms – A comparison

13/04/2016© Marianthi Georgitsi
Workflow of a typical GWAS study
Sample
collection
DNA extraction
and Quantifica
tion
DNA Plating
Array run
QC
Statistical analysis
(trait-dependent)
Peripheral blood
Buccal cells
…
Manual purification
Kit-based purification
96-well plates
384-well plates
Replication
study
(stage 2)
Validation
(technical,
functional)
Pathway
analyses
Meta-analyse
s
Fluorospectrophotometry
Spectrophotometry
• Other genotyping platform
• In silico analysis (SNPs in
LD)
• Gene expression analysis
• Cell-based analysis
• Animal models
• Resequencing of region
• ANOVA• Chi-square• Fisher’s Exact• Covariate
adjustment
• Multiple
testing
• Sample
size
• Population
• Phenotypic
criteria

T2DM associated genes before 2007
Confirmed susceptibility genes in the pre-GWAS era
Altshuler et al, Nature Genetics 2000Gloyn et al, Diabetes 2003
Grant et al, Nature Genetics 2006
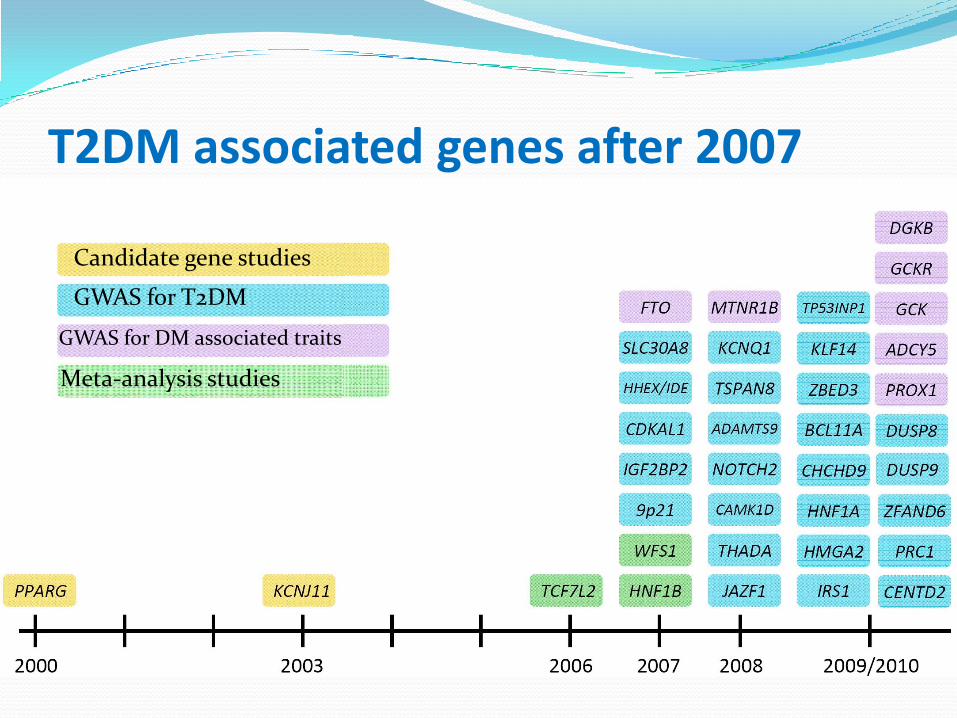
Candidate gene studies
GWAS for T2DM
GWAS for DM associated traits
Meta-analysis studies
T2DM associated genes after 2007

Monda et al. Nature Genetics 2013
>3.2 million SNPs
39,144 men and women of African ancestry
Body Mass Index GWAS and meta-analysis
women of African ancestry

Alleles associated with multifactorial disorders differ in frequency around the world
CORONA ET AL. 12TH INTERNATIONAL CONGRESS OF HUMAN GENETICS, 2011

Adygei
Russian
Sardinian
Basque
Orcadian
French
Italian/Tuscan
Different genetic structure in different populations
Significant differentiation even among European populations.
Paschou et al. Journal of Medical Genetics 2010Paschou et al. PLoS Genetics 2008Paschou et al. PLoS Genetics 2007
650.000 SNPs in different European populations.

CEU Greeks
TSI (Italians)
(North Europe) (South Europe)
Principal Components Analysis
1,200 SNPs
For each population, the average individual as well as standard deviation is shown
Stathias et al. Annals of Human Genetics 2012
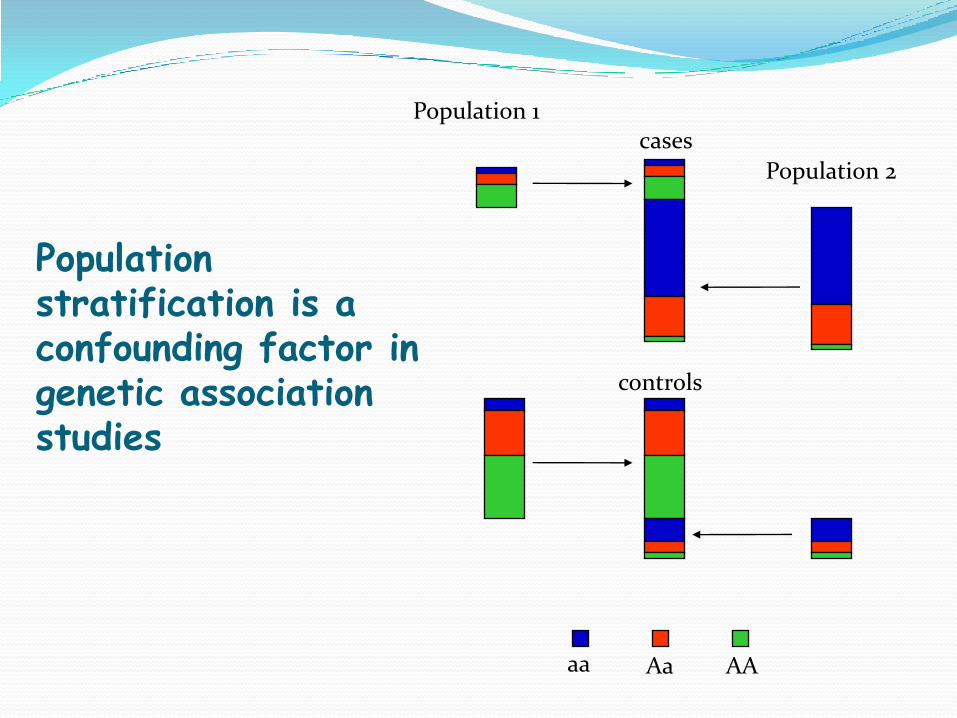
aa Aa AA
Population 1
Population 2
cases
controls
Population stratification is a confounding factor in genetic association studies

Paschou et al PLoS Genet 2007 Paschou et al PLoS Genet 2008
AsianAfrican
European
Using genetic markers to correct for population stratification in genome-wide
association studies

How many more genes are we looking for?
Type 2 Diabetes – already 45 genes associated
DIAbetes Genetics Replication And Meta-analysis (DIAGRAM) Consortium
34,840 patients – 114,981 controls
10 additional genes
Morris et al. Nature Genetics 2012

Type 2 Diabetes associated genes account for 10-28% of heritability

The case of the missing heritability (Maher, Nature 2008)

What GWAS studies have to offer – Pros and Cons
Pros (+)
• High-throughput analysis (hundreds of
thousands up to million variants)
• Large-scale projects with thousands
participants
• Suitable for complex, non-Mendelian
disorders, quantitative traits, eQTLs, …
• Variety of software tools for computerized
analysis
• Dataset repositories for meta-analyses
continuously curated and updated
• Pathway analyses
• Certified service providers worldwide
• ...
Cons (-)
• They target pre-defined variants (biased)
• Not suitable for identification (de novo) studies
• Not suitable for studying Mendelian disorders
• Alleles confer small effect sizes [small Odds
Ratios (typically OR<1.5)]
• False-positive (population stratification,
genotyping errors, selection bias, etc) or false-
negative results (insensitivity to rare variants,
lack of genetic variants from platforms, lack of
variation in a SNP in the population under
study)
• The richer they are in context, the more
expensive
• Their analysis requires training in
bioinformatics and computationally intensive
analyses and infrastructure
• Functional approaches to interpret the data are
needed (gene expression analysis, cell and animal
model manipulations, etc)
• ...
“Missing heritability” of common
diseases/disorders
© Marianthi Georgitsi

What GWAS studies have to offer
Prof. Scharf J, Massachusetts General
Hospital, Boston, personal communication,
2015
Missing heritability not targeted by GWAS
studies
• Rare variants (MAF<1%)
• Structural variants
• Gene-gene interactions
• Gene-environment interactions
• Population isolates and population extremes
Low-hanging fruit ?
(high penetrance, high frequency)
Human
Genome
© Marianthi Georgitsi

Where is the missing heritability?
McCarthy et al. Nat Rev Genet 2008
Common disease – rare variant hypothesis

Genome genotyping
(GWAS)
250$
1 millionSNPs
Candidate genes
1$ per SNP
1 -100 SNPs
2007
Technology reduces the cost

Exome sequencing
(NGS)
1000$
All exons
Whole genome sequencing
(NGS)
< 1000$
The whole genome
Genome genotyping
(GWAS)
250$
1 millionSNPs
Candidate genes
1$ per SNP
1 -100 SNPs
2007 2011 2014?
Technology reduces the cost


…1000 genomes project

Nature 526, 68–74 (01 October 2015)

•Four affected individuals in three independent kindreds, •Exome sequencing at 40x coverage.
•Filtering against public SNP databases and eight HapMapexomes identified a single candidate gene
•DHODH (Dihydroorotate dehydrogenase), encodes a key enzyme in the pyrimidine de novo biosynthesis pathway.
•Sanger sequencing confirmed the presence of DHODH mutations in three additional families with Miller syndrome.
Exome sequencing identifies the cause of a Mendelian disorder
Ng et al. Nature Genetics 2010
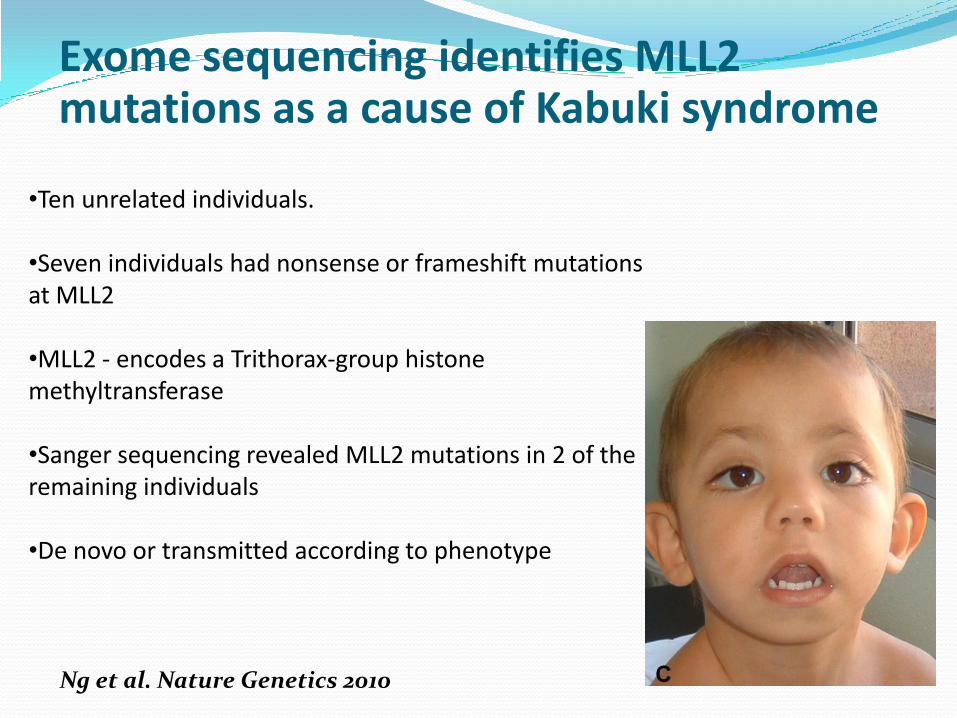
•Ten unrelated individuals.
•Seven individuals had nonsense or frameshift mutations at MLL2
•MLL2 - encodes a Trithorax-group histonemethyltransferase
•Sanger sequencing revealed MLL2 mutations in 2 of the remaining individuals
•De novo or transmitted according to phenotype
Exome sequencing identifies MLL2 mutations as a cause of Kabuki syndrome
Ng et al. Nature Genetics 2010
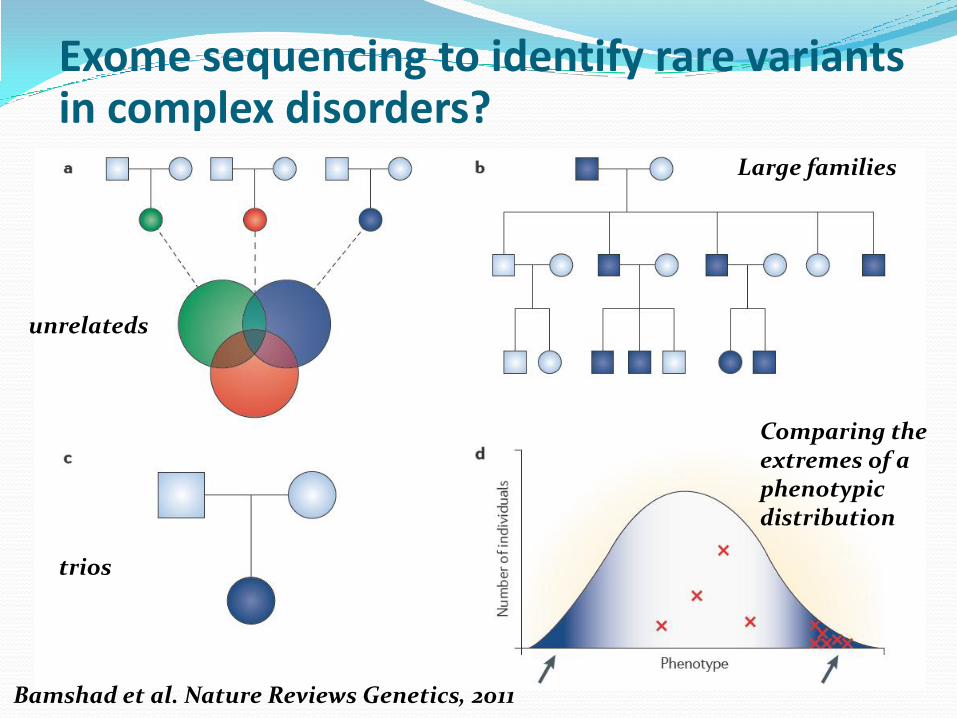
Exome sequencing to identify rare variants in complex disorders?
Bamshad et al. Nature Reviews Genetics, 2011
unrelateds
Large families
trios
Comparing the extremes of a phenotypic distribution

• Sequencing the exomes of >7,000 individuals with extreme phenotypes
• Goal: find genes that underlie common cardiovascular disease (eg early-onset myocardial infarction and stroke) and lung disease (eg chronic obstructive pulmonary disease)
• Funded by the US National Heart, Lung, and Blood Institute
The Exome Sequencing Project
Fu et al. Nature 2013Boileau et al. Nature Genetics 2012Emond et al. Nature Genetics 2012
Tennessen et al. Science 2012

Data analysis of a typical NGS experiment
Illumina site:
http://www.illumina.com/


Workflow to identify disease variants in exomesequencing data
Pabinger et al. Briefings in Bioinformatics, 2013

Making sense of NGS data
~24.000 SNPs (exome-seq)
~20.000 SNPs (exome-seq)
Factors affecting the identification of causal alleles
against a background of common polymorphisms:
What is the mode of inheritance of a trait?
Does population structure affect causal alleles?
Does the phenotype arise de novo or due to inherited
variants?
Locus heterogeneity of a trait (=how many genes
affect the manifestation of a trait)
How large sample size in order to identify trait-
associated alleles?
What analytical framework (software, pipeline) to be
used?
~2% of SNPs identified
per individual by WES is
novel
© Marianthi Georgitsi


• Coding?
• Intronic?
• Deleterious?
• Non-functional?
• Amino-acid change?
• Regulatory?
20,000-25,000 exonic variants…What is the effect?

dbSNP- Includes everything!!- SNPs have information aboutorigin-VCF available
ClinSeq- 650 Exomes with phen. (dbGaP)- CCDS and knownGenes- soon in dbSNP, VCF to beavailable
1000 Genomes- 1,094 low coverage genomes (~4x)- >=1% sensitivity- In dbSNP, VCF available- 822 Exomes – CCDS (coming soon)
NHLBI Exome Sequencing Project- 2,500 Exomes with phen. (dbGaP)- in dbSNP, VCF available
Who else has the variant? Human Variation DatabasesGoal: Determine presence of variant in others

Potential frequencies of causal variants in
complex traits
Cirulli and Goldstein, Nature Reviews Genetics 2010
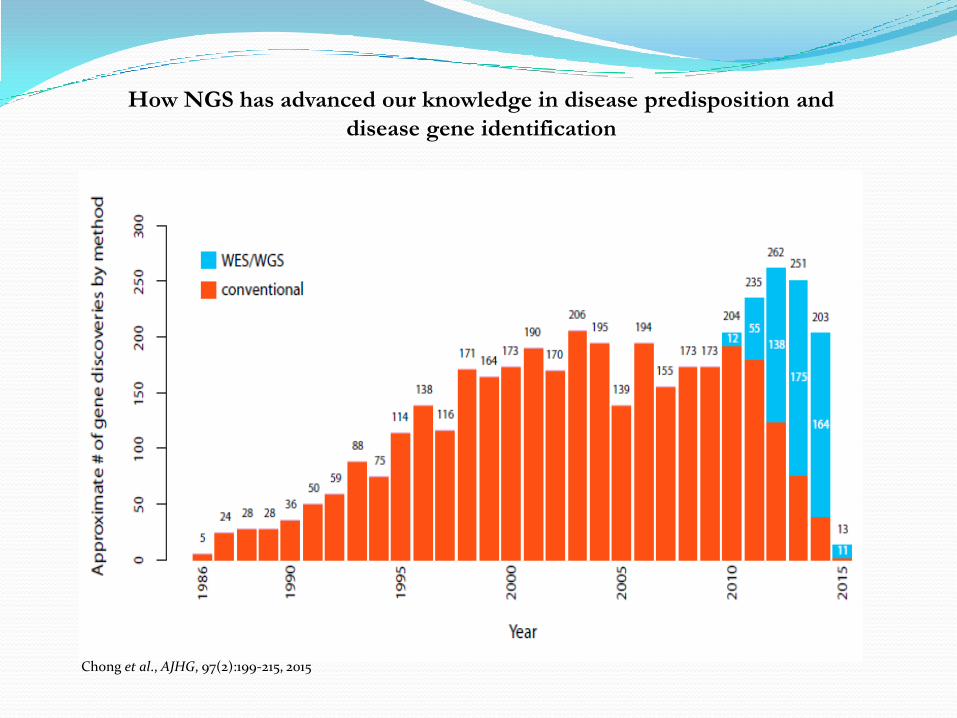
How NGS has advanced our knowledge in disease predisposition and
disease gene identification
Chong et al., AJHG, 97(2):199-215, 2015


Risk of developing a disease Lifestyle changes
Personalized treatment (pharmacogenomics)
Less toxicity & ADR / Better response
Family planning Prenatal screening / Genetic counseling
Presymptomatic or predictive screening
Disease management and follow-up


