idt_ _short final.pdf
TRANSCRIPT
8/18/2019 IDT_ _short final.pdf
http://slidepdf.com/reader/full/idt-short-finalpdf 1/20
IDT Report
TRAI 1
Analysis of the Network Performance of the Telecom Service
Providers in Mumbai and Delhi
Background
1. TRAI is regularly monitoring the performance of Telecom Service Providers (TSP) against the
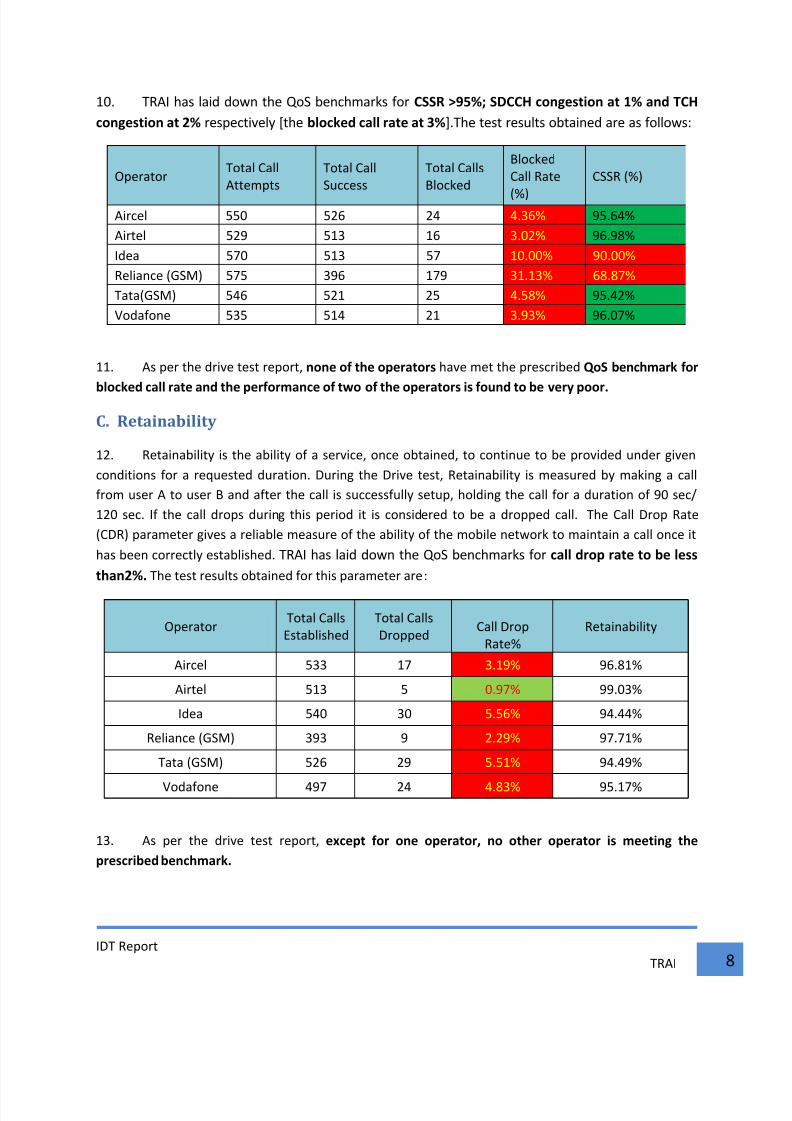
enchmar!s for the various "uality of Service ("oS) parameters laid do#n y the Authority. TSPs sumit
Performance $onitoring Reports to TRAI every %uarter.
&. TRAI also underta!es audit and assessment of "uality of Service through independent agencies
to verify the "uality of Service claimed. The Audit agencies conduct sample 'Drive tests across various
cities all over the country as part of audit and assessment of the TSPs performance. The audit reports of
these agencies are pulished on the #esite of TRAI.
. In vie# of complaints on call drops and other net#or! issues* on ehalf of TRAI* an independent
Drive Test (IDT)#as conducted y $+s T,- S,D on
a. &rd
and &th
/une &01 covering various locations in South and 2entral $umai. The
performance of Idea* Airtel* -odafone* Reliance (3S$)* Aircel4 Tata(3S$) #as
monitored5
. 6th to 11th /uly &01 covering various locations in South Delhi* 2entral Delhi and 7est
Delhi. The performance of Idea* Airtel* -odafone* Reliance (3S$)* Aircel 4 Tata(2D$A)
#as monitored.
. A team from the TRAI 8" #as present for these Drive tests during these days. 9or the purpose
of these tests* only 2GBTS #ere covered.
. The test results otained from these drive tests are presented to e:plain the net#or! condition
in terms of Radio 9re%uency (R9)2overage5 R: "uality5 Accessiility5 Retainaility5 and 2arrier to
Interference ratio. ;f these parameters* performance enchmar!s have een prescried y TRAI or the
<icensor for R9 2overage5 R: "uality5 Accessiility and Retainaility. 8o#ever* for a comprehensive
e:amination of the net#or! %uality* the parameters relating to 2arrier over Interference have also een
added.
What is a Drive Test?
=. Drive Test is a test performed to evaluate the performance of various cellular net#or!s onpredetermined parameters. A Drive test is performance oriented and therefore technology neutral.
>. A Drive test is conducted y driving a vehicle at a steady speed over the selected route. The
vehicle carries the testing e%uipment #hich measures the !ey performance indicators (?PI)y
repeatedly ma!ing calls* estalishing the call* recording the %uality of connection* measuring dropped
calls* etc. in accordance #ith the predetermined parameters.

8/18/2019 IDT_ _short final.pdf
http://slidepdf.com/reader/full/idt-short-finalpdf 2/20

8/18/2019 IDT_ _short final.pdf
http://slidepdf.com/reader/full/idt-short-finalpdf 3/20
IDT Report
TRAI
RF DRIVE TEST IN MMB!I
2"rd
!ND 2#th
$une 2%&'

8/18/2019 IDT_ _short final.pdf
http://slidepdf.com/reader/full/idt-short-finalpdf 4/20
IDT Report
Target Network:1. The target net#or!s for t
(3S$).
Mu()ai *irc+e
Population
Area
Population Density
Mu()ai *it, Ma- is sho.n )e+o./
1http++maps.google.co.in
he IDT #ere BIdea* Airtel* -odafone* Reliance (3
Ta)+e & *IT0 DEM1GR!3I*S
Detai+s
1*0*000
=0 S%uare ?m
&6*=0 People per S%uare ?m
Ta)+e 2 Mu()ai *it, Ma-&
TRAI
S$)* Aircel 4Tata

8/18/2019 IDT_ _short final.pdf
http://slidepdf.com/reader/full/idt-short-finalpdf 5/20
IDT Report
TRAI
&. The numer of ETS count and the suscrier ase of the target net#or!s are given elo#
;perator Technology Eand ($8C) ETS 2ount SuscriersF
(Prepaid G
Postpaid)
Suscriers + ETS
Aircel 3S$ 1@00 1@&6 &@01> 1>
Airtel 3S$ 600 4 1@00 0 010> 66
Idea 3S$ 1@00 @ >>1>= 1=6
Reliance (3S$) 3S$ 1@00 &1>@ &@1&11&6&
Tata(3S$) 3S$ 1@00 &@@= &&@1=6 @1
-odafone 3S$ 600 4 1@00 1& @=&0&1 1611
FSuscriers data of $umai circle on 1 $arch &01 ta!en from 2SD audit.

8/18/2019 IDT_ _short final.pdf
http://slidepdf.com/reader/full/idt-short-finalpdf 6/20
IDT Report
Drive Test Route
. The total Drive test route
covered included *o+a)a4 *hurch
elo# depicts the route that #as f
Peddar Road
Navy Nagar
Malabar Hill
overed over the t#o days #as appro:imately "%%
ate4 !ndheri4 Ma+ad4 Ghatko-ar4 5okhand.a+a
llo#ed during the $umai Drive test.
Ghatkopar
Govandi St
TRAI =
k(s. $aHor areas
6 $uhu. The map
tion Rd

8/18/2019 IDT_ _short final.pdf
http://slidepdf.com/reader/full/idt-short-finalpdf 7/20
IDT Report
TRAI >
Drive Test Schedu+e
. The test #as performed from 0600 hrs. to 160 hrs. to cover pea! and offBpea! hours. In all
aout 0 calls #ere made for all the = operators.
. The tests #ere conducted as Eenchmar!ing tests aimed to compare the performances of thevarious net#or!s for the same parameters and against the same enchmar!s for comparaility. The ?ey
Performance Indicators recorded #ere R9 2overage ()*Accessiility ()* Retainaility()* $oility ()*
R: "uality()*2arrier over Interference().
A. RF Coverage rate
=. Radio Frequency (RF) Coverage relates to the geographical footprint within an area that has
sufficient RF signal strength to allow for a call/data session. The R9 2overage rate of an operator is
calculated on the asis of of samples in #hich the receive level (R:) is etter than 78' d)(at street
level. The test results otained in $umai on the drive test route (appro:. 00 !m) are as follo#s
;perator2overage Rate
R: <evel 0 to B@dEm
2overage Rate
R: <evel 0 to B6dEm
Aircel 6.= 66.=0
Airtel 6.1 66.&6
Idea 6.0 66.6@
Reliance (3S$) @6.6 6@.
Tata(3S$) 6>.0> 66.>=
-odafone 61.0@ [email protected]
>. As per the drive test report* the coverage along the selected route of a++ the o-erators #as
found to e satisfactory.
B. Accessibility
@. Accessibility is the aility of a user to otain the re%uested service from the net#or!.
6. Accessiility is monitored y measuring the 2all Setup Success Rate (2SSR).The 2SSR is
defined as the ratio of Jstalished 2alls to numer of 2all Attempts. 7hen a user KAL initiates a call
to user KEL in the same net#or!* a Stand Alone Dedicated 2ontrol 2hannel (SD228)is allocated for
setting up the call. ;nce the call is setup* a Traffic 2hannel(T28) is allocated for the call. Mon
availaility of control channel or traffic channel #ill lead to congestion #hich is measured through
the SD228 congestion and the T28 congestion. The SD228 congestion and T28 congestion are
monitored through the 'Eloc!ed 2all rate parameter in the Drive test.
8/18/2019 IDT_ _short final.pdf
http://slidepdf.com/reader/full/idt-short-finalpdf 8/20
IDT Report
TRAI @
10. TRAI has laid do#n the "oS enchmar!s for *SSR 9:';< SD**3 congestion at &; and T*3
congestion at 2; respectively Nthe )+ocked ca++ rate at ";O.The test results otained are as follo#s
;peratorTotal 2all
Attempts
Total 2all
Success
Total 2alls
Eloc!ed
Eloc!ed
2all Rate
()
2SSR ()
Aircel 0 &= & .= 6.=
Airtel &6 1 1= .0& 6=.6@
Idea >0 1 > 10.00 60.00
Reliance (3S$) > 6= 1>6 1.1 =@.@>
Tata(3S$) = &1 & .@ 6.&
-odafone 1 &1 .6 6=.0>
11. As per the drive test report* none o= the o-erators have met the prescried >oS )ench(ark =or
)+ocked ca++ rate and the -er=or(ance o= t.o o= the o-erators is =ound to )e ver, -oor
C. Retainability
1&. Retainaility is the aility of a service* once otained* to continue to e provided under given
conditions for a re%uested duration. During the Drive test* Retainaility is measured y ma!ing a call
from user A to user E and after the call is successfully setup* holding the call for a duration of 60 sec+
1&0 sec. If the call drops during this period it is considered to e a dropped call. The 2all Drop Rate
(2DR) parameter gives a reliale measure of the aility of the moile net#or! to maintain a call once it
has een correctly estalished. TRAI has laid do#n the "oS enchmar!s for ca++ dro- rate to )e +ess
than2; The test results otained for this parameter are
;peratorTotal 2alls
Jstalished
Total 2alls
Dropped2all Drop
Rate
Retainaility
Aircel 1> .16 6=.@1
Airtel 1 0.6> 66.0
Idea 0 0 .= 6.
Reliance (3S$) 6 6 &.&6 6>.>1
Tata (3S$) &= &6 .1 6.6
-odafone 6> & .@ 6.1>
1. As per the drive test report* e@ce-t =or one o-erator4 no other o-erator is (eeting the
-rescri)ed )ench(ark

8/18/2019 IDT_ _short final.pdf
http://slidepdf.com/reader/full/idt-short-finalpdf 9/20
IDT Report
TRAI 6
1. The specific reason for a call drop in a particular case cannot e determined during the drive test
or from the test results themselves. The common reasons attriuted for call drops are given elo#.
a. Spectrum related issues such as limited spectrum or unavailaility of spectrum5
. 2overage gaps5
c. Inade%uate capacity in a ETS5
d. Interference issues caused y illegal repeaters* private #ide and repeaters* and other
#ireless devices5
e. J%uipment failure* transmission media fluctuations+ disruptions.
D. Mobility
1. In a cellular system a ase station has only a limited coverage area. 8ence it is possile for a
moving suscrier to e out of range of a ase station #hile ma!ing a call or during a call. The process
y #hich a moile telephone call is transferred from one ase station to another as the suscrier
passes the oundary of a cell is called a 8andover. A 8andover success rate (8;SR) more than 6 is
considered to e good. The various operators performance oserved during the Drive Test #as
;perator Total 8; AttemptTotal 8;
Success8; Success Rate
Aircel >6 >>0 6=.@=
Airtel 1&@ 1&1> 6=.>
Idea 6@ 6= 6>.@>
Reliance (3S$) 100 6@ [email protected]
Tata(3S$) 1 1=6 6.0
-odafone 1>0 1>0> 6>.
1=. As per the drive test report* a++ o=the o-erators are meeting the enchmar!.
E. Rx Quality
1>. 9or measuring voice %uality* R: "ual samples on a scale from 0 to > for 3S$ operators are
measured. As per the TRAI "oS norms* R: "ual et#een 0B for 3S$ operators is considered to e
good* #hereas R: "ual eyond this enchmar! is considered to e poor. TRAI has set do#n the "oS
norm re%uiring connections #ith good voice %uality to e 6. Accordingly the R:"uality is determined
and as can e seen from the tale elo#
;peratorR: "uality Samples
(0B>)
R: "uality
Samples (0B)
R: "uality Samples
(0B)
Aircel =>=@> >61>> @.=0
Airtel =>=06 =1= 61.11
Idea =6@00 =1>@6 @=.=
Reliance (3S$) >>1> 60=@& @.
Tata (3S$) >1106> ==1 @6.0
-odafone =00& >@=0 @6.=
1@. As per the drive test report* none o= the o-erators are (eeting the -rescri)ed )ench(ark.

8/18/2019 IDT_ _short final.pdf
http://slidepdf.com/reader/full/idt-short-finalpdf 10/20
IDT Report
TRAI 10
F. Carrier over nter!erence "C#$
16. The carrierBoverBinterference ratio see!s to test the level of optimisation of the signal strength
of a net#or!. It is the ratio et#een the levels of the signal strength of the current serving cell to that of
the signal strength of undesired or interfering signal components. The measurement range e:tends from
0 dE to 0 dE. A 2+I elo# dE #ould normally result in a dropped call. The 2+I values et#een 6 and 1is acceptale5 #hile values et#een 1 and 0 are considered good.
&0. Mo specific "oS Eenchmar! has een laid do#n for 2+I. The performance of TSPs is given elo#
;perator 2+I Samples (1B0) 2+I Total Samples2+I Samples (1B0)
Aircel &>=0 6&=1 [email protected]
Airtel 606=0 1011 =.@
Idea 1=6@60 &@= ==.=>
Reliance 1060> 6& @.
Tata &=11@ >>@ =6.>
-odafone 10=0 1=1=@0 =.&
%verall %&erator Analysis
&1. The results of these ?ey Performance Indicators is summarised in the tale elo#B
?PI Aircel Airtel IdeaReliance
(3S$)
Tata
(3S$)
-odafone
2overage 6.= 6.1 6.0 @6.6 6>.0> 61.0@
Accessiility 6.= 6=.6@ 60.00 =@.@> 6.& 6=.0>
Retainaility 6=.@1 66.0 6. 6>.>1 6.6 6.1>
$oility 6=.@= 6=.> 6>.@> [email protected] 6.0 6>.
R: "uality @.=0 61.11 @=.= @. @6.0 @6.=
2+I [email protected] =.@ ==.=> @. =6.> =.&

8/18/2019 IDT_ _short final.pdf
http://slidepdf.com/reader/full/idt-short-finalpdf 11/20
IDT Report
TRAI 11
!na+,sis o= the RF drive re-ort
&&. The overall performance of the TSPs* as determined y the independent audit agency* is
summed up elo#
AI !irce+ !irte+ IdeaRe+iance
GSMC
Tata
GSMCVoda=one
*a++ !tte(-t 0 &6 >0 > =
B+ocked *a++ Rate
";C#"; "%2; &%%%; "&&"; #'8; ":";
*a++ Setu- Success
Rate 9:';C
6.= 6=.6@ 60.00 =@.@@ 6.& 6=.0>
Dro--ed *a++ Rate
2;C.16 0.6> .= &.&6 .1 .@
R@ >ua+it, %7'C
9:';C@.=0 61.11 @=.= @. @6.0 @6.=
3andover Success
Rate 9:';C6=.@= 6=.> 6>.@> [email protected] 6.0 6>.
&. The Drive test resu+ts revea+ed that (ost o= the o-erators are not (eeting the )ench(arks o=
the net.ork re+ated -ara(eters The, =ai+ed to achieve the )ench(arks due to 3igh B+ock *a++ Rate4
3igh Dro- *a++ Rate4 5o. *a++ Setu- Success Rate 6-oor R@ >ua+it, 3o.ever4 as (entioned ear+ier4this resu+t re=+ects on+, the net.ork conditions on the route =o++o.ed ), the Test vehic+es and as
deter(ined during the da, and ti(e o= the Drive test

8/18/2019 IDT_ _short final.pdf
http://slidepdf.com/reader/full/idt-short-finalpdf 12/20

8/18/2019 IDT_ _short final.pdf
http://slidepdf.com/reader/full/idt-short-finalpdf 13/20
IDT Report
Target Network1. The target net#or!s for th
(2D$A)
De+hi *irc+e
Population
Area
Population Density
De+hi *it, Ma- is sho.n )e+o.
& ###.mapsof#orld.com
e IDT #ereB Aircel* Idea* -odafone* Airtel* Relian
Ta)+e & *it, De(ogra-hics
Detai+s
1.=@ 2rores (2ensus &011)
1@ S%uare ?m
11*&0 People per S%uare ?
Ta)+e 2 De+hi *it, Ma-2
TRAI 1
e (3S$) and Tata
m

8/18/2019 IDT_ _short final.pdf
http://slidepdf.com/reader/full/idt-short-finalpdf 14/20
IDT Report
TRAI 1
&. The numer of ETS count and the suscrier ase of the target net#or! are given elo#
;perator Technology Eand ($8C) ETS 2ountSuscriersF (Prepaid
G Postpaid)Suscriers + ETS
Aircel 3S$ 1@00 >6 06>@ 10
Airtel 3S$ 600 4 1@00 6@@ 106=60 1>=
Idea 3S$ 1@00 @0 60=& 1&
Reliance 3S$ 1@00 &6 &1@
Tata 2D$A @00 1== &=&= 1>6>
-odafone 3S$ 600 4 1@00 =11 6@@@ 1=@
FSuscriers data of Delhi circle in 1 $arch &01 ta!en from 2SD audit.
Drive Test Route
. The total Drive test route covered #as appro:imately "%% k(s. $aHor areas covered included
*onnaught +ace *C inner and outer circ+e4 India gate4 5ut,ens one4 *hank,a-uri4 South *a(-us4 IIT4
!IIMS4 De+hi *antt4 De+hi Gate4 Dar,aganH and di==erent -arts o= South and West De+hi The map elo#
depicts the route that #as follo#ed during the Delhi Drive test.
Drive test route o= Ne. De+hi
Sadar Baar

8/18/2019 IDT_ _short final.pdf
http://slidepdf.com/reader/full/idt-short-finalpdf 15/20
IDT Report
TRAI 1
Drive Test Schedu+e
. The test #as performed from 0600 hrs to &00 hrs* to cover oth pea! as #ell as offBpea! hours.
In all aout =&= calls #ere made for all the = operators.
. The ?ey Performance Indicators recorded #ere R9 2overage ()*Accessiility ()*Retainaility()* $oility ()* R: "uality()*2arrier over Interference() in the Delhi IDT is e:plained
elo#.
A. RF Coverage rate
=. The test results otained in Delhi on the drive test route (appro:. 00 !m) are as follo#s
;PJRAT;R 2overage Rate N0 to B@dEmO 2overage Rate N0 to B6dEmO
Aircel >.& 6=.0=
Airtel 61.&= 66.6=Idea @>.& 6@.=
Reliance >.6= @=.10
Tata(2D$A) @.0> @&.1&
-odafone @>.&6 [email protected]
>. As per the drive test report* the coverage =or a++ the o-erators e@ce-t one is -oor
B. Accessibility
@. The test results otained are as follo#s
;peratorTotal 2all
Attempts
Total 2all
Success
Total 2alls
Eloc!ed
Eloc!ed 2all
Rate ()2SSR ()
Aircel 1 &@ 1 &.6 6>.0
Airtel @> 6 @.1@ 61.@&
Idea >@& >@ &@ &=.06 >.61
Reliance =0 0 1 10. @6.
Tata(2D$A) >& >1 &0 1.11 6@.@6
-odafone 60 => && .=6 6.1
6. As per the drive test report* (ost o= the o-erators have not (et the -rescri)ed >oS
)ench(ark =or )+ocked ca++ rate and the -er=or(ance o= three o= the o-erators .as =ound to )e ver,
-oor

8/18/2019 IDT_ _short final.pdf
http://slidepdf.com/reader/full/idt-short-finalpdf 16/20
IDT Report
TRAI 1=
C. Retainability
10. The test results otained for this parameter are
;peratorTotal 2alls
Jstalished
Total 2alls
Dropped2all Drop Rate () Retainaility ()
Aircel & && .1@ 6.@&Airtel @.0 61.6=
Idea @@ 11 &.@ 6>.1=
Reliance @ 6 1>.&6 @&.>1
Tata(2D$A) >1 = 0.@ 66.1=
-odafone => &0 .&@ 6.>&
11. As per the drive test report* e@ce-t =or one o-erator4 none o= the o-erators are (eeting the
-rescri)ed )ench(ark
D. 'obility1&. The performance of the various operators oserved during the Drive Test #as
;perator Total 8; Attempt Total 8; Success 8; Success Rate
Aircel =& =@ 6>.@
Airtel 10@ 101 6.6
Idea 1&@ 1&1 6@.=
Reliance >6 >>0 6=.@=
Tata(2D$A) >= >&0 6.1&
-odafone 1=@ 1&@@ 6.1
1. As per the drive test report* t.o o= the o-erators are not (eeting the )ench(ark
E. Rx Quality
1. The R: "uality for the operators are as sho#n in the tale elo#
;peratorR: "uality
Samples (0B)
R: "uality
Samples (0B>)
R: "uality Samples (0B)
Aircel @1=@> @&11 @&.=6
Airtel 0>&> =01=06 @.&
Idea &611 @0&> 61.1&
Reliance 1>0 @==> @.=
Tata(2D$A) @>=@>> @>6>& 66.=@
-odafone 660=& 0&>& 60.=>
1. As per the drive test report* none o= the o-erators e@ce-t one o-erator are (eeting the
-rescri)ed )ench(ark

8/18/2019 IDT_ _short final.pdf
http://slidepdf.com/reader/full/idt-short-finalpdf 17/20
IDT Report
TRAI 1>
F. Carrier over nter!erence "C#$ (
1=. The performances of TSPs on this parameter is given elo#
;perator 2+I Samples 2+I Total Samples 2+I Samples ()
Aircel &11>= 6=@ .=
Idea &0>&> >1 =0.0
-odafone &10&60 > @.@&
Airtel 1@=@0@ &=&6& .@&
Reliance 101& &>0&0 .=
Tata(2D$A)BJc+Io @161= 10&6@ >6.6=
%verall %&erator Analysis
1>. The results of the ?ey Performance Indicators are summarised in the tale elo#B
AI !irce+ !irte+ Idea Re+ianceTata
*DM!CVoda=one
2overage >.& 61.&= @>.& >.6= @.0> @>.&6
Accessiility 6>.0 61.@& >.61 @6. 6@.@6 6.1
Retainaility 6.@& 61.6= 6>.1= @&.>1 66.1= 6.>&
$oility 6>.@ 6.6 6@.= 6=.@= 6.1& 6.1
R: "uality @&.=6 @.& 61.1& @.= 66.=@ 60.=>
2+I .= .@& =0.0 .= >6.6= @.@&
In 3S$* the 2+I value is measured through samples having more than 1 to 0. In 2D$A * it is usually measured as
Jc+Io. The Jc+Io is used to measure the for#ard lin! coverage performance.

8/18/2019 IDT_ _short final.pdf
http://slidepdf.com/reader/full/idt-short-finalpdf 18/20
IDT Report
TRAI 1@
!na+,sis o= the RF drive re-ort
1@. The overall performance of the service providers is as given elo#
AI !irce+ Idea Voda=one !irte+ Re+ianceTata
*DM!C
2all Attempt 1 >@& 60 @> =0 >&
Eloc!ed 2all
Rate ( ).&> @.6= .>1 @.1= 6. &.@0
2all Setup
Success
Rate (6)
6.@& 6>.1= 6.>& 61.6= @&.>1 66.1=
Dropped
2all Rate
(&)
.1@ &.@ .&@ @.0 1>.&6 0.@
R: "uality
(0B) (6)@&.=6 61.1& 60.=> @.& @.= 66.=@
8andover
Success
Rate 6
6>.@ 6@.= 6.1 6.6 6=.@= 6.1&
16. The Drive test resu+ts revea+ed that (ost o= the o-erators are not (eeting the )ench(arks o=
net.ork re+ated -ara(eters The, =ai+ed to achieve the )ench(arks due to 3igh B+ock *a++ Rate4 3igh
Dro- *a++ Rate4 5o. *a++ Setu- Success Rate 6 -oor R@ >ua+it, 3o.ever4 as (entioned ear+ier4 thisresu+t re=+ects on+, the net.ork conditions on the route =o++o.ed ), the Test vehic+es and as
deter(ined during the da, and ti(e o= the Drive test

8/18/2019 IDT_ _short final.pdf
http://slidepdf.com/reader/full/idt-short-finalpdf 19/20
IDT Report
TRAI 16
SMM!R0

8/18/2019 IDT_ _short final.pdf
http://slidepdf.com/reader/full/idt-short-finalpdf 20/20
IDT Report&0
1. The issue of call drop is regularly ta!en up y TRAI #ith the 2hief Technology ;fficers (2T;s) of
all the TSPs and certain measures including net#or! optimiCation discussed. They have een advised to
underta!e their o#n Drive tests to effectively optimiCe their net#or!s. 3iven the adverse impact of call
drops on the consumers* the TSPs #ere advised to ta!e initiatives and improve their performance*
including e:ploring suitale compensation for call drops.
&. The TSPs have claimed that follo#ing are the main reasons contriuting to fre%uent call drops
a. Spectrum related issues such as limited spectrum5 delay in allocation of spectrum5
reduction in &3 fre%uency and after the spectrum auction5 and maHor changeover of
fre%uencies #ithin and across the 600 $8C and 1@00 $8C ands on the live net#or!s
for some TSPs.
. Poor coverage due to nonBavailaility of sites for ETS in some areas5 sealing of e:isting
sites5 forced closure of e:isting sites y local odies. During the last si: months around
8%& sites Detai+s at !nne@ure J!KCin $umai and '2" sites Detai+s at !nne@ure JBKCin
Delhi #ere shutBdo#n due to various reasons (sealing of sites y municipal authorities*
R7A*J$9 related issues* o#ner issues).The closure of each site impacts three to four
neighouring sites #hich could result in increased call drops at such locations.
c. J$9 radiation issues causing fear in the minds of general pulic.
d. Interference issues caused y illegal repeaters* private #ide and repeaters* and other
#ireless devices installed y individuals.
. During the last one and half years the independent auditors appointed y TRAI have conducted
around 00 R9 drive tests* each covering aout 00 route ?ms* totalling in e:cess of aout 1.& la!h route
?ms. Thus* all the states of the country have een covered y at least one R9 Drive Test. Eased on these
tests the TSPs are eing+ have een instructed to ta!e necessary action to improve coverage+%uality in
the identified affected areas.
. TRAI is evaluating the need for a consultation paper on 'Regulatory 9rame#or! on 2all Drops*
ased on availale information and facts* discussions #ith TSPs* independent R9 drive tests*
international est practices and other related issues.
BBBBBBBBBBBBBBBBBBBB