ie tools in construction - small tools spreadsheet · 2018-12-15 · ie tools in construction -...
TRANSCRIPT

Clemson UniversityTigerPrints
All Theses Theses
5-2010
IE Tools in Construction - Small Tools SpreadsheetRonald GoodsonClemson University, [email protected]
Follow this and additional works at: https://tigerprints.clemson.edu/all_theses
Part of the Civil Engineering Commons
This Thesis is brought to you for free and open access by the Theses at TigerPrints. It has been accepted for inclusion in All Theses by an authorizedadministrator of TigerPrints. For more information, please contact [email protected].
Recommended CitationGoodson, Ronald, "IE Tools in Construction - Small Tools Spreadsheet" (2010). All Theses. 822.https://tigerprints.clemson.edu/all_theses/822

IE TOOLS IN CONSTRUCTION – SMALL TOOLS SPREADSHEET
A Thesis Presented to
the Graduate School of Clemson University
In Partial Fulfillment of the Requirements for the Degree
Master of Science Civil Engineering
by Ronald Arthur Goodson Jr.
May 2008
Accepted by: Dr. Steve Sanders, Committee Chair
Dr. William Ferrell Dr. Leidy Klotz

ii
ABSTRACT
This document will explore the development and implementation of a spreadsheet
tool that will provide for effective planning, procurement, and management of “small
tools” on a construction site – small tools are relatively inexpensive items that are usually
handheld. The following five chapters cover the development of the spreadsheet. Both
methodology and the calculation process are explored in detail and all facets of the
spreadsheet are explained. A key component of the development process is that end users
were involved in the entire development process to ensure the spreadsheet met their
needs.
In general, users input several criteria regarding work for different disciplines.
From these inputs the spreadsheet creates appropriate tool distributions over the duration
of the project. Users are able to select an appropriate distribution from a list as well as
customize the spreadsheet to better fit their practices. This document concludes with
suggestions for revision and future development of this spreadsheet tool.

iii
ACKNOWLEDGMENTS
I would like to thank Rick Montgomery and Donnie Chapman of Progress Energy
and Day and Zimmerman, respectively for their help with the small tools spreadsheet and
vendor tool lists. I would also like to thank Dr. Steve Sanders of the Clemson University
Department of Civil Engineering and Dr. Bill Ferrell for serving on my committee and
guiding me through the spreadsheet project. Finally, I would like to thank Dr. Leidy
Klotz for also serving on my committee.

iv
TABLE OF CONTENTS
Page
TITLE PAGE.................................................................................................................... i ABSTRACT.....................................................................................................................ii ACKNOWLEDGMENTS ..............................................................................................iii CHAPTER I. INTRODUCTION .........................................................................................1 II. LITERATURE REVIEW ..............................................................................3 III. METHODOLOGY ........................................................................................5 IV. RESULTS ....................................................................................................16 V. CONCLUSIONS AND FUTURE WORK ..................................................18 APPENDICES ...............................................................................................................21 A: Screenshots from the Small Tools Spreadsheet ...........................................21 B: Instruction Guide for Small Tools Spreadsheet ...........................................26

CHAPTER ONE
INTRODUCTION
This document explains the development of a small tools spreadsheet to aid in the
planning, procurement, and management of small tools on construction sites. In this
context, “small tools” refers mainly to handheld tools that are required on most
construction sites. As all construction projects are different, there is no standard set of
these tools that will fit all of them. However, items such as grinders, chisels, hammers,
and wrenches will appear on most all construction sites, particularly those in the
industrial sector. Small tools can generally be carried by one person and usually cost less
than $500. This will be the convention for this document and the small tools spreadsheet.
Although most would consider small tools expendable, the quantity used on most
construction projects is enough that significant amounts of money can be saved by
effectively managing them. In the past, the procurement and management of small tools
was the responsibility of a person or persons involved in project management. As there
was no set method to plan and manage these tools, everyone did it a little bit differently.
Personal experience, common sense, individual judgment, and to some extent historical
data were all used to decide on which and how many of these tools should be purchased.
Many times, this method was little more than an educated guess as to how many tools
would be required over the project’s duration. This almost always led to too many items
being purchased or running out of a particular tool during the project. Also, since many
tools are not all purchased at the beginning of a project, reorders must be done throughout
the project. The amount of tools on these reorders was again little more than a guess.

2
There should obviously be a better way to determine these tool requirements. Although
these ineffective methods have sufficed in the past, companies could have saved
significant sums of money over the years if they had efficiently managed these small
tools.
There are currently no means to provide for the planning, procurement, and
management of small tools through all stages of a project and match the demand to the
appropriate distribution. Here arises the niche for a way to effectively manage these small
tools. A single tool that would accomplish these goals would prove invaluable in the
construction field if designed in such a way to produce accurate and reliable results and
allow for manipulation to better-fit specific projects.
Considering the nature of this problem, an electronic solution would be desirable.
Also, having this solution on a computer would make the tool more likely to be utilized
by today’s professionals. Microsoft Excel provides a platform that is near perfect for this
application. Most professionals in the fields of engineering and construction have ready
access to Microsoft software, specifically Excel, and are at least somewhat familiar with
it. Also, Excel makes it easy to input and manipulate data and print desirable outcomes.
The goal of this project is to provide a user-friendly Excel based tool that will provide a
plan for the purchasing and management of small tools with a limited number of user
inputs.

3
CHAPTER TWO
LITERATURE REVIEW
As there has been limited research in the area of IE applications in construction, it
is not a surprise that a tool to manage small tools has not been created. Similarly, the idea
of using Microsoft Excel to model tool requirements has not seen research either. That
makes this spreadsheet tool completely new research, which drastically changes the
nature of this document.
It is important to note that this “research project” is not really research at all.
Whereas most traditional research projects involve a great deal of literature review, this
scenario does not call for that. Since there is effectively no pertinent material to review,
most of the research here is in the development and testing of the small tools spreadsheet.
Research is the customary word to refer to this kind of work, so that term will be used in
this document also, for convenience. There has definitely been research taking place
throughout this project, however, even if it is not the traditional type. Investigation would
probably be a better term for the methods used to develop this spreadsheet, as trial and
error and suggestions from others have shaped the final product more than anything else.
The first version of the small tools spreadsheet, an example from a previous
project on which the companies had worked, came from two individuals working for two
separate companies. This example served as a very basic version of the final product. The
ideas and some of the calculations were present in that first version, but the tool was not
user friendly. In fact, the majority of people that looked at that spreadsheet would
probably not even know what it was. It was designed for and used by experienced

4
professionals in dealing with tool procurement and management. The sheet was not
generic and did not allow for modifications. Regardless, the spreadsheet had the makings
of a very useful tool. This is not to say that the final product obtained was just a newer
version of the original spreadsheet. This new version is completely stand-alone and
merely incorporated some of the same mathematical processes and ideas of the
distributions.

5
CHAPTER THREE
METHODOLOGY
This section describes the process used to develop the small tools spreadsheet.
The objective was to develop a tool that could use standard tool lists for specific
disciplines to calculate the discipline’s tool needs over the life of the project and
accurately distribute them across the working period of that discipline. This tool was to
be user friendly and very intuitive, even to someone with limited computer knowledge.
Microsoft Excel was selected to develop this tool for several reasons. First, most
construction management professionals have access and some familiarity with the
program. Also, Excel is inherently user friendly and a great deal of help and
troubleshooting advice exists both electronically and in print. Moreover, few programs
can match Excel in its ability to manipulate and manage data and create easy-to-use user
inputs. All in all, a comprehensive Excel spreadsheet fit the bill perfectly for the
development of the small tools management tool. When completed, this tool would stand
on its own needing no inputs from any other source except its end user.
With the scope and basic ideas of the small tools spreadsheet defined, the task
shifted to figuring out exactly how this spreadsheet would function. Key elements were
defined for three basic portions of the spreadsheet: user inputs, calculations, and final
outputs. Many facets exist in these three categories and their number had to be limited to
maintain the simplicity of the tool.
User inputs are one of the most important components of the spreadsheet. The key
is to have enough input to make the results logical and accurate, yet stay simple enough

6
to maintain the user’s interest and comfort level. In the early stages, the inputs of the
spreadsheet were numerous and simplicity was sacrificed. Through some experimentation
and opinions of the research team, these inputs were condensed to a reasonable number
while maintaining the accuracy of the tool.
To use the spreadsheet, the user inputs several parameters for the work to be done
by each of six predefined disciplines.
1. Boilermakers are craftsmen that fabricate steel and other metals in a variety of
applications including but not limited to boilers and furnaces.
2. The Civil discipline deals with the individuals doing grading and site work.
Drainage is also included in this discipline.
3. Instrumentation/Electrical craftsmen deal with electronic and electrical
components of a project. This often includes wiring and the installation of various
instruments.
4. Millwrights are craftsmen trained to construct and maintain machinery.
5. The Piping discipline deals with all aspects of the installation of piping for any
reason it may exist on the project. It generally deals with metal piping for steam,
water, pressurized air or other gasses as opposed to drainage pipes.
6. Structural steel deals with the fabrication and erection of the structural steel
components of the structure itself.
The user inputs four parameters for each discipline – total work hours, start date, end
date, and appropriate distribution. The work hours referred to here are the total number of
work hours (the term “man hours” is still used by many) needed for each discipline to

7
accomplish their portion of the work. These work hours are assumed to take place
uninterrupted between the start and end dates of that discipline’s work.
Work hours are distributed over the duration of each discipline’s work according to a
user-specified distribution. Four distributions are available in the form of a drop-down
menu. Although Excel has many statistical distributions, these distributions most
accurately model the work hour progression through each discipline’s duration. The four
distributions are:
1. Normal distribution
2. Beta 1 distribution (referred to as “Semicircle” in the spreadsheet)
3. Beta 2 distribution (referred to as “Front-end loaded” in the spreadsheet)
4. Uniform distribution (referred to as “Flat” in the spreadsheet)
These provide the user with the ability to tailor the allocation of work hours to their
specific project and its work distribution. For those not familiar with these statistical
functions, a diagram appears below the input template that shows the graphs of the four
distributions (see Figure A-5). A simplified explanation of the distributions and the entire
input template appears in the instruction manual to the spreadsheet (see Figure B-1).
The Navigation Page provides easy access to all parts of the spreadsheet. As in
any multi-page spreadsheet in Excel, tabs label each sheet along the bottom. The tabs in
the small tools spreadsheet are labeled to show their contents. Users can navigate the
spreadsheet with the Navigation Page or the tabs directly. Either way yields the same
results. More advanced users are likely to use the tabs because of familiarity (see Figure
A-3). The spreadsheet opens to the top of the Navigation Page to help users understand

8
the process of filling out the spreadsheet. The Navigation Page contains hyperlinks to
various parts of the spreadsheet including the User Input page (see Figure A-4). These
links will take users directly to each of the six disciplines to fill out their respective
parameters. Other links go to the remaining user inputs for the entire project. Also, links
exist to take users to the output sheets after the calculations have taken place. All the
linked pages contain links to direct users back to the Navigation Page.
As mentioned above, several user inputs exist for the project as a whole, not
specific to any discipline. Working hours per day and working days per week are the first
two. The spreadsheet defaults to 10 work hours per day and 5 working days per week, but
users can change these values at any point while using the spreadsheet. The cells are
referenced absolutely so users can actually see the impact of altering their work schedule
on tool requirements.
A multiplication factor is the next input. This factor accounts mainly for the theft
of and damage to small tools. As any professional with field experience knows, many
tools are damaged or stolen during a project, especially projects with a high number of
handheld tools. The default value of the multiplication factor is 1.5. In this case, that
means the number of tools for each discipline is increased by 50% to yield the actual
project requirements. This actual value will be different on most projects and must be
determined based on experience and/or historical data. Since the multiplication factor has
such a great impact on the tools required, careful attention should be taken to maintain its
accuracy. Also, the cell in the spreadsheet is absolutely referenced, so it can be adjusted
at any time and tool requirements will update automatically.

9
The final two inputs on the input sheet are the start and end dates for the entire
project. These dates are used to populate some of the calculation pages of the spreadsheet
and are not as crucial to the number of tools required as the other inputs. Users should
always input them properly, however, as the accuracy of the tool distributions will be
affected if all dates are not kept consistent. Users should always keep that in mind that
the accuracy of the spreadsheet tool is completely dependent upon the accuracy of the
input data.
After all user inputs are complete, the spreadsheet’s calculation process can take
place. To recap, the spreadsheet essentially distributes predefined (or user defined) tool
lists over the appropriate working period for each of the six disciplines. The shape of that
distribution is defined by the user on the User Inputs sheet. The four available
distributions will be discussed in greater detail later in this document. For example, the
Piping discipline’s standard tool list is shown in the Piping Tool List sheet. Standard tool
requirements are built in to the spreadsheet, but users can edit them in the Piping Tool
List sheet or whatever discipline is desired. If someone wished to increase or decrease the
number of a particular tool required by the Piping discipline, or eliminate the tool
altogether, that is accomplished by editing the standard tool lists. Again, links exist on the
Navigation Page to help unfamiliar users with this task.
Calculations take place automatically when users input their project information.
Outputs already exist in the spreadsheet; the number of tools required is simply populated
in the existing cells. The spreadsheet contains seven predefined outputs representing
different facets of the overall tool requirements for the project. A sheet exists for the tool
10
requirements for each of the six disciplines. It shows the number of tools required, by
month, over the duration of the project. A consolidated tool list is also present that sums
the tool requirements for all six disciplines for a comprehensive tool list, by month, for
the entire project. As with all parts of the spreadsheet, the Navigation Page provides an
easy means to access all these sheets via hyperlinks. Similarly, each output sheet has a
hyperlink at the bottom of the page directing the user back to the Navigation Page.
There are a great number of other considerations that must be accounted for to
make this spreadsheet useful, user-friendly, and accurate. One of the most important
aspects of the spreadsheet is the ability to use different tool distributions to match
individual project requirements. No two projects are exactly alike and similarly, no two
projects’ tool requirements will be either. Tool requirements will be distributed
differently in all construction projects. However, the number of available distributions
must be limited to create this spreadsheet tool. After extensive discussion, it was decided
that most all projects would approximately fit one of four possible distributions. Users
select one of the four from a dropdown menu on the User Inputs sheet. The four
distributions appear to users as:
1. Normal distribution
2. Semicircle distribution (Beta 1 distribution)
3. Front-end loaded distribution (Beta 2 distribution)
4. Flat distribution (Flat distribution)
Three of these four names are not technically the correct statistical name for their
respective distributions, but they make more sense to someone with limited experience

11
with statistics. These four distributions are technically 1) Normal distribution, 2) Beta 1
distribution, 3) Beta 3 distribution, and 4) Uniform distribution. These names are the
actual statistical reference in Microsoft Excel and are consistent with general knowledge
in statistics. Several knowledgeable individuals were asked about appropriate
distributions for this spreadsheet and the four listed above were finally decided upon. The
fact is that none of these distributions, or any standard distribution for that matter, can
exactly model the tools required on a project. Also, if a distribution was accurate for one
project, there is a high likelihood that it will not match exactly with other projects, no
matter how similar they may be. However, this spreadsheet tool is meant to provide for
the planning, procurement, and management of small tools. This does not require a
“perfect distribution”, but rather a reasonable estimate of the average tool needs over the
project’s duration. For this reason, the spreadsheet’s four available distributions will
serve their purpose just fine. There is a graphic on the User Inputs sheet that shows the
four distributions and their shapes (see Figure A-5).
Recalling, the four distributions are normal, beta 1, beta 2, and uniform. The
preset for the spreadsheet is the normal distribution, and it is likely that this will be the
most utilized. The standard normal distribution is very important to statistics. It is
essentially a bell-shaped curve that is symmetrical about its mean. As this document is
not statistics-related, no further explanation of the normal distribution is warranted. It is
safe to say, however, that the normal distribution will provide a somewhat accurate
representation of tool requirements in most situations. The important thing to take from
the normal and any of the other three distributions is its shape. The bell shape is applied

12
to the tool requirements to create the tool distributions over time. The inherit problem
with using the normal distribution is the fact that the tool requirements are far greater in
the center of the duration than in the beginning or near the end. In reality, the normal
distribution is a little extreme in that regard and that should be kept in mind. Using this
distribution would cause a contractor to obtain a great number of tools over a short
amount of time right before the peak of the work. Also, those tools would no longer be
needed right after that peak took place. Although the normal distribution is somewhat
relevant, a more realistic distribution would probably be the semicircle.
The second available distribution is the semicircle/beta 1 distribution. It appears
to the user as “Semicircle” distribution because of its semicircular shape. This shape
needs little explanation here, as it is simply a symmetrical half circle. This distribution
will also accurately represent the tool requirements much of the time. Both the beta 1 and
normal distributions are safe to assume in cases where the actual tool requirements are
not known. It is likely that the tool requirements on a project will gradually increase with
time to a point, and then gradually decrease until the work is completed. This is modeled
best by the shape of the semicircle and to a lesser extent that of the normal distribution.
The third distribution is the front-end loaded/beta 2 distribution. This appears to
users as “Front-end loaded”. It is still a somewhat semicircle, but the maximum height is
achieved close to the beginning of the distribution. In terms of tool requirements, this
shape would indicate that more tools would be needed early on in the working period and
less towards the end. This should be used when most resources are used at the early
stages of the project. Many companies, having no means to accurately predict the tool

13
requirements, will procure tools in a manner consistent with this distribution. Some
project managers will tend to buy the majority of the required tools at the beginning of a
project so they will be available when needed. This is especially the case when storage
space is of no concern. While this is not the most effective way to procure small tools, it
has proven successful on projects for many years.
The forth and final available distribution is the uniform/flat distribution. It appears
to users as “Flat” because of its shape. The shape of this distribution would indicate that
tools are required at the exact same rate through the entire duration of the work. In some
projects, this might be accurate. This would cause a contractor to purchase most all the
tools to be used on the project and keep them available throughout its duration. Besides a
drastic increase in the very beginning of the project, the tool requirements stay at a
constant level all the way until the end of the work.
Users of this spreadsheet tool should have enough knowledge of their work
environment to know which of the four distributions best suits their needs. It is important
to note that the user selects distributions for each of the six disciplines individually.
Different work crews have different tool needs over time and this option accounts for
that.
Aside from the distributions, there are several other important considerations in
the spreadsheet, most dealing with the spreadsheet’s quality of being user-friendly. This
was one of the most important ideas behind the spreadsheet tool. No matter how accurate
and comprehensive a tool like this may be, it will never see its full potential and

14
usefulness unless it is easy to use. Again, the purpose here is to provide a user friendly
Excel based tool.
When designing the spreadsheet, one of the first things to be decided on was the
user’s level of sophistication, especially with Excel. As outlined in the instruction guide
(see Figure B-1), the spreadsheet tool can be used in two different ways, based on user
sophistication. The “out of the box” version of the spreadsheet will have some of its
capabilities locked. That is, users will not be able to change certain parts of the sheet to
fit their needs. For users with minimal experience in Excel or with small tools
management, this would be an appropriate option.
However, by simply saving the spreadsheet to one’s own computer, the locks can
be removed, allowing users to edit different items, for example the standard tool lists.
This can only be done if users save their own copy of the spreadsheet to their computers.
This higher level of sophistication is applicable to those with prior experience with this
particular spreadsheet or those who have more extensive knowledge with Excel and/or
the management of small tools. This option gives those users the ability to tailor the
spreadsheet to their particular company and their individual projects, further adding to the
effectiveness of this tool. Also, these users can view the calculation process that is hidden
in the standard form of the spreadsheet.
Another aspect of making this spreadsheet user-friendly is having intuitive inputs
and logical outputs. The goal is for users to see how the information they provide is
processed and the outputs it provides. The most comfortable users are with the
calculation process, the more likely they are to fully utilize this tool. This was

15
accomplished by creating easily followed inputs on the User Inputs sheet and easy to read
outputs on the various output sheets. These outputs are nicely packaged and pre-
formatted so users can easily use them immediately. The entire spreadsheet was designed
to be as concise and accurate as possible to gain users’ trust and approval.
A final aspect of the spreadsheet’s effectiveness is perhaps the most significant.
The Navigation Page was created to make the spreadsheet tool easier to use for all users.
As mentioned earlier, the Navigation Page provides links to and from all the appropriate
pages of the spreadsheet. It also, however, provides a simplified set of instructions for
using the spreadsheet tool. If a user opens the small tools spreadsheet, the Navigation
Page is the first thing they see. In fact, the cell that is already highlighted gives simplified
instruction regarding the procedure of completing the spreadsheet. If users follow the
spreadsheet in order, it is likely that they would properly utilize the spreadsheet tool the
very first time they used it, even without prior knowledge of its characteristics. The
Navigation Page makes it very simple to navigate through the entire spreadsheet and back
with just a few clicks. Its addition to the spreadsheet was probably the single most
important step in assuring the tool being user-friendly. A screenshot of the Navigation
Page can be found in Appendix A (see. Figures A-1 and A-2).

16
CHAPTER FOUR
RESULTS
After all was said and done, the final product of this research turned out as well as
could be expected. The final version of the spreadsheet accomplishes all goals set forth
earlier in the project. Although extensive testing has not yet been conducted with those in
the industry, several individuals in the research team have dealt with the spreadsheet
enough to affirm its accuracy. Those who made the spreadsheet happen have agreed that
all objectives were accomplished.
An important part of the further refinement of the spreadsheet tool is trials by
industry experts and others in academia. Because of time and deadline limitations, this
was not able to take place before the creation of this document. However, several
individuals will have a copy of the spreadsheet in the near future for them to critique.
Their opinions will further align all parts of the spreadsheet and make the final product
that much more user friendly.
Along with others’ suggestions, a few other changes have already been foreseen
before the final spreadsheet product is produced. A few nuances still exist in the current
version of the spreadsheet, most of which deal with automatic population of cells and
making printing easier and more concise. Most all these issues will be resolved using
macros. One criteria set by the team early on was that the spreadsheet would be easy to
view and to print. The viewing part has already been accomplished but more work needs
to happen in the printing area. The goal is to have pre-formatted print areas set in the
default spreadsheet that will adjust themselves based on work duration and number of

17
tools required. This will take some more time and likely the development of more
macros. Some of the programming issues, advanced macros for example, were beyond
the scope of this portion of the project. However, the framework for the final spreadsheet
already exists and other team members are able to finish off these last few issues.
Besides these few nuances, other issues will likely arise when more individuals
begin testing the spreadsheet. Hopefully, these will all be small issues and will be easy to
resolve. In the construction of a tool such as this one, all details can never be completely
resolved until a great deal of time has been spent testing the tool. At that point, the
spreadsheet defined in the scope of this project will be functioning as near perfect as
possible.
Looking back, things could have been done differently during the development of
the small tools spreadsheet. Since several individuals were involved in the construction of
the spreadsheet tool, coordination and timing of submittals could have been more
efficient. Perhaps more could have been done to the spreadsheet, especially testing, if the
final product had been reached a month earlier or more. It is likely that the few remaining
nuances could have already been resolved and some testing could have already taken
place. It is important to keep in mind that this spreadsheet tool was essentially the first of
its kind. Since nothing like it had been built by anyone, the entire experience was a
learning process for everyone involved. Overall, the spreadsheet project was a success,
providing a brand new tool to be used in many small tools management applications.

18
CHAPTER FIVE
CONCLUSIONS AND FUTURE WORK
Although the development of the small tools spreadsheet was a learning process
through all its stages, the spreadsheet turned out very well. Overall, all objectives were
met and the tool is very effective. Basically, the spreadsheet turned out to accomplish
everything it was intended to. User friendliness was always maintained and all
calculations took place when and how they were supposed to. The overall simplicity of
the spreadsheet was also maintained throughout its development both in looks and
functionality. Automatic population and layout were also achieved. All these and other
factors create the overall effectiveness of the tool.
In regards to lessons learned, a few things should have probably been done
differently in the development of the spreadsheet. As is the case in many projects, scope
is not fully defined until a ways through the work. That was the case here, as the actual
specifics of the spreadsheet tool were not fully defined until nearly half way through this
portion of the research. Had the team known exactly what it was aiming for earlier on,
more could have been done with the spreadsheet in the time given. Also, a computer
expert was assigned to the project later on during the spreadsheet’s development. Had
this individual been available during the entire process of developing the tool, the entire
thing would have gone much more smoothly. Many of the limitations of the tool are due
to Excel and the limited Excel knowledge of the research team. The computer expert was
able to bypass most of these limitations or at least provide partial solutions. This person
has the knowledge to manipulate Excel much more effectively than those who put most

19
of the spreadsheet together. In the end, however, the computer expert was able to resolve
almost all issues in the given time. Still, more could have been done earlier, as with many
parts of this project.
Since this spreadsheet was the first of its kind, it will provide the groundwork for
more in-depth and comprehensive programs to be built later on. The basic idea of the
spreadsheet – taking defined tool lists and accurately distributing them over the duration
of a project – was the most important accomplishment of the spreadsheet tool. Although
the spreadsheet definitely accomplishes this goal, it can be expanded to provide even
more tool management opportunities. For one, this idea does not have to be limited to
small tools. Other construction tools and equipment could also apply, as long as their
distributions could be accurately modeled. Materials and consumables could also be
planned and managed this way, with minimal alteration to the spreadsheet. Although
laborers are surely not tools of any sort, a process similar to that in the small tools
spreadsheet could manage individual workers. The same principles apply to all these
examples as well as many others.
Staying with the idea of managing small tools, this spreadsheet tool could be
taken by another team and formed into something even more useful with greater
accuracy. If the current framework was maintained, more detail and user inputs could be
added to further tailor the spreadsheet to individual projects. For example, more
distributions could be added to better match a project’s requirements. More options could
be made for users including the selection of disciplines and crew mixes. More than one
standard set of tools for each discipline could be added as well. For example, a power

20
plant type project might warrant a specific set of tool lists and a manufacturing facility
might warrant a completely different set. More options could be added to the calculation
processes as well. For example, a tool manager might want to see a more specific
breakdown of the tool requirements than by month. One may desire to see them by week
and that option could be created. All these add to the required user sophistication and
familiarity with the spreadsheet, which was generally avoided. The purpose of this
spreadsheet was to provide a simplistic model of the too requirements to give manager
something to go on while maintaining a low level of required sophistication, especially
with technology.
A final path this spreadsheet could venture down would be the use of computer
programs besides Excel or the spreadsheet being linked to one such program. If a simple
computer program could be written such that users input simple parameters, similar to the
ones in the User Inputs sheet (see Figure A-4), in a non-Excel program, it would allow
more individuals to use the spreadsheet’s capabilities, even if they were not comfortable
with Excel. Ideally, those inputs could be entered, Excel or some other programs could
perform the calculations in the background, and the program could provide easy to read
outputs – tools over time. This will involve a great deal of development, which was out of
the scope of this project. Although this alternative seems very effective, it limits the
user’s ability to edit tool lists and other specifics, all of which must be taken into
consideration. Excel is likely the best platform to build such a tool, and that is why it was
used for this project.

21
APPENDICES
Appendix A
Screenshots from the Small Tools Spreadsheet
Figure A-1: Top of Navigation Page

22
Figure A-2: Bottom of Navigation Page
Figure A-3: Tabs for easy navigation
Figure A-4: User inputs sheet (user inputs shown in yellow)

23
Figure A-5: The four available distributions
Figure A-6: Sample of the Master Tool List
24
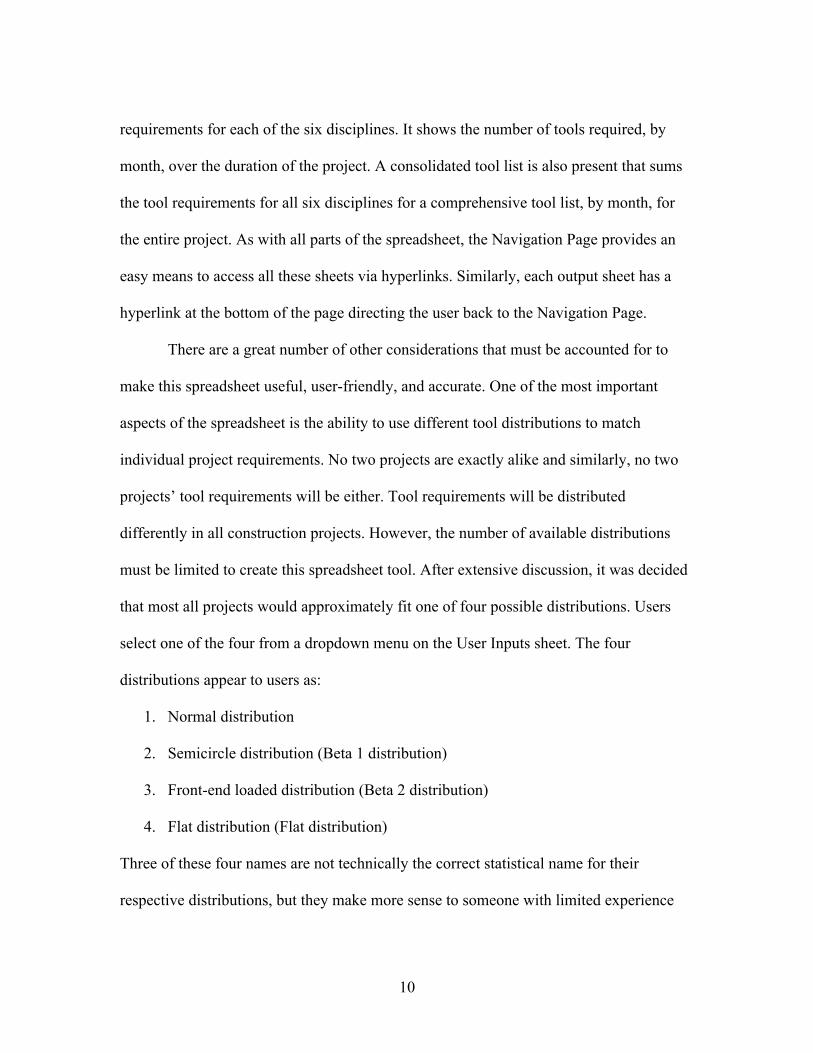
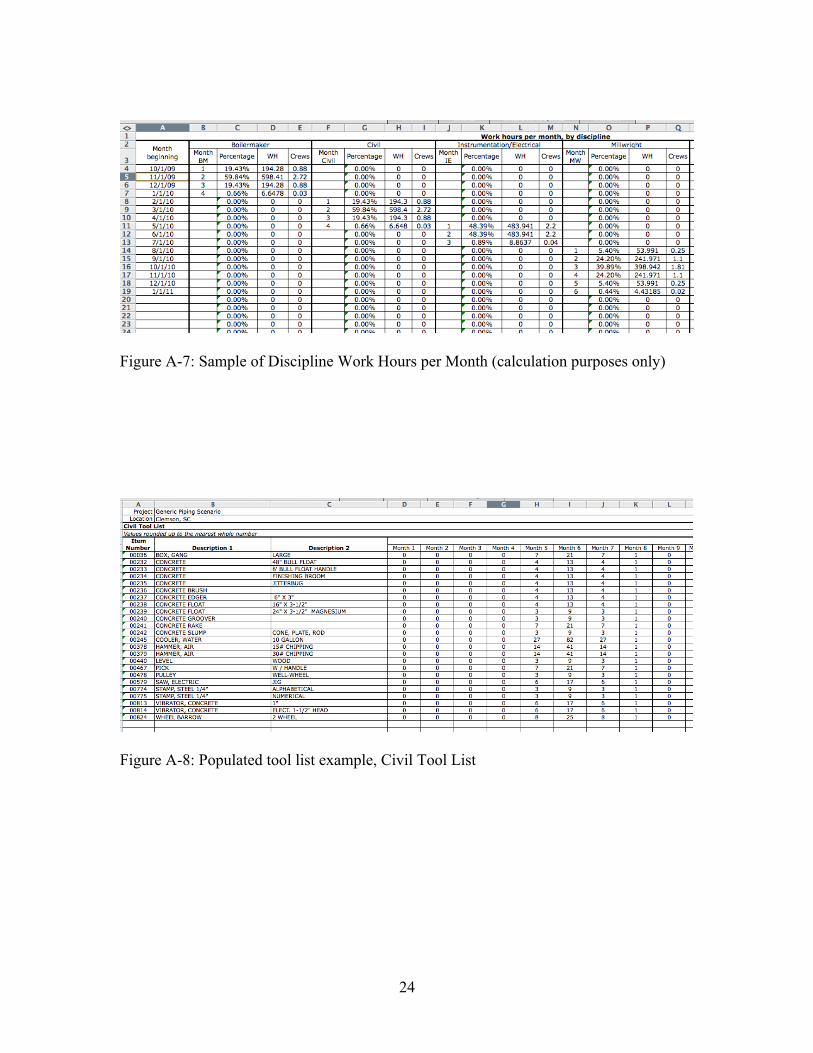
Figure A-7: Sample of Discipline Work Hours per Month (calculation purposes only)
Figure A-8: Populated tool list example, Civil Tool List

25
Figure A-9: Populated tool list example, Consolidated Tool List

26
APPENDIX B
INSTRUCTION GUIDE FOR SMALL TOOLS SPREADSHEET
Figure B-1: Instruction Guide for Small Tools Spreadsheet