iea global industry dialogue expert review … review workshop the european chemical industry...
TRANSCRIPT

1
IEA Global Industry Dialogue
Expert Review Workshop
The European Chemical Industry perspective
7 October 2013 William Garcia

The European chemical industry in a
nutshell
Sales 2010-2011
2
Petrochemicals118.1
Basic Inorganics66.6
Polymers118.1
Specialty Chemicals
125.6
Consumer Chemicals
63.0
2010: 491 billion
Petrochemicals133.1
Basic Inorganics72.2
Polymers131.0
Specialty Chemicals
136.4
Consumer Chemicals
66.3
2011: 539 billion
Trade 1999-2011 Source: Cefic, 2012
Facts-and-Figures
The EU chemical industry is a network of 26.000
companies, a direct employer to 1.2 M It contributes
about €500 billion to the EU economy and €42 billion to
its positive trade balance

3
95% of Manufacturing Rely on Chemical Building Blocks

4
Why this roadmap ?
Cefic initiated the roadmap study to explore opportunities and risks for the European chemical industry
Roadmap timeframe: 2020 – 2050
Based on four scenarios: each differ in terms of policy targets in Europe and rest of world, energy and feedstock costs, and speed of innovation
Cefic commissioned ECOFYS to perform analyses and bring forward key conclusions and recommendations from their independent viewpoint, all in close collaboration with sector

5
FACTS AND FIGURES
European chemistry for growth :
“Unlocking a competitive, low carbon and efficient future”
William Garcia 7 Oct. 2013

6 6
Energy Efficiency
The EU chemicals industry has reduced energy intensity by 48.7 per cent since 1990

Development of chemicals production (production
index based on value added) and greenhouse gas
emissions (indexed, 1990 = 100, Cefic, 2012a) 7
GHG
emissions
The EU chemicals industry has reduced GHG emissions ( Tier1) by 50 per cent since 1990

8
Energy Matters for Chemicals Sector
Used as feedstock AND to power plants
• Global energy demand 42 EJ/yr (two thirds feedstock)
• 10% of global (30% of industrial) demand
• Fastest growing industrial consumer
18 chemical building blocks account for 80% of energy
demand
• Average energy costs about 50%, but key building blocks
have cost impact of up to 85%
95% of manufacturing require chemistry inputs
• “Competitive Energy” biggest sector concern & growing
issue for EU economy’s broader manufacturing base

9
Energy consumption per chemical industry subsector, 2010- source Ecofys
1,492 1,613
805
354 386
246
53
0
200
400
600
800
1 000
1 200
1 400
1 600
1 800
Energ
y
Feedst
ock
Energ
y
Feedst
ock
Energ
y
Energ
y
Energ
y
Petrochemicals Basic Inorganics Polymers SpecialtyChemicals
ConsumerChemicals
PJ
/ year
Electricity
Ren.Heat
Biomass
Natural Gas
Oil
Coal
Source: Ecofys
Energy
consumption mix
The EU chemicals industry is heavily dependent on gas and oil

10
Uncompetitive level playing field for the
European chemical industry

11
New World to 2020 requires new
course of actions
11
Source: E.ON
Europe was in a comparable cost situation to the United States for the production of ethylene.
The availability of natural gas as a low-cost energy source has resulted in lower-cost ethane and ethylene.

Energy costs as a proportion of sales for the five
subsectors of the chemical industry subsectors in
2010
12
Energy costs
0%
4%
8%
12%
16%
Petr
o-
chem
icals
Basic
Inorg
anic
s
Poly
mers
Specia
lty
Chem
icals
Consum
er
Chem
icals
[%
]
•Source: Ecofys
cost for industry
EU + Member State level
Spread for rest of the world
ambition level energy
and climate policy
Policy costs
Policy ambition levels and associated costs in the
European Union and in the rest of the world
Source Ecofys
EU Energy &
Policies costs
To stay competitive, the EU chemicals industry needs a access to more competitive energy mixes and policy environment

13
The world has changed tracks from
2007 assumptions
2007 2013
Economic growth Economic crisis: EU competence ?
Global agreement “by 2009” Fragmented climate policies
Climate Change = “EU Leadership” EU marginalised
“Depleting fossil energies: surging
prices”
US shale gas revolution, EU investment
leakage
Liberalising EU Energy market Regulated Energy markets ?
Uniform pan-european RES policy well
accepted by public
Scattered, unefficient and costly RES
policy implementation leading to
uncompetitive costs
“Rolling out CCS” Lagging implementation of CCS
Nuclear energy part of the EU mix Post Fukushima – less/no nuclear
ETS as ‘flagship’ policy tool to achieve
target at low cost
“backloading, CSCF, carbon leakage
list, LRF”, EU / national policy potpourri
Facts have changed and costs continue to rise…

14
ROADMAP KEY FINDINGS
European chemistry for growth :
“Unlocking a competitive, low carbon and efficient future”
William Garcia 7 Oct. 2013

15 15
1/3 of Avoided EU GHG Emissions via Chemistry
Key findings Chemical industry products enable significant improvements in energy efficiency and GHG emission reductions in all sectors.

16
Consequences of Level Playing Field:
Growth & Jobs for EU industry
EU production growth and EU demand. Key findings
0
200
400
600
800
1,000
1,200
2010 2020 2030 2050
Demand under thescenarios studied
Production assuminga global level playing
field
Production assuminga unilateral EU
climate action
Bill
ion o
f 2010 €
/ year
Source: Ecofys

17
Consequences of Unilateral Action:
Exporting Production & Increasing Global GHGs
Competitiveness of entire European chemical industry value chain threatened due to diverging energy and policy costs.
Key findings

18
In a global playing field scenario, energy efficiency, N2O abatement and changes in the fuel-for-heat mix could result in 15% absolute reduction of GHG emissions in 2030 vs. 2010 (e.g. 30% decrease in GHG emission relative intensity). All options rely on innovation.
Key findings
Deeper reductions technically possible by power sector decarbonisation, CCS

19
POLICY ASKS TO 2030
European chemistry for growth :
“Unlocking a competitive, low carbon and efficient future”
William Garcia 7 Oct. 2013

20
Addressing the EU Policy makers: Key messages inspired from the Roadmap
The EU chemicals industry (ECI) can make a significant contribution to the changes needed for a low carbon future. The ECI products enable energy efficiency and greenhouse gas emission reductions in all sectors.
Energy is a fundamental input for the European economy and affordable energy is essential for economic growth. The energy costs in the European Union relative to those in competing regions are a key factor in global competitiveness since EU companies cannot pass on EU policy costs.
The ECI acknowledges the EU vision of a sustainable, globally competitive low-carbon economy. The issue is not whether the European Union should aim for such a future but how?
The European Union should continue to pursue a global agreement with equitable burden towards a global carbon price. In the absence of such an agreement, the European Union should pursue its objectives by measures that reduce the energy cost differential with its major competitors.
The EU is at the crossroads. Short-term increases in the policy-driven cost of energy will inhibit investments needed to realise the longer-term benefits of innovation.
Promoting innovation and market-driven competition would result in affordable energy, increasing investment and competitiveness.

21
Elements of Cefic position on
integrated EU energy & climate policy
Energy: ensure predictability, security, affordability,
coherence: 3rd energy package towards the completion of the internal energy market,
Diversify and use all energy sources (including unconventional sources of energy),
Gradually phase out subsidized RES
Climate : change course to apply a realistic climate approach to the EU, based on a substantial global agreement In the absence of a global agreement, the Commission should provide a
realistic range for a pan-European climate goal, taking scenarios into
account.
Support ETS beyond 2020: Structural changes needed to introduce more flexibility and avoid short- term fixes like backloading

22
Enable economic growth: Inclusion of a 20% of industry share in GDP by 2020 and beyond
Keep the entire chemicals manufacturing chain in Europe
Move away from absolute energy consumption cap
Focus on innovation: Build on sector specific knowledge and ability to deliver breakthrough technologies
Elements of Cefic position towards
2030

23
SHALE GAS - A GAME CHANGER Impact for the European Chemical Industry
William Garcia 7 Oct. 2013

24
Europe has potential

25
Impact of shale gas on the EU Chemical
Industry

26
Impact down the Value Chain
27
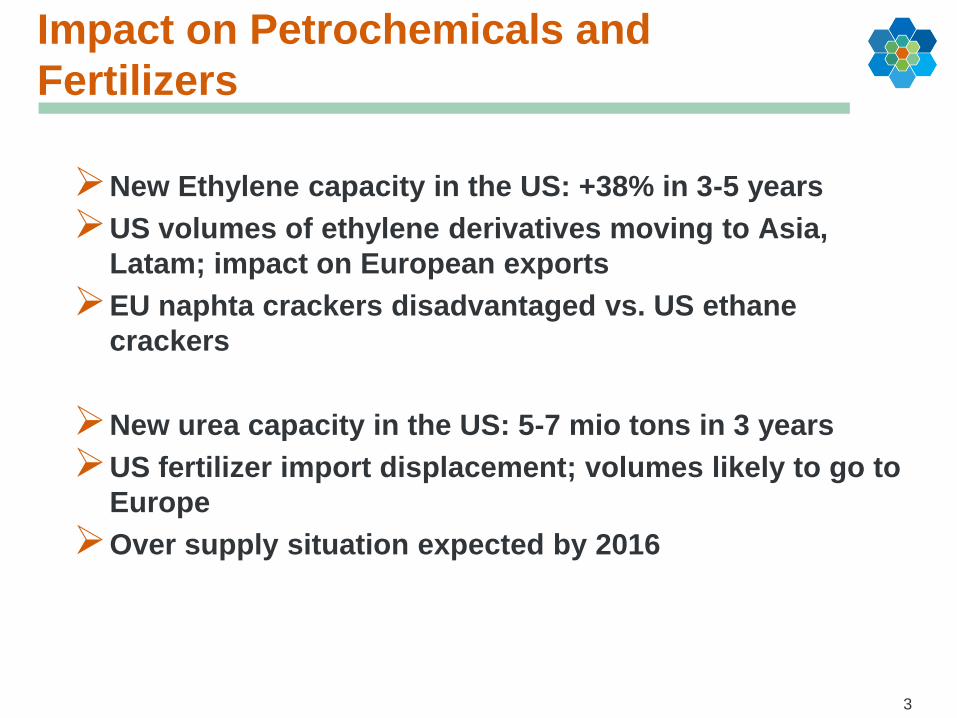
Impact on Petrochemicals and
Fertilizers
New Ethylene capacity in the US: +38% in 3-5 years
US volumes of ethylene derivatives moving to Asia,
Latam; impact on European exports
EU naphta crackers disadvantaged vs. US ethane
crackers
New urea capacity in the US: 5-7 mio tons in 3 years
US fertilizer import displacement; volumes likely to go to
Europe
Over supply situation expected by 2016
3

28
Low US Ethane Costs boost US Crackers’
competitiveness
The cost curve is built on the cumulative petrochemical capacity from the lowest cost producers (in the Middle East) to the highest cost producers (in Northeast Asia).
US ethane-based ethylene producers have moved to the lower end of the global cost curve, after only the Middle East and Canada.
Source: ACC: Shale Gas Study, May 2013

29
Comparing Global Electricity Prices Cost Advantages for US Industry
Japan Germany China USA Canada India Russia
Average electricity price for industry
in $ per Mwh (Source: BDI)

30
Cost Advantages for US Industry Negative Impact for EU Energy intensive Sectors
Source: ERT
Energy cost as % of production costs
in energy-intensive industries In the chemicals sector,
competition with the U.S., with relatively equivalent labour costs, is intensifying due to significant differences in energy prices.
According to US EIA the industries which are affected mostly by lower gas prices are bulk chemicals and primary metals.
Low electricity prices for industry impact on future investment decisions.


© ECOFYS | |
Cefic Roadmap data flow diagram
02/04/2013 Ecofys

34 34
Roadmap Energy and GHG emissions
2010 baseline

© ECOFYS | |
Cefic Roadmap Scenario narratives (1)
02/04/2013 Ecofys
Continued
Fragmentation Isolated Europe
Differentiated
Global Action
Level Playing
Field
Economy-wide GHG emission reduction target in Europe by 2050 compared to 1990
An economy-wide 40% target, 46% for industry.
An economy-wide 80% target, similar for industry.
An economy-wide 80% target, similar for industry.
Global ambition in line with 2 °C target (50% reduction), uniform global carbon price signal determines where abatement takes place.
Level of harmonisation
No global climate change agreement, continued fragmentation of worldwide energy and climate policies with low global and less ambitious EU ambitions.
No global climate change agreement, continued fragmentation of worldwide energy and climate policies the EU is the only region with ambitious climate ambitions.
Global commitment in line with 2 °C target. Country ambition levels and policies differentiated with limited global convergence.
Global climate change agreement in line with 2 °C target. Uniform global carbon price signal, e.g. via fully linked emissions trading systems.
Main features of the energy and climate policies in Europe
The current EU Policy Initiatives are implemented. Actions beyond the current initiatives are not undertaken.
On top of the current EU policy initiatives, Europe’s abatement is driven by carbon pricing for all sectors of the economy where all energy sources can compete on a market basis with no specific support measures for energy efficiency and renewables.

© ECOFYS | |
Cefic Roadmap Scenario narratives (2)
02/04/2013 Ecofys
Continued
Fragmentation Isolated Europe
Differentiated
Global Action
Level Playing
Field
Fossil fuel prices Strong increase in global energy use resulting in increasing fossil fuel prices. No convergence in fossil fuel prices.
As a result of global action, fossil fuel use and price increases are limited. No convergence in fossil fuel prices.
Industrial electricity prices
Electricity price of 107 € / MWh in 2030, stabilisation afterwards, continued differences in electricity price with rest of the world.
Industry pays ~65% of average retail electricity price.
Electricity price of 132 € / MWh in 2030, stabilisation afterwards, continued differences in electricity price with rest of the world.
Industry pays ~80% of average retail electricity price.
Electricity price of 96 € / MWh in 2030, stabilisation afterwards, continued differences in electricity price with rest of the world.
Industry pays ~60% of average retail electricity price.
Electricity price of 128 € / MWh in 2030, stabilisation afterwards; converging electricity prices globally.
Industry pays ~80% of average retail electricity price.
CO2 prices (in constant 2010 € / t CO2)
2030: 33 2050: 53
2030: 44 2050: 221
2030: 54 2050: 276
2030: 37 2050: 194

© ECOFYS | |
Cefic Roadmap Scenario narratives (3)
02/04/2013 Ecofys
Continued
Fragmentation Isolated Europe
Differentiated
Global Action
Level Playing
Field
Scope of carbon pricing, allocation and differences with rest of the world
Existing ETS scope. Continued, but declining free allocation for direct emissions in the 2030–2050 period, no free allocation for power sector. No effective CO2 price signal in rest of the world.
ETS and non-ETS sectors have equal CO2 prices from 2020 onwards. No free allocation after 2020. No effective CO2 price signal in rest of the world.
ETS and non-ETS sectors have equal CO2 prices from 2020 onwards. Continued, but declining, free allocation for direct emissions, no free allocation for the power sector CO2 price difference taking free allocation of allowances into account with the rest of the world at most 30 € / t CO2.
ETS and non-ETS sectors have equal CO2 prices from 2020 onwards. No free allocation after 2020. Uniform, global CO2 price signal.
Innovation
Low. Predominantly small incremental innovations without major development and deployment of breakthrough technologies.
Medium. Innovation in Europe is somewhat accelerated due to the high CO2 prices in this scenario.
High. Global action has a positive stimulus on the development and deployment of breakthrough technologies resulting in significant technology spillovers between world regions.

© ECOFYS | |
Cefic Roadmap: Resulting final energy use and energy
efficiency improvements 2010–2050 (in PJ / year)
02/04/2013 Ecofys
> Upper lines reflect energy use with projected production and 2010 energy intensity

© ECOFYS | |
Cefic Roadmap: Resulting GHG emissions and contributions
of GHG emission reductions 2010–2050 (in Mt CO2e / year)
02/04/2013 Ecofys
> Upper lines reflect GHG emissions with projected production and 2010 GHG emission
intensity;
> Emissions are scope 1 and 2 only and for that reason exclude upstream emissions from
fossil fuel exploration and production, emissions from the cultivation of biomass and
emissions related to end-of life treatment of chemicals outside the scope of the chemical
industry.

© ECOFYS | |
Cefic Roadmap : projected energy and emission profile –
summary
02/04/2013 Ecofys
> By 2030, final energy use (excluding feedstock) decreases slightly in the Continued
Fragmentation and Differentiated Global Action scenarios;
> The same is valid for the Isolated Europe scenario, but this scenario shows a sharp
decline in energy use beyond 2030;
> Energy use is growing by 1% from 2010 to 2030 in the Level Playing Field scenario,
caused by the increased European production in this scenario and a continued net export
position of the European chemical industry;
> By 2030, three options (energy efficiency improvements, a change in the fuel mix for
heat generation and N2O emission abatement) together, which remain under control of
the chemical industry itself, have the potential to reduce GHG emission intensity by
about 40% as compared to a situation without further improvements in the GHG
intensity beyond 2010;
> By 2050, this is about 55%;
> Compared to 2010 levels, these options would reduce GHG emissions by 15% in 2030
with stabilisation around these levels towards 2050;
> Deeper reductions are possible by decarbonising electricity production and by CCS (with
many challenges and barriers);

© ECOFYS | | 02/04/2013 Ecofys
> Bio-based feedstock use most dominant in Specialty and Consumer Chemicals;
> In the Continued Fragmentation and Isolated Europe scenarios the driving forces are the
development of bio-based routes and increase in the oil price relative to the biomass
price;
> In the Differentiated Action and Level Playing Field scenarios, bio-based routes are
expected to be quicker developed and used due to the CO2 price signal.
0
500
1,000
1,500
2,000
2,500
3,000
2010 2020 2030 2050
Biomass (feed)
Natural gas(feed)
Oil (feed)
0
500
1,000
1,500
2,000
2,500
3,000
3,500
4,000
4,500
2010 2020 2030 2050
0
500
1,000
1,500
2,000
2,500
3,000
3,500
4,000
4,500
2010 2020 2030 2050
0
500
1,000
1,500
2,000
2,500
3,000
3,500
4,000
4,500
2010 2020 2030 2050
0
500
1,000
1,500
2,000
2,500
3,000
3,500
4,000
4,500
2010 2020 2030 2050
PJ
/ year
PJ
/ year
Source: Ecofys
Continued Fragmentation Isolated Europe
Differentiated Global Action Level Playing Field
Cefic Roadmap: Bio-based feedstock – scenario results

© ECOFYS | |
Cefic Roadmap: process efficiency improvement results per
subsector ( see DISCLAIMER on next page)
02/04/2013 Ecofys

© ECOFYS | |
> When interpreting the results on the previous slide, take into consideration:
– Not based on individual product assessment, all products in subsector assumed to
have similar potential;
– These potentials are NOT autonomous developments, but – especially for “Consumer
Chemicals” and “Specialty Chemicals” require significant innovation and deployment
of new technologies;
– Underlying information is stronger for subsectors “Other Petrochemicals”, “Other
Basic Inorganics” and “Polymers” than for subsectors “Consumer Chemicals” and
“Specialty Chemicals”;
– Improvement potential for “Consumer Chemicals” and “Specialty Chemicals”
includes effect of likely increased selectivity and thereby reduced upstream energy
use.
02/04/2013 Ecofys
DISCLAIMER: process efficiency improvement results per
subsector

© ECOFYS | |
Cefic Roadmap: heat sources assumed in the four scenarios
02/04/2013 Ecofys
0%
20%
40%
60%
80%
100%
2010 2020 2030 2050
Geothermal heat
Biomass
Natural gas
Oil
Coal
0%
20%
40%
60%
80%
100%
2010 2020 2030 2050
0%
20%
40%
60%
80%
100%
2010 2020 2030 2050
0%
20%
40%
60%
80%
100%
2010 2020 2030 2050
0%
20%
40%
60%
80%
100%
2010 2020 2030 2050
Continued Fragmentation Isolated Europe
Differentiated Global Action Level Playing Field
Share
in h
eat sourc
eS
hare
in h
eat s
ourc
e
Source: Ecofys
> This figure refers to generic subsectors only and excludes increase of bio-based
production.

© ECOFYS | | 02/04/2013 Ecofys
7F End-of-pipe abatement – 2050 annualised investment
costs for combustion sources
> Investments (Capex) annualised with IRR=12%, 15 years
> Large influence of the type of subsector
> Cost uncertainty is substantial

© ECOFYS | |
> In CF scenario, no CCS applied (neither existing nor new stock);
> Until 2030, assumed CO2 prices do no yield economically attractive abatement of CO2 via
CCS;
> By 2050 – in all decarbonisation scenarios – CCS is, to various degrees, attractive for all
subsectors, however:
1. Estimated costs of CCS only become reality if CCS is applied on a large scale;
2. Some sites have site specific limitations towards the use of CCS;
3. Many public acceptance and legal issues need to be overcome;
4. Additional energy use related to CCS remains a drawback and will continue to play a
role in the public debate on CCS.
> Provided that most of these barriers could ultimately be overcome towards 2050, 90%
CCS is assumed for Petrochemicals, Other Basic Inorganics, Polymers, cracker products
and ammonia;
> For Specialty Chemicals and Consumer Chemicals, 75% CCS due to limited plant size is
assumed;
> For Isolated Europe this is a positive assumption, since CCS in this scenario will result in
significant additional costs compared to non-EU producers.
02/04/2013 Ecofys
7F End-of-pipe abatement – explanation of scenario choices

© ECOFYS | |
Cefic Roadmap: Cracker products – scenario results (1)
> Energy intensity develops best in the Level Playing Field scenario, due to the highest
share of new stock, and due to the implementation of the ethanol-to-ethylene route,
which has a relatively low energy demand;
> Energy intensity improvement in the Isolated Europe scenario is lowest, as the share of
new and thus improved plants is lowest;
> Energy use would be higher if production of ethanol from biomass had been included.
This energy use is assumed to take place outside the European Chemical Industry. This
only affects the lower line of the graph in 2050;
02/04/2013 Ecofys

© ECOFYS | | 02/04/2013 Ecofys
> In the Continued Fragmentation scenario, the energy efficiency of stock operating in
2010 is expected to improve by 14% (2030) and by 23% (2050) compared to 2010. In
the Differentiated Global Action scenario, this is 21% (2030) and 34% (2050);
> Improvement rates for the other scenarios are in between;
> For new stock an improved traditional cracker is the dominant technology, combined
with CCS to a significant extent after 2030 in the Isolated Europe scenario, and
combined with CCS and ethanol and woody biomass as feedstock after 2030 in the
Differentiated Global Action and Level Playing Field scenarios;
> CCS: Maximum penetration of 90% in 2050;
> Production projections were made for the subsector Petrochemicals as a whole, not
specifically for cracker products. Production projections for cracker products are thus
assumed to be identical to those of the subsector Petrochemicals. In practice, it is
expected that in the Continued Fragmentation, Isolated Europe, and Differentiated
Global Action scenarios, part of the existing cracker capacity will close and that no new
installations will be built to replace it:
> In the absence of any investments in new installations, production would gradually
decline towards 2050;
> This would lead to a development of the energy intensity equal to that for stock
operating in 2010, hence to a much lower decrease in energy intensity.
Cefic Roadmap: Cracker products – scenario results (2)

© ECOFYS | |
> All plants are expected to have installed abatement technology with an average
emission of 90% below the 2010 level;
> By 2020 all plants are expected to have installed abatement technology with an average
emission level of 0.7 kg N2O per tonne of nitric acid, decreasing further to an average of
0.4 kg in 2030 and 0.3 kg in 2050;
Cefic Roadmap: Nitric acid – scenario results (1)
02/04/2013 Ecofys

© ECOFYS | |
Cefic Roadmap: Nitric acid – scenario results (2)
02/04/2013 Ecofys
> Investment costs for N2O abatement, expressed in their equivalent CO2 abatement
costs, range from 7 to 190 € / t CO2e, depending on the type of measure, the current
layout of the plant and temperatures of the tail gas;
> In general, these measures are cost-effective and their implementation does not depend
on the scenario;
> New nitric acid plants built after 2020 can achieve capture rates of 95% for inbuilt
technology and 99% for end-of-pipe technology, which corresponds to emission levels of
approximately 0.4–0.1 kg respectively of N2O per tonne of nitric acid produced. An
average capture rate of 96% is taken into account for new stock;
> The very small difference observed between the scenarios is due to shares of stock
operating in 2010 and new stock not being the same in all scenarios;
> In this Roadmap, it is assumed that N2O emissions from the production of other
chemicals (adipic acid, glyoxal and glyoxylic acid and caprolactam) follow the same
reduction pathway as the N2O emissions from nitric acid production.

51
2013 Course correction towards 2030
Fragmented climate policies Align first with major emitting economies
US shale gas revolution, EU investment
leakage
Foster creation of a real integrated pan
European energy market- Explore all
energy opportunities
Regulated Energy markets Innovate, first make RES competitive,
develop cross-border connections
Energy uncompetitive costs Affordable energy and competitive costs
for industry and consumers
Lagging CCS roll out Avoid declare CCS as the only
alternative to GHG emissions reduction.
Foster emerging innovative processes
like H2 or CCU beyond 2030.
Post Fukushima – less nuclear energy in
the EU mix
Use all sources, avoid costly exclusions
Many attempts to higher cost of CO2 in
the EU (backloading, CSCF, carbon
leakage list,
Review ETS towards low-cost, dynamic
tool, no more multitude of overlapping
targets
The world changes,
EU 2030 strategy needs “update”…

52
Support ETS beyond 2020:
Dynamic Allocation based on actual production:
Actual instead of fixed (‘frozen’) historic production level
“True up” (s. Australian scheme)
Cap (‘total’) for entire economy, relative cap for industry corresponding to actual growth
ETS visibility beyond 2020, therefore no «excess allowances» issue
52
Cefic key messages on ETS post 2020

53
Support ETS beyond 2020:
New Entrants Reserve (NER) serves as allowances source for growth and as sink in times of recession; NER left-over transferred to next trading period (not lost, not auctioned off)
Benchmarks based on weighted average to avoid carbon leakage
Complementary unrestricted indirect allocation to provide predictability and to avoid carbon leakage
53
Cefic key messages on ETS post 2020

54
Support ETS beyond 2020:
Allocation based on actual production
No over-allocation, no excessive scarcity: no dramatic CO2 price shifts
Must Enable efficient growth (current rules insufficient)
No underallocation for most efficient manufacturing:
=Cross-sectoral reduction factor and linear curve = threat
Not solved by proposed EC options!
Minimizes carbon leakage – in contrast to current ETS design
New ideas and cooperative approach appreciated:
flexibility and convergence of ETS and EU and national policies with global developments
54
Cefic key messages on ETS post 2020