ieee cgncc 2014 - buaa.edu.cn
TRANSCRIPT

IEEE CGNCC 2014 August 8-10, 2014, Yantai, China
Program Digest
http://cgncc.buaa.edu.cn

Situation for Dynamic Inverse Control Law
Sen Yang Flight Automatic Control Research Institute
Xianglun Zhang Flight Automatic Control Research Institute
14:00-14:15 SatA6.3
Compound Angle-Synchronizing Control Strategy for Dual
Electro- Hydraulic Motors in HydraulicFlight Motion Simulator
Wenhao Dong Beihang Univ.
Songshan Han Beihang Univ.
Zongxia Jiao Beihang Univ.
Shuai Wu Beihang Univ.
Yifei Zhao Beihang Univ.
14:15-14:30 SatA6.4
Adaptive Robust H Control for Uncertain Discrete-Time
Systems with Time-Varying State and Input Delays
Cunwu Han North China University of Technology
Fengmei Zhang North China University of Technology
Lei Liu North China University of Technology
Song Bi North China University of Technology
Dehui Sun North China University of Technology
14:30-14:45 SatA6.5
Internal Model Tracking Control of an Uncertain Impulsive
Switched System
Jian Chen Beihang Univ.
Chen Bai Beihang Univ.
Qingdong Li Beihang Univ.
Cunjia Liu Loughborough Univ.
Yuan Tian Beijing Institute of Space
Long March Vehicle
Zhang Ren Beihang Univ.
14:45-15:00 SatA6.6
Observer-based Control of One-sided Lipschitz Nonlinear
Systems
Rui Wu Shanghai University of Engineering Science
Wei Zhang Shanghai University of Engineering Science
Jian Li Shanghai University of Engineering Science
Zhiyang Wu Shanghai University of Engineering Science
15:00-15:15 SatA6.7
Robust Attitude Control for Flexible Satellite During Orbit
Maneuver
Long Li Harbin Institute of Technology
Jing Yang Harbin Institute of Technology
Xiaoping Shi Harbin Institute of Technology
Hailong Liu Harbin Institute of Technology
15:15-15:30 SatA6.8
Dynamic Control Algorithm Design of the 6 Wheel-drive
All-terrain Robotic Skid-steered Vehicles
Tong Liu Luoyang Institute of Electro-Optical
Equipment, AVIC
Wei Li Luoyang Institute of Electro-Optical
Equipment, AVIC
Beile Wang Luoyang Institute of Electro-Optical
Equipment, AVIC
Yuqian Li Luoyang Institute of Electro-Optical
Equipment, AVIC
SatA7 APPHIREModeling & Simulation I (Regular Session)
Chair: Junsheng You Air Force Institute of Aeromedicine
Haijun Zhou Xi'an Flight Automatic Control
Research Institute
13:30-13:45 SatA7.1
Research on Modeling of Morphing Aircraft
Bowen Li Xi'an Flight Automatic
Control Research Institute
Haijun Zhou Xi'an Flight Automatic
Control Research Institute
Xianglun Zhang Xi'an Flight Automatic
Control Research Institute
Jun Che Xi'an Flight Automatic
Control Research Institute
Kepu Song Xi'an Flight Automatic
Control Research Institute
13:45-14:00 SatA7.2
Modeling and Modal Responses Analysis of an Unmanned
Small-Scaled Gyroplane
Changle Xiang Beijing Institute of Technology
Xiaoliang Wang Beijing Institute of Technology
Yue Ma Beijing Institute of Technology
Yang Wang Beijing Institute of Technology
14:00-14:15 SatA7.3
An Optimization Method of Aircraft Periodic Inspection and
Maintenance Based on the Zero-Failure Data Analysis
Jun Huang Naval Aeronautical and Astronautical Univ. Yanbo Song Naval Aeronautical and Astronautical Univ. Yongji Ren Naval Aeronautical and Astronautical Univ.
Qingwei Gao Naval Aeronautical and Astronautical Univ.
14:15-14:30 SatA7.4
Background Modeling in Infrared Guidance Hardware-in-loop
Simulation System
Haowen Zhang Beihang Univ. Wulong Zhang Beijing Simulation Center
Yunjie Wu Beihang Univ.
Jianmin Wang Beihang Univ.
14:30-14:45 SatA7.5
Research on Boundary Layer Ingestion Effects of Distributed
Propulsion Configuration
Wenwen Kang Beihang Univ.
Jing Zhang Beihang Univ.
Lingyu Yang Beihang Univ.
14:45-15:00 SatA7.6
Research on Supercirculation Effects of Distributed
Propulsion Configuration
Wenwen Kang Beihang Univ.
Jing Zhang Beihang Univ.
Lingyu Yang Beihang Univ. 15:00-15:15 SatA7.7
An HLA/RTI Architecture Based on Periodic and Aperiodic
Tasks Scheduling for Real-time Improvement
Shutian Liu Beihang Univ.
Shuling Dai Beihang Univ.
15:15-15:30 SatA7.8
A Real-Time Flight Simulation System Based on Rapid
Prototyping and VxWorks
Xintao Liao Nanjing Univ. of Aeronautics and Astronautics
35
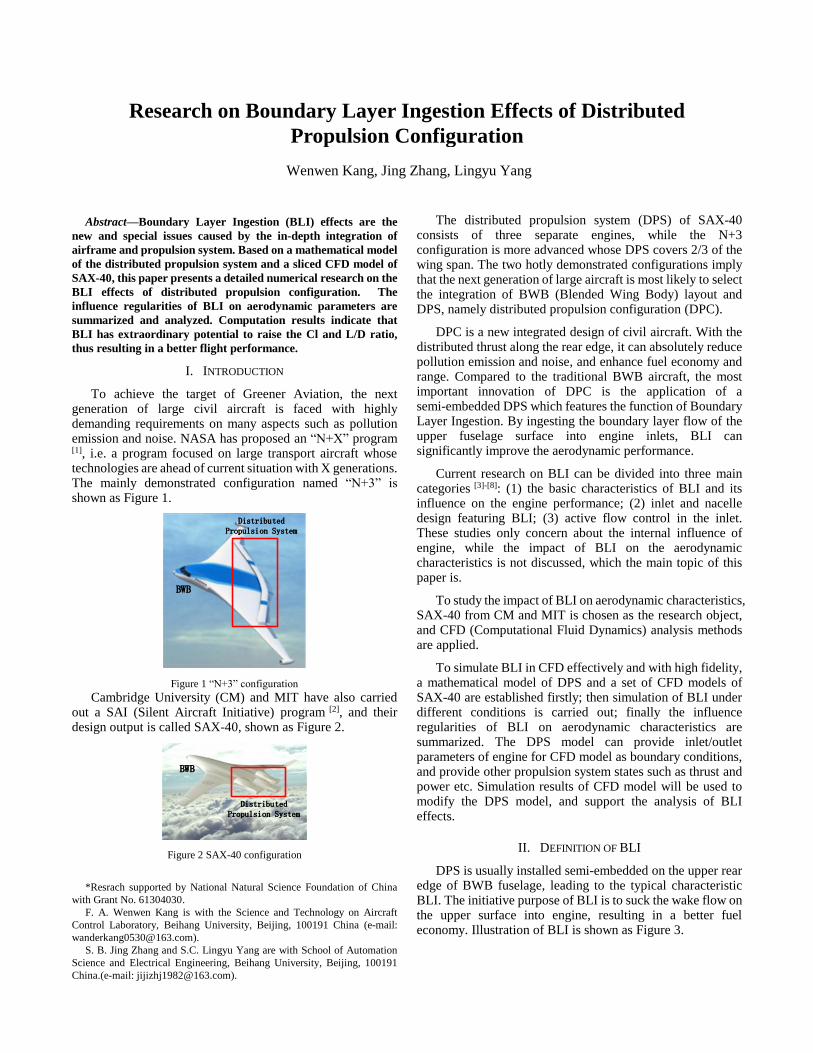
Abstract—Boundary Layer Ingestion (BLI) effects are the
new and special issues caused by the in-depth integration of
airframe and propulsion system. Based on a mathematical model
of the distributed propulsion system and a sliced CFD model of
SAX-40, this paper presents a detailed numerical research on the
BLI effects of distributed propulsion configuration. The
influence regularities of BLI on aerodynamic parameters are
summarized and analyzed. Computation results indicate that
BLI has extraordinary potential to raise the Cl and L/D ratio,
thus resulting in a better flight performance.
I. INTRODUCTION
To achieve the target of Greener Aviation, the next generation of large civil aircraft is faced with highly demanding requirements on many aspects such as pollution emission and noise. NASA has proposed an “N+X” program
[1], i.e. a program focused on large transport aircraft whose technologies are ahead of current situation with X generations. The mainly demonstrated configuration named “N+3” is shown as Figure 1.
Distributed Propulsion System
BWB
Figure 1 “N+3” configuration
Cambridge University (CM) and MIT have also carried out a SAI (Silent Aircraft Initiative) program [2], and their design output is called SAX-40, shown as Figure 2.
Distributed Propulsion System
BWB
Figure 2 SAX-40 configuration
*Resrach supported by National Natural Science Foundation of China
with Grant No. 61304030.
F. A. Wenwen Kang is with the Science and Technology on Aircraft
Control Laboratory, Beihang University, Beijing, 100191 China (e-mail:
S. B. Jing Zhang and S.C. Lingyu Yang are with School of Automation
Science and Electrical Engineering, Beihang University, Beijing, 100191
China.(e-mail: [email protected]).
The distributed propulsion system (DPS) of SAX-40 consists of three separate engines, while the N+3 configuration is more advanced whose DPS covers 2/3 of the wing span. The two hotly demonstrated configurations imply that the next generation of large aircraft is most likely to select the integration of BWB (Blended Wing Body) layout and DPS, namely distributed propulsion configuration (DPC).
DPC is a new integrated design of civil aircraft. With the distributed thrust along the rear edge, it can absolutely reduce pollution emission and noise, and enhance fuel economy and range. Compared to the traditional BWB aircraft, the most important innovation of DPC is the application of a semi-embedded DPS which features the function of Boundary Layer Ingestion. By ingesting the boundary layer flow of the upper fuselage surface into engine inlets, BLI can significantly improve the aerodynamic performance.
Current research on BLI can be divided into three main categories [3]-[8]: (1) the basic characteristics of BLI and its influence on the engine performance; (2) inlet and nacelle design featuring BLI; (3) active flow control in the inlet. These studies only concern about the internal influence of engine, while the impact of BLI on the aerodynamic characteristics is not discussed, which the main topic of this paper is.
To study the impact of BLI on aerodynamic characteristics, SAX-40 from CM and MIT is chosen as the research object, and CFD (Computational Fluid Dynamics) analysis methods are applied.
To simulate BLI in CFD effectively and with high fidelity, a mathematical model of DPS and a set of CFD models of SAX-40 are established firstly; then simulation of BLI under different conditions is carried out; finally the influence regularities of BLI on aerodynamic characteristics are summarized. The DPS model can provide inlet/outlet parameters of engine for CFD model as boundary conditions, and provide other propulsion system states such as thrust and power etc. Simulation results of CFD model will be used to modify the DPS model, and support the analysis of BLI effects.
II. DEFINITION OF BLI
DPS is usually installed semi-embedded on the upper rear edge of BWB fuselage, leading to the typical characteristic BLI. The initiative purpose of BLI is to suck the wake flow on the upper surface into engine, resulting in a better fuel economy. Illustration of BLI is shown as Figure 3.
Research on Boundary Layer Ingestion Effects of Distributed
Propulsion Configuration
Wenwen Kang, Jing Zhang, Lingyu Yang
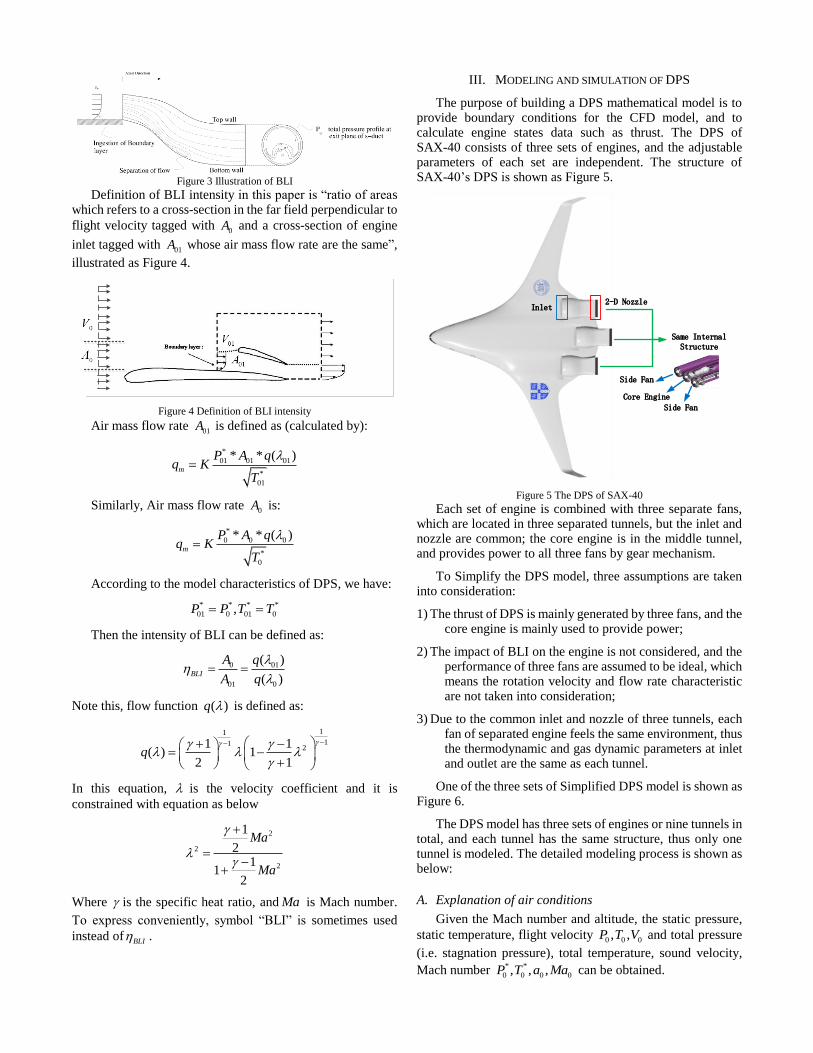
Figure 3 Illustration of BLI
Definition of BLI intensity in this paper is “ratio of areas which refers to a cross-section in the far field perpendicular to
flight velocity tagged with 0A and a cross-section of engine
inlet tagged with 01A whose air mass flow rate are the same”,
illustrated as Figure 4.
Figure 4 Definition of BLI intensity
Air mass flow rate 01A is defined as (calculated by):
*
01 01 01
*
01
* * ( )m
P A qq K
T
Similarly, Air mass flow rate 0A is:
*
0 0 0
*
0
* * ( )m
P A qq K
T
According to the model characteristics of DPS, we have:
* * * *
01 0 01 0,P P T T
Then the intensity of BLI can be defined as:
0 01
01 0
( )
( )BLI
A q
A q
Note this, flow function ( )q is defined as:
11
1121 1
( ) 12 1
q
In this equation, is the velocity coefficient and it is
constrained with equation as below
2
2
2
1
21
12
Ma
Ma
Where is the specific heat ratio, and Ma is Mach number.
To express conveniently, symbol “BLI” is sometimes used
instead ofBLI .
III. MODELING AND SIMULATION OF DPS
The purpose of building a DPS mathematical model is to provide boundary conditions for the CFD model, and to calculate engine states data such as thrust. The DPS of SAX-40 consists of three sets of engines, and the adjustable parameters of each set are independent. The structure of SAX-40’s DPS is shown as Figure 5.
Inlet2-D Nozzle
Same Internal Structure
Core Engine
Side Fan
Side Fan
Figure 5 The DPS of SAX-40
Each set of engine is combined with three separate fans, which are located in three separated tunnels, but the inlet and nozzle are common; the core engine is in the middle tunnel, and provides power to all three fans by gear mechanism.
To Simplify the DPS model, three assumptions are taken into consideration:
1) The thrust of DPS is mainly generated by three fans, and the core engine is mainly used to provide power;
2) The impact of BLI on the engine is not considered, and the performance of three fans are assumed to be ideal, which means the rotation velocity and flow rate characteristic are not taken into consideration;
3) Due to the common inlet and nozzle of three tunnels, each fan of separated engine feels the same environment, thus the thermodynamic and gas dynamic parameters at inlet and outlet are the same as each tunnel.
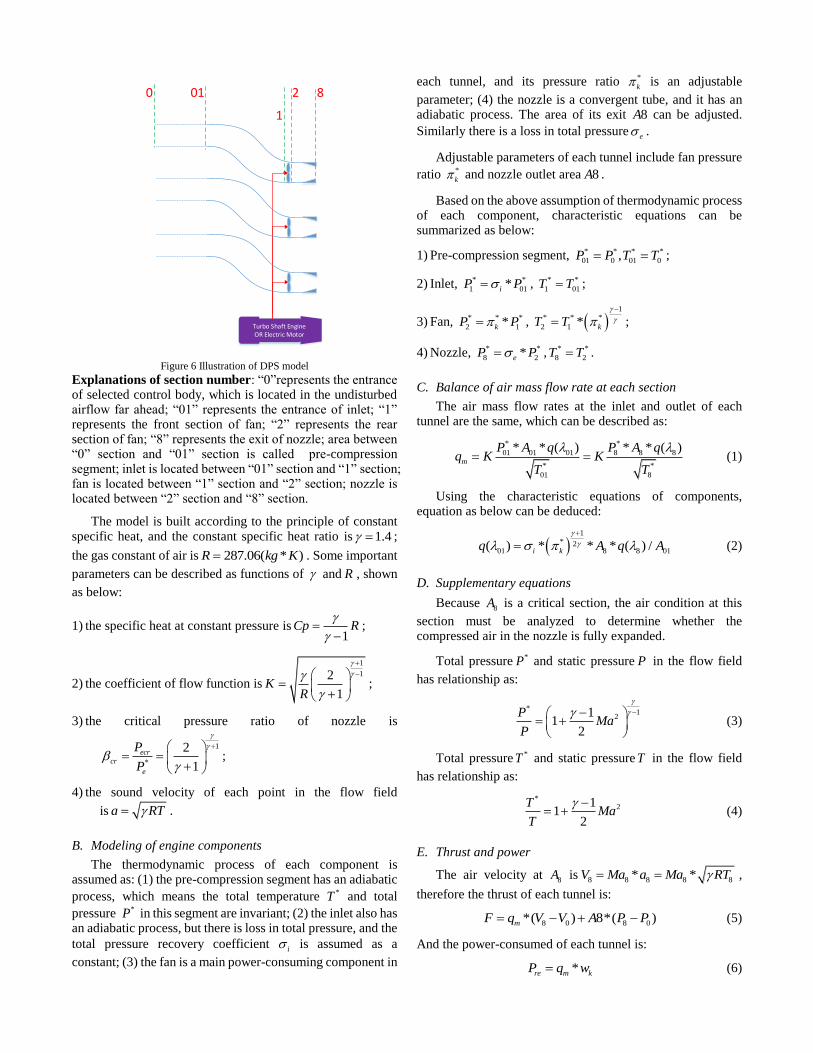
One of the three sets of Simplified DPS model is shown as Figure 6.
The DPS model has three sets of engines or nine tunnels in total, and each tunnel has the same structure, thus only one tunnel is modeled. The detailed modeling process is shown as below:
A. Explanation of air conditions
Given the Mach number and altitude, the static pressure,
static temperature, flight velocity 0 0 0, ,P T V and total pressure
(i.e. stagnation pressure), total temperature, sound velocity,
Mach number * *
0 0 0 0, , ,P T a Ma can be obtained.
0 01
1
2 8
Turbo Shaft Engine OR Electric Motor
Figure 6 Illustration of DPS model
Explanations of section number: “0”represents the entrance of selected control body, which is located in the undisturbed airflow far ahead; “01” represents the entrance of inlet; “1” represents the front section of fan; “2” represents the rear section of fan; “8” represents the exit of nozzle; area between “0” section and “01” section is called pre-compression segment; inlet is located between “01” section and “1” section; fan is located between “1” section and “2” section; nozzle is located between “2” section and “8” section.
The model is built according to the principle of constant specific heat, and the constant specific heat ratio is 1.4 ;
the gas constant of air is 287.06( * )R kg K . Some important
parameters can be described as functions of and R , shown
as below:
1) the specific heat at constant pressure is1
Cp R
;
2) the coefficient of flow function is
1
12
1K
R
;
3) the critical pressure ratio of nozzle is
1
*
2
1
ecr
cr
e
P
P
;
4) the sound velocity of each point in the flow field
is a RT .
B. Modeling of engine components
The thermodynamic process of each component is assumed as: (1) the pre-compression segment has an adiabatic
process, which means the total temperature *T and total
pressure *P in this segment are invariant; (2) the inlet also has an adiabatic process, but there is loss in total pressure, and the
total pressure recovery coefficient i is assumed as a
constant; (3) the fan is a main power-consuming component in
each tunnel, and its pressure ratio *
k is an adjustable
parameter; (4) the nozzle is a convergent tube, and it has an adiabatic process. The area of its exit 8A can be adjusted.
Similarly there is a loss in total pressuree .
Adjustable parameters of each tunnel include fan pressure
ratio *
k and nozzle outlet area 8A .
Based on the above assumption of thermodynamic process of each component, characteristic equations can be summarized as below:
1) Pre-compression segment, * * * *
01 0 01 0,P P T T ;
2) Inlet, * *
1 01*iP P , * *
1 01T T ;
3) Fan, * * *
2 1*kP P , 1
* * *
2 1 * kT T
;
4) Nozzle, * *
8 2*eP P , * *
8 2T T .
C. Balance of air mass flow rate at each section
The air mass flow rates at the inlet and outlet of each tunnel are the same, which can be described as:
* *
01 01 01 8 8 8
* *
01 8
* * ( ) * * ( )m
P A q P A qq K K
T T
(1)
Using the characteristic equations of components, equation as below can be deduced:
1
* 201 8 8 01( ) * * * ( ) /i kq A q A
(2)
D. Supplementary equations
Because 8A is a critical section, the air condition at this
section must be analyzed to determine whether the compressed air in the nozzle is fully expanded.
Total pressure *P and static pressure P in the flow field
has relationship as:
*1
211
2
PMa
P
(3)
Total pressure *T and static pressure T in the flow field
has relationship as:
*21
12
TMa
T
(4)
E. Thrust and power
The air velocity at 8A is 8 8 8 8 8* *V Ma a Ma RT ,
therefore the thrust of each tunnel is:
8 0 8 0*( ) 8*( )mF q V V A P P (5)
And the power-consumed of each tunnel is:
*re m kP q w (6)
Where kw is the power consumed by unit air mass flow rate,
and it can be described as:
1
* * * * * *
2 1 0( ) / * * 1 /1
k k k kw Cp T T R T
(7)
In which, *
k is the efficiency of power transmission from
shaft power to compression power.
As above, all the equations needed to build a DPS mathematical model are described. If the initial conditions are set, all the thermodynamic and gas dynamic parameters at each section can be obtained.
F. Modification of DPS model and settings of adjustable
parameters
To modify the design parameters of the basic DPS model, information such as required thrust must be extracted from CFD results.
When the modification has been done, the available range of adjustable parameters of DPS model should be set. There are two limit conditions:
1) Usable total thrust should cover all the situations which could occur during the whole cruising state, e.g. the whole range of AOA (Angle of Attack) variation;
2) Usable air mass flow rate should be limited to keep the Mach number of the entrance of inlet under 1,
i.e.01 1Ma , because the inlet of SAX-40 is designed to
work at subsonic condition.
G. Extract BLI intensity from DPS model
After the modeling of DPS has been completed, the intensity of BLI can be deduced as:
0 01
01 0
( )
( )BLI
A q
A q
(8)
In which, 0( )q can be directly determined by flight states,
and 01( )q can be obtained from DPS mathematical model.
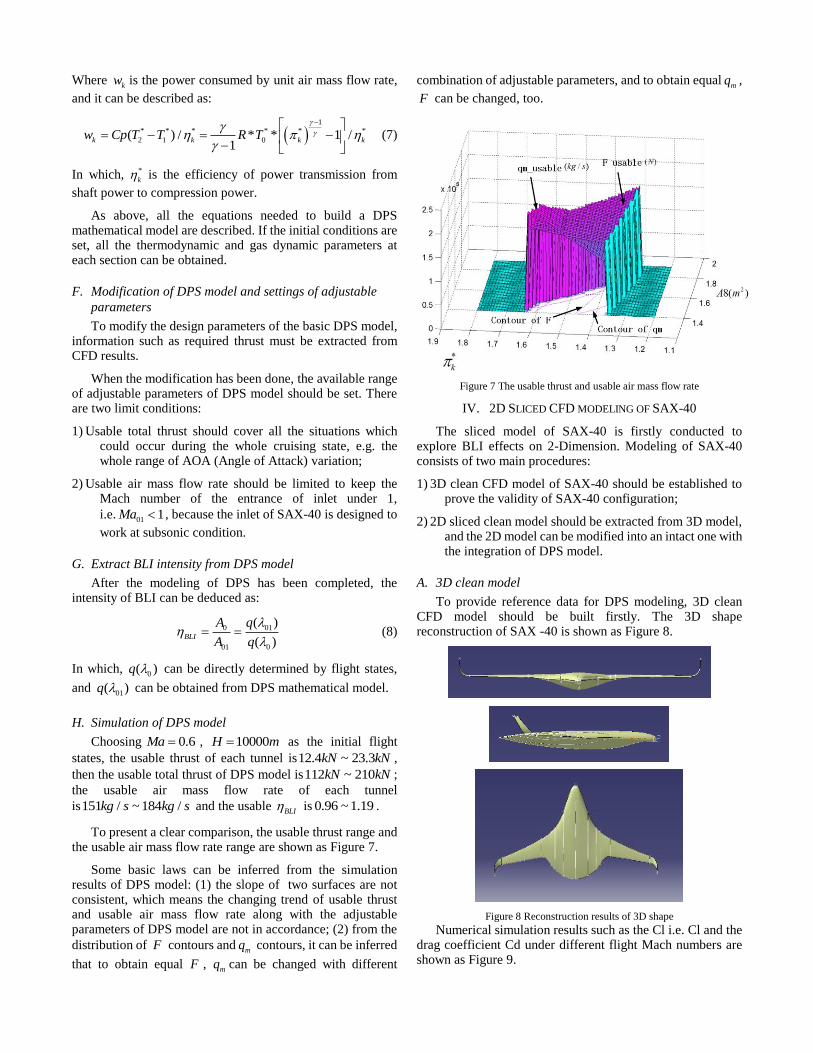
H. Simulation of DPS model
Choosing 0.6Ma , 10000H m as the initial flight
states, the usable thrust of each tunnel is12.4 ~ 23.3kN kN ,
then the usable total thrust of DPS model is112 ~ 210kN kN ;
the usable air mass flow rate of each tunnel
is151 / ~ 184 /kg s kg s and the usable BLI is 0.96 ~1.19 .
To present a clear comparison, the usable thrust range and the usable air mass flow rate range are shown as Figure 7.
Some basic laws can be inferred from the simulation results of DPS model: (1) the slope of two surfaces are not consistent, which means the changing trend of usable thrust and usable air mass flow rate along with the adjustable parameters of DPS model are not in accordance; (2) from the
distribution of F contours andmq contours, it can be inferred
that to obtain equal F , mq can be changed with different
combination of adjustable parameters, and to obtain equalmq ,
F can be changed, too.
Figure 7 The usable thrust and usable air mass flow rate
IV. 2D SLICED CFD MODELING OF SAX-40
The sliced model of SAX-40 is firstly conducted to explore BLI effects on 2-Dimension. Modeling of SAX-40 consists of two main procedures:
1) 3D clean CFD model of SAX-40 should be established to prove the validity of SAX-40 configuration;
2) 2D sliced clean model should be extracted from 3D model, and the 2D model can be modified into an intact one with the integration of DPS model.
A. 3D clean model
To provide reference data for DPS modeling, 3D clean CFD model should be built firstly. The 3D shape reconstruction of SAX -40 is shown as Figure 8.
Figure 8 Reconstruction results of 3D shape
Numerical simulation results such as the Cl i.e. Cl and the drag coefficient Cd under different flight Mach numbers are shown as Figure 9.

Figure 9 Aerodynamic Parameters of 3D model
As can be seen, first the Cl is linearly changing with AOA, while Cd is changing with AOA in a quadratic curve. The changing trend is in accordance with the conventional experience; secondly, through an integrated analysis with design parameters such as total cruising weight and reference area of the wing, conclusions can be made that the 3D CFD simulation results are logical and rational and SAX-40 configuration can be selected as the basis for further discussion.
B. 2D sliced clean model
BLI effects are mostly generated in front of the entrance of inlet, i.e. the upper surface of central fuselage. To simplify the analysis, the regions shown as Figure 10 in shadows are considered as the main affected regions in this article.
7 0
Figure 10 Regions affected by BLI
Since the 3D shape of SAX-40 has been established, 2D sliced model can be easily extracted from the corresponding position from 3D model. Taking the areas affected by BLI into consideration, the clean airfoil of “7” position are extracted, as shown as Figure 11.
Figure 11 Sliced models of clean airfoil
The purpose of extracting 2D sliced clean model is to
provide a reference to BLI effects and to provide a basic
model for modifying.
C. 2D sliced model integrated with DPS model
With the specific design parameters of DPS model, the 2D clean airfoil can be modified with the shape of propulsion system, and the modified results are shown as Figure 12.
Figure 12 Sliced models with engine shape
To simulate BLI effects with CFD measures, the DPS model should be integrated into the CFD model. Correspondingly, the DPS model provides the CFD model with boundary conditions, shown as Figure 13.
A01
A8
Figure 13 Illustration of required boundary conditions
V. STUDY ON INFLUENCE REGULARITIES OF BLI
In this paper, two kinds of initial flight conditions are chosen to conduct CFD simulation on BLI effects, as shown below:
1) 0.6, 10000 , 0Ma H m ;
2) 0.8, 10000 , 0Ma H m .
The slice “7” is selected as the analysis area. First, the visualized nephograms will be presented to give an intuitionistic explanation; then, a systematic analysis based on the numerical data will be presented.
A. Simulation results of slice “7” under the condition of
0.6, 10000Ma H m
1) The velocity nephograms of slice “7” with clean airfoil and
BLI effects 1.08BLI are shown separately as Figure
14.
As can be seen, the jet velocity of propulsion system is apparent, which is in accordance with the DPS data, and the flow velocity on the upper surface of airfoil is obviously raised with BLI.
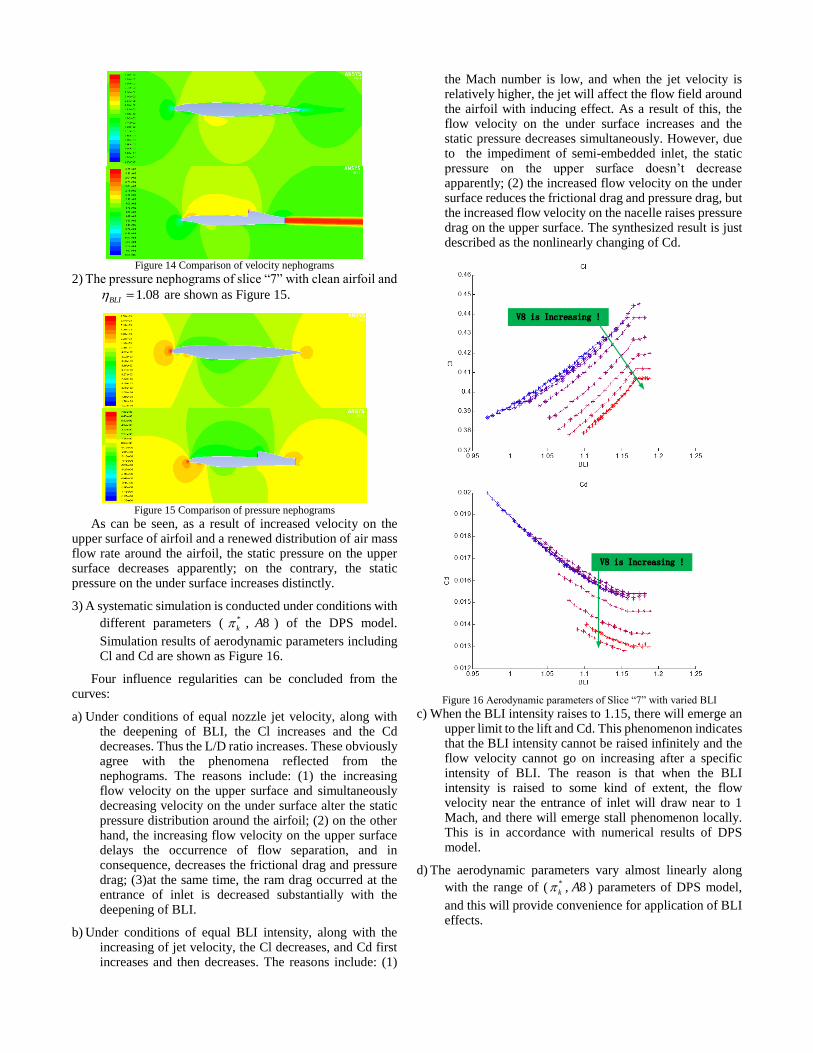
Figure 14 Comparison of velocity nephograms
2) The pressure nephograms of slice “7” with clean airfoil and
1.08BLI are shown as Figure 15.
Figure 15 Comparison of pressure nephograms
As can be seen, as a result of increased velocity on the upper surface of airfoil and a renewed distribution of air mass flow rate around the airfoil, the static pressure on the upper surface decreases apparently; on the contrary, the static pressure on the under surface increases distinctly.
3) A systematic simulation is conducted under conditions with
different parameters ( *
k , 8A ) of the DPS model.
Simulation results of aerodynamic parameters including Cl and Cd are shown as Figure 16.
Four influence regularities can be concluded from the curves:
a) Under conditions of equal nozzle jet velocity, along with the deepening of BLI, the Cl increases and the Cd decreases. Thus the L/D ratio increases. These obviously agree with the phenomena reflected from the nephograms. The reasons include: (1) the increasing flow velocity on the upper surface and simultaneously decreasing velocity on the under surface alter the static pressure distribution around the airfoil; (2) on the other hand, the increasing flow velocity on the upper surface delays the occurrence of flow separation, and in consequence, decreases the frictional drag and pressure drag; (3)at the same time, the ram drag occurred at the entrance of inlet is decreased substantially with the deepening of BLI.
b) Under conditions of equal BLI intensity, along with the increasing of jet velocity, the Cl decreases, and Cd first increases and then decreases. The reasons include: (1)
the Mach number is low, and when the jet velocity is relatively higher, the jet will affect the flow field around the airfoil with inducing effect. As a result of this, the flow velocity on the under surface increases and the static pressure decreases simultaneously. However, due to the impediment of semi-embedded inlet, the static pressure on the upper surface doesn’t decrease apparently; (2) the increased flow velocity on the under surface reduces the frictional drag and pressure drag, but the increased flow velocity on the nacelle raises pressure drag on the upper surface. The synthesized result is just described as the nonlinearly changing of Cd.
V8 is Increasing !
V8 is Increasing !
Figure 16 Aerodynamic parameters of Slice “7” with varied BLI
c) When the BLI intensity raises to 1.15, there will emerge an upper limit to the lift and Cd. This phenomenon indicates that the BLI intensity cannot be raised infinitely and the flow velocity cannot go on increasing after a specific intensity of BLI. The reason is that when the BLI intensity is raised to some kind of extent, the flow velocity near the entrance of inlet will draw near to 1 Mach, and there will emerge stall phenomenon locally. This is in accordance with numerical results of DPS model.
d) The aerodynamic parameters vary almost linearly along
with the range of ( *
k , 8A ) parameters of DPS model,
and this will provide convenience for application of BLI effects.

The aerodynamic parameters of slice “7” with clean airfoil
under conditions of 0.6Ma and 0oAOA are shown as
below:
0.0276
0.0153
1.8
Cl
Cd
K
Three influence regularities can be concluded from numerical comparisons of the clean model and the BLI model:
a) The Cl is raised apparently with BLI effects, and this indicates that the BLI effects have great potential to improve the flow field around the airfoil;
b) The Cd is relatively higher with BLI effects than the clean model, but along with the increasing BLI effects, the ram drag is effectively reduced. This is consistent with actual situation, and indicates the validity of CFD models.
c) The L/D ratio is raised obviously with increasing BLI effects, and this implies that the BLI effects have great potential to improve the performance of SAX-40.
4) To analyze the influence of jet velocity on BLI effects in-depth, aerodynamic data under equal BLI effects is extracted from initial calculation results. The jet velocity of the nozzle 8V is chosen as the abscissa factor, and the
results are shown as Figure 17.
BLI is Increasing !
BLI is Increasing !
Figure 17 Aerodynamic parameters of Slice “7” with varied V8
Two influence regularities can be concluded from the curves:
a) When 8V is less than 280 /m s , its influence on
aerodynamic parameters is negligible; but when 8V is
large sufficiently, its influence will be more and more obvious.
b) Under the equal BLI intensity, the influence of 8V on
aerodynamic parameters appears to be nonlinear, but the variation gap between different BLI intensities is almost the same. This can be deduced from that the curves of different BLI intensities are almost parallel.
5) To analyze the challenge of BLI effects on integrated flight/propulsion control, aerodynamic data under the
equal thrust is extracted from initial results. *
k and
8A both are the influence factors of thrust. Choosing 8A
as the abscissa factor, the results are shown as Figure 18.
1.4 1.45 1.5 1.55 1.60.37
0.38
0.39
0.4
0.41
0.42
0.43
0.44
0.45Cl (F is a Constant)
A8(m2)
Cl
Figure 18 Aerodynamic parameters of Slice “7” with equal thrust
As can be seen, with the same thrust, change of the parameters A8 can alter the BLI intensity, resulting in changing of aerodynamic parameters. And when the thrust is being adjusted, the corresponding aerodynamic parameters will present a strong nonlinearity.
B. Simulation results of slice “7” under the condition of
0.8, 10000Ma H m
1) Due to the relatively high Mach number, the influence of 8V on BLI effects needs to be discussed first. Under a
same BLI intensity, the results of 8V influence on
aerodynamic parameters are shown as Figure 19.
Figure 19 Influence of V8 on Aerodynamic parameters
As can be seen, when the Mach number is relatively high, the influence of 8V is little enough, which can be neglected.
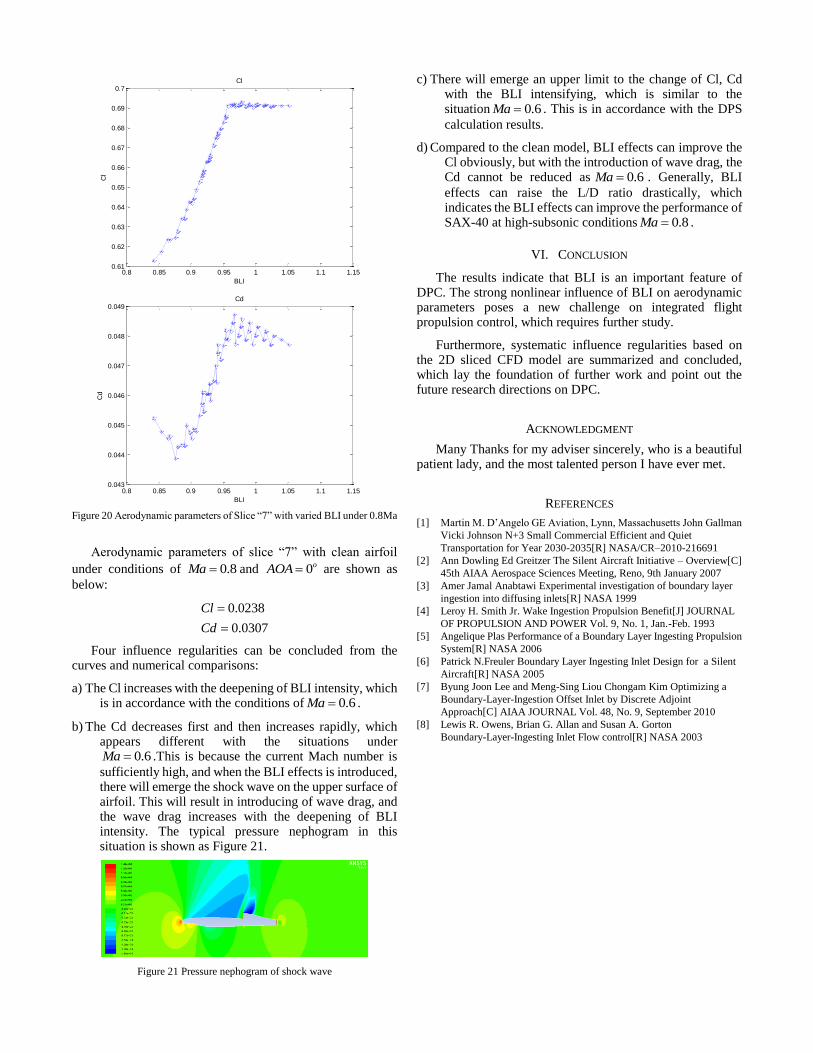
2) Under the different conditions of *
k and 8A . Simulation
results of aerodynamic parameters such as Cl, Cd are shown as Figure 20.
0.8 0.85 0.9 0.95 1 1.05 1.1 1.150.61
0.62
0.63
0.64
0.65
0.66
0.67
0.68
0.69
0.7Cl
BLI
Cl
0.8 0.85 0.9 0.95 1 1.05 1.1 1.150.043
0.044
0.045
0.046
0.047
0.048
0.049Cd
BLI
Cd
Figure 20 Aerodynamic parameters of Slice “7” with varied BLI under 0.8Ma
Aerodynamic parameters of slice “7” with clean airfoil
under conditions of 0.8Ma and 0oAOA are shown as
below:
0.0238
0.0307
Cl
Cd
Four influence regularities can be concluded from the curves and numerical comparisons:
a) The Cl increases with the deepening of BLI intensity, which is in accordance with the conditions of 0.6Ma .
b) The Cd decreases first and then increases rapidly, which appears different with the situations under
0.6Ma .This is because the current Mach number is
sufficiently high, and when the BLI effects is introduced, there will emerge the shock wave on the upper surface of airfoil. This will result in introducing of wave drag, and the wave drag increases with the deepening of BLI intensity. The typical pressure nephogram in this situation is shown as Figure 21.
Figure 21 Pressure nephogram of shock wave
c) There will emerge an upper limit to the change of Cl, Cd with the BLI intensifying, which is similar to the situation 0.6Ma . This is in accordance with the DPS
calculation results.
d) Compared to the clean model, BLI effects can improve the Cl obviously, but with the introduction of wave drag, the Cd cannot be reduced as 0.6Ma . Generally, BLI
effects can raise the L/D ratio drastically, which indicates the BLI effects can improve the performance of SAX-40 at high-subsonic conditions 0.8Ma .
VI. CONCLUSION
The results indicate that BLI is an important feature of DPC. The strong nonlinear influence of BLI on aerodynamic parameters poses a new challenge on integrated flight propulsion control, which requires further study.
Furthermore, systematic influence regularities based on the 2D sliced CFD model are summarized and concluded, which lay the foundation of further work and point out the future research directions on DPC.
ACKNOWLEDGMENT
Many Thanks for my adviser sincerely, who is a beautiful patient lady, and the most talented person I have ever met.
REFERENCES
[1] Martin M. D’Angelo GE Aviation, Lynn, Massachusetts John Gallman
Vicki Johnson N+3 Small Commercial Efficient and Quiet
Transportation for Year 2030-2035[R] NASA/CR–2010-216691
[2] Ann Dowling Ed Greitzer The Silent Aircraft Initiative – Overview[C]
45th AIAA Aerospace Sciences Meeting, Reno, 9th January 2007
[3] Amer Jamal Anabtawi Experimental investigation of boundary layer
ingestion into diffusing inlets[R] NASA 1999
[4] Leroy H. Smith Jr. Wake Ingestion Propulsion Benefit[J] JOURNAL
OF PROPULSION AND POWER Vol. 9, No. 1, Jan.-Feb. 1993
[5] Angelique Plas Performance of a Boundary Layer Ingesting Propulsion
System[R] NASA 2006
[6] Patrick N.Freuler Boundary Layer Ingesting Inlet Design for a Silent
Aircraft[R] NASA 2005
[7] Byung Joon Lee and Meng-Sing Liou Chongam Kim Optimizing a
Boundary-Layer-Ingestion Offset Inlet by Discrete Adjoint
Approach[C] AIAA JOURNAL Vol. 48, No. 9, September 2010
[8] Lewis R. Owens, Brian G. Allan and Susan A. Gorton
Boundary-Layer-Ingesting Inlet Flow control[R] NASA 2003