ieee transactions on cloud computing, vol. 5, no. 4...
TRANSCRIPT
Demystifying the Clouds: Harnessing ResourceUtilization Models for Cost Effective
Infrastructure AlternativesWes J. Lloyd,Member, IEEE, Shrideep Pallickara,Member, IEEE, Olaf David,
Mazdak Arabi, Tyler Wible, Jeffrey Ditty, and Ken Rojas
Abstract—Deployment of service oriented applications (SOAs) to public infrastructure-as-a-service (IaaS) clouds presents challenges
to system analysts. Public clouds offer an increasing array of virtual machine types with qualitatively defined CPU, disk, and network
I/O capabilities. Determining cost effective application deployments requires selecting both the quantity and type of virtual machine
(VM) resources for hosting SOA workloads of interest. Hosting decisions must utilize sufficient infrastructure to meet service level
objectives and cope with service demand. To support these decisions, analysts must: (1) understand how their SOA behaves in the
cloud; (2) quantify representative workload(s) for execution; and (3) support service level objectives regardless of the performance
limits of the hosting infrastructure. In this paper we introduce a workload cost prediction methodology which harnesses operating
system time accounting principles to support equivalent SOA workload performance using alternate virtual machine types. We
demonstrate how the use of resource utilization checkpointing supports capturing the total resource utilization profile for SOA
workloads executed across a pool of VMs. Given these workload profiles, we develop and evaluate our cost prediction methodology
using six SOAs. We demonstrate how our methodology can support finding alternate infrastructures that afford lower hosting costs
while offering equal or better performance using any VM type on Amazon’s public elastic compute cloud.
Index Terms—Service oriented application, performance equivalence, predictive models, IaaS cloud, cloud economics
Ç
1 INTRODUCTION
DEPLOYING service oriented applications (SOAs) to Infra-structure-as-a-Service (IaaS) clouds requires selection
of both the type and quantity of VMs adequate for workloadhosting. Public IaaS clouds offer a wide array of VM appli-ance types featuring different hardware configurations.These VM appliance types provide fixed allocations of CPUcores, system memory, hard disk capacity and type (spindleversus solid state), and network throughput. By focusing onproviding a limited number of VM types, cloud providerscan leverage economies of scale to improve performanceand availability of VM types in hardware procurement andmanagement. Given the ever increasing number of VMtypes it is increasingly difficult to make informed choicesfor SOA deployment. In 2014, Amazon EC2 and HP Helion
offered 34 and 11 predefined VM types respectively, eachwith different CPU, memory, disk, and network bandwidthallocations available for different costs.
Quantifying performance expectations of cloud resourcesis difficult. Amazon EC2 andHPHelion’s clouds use qualita-tive “compute units” to describe relative processing capabili-ties of VMs. Amazon EC2 describes VM performance usingelastic compute units (ECUs), where one ECU is stated toprovide the equivalent CPU capacity of a 1.0-1.2 GHz 2007AMDOpteron or Intel Xeon processor [1]. AnHP cloud com-pute unit (CCU) is advertised to be roughly equivalent to theminimum power of 2/13th of one logical core (a hardwarehyper-thread) of an Intel 2.6 GHz 2012 Xeon CPU. Recently,Amazon has stopped directly marketing ECUs for third gen-eration VM-types, though ECUs are still listed in the man-agement console interface. Additionally, Amazon employsapproximate network throughput categories. They include:very low, low (250 Mbps), moderate (500 Mbps), high (1,000Mbps), and 10 Gigabit.
Not only do cloud vendors offer a diverse array ofVM-types, investigations have shown that VM types areoften implemented using heterogeneous hardware result-ing in performance variance [2], [3]. Ou et al. identifiedno less than five hardware implementations of the m1.large Amazon VM-type in 2011, with performance vari-ance up to 28 percent [2]. Ou also observed the use ofdifferent CPU time sharing allotments to implement them1.large VM type. In some cases, multi-core VMs werefound to not receive 100 percent allotments of every core.
� W.J. Lloyd, O. David, M. Arabi, T. Wible, and J. Ditty are with theDepartments of Computer Science and Civil Engineering, 1372 CampusDelivery, Colorado State University, Fort Collins, CO 80523.E-mail: [email protected], {odavid, marabi, tcwible}@colostate.edu,[email protected].
� S. Pallickara is with the Department of Computer Science, 1873 CampusDelivery, Colorado St. Univ., Ft. Collins, CO 80523.E-mail: [email protected].
� K. Rojas is with the US Department of Agriculture Natural ResourcesConservation Service, Information Technology Center, 2150 Centre Ave,Building A, Suite 150, Fort Collins, CO 80526-8121.
Manuscript received 13 Oct. 2014; revised 24 Feb. 2015; accepted 21 Apr.2015. Date of publication 6 May 2015; date of current version 6 Dec. 2017.Recommended for acceptance by B. He.For information on obtaining reprints of this article, please send e-mail to:[email protected], and reference the Digital Object Identifier below.Digital Object Identifier no. 10.1109/TCC.2015.2430339
IEEE TRANSACTIONS ON CLOUD COMPUTING, VOL. 5, NO. 4, OCTOBER-DECEMBER 2017 667
2168-7161� 2015 IEEE. Personal use is permitted, but republication/redistribution requires IEEE permission.See ht _tp://www.ieee.org/publications_standards/publications/rights/index.html for more information.
Using CPU benchmarking techniques we confirmed thisphenomenon. Timeshare allocations of the four-core m1.xlarge backed by the Intel Xeon E5-2650 v0 @ 2.0 GHzcould not be made to exceed 100, 100, 95, and 75 percentCPU for each respective core.
Beyond VM type heterogeneity challenges, previousresearch has demonstrated how resource contention frommulti-tenancy on VM hosts results in SOA performance var-iance and degradation [4], [5], [6], [7]. Provisioning varia-tion, the uncertainty of the physical location of VMs acrossphysical hosts, has been shown to contribute to applicationperformance variance and degradation [8], [9].
Determining the best VM type for SOA hosting is compli-cated by: (1) a plethora of vendor provided VM-types, (2)vague qualitative descriptions of VM capabilities, (3) hetero-geneous vendor hardware and hypervisor configurations,and (4) performance variance from resource contention andprovisioning variation across shared hardware. Given thesechallenges, a practitioner’s effectiveness at employing onlyintuition to make architectural choices which account for per-formance and cost tradeoffs is increasingly in doubt.
1.1 Workload Cost Prediction Methodology
Making informed choices regarding VM deployments forSOA hosting requires (1) characterization of workloads and(2) benchmarking performance capabilities of available VMtypes. In this paper, we present a workload cost predictionmethodology that harnesses both to support determina-tion of infrastructure requirements for achieving equiva-lent performance for SOA workloads.
To develop our approach we investigate SOA workloadhosting consisting of a large number of individual servicerequests. We focus on achieving equivalent total executiontime for entire workloads using different VM types, irre-spective of individual service request execution times. Ourapproach supports prediction of the type and quantity of VMs toachieve equivalent workload performance providing resource alter-natives. Given alternatives the most economical can be cho-sen for SOA hosting. Infrastructure costs can be calculatedby multiplying fixed or spot market prices by the predictedquantity of VMs to derive monetary costs. Cost predictionscan be compared to determine the most cost effective virtualinfrastructure.
We consider SOA hosting using VM pools consisting of asingle VM type. We do not investigate hosting using poolswith mixed VM types. The utility of mixing VM types couldemulate support of vertical scaling in a public cloud. Verticalscaling is useful when an optimal CPU core requirement isdetermined to be 22 cores. With vertical scaling this workloadcould be hosted using 5 � 4-core VMs, and 1 � 2-core VM ofsimilar processing speed. We do not consider provisioningseparate infrastructure for different phases of SOAworkloads,rather we provision infrastructure for themost resource inten-sive phase. When necessary, workload phases could be pro-filed separately and infrastructure provisioned accordingly.
We consider SOA hosting only on VM types whichmeet or exceed SOA RAM and disk space requirements.We do not consider under allocation of VM RAM or diskspace. This would likely result in significant performancedegradation and represents a problem outside the scopeof our investigation.
Unlike related work in cost optimization for cloudworkloads we do not assume that application workloadsare identical [10], [11], [12]. We profile representativeSOA workloads and build predictive resource utilizationmodels. Our models convert resource requirements froma selected base VM type to alternate VM types needed toachieve equivalent performance. We focus our analysison service oriented application workloads where manyindividual service requests are executed independently inparallel. As our resource utilization based approachesare generic, our workload cost prediction methodology isextensible to any workload that will run across a distrib-uted pool of VMs.
We initially considered cloud application performancemodeling using resource utilization statistics in [13]. Weharnessed this approach to predict performance of variouscomponent compositions across VMs in [8], [14]. Theseefforts demonstrate how intuition is insufficient to deter-mine the best performing VM component compositions. Wedeveloped VM-Scaler to easily facilitate resource utilizationprofiling of application deployments in private and publiccloud settings [15].
1.2 Research Questions
This paper investigates the following research questions:
1 How can equivalent SOA workload performance beachieved across different virtual machine (VM) typesby harnessing resource utilization profiles? [Equiva-lent Performance]
2 How effectively can we predict independentresource utilization variables for SOA workloadsacross VM types? Specifically, how well can we pre-dict: CPU-user-time, CPU-kernel-time, CPU-idle-time, and CPU-IO-wait-time? [Profile Prediction]
3 When scaling the number ofVMs, how canwe accountfor changes in the SOA workload resource utilizationprofile variables? Specifically, what changes occurand, how do we accommodate them for: CPU-user-time, CPU-kernel-time, CPU-idle-time, and CPU-IO-wait-time? [Profile Scaling]
1.3 Research Contributions
In this paper we present our workload cost prediction meth-odology to predict hosting costs of SOA workloads harness-ing resource utilization models. Our methodology providesinfrastructure configuration alternatives that provide equivalentperformance allowing the most economical infrastructure to bechosen. Our methodology supports: (1) characterization ofworkload requirements, (2) predicting the required numberof VMs of a given type required to host workloads, while(3) ensuring equivalent performance is achieved. We addi-tionally contribute:
1. A novel resource checkpointing scheme that sup-ports profiling SOA workload resource utilizationfor jobs executing across VM pools.
2. A research application of Ou et al.’s trial-and-betterapproach [2] to normalize VM pools to ensure eachVM has an identical backing CPU to support SOAworkload profiling.
668 IEEE TRANSACTIONS ON CLOUD COMPUTING, VOL. 5, NO. 4, OCTOBER-DECEMBER 2017
Our resource utilization checkpointing scheme supportsprofiling application resource utilization across VM pools.Resource utilization data collection is synchronized to thenearest second to accurately benchmark resource require-ments. We use a novel application of the trial-and-betterapproach to homogenize public cloud infrastructure for allexperiments. We argue that all public cloud research should usetrial-and-better to reduce heterogeneity of tested resources. Trial-and-better supports normalization of resources to reducevariance of testing in public clouds.
1.4 Paper Organization
In Section 2 provides an overview of related research forcloud based cost optimization and prediction for workloadhosting. Section 3 describes our workload cost predictionmethodology that harnesses Linux CPU time accountingprinciples for workload cost prediction to address research-question 1. Section 4 describes our environmental scienceSOAs used for evaluation and our hardware and test con-figurations. Section 5 describes results of our evaluationwhile addressing research questions 2 and 3. Section 6 sum-marizes our findings while Section 7 discusses future work.
2 BACKGROUND AND RELATED WORK
Research on cloud economics and application hostingcosts can be broken down into efforts focused on demandbased pricing models (spot markets), and investigationson the cost implications of infrastructure managementand scaling approaches.
Amazon introduced spot virtual machine instances as amethod to sell unused datacenter capacity in late 2009. Spotinstances enable bidding for spare public cloud capacity bygranting resources to users whose bids exceed current spotprices. When demand spikes, user VMs whose bid price fallsbelow the current market price are terminated instantly,freeing capacity for higher bidders. Spot instances are idealfor executing computational workloads for scientific model-ing where the time of execution is less important than com-pleting the workloads at minimum cost. Spot instances wereharnessed to conduct our research.
A number of efforts have investigated spot instance pric-ing and similar demand based pricing mechanisms [11],[12], [16], [17]. These efforts employed modeling to predictor set prices. Yi et al. investigated the use of job checkpoint-ing as a mechanism to reduce job costs executed using spotinstances [11]. Their approach was limited to supportingjobs with fixed execution times and was evaluated by simu-lation using spot price histories. Andrzejak et al. developeda model which supports users by providing bid suggestionswhile considering resource availability, reliability, perfor-mance, and resource costs [12]. Their approach was limitedto compute intensive, embarrassingly parallel jobs whosecomputation is easily divided.
Other efforts primarily have focused on infrastructuremanagement to minimize hosting costs [2], [3], [10], [18],[19], [20]. In [21], Galante and E. de Bona provide a surveyof recent research on cloud computing elasticity. Theyidentify 28 works which consider elasticity for infrastruc-ture, platform, and application hosting. Of these only one
study [10], focused on cost optimization of applicationhosting and scaling.
In [10] Sharma et al. describe Kingfisher, a managementsystem supporting cost-aware application hosting and scal-ing for IaaS clouds. Kingfisher determines the most costeffective approach to transition existing application infra-structures to target infrastructures to meet service levelagreements (SLAs). Transitions considered include verticaland horizontal scaling, as well as VM live migration. King-fisher was evaluated using Amazon’s public cloud and alocal private XEN-based cloud. Kingfisher assumes thateach VM can service a fixed volume of incoming requestsand that all requests require the same resources to process.
In [18], Leitner et al. developed an SLA-aware client siderequest scheduler which minimizes “aggregate” hostingcosts by balancing both price and SLA requirements. Theyevaluated their approach by simulation using workloadarchival data to test how their scheduler responds. Theycompared the aggregate costs of their algorithms with:(1) the minimum infrastructure (one VM for all requests),(2) the maximum infrastructure (one VM for each request)and (3) a bin-packing approach which fully packs existingresources before allocating additional VMs. Their approachprovided the lowest aggregate costs but their bin packingapproach did not address infrastructure launch latency.
Simarro et al. provide a cost aware VM-placement sched-uler which seeks to reduce infrastructure costs by provision-ing VMs across cloud data centers having the lowestinfrastructure prices [19]. Their schedulers use price forecaststo predict pricing trends to support themost economical infra-structure placements. Their approach reduced infrastructurecosts but did not address network latency and performanceissues resulting when application infrastructure is simulta-neously provisioned across different data centers.
In [20] Villegas et al. provide a performance and costanalysis of provisioning and job scheduling policies in thecloud. They assessed policies from recent literature for theiranalysis using two private clouds and Amazon EC2. Theyfound that statically provisioned virtual infrastructuredelivered better performance, but was up to 5Xs morecostly. Conversely dynamically provisioned infrastructureprovided lower hosting costs but with performance caveatsresulting from infrastructure launch latency similar to [22].This key cost versus performance tradeoff for infrastructureprovisioning highlights the need for good hot spot detectionand load prediction techniques [23].
Farley et al. demonstrated that Amazon EC2 instancetypes had heterogeneous hardware implementations in [3].Their investigation focused on the m1.small instance typeand demonstrated potential for cost savings by discardingVMs with less performant implementations. Ou et al.extended their work by demonstrating that several Amazonand Rackspace VM types exhibit heterogeneous implemen-tations [2]. They identified four different implementationsof the m1.large VM on Amazon EC2 with varying perfor-mance. Performance variations were attributed to the use ofdifferent backing CPUs and XEN scheduler configurations.They harnessed this heterogeneity by developing a “trial-and-better” approach to test new instances and discardpoor performing instances. The authors demonstrated costsavings for long running jobs as a result of faster job
LLOYD ET AL.: DEMYSTIFYING THE CLOUDS: HARNESSING RESOURCE UTILIZATION MODELS FOR COST EFFECTIVE INFRASTRUCTURE... 669
execution. For our work we adopt Ou’s “trial-and-better”approach to improve homogeneity of VM profiling.
Previous research investigating cost implications of IaaSclouds has focused on spot market analysis [16], [17], pric-ing/bid support [11], [12], cost-aware VM scheduling [10],[19], [20], and job placement schemes [18], [20]. For the sur-veyed approaches workloads were assumed to be heteroge-neous. None of the approaches specifically support diverseworkloads with varying resource requirements (e.g. CPUand I/O) [10], [11], [12]. Conversely, we provide a workloadcost prediction methodology which harnesses SOA work-load profiles and VM benchmarking to capture the uniqueresource requirements of diverse workloads. Our methodol-ogy provides equivalent workload performance using dif-ferent VM types and supports cost savings by identifyinginfrastructure alternatives.
3 RESOURCE UTILIZATION MODELS FOR COST
PREDICTION
Our resource utilization based approach for SOA workloadcost prediction focuses on achieving equivalent performancefor diverse SOA workloads. For the purposes of our evalua-tion in Section 5, we consider equivalent performance to beþ/– 2 seconds of the observable wall clock time. This equa-tes to �2 percent execution time for our SOA workloads.Our workloads consist of sets of individual service requeststhat execute in parallel across virtual infrastructure. We arenot concerned with response time of individual servicerequests, but rather the total workload execution time.In fact, we expect individual requests to perform slower onVM-types having slower CPU clock speeds.
3.1 Workload Equivalent Performance
Given SOA workloads, we predict the workload resourceutilization requirements for pools of distinct virtualmachine types. For example, we have three pools: one con-sisting of c3.xlarge VMs, another m1.xlarge, and a third c1.medium. Our methodology supports determining therequired number of virtual machines to provide equivalentworkload performance using these different VM pools.
We harness Linux CPU time accounting principles toaccount for available time across the pool of VMs servicingthe workload. Workload wall clock time can be determinedby summing CPU resource utilization variables across theVM pool and dividing by the total number of CPU cores.
Workloadtime ¼cpuUsrT þ cpuKrnT þ cpuIdleT þ cpuIoWaitTþ
cpuIntSrvcT þ cpuSftIntSrvcT þ cpuNiceT þ cpuStealTVMcores
:
(1)
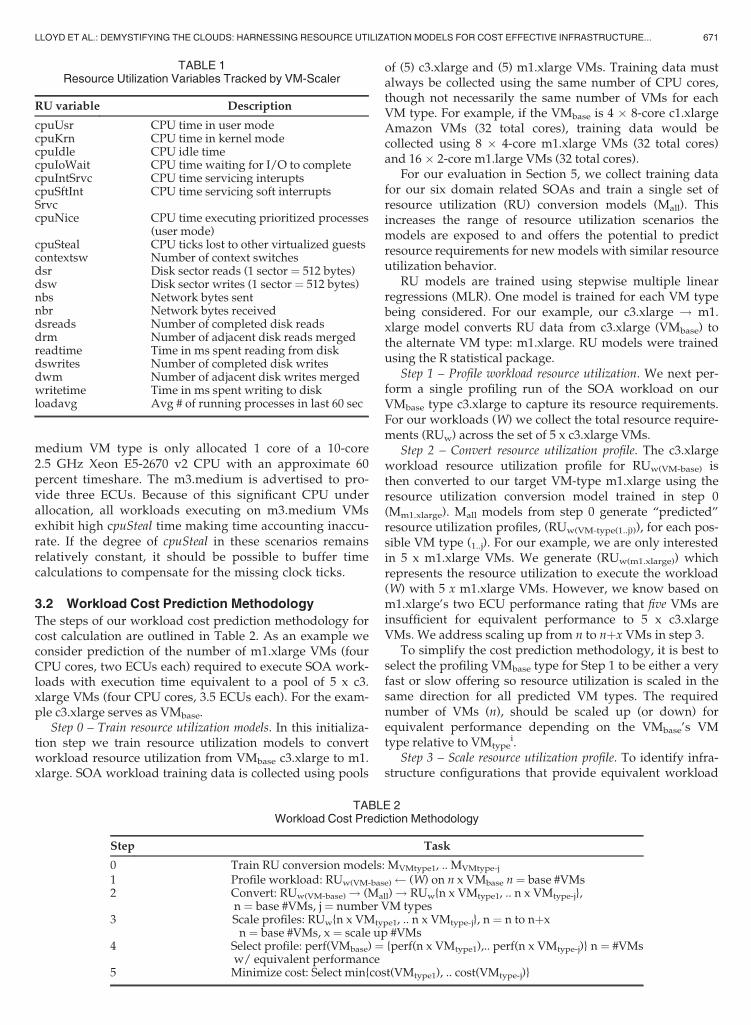
Eight resource utilization variables contribute to theobserved wall clock time. These eight variables described inTable 1 include: cpuUsr, cpuKrn, cpuIdle, cpuIoWait,cpuIntSrvc, cpuSftIntSrvc, cpuNice, and cpuSteal. In practicewe found it unnecessary to consider all eight variables.For our SOA workloads described in section 4.1, m1.xlargewall clock time on average was accounted for bycpuUsr (45.26 percent), cpuKrn (7.52 percent), and cpuIdle(43.71 percent). CpuIoWait (3.14 percent) and cpuSftIntSrvc(0.28 percent) help further improve prediction accuracy. We
ignore cpuIntSrvc (0 percent), cpuNice (0 percent) andcpuSteal (.08 percent) in practice because the time theyaccount for was negligible. We use resource utilizationcheckpointing, a feature of VM-Scaler cloud to capture theworkload resource utilization as described in Section 4.3.
Of the eight resource utilization variables, cpuUsr andcpuIdle account for the majority of the time. For our SOAworkload evaluation described in Section 5, approxi-mately 88.97 percent of m1.xlarge SOA execution time isaccounted for by cpuUsr or cpuIdle. CpuUsr represents thetotal amount of computation required by the workload.Through extensive testing, we observe that cpuUsr timeremains generally the same regardless of the numberVMs used to host the workload. Introducing additionalVMs into the VM pool adds to the total overhead frombackground Linux processes. This overhead is relativelyconstant and can easily be accounted for. CpuIdle repre-sents the unused time where CPU cores have been provi-sioned but remain idle. Workloads exhibiting high cpuIdletime demonstrate parallel execution inefficiencies. Thisindicates significant resource waste in the service imple-mentation. Applications concerned about cloud hostingcosts should be architected to decrease cpuIdle time.
CpuKrn is the time a workload spends executing kernelmode instructions. When executing SOA workloads acrossVMs, we found the ratio of time spent in kernel mode issimilar, with slightly more cpuKrn time occurring on VMswith slower I/O. CpuKrn is the third greatest contributor toworkload execution time at approximately 7.52 percent.CpuIntSrvc and cpuSftIntSrvc represent time spent servicingsystem interrupts and is generally small. CpuNice is timespent executing prioritized processes in user mode. This israre, and only occurs when SOAs employ process prioritiza-tion in an attempt to gain a larger share of the CPU.
CpuSteal is an important, though unusable metric.CpuSteal registers processor ticks when a virtual CPU coreis ready to execute, but the physical core is busy andunavailable. The CPU may be unavailable because thehypervisor is executing native instructions (e.g. XEN Dom0)or other co-located VMs are currently “stealing” the CPU.The difficulty with this measure is that ticks are only regis-tered when execution should occur, but is unable to. Theseticks, unfortunately, do not adequately account for the miss-ing time. When workloads exhibit high cpuSteal time error isintroduced into the Linux CPU time accounting calcula-tions. On the VM there is essentially “missing time”, whichis the gap between accounted for time and actual time.There are a number of factors which cause CpuSteal time tooccur. These include:
1. Processors are shared by too many VMs, and thoseVMs are busy
2. The hypervisor is occupying the CPU3. The VM’s CPU core time share allocation is less than
100 percent, though 100 percent is needed for a CPUintensive workload
In the case of 3, we observe high cpuSteal time whenexecuting workloads on Amazon EC2 VMs which underallocate CPU cores as described earlier in Section 1.A specific example of this is the m1.small [2] andm3.medium VMs. In 2014, we observed that the m3.
670 IEEE TRANSACTIONS ON CLOUD COMPUTING, VOL. 5, NO. 4, OCTOBER-DECEMBER 2017
medium VM type is only allocated 1 core of a 10-core2.5 GHz Xeon E5-2670 v2 CPU with an approximate 60percent timeshare. The m3.medium is advertised to pro-vide three ECUs. Because of this significant CPU underallocation, all workloads executing on m3.medium VMsexhibit high cpuSteal time making time accounting inaccu-rate. If the degree of cpuSteal in these scenarios remainsrelatively constant, it should be possible to buffer timecalculations to compensate for the missing clock ticks.
3.2 Workload Cost Prediction Methodology
The steps of our workload cost prediction methodology forcost calculation are outlined in Table 2. As an example weconsider prediction of the number of m1.xlarge VMs (fourCPU cores, two ECUs each) required to execute SOA work-loads with execution time equivalent to a pool of 5 x c3.xlarge VMs (four CPU cores, 3.5 ECUs each). For the exam-ple c3.xlarge serves as VMbase.
Step 0 – Train resource utilization models. In this initializa-tion step we train resource utilization models to convertworkload resource utilization from VMbase c3.xlarge to m1.xlarge. SOA workload training data is collected using pools
of (5) c3.xlarge and (5) m1.xlarge VMs. Training data mustalways be collected using the same number of CPU cores,though not necessarily the same number of VMs for eachVM type. For example, if the VMbase is 4 � 8-core c1.xlargeAmazon VMs (32 total cores), training data would becollected using 8 � 4-core m1.xlarge VMs (32 total cores)and 16 � 2-core m1.large VMs (32 total cores).
For our evaluation in Section 5, we collect training datafor our six domain related SOAs and train a single set ofresource utilization (RU) conversion models (Mall). Thisincreases the range of resource utilization scenarios themodels are exposed to and offers the potential to predictresource requirements for newmodels with similar resourceutilization behavior.
RU models are trained using stepwise multiple linearregressions (MLR). One model is trained for each VM typebeing considered. For our example, our c3.xlarge ! m1.xlarge model converts RU data from c3.xlarge (VMbase) tothe alternate VM type: m1.xlarge. RU models were trainedusing the R statistical package.
Step 1 – Profile workload resource utilization. We next per-form a single profiling run of the SOA workload on ourVMbase type c3.xlarge to capture its resource requirements.For our workloads (W) we collect the total resource require-ments (RUw) across the set of 5 x c3.xlarge VMs.
Step 2 – Convert resource utilization profile. The c3.xlargeworkload resource utilization profile for RUw(VM-base) isthen converted to our target VM-type m1.xlarge using theresource utilization conversion model trained in step 0(Mm1.xlarge). Mall models from step 0 generate “predicted”resource utilization profiles, (RUw(VM-type(1..j))), for each pos-sible VM type (1..j). For our example, we are only interestedin 5 x m1.xlarge VMs. We generate (RUw(m1.xlarge)) whichrepresents the resource utilization to execute the workload(W) with 5 x m1.xlarge VMs. However, we know based onm1.xlarge’s two ECU performance rating that five VMs areinsufficient for equivalent performance to 5 x c3.xlargeVMs. We address scaling up from n to nþx VMs in step 3.
To simplify the cost prediction methodology, it is best toselect the profiling VMbase type for Step 1 to be either a veryfast or slow offering so resource utilization is scaled in thesame direction for all predicted VM types. The requirednumber of VMs (n), should be scaled up (or down) forequivalent performance depending on the VMbase’s VMtype relative to VMtype
i.Step 3 – Scale resource utilization profile. To identify infra-
structure configurations that provide equivalent workload
TABLE 1Resource Utilization Variables Tracked by VM-Scaler
RU variable Description
cpuUsr CPU time in user modecpuKrn CPU time in kernel modecpuIdle CPU idle timecpuIoWait CPU time waiting for I/O to completecpuIntSrvc CPU time servicing interuptscpuSftIntSrvc
CPU time servicing soft interrupts
cpuNice CPU time executing prioritized processes(user mode)
cpuSteal CPU ticks lost to other virtualized guestscontextsw Number of context switchesdsr Disk sector reads (1 sector ¼ 512 bytes)dsw Disk sector writes (1 sector ¼ 512 bytes)nbs Network bytes sentnbr Network bytes receiveddsreads Number of completed disk readsdrm Number of adjacent disk reads mergedreadtime Time in ms spent reading from diskdswrites Number of completed disk writesdwm Number of adjacent disk writes mergedwritetime Time in ms spent writing to diskloadavg Avg # of running processes in last 60 sec
TABLE 2Workload Cost Prediction Methodology
Step Task
0 Train RU conversion models: MVMtype1, .. MVMtype-j
1 Profile workload: RUw(VM-base) (W) on n x VMbase n ¼ base #VMs2 Convert: RUw(VM-base)! (Mall)! RUw{n x VMtype1, .. n x VMtype-j},
n ¼ base #VMs, j ¼ number VM types3 Scale profiles: RUw{n x VMtype1, .. n x VMtype-j}, n ¼ n to nþx
n ¼ base #VMs, x ¼ scale up #VMs4 Select profile: perf(VMbase) ¼ {perf(n x VMtype1),.. perf(n x VMtype-j)} n ¼ #VMs
w/ equivalent performance5 Minimize cost: Select min{cost(VMtype1), .. cost(VMtype-j)}
LLOYD ET AL.: DEMYSTIFYING THE CLOUDS: HARNESSING RESOURCE UTILIZATION MODELS FOR COST EFFECTIVE INFRASTRUCTURE... 671
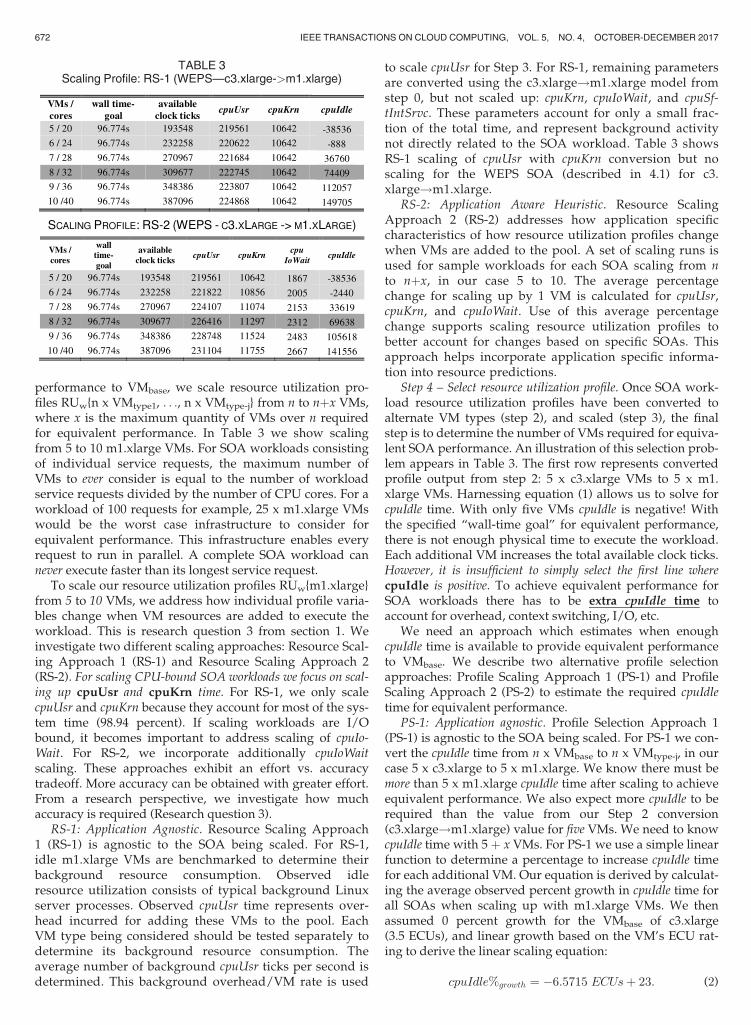
performance to VMbase, we scale resource utilization pro-files RUw{n x VMtype1, . . ., n x VMtype-j} from n to nþx VMs,where x is the maximum quantity of VMs over n requiredfor equivalent performance. In Table 3 we show scalingfrom 5 to 10 m1.xlarge VMs. For SOA workloads consistingof individual service requests, the maximum number ofVMs to ever consider is equal to the number of workloadservice requests divided by the number of CPU cores. For aworkload of 100 requests for example, 25 x m1.xlarge VMswould be the worst case infrastructure to consider forequivalent performance. This infrastructure enables everyrequest to run in parallel. A complete SOA workload cannever execute faster than its longest service request.
To scale our resource utilization profiles RUw{m1.xlarge}from 5 to 10 VMs, we address how individual profile varia-bles change when VM resources are added to execute theworkload. This is research question 3 from section 1. Weinvestigate two different scaling approaches: Resource Scal-ing Approach 1 (RS-1) and Resource Scaling Approach 2(RS-2). For scaling CPU-bound SOA workloads we focus on scal-ing up cpuUsr and cpuKrn time. For RS-1, we only scalecpuUsr and cpuKrn because they account for most of the sys-tem time (98.94 percent). If scaling workloads are I/Obound, it becomes important to address scaling of cpuIo-Wait. For RS-2, we incorporate additionally cpuIoWaitscaling. These approaches exhibit an effort vs. accuracytradeoff. More accuracy can be obtained with greater effort.From a research perspective, we investigate how muchaccuracy is required (Research question 3).
RS-1: Application Agnostic. Resource Scaling Approach1 (RS-1) is agnostic to the SOA being scaled. For RS-1,idle m1.xlarge VMs are benchmarked to determine theirbackground resource consumption. Observed idleresource utilization consists of typical background Linuxserver processes. Observed cpuUsr time represents over-head incurred for adding these VMs to the pool. EachVM type being considered should be tested separately todetermine its background resource consumption. Theaverage number of background cpuUsr ticks per second isdetermined. This background overhead/VM rate is used
to scale cpuUsr for Step 3. For RS-1, remaining parametersare converted using the c3.xlarge!m1.xlarge model fromstep 0, but not scaled up: cpuKrn, cpuIoWait, and cpuSf-tIntSrvc. These parameters account for only a small frac-tion of the total time, and represent background activitynot directly related to the SOA workload. Table 3 showsRS-1 scaling of cpuUsr with cpuKrn conversion but noscaling for the WEPS SOA (described in 4.1) for c3.xlarge!m1.xlarge.
RS-2: Application Aware Heuristic. Resource ScalingApproach 2 (RS-2) addresses how application specificcharacteristics of how resource utilization profiles changewhen VMs are added to the pool. A set of scaling runs isused for sample workloads for each SOA scaling from nto nþx, in our case 5 to 10. The average percentagechange for scaling up by 1 VM is calculated for cpuUsr,cpuKrn, and cpuIoWait. Use of this average percentagechange supports scaling resource utilization profiles tobetter account for changes based on specific SOAs. Thisapproach helps incorporate application specific informa-tion into resource predictions.
Step 4 – Select resource utilization profile. Once SOA work-load resource utilization profiles have been converted toalternate VM types (step 2), and scaled (step 3), the finalstep is to determine the number of VMs required for equiva-lent SOA performance. An illustration of this selection prob-lem appears in Table 3. The first row represents convertedprofile output from step 2: 5 x c3.xlarge VMs to 5 x m1.xlarge VMs. Harnessing equation (1) allows us to solve forcpuIdle time. With only five VMs cpuIdle is negative! Withthe specified “wall-time goal” for equivalent performance,there is not enough physical time to execute the workload.Each additional VM increases the total available clock ticks.However, it is insufficient to simply select the first line wherecpuIdle is positive. To achieve equivalent performance forSOA workloads there has to be extra cpuIdle time toaccount for overhead, context switching, I/O, etc.
We need an approach which estimates when enoughcpuIdle time is available to provide equivalent performanceto VMbase. We describe two alternative profile selectionapproaches: Profile Scaling Approach 1 (PS-1) and ProfileScaling Approach 2 (PS-2) to estimate the required cpuIdletime for equivalent performance.
PS-1: Application agnostic. Profile Selection Approach 1(PS-1) is agnostic to the SOA being scaled. For PS-1 we con-vert the cpuIdle time from n x VMbase to n x VMtype-j, in ourcase 5 x c3.xlarge to 5 x m1.xlarge. We know there must bemore than 5 x m1.xlarge cpuIdle time after scaling to achieveequivalent performance. We also expect more cpuIdle to berequired than the value from our Step 2 conversion(c3.xlarge!m1.xlarge) value for five VMs. We need to knowcpuIdle time with 5 þ x VMs. For PS-1 we use a simple linearfunction to determine a percentage to increase cpuIdle timefor each additional VM. Our equation is derived by calculat-ing the average observed percent growth in cpuIdle time forall SOAs when scaling up with m1.xlarge VMs. We thenassumed 0 percent growth for the VMbase of c3.xlarge(3.5 ECUs), and linear growth based on the VM’s ECU rat-ing to derive the linear scaling equation:
cpuIdle%growth ¼ �6:5715 ECUsþ 23: (2)
TABLE 3Scaling Profile: RS-1 (WEPS—c3.xlarge->m1.xlarge)
672 IEEE TRANSACTIONS ON CLOUD COMPUTING, VOL. 5, NO. 4, OCTOBER-DECEMBER 2017
Our equation expresses percentage growth as a num-ber from 1 to 100, and supports increasing cpuIdle timefaster for slower VM types. From SOA workload testingwe observe that slower VMs require more cpuIdle toachieve equivalent performance. This approach to scalecpuIdle for profile selection is application agnostic. Wetake advantage of ECUs already being a normalized mea-sure of CPU performance. If ECUs were unavailable asimilar approach using CPU clock speed could be derivedthough we would need to compensate for generationalimprovements in CPU performance. For example a 2012Intel Xeon CPU at 2.5 GHz is somewhat faster than a2007 Xeon at the same clock rate. Table 3 shows PS-1selection as the dark grey row. PS-1 and PS-2 identify thesame row in the scaling profile example.
PS-2: Application aware heuristic. Our second ProfileSelection Approach (PS-2) attempts to address applicationspecific characteristics relating to cpuIdle time when infra-structure is scaled up. We convert cpuIdle time from c3.xlarge to m1.xlarge. After conversion, we scale therequired cpuIdle time for selection using the SOA specificaverage percentage change in cpuIdle derived from appli-cation scaling test observations. This approach does notassume cpuIdle scales the same for all SOAs, but appliesan application specific scaling factor to support predictionof required cpuIdle time. Table 3 shows PS-2 selection asthe dark grey row.
Step 5 – Minimize cost. Once profile selection has identi-fied the number of VMs for equivalent performance usingalternate VM types, infrastructure costs can be calculated.Cost is determined by multiplying the required numberof VMs by fixed or spot market VMtype prices to deter-mine deployment costs. The lowest priced infrastructurecan be selected for SOA hosting while ensuring equiva-lent performance.
4 EXPERIMENTAL INVESTIGATION
4.1 Environmental Modeling Services
To evaluate our workload cost prediction methodologyand investigate the research questions presented inSection 1, we harness six environmental science SOAsfrom the cloud services innovation platform (CSIP) [24],[25]. These six SOAs represent a diverse array of applica-tions with varying computational requirements and archi-tectures. CSIP has been developed by Colorado StateUniversity with the US Department of Agriculture(USDA) to provide environmental modeling services.
CSIP provides a common Java-based framework forREST/JSON based service development. CSIP servicesare deployed using the Apache Tomcat web container[26]. Our six SOAs include: the Revised Universal SoilLoss Equation – Version 2 (RUSLE2) [27], the Wind Ero-sion Prediction System (WEPS) [28], two versions of theSoil Water Assessment Tool for modeling interactivechannel degradation (SWAT-DEG) [29], [30], the Compre-hensive Flow Analysis LOAD ESTimator (CFA-LOAD-EST) [31], [32], and the Comprehensive Flow AnalysisLoad Duration Curve (CFA-LDC) [33].
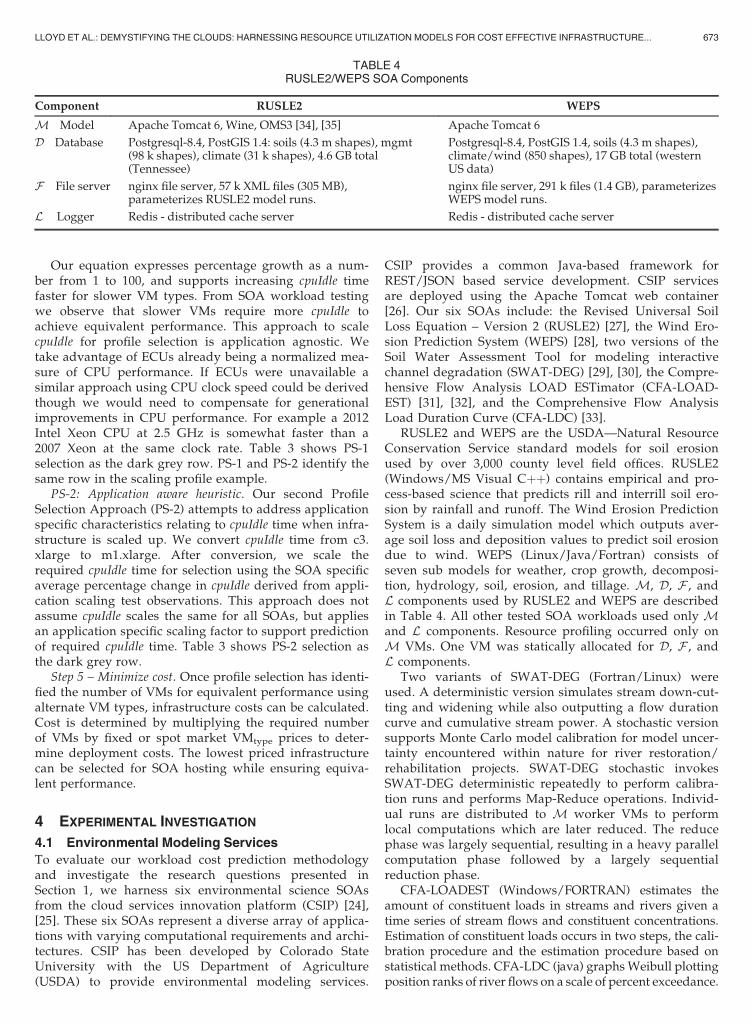
RUSLE2 and WEPS are the USDA—Natural ResourceConservation Service standard models for soil erosionused by over 3,000 county level field offices. RUSLE2(Windows/MS Visual Cþþ) contains empirical and pro-cess-based science that predicts rill and interrill soil ero-sion by rainfall and runoff. The Wind Erosion PredictionSystem is a daily simulation model which outputs aver-age soil loss and deposition values to predict soil erosiondue to wind. WEPS (Linux/Java/Fortran) consists ofseven sub models for weather, crop growth, decomposi-tion, hydrology, soil, erosion, and tillage. M, D, F , andL components used by RUSLE2 and WEPS are describedin Table 4. All other tested SOA workloads used only Mand L components. Resource profiling occurred only onM VMs. One VM was statically allocated for D, F , andL components.
Two variants of SWAT-DEG (Fortran/Linux) wereused. A deterministic version simulates stream down-cut-ting and widening while also outputting a flow durationcurve and cumulative stream power. A stochastic versionsupports Monte Carlo model calibration for model uncer-tainty encountered within nature for river restoration/rehabilitation projects. SWAT-DEG stochastic invokesSWAT-DEG deterministic repeatedly to perform calibra-tion runs and performs Map-Reduce operations. Individ-ual runs are distributed to M worker VMs to performlocal computations which are later reduced. The reducephase was largely sequential, resulting in a heavy parallelcomputation phase followed by a largely sequentialreduction phase.
CFA-LOADEST (Windows/FORTRAN) estimates theamount of constituent loads in streams and rivers given atime series of stream flows and constituent concentrations.Estimation of constituent loads occurs in two steps, the cali-bration procedure and the estimation procedure based onstatistical methods. CFA-LDC (java) graphsWeibull plottingposition ranks of river flows on a scale of percent exceedance.
TABLE 4RUSLE2/WEPS SOA Components
Component RUSLE2 WEPS
M Model Apache Tomcat 6, Wine, OMS3 [34], [35] Apache Tomcat 6
D Database Postgresql-8.4, PostGIS 1.4: soils (4.3 m shapes), mgmt(98 k shapes), climate (31 k shapes), 4.6 GB total(Tennessee)
Postgresql-8.4, PostGIS 1.4, soils (4.3 m shapes),climate/wind (850 shapes), 17 GB total (westernUS data)
F File server nginx file server, 57 k XML files (305 MB),parameterizes RUSLE2 model runs.
nginx file server, 291 k files (1.4 GB), parameterizesWEPS model runs.
L Logger Redis - distributed cache server Redis - distributed cache server
LLOYD ET AL.: DEMYSTIFYING THE CLOUDS: HARNESSING RESOURCE UTILIZATION MODELS FOR COST EFFECTIVE INFRASTRUCTURE... 673
Graphing flow values in this way allows for a quick visuali-zation of the variability of flow for different flow regimes.
4.2 The Virtual Machine Scaler
To facilitate performance profiling of virtual infrastruc-tures for hosting SOA workloads we developed the Vir-tual Machine Scaler, a REST/JSON-based web servicesapplication [15]. VM-Scaler harnesses the Amazon EC2API to support application profiling and cloud infrastruc-ture management and currently supports Amazon’s pub-lic cloud (EC2) and private clouds running Eucalyptus.VM-Scaler provides cloud control while abstracting theunderlying IaaS cloud and can be extended to supportany EC2 compatible virtual infrastructure manager. Keyfeatures are provided to support workload managementand IaaS cloud research. Features include: hotspot detec-tion, dynamic scaling, VM management and placement,job scheduling and proxy services, VM workload profil-ing, and VM worker pools.
Upon initialization VM-Scaler probes the host cloud andcollects metadata including location and state informationfor all VMs and physical hosts (private IaaS only). An agentinstalled on each VM sends resource utilization data to VM-Scaler at fixed intervals. Collected resource utilization varia-bles are described previously in Table 1. Application andload balancer configuration is performed automatically asneeded to support workload execution and profiling tasks.VM-Scaler builds on previous research investigating the useof resource utilization variables for guiding cloud applica-tion deployment [8], [13].
VM-Scaler supports group management of VMs using aconstruct known as a “VM pool”. Common operations canbe applied to pools in parallel to support flushing memorycaches, restarting the web container, checkpointing resourceutilization and running scripts. Pools support reuse of VMsfor multiple workloads as VMs can be returned to the poolafter job assignment. For Amazon’s public cloud, VMs arebilled for a minimum of one hour. This coarse-grained bill-ing cycle makes it advantageous to retain VMs for at least1 hour for potential reuse. Pools maintain a minimum num-ber of members and can be instructed to spawn new VMsin anticipation of future demand to help alleviate VMlaunch latency.
4.3 Resource Utilization Checkpointing
VM-Scaler supports collection of resource utilization dataacross a pool of worker VMs providing SOA workload exe-cution. A simple script installed on each VM sends VM-Scaler resource utilization data at preconfigured intervals.VM-Scaler’s checkpoint service is called to mark the starttime for workload execution. Resource utilization deltas canbe calculated from any checkpoint to the present to capturetotal resource utilization across a pool of VMs. All VMs runLinux’s Network Time Protocol daemon (ntpd) to synchro-nize clock times. VM-Scaler ensures resource utilizationdata collection is synchronized to within one second.Resource utilization checkpointing in VM-Scaler has beentested using pools >100 VMs.
Resource utilization checkpoints allow for a compositeview of the total resource consumption of an SOA
workload. This novel feature helps characterize diverseSOA workloads whose execution is distributed across anarray of VMs. Composite resource utilization profiles canbe harnessed to examine SOA workload characteristics,resource use efficiency, perform analysis, and to buildmodels to support infrastructure and cost prediction.
4.4 Hardware Configuration
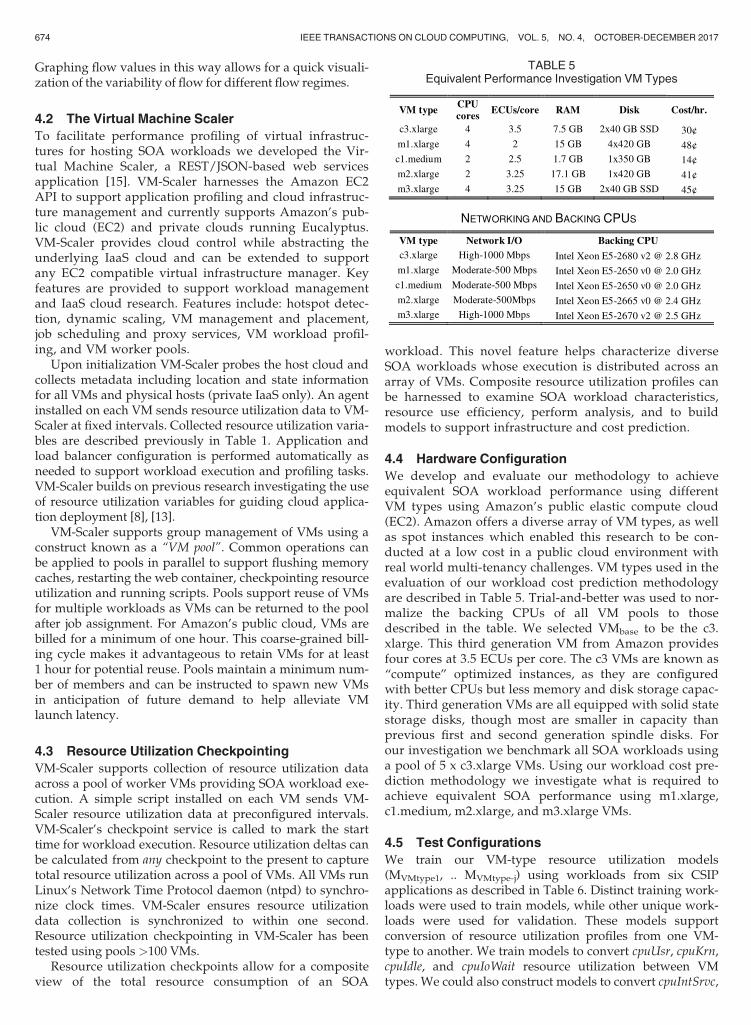
We develop and evaluate our methodology to achieveequivalent SOA workload performance using differentVM types using Amazon’s public elastic compute cloud(EC2). Amazon offers a diverse array of VM types, as wellas spot instances which enabled this research to be con-ducted at a low cost in a public cloud environment withreal world multi-tenancy challenges. VM types used in theevaluation of our workload cost prediction methodologyare described in Table 5. Trial-and-better was used to nor-malize the backing CPUs of all VM pools to thosedescribed in the table. We selected VMbase to be the c3.xlarge. This third generation VM from Amazon providesfour cores at 3.5 ECUs per core. The c3 VMs are known as“compute” optimized instances, as they are configuredwith better CPUs but less memory and disk storage capac-ity. Third generation VMs are all equipped with solid statestorage disks, though most are smaller in capacity thanprevious first and second generation spindle disks. Forour investigation we benchmark all SOA workloads usinga pool of 5 x c3.xlarge VMs. Using our workload cost pre-diction methodology we investigate what is required toachieve equivalent SOA performance using m1.xlarge,c1.medium, m2.xlarge, and m3.xlarge VMs.
4.5 Test Configurations
We train our VM-type resource utilization models(MVMtype1, .. MVMtype-j) using workloads from six CSIPapplications as described in Table 6. Distinct training work-loads were used to train models, while other unique work-loads were used for validation. These models supportconversion of resource utilization profiles from one VM-type to another. We train models to convert cpuUsr, cpuKrn,cpuIdle, and cpuIoWait resource utilization between VMtypes. We could also construct models to convert cpuIntSrvc,
TABLE 5Equivalent Performance Investigation VM Types
674 IEEE TRANSACTIONS ON CLOUD COMPUTING, VOL. 5, NO. 4, OCTOBER-DECEMBER 2017
cspuSftIntSrvc, cpuNice, and cpuSteal. However, for our SOAworkloads, these resource utilization variables are shown tohave very little impact on total wall clock time.
In Section 3.1, we discussed the challenges cpuStealpresents in accounting for wall clock time. We have chosento avoid these challenges by selecting SOA workloads andVM type configurations which exhibit very low cpuStealtime. It should be noted that it was not difficult to avoidthese cpuSteal challenges for this work. Accounting for cpuS-teal time may be possible by investigating the use of offsetvalues to account for missing clock ticks in the presence ofrelatively constant cpuSteal.
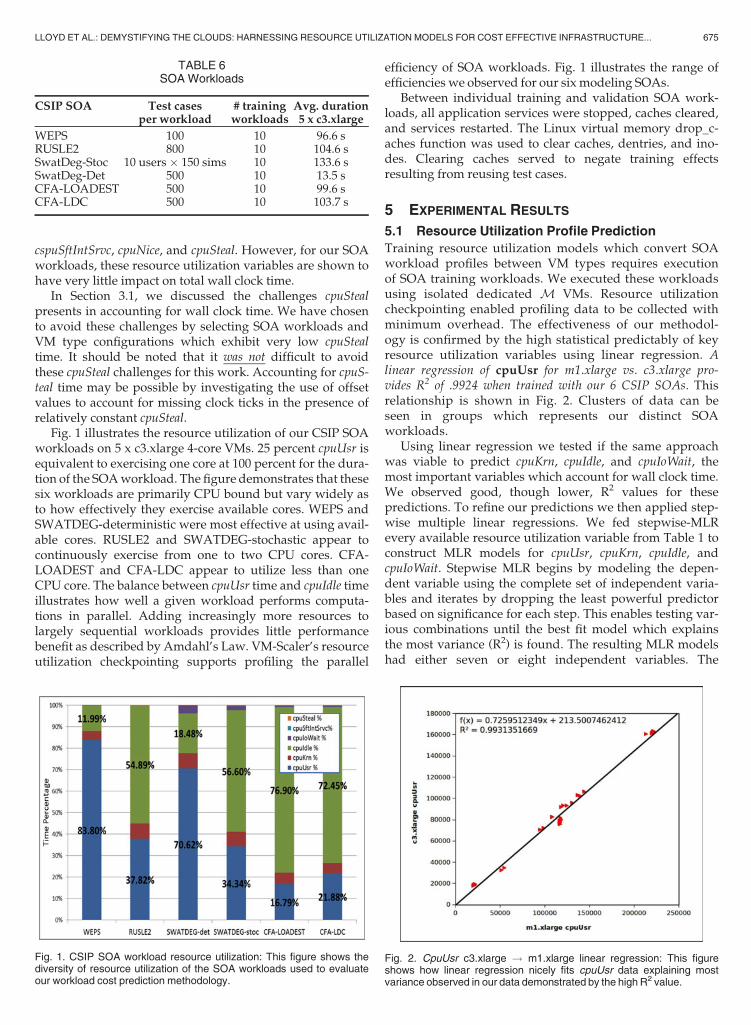
Fig. 1 illustrates the resource utilization of our CSIP SOAworkloads on 5 x c3.xlarge 4-core VMs. 25 percent cpuUsr isequivalent to exercising one core at 100 percent for the dura-tion of the SOAworkload. The figure demonstrates that thesesix workloads are primarily CPU bound but vary widely asto how effectively they exercise available cores. WEPS andSWATDEG-deterministic were most effective at using avail-able cores. RUSLE2 and SWATDEG-stochastic appear tocontinuously exercise from one to two CPU cores. CFA-LOADEST and CFA-LDC appear to utilize less than oneCPU core. The balance between cpuUsr time and cpuIdle timeillustrates how well a given workload performs computa-tions in parallel. Adding increasingly more resources tolargely sequential workloads provides little performancebenefit as described by Amdahl’s Law. VM-Scaler’s resourceutilization checkpointing supports profiling the parallel
efficiency of SOA workloads. Fig. 1 illustrates the range ofefficiencies we observed for our six modeling SOAs.
Between individual training and validation SOA work-loads, all application services were stopped, caches cleared,and services restarted. The Linux virtual memory drop_c-aches function was used to clear caches, dentries, and ino-des. Clearing caches served to negate training effectsresulting from reusing test cases.
5 EXPERIMENTAL RESULTS
5.1 Resource Utilization Profile Prediction
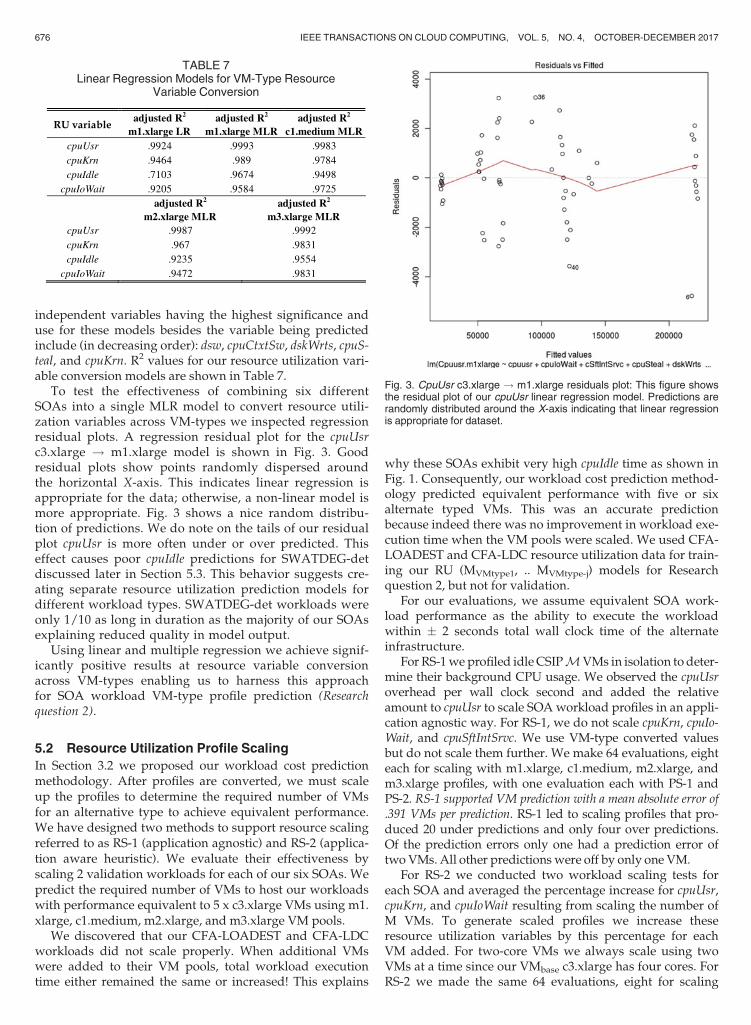
Training resource utilization models which convert SOAworkload profiles between VM types requires executionof SOA training workloads. We executed these workloadsusing isolated dedicated M VMs. Resource utilizationcheckpointing enabled profiling data to be collected withminimum overhead. The effectiveness of our methodol-ogy is confirmed by the high statistical predictably of keyresource utilization variables using linear regression. Alinear regression of cpuUsr for m1.xlarge vs. c3.xlarge pro-vides R2 of .9924 when trained with our 6 CSIP SOAs. Thisrelationship is shown in Fig. 2. Clusters of data can beseen in groups which represents our distinct SOAworkloads.
Using linear regression we tested if the same approachwas viable to predict cpuKrn, cpuIdle, and cpuIoWait, themost important variables which account for wall clock time.We observed good, though lower, R2 values for thesepredictions. To refine our predictions we then applied step-wise multiple linear regressions. We fed stepwise-MLRevery available resource utilization variable from Table 1 toconstruct MLR models for cpuUsr, cpuKrn, cpuIdle, andcpuIoWait. Stepwise MLR begins by modeling the depen-dent variable using the complete set of independent varia-bles and iterates by dropping the least powerful predictorbased on significance for each step. This enables testing var-ious combinations until the best fit model which explainsthe most variance (R2) is found. The resulting MLR modelshad either seven or eight independent variables. The
TABLE 6SOAWorkloads
CSIP SOA Test casesper workload
# trainingworkloads
Avg. duration5 x c3.xlarge
WEPS 100 10 96.6 sRUSLE2 800 10 104.6 sSwatDeg-Stoc 10 users � 150 sims 10 133.6 sSwatDeg-Det 500 10 13.5 sCFA-LOADEST 500 10 99.6 sCFA-LDC 500 10 103.7 s
Fig. 1. CSIP SOA workload resource utilization: This figure shows thediversity of resource utilization of the SOA workloads used to evaluateour workload cost prediction methodology.
Fig. 2. CpuUsr c3.xlarge ! m1.xlarge linear regression: This figureshows how linear regression nicely fits cpuUsr data explaining mostvariance observed in our data demonstrated by the high R2 value.
LLOYD ET AL.: DEMYSTIFYING THE CLOUDS: HARNESSING RESOURCE UTILIZATION MODELS FOR COST EFFECTIVE INFRASTRUCTURE... 675
independent variables having the highest significance anduse for these models besides the variable being predictedinclude (in decreasing order): dsw, cpuCtxtSw, dskWrts, cpuS-teal, and cpuKrn. R2 values for our resource utilization vari-able conversion models are shown in Table 7.
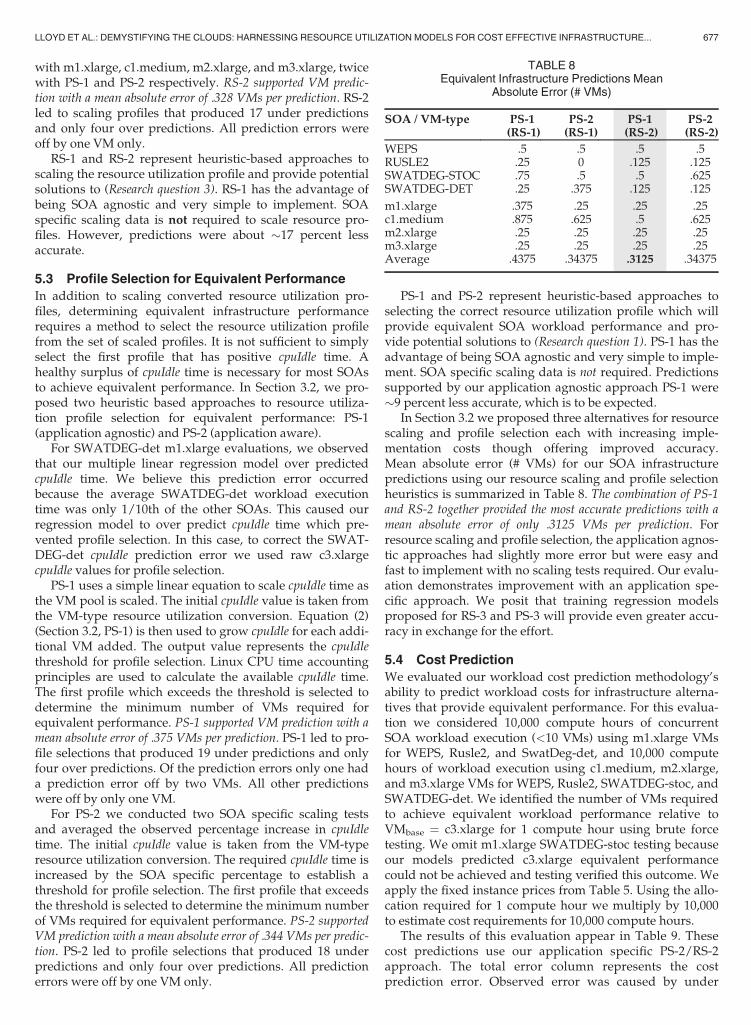
To test the effectiveness of combining six differentSOAs into a single MLR model to convert resource utili-zation variables across VM-types we inspected regressionresidual plots. A regression residual plot for the cpuUsrc3.xlarge ! m1.xlarge model is shown in Fig. 3. Goodresidual plots show points randomly dispersed aroundthe horizontal X-axis. This indicates linear regression isappropriate for the data; otherwise, a non-linear model ismore appropriate. Fig. 3 shows a nice random distribu-tion of predictions. We do note on the tails of our residualplot cpuUsr is more often under or over predicted. Thiseffect causes poor cpuIdle predictions for SWATDEG-detdiscussed later in Section 5.3. This behavior suggests cre-ating separate resource utilization prediction models fordifferent workload types. SWATDEG-det workloads wereonly 1/10 as long in duration as the majority of our SOAsexplaining reduced quality in model output.
Using linear and multiple regression we achieve signif-icantly positive results at resource variable conversionacross VM-types enabling us to harness this approachfor SOA workload VM-type profile prediction (Researchquestion 2).
5.2 Resource Utilization Profile Scaling
In Section 3.2 we proposed our workload cost predictionmethodology. After profiles are converted, we must scaleup the profiles to determine the required number of VMsfor an alternative type to achieve equivalent performance.We have designed two methods to support resource scalingreferred to as RS-1 (application agnostic) and RS-2 (applica-tion aware heuristic). We evaluate their effectiveness byscaling 2 validation workloads for each of our six SOAs. Wepredict the required number of VMs to host our workloadswith performance equivalent to 5 x c3.xlarge VMs using m1.xlarge, c1.medium, m2.xlarge, and m3.xlarge VM pools.
We discovered that our CFA-LOADEST and CFA-LDCworkloads did not scale properly. When additional VMswere added to their VM pools, total workload executiontime either remained the same or increased! This explains
why these SOAs exhibit very high cpuIdle time as shown inFig. 1. Consequently, our workload cost prediction method-ology predicted equivalent performance with five or sixalternate typed VMs. This was an accurate predictionbecause indeed there was no improvement in workload exe-cution time when the VM pools were scaled. We used CFA-LOADEST and CFA-LDC resource utilization data for train-ing our RU (MVMtype1, .. MVMtype-j) models for Researchquestion 2, but not for validation.
For our evaluations, we assume equivalent SOA work-load performance as the ability to execute the workloadwithin � 2 seconds total wall clock time of the alternateinfrastructure.
For RS-1we profiled idleCSIPMVMs in isolation to deter-mine their background CPU usage. We observed the cpuUsroverhead per wall clock second and added the relativeamount to cpuUsr to scale SOA workload profiles in an appli-cation agnostic way. For RS-1, we do not scale cpuKrn, cpuIo-Wait, and cpuSftIntSrvc. We use VM-type converted valuesbut do not scale them further. We make 64 evaluations, eighteach for scaling with m1.xlarge, c1.medium, m2.xlarge, andm3.xlarge profiles, with one evaluation each with PS-1 andPS-2. RS-1 supported VM prediction with a mean absolute error of.391 VMs per prediction. RS-1 led to scaling profiles that pro-duced 20 under predictions and only four over predictions.Of the prediction errors only one had a prediction error oftwo VMs. All other predictionswere off by only one VM.
For RS-2 we conducted two workload scaling tests foreach SOA and averaged the percentage increase for cpuUsr,cpuKrn, and cpuIoWait resulting from scaling the number ofM VMs. To generate scaled profiles we increase theseresource utilization variables by this percentage for eachVM added. For two-core VMs we always scale using twoVMs at a time since our VMbase c3.xlarge has four cores. ForRS-2 we made the same 64 evaluations, eight for scaling
TABLE 7Linear Regression Models for VM-Type Resource
Variable Conversion
Fig. 3. CpuUsr c3.xlarge ! m1.xlarge residuals plot: This figure showsthe residual plot of our cpuUsr linear regression model. Predictions arerandomly distributed around the X-axis indicating that linear regressionis appropriate for dataset.
676 IEEE TRANSACTIONS ON CLOUD COMPUTING, VOL. 5, NO. 4, OCTOBER-DECEMBER 2017
with m1.xlarge, c1.medium, m2.xlarge, and m3.xlarge, twicewith PS-1 and PS-2 respectively. RS-2 supported VM predic-tion with a mean absolute error of .328 VMs per prediction. RS-2led to scaling profiles that produced 17 under predictionsand only four over predictions. All prediction errors wereoff by one VM only.
RS-1 and RS-2 represent heuristic-based approaches toscaling the resource utilization profile and provide potentialsolutions to (Research question 3). RS-1 has the advantage ofbeing SOA agnostic and very simple to implement. SOAspecific scaling data is not required to scale resource pro-files. However, predictions were about �17 percent lessaccurate.
5.3 Profile Selection for Equivalent Performance
In addition to scaling converted resource utilization pro-files, determining equivalent infrastructure performancerequires a method to select the resource utilization profilefrom the set of scaled profiles. It is not sufficient to simplyselect the first profile that has positive cpuIdle time. Ahealthy surplus of cpuIdle time is necessary for most SOAsto achieve equivalent performance. In Section 3.2, we pro-posed two heuristic based approaches to resource utiliza-tion profile selection for equivalent performance: PS-1(application agnostic) and PS-2 (application aware).
For SWATDEG-det m1.xlarge evaluations, we observedthat our multiple linear regression model over predictedcpuIdle time. We believe this prediction error occurredbecause the average SWATDEG-det workload executiontime was only 1/10th of the other SOAs. This caused ourregression model to over predict cpuIdle time which pre-vented profile selection. In this case, to correct the SWAT-DEG-det cpuIdle prediction error we used raw c3.xlargecpuIdle values for profile selection.
PS-1 uses a simple linear equation to scale cpuIdle time asthe VM pool is scaled. The initial cpuIdle value is taken fromthe VM-type resource utilization conversion. Equation (2)(Section 3.2, PS-1) is then used to grow cpuIdle for each addi-tional VM added. The output value represents the cpuIdlethreshold for profile selection. Linux CPU time accountingprinciples are used to calculate the available cpuIdle time.The first profile which exceeds the threshold is selected todetermine the minimum number of VMs required forequivalent performance. PS-1 supported VM prediction with amean absolute error of .375 VMs per prediction. PS-1 led to pro-file selections that produced 19 under predictions and onlyfour over predictions. Of the prediction errors only one hada prediction error off by two VMs. All other predictionswere off by only one VM.
For PS-2 we conducted two SOA specific scaling testsand averaged the observed percentage increase in cpuIdletime. The initial cpuIdle value is taken from the VM-typeresource utilization conversion. The required cpuIdle time isincreased by the SOA specific percentage to establish athreshold for profile selection. The first profile that exceedsthe threshold is selected to determine the minimum numberof VMs required for equivalent performance. PS-2 supportedVM prediction with a mean absolute error of .344 VMs per predic-tion. PS-2 led to profile selections that produced 18 underpredictions and only four over predictions. All predictionerrors were off by one VM only.
PS-1 and PS-2 represent heuristic-based approaches toselecting the correct resource utilization profile which willprovide equivalent SOA workload performance and pro-vide potential solutions to (Research question 1). PS-1 has theadvantage of being SOA agnostic and very simple to imple-ment. SOA specific scaling data is not required. Predictionssupported by our application agnostic approach PS-1 were�9 percent less accurate, which is to be expected.
In Section 3.2 we proposed three alternatives for resourcescaling and profile selection each with increasing imple-mentation costs though offering improved accuracy.Mean absolute error (# VMs) for our SOA infrastructurepredictions using our resource scaling and profile selectionheuristics is summarized in Table 8. The combination of PS-1and RS-2 together provided the most accurate predictions with amean absolute error of only .3125 VMs per prediction. Forresource scaling and profile selection, the application agnos-tic approaches had slightly more error but were easy andfast to implement with no scaling tests required. Our evalu-ation demonstrates improvement with an application spe-cific approach. We posit that training regression modelsproposed for RS-3 and PS-3 will provide even greater accu-racy in exchange for the effort.
5.4 Cost Prediction
We evaluated our workload cost prediction methodology’sability to predict workload costs for infrastructure alterna-tives that provide equivalent performance. For this evalua-tion we considered 10,000 compute hours of concurrentSOA workload execution (<10 VMs) using m1.xlarge VMsfor WEPS, Rusle2, and SwatDeg-det, and 10,000 computehours of workload execution using c1.medium, m2.xlarge,and m3.xlarge VMs for WEPS, Rusle2, SWATDEG-stoc, andSWATDEG-det. We identified the number of VMs requiredto achieve equivalent workload performance relative toVMbase ¼ c3.xlarge for 1 compute hour using brute forcetesting. We omit m1.xlarge SWATDEG-stoc testing becauseour models predicted c3.xlarge equivalent performancecould not be achieved and testing verified this outcome. Weapply the fixed instance prices from Table 5. Using the allo-cation required for 1 compute hour we multiply by 10,000to estimate cost requirements for 10,000 compute hours.
The results of this evaluation appear in Table 9. Thesecost predictions use our application specific PS-2/RS-2approach. The total error column represents the costprediction error. Observed error was caused by under
TABLE 8Equivalent Infrastructure Predictions Mean
Absolute Error (# VMs)
SOA / VM-type PS-1(RS-1)
PS-2(RS-1)
PS-1(RS-2)
PS-2(RS-2)
WEPS .5 .5 .5 .5RUSLE2 .25 0 .125 .125SWATDEG-STOC .75 .5 .5 .625SWATDEG-DET .25 .375 .125 .125
m1.xlarge .375 .25 .25 .25c1.medium .875 .625 .5 .625m2.xlarge .25 .25 .25 .25m3.xlarge .25 .25 .25 .25Average .4375 .34375 .3125 .34375
LLOYD ET AL.: DEMYSTIFYING THE CLOUDS: HARNESSING RESOURCE UTILIZATION MODELS FOR COST EFFECTIVE INFRASTRUCTURE... 677
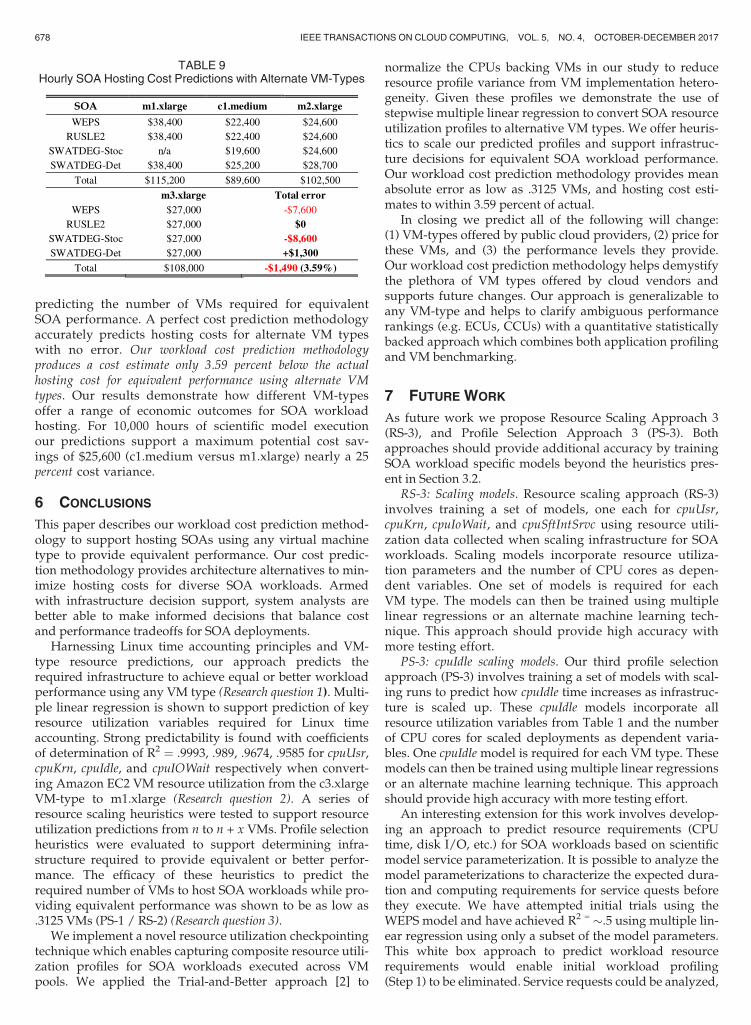
predicting the number of VMs required for equivalentSOA performance. A perfect cost prediction methodologyaccurately predicts hosting costs for alternate VM typeswith no error. Our workload cost prediction methodologyproduces a cost estimate only 3.59 percent below the actualhosting cost for equivalent performance using alternate VMtypes. Our results demonstrate how different VM-typesoffer a range of economic outcomes for SOA workloadhosting. For 10,000 hours of scientific model executionour predictions support a maximum potential cost sav-ings of $25,600 (c1.medium versus m1.xlarge) nearly a 25percent cost variance.
6 CONCLUSIONS
This paper describes our workload cost prediction method-ology to support hosting SOAs using any virtual machinetype to provide equivalent performance. Our cost predic-tion methodology provides architecture alternatives to min-imize hosting costs for diverse SOA workloads. Armedwith infrastructure decision support, system analysts arebetter able to make informed decisions that balance costand performance tradeoffs for SOA deployments.
Harnessing Linux time accounting principles and VM-type resource predictions, our approach predicts therequired infrastructure to achieve equal or better workloadperformance using any VM type (Research question 1). Multi-ple linear regression is shown to support prediction of keyresource utilization variables required for Linux timeaccounting. Strong predictability is found with coefficientsof determination of R2 ¼ .9993, .989, .9674, .9585 for cpuUsr,cpuKrn, cpuIdle, and cpuIOWait respectively when convert-ing Amazon EC2 VM resource utilization from the c3.xlargeVM-type to m1.xlarge (Research question 2). A series ofresource scaling heuristics were tested to support resourceutilization predictions from n to n + x VMs. Profile selectionheuristics were evaluated to support determining infra-structure required to provide equivalent or better perfor-mance. The efficacy of these heuristics to predict therequired number of VMs to host SOA workloads while pro-viding equivalent performance was shown to be as low as.3125 VMs (PS-1 / RS-2) (Research question 3).
We implement a novel resource utilization checkpointingtechnique which enables capturing composite resource utili-zation profiles for SOA workloads executed across VMpools. We applied the Trial-and-Better approach [2] to
normalize the CPUs backing VMs in our study to reduceresource profile variance from VM implementation hetero-geneity. Given these profiles we demonstrate the use ofstepwise multiple linear regression to convert SOA resourceutilization profiles to alternative VM types. We offer heuris-tics to scale our predicted profiles and support infrastruc-ture decisions for equivalent SOA workload performance.Our workload cost prediction methodology provides meanabsolute error as low as .3125 VMs, and hosting cost esti-mates to within 3.59 percent of actual.
In closing we predict all of the following will change:(1) VM-types offered by public cloud providers, (2) price forthese VMs, and (3) the performance levels they provide.Our workload cost prediction methodology helps demystifythe plethora of VM types offered by cloud vendors andsupports future changes. Our approach is generalizable toany VM-type and helps to clarify ambiguous performancerankings (e.g. ECUs, CCUs) with a quantitative statisticallybacked approach which combines both application profilingand VM benchmarking.
7 FUTURE WORK
As future work we propose Resource Scaling Approach 3(RS-3), and Profile Selection Approach 3 (PS-3). Bothapproaches should provide additional accuracy by trainingSOA workload specific models beyond the heuristics pres-ent in Section 3.2.
RS-3: Scaling models. Resource scaling approach (RS-3)involves training a set of models, one each for cpuUsr,cpuKrn, cpuIoWait, and cpuSftIntSrvc using resource utili-zation data collected when scaling infrastructure for SOAworkloads. Scaling models incorporate resource utiliza-tion parameters and the number of CPU cores as depen-dent variables. One set of models is required for eachVM type. The models can then be trained using multiplelinear regressions or an alternate machine learning tech-nique. This approach should provide high accuracy withmore testing effort.
PS-3: cpuIdle scaling models. Our third profile selectionapproach (PS-3) involves training a set of models with scal-ing runs to predict how cpuIdle time increases as infrastruc-ture is scaled up. These cpuIdle models incorporate allresource utilization variables from Table 1 and the numberof CPU cores for scaled deployments as dependent varia-bles. One cpuIdle model is required for each VM type. Thesemodels can then be trained using multiple linear regressionsor an alternate machine learning technique. This approachshould provide high accuracy with more testing effort.
An interesting extension for this work involves develop-ing an approach to predict resource requirements (CPUtime, disk I/O, etc.) for SOA workloads based on scientificmodel service parameterization. It is possible to analyze themodel parameterizations to characterize the expected dura-tion and computing requirements for service quests beforethey execute. We have attempted initial trials using theWEPS model and have achieved R2 = �.5 using multiple lin-ear regression using only a subset of the model parameters.This white box approach to predict workload resourcerequirements would enable initial workload profiling(Step 1) to be eliminated. Service requests could be analyzed,
TABLE 9Hourly SOA Hosting Cost Predictions with Alternate VM-Types
678 IEEE TRANSACTIONS ON CLOUD COMPUTING, VOL. 5, NO. 4, OCTOBER-DECEMBER 2017
not run, to predict workload execution costs and deploymentinfrastructure. Developing this approach requires harness-ing domain specific characteristics of service requests andthere will likely be limitations to the ability when trainingmodels to accurately predict model service behavior.
ACKNOWLEDGMENTS
This research has been supported in part by funding fromthe US Department of Homeland Security’s Long Rangeprogram (HSHQDC-13-C-B0018) and the US National Sci-ence Foundation’s Computer Systems Research Program(CNS-1253908).
REFERENCES
[1] Amazon EC2 Instance Comparison [Online]. Available: http://www.ec2instances.info, 2014.
[2] Z. Ou, H. Zhuang, A. Lukyanenko, J. K. Nurminen, P. Hui, V.Mazalov, and A. Yla-Jaaski, “Is the same instance type createdequal? exploiting heterogeneity of public clouds,” IEEE Trans.Cloud Comput., vol. 1, no. 2, pp. 201–214, Jul.–Dec. 2013.
[3] B. Farley, A. Juels, V. Varadarajan, T. Ristenpart, K. D. Bowers,and M. M. Swift, “More for your money: Exploiting performanceheterogeneity in public clouds,” in Proc. 3rd ACM Symp. CloudComput., 2012, pp. 1–14.
[4] D. Armstrong and K. Djemame, “Performance issues in clouds:An evaluation of virtual image propagation and I/O para-virtualization,” Comput. J., vol. 54, pp. 836–849, 2011.
[5] D. Jayasinghe, S. Malkowski, Q. Wang, J. Li, P. Xiong, and C. Pu,“Variations in performance and scalability when migrating n-tierapplications to different clouds,” in Proc. IEEE 4th Int. Conf. CloudComput., 2011, pp. 73–80.
[6] G. Kousiouris, T. Cucinotta, and T. Varvarigou, “The effects ofscheduling, workload type and consolidation scenarios on virtualmachine performance and their prediction through optimized arti-ficial neural networks,” J. Syst. Softw., vol. 84, pp. 1270–1291, 2011.
[7] S. Ostermann, A. Iosup, N. Yigitbasim, R. Prodan, T. Fahringer,and D. Eperma, “A performance analysis of EC2 cloud computingservices for Scientific Computing,” in Proc. 1st Int. Conf. CloudComput., 2009, pp. 115–131.
[8] W. Lloyd, S. Pallickara, O. David, J. Lyon, M. Arabi, and K. W.Rojas, “Performance implications of multi-tier applicationdeployments on Infrastructure-as-a-Service clouds: Towardsperformance modeling,” Future Gener. Comput. Syst., vol. 29,pp. 1254–1264, 2013.
[9] M. S. Rehman and M. F. Sakr, “Initial findings for provisioningvariation in cloud computing,” in Proc. 2nd IEEE Int. Conf. CloudComput. Technol. Sci., 2010, pp. 473–479.
[10] U. Sharma, P. Shenoy, S. Sahu, and A. Shaikh, “A cost-aware elas-ticity provisioning system for the cloud,” in Proc. Int. Conf. Distrib.Comput. Syst., 2011, pp. 559–570.
[11] S. Yi, D. Kondo, and A. Andrzejak, “Reducing costs of spot instan-ces via checkpointing in the Amazon Elastic Compute Cloud,” inProc. IEEE 3rd Int. Conf. Cloud Comput., 2010, pp. 236–243.
[12] A. Andrzejak, D. Kondo, and S. Yi, “Decision model forcloud computing under SLA constraints,” in Proc. IEEE Int.Symp. Model., Anal. Simulation Comput. Telecommun. Syst., 2010,pp. 257–266.
[13] W. Lloyd, S. Pallickara, O. David, J. Lyon, M. Arabi, and K. W.Rojas, “Performance modeling to support multi-tier applicationdeployment to infrastructure-as-a-service clouds,” in Proc.IEEE/ACM 5th Int. Conf. Utility Cloud Comput., 2012, pp. 73–80.
[14] W. Lloyd, S. Pallickara, O. David, J. Lyon, M. Arabi, and K. W.Rojas, “Service isolation vs. consolidation: Implications for IaaScloud application deployment,” in Proc. IEEE Int. Conf. Cloud Eng.,2013, pp. 21–30.
[15] W. Lloyd, O. David, M. Arabi, J. C. Ascough II, T. R. Green, J. Carl-son, and K. W. Rojas, “The virtual machine (VM) Scaler: An infra-structure manager supporting environmental modeling on IaaSclouds,” in Proc. iEMSs Int. Congr. Environ.Model. Softw., 2014, p. 8.
[16] Q. Zhang, Q. Zhu, and R. Boutaba, “Dynamic resource allocationfor spot markets in cloud computing environments,” in Proc. 4thIEEE Int. Conf. Util. Cloud Comput., 2011, pp. 178–185.
[17] O. A. Ben-Yehuda, M. Ben-Yehuda, A. Schuster, and D. Tsafrir,“Deconstructing Amazon EC2 spot instance pricing,” in Proc. 3rdIEEE Int. Conf. Cloud Comput. Technol. Sci., 2011, pp. 304–311.
[18] P. Leitner, W. Hummer, B. Satzger, C. Inzinger, and S. Dustdar,“Cost-efficient and application SLA-aware client side requestscheduling in an infrastructure-as-a-service cloud,” in Proc. IEEE5th Int. Conf. Cloud Comput., 2012, pp. 213–220.
[19] J. L. L. Simarro, R. Moreno-Vozmediano, R. S. Montero, and I. M.Llorente, “Dynamic placement of virtual machines for cost opti-mization in multi-cloud environments,” in Proc. Int. Conf. HighPerform. Comput. Simul., 2011, pp. 1–7.
[20] D. Villegas, A. Antoniou, S. M. Sadjadi, and A. Iosup, “Ananalysis of provisioning and allocation policies for infrastructure-as-a-service clouds,” in Proc. 12th IEEE/ACM Int. Symp. Cluster,Cloud Grid Comput., 2012, pp. 612–619.
[21] G. Galante and L. C. E. De Bona, “A survey on cloud computingelasticity,” in Proc. IEEE/ACM 5th Int. Conf. Utility Cloud Comput.,2012, pp. 263–270.
[22] A. Kejariwal, “Techniques for optimizing cloud footprint,” inProc. 1st IEEE Int. Conf. Cloud Eng., 2013, pp. 258–268.
[23] P. Saripalli, G. V. R. Kiran, R. R. Shankar, H. Narware, and N.Bindal, “Load prediction and hot spot detection models for auto-nomic cloud computing,” in Proc. 4th IEEE Int. Conf. Utility CloudComput., 2011, pp. 397–402.
[24] W. Lloyd, O. David, J. Lyon, K. W. Rojas, J. C. Ascough II, T. R.Green, and J. Carlson, “The cloud services innovation platform-enabling service-based environmental modeling using IaaS cloudcomputing,” in Proc. iEMSs Int. Congr. Environ. Model. Softw., 2012,p. 8.
[25] O. David, W. Lloyd, K. W. Rojas, M. Arabi, F. Geter, J. Carlson, G.H. Leavesley, J. C. Ascough II, and T. R. Green, “Model as a ser-vice (MaaS) using the cloud service innovation platform (CSIP),”in Proc. iEMSs Int. Congr. Environ. Model. Software, 2014, p. 8.
[26] Apache Tomcat. [Online]. Available: http://tomcat.apache.org,2014.
[27] USDA-ARS, “Revised Universal Soil Loss Equation Version 2(RUSLE2). [Online]. Available: http://www.ars.usda.gov/ SP2U-serFiles/Place/%2064080510/RUSLE/RUSLE2_Science_Doc.pdf,2014.
[28] L. Hagen, “A wind erosion prediction system to meet user needs,”J. Soil Water Conserv., vol. 46, no. 2, pp. 105–11, 1991.
[29] P. M. Allen, J. G. Arnold, and W. Skipwith, “Prediction of channeldegradation rates in urbanizing watersheds,” Hydrological Sci. J.,vol. 53. pp. 1013–1029, 2008.
[30] J. Ditty, P. Allen, O. David, J. Arnold, M. White, and M. Arabi,“Deployment of SWAT-DEG as a web infrastructure utilizationcloud computing for stream restoration,” in Proc. iEMSs Int.Congr. Environ. Model. Softw., 2014, p. 6.
[31] R. L. Runkel, C. G. Crawford, and T. a Cohn, “Load estimator(LOADEST): A FORTRAN program for estimating constituentloads in streams and rivers,” in Techniques and Methods Book 4,Reston, VA, USA: U.S. Geological Survey, 2004, ch. A5, p. 69.
[32] T. Wible, W. Lloyd, O. David, and M. Arabi, “Cyberinfrastructurefor scalable access to stream flow analysis,” in Proc. iEMSs Int.Congr. Environ. Model. Softw. 2, 2014, p. 6.
[33] B. Cleland, “An approach for using load duration curves in thedevelopment of TMDLs,” [Online]. Available: http://www.epa.gov/owow/tmdl/duration_curve_guide_aug2007.pdf, 2014.
[34] O. David, J. C. Ascough II, W. Lloyd, T. R. Green, K.W. Rojas, G. H.Leavesley, and L. R. Ahuja, “A software engineering perspectiveon environmental modeling framework design: The object model-ing system,” Environ.Model. Softw., vol. 39, pp. 201–213, 2013.
[35] O. David, J. C. Ascough II, G. H. Leavesley, and L. R. Ahuja,“Rethinking modeling framework design: Object ModelingSystem 3.0,” in Modelling Environ. Sake: Proc. 5th Biennial Conf. Int.Envir. Model. Softw. Soc., 2010, vol. 2, pp. 1190–1198.
Wes J. Lloyd is a research scientist in theDepartment of Civil Engineering and the Depart-ment of Computer Science, Colorado StateUniversity (CSU). He works via a cooperativeagreement with the US Department of AgricultureNatural Resource Conservation Service (USDA-NRCS) on the cloud services innovation platformproject. He is a member of the IEEE.
LLOYD ET AL.: DEMYSTIFYING THE CLOUDS: HARNESSING RESOURCE UTILIZATION MODELS FOR COST EFFECTIVE INFRASTRUCTURE... 679
Shrideep Pallickara is an associate professor inthe Department of Computer Science, ColoradoState University. His research interests includethe area of large-scale distributed systems spe-cifically, computing and streaming. He receivedthe US National Science Foundation (NSF)CAREER Award. He is a member of the IEEE.
Olaf David is a research scientist in theDepartment of Civil Engineering and theDepartment of Computer Science, ColoradoState University. He is with the US Departmentof Agriculture Natural Resources ConservationService (USDA-NRCS) on the cloud servicesinnovation Platform project and the objectmodeling system (OMS) framework.
Mazdak Arabi received the PhD degree inAugust 2005 from Purdue University. He is anassociate professor in the Department of CivilEngineering, Colorado State University. He isteaching and actively conducting research in thewater resources management and planning andenvironmental engineering areas.
Tyler Wible is a full time research associate incivil engineering at Colorado State University.His research focuses on environmental sciencesmodel services development. His master’s thesisfocused on coupling the watershed models ofSWAT and MODFLOW for cloud deployment toimprove access and scalability of stream flowanalysis tools.
Jeffrey Ditty is working toward the graduatedegree in the Department of Civil and Environ-mental Engineering, Colorado State University.His research involves the study of water resour-ces, and hydrologic and environmental sciences.
Ken Rojas is an acting director in the InformationTechnology Center, USDA-Natural ResourcesConservation Service in Fort Collins, Colorado.He manages development, enhancement, andmaintenance of 70þ client and enterprise appli-cations delivering technical assistance to farmersand ranchers across the US.
" For more information on this or any other computing topic,please visit our Digital Library at www.computer.org/publications/dlib.
680 IEEE TRANSACTIONS ON CLOUD COMPUTING, VOL. 5, NO. 4, OCTOBER-DECEMBER 2017