ieee transactions on multimedia, vol. 13, no. 3, june 2011 573
TRANSCRIPT
IEEE TRANSACTIONS ON MULTIMEDIA, VOL. 13, NO. 3, JUNE 2011 573
High-Quality Visualization for GeographicallyDistributed 3-D Teleimmersive Applications
Ramanarayan Vasudevan, Student Member, IEEE, Gregorij Kurillo, Edgar Lobaton, Member, IEEE,Tony Bernardin, Oliver Kreylos, Ruzena Bajcsy, Life Fellow, IEEE, and Klara Nahrstedt, Fellow, IEEE
Abstract—The growing popularity of 3-D movies has led tothe rapid development of numerous affordable consumer 3-Ddisplays. In contrast, the development of technology to generate3-D content has lagged behind considerably. In spite of significantimprovements to the quality of imaging devices, the accuracy ofthe algorithms that generate 3-D data, and the hardware avail-able to render such data, the algorithms available to calibrate,reconstruct, and then visualize such data remain difficult to use,extremely noise sensitive, and unreasonably slow. In this paper, wepresent a multi-camera system that creates a highly accurate (onthe order of a centimeter), 3-D reconstruction of an environmentin real-time (under 30 ms) that allows for remote interaction be-tween users. This paper focuses on addressing the aforementioneddeficiencies by describing algorithms to calibrate, reconstruct, andrender objects in the system. We demonstrate the accuracy andspeed of our results on a variety of benchmarks and data collectedfrom our own system.
Index Terms—Human-computer interaction, real-time, stereoreconstruction, virtual reality, visualization, 3-D teleimmersion,3-D video.
I. INTRODUCTION
R OBUST accurate real-time generation of 3-D data fromreal-life scenes has proved extremely difficult. In fact,
most of the content we now enjoy on 3-D displays is either gen-erated entirely offline or is synthetically generated. In this paper,we focus on a particularly important application of 3-D contentgenerating technology: video conferencing systems.
Most existing video conferencing systems make someattempt to humanize remote interaction, but few are able to
Manuscript received November 01, 2010; accepted January 24, 2011. Date ofpublication March 10, 2011; date of current version May 18, 2011. This workwas supported in part by NSF (grants: 0703787, 0724681, 0937060), HP Labs,EADS, and CITRIS at University of California, Berkeley. The associate editorcoordinating the review of this manuscript and approving it for publication wasDr. Zhengyou Zhang.
R. Vasudevan, G. Kurillo, and R. Bajcsy are with the Department of ElectricalEngineering and Computer Sciences, University of California, Berkeley, CA94720 USA (e-mail: [email protected]; [email protected];[email protected]).
E. Lobaton is with the Department of Computer Science, University of NorthCarolina at Chapel Hill, Chapel Hill, NC 27599 USA (e-mail: [email protected]).
T. Bernardin and O. Kreylos are with the Institute for Data Analysis andVisualization, University of California Davis, Davis, CA 95616 USA (e-mail:[email protected]; [email protected]).
K. Nahrstedt is with the Department of Computer Science, University of Illi-nois at Urbana Champaign, Urbana, IL 61801 USA (e-mail: [email protected]).
This paper has supplementary downloadable material available at http://ieeexplore. ieee.org. The total size is 63.5 MB.
Color versions of one or more of the figures in this paper are available onlineat http://ieeexplore.ieee.org.
Digital Object Identifier 10.1109/TMM.2011.2123871
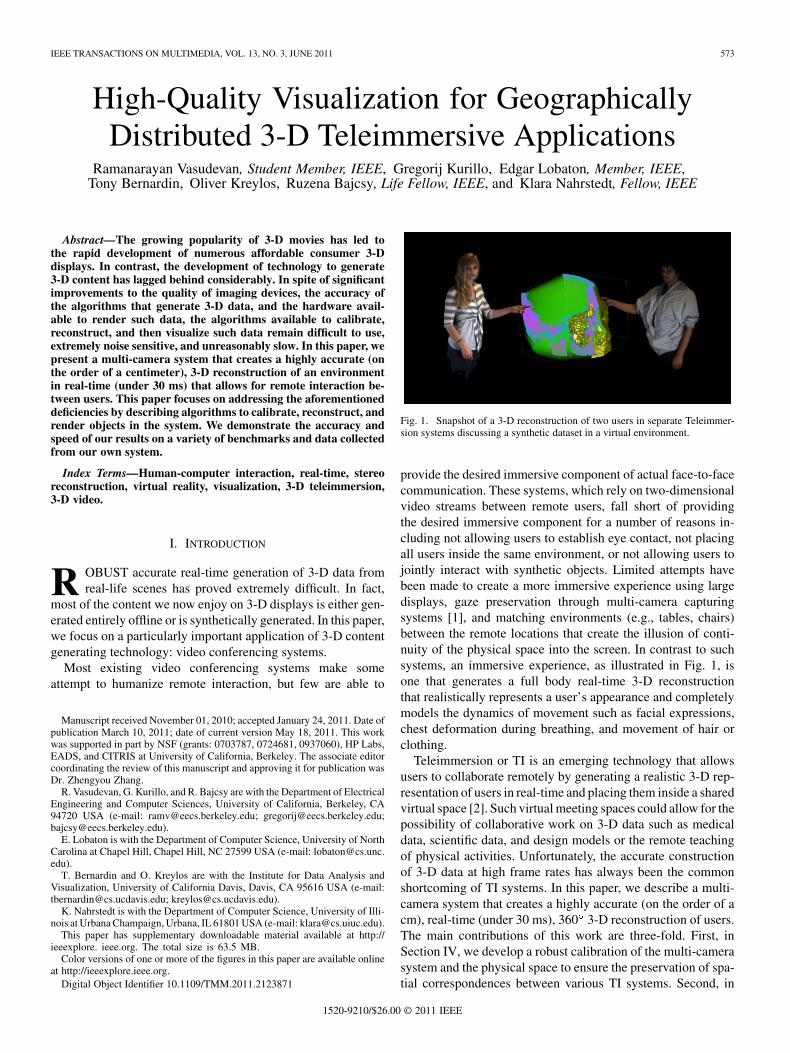
Fig. 1. Snapshot of a 3-D reconstruction of two users in separate Teleimmer-sion systems discussing a synthetic dataset in a virtual environment.
provide the desired immersive component of actual face-to-facecommunication. These systems, which rely on two-dimensionalvideo streams between remote users, fall short of providingthe desired immersive component for a number of reasons in-cluding not allowing users to establish eye contact, not placingall users inside the same environment, or not allowing users tojointly interact with synthetic objects. Limited attempts havebeen made to create a more immersive experience using largedisplays, gaze preservation through multi-camera capturingsystems [1], and matching environments (e.g., tables, chairs)between the remote locations that create the illusion of conti-nuity of the physical space into the screen. In contrast to suchsystems, an immersive experience, as illustrated in Fig. 1, isone that generates a full body real-time 3-D reconstructionthat realistically represents a user’s appearance and completelymodels the dynamics of movement such as facial expressions,chest deformation during breathing, and movement of hair orclothing.
Teleimmersion or TI is an emerging technology that allowsusers to collaborate remotely by generating a realistic 3-D rep-resentation of users in real-time and placing them inside a sharedvirtual space [2]. Such virtual meeting spaces could allow for thepossibility of collaborative work on 3-D data such as medicaldata, scientific data, and design models or the remote teachingof physical activities. Unfortunately, the accurate constructionof 3-D data at high frame rates has always been the commonshortcoming of TI systems. In this paper, we describe a multi-camera system that creates a highly accurate (on the order of acm), real-time (under 30 ms), 360 3-D reconstruction of users.The main contributions of this work are three-fold. First, inSection IV, we develop a robust calibration of the multi-camerasystem and the physical space to ensure the preservation of spa-tial correspondences between various TI systems. Second, in
1520-9210/$26.00 © 2011 IEEE

574 IEEE TRANSACTIONS ON MULTIMEDIA, VOL. 13, NO. 3, JUNE 2011
Section V, we introduce a novel multi-scale representation thatallows for a highly accurate reconstruction of a scene while al-lowing for high compressibility of the produced 3-D data. Third,in Section VI, we describe how the data produced from the mul-tiple cameras can be integrated together to improve the overallvisual quality of the reconstruction. The rest of the discussionincludes a brief overview of related work in Section II, an overalldescription of the system in Section III, and a description of var-ious applications that illustrate the robustness and utility of theproposed system in Section VII.
II. RELATED WORK
In the past decade, several have attempted to develop real-time 3-D reconstruction systems for marker-less capture of thehuman body for telepresence in a virtual environment. Mostreal-time approaches fall into one of three categories dependingupon their computational approach: 1) image-based reconstruc-tion using dense stereo, 2) voxel-based methods with spatialsampling, and 3) silhouette-based reconstruction.
We begin by describing several systems that perform 3-D re-construction using image-based reconstruction. In 1999, Kanadeet al. presented one of the first full-body capturing systems usingimage-based reconstruction with a large number of distributedcameras to capture human movement at close to real-time (lessthan a single frame per second) [3]. The first TI system was devel-oped by researchers at the University of Pennsylvania who usedseveral stereo camera triplets for image-based reconstruction ofthe upper body [4]. Sang et al. presented a faster TI system basedon dense-stereo depth maps obtained via trinocular 3-D recon-struction [5]. The presented approach, however, had two majorshortcomings: its slow speed and its unreliability in texture-lessregions of the scene which resulted in missing data.
Several systems have employed voxel-based methods to per-form 3-D reconstruction. Hasenfratz et al. proposed a voxel-based interactive virtual reality system that featured real-time(25 frames per second) 3-D reconstruction of the human body[6]. However, the approach had limited ability to acquire detailssuch as clothing and facial features due to the inherent limita-tions of space carving methods. Schreer et al. attempted to over-come this limitation by incorporating a depth estimate from animage-based reconstruction [7]. The system, however, requireda large number of cameras to generate a 3-D model of the user.
Several systems perform 3-D reconstruction using silhouette-based methods. Baker et al. proposed a desktop 3-D recon-struction systems that used five different views to obtain a 3-Dmodel of the user via a visual-hull approach [8]. The systemwas run on a single PC which performed 3-D reconstructionand rendering of the users in a simple virtual meeting room. Afull-body TI system was introduced by Gross et al. who appliedsilhouette-based 3-D reconstruction from several views to cap-ture the user inside a CAVE-like environment [9]. Two such sys-tems were built to offer a collaborative platform connecting ge-ographically distributed users. Unfortunately, silhouette-basedmethods fail to reconstruct concave regions in the scene and tendto be inaccurate unless numerous cameras are employed.
In recent years, several benchmarks to compare the accuracyof various types of stereo reconstructions have become avail-able. Scharstein et al. present a thorough overview of a variety
of standard algorithms to perform 3-D reconstruction (most donot work in real-time) and provide a powerful benchmark thathas become an industry standard [10]. A brief review of the re-sults of a variety of algorithms on this benchmark illustratesrather clearly that image-based reconstructions, in general, pro-vide far more accurate results than the other two approaches.Image-based approaches make fewer explicit assumptions aboutthe object to be imaged and therefore tend to be more accurateat the expense of speed.
The use of multiple cameras also provides a distinct advan-tage over direct-ranging sensors (e.g., Kinect) which cannot sat-isfy the multi-viewer multi-viewpoint experience since criticalareas of the scene (i.e., object boundaries, transparencies, etc.)are poorly reconstructed, poorly resolved, or missed altogetherdue to the nature of the underlying technology (e.g., multi-sam-pling within a measurement pixel). Redundancy of such sen-sors could potentially improve the experience; however, this ap-proach would require complex hardware-based triggering to ef-ficiently deal with interference between multiple range sensors.
TI systems, in general, have focused almost entirely on thespeed of the system and have not focused on the accuracy ofthe reconstruction. In this paper, we describe a TI frameworkthat employs image-based reconstruction to get accurate resultsin real-time. We compare our approach on the aforementionedbenchmark to illustrate the strength of our method. The ap-proach can be applied to various camera configurations, froma single stereo view to multi-view 360-degree reconstruction, toachieve accurate 3-D reconstruction.
III. SYSTEM OVERVIEW
The goal of the TI system presented in this paper is to allowfor geographically distributed collaboration in a shared virtualenvironment. To this end, each user interacts in the virtual en-vironment via their own local TI station. Each station maintainsa local copy of the entire virtual space in order to allow modelmanipulation and postprocessing of data locally. With these re-quirements in mind, each station must perform the followingthree tasks: 1) computation of a 3-D reconstruction of local ob-jects, 2) communication of 3-D data to other stations, and 3) vi-sualization of the virtual environment with other remote users.
An appropriate choice of representation for the data shouldtake into consideration the aforementioned goals. Namely, thesystem should be able to reconstruct any object that is present ateach station without making a priori assumptions about the ob-ject to be reconstructed. The 3-D reconstruction should also befast and accurate, which suggests that the reconstruction shouldonly occur at informative points and then be filled in usinginterpolation where appropriate. Since we require real-timestreaming of 3-D data, we must choose a representation thatallows for fast and efficient compression and decompression.Though each station creates a separate 3-D model of an objectbased on views from multiple camera clusters, in order to vi-sualize the objects, these views must be integrated. With theserequirements in mind, we argue that the ideal representationof an object from a view is a mesh as opposed to a set ofscattered points without connectivity information. We describethe different components of the TI system as illustrated in

VASUDEVAN et al.: HIGH-QUALITY VISUALIZATION 575
Fig. 2. Components of the TI system. Capturing component is displayed to theleft. Data are then processed using a computing cluster. The model is transmittedover the network for display at another TI station.
Fig. 2. Though we describe two particular hardware instantia-tions of the TI system (a general and portable apparatus), westress that the algorithms presented in the next few sections areindependent of the particular hardware choices.
The general TI apparatus consists of 48 Dragonfly cameras(Point Grey Research Inc., Vancouver, BC, Canada), each witha resolution of 640 480 pixels. The cameras are arranged in12 clusters of three grayscale cameras for stereo reconstructionand a color camera for texture acquisition. Ten of the clustersare equipped with 6-mm lenses while the remaining two clustershave 3.8-mm lenses for wider capture space. The clusters cover360 of the workspace of about . The camerasof each cluster are connected through IEEE 1394a (FireWire) in-terface to a dedicated server which performs image acquisitionand stereo reconstruction. The server computers used for the re-construction have two Dual-Core Intel Xeon 2.33-GHz proces-sors, 2 GB of memory, and 1 Gbps connection to Internet 2. Theportable TI apparatus consists of four color Bumblebee cameras(Point Grey Research Inc., Vancouver, BC, Canada), each witha resolution of 640 480 pixels. Each cluster is equipped with3.8-mm lenses for wider capture space. The clusters cover 180of the workspace of about . The cameras ofeach cluster are connected through IEEE 1394a (FireWire) in-terface to a dedicated server which performs image acquisitionand stereo reconstruction. The server computers used for the re-construction have two Intel Dual-Core 2.33-GHz processors, 2GB of memory, and 1 Gbps connection to Internet 2.
The display system for both systems consists of a renderingcomputer with Intel Dual Core CPU, 2.66-GHz processors, 2GB of memory, and two NVIDIA GeForce 8800 GTS graphicscards. The renderer can receive compressed 3-D data directlyfrom the cluster computers in separate network streams or in-directly through a gateway computer which can also connect toa remote site. The renderer supports different display options,such as single or multiple desktop displays and various passiveor active stereo systems. The users can also use different inter-face devices (e.g., wireless 3-D mouse, Wii remote) to interactwith the virtual environment.
IV. CALIBRATION
In this section, we describe a hierarchical approach to the cali-bration of the TI system. In the lowest level, we calibrate internal
camera parameters using Zhang’s method [11] through homog-raphy obtained from a checkerboard. Once each cluster is inter-nally calibrated, we can proceed with the external calibration ofclusters to obtain their position and orientation with respect toa reference camera. The external calibration is performed usinga calibration object fashioned out of two LEDs positioned at afixed distance. Finally, we calibrate the display and the trackingsystem to determine the spatial relationship of the data with re-spect to a world coordinate system in the virtual environment.During our discussion, we assume some familiarity with calibra-tion. A formal introduction to this topic can be found in [12].
A. Stereo Cluster Calibration
The cameras for the TI system can be arranged in various pat-terns, from simple two-camera clusters to multi-camera lineararrays. As long as the cameras within the cluster have largeoverlap, they can be calibrated simultaneously. Calibration ofeach stereo cluster is performed using Zhang’s method. A planarcheckerboard target is placed in different positions and orienta-tions to generate a set of points for homography calculation. Weuse the standard pinhole camera model:
(1)
The model in (1) represents the transformation from a ho-mogeneous 3-D point seen by camera to the corre-sponding image pixel coordinate defined on the image plane.
represents the camera matrix which contains thefocal length and the optical center. is the standardprojection matrix. contains rotational matrix andposition of the camera center from the object coordinate systemorigin.
The calibration algorithm uses a set of known points on aplanar checkerboard and a set of detected corner features onthe image as their projection. A system of linear equations isformed and solved via singular value decomposition to obtainthe initial value of the focal length, optical center, and distor-tion. The minimization function is defined as the reprojectionerror between image points obtained in positions of thecalibration board and the points projected through the cameramodel with the linear parameters as an initial guess. After eachcamera is calibrated independently, the relative orientation andposition of the cameras within the cluster ( , ) are com-puted. The relative relationship between an arbitrary cameraand selected reference camera can be expressed as follows:
(2)
Next, we rewrite (1) to only consider the orientation and po-sition of the reference camera and the relative orientation andposition between cameras:
(3)
Finally, nonlinear optimization of the external camera pa-rameters within the cluster is performed using Levenberg-Mar-quardt algorithm. The error function is defined as the total repro-jection error, i.e., the sum of reprojection errors of all the gridpoints as seen by cameras in checkerboard positions.

576 IEEE TRANSACTIONS ON MULTIMEDIA, VOL. 13, NO. 3, JUNE 2011
Fig. 3. (a) Distribution of the reprojection error of the checkerboard points fora pair of cameras inside a stereo cluster. (b) Distribution of reprojection erroracross the image for each camera. The total mean reprojection error was 0.18(0.11) pixels.
Since the internal parameters of the cameras are independentand have already been optimized, only the external parametersare considered during this optimization. In total,
parameters are optimized.Usually, one needs to collect about 15–20 images of the
checkerboard in various poses to obtain accurate calibration.The typical reprojection error for a pair of cameras is between0.12 and 0.20 pixels. Fig. 3(a) shows the error distributionfor a calibrated stereo pair. Notice that it is approximately askewed Gaussian distribution. Fig. 3(b) illustrates the repro-jection error across each image. Areas with consistently highreprojection error indicate an inadequate model which maysuggest deviations in the lens construction or other issues withthe camera.
B. External Calibration
Before we externally calibrate the camera clusters, we con-struct a vision graph to identify the cameras with largest overlap.In contrast to other methods [13]–[15], our approach resolvesEuclidean reconstruction (preserving metric information) andintroduces novel parameter reduction in the case of two-pointbar calibration which increases the robustness of the calibra-tion [16].
Our external calibration algorithm consists of the followingsteps:
1) image acquisition and sub-pixel marker detection onmultiple cameras;
2) composition of adjacency matrix to construct a weightedvision graph that describes interconnections between thecameras (e.g., the number of common points);
3) computation of the fundamental, , and essential, ,matrices with RANSAC;
4) essential matrix decomposition into rotation and trans-lation parameters defined up to a scale factor, ;
5) determination of the scale factor, , through triangula-tion and LM optimization;
6) optimal path search using Dijkstra algorithm;
Fig. 4. Vision graph generated for 12 stereo clusters with the cluster #3 se-lected as the reference cluster (left) and typical reprojection error for the ex-ternal cluster calibration (right).
7) global optimization of the parameters using sparsebundle adjustment (SBA) [17].
Our external calibration approach assumes that at least anytwo clusters overlap. Based on captured marker positions, pairwise geometric relationships are established between camerapairs with large numbers of common points. The relationshipbetween the points captured by each camera can be described bythe fundamental matrix, , for the image coordinates, , and bythe essential matrix, , for the normalized image coordinates,
:
(4)
The fundamental matrix is calculated from the image pointsusing the 8-point algorithm while the outliers are removed bythe RANSAC method. From the fundamental matrix, the essen-tial matrix is computed using predetermined internal calibrationparameters. The essential matrix can then be decomposed intoa rotational matrix and a position vector . Using singularvalue decomposition, the matrices and can be obtained[18]. Results obtained from the essential matrix decompositionare further optimized using the LM algorithm. Due to the na-ture of the essential matrix, the translation between cameras canonly be obtained up to a scale factor which can be obtained byknowing the distance between the two LED markers.
To solve for the global calibration, only the transformationsfor the relevant pairs of cameras are calculated. The pairs are au-tomatically selected from the vision graph which is constructedbased on the number of overlapping points between the cameraclusters. In the vision graph, weighted connections represent thereciprocal of the number of common points seen by both refer-ence cameras. If there are no common points or the number ofpoints is too small, the connection is removed. Using the shortestpath from the reference camera to each camera, we can calculatethe absolute position of each camera (Fig. 4). Let , , and beindices of consecutive cameras on the path found in the visiongraph. From pairwise calibration, the transformations from to
and from to are denoted as ( , ) and ( , ). Thetransformation from to can be calculated as follows:
(5)
After the initial solution of the relative position and orientationof the cameras are obtained, the results are globally optimizedusing nonlinear optimization to reduce the reprojection errors.

VASUDEVAN et al.: HIGH-QUALITY VISUALIZATION 577
Fig. 5. Block diagram of the stereo algorithm for the 3-D mesh generation.
The sparse nature of the optimization problem (i.e., all camerascannot see all the points) ensures that the optimal solution canbe obtained efficiently using SBA [19].
For external calibration of our 48 camera setup, we use a rigidmetal bar with two LED markers attached on each end. We choseLuxeon I LED (Philips Lumileds Lighting Company, San Jose,CA), with a brightness of 30.6 lm and 160 emitting angle. Thetwo LEDs are placed on a metal bar at a distance of 298 mm. Thecomplete external calibration of our general TI apparatus whichhas 12 stereo clusters with about 3000 3-D points, takes between10–15 s on an Intel Xeon 3.20-GHz processor with 1 GB ofmemory. The mean reprojection error between all the camerasis typically between 0.25 and 0.40 pixels with the standard devi-ation between 0.04 and 0.12 pixels as illustrated in Fig. 4. In oursetup, these errors result in the cluster position errors of about0.5% and orientation errors of about 0.1 .
C. Calibration of Physical Space
Once the calibration of the cameras is performed, the ref-erence camera cluster needs to be aligned with the display toachieve correct scale for each user. We propose a simple methodfor calibrating the reference cluster (i.e., camera space) to thephysical space of each TI station. The calibration of the phys-ical space is performed by acquiring one image of the checker-board placed in the vertical position in front of the referencecamera and aligned with the display. The checkerboard can alsobe equipped with calibration markers if a tracking system needsto be aligned with the 3-D data (e.g., for tracking input de-vices or stereo glasses). Since the reference camera calibrationis known, it is possible to determine the exact position and ori-entation from one checkerboard image.
V. 3-D RECONSTRUCTION
In this section, we explain how we construct a 3-D modelof an object using a calibrated camera cluster. Fig. 5 illustratesthe algorithmic pipeline for each stereo cluster. Our focus, inthis section, are the algorithms drawn between the dotted lines.We assume some familiarity with 3-D reconstruction. A moreformal introduction to this topic can be found in [12] and [20].
Determining the 3-D coordinates of a point using a cal-ibrated stereo pair is in fact equivalent to matching theprojection of the point in each of the image planes. To simplifythe matching procedure, the image is first transformed via aprocess known as rectification, which reduces the problem intoa linear search problem along vertically aligned images. Moreconcretely, given rectified left and right gray scale images,
, our objective is to find the disparity map,, such that
(6)
For simplicity, we model the domain and range of each imageas the continuum, but the methods presented in this section gen-eralize to a discrete space in a straightforward manner. The dis-parity function determines the 3-D position of every point thatis simultaneously observable by both cameras in a stereo pair.
Traditional methods to determine this match either employ alocal approach like normalized cross correlation or global op-timization techniques [21]. The normalized cross correlationtechniques rely on a fixed window to perform matching, whichassumes unreasonably that all depths within a window are iden-tical. This assumption ensures that the algorithm is able to workquickly, but unfortunately produces extremely inaccurate re-sults. Global optimization techniques begin by associating a costto each pixel’s disparity that depends not only on how well itmatches to a pixel in the other image, but also how well this dis-parity matches to neighboring pixels’ disparity. This cost func-tion is then minimized in order to determine the disparity of eachpixel. Though these optimization techniques produce more ac-curate results than the entirely local approaches, they are com-putationally expensive.
In this paper, we employ a hybrid approach to resolve theproblem. We construct a triangular mesh over the set of visiblepoints on the domain of the right image, and then construct adisparity map using a version of normalized cross correlationover the nodes of the mesh. Importantly, the size of each tri-angle dictates an appropriate window size over which to performmatching while simultaneously reducing the number of pointsto perform matching over. Once the disparity is determined atthese points, interpolation can be employed to determine depthin between nodes. Several post-processing techniques exist thatact similarly to global optimization by enforcing some regu-larity on the disparity map (e.g., smoothness). In our case, weemploy anisotropic diffusion which when defined on our meshconverges quickly [22].
We continue our discussion by finding a graphical model of animage which yields an appropriate triangular mesh upon whichwe can define neighborhood-based operators. Then, we specifyhow a regularized disparity is computed using this model. Fi-nally, we analyze the accuracy of our results and the efficiencyof our meshing approach in compressing data.
A. Image Model
We begin by defining the amount of variation on the grayscale values around a point on the domain. We want the size ofa triangle in the mesh to dictate the scale at which to perform

578 IEEE TRANSACTIONS ON MULTIMEDIA, VOL. 13, NO. 3, JUNE 2011
Fig. 6. Triangular meshing of an image domain: A hierarchy of meshes is usedto define the neighborhoods �� � around any point � (left). A collection ofsets is highlighted for a point in the domain. A non-conforming meshing of thedomain obtained by selecting the neighborhoods specified by the index of sup-port ���� �� for a given threshold, � , which corresponds to the desired amountof variation (middle). A conforming meshing obtained after refining non-con-forming triangles (right).
matching (i.e., every point in a triangular region should be at ap-proximately the same depth); therefore, an ideal mesh would givemore detail to regions with large values of variation since theseareas generally correspond to places with depth discontinuities.
For every point in , let denote a decreasingcollection of sets, where is some fixed number and
if . The variation around a point atlevel is then defined as
(7)
where is the mean intensity value over . Let the indexof support be the function defined as
(8)
where is a user-specified threshold which identifies theamount of variation allowed in a fixed region within an image.The index of support defines the neighborhood around atwhich we first find the desired amount of variation.
Before generating the triangular mesh of the image domain,a coarse mesh of right isosceles triangles is generated at level
as illustrated in Fig. 6. This coarse mesh is then refined bybisecting each triangle. The refinement procedure in a particularregion is halted when the variation in each triangle is less than auser-specified threshold . The index of support, , is thenequivalent to choosing the coarsest level triangular mesh thatcovers the domain while satisfying the user-defined threshold.
As we discussed earlier, our goal is to mimic the effects of aglobal optimization procedure by refining our initial local dis-parity estimates via anisotropic diffusion. To define such a post-processing step, our mesh must be able to share information be-tween neighboring nodes which requires that our mesh have nonodes that are on the middle of another triangle’s edge. A meshsatisfying such a property is referred to as a conforming mesh[23]. A conforming triangular mesh is constructed by followingAlgorithm 1. Importantly, the steps required to construct themesh using the Bisection Algorithm can be stored as a list corre-sponding to the triangles at which a bisection took place, which
Fig. 7. Graphical representation of the mesh: A conforming triangular mesh(left). The graph constructed by representing each triangle by a point anddrawing edges between triangles that share an edge (middle). Discretization ofthe diffusion operator on the triangulated domain (right).
as we discuss in Section V-E gives an efficient way to compressthe mesh. Fig. 6 illustrates the outcome of the algorithm.
A graphical representation, , of the image is then con-structed by letting each triangle in the mesh correspond to avertex and letting edges in the graph correspond to trianglesthat share an edge. Fig. 7 illustrates the construction of sucha graph. Notice that by requiring the mesh to be conforming,each node in the graph (except those sitting at the edge of theimage) has exactly three edges connecting to it.
Algorithm 1: Bisection Algorithm
1: Initialize the procedure with a coarse triangulation of theimage domain.
2: for each triangle in the mesh do
3: Let correspond to the level to which belongs.
4: if the variation in is greater than then
5: Bisect .
6: Let be the neighboring triangle to opposite to itsright angle and suppose belongs to level .
7: if then
8: Repeat steps 5 through 9 using .
9: end if
10: end if
11: end for
B. Disparity Computation
Since each vertex of the graph, , uniquely corresponds toan image coordinate, , in the right image, , in orderto determine a depth, it is sufficient to construct a disparitymap, . We begin by defining a matching score,
. At a point , with correspondingto a triangle, , the matching score is defined as the average nor-malized cross correlation between the reference window cen-tered at each of the corners of in the right image and a window

VASUDEVAN et al.: HIGH-QUALITY VISUALIZATION 579
centered at the same coordinate as each of the corners of inthe left image after a horizontal translation by . Importantlythe size of the neighborhoods used during the normalized crosscorrelation step are dictated by the level of the triangle (i.e., asmall triangle employs a small correlation window and a largetriangle uses a large correlation window).
We then define an approximation to the disparity, , by se-lecting for each vertex the displacement value that givesthe greatest correlation score. That is
(9)
Let the set of vertices be the set of pointsfor which we do not have a confident match, i.e., its correlationscore is smaller than some user-specified threshold . These arethe vertices that are processed during the anisotropic diffusionstep described in the next section.
C. Anistropic Diffusion
At this point, we have an initial estimate of the disparity, ,but in order to approximate a global method, we enforce a reg-ularity condition on the disparity values of . In practice, reg-ularity conditions generally take the form
(10)
where is the disparity we are attempting to compute,is a weighting function known as the
diffusivity function, and denotes the gradient operation.This diffusivity function penalizes large variations of . Wecan impose additional constraints on this function in order toensure that it behaves appropriately given our task such aslarge penalties at homogeneous regions in the image or smallpenalties at inhomogeneous regions in the image. The first re-quirement describes our expectation that homogeneous regionsof the image should have approximately constant disparity,whereas the second requirement allows for high variability inthe disparity at or near edges. The diffusivity function thereforedepends on the image itself.
In order to compute the disparity, (10) must be minimized,but this process is generally cumbersome. A typical approachto minimizing the energy functional in (10), using the Euler-Lagrange equations, leads to a diffusion process of the form
(11)
where denotes the divergence operation and is the evolutionparameter [24]. To compute the disparity, this diffusion processis initialized with some estimate and then allowed to evolve ac-cording to (11) until it converges, which in practice can takequite some time. Fortunately, using our triangular mesh, this dif-fusion process takes a more computable form that quickly con-verges in practice. To arrive at this computable form, we begin
by integrating the diffusion equation in a triangular region, ,and then apply Gauss’s Theorem:
where is the boundary of the triangular region considered,are the sides of the triangle, and is the normal to each of
these sides.Using the notation introduced in Fig. 7, we discretize the dif-
fusion equation. As noted above, every triangle has exactly threeneighbors. Let be the disparity value to be updated and ’sthe disparity values of the neighboring vertices in , then
(12)
where is the area of the triangle , is the time step,is evaluated at the side , is the length of the hy-potenuse of neighboring triangle , and is the distance betweenthe and . In order to simplify this equation, we first assumethat is constant. This is a good approximation in prac-tice. We then combine into a single constant, , andour discrete update equation that performs anisotropic diffusionbecomes
(13)
At this point, we substitute for given our requirements.Let denote the intensity of the base vertex and denote theintensity of the neighboring vertices in . We then set
, where is a monotone decreasingfunction. Observe that this choice satisfies our required proper-ties. Namely, due to our choice of representation, large size tri-angular regions correspond to homogeneous regions. is eval-uated at the edge between triangles wherein there could be a dra-matic change in the intensity (i.e., an inhomogeneous region).Therefore, we measure the homogeneity of this edge by com-paring the intensity of neighboring vertices. Combining thesetwo terms measuring the homogeneity, we arrive at our diffu-sivity function. With this substitution, the discrete update equa-tion that performs anistropic diffusion becomes
(14)We initialize this discrete update equation using our initial esti-mate for the disparity, . We obtain from by applying

580 IEEE TRANSACTIONS ON MULTIMEDIA, VOL. 13, NO. 3, JUNE 2011
Fig. 8. A 320� 240 image taken from a single camera in a stereo cluster (left), a background subtracted image generated for that image (second from the left), themesh generated for this image (middle), the pre-processed disparity image (second from the right), and the post-processed disparity image (right). Note that lightergray values indicate that the object in the scene is closer, darker gray indicate that an object in the scene is further away, and black indicates areas of uncertainty.
TABLE IAVERAGE FRAME RATE FOR A TYPICAL IMAGE SEQUENCE IN THE
TI SYSTEM ON TWO DUAL CORE 2.33-GHz MACHINES OBTAINED
USING TI STEREO PAIRS EACH WITH SIZE 320 � 240 AND 640 � 480WITH APPROXIMATELY 10 000 TRIANGLES PER FRAME
steps of anisotropic diffusion. In practice, after ten steps, thisprocedure converges. We can then obtain a disparity map overthe entire image domain by interpolating the values obtained foreach of the triangular regions.
Fig. 8 illustrates the output of our algorithm at various steps inthe reconstruction pipeline for a typical 320 240 image fromour portable TI apparatus. Table I describes the average timerequired to perform each step of our algorithm using an imagesequence similar to the one presented in Fig. 8.1
D. Analysis of Disparity
At this point, we can compare the effectiveness of our al-gorithm in calculating disparities on the traditional aforemen-tioned benchmarks. The benchmarks consist of dozens of pic-tures. The two images that the benchmark has identified as themost difficult are found in the left column of Fig. 9. The accu-racy of the measurements is calculated against a ground truthimage, which can be found in the center column of Fig. 9, gen-erated by a laser range finder. Error, in this domain, is gener-ally calculated by the percentage of pixels that differ in theirreturned disparity from the ground truth by more than one. Putmore clearly, this is approximately the number of pixels thatdiffer in their returned value by more than an order of magni-tude greater than a single centimeter. The output of our stereo
1The video icme_project.avi included in the supplementary material is an il-lustration of the local reconstruction of a user from a single stereo camera.
Fig. 9. Two images, each of size 450 � 375, from the benchmark developedby Scharstein et al. [25] (left column), the ground truth for these two imagesproduced using a laser range finder (center column), and the output of our stereoalgorithm (right column). Note that lighter gray values indicate that the objectin the scene is closer, darker gray indicate that an object in the scene is furtheraway, and black indicates areas of uncertainty.
algorithm on the images found in the left column of Fig. 9 cal-culated on two dual core 2.33-GHz machines can be found inthe right column of the same figure. A quantitative comparisonof our algorithm can be found in Table II. We include the mostaccurate performers on this benchmark in the same table. Wanget al. employed a dual core 1.6-GHz machine [26], Bleyer et al.employed a 2-GHz Pentium 4 machine [27], and Klaus et al.employed a dual core 2.21-GHz machine [28].
E. Communication of Reconstruction
Sharing the models between different stations requires trans-mitting the triangulation models in real-time. A standard formatfor transmitting triangulation information consists of transmit-ting nodal values, and then specifying the triangles based on thenode indices. In particular, if we consider RGB values (3 bytes)and depth values (2 bytes) per pixel, we have 5 bytes per node.Each triangle must specify 3 vertices and each vertex requires atleast 3 bytes (since there are more than possible nodes in ourrepresentation). Hence, there are at least 9 bytes per triangle.
Given our choice of representation, we can do better. Sinceour triangulation results from a bisection scheme, it is possible

VASUDEVAN et al.: HIGH-QUALITY VISUALIZATION 581
TABLE IIQUANTITATIVE COMPARISON OF OUR ALGORITHM AGAINST THE TOP
PERFORMERS ON THE BENCHMARK DEVELOPED BY SCHARSTEIN ET AL. [25].THE TEDDY AND CONE IMAGE CORRESPOND TO THE TOP AND BOTTOM
ROWS OF FIG. 9, RESPECTIVELY. OUR OUTPUT WAS PRODUCED WITH
APPROXIMATELY 40 000 TRIANGLES IN BOTH INSTANCES
Fig. 10. Comparison of package size between the standard and our encodedformat.
to specify how the representation was generated instead of spec-ifying each node in the triangle. That is, we can specify whichtriangles are bisected. This encoding scheme for the triangula-tion yields large gains given enough triangles in the representa-tion. No additional time is required to encode the representationsince the information for encoding the representation is gener-ated at the same time the representation is initially computed.
In Fig. 10, we compare the size of the data package gener-ated over a typical image sequence after background subtractionfrom the TI system (each image has size 320 240). Typical im-ages in the sequence look similar to the left images in Fig. 8. Inthe sequence used for Fig. 10, no object is present in the field ofview of the camera for the first seven frames during which timethe compressed package is larger than the standard package, butfrom then on, the compressed package is close to three timessmaller than the standard package. Notice, each frame is lessthan 15 Kbytes.
VI. 3-D VISUALIZATION
The TI renderer is responsible for providing a collaborative,immersive, virtual environment by integrating the 3-D videostreams coming from the local and remote TI stations. The ren-derer allows users to freely reposition and reorient reconstructed3-D objects within the environment and record and later playback with full control incoming streams. The immersive envi-ronment and the 3-D video components each present a set ofchallenges to the real-time performance expected of the ren-derer. In this section, we highlight these challenges and how weaddress them.
Fig. 11. Contribution of each triangle is determined by: (Left) how well thecorresponding capturing camera is able to resolve that triangle; (Right) howmuch that triangle is likely to contribute to the final image given the currentview parameters. Filled lines represent important triangles versus unimportantones which are depicted as dashed lines.
Fig. 12. Illustration of the difference between naïvely projecting facades (left)and after compositing different facades using the weight factors (right).
Immersive environments must satisfy a strict set of require-ments to ensure usability [29]. For example, a steady refresh rateof 60 frames per second for virtual reality displays is requiredto prevent discomfort or motion sickness. Given this fact, the TIrenderer must satisfy the following requirements: first, it shouldoptimize the necessary processing for speed, fully exploiting allavailable computational resources; and second, its design mustseparate the rendering from 3-D video processing to ensure thatthe visual refresh is not stalled.
We optimize the stream management by exploiting two levelsof parallelism: task parallelism and data parallelism. At the tasklevel, we distinguish between the rendering thread and the 3-Dvideo processing thread. The two task sets communicate viatriple-buffered storage which receives reconstructed video dataproduced by the processing thread and then serves it to the ren-dering thread. The buffered storage guarantees that completedata is always available for the display independent of erraticvideo processing behavior. Conversely, the video processing isable to produce representations unhampered by the renderingthread’s lock on data. The 3-D video stream bundles the data,

582 IEEE TRANSACTIONS ON MULTIMEDIA, VOL. 13, NO. 3, JUNE 2011
Fig. 13. Illustration of the various applications of the TI system. An example of remote learning of physical actions wherein Tai Chi is being taught in 3-D (left).An example of cyber-archeology (middle). An illustration of the tracking (drawn in green) that can be constructed using particle filtering (the yellow and red dots)in tandem with our representation (right).
called facades, coming from each of the individual clusters of aTI system. The video processing task is split further into mul-tiple concurrent tasks for each facade. The CPU cores are usedto uncompress the data, but are not used to produce the finalvirtual space 3-D projection of the facades. Instead, the trans-formation from the 3-D reconstruction done at each capturingcluster to the calibrated cross-cluster 3-D space representationis most suited for the data parallel processing step.
If we want a high-quality rendition that is visually consis-tent over the duration of playback, relying on a naïve approach(i.e., projecting the different facades into the cross-cluster 3-Dspace without enforcing some type of consistently between dif-ferent facades) would not produce a well-defined surface dueto the noise in the reconstruction of each facade and the colormismatch between different facades since the capturing clus-ters are not photometrically calibrated. Our approach to the vi-sual representation addresses these issues by 1) leveraging thebuilt-in functionality of the graphics hardware to rapidly projectthe triangles and compute screen coverage in real-time and 2)compositing the individual contributions of all reconstructionsat each screen pixel to obtain better quality visualization. In thefirst phase of the rendering process, the individual contributionsfor each reconstruction are contributed relative to the currentview. For this purpose, each reconstruction is transformed andrasterized based on the current view into an off-screen bufferusing a custom fragment program. For each covered fragment,we generate the usual color and depth contribution and computeand store weight factors used during the compositing of multipleviews. As illustrated in Fig. 11, we determine the weight factorusing two pieces: the capture and view weight.
To determine the view weight, we consider the orientation ofeach triangle in a reconstruction with respect to the capturing di-rection of the corresponding camera cluster. Triangles directlyfacing the capturing cluster receive a high weight, and as thetriangles face away from the camera, the weight drops towardszero at the orthogonal orientation. This first weight relies on aTI system using many clusters to cover the environment whichproduces many overlapping regions, where better resolved tri-angles in the overlap should naturally be favored. Similar to thecapturing weight, to determine the view weight we consider thecurrent viewing parameters to determine interesting parts of thereconstruction with respect to the current view. Again the dotproduct is taken, but here it is calculated between the normalof each triangle and the viewing direction. This second weight,thus, favors the facades from camera clusters that are alignedwith the current view.
The two weights are multiplied together to form the finalweight of the contribution. In the second phase, the contribu-tions at each pixel of the screen are composited independently.Care has to be taken not to blend all the stored contributionsto retain proper occlusion, e.g., a hand in front of a torso. Ourcurrent implementation determines the closest contributionand blends it with those within a user-specified depth range.Fig. 12 illustrates the difference between using a naïve ap-proach wherein everything is projected without blending andour approach.2
VII. APPLICATIONS
In the past several years, we have demonstrated the utility ofthe TI system via several interdisciplinary applications as illus-trated in Fig. 13. In this section, we briefly review several ofthese applications.
One of the first applications of the TI framework presentedin this paper was during a distributed dance performance acrossthe continent (between Berkeley, CA and Urbana-Champaign,IL) in a shared virtual environment. The TI system provided abi-directional connection between two locations, allowing thedancers to see each other side-by-side in the same virtual space.The dancers had to accommodate to the networking limitationsof the system (delays ranged between 500 to 1500 ms).3 TheTI system also introduced the novel concept of “virtual touch”wherein tactile and haptic feedback rely on visual informationfrom the rendering [30].
In collaboration with Stanford University, we have examinedthe utility of immersive environments when compared with 2-Dvideo for learning [31]. To do this, we captured a Tai Chi teacherin our TI system performing several moves and then reprojectedthis information into a virtual space alongside the real-time 3-Ddata of a student. The student was then able to see the teacher’sand his or her own data in real-time side by side as in a vir-tual mirror. Two sets of experiments were then performed with40 participants comparing the immersive and video learning.The result of the study conclusively demonstrated according toa self-report and an objective performance measure that userslearned much better in the TI system rather than via video.
2The video J360.mov included in the supplementary material is an illustrationof the local reconstruction of a user for a single frame from multiple views usingour blending scheme.
3The video DanceLab.mov included in the supplementary material is an illus-tration of two dancers collaborating together over the network using the portableTI system.

VASUDEVAN et al.: HIGH-QUALITY VISUALIZATION 583
Similar collaborative ideas have been applied to the applica-tion of cyber-archaeology for remote real-time interaction with3-D archaeological models in a shared virtual environment. Theframework addresses key issues in modern archeology, the re-versibility of the excavation process, and the accessibility ofdata during the interpretation process [32]. In collaboration withUC Merced, we are developing a virtual participatory platformwhere 3-D models, photos, movies, maps, and other spatial dataare presented to geographically distributed users in a virtual en-vironment. Each user navigates and interacts from a first personperspective while users from remote locations also participateusing their own TI station.
The real-time TI system can also be used to perform marker-less motion capture to provide 3-D data for full-body trackingusing a particle filter [33]. Importantly we show that by ap-plying this method to our representation of 3-D space ratherthan a point wise representation of the 3-D space, the resultingfull-body tracking is far more accurate and faster. Though thishas obvious applications to user interface design, we briefly de-scribe how we have applied a simplified real-time data analysistechnique to this tracking data to perform tele-rehabilitation be-tween a “therapist” and a “patient” in a virtual environment. Thepatient was required to track the movement of the therapist whowas performing a stepping-in-place task. Hip angles were ex-tracted in real-time from the data and projected on the screen toaugment the visual feedback for the users [34].
VIII. CONCLUSION
In this paper, we described a multi-camera system that cre-ates a highly accurate, 3-D reconstruction of an environment inreal-time. We began by providing an overall systems perspec-tive and then described in detail a calibration, representation, re-construction, and then visualization methodology that togetherprovide a state-of-the-art TI system. The hierarchical calibrationapproach allows for robust and flexible calibration of multiplecameras with various pairwise overlap. The representation andreconstruction of 3-D data is simultaneously flexible and accu-rate which allows for high levels of compressibility and easyvisualization. The reconstruction is amongst the top performerson an industry wide benchmark for accuracy and it is easily oneof the fastest reconstructions available. The visualization tech-nique employs the nature of the representation and the viewingdirection to build high-quality depiction that is visually consis-tent. The technique works rapidly by taking advantage of stan-dard graphics hardware.
Future work will focus on employing the reconstruction tobuild a single unified model of the 3-D environment from thevarious views as opposed to the current strategy of simply re-lying on the visualization technique to correct for possible in-consistencies amongst the various views. This would have theadded benefit of reducing the final size for the entire 3-D envi-ronment, which would have the benefit of reducing the overallnetwork bandwidth required for a particular TI station. Full-body 3-D reconstruction of users in real-time offers new pos-sibilities for immersive and TI applications. The users can beimmersed inside computer generated existing or non-existingenvironments, such as ancient buildings and future architec-tural designs to allow interactive exploration. The 3-D capturingframework presented can also provide data for human motionanalysis and modeling. Extracted kinematic parameters could
be applied as online feedback to a user for training of physicalmovements (e.g., dancing, physical therapy, and exercise).
REFERENCES
[1] D. Nguyen and J. Canny, “Multiview: Spatially faithful group videoconferencing,” in Proc. ACM SIGCHI Conf. Human Factors in Com-puting Systems, New York, 2005, pp. 799–808.
[2] T. DeFanti, D. Sandin, M. Brown, D. Pape, J. Anstey, M. Bogucki,G. Dawe, A. Johnson, and T. S. Huang, “Technologies for virtual re-ality/tele-immersion applications: Issues of research in image displayand global networking,” in Proc. EC/NSF Workshop Research Fron-tiers in Virtual Environments and Human-Centered Computing, Jun.1–4, 1999.
[3] T. Kanade, P. Rander, S. Vedula, and H. Saito, “Virtualized reality:Digitizing a 3D time varying event as is and in real time,” in Mixed Re-ality, Merging Real and Virtual Worlds. New York: Springer-Verlag,1999, pp. 41–57.
[4] J. Mulligan and K. Daniilidis, “Real time trinocular stereo for tele-immersion,” in Proc. 2001 Int. Conf. Image Processing, Thessaloniki,Greece, 2001, pp. 959–962.
[5] S. Jung and R. Bajcsy, “A framework for constructing real-time im-mersive environments for training physical activities,” J. Multimedia,vol. 1, no. 7, pp. 9–17, 2006.
[6] J. Hasenfratz, M. Lapierre, and F. Sillion, “A real-time system for full-body interaction with virtual worlds,” in Proc. Eurographics Symp. Vir-tual Environments, The Eurographics Association, 2004, pp. 147–156.
[7] O. Schreer, I. Feldmann, N. Atzpadin, P. Eisert, P. Kauff, and H. Belt,“3dpresence—A system concept for multi-user and multi-party immer-sive 3d videoconferencing,” in Proc. 5th Eur. Conf. Visual Media Pro-duction (CVMP 2008), Nov. 2008, pp. 1–8.
[8] H. Baker, D. Tanguay, I. Sobel, D. Gelb, M. Gross, W. Culbertson, andT. Malzenbender, “The coliseum immersive teleconferencing system,”in Proc. Int. Workshop Immersive Telepresence, Juan-les-Pins, France,2002.
[9] M. Gross, S. Würmlin, M. Naef, E. Lamboray, C. Spagno, A. Kunz,E. Koller-Meier, T. Svoboda, L. V. Gool, S. Lang, K. Strehlke, A. V.Moere, and O. Staadt, “blue-c: A spatially immersive display and 3dvideo portal for telepresence,” ACM Trans. Graph., vol. 22, no. 3, pp.819–827, 2003.
[10] D. Scharstein and R. Szeliski, “A taxonomy and evaluation of densetwo-frame stereo correspondence algorithms,” Int. J. Comput. Vis., vol.47, no. 1, pp. 7–42, 2002.
[11] D. Zhang, Y. Nomura, and S. Fujii, “Error analysis and optimizationof camera calibration,” in Proc. IEEE/RSJ Int. Workshop IntelligentRobots and Systems (IROS 91), Osaka, Japan, 1991, pp. 292–296.
[12] Y. Ma, S. Soatto, J. Kosecka, Y. Ma, S. Soatta, J. Kosecka, and S.Sastry, An Invitation to 3-D Vision. New York: Springer, 2004.
[13] X. Cheng, J. Davis, and P. Slusallek, “Wide area camera calibrationusing virtual calibration objects,” in Proc. IEEE Conf. Computer Visionand Pattern Recognition (CVPR 2000), 2000.
[14] I. Ihrke, L. Ahrenberg, and M. M. Magnor, “External camera calibra-tion for synchronized multi-video systems,” in Proc. 12th Int. Conf.Computer Graphics, Visualization and Computer Vision 2004, Plzen,Czech Republic, Feb. 2004, vol. 12, pp. 537–544.
[15] T. Svoboda, D. Martinec, and T. Pajdla, “A convenient multicameraself-calibration for virtual environments,” Presence, vol. 14, no. 4, pp.407–422, 2005.
[16] G. Kurillo, Z. Li, and R. Bajcsy, “Wide-area external multi-camera cal-ibration using vision graphs and virtual calibration object,” in Proc. 2ndACM/IEEE Int. Conf. Distributed Smart Cameras (ICDSC 08), Stan-ford, CA, Sep. 7–11, 2008, IEEE.
[17] M. Lourakis, Levmar: Levenberg-Marquardt Nonlinear Least SquaresAlgorithms in C/C++, Jul. 2004. [Online]. Available: http://www.ics.forth.gr/~lourakis/levmar.
[18] R. I. Hartley and A. Zisserman, Multiple View Geometry in ComputerVision, 2nd ed. New York: Cambridge Univ. Press, 2004.
[19] M. Lourakis and A. Argyros, The Design and Implementation ofa Generic Sparse Bundle Adjustment Software Package Based onthe Levenberg-Marquardt Algorithm, Institute of Computer Sci-ence—FORTH, Heraklion, Crete, Greece, Tech. Rep. 340, Aug. 2004.[Online]. Available: http://www.ics.forth.gr/~lourakis/sba.
[20] D. Forsyth and J. Ponce, Computer Vision: A Modern Approach. En-glewood Cliffs, NJ: Prentice-Hall Professional Technical Reference,2002.
[21] S. Seitz, B. Curless, J. Diebel, D. Scharstein, and R. Szeliski, “A com-parison and evaluation of multi-view stereo reconstruction algorithms,”in Proc. Int. Conf. Computer Vision and Pattern Recognition, 2006, pp.519–528.
[22] P. Perona and J. Malik, “Scale-space and edge detection usinganisotropic diffusion,” IEEE Trans. Pattern Anal. Mach. Intell., vol.12, no. 7, pp. 629–639, Jul. 1990.

584 IEEE TRANSACTIONS ON MULTIMEDIA, VOL. 13, NO. 3, JUNE 2011
[23] J. Maubach, “Local bisection refinement for N-simplicial grids gener-ated by reflection,” SIAM J. Sci. Comput., vol. 16, p. 210, 1995.
[24] T. Chan and J. Shen, Image Processing and Analysis: Variational, PDE,Wavelet, and Stochastic Methods. Philadelphia, PA: SIAM, 2005.
[25] D. Scharstein, R. Szeliski, and M. Coll, “High-accuracy stereo depthmaps using structured light,” in Proc. 2003 IEEE Computer SocietyConf. Computer Vision and Pattern Recognition, 2003, vol. 1.
[26] Z. Wang and Z. Zheng, “A region based stereo matching algorithmusing cooperative optimization,” in Proc. IEEE Computer Society Conf.Computer Vision and Pattern Recognition 2008, Anchorage, AK.
[27] M. Bleyer and M. Gelautz, “A layered stereo matching algorithm usingimage segmentation and global visibility constraints,” ISPRS J. Pho-togram. Remote Sens., vol. 59, no. 3, pp. 128–150, 2005.
[28] A. Klaus, M. Sormann, and K. Karner, “Segment-based stereomatching using belief propagation and a self-adapting dissimilaritymeasure,” in Proc. Int. Conf. Pattern Recognition, 2006, vol. 2.
[29] G. Kurillo, R. Bajcsy, K. Nahrstedt, and O. Kreylos, “Immersive 3d en-vironment for remote collaboration and training of physical activities,”in Proc. IEEE Virtual Reality Conf. (VR 2008), Reno, NV, Mar. 8–12,2008, pp. 269–270.
[30] Z. Yang, W. Wu, K. Nahrstedt, G. Kurillo, and R. Bajcsy, “Enablingmulti-party 3d tele-immersive environments with viewcast,” ACMTrans. Multimedia Comput., Commun., Appl. (TOMCCAP), acceptedfor publication.
[31] J. N. Bailenson, K. Patel, A. Nielsen, R. Bajcsy, S. Jung, and G. Kurillo,“The effect of interactivity on learning physical actions in virtual re-ality,” Media Psychol., to be published.
[32] M. Forte and G. Kurillo, “Cyberarchaeology—Experimenting withteleimmersive archaeology,” in Proc. 16th Int. Conf. Virtual Systemsand Multimedia (VSMM 2010), Seoul, Korea, Oct. 20–23, 2010.
[33] S. Hauberg, S. Sommer, and K. S. Pedersen, “Gaussian-like spatialpriors for articulated tracking,” in Proc. ECCV 2010, K. Daniilidis, P.Maragos, and N. Paragios, Eds., 2010, pp. 425–437, Springer-Verlag,Berlin, Germany.
[34] G. Kurillo, T. Koritnik, T. Bajd, and R. Bajcsy, “Real-time 3d avatarsfor tele-rehabilitation in virtual reality,” in Proc. 18th Medicine MeetsVirtual Reality (MMVR) Conf., Newport Beach, CA, Feb. 2011, pp.290–296.
Ramanarayan Vasudevan (S’10) received theB.S. degree in electrical engineering and computersciences and an honors degree in physics from theUniversity of California, Berkeley, in 2006 andthe M.S. degree in electrical engineering from theUniversity of California, Berkeley, in 2009.
His research interests include sensor networks,computer vision, hybrid systems, and optimalcontrol. He is the recipient of the 2002 Regent andChancellor’s Scholarship.
Gregorij Kurillo received the B.Sc. and Ph.D. de-grees from School of Electrical Engineering, Univer-sity of Ljubljana, Ljubljana, Slovenia, in 2001 and2006, respectively.
He received the highest national award for his un-dergraduate thesis work. He was a Research Assis-tant with the Laboratory of Robotics and Biomed-ical Engineering at the same institution from 2002 to2006. He was a Postdoctoral Researcher at Universityof California (UC), Berkeley, from 2006–2009. Since2009, he has been assigned to the Research Engineer
position to manage work on the Teleimmersion project at UC Berkeley. Hisresearch interests include camera calibration, stereo vision, image processing,robotics, and collaborative virtual reality.
Edgar Lobaton (M’09) received the B.S. degrees inmathematics and electrical engineering from SeattleUniversity, Seattle, WA, in 2004 and the Ph.D. degreein electrical engineering and computer sciences fromthe University of California, Berkeley, in 2009.
He is currently a Post-Doctoral Researcher at theDepartment of Computer Science at the University ofNorth Carolina at Chapel Hill. He was previously en-gaged in research at Alcatel-Lucent Bell Labs in 2005and 2009. His research interests include sensor net-works, computer vision, tele-immersion, and motion
planning. He is the recipient of the 2009 Computer Innovation Fellows post-doc-toral fellowship award, the 2004 Bell Labs Graduate Research Fellowship, andthe 2003 Barry M. Goldwater Scholarship.
Tony Bernardin received the B.S. degree incomputer science from the Universität Karlsruhe(TH), Karlsruhe, Germany, and the Ph.D. degree incomputer science from the University of California,Davis, in 2009 under the supervision of B. Hamann.
His primary research interests are visualization,computer graphics, and virtual reality, with a focuson immersive visualization applications in thecomputational and earth sciences.
Oliver Kreylos received the B.S. and M.S. degreesin computer science from the Universität Karlsruhe(TH), Karlsruhe, Germany, and the M.S. degree incomputer science from the University of California(UC), Davis. He received the Ph.D. degree in com-puter science from the UC Davis, in 2003 under thesupervision of B. Hamann.
He is an assistant research scientist with the UCDavis W.M. Keck Center for Active Visualization inthe Earth Sciences (KeckCAVES), and the UC DavisInstitute for Data Analysis and Visualization (IDAV).
His primary research interests are visualization, computer graphics, and virtualreality, with a focus on immersive visualization applications in the computa-tional and earth sciences.
Ruzena Bajcsy (LF’08) received the Master’s andPh.D. degrees in electrical engineering from SlovakTechnical University, Bratislava, Slovak Republic, in1957 and 1967, respectively, and the Ph.D. in com-puter science from Stanford University, Stanford,CA, in 1972.
She is a Professor of Electrical Engineering andComputer Sciences at the University of California,Berkeley, and Director Emeritus of the Center for In-formation Technology Research in the Interest of Sci-ence (CITRIS). Prior to joining Berkeley, she headed
the Computer and Information Science and Engineering Directorate at the Na-tional Science Foundation.
Dr. Bajcsy is a member of the National Academy of Engineering and theNational Academy of Science Institute of Medicine as well as a Fellow of theAssociation for Computing Machinery (ACM) and the American Associationfor Artificial Intelligence. In 2001, she received the ACM/Association for theAdvancement of Artificial Intelligence Allen Newell Award, and was named asone of the 50 most important women in science in the November 2002 issueof Discover Magazine. In 2008, she was the recipient of the Benjamin FranklinMedal for Computer and Cognitive Sciences.
Klara Nahrstedt (F’08) received the Diploma inmathematics and numerical analysis from HumboldtUniversity, Berlin, Germany, in 1985 and the Ph.D.degree from the Department of Computer andInformation Science, University of Pennsylvania,Philadelphia, in 1995.
She is Ralph and Catherine Fisher Professor at theComputer Science Department, University of Illinoisat Urbana-Champaign. She was a research scientistin the Institute for Informatik in Berlin until 1990.Her research interests are directed toward multimedia
distributed systems and networking, and tele-immersive systems.Prof. Nahrstedt is the recipient of the University Scholar Award and the Hum-
boldt Research Award. She is the associate editor of ACM TOMCCAP. She isthe chair of the ACM SIG Multimedia. She is the member of ACM.