ieee transactions on nuclear science,...
TRANSCRIPT
IEEE TRANSACTIONS ON NUCLEAR SCIENCE, VOL. 60, NO. 3, JUNE 2013 1609
Generalization Evaluation of Machine LearningNumerical Observers for Image Quality Assessment
Mahdi M. Kalayeh, Thibault Marin, Member, IEEE, and Jovan G. Brankov, Senior Member, IEEE
Abstract—In this paper, we present two new numerical ob-servers (NO) based on machine learning for image qualityassessment. The proposed NOs aim to predict human observerperformance in a cardiac perfusion-defect detection task forsingle-photon emission computed tomography (SPECT) images.Human observer (HumO) studies are now considered to bethe gold standard for task-based evaluation of medical images.However such studies are impractical for use in early stages ofdevelopment for imaging devices and algorithms, because theyrequire extensive involvement of trained human observers whomust evaluate a large number of images.To address this problem, numerical observers (also called
model observers) have been developed as a surrogate for humanobservers. The channelized Hotelling observer (CHO), with orwithout internal noise model, is currently the most widely usedNO of this kind. In our previous work we argued that developmentof a NO model to predict human observers’ performance can beviewed as a machine learning (or system identification) problem.This consideration led us to develop a channelized support vectormachine (CSVM) observer, a kernel-based regression model thatgreatly outperformed the popular and widely used CHO. This wasespecially evident when the numerical observers were evaluated interms of generalization performance. To evaluate generalizationwe used a typical situation for the practical use of a numericalobserver: after optimizing the NO (which for a CHOmight consistof adjusting the internal noise model) based upon a broad set ofreconstructed images, we tested it on a broad (but different) set ofimages obtained by a different reconstruction method.In this manuscript we aim to evaluate two new regressionmodels
that achieve accuracy higher than the CHO and comparable to ourearlier CSVM method, while dramatically reducing model com-plexity and computation time. The new models are defined in aBayesian machine-learning framework: a channelized relevancevector machine (CRVM) and a multi-kernel CRVM (MKCRVM).
Index Terms—Channelized hotelling observer (CHO), humanobserver (HumO), image quality, numerical observer, relevancevector machine (RVM), single-photon emission computed tomog-raphy (SPECT).
I. INTRODUCTION
I MAGE quality is traditionally evaluated by using numer-ical criteria such as signal-to-noise ratio (SNR), bias-vari-
ance trade-off, etc., [1]. However, such metrics have significantlimitations, as recognized in the 1970s in the context of radio-graphic imaging by Lusted [2], who pointed out that an image
Manuscript received October 23, 2012; revised January 30, 2013; acceptedMarch 26, 2013. Date of publication May 16, 2013; date of current version June12, 2013. This work was supported under grants NIH/NHLBI HL065425 andHL091017.The authors are with the Department of Electrical and Computer Engi-
neering, Illinois Institute of Technology, Chicago, IL 60616 USA (e-mail:[email protected]; [email protected]; [email protected]).Digital Object Identifier 10.1109/TNS.2013.2257183
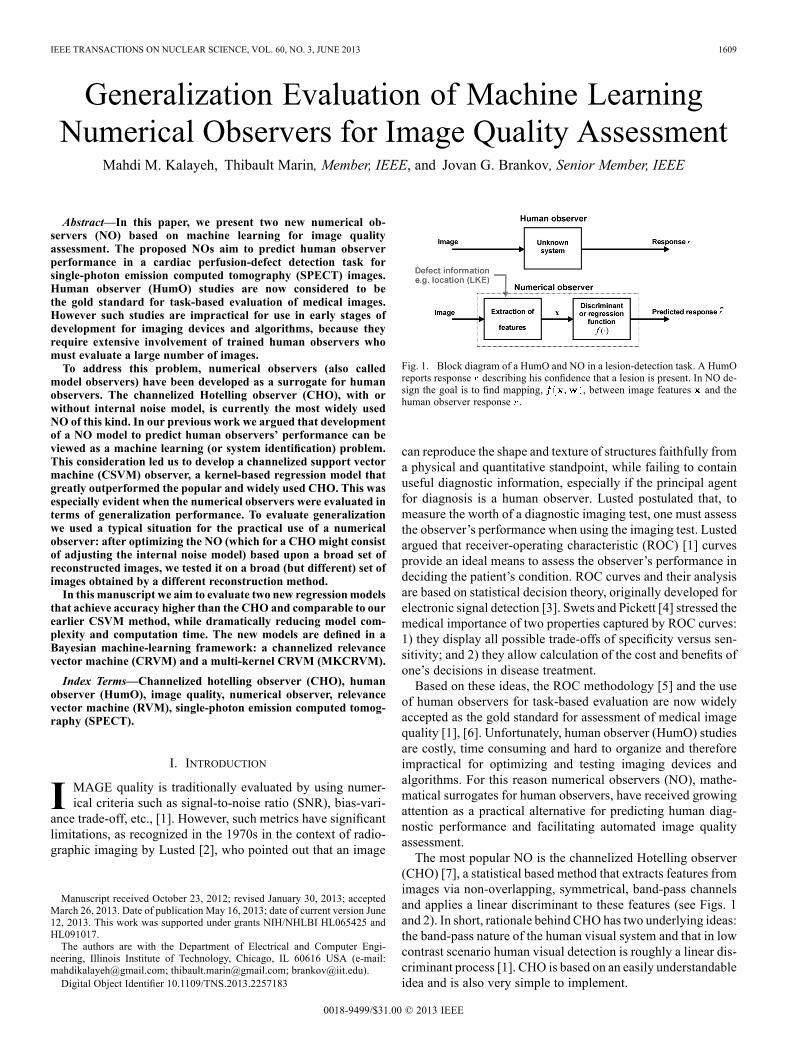
Fig. 1. Block diagram of a HumO and NO in a lesion-detection task. A HumOreports response describing his confidence that a lesion is present. In NO de-sign the goal is to find mapping, , between image features and thehuman observer response .
can reproduce the shape and texture of structures faithfully froma physical and quantitative standpoint, while failing to containuseful diagnostic information, especially if the principal agentfor diagnosis is a human observer. Lusted postulated that, tomeasure the worth of a diagnostic imaging test, one must assessthe observer’s performance when using the imaging test. Lustedargued that receiver-operating characteristic (ROC) [1] curvesprovide an ideal means to assess the observer’s performance indeciding the patient’s condition. ROC curves and their analysisare based on statistical decision theory, originally developed forelectronic signal detection [3]. Swets and Pickett [4] stressed themedical importance of two properties captured by ROC curves:1) they display all possible trade-offs of specificity versus sen-sitivity; and 2) they allow calculation of the cost and benefits ofone’s decisions in disease treatment.Based on these ideas, the ROC methodology [5] and the use
of human observers for task-based evaluation are now widelyaccepted as the gold standard for assessment of medical imagequality [1], [6]. Unfortunately, human observer (HumO) studiesare costly, time consuming and hard to organize and thereforeimpractical for optimizing and testing imaging devices andalgorithms. For this reason numerical observers (NO), mathe-matical surrogates for human observers, have received growingattention as a practical alternative for predicting human diag-nostic performance and facilitating automated image qualityassessment.The most popular NO is the channelized Hotelling observer
(CHO) [7], a statistical based method that extracts features fromimages via non-overlapping, symmetrical, band-pass channelsand applies a linear discriminant to these features (see Figs. 1and 2). In short, rationale behind CHO has two underlying ideas:the band-pass nature of the human visual system and that in lowcontrast scenario human visual detection is roughly a linear dis-criminant process [1]. CHO is based on an easily understandableidea and is also very simple to implement.
0018-9499/$31.00 © 2013 IEEE
1610 IEEE TRANSACTIONS ON NUCLEAR SCIENCE, VOL. 60, NO. 3, JUNE 2013
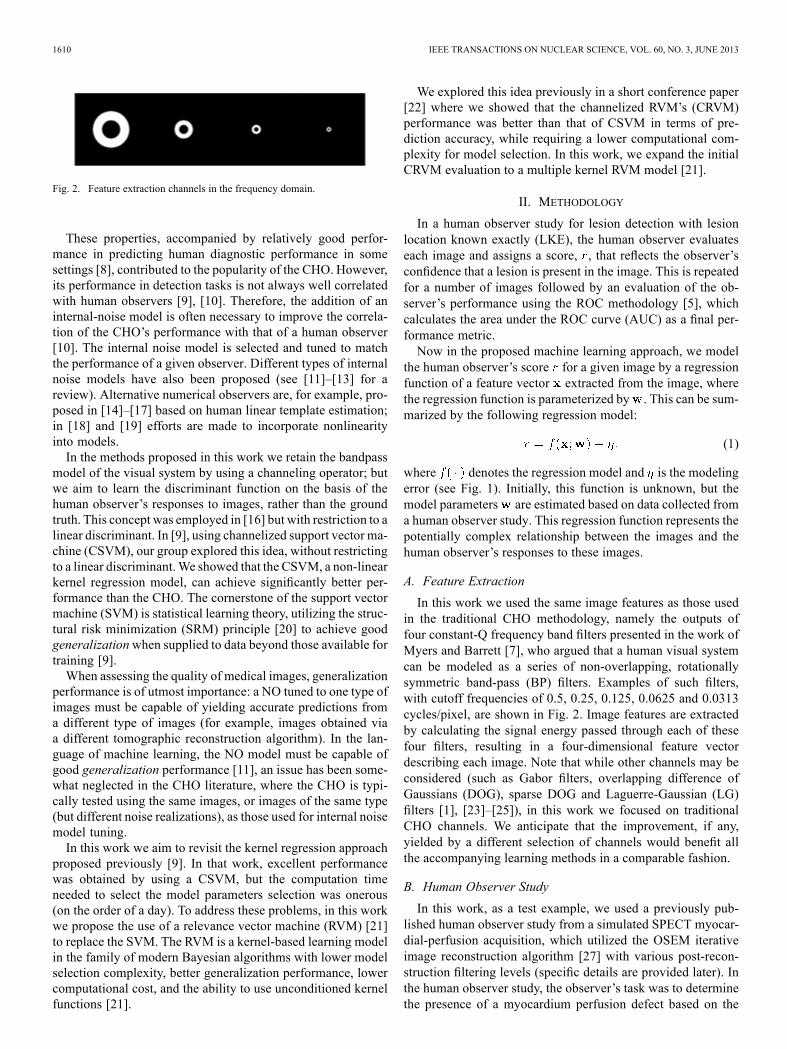
Fig. 2. Feature extraction channels in the frequency domain.
These properties, accompanied by relatively good perfor-mance in predicting human diagnostic performance in somesettings [8], contributed to the popularity of the CHO. However,its performance in detection tasks is not always well correlatedwith human observers [9], [10]. Therefore, the addition of aninternal-noise model is often necessary to improve the correla-tion of the CHO’s performance with that of a human observer[10]. The internal noise model is selected and tuned to matchthe performance of a given observer. Different types of internalnoise models have also been proposed (see [11]–[13] for areview). Alternative numerical observers are, for example, pro-posed in [14]–[17] based on human linear template estimation;in [18] and [19] efforts are made to incorporate nonlinearityinto models.In the methods proposed in this work we retain the bandpass
model of the visual system by using a channeling operator; butwe aim to learn the discriminant function on the basis of thehuman observer’s responses to images, rather than the groundtruth. This concept was employed in [16] but with restriction to alinear discriminant. In [9], using channelized support vector ma-chine (CSVM), our group explored this idea, without restrictingto a linear discriminant.We showed that the CSVM, a non-linearkernel regression model, can achieve significantly better per-formance than the CHO. The cornerstone of the support vectormachine (SVM) is statistical learning theory, utilizing the struc-tural risk minimization (SRM) principle [20] to achieve goodgeneralizationwhen supplied to data beyond those available fortraining [9].When assessing the quality of medical images, generalization
performance is of utmost importance: a NO tuned to one type ofimages must be capable of yielding accurate predictions froma different type of images (for example, images obtained viaa different tomographic reconstruction algorithm). In the lan-guage of machine learning, the NO model must be capable ofgood generalization performance [11], an issue has been some-what neglected in the CHO literature, where the CHO is typi-cally tested using the same images, or images of the same type(but different noise realizations), as those used for internal noisemodel tuning.In this work we aim to revisit the kernel regression approach
proposed previously [9]. In that work, excellent performancewas obtained by using a CSVM, but the computation timeneeded to select the model parameters selection was onerous(on the order of a day). To address these problems, in this workwe propose the use of a relevance vector machine (RVM) [21]to replace the SVM. The RVM is a kernel-based learning modelin the family of modern Bayesian algorithms with lower modelselection complexity, better generalization performance, lowercomputational cost, and the ability to use unconditioned kernelfunctions [21].
We explored this idea previously in a short conference paper[22] where we showed that the channelized RVM’s (CRVM)performance was better than that of CSVM in terms of pre-diction accuracy, while requiring a lower computational com-plexity for model selection. In this work, we expand the initialCRVM evaluation to a multiple kernel RVM model [21].
II. METHODOLOGY
In a human observer study for lesion detection with lesionlocation known exactly (LKE), the human observer evaluateseach image and assigns a score, , that reflects the observer’sconfidence that a lesion is present in the image. This is repeatedfor a number of images followed by an evaluation of the ob-server’s performance using the ROC methodology [5], whichcalculates the area under the ROC curve (AUC) as a final per-formance metric.Now in the proposed machine learning approach, we model
the human observer’s score for a given image by a regressionfunction of a feature vector extracted from the image, wherethe regression function is parameterized by . This can be sum-marized by the following regression model:
(1)
where denotes the regression model and is the modelingerror (see Fig. 1). Initially, this function is unknown, but themodel parameters are estimated based on data collected froma human observer study. This regression function represents thepotentially complex relationship between the images and thehuman observer’s responses to these images.
A. Feature Extraction
In this work we used the same image features as those usedin the traditional CHO methodology, namely the outputs offour constant-Q frequency band filters presented in the work ofMyers and Barrett [7], who argued that a human visual systemcan be modeled as a series of non-overlapping, rotationallysymmetric band-pass (BP) filters. Examples of such filters,with cutoff frequencies of 0.5, 0.25, 0.125, 0.0625 and 0.0313cycles/pixel, are shown in Fig. 2. Image features are extractedby calculating the signal energy passed through each of thesefour filters, resulting in a four-dimensional feature vectordescribing each image. Note that while other channels may beconsidered (such as Gabor filters, overlapping difference ofGaussians (DOG), sparse DOG and Laguerre-Gaussian (LG)filters [1], [23]–[25]), in this work we focused on traditionalCHO channels. We anticipate that the improvement, if any,yielded by a different selection of channels would benefit allthe accompanying learning methods in a comparable fashion.
B. Human Observer Study
In this work, as a test example, we used a previously pub-lished human observer study from a simulated SPECT myocar-dial-perfusion acquisition, which utilized the OSEM iterativeimage reconstruction algorithm [27] with various post-recon-struction filtering levels (specific details are provided later). Inthe human observer study, the observer’s task was to determinethe presence of a myocardium perfusion defect based on the

KALAYEH et al.: GENERALIZATION EVALUATION OF MACHINE LEARNING NUMERICAL OBSERVERS 1611
intensity change in the image. In the dataset considered, twoobservers were asked to score their confidence in the presenceof a defect on a discrete, scale from 1 to 6 (1 denotes that thelesion is definitively not present, and 6 indicates that the le-sion is definitively present) in an LKE environment. This proce-dure was repeated over 100 images corresponding to differentnoise realizations, for a combination of six filtering levels andtwo different numbers of OSEM iterations, so that we havea total of image scores and featurepairs . In the subsequent analysis, thesedata were carefully split into training and test sets, denoted by
and , respec-tively, which were mutually exclusive, i.e., .
C. Channelized Support Vector Machine
The first supervised learning regression model considered isthe support vector machine (CSVM), which we previously eval-uated in [9]. In this kernel regression model, the data is firstmapped from the original feature space, , into a higher di-mensional feature space using the following, for now unknown,transformation:
(2)
Now the SVM methodology uses a linear regression in theaugmented feature space, represented as:
(3)
where is the predicted image score. The optimum values forand are determined through a structural risk minimization
(SRM) procedure from [11], [31]:
(4)
where the -insensitive loss function is defined as:
(5)The soft margin loss function [30], [31] does not penalizeprediction error smaller than the . Regression function in (4)is also called -insensitive regression. The constant deter-mines the trade-off between model complexity (controlled bythe magnitude and number of non-zero elements of ) and fi-delity (measured by ). Note that minimization of the normof is equivalent to minimization of the capacity of the regres-sion function in (3) [20].The value of and are determined using a cross-validation
procedure described in Section II.D.It can be shown that the optimal has the following form:
(6)
which is defined by so-called support vectors, a subset oftraining samples, denoted by where is the number ofsupport vectors and is obtained by a quadratic programming
Fig. 3. Several radial basis function (RBF) kernels of different width.
optimization procedure [9]. This gives the following expressionfor the CSVM regression model:
(7)
Here we note that there is no need to know but only theinner product which is usually more convenientlydescribed by a kernel function. In this work (as in [9]) we useradial basis function (RBF) kernels described as:
(8)
where denotes the Gaussian kernel’s width also referredto as kernel parameter in this manuscript (see Fig. 3 for ex-ample kernels). Alternatively, SVM can use polynomials aswell as sigmoid kernel functions [28], all of which shouldmeet Mercer’s condition [21], [36]. Mercer’s conditionstates that the kernel mapping has to satisfy
for any such thatis finite.
The final expression for the CSVM regression model, from(7), can be rewritten as:
(9)
whereand .
D. K-Fold Cross-Validation (CV)
Training of the CSVM requires selection of the model pa-rameters: kernel width, , fidelity penalization, , and insen-sitive tube, . To find optimal values for these parameters weuse a -fold cross-validation (in our experiments 6-fold) on thetraining dataset. In this method, the training data set is split into-folds. are used for model optimization (i.e., finding
1612 IEEE TRANSACTIONS ON NUCLEAR SCIENCE, VOL. 60, NO. 3, JUNE 2013
and ) and the remaining fold for testing. This is repeated forevery fold and the performancemetric is averaged over folds. Asa final performance metric we used the averaged mean squaredprediction error defined as:
(10)
where denotes number of elements in the kth fold.This is repeated for every possible value of parameters and. It is worth mentioning that the range of used in cross-vali-dation has to be wide so that a good global optimum value canbe found (a coarse to fine approach can be used to first locate arange of values in which the optimal parameter is likely to befound).
E. Channelized Relevance Vector Machine
RVM is amodern Bayesian learning approach [29], which hasseveral benefits over SVM: probabilistic interpretation, use ofdramatically fewer basis functions, lower model selection com-plexity and ability to use arbitrary non-‘Mercer’ kernels [21].In a Bayesian approach, we ideally desire a predictive distri-
bution of :
(11)
marginalized over all nuisance model parameters here denotedby , where denotes the observed trainingdata. The nuisance model parameters define the regressionmodel but are not of a particular interest by themselves. Equa-tion (11) cannot be expressed in closed-form so we must seekan effective approximation as described next [21]. For clarity,we omit to note the implicit conditioning upon the set of inputfeature vectors, , in (11) and subsequent expressions.1) Model Specification: In the RVM approach, the relation-
ship between features and scores is defined by:
(12)
whereand is the kernel function (e.g., a radial basis func-tion (RBF) with a kernel width ) that maps the feature space toa non-linear space where linear regression is applied. Note thatthe RVM and SVM have conceptually the same forms given in(9) and (12).The RVM methodology [21] introduces a hierarchical prior
model that can be summarized as:
(13)
Here denotes that the variable is distributed accordingly,while denotes a Gaussian and is a Gammaprobability density function. To make Gamma hyper-priorsnon-informative (i.e., flat) we fix their parameters to smallvalues i.e., .As we can see from (13), the RVM uses a hierarchical
prior probability distribution on the weights that willencourage sparsity (producing mostly zero weights). To see thiswe need to calculate the true prior over weights, obtainedby marginalization over . This marginalization will resultin a Student-t distribution whose density has contours thatintroduce sparsity (see [21] for details).2) Inference: Now having a Bayesian approach we desire to
find the predictive distribution, as defined in (11), marginalizedover all nuisance model parameters . This is usu-ally not possible analytically and therefore we must seek an ef-fective approximation. In this work we will use the fact that theposterior of can be approximated by a delta func-tion at its mode, i.e., at its most-probable values .We can assume this point-estimate as the representative of theposterior, that is, for the predictive purposes we just require
(14)
to be a good approximation [21]. This will result in a predictivedistribution given by:
(15)
here are the mean and covariance matrix of respectivelyand are iteratively estimated as we will summarize in Table I. Acomplete description of the RVM methodology can be found in[21].Here wewill point out several advantages of RVMover SVM:1. The RVM’s Bayesian formulation reduces the number offree parameters, when compared to the SVM, in which op-timization requires a time consuming cross-validation step.In RVM we are left only with the choice of -kernel widthwhich is embedded in and . This parameter can befound by cross-validation.
2. In addition, this probabilistic view allows computing mar-ginal likelihoods that is very useful in model parametersselection and comparison. For example, we can opt to usemarginal likelihood to find -kernel width instead of cross-validation.
3. RVM is a probabilistic regression so that for each regres-sion point one can also characterize the uncertainty in pre-diction that is .
4. Finally RVM is a special case of Gaussian Process (GP)[29] where the spatial correlation (see (15)) is defined by
. Using GP consideration, it is evidentthat the proposed RVM regression model is finding the so-lution that belongs to the reproducing kernel Hilbert space(RKHS) defined by the kernel function .
KALAYEH et al.: GENERALIZATION EVALUATION OF MACHINE LEARNING NUMERICAL OBSERVERS 1613
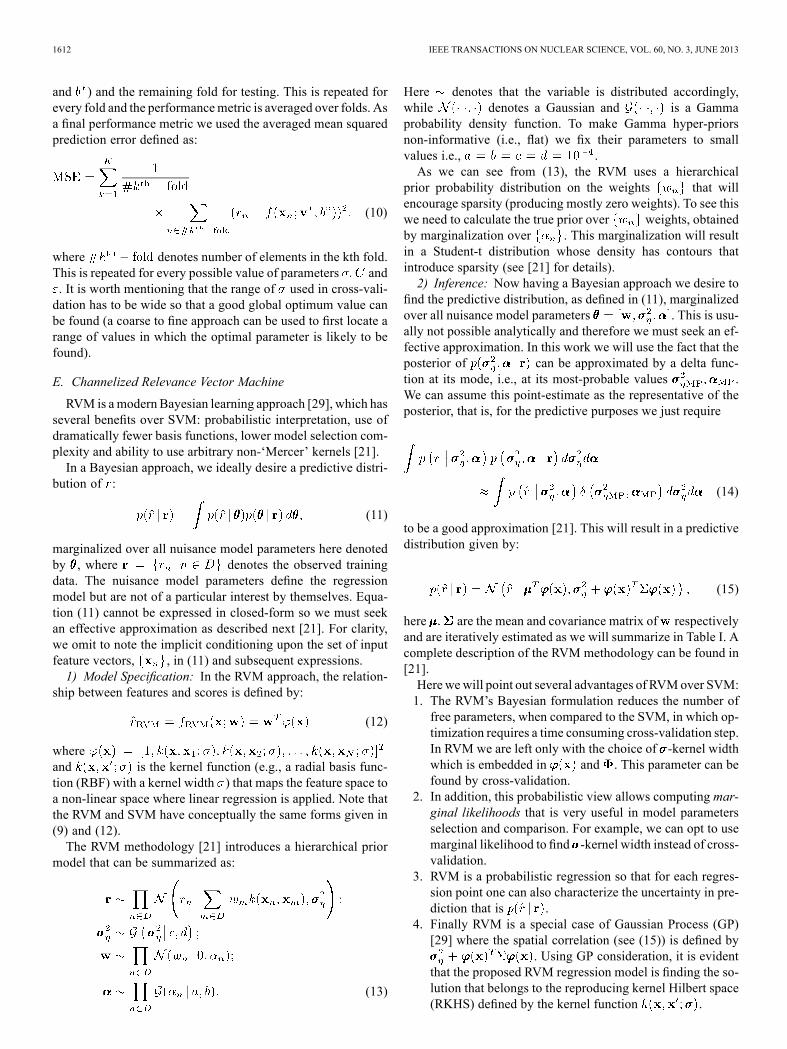
TABLE IITERATIVE STEPS OF THE RVM ALGORITHM
5. The RKHS interpretation motivated the inclusion of multi-kernel model to allow the final solution to belong to RKHSdefined with multiple kernel functions.
F. Robustness of SVM and RVM
While the SVM relied on -insensitivity to relax its modeland produce many zero value elements in , the RVM approachdoes not include such an explicit control. Instead, RVM avoidssensitivity to small errors by manipulating the pruning criteria,due to the Student-t distribution over , enforcing sparsity overelements in .
G. Multi-Kernel Channelized Relevance Vector Machine
The second new regression model proposed in this paperis the multi-kernel channelized relevance vector machine(MKCRVM). Considering RVM interpretation as a Gaussianprocess [29] it quickly becomes evident that both CRVM andCSVM regression models represent relations between imagefeatures and HumO scores as a stationary RKHS defined bya single kernel. There is no evidence that the human observerregression model should obey this assumption. Thus, by in-cluding several kernel functions one can expect improvedregression accuracy. Mathematically, the multi-kernel CRVM(MKCRVM) is easily obtained by expanding the design matrixas:
(22)
where is a “sub design” matrix with as kernel width anddenotes number of different kernels (see Fig. 3). Next we
would like to point out that we could also consider a mixtureof different kernel types (like linear, polynomial etc.,) although
a simpler case is presented in this work. Here we also have toaugment and as:
(23)
(24)
The rest of the equations for MKCRVM are exactly the sameas for the single kernel CRVM and as such will be omitted. TheMKCRVMmethod will find optimal weights for every kernel inthe consideration. Therefore, MKCRVM does not need cross-validation for model parameter selection: unused kernel widthwill receive zero weights.
H. Channelized Hotelling Observer
For completeness of this manuscript we will give a brief de-scription of the CHO. The CHO is the most widely used numer-ical observer that serves as a surrogate for human observers inevaluations of image quality.CHO is a cascade of two linear operators, which in practice
can be combined into one. The first operator, channel oper-ator, measures features of the image by applying for examplenon-overlapping, band-pass filters (BP) as in Fig. 2 or othercommonly used Gabor filters, overlapping difference of Gaus-sians (DOG), sparse DOG and Laguerre-Gaussian (LG) filters[1], [23], [24], [25]. The second operator, called the Hotellingobserver, computes a test statistic, , for choosing between de-fect absent and defect present hypotheses based on the observedfeature vector . This test statistic is defined as:
(25)
where in whichis the expected value of under hypoth-
esis is the covariance matrix of , andmodels an internal noise. In this work we will consider
the following three types of internal noise models which areapplied to diagonal elements of as:
(26)
When properly chosen, the internal noise parameter can im-prove the agreement between the CHO and the human observerdetection performance.The CHO’s detection performance is usually summarized as
[1]:
(27)
For more details readers can refer to [1], [11]–[14]. Note thatthe CHO can predict: the ROC and/or the AUC (AUC is givenin (27)) but cannot predict directly image scores as given by thehuman observers.
1614 IEEE TRANSACTIONS ON NUCLEAR SCIENCE, VOL. 60, NO. 3, JUNE 2013
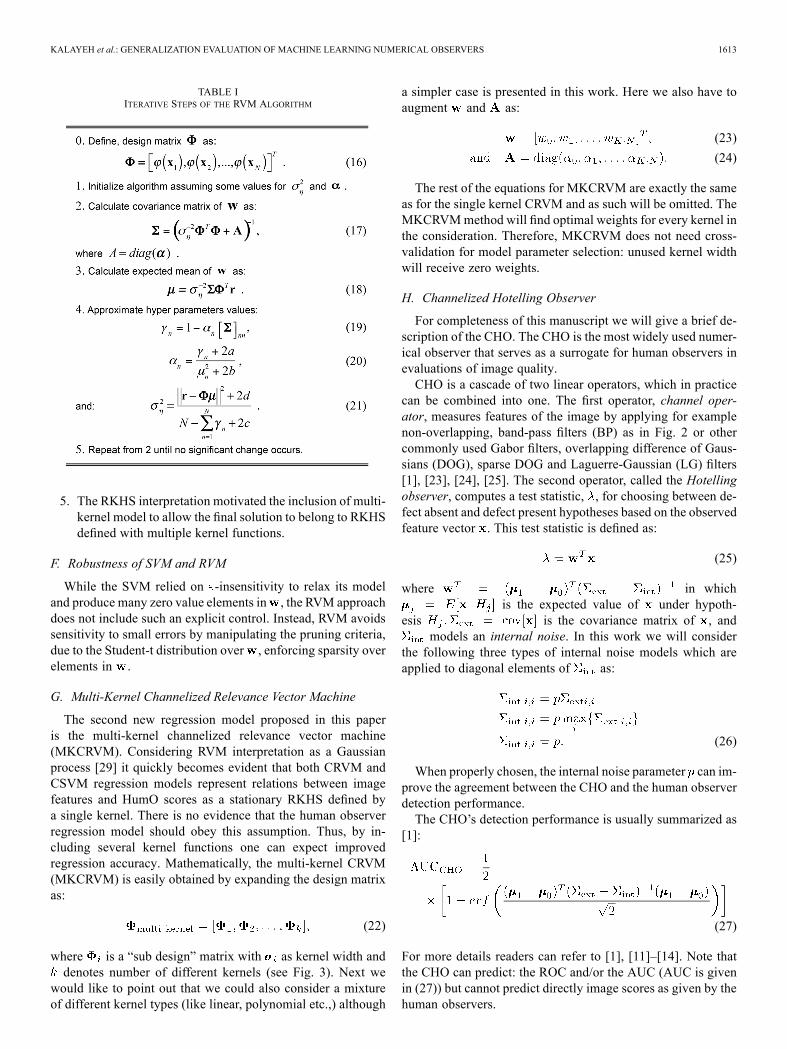
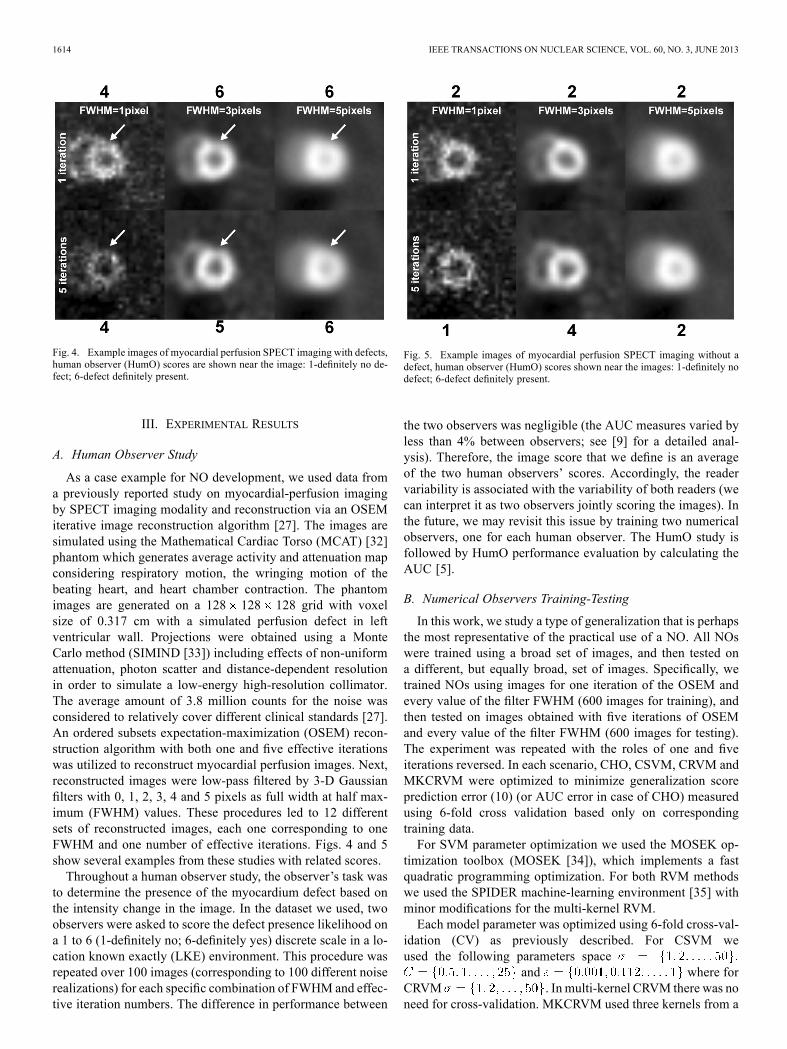
Fig. 4. Example images of myocardial perfusion SPECT imaging with defects,human observer (HumO) scores are shown near the image: 1-definitely no de-fect; 6-defect definitely present.
III. EXPERIMENTAL RESULTS
A. Human Observer Study
As a case example for NO development, we used data froma previously reported study on myocardial-perfusion imagingby SPECT imaging modality and reconstruction via an OSEMiterative image reconstruction algorithm [27]. The images aresimulated using the Mathematical Cardiac Torso (MCAT) [32]phantom which generates average activity and attenuation mapconsidering respiratory motion, the wringing motion of thebeating heart, and heart chamber contraction. The phantomimages are generated on a 128 128 128 grid with voxelsize of 0.317 cm with a simulated perfusion defect in leftventricular wall. Projections were obtained using a MonteCarlo method (SIMIND [33]) including effects of non-uniformattenuation, photon scatter and distance-dependent resolutionin order to simulate a low-energy high-resolution collimator.The average amount of 3.8 million counts for the noise wasconsidered to relatively cover different clinical standards [27].An ordered subsets expectation-maximization (OSEM) recon-struction algorithm with both one and five effective iterationswas utilized to reconstruct myocardial perfusion images. Next,reconstructed images were low-pass filtered by 3-D Gaussianfilters with 0, 1, 2, 3, 4 and 5 pixels as full width at half max-imum (FWHM) values. These procedures led to 12 differentsets of reconstructed images, each one corresponding to oneFWHM and one number of effective iterations. Figs. 4 and 5show several examples from these studies with related scores.Throughout a human observer study, the observer’s task was
to determine the presence of the myocardium defect based onthe intensity change in the image. In the dataset we used, twoobservers were asked to score the defect presence likelihood ona 1 to 6 (1-definitely no; 6-definitely yes) discrete scale in a lo-cation known exactly (LKE) environment. This procedure wasrepeated over 100 images (corresponding to 100 different noiserealizations) for each specific combination of FWHM and effec-tive iteration numbers. The difference in performance between
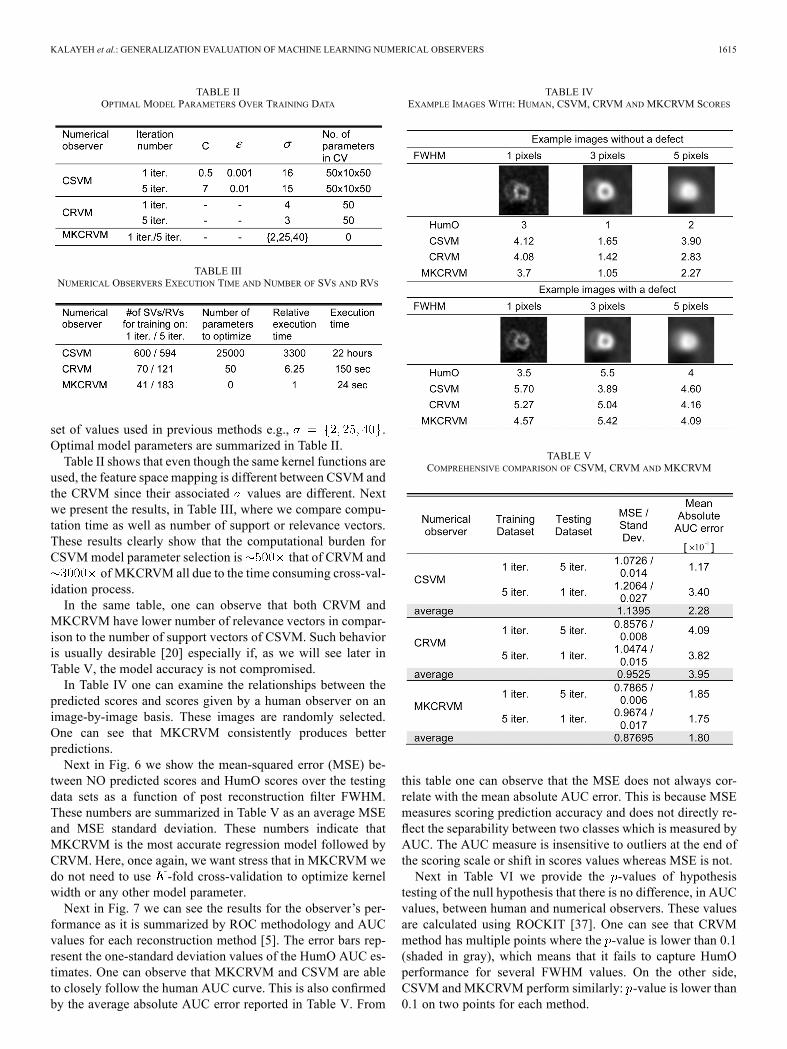
Fig. 5. Example images of myocardial perfusion SPECT imaging without adefect, human observer (HumO) scores shown near the images: 1-definitely nodefect; 6-defect definitely present.
the two observers was negligible (the AUC measures varied byless than 4% between observers; see [9] for a detailed anal-ysis). Therefore, the image score that we define is an averageof the two human observers’ scores. Accordingly, the readervariability is associated with the variability of both readers (wecan interpret it as two observers jointly scoring the images). Inthe future, we may revisit this issue by training two numericalobservers, one for each human observer. The HumO study isfollowed by HumO performance evaluation by calculating theAUC [5].
B. Numerical Observers Training-Testing
In this work, we study a type of generalization that is perhapsthe most representative of the practical use of a NO. All NOswere trained using a broad set of images, and then tested ona different, but equally broad, set of images. Specifically, wetrained NOs using images for one iteration of the OSEM andevery value of the filter FWHM (600 images for training), andthen tested on images obtained with five iterations of OSEMand every value of the filter FWHM (600 images for testing).The experiment was repeated with the roles of one and fiveiterations reversed. In each scenario, CHO, CSVM, CRVM andMKCRVM were optimized to minimize generalization scoreprediction error (10) (or AUC error in case of CHO) measuredusing 6-fold cross validation based only on correspondingtraining data.For SVM parameter optimization we used the MOSEK op-
timization toolbox (MOSEK [34]), which implements a fastquadratic programming optimization. For both RVM methodswe used the SPIDER machine-learning environment [35] withminor modifications for the multi-kernel RVM.Each model parameter was optimized using 6-fold cross-val-
idation (CV) as previously described. For CSVM weused the following parameters space
and where forCRVM . Inmulti-kernel CRVM there was noneed for cross-validation. MKCRVM used three kernels from a
KALAYEH et al.: GENERALIZATION EVALUATION OF MACHINE LEARNING NUMERICAL OBSERVERS 1615
TABLE IIOPTIMAL MODEL PARAMETERS OVER TRAINING DATA
TABLE IIINUMERICAL OBSERVERS EXECUTION TIME AND NUMBER OF SVS AND RVS
set of values used in previous methods e.g., .Optimal model parameters are summarized in Table II.Table II shows that even though the same kernel functions are
used, the feature space mapping is different between CSVM andthe CRVM since their associated values are different. Nextwe present the results, in Table III, where we compare compu-tation time as well as number of support or relevance vectors.These results clearly show that the computational burden forCSVMmodel parameter selection is that of CRVM and
of MKCRVM all due to the time consuming cross-val-idation process.In the same table, one can observe that both CRVM and
MKCRVM have lower number of relevance vectors in compar-ison to the number of support vectors of CSVM. Such behavioris usually desirable [20] especially if, as we will see later inTable V, the model accuracy is not compromised.In Table IV one can examine the relationships between the
predicted scores and scores given by a human observer on animage-by-image basis. These images are randomly selected.One can see that MKCRVM consistently produces betterpredictions.Next in Fig. 6 we show the mean-squared error (MSE) be-
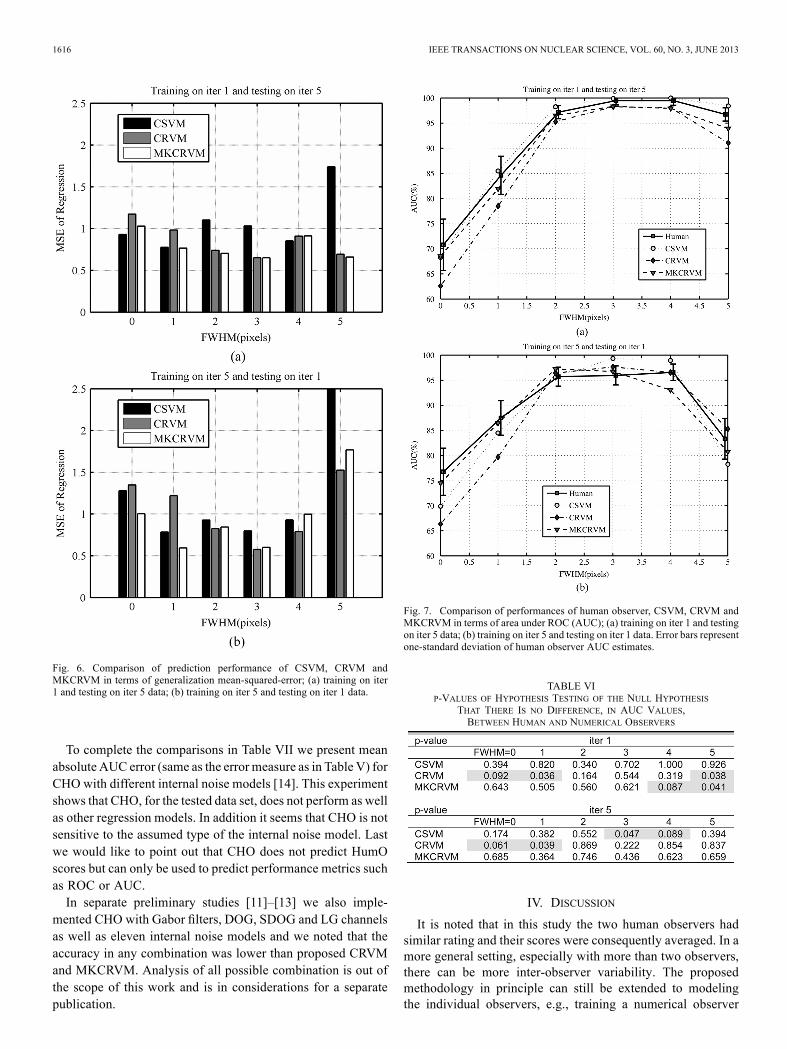
tween NO predicted scores and HumO scores over the testingdata sets as a function of post reconstruction filter FWHM.These numbers are summarized in Table V as an average MSEand MSE standard deviation. These numbers indicate thatMKCRVM is the most accurate regression model followed byCRVM. Here, once again, we want stress that in MKCRVM wedo not need to use -fold cross-validation to optimize kernelwidth or any other model parameter.Next in Fig. 7 we can see the results for the observer’s per-
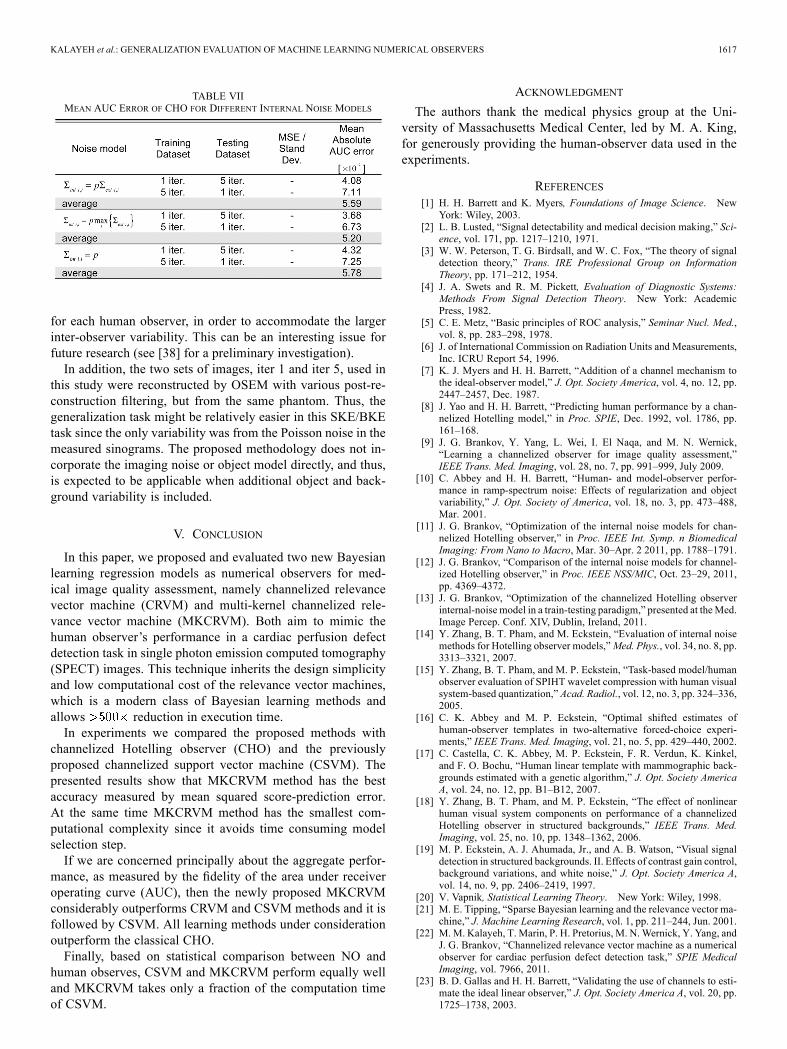
formance as it is summarized by ROC methodology and AUCvalues for each reconstruction method [5]. The error bars rep-resent the one-standard deviation values of the HumO AUC es-timates. One can observe that MKCRVM and CSVM are ableto closely follow the human AUC curve. This is also confirmedby the average absolute AUC error reported in Table V. From
TABLE IVEXAMPLE IMAGES WITH: HUMAN, CSVM, CRVM AND MKCRVM SCORES
TABLE VCOMPREHENSIVE COMPARISON OF CSVM, CRVM AND MKCRVM
this table one can observe that the MSE does not always cor-relate with the mean absolute AUC error. This is because MSEmeasures scoring prediction accuracy and does not directly re-flect the separability between two classes which is measured byAUC. The AUC measure is insensitive to outliers at the end ofthe scoring scale or shift in scores values whereas MSE is not.Next in Table VI we provide the -values of hypothesis
testing of the null hypothesis that there is no difference, in AUCvalues, between human and numerical observers. These valuesare calculated using ROCKIT [37]. One can see that CRVMmethod has multiple points where the -value is lower than 0.1(shaded in gray), which means that it fails to capture HumOperformance for several FWHM values. On the other side,CSVM and MKCRVM perform similarly: -value is lower than0.1 on two points for each method.
1616 IEEE TRANSACTIONS ON NUCLEAR SCIENCE, VOL. 60, NO. 3, JUNE 2013
Fig. 6. Comparison of prediction performance of CSVM, CRVM andMKCRVM in terms of generalization mean-squared-error; (a) training on iter1 and testing on iter 5 data; (b) training on iter 5 and testing on iter 1 data.
To complete the comparisons in Table VII we present meanabsolute AUC error (same as the error measure as in Table V) forCHO with different internal noise models [14]. This experimentshows that CHO, for the tested data set, does not perform as wellas other regression models. In addition it seems that CHO is notsensitive to the assumed type of the internal noise model. Lastwe would like to point out that CHO does not predict HumOscores but can only be used to predict performance metrics suchas ROC or AUC.In separate preliminary studies [11]–[13] we also imple-
mented CHO with Gabor filters, DOG, SDOG and LG channelsas well as eleven internal noise models and we noted that theaccuracy in any combination was lower than proposed CRVMand MKCRVM. Analysis of all possible combination is out ofthe scope of this work and is in considerations for a separatepublication.
Fig. 7. Comparison of performances of human observer, CSVM, CRVM andMKCRVM in terms of area under ROC (AUC); (a) training on iter 1 and testingon iter 5 data; (b) training on iter 5 and testing on iter 1 data. Error bars representone-standard deviation of human observer AUC estimates.
TABLE VIP-VALUES OF HYPOTHESIS TESTING OF THE NULL HYPOTHESIS
THAT THERE IS NO DIFFERENCE, IN AUC VALUES,BETWEEN HUMAN AND NUMERICAL OBSERVERS
IV. DISCUSSION
It is noted that in this study the two human observers hadsimilar rating and their scores were consequently averaged. In amore general setting, especially with more than two observers,there can be more inter-observer variability. The proposedmethodology in principle can still be extended to modelingthe individual observers, e.g., training a numerical observer
KALAYEH et al.: GENERALIZATION EVALUATION OF MACHINE LEARNING NUMERICAL OBSERVERS 1617
TABLE VIIMEAN AUC ERROR OF CHO FOR DIFFERENT INTERNAL NOISE MODELS
for each human observer, in order to accommodate the largerinter-observer variability. This can be an interesting issue forfuture research (see [38] for a preliminary investigation).In addition, the two sets of images, iter 1 and iter 5, used in
this study were reconstructed by OSEM with various post-re-construction filtering, but from the same phantom. Thus, thegeneralization task might be relatively easier in this SKE/BKEtask since the only variability was from the Poisson noise in themeasured sinograms. The proposed methodology does not in-corporate the imaging noise or object model directly, and thus,is expected to be applicable when additional object and back-ground variability is included.
V. CONCLUSION
In this paper, we proposed and evaluated two new Bayesianlearning regression models as numerical observers for med-ical image quality assessment, namely channelized relevancevector machine (CRVM) and multi-kernel channelized rele-vance vector machine (MKCRVM). Both aim to mimic thehuman observer’s performance in a cardiac perfusion defectdetection task in single photon emission computed tomography(SPECT) images. This technique inherits the design simplicityand low computational cost of the relevance vector machines,which is a modern class of Bayesian learning methods andallows reduction in execution time.In experiments we compared the proposed methods with
channelized Hotelling observer (CHO) and the previouslyproposed channelized support vector machine (CSVM). Thepresented results show that MKCRVM method has the bestaccuracy measured by mean squared score-prediction error.At the same time MKCRVM method has the smallest com-putational complexity since it avoids time consuming modelselection step.If we are concerned principally about the aggregate perfor-
mance, as measured by the fidelity of the area under receiveroperating curve (AUC), then the newly proposed MKCRVMconsiderably outperforms CRVM and CSVM methods and it isfollowed by CSVM. All learning methods under considerationoutperform the classical CHO.Finally, based on statistical comparison between NO and
human observes, CSVM and MKCRVM perform equally welland MKCRVM takes only a fraction of the computation timeof CSVM.
ACKNOWLEDGMENT
The authors thank the medical physics group at the Uni-versity of Massachusetts Medical Center, led by M. A. King,for generously providing the human-observer data used in theexperiments.
REFERENCES[1] H. H. Barrett and K. Myers, Foundations of Image Science. New
York: Wiley, 2003.[2] L. B. Lusted, “Signal detectability and medical decision making,” Sci-
ence, vol. 171, pp. 1217–1210, 1971.[3] W. W. Peterson, T. G. Birdsall, and W. C. Fox, “The theory of signal
detection theory,” Trans. IRE Professional Group on InformationTheory, pp. 171–212, 1954.
[4] J. A. Swets and R. M. Pickett, Evaluation of Diagnostic Systems:Methods From Signal Detection Theory. New York: AcademicPress, 1982.
[5] C. E. Metz, “Basic principles of ROC analysis,” Seminar Nucl. Med.,vol. 8, pp. 283–298, 1978.
[6] J. of International Commission on Radiation Units and Measurements,Inc. ICRU Report 54, 1996.
[7] K. J. Myers and H. H. Barrett, “Addition of a channel mechanism tothe ideal-observer model,” J. Opt. Society America, vol. 4, no. 12, pp.2447–2457, Dec. 1987.
[8] J. Yao and H. H. Barrett, “Predicting human performance by a chan-nelized Hotelling model,” in Proc. SPIE, Dec. 1992, vol. 1786, pp.161–168.
[9] J. G. Brankov, Y. Yang, L. Wei, I. El Naqa, and M. N. Wernick,“Learning a channelized observer for image quality assessment,”IEEE Trans. Med. Imaging, vol. 28, no. 7, pp. 991–999, July 2009.
[10] C. Abbey and H. H. Barrett, “Human- and model-observer perfor-mance in ramp-spectrum noise: Effects of regularization and objectvariability,” J. Opt. Society of America, vol. 18, no. 3, pp. 473–488,Mar. 2001.
[11] J. G. Brankov, “Optimization of the internal noise models for chan-nelized Hotelling observer,” in Proc. IEEE Int. Symp. n BiomedicalImaging: From Nano to Macro, Mar. 30–Apr. 2 2011, pp. 1788–1791.
[12] J. G. Brankov, “Comparison of the internal noise models for channel-ized Hotelling observer,” in Proc. IEEE NSS/MIC, Oct. 23–29, 2011,pp. 4369–4372.
[13] J. G. Brankov, “Optimization of the channelized Hotelling observerinternal-noise model in a train-testing paradigm,” presented at theMed.Image Percep. Conf. XIV, Dublin, Ireland, 2011.
[14] Y. Zhang, B. T. Pham, and M. Eckstein, “Evaluation of internal noisemethods for Hotelling observer models,”Med. Phys., vol. 34, no. 8, pp.3313–3321, 2007.
[15] Y. Zhang, B. T. Pham, and M. P. Eckstein, “Task-based model/humanobserver evaluation of SPIHT wavelet compression with human visualsystem-based quantization,” Acad. Radiol., vol. 12, no. 3, pp. 324–336,2005.
[16] C. K. Abbey and M. P. Eckstein, “Optimal shifted estimates ofhuman-observer templates in two-alternative forced-choice experi-ments,” IEEE Trans. Med. Imaging, vol. 21, no. 5, pp. 429–440, 2002.
[17] C. Castella, C. K. Abbey, M. P. Eckstein, F. R. Verdun, K. Kinkel,and F. O. Bochu, “Human linear template with mammographic back-grounds estimated with a genetic algorithm,” J. Opt. Society AmericaA, vol. 24, no. 12, pp. B1–B12, 2007.
[18] Y. Zhang, B. T. Pham, and M. P. Eckstein, “The effect of nonlinearhuman visual system components on performance of a channelizedHotelling observer in structured backgrounds,” IEEE Trans. Med.Imaging, vol. 25, no. 10, pp. 1348–1362, 2006.
[19] M. P. Eckstein, A. J. Ahumada, Jr., and A. B. Watson, “Visual signaldetection in structured backgrounds. II. Effects of contrast gain control,background variations, and white noise,” J. Opt. Society America A,vol. 14, no. 9, pp. 2406–2419, 1997.
[20] V. Vapnik, Statistical Learning Theory. New York: Wiley, 1998.[21] M. E. Tipping, “Sparse Bayesian learning and the relevance vector ma-
chine,” J. Machine Learning Research, vol. 1, pp. 211–244, Jun. 2001.[22] M.M. Kalayeh, T. Marin, P. H. Pretorius, M. N.Wernick, Y. Yang, and
J. G. Brankov, “Channelized relevance vector machine as a numericalobserver for cardiac perfusion defect detection task,” SPIE MedicalImaging, vol. 7966, 2011.
[23] B. D. Gallas and H. H. Barrett, “Validating the use of channels to esti-mate the ideal linear observer,” J. Opt. Society America A, vol. 20, pp.1725–1738, 2003.
1618 IEEE TRANSACTIONS ON NUCLEAR SCIENCE, VOL. 60, NO. 3, JUNE 2013
[24] M. A. Kupinski, E. Clarkson, J. W. Hoppin, L. Chen, and H. H. Barrett,“Experimental determination of object statistics from noisy images,” J.Opt. Society America A, vol. 20, pp. 421–429, 2003.
[25] S. Park, H. H. Barrett, E. Clarkson, M. A. Kupinski, and K. J. Myers,“Channelized-ideal observer using Laguerre-Gauss channels in de-tection tasks involving non-Gaussian distributed lumpy backgroundsand a Gaussian signal,” J. Opt. Society America, vol. 24, no. 12, pp.B136–B150, 2007.
[26] C. J. C. Burges, “A tutorial on support vector machines for patternrecognition,” in Data Mining and Knowledge Discovery. New York:Kluwer Academic Publishers, 1998, vol. 2, pp. 121–167, Number 2.
[27] M. V. Narayanan, H. C. Gifford, M. A. King, P. H. Pretorius, T. H.Farncombe, P. Bruyant, and M. N. Wernick, “Optimization of iterativereconstructions of 99 m/Tc cardiac SPECT studies using numerical ob-servers,” IEEE Trans. Nuclear Science, vol. 49, no. 5, pp. 2355–2360,Oct. 2002.
[28] D. J. C. MacKay, “Bayesian interpolation,” Neural Computation, vol.4, no. 3, pp. 415–447, May 1992.
[29] C. E. Rasmussen and C. K. I. Williams, Gaussian Processes for Ma-chine Learning. Cambridge: MIT Press, 2006.
[30] K. P. Bennett and O. L. Mangasarian, “Robust linear programming dis-crimination of two linearly inseparable sets,” Optim. Meth. Software,vol. 1, pp. 23–34, 1992.
[31] C. Cortes and V. Vapnik, “Support vector networks,” MachineLearning, vol. 20, pp. 273–297, 1995.
[32] P. H. Pretorius, M. A. King, B. M. W. Tsui, K. J. LaCroix, and W. Xia,“A mathematical model of motion of the heart for use in generatingsource and attenuation maps for simulating emission imaging,” Med.Phys., vol. 26, pp. 2323–2332, 1999.
[33] M. Ljungberg and S.-E. Strand, “A Monte Carlo program for the simu-lation of scintillation camera characteristics,” Computer Methods andPrograms in Biomed., vol. 29, no. 4, pp. 257–272, Aug. 1989.
[34] MOSEK, Aps, Denmark [Online]. Available: http://www-.mosek.com[35] SPIDER, Max Planck Institute for Biological Cybernetics [Online].
Available: http://www.kyb.Tuebingen.mpg.de/bs/people/spider/[36] R. Courant and D. Hilbert, Methods of Mathematical Physics.
Hoboken: Wiley-Interscience, 1953.[37] ROCKIT, [Online] Available: [Online]. Available: http://metz-roc.
uchicago.edu/MetzROC/software/software[38] J. G. Brankov and P. H. Pretorius, “Personalized numerical observer,”
in Proc. SPIE, 2010, vol. 7627.