ielllllllllei mmhmhhhhhhhlo mhhhhmmhhhhhlm … · binary alloys, (4) development of a statistical...
TRANSCRIPT

"D-A167 306 SEMICONDUCTOR ALLOY THEORY(U) AtERN UNIV LA DEPT OF 1/1PHYSICS A CHEN 14 JAN 86 AFOSR-TR-86-0160RFOSR-84-0282
UNCLRSSIFIED F/0 11/6 NLIElllllllllEImmhmhhhhhhhlomhhhhmmhhhhhlmmhhhhhhhmmhmmmIIIIIIIIIIIIuEIIIIIIIIIIIIu
I."I
Ia.,
L6.
11111L - 1 L1.6
micRnoCOP CHA9T
4.S.
Pk .1 -A %*.*.
A FOSR-TR. 8 6- 0 160
0
PHYSICSSEMICONDUCTOR AIOY Tl (1, )-
AIR FnRCE OFFICE OF SC I 8Nf'C ,i:,EARC"
AFOS P -84- 0 2 8 2
DTICZLECLEDSr
DD
AUBURN UNIVERSITYAUBURN, ALABAMA :
--.
.. .. .. .. .. .. . .. •.. .. .... .. .

DTICS ELECT"eAPR2BS
SEMICONDUCTOR ALLOY THEORY
FINAL REPORT
AIR FORCE OFFICE OF SCIENCE RESEARCH r
AFOSR-84-0282
September 1, 1984 to December 31, 1985 ii
Submitted by
An-Ban Chen, Physics DepartmentAuburn Univeristy, AL 36849
Date: January 14, 1986
AIR 701M077 (YTC' 09 SCITTI7C R9MU" (AIW)ITOTICI 1f TRAP SJLtTl TO DTICThis toahnic-il rcix-rt r:iv; '.A emd 13
MATTKN 3. XXV11Mi
unclassililedSCUIVCLASSIFICAT1ON OF THIlS PAGE (10%0- 0at.E £neE __________________
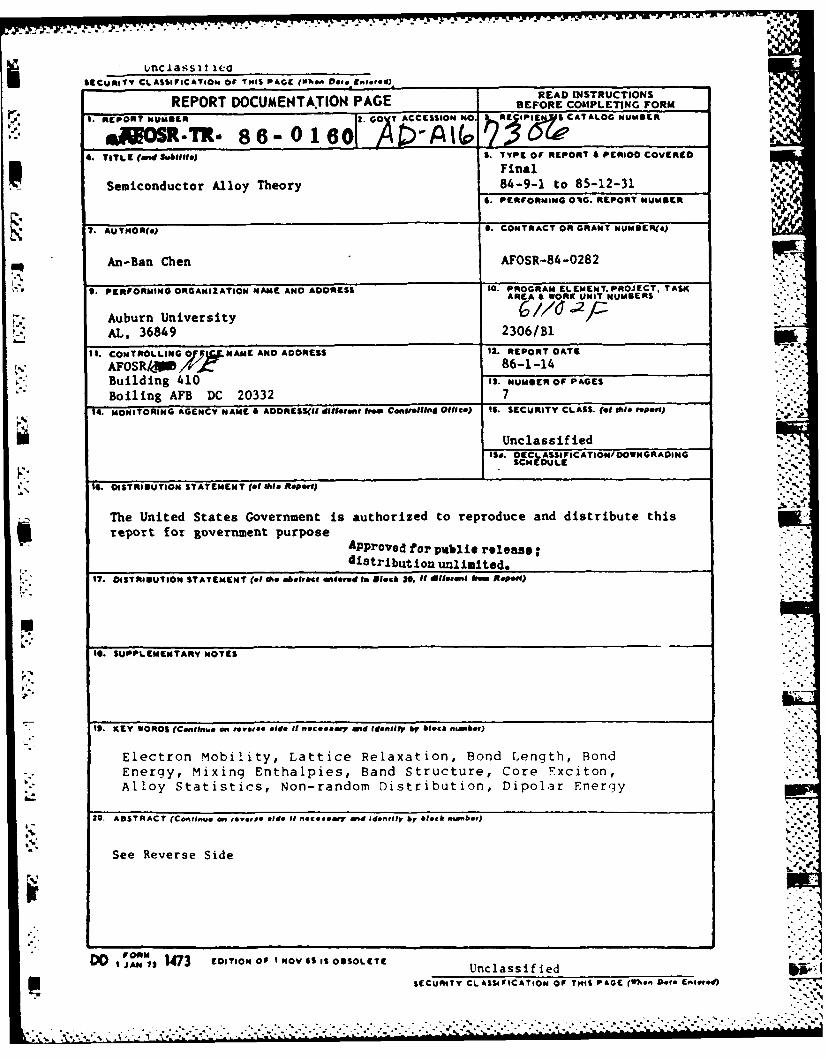
READ IN4STRUCTIONSREPORT DOCUMENTATION PAGE BEFORE COMIPLETING FORM
I. RCPORT NUMBER 12. GOTACCESS1IN NO. 3R PSI S CATALOG WNDER
&*IJMiRd 8 6- 0 (1 A hL 0 MI 93~L4. TITLE an sublefe3 S. Type or REPORT a PERIOD COVERED
FinalSemiconductor Alloy Theory 849- o 5123
S. PERFORMING ONG. REPORT NUMBER
7. AUTtIOR1(s) S1. CONTRACT ON GRANT wUMBCN(a)
An-Ban Chen AFOSR-84-0282
9. PERFORMING ORGANI11ATION NAME AMC ADDRESS 10. PROGRAM ELEMENT. PROJECT. TASKCAREA & WORK UNIT NUMBERS
Auburn UniversityAL, 36849 2306/31
II. CONTROLLING Of PqU. NAME AND ADDRESS 12. REPORT DATE
AFOSR/dW 4X. 86-1-14Building 410 IS. NUMBER OF PAGES
Boiling AFB DC 20332 7
14. MONITORING AGENCY NAME &A DRESSIf 411ffeet ms CoeniwS5ilai Cities) IS. SECURITY CLASS. (1 tis ft p.e)
UnclassifiedSC. DCASIFIC ATION/ DOWN GRADING
5G DLE
1S. DISTRIBUTION STATEMENT (of ihsApn
The United States Government is authorized to reproduce and distribute thisreport for government purpose Apoe o ulcrlae
distribution unlimited.
17. DISTRIBUTIONSTTMN . A afctmlu45 Ih 0 1I.o brRp.)
I0. SUPPLEMENTARY NOTES
* It. KEY WORDS (Conlinw* an rovoloo ad* It ftoc*o~ow7 and Idenify' by block nam. bor)
Electron mobility, Lattice Relaxation, Bond Length, BondEnergy, Mixing Enthalpies, Band Structure, Core Fxciton,AlloY Statistics, Non-random Distribution, Dipolar Fnerqy
20. ABSTRACT (Confinwe on ,*e@,D aid* II A@c*oooo and IdonedyIII b7lock owbot)
See Reverse Side
DO I jA"7 1473 EDITION OF INOYV51 IS ODSOLETE nlssfe
U SECURITY CLASS4SFICATION OF TellS PAGE (".On 9400 Eofor.41
6gCURIY CLASSIFUCATIOw4 or THIS PA~G(W07660 Dole gns.,.e)
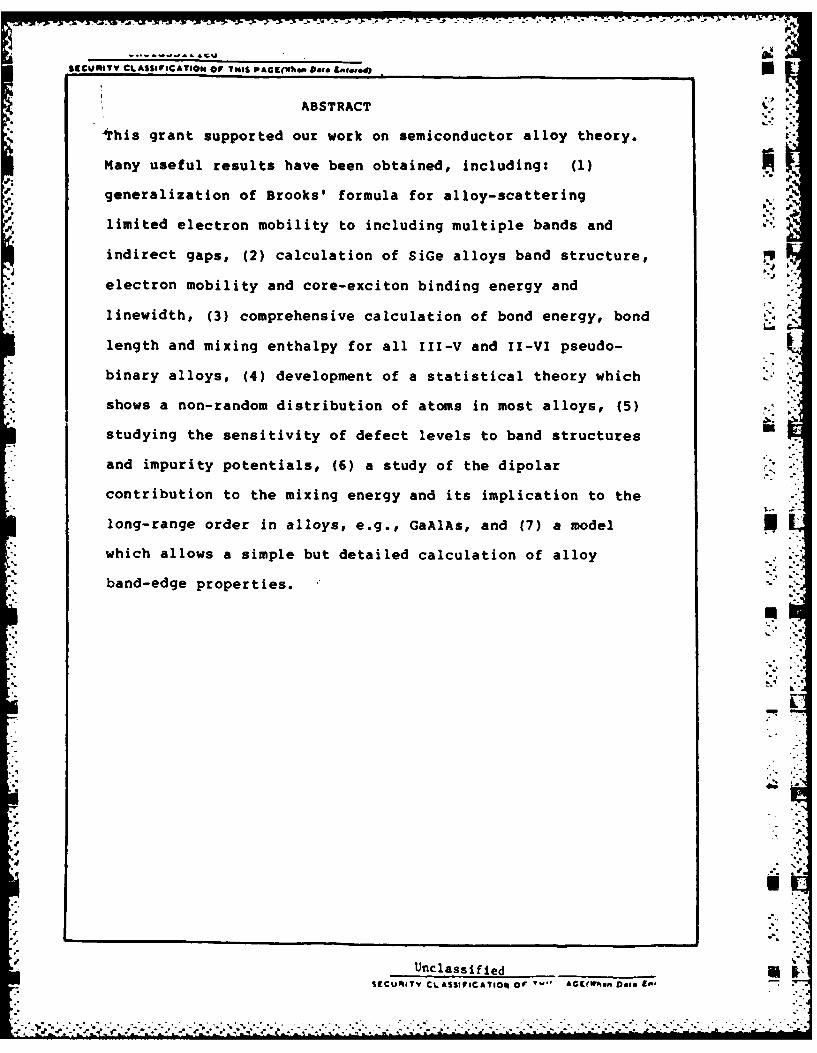
* I ABSTRACT
Nthis grant supported our work on semiconductor alloy theory.
Many useful results have been obtained, including: (1)
generalization of Brooks' formula for alloy-scattering
limited electron mobility to including multiple bands and
indirect gaps, (2) calculation of SiGe alloys band structure,
electron mobility and core-exciton binding energy and
• :linewidth, (3) comprehensive calculation of bond energy, bond
length and mixing enthalpy for all Ill-V and I-VI pseudo-
binary alloys, (4) development of a statistical theory which
shows a non-random distribution of atoms in most alloys, (5) . *
studying the sensitivity of defect levels to band structures
and impurity potentials, (6) a study of the dipolar
contribution to the mixing energy and its implication to the
long-range order in alloys, e.g., GaAlAs, and (7) a model
which allows a simple but detailed calculation of alloy
band-edge properties. "-
PU
*.*1
'5..
Unclassified 0.e-- S CCU0ITY Ct.ASSIOPICATIOGN Or ., AGE(When Does Eft,7.

SUMMARY
This grant supported our work on semiconductor alloy
theory. Through interactions with Dr. Arden Sher's group at
SRI International, many useful results have been obtained under
this grant. Below we summerize th highlights. The details
will be discussed in the publications enclosed with this
report.
A. Generalized Brooks' Formula and the Electron
Mobility in SiGe Alloy
Although Brooks' formula has been used widely for
calculating the alloy-scattering limited electron mobility, we
show that this formula is only valid for a direct-gap
semiconductor. There are also questions about the scattering
parameter and the effective mass. We generalized the formula
for indirect-gap alloys with multiple bands and applied it to
SiGe alloy. Our results, correlated well with experiments,
showed that the electron mobility drops fast with alloying.
The mobility has a dip at 15% Si concentration, corresponding a
transition from the X to the L edge.
B. Bond Lengths, Lattice Relaxation and MixingEnthalpies in Semiconductor Alloys
We treated the problem with a model which combines
Harrison's bonding theory with a valence force model and an ,des
-2- t-P.Cia-
2F:rEc • .C..
elastic continuum. While the local strain is the main driving
force for the bimodal bond-length distribution in pseudo-binary
alloys found in the EXAFS experiment, we found that the
* chemical shifts arising from different bond lengths and ."
polarities of the constituent bonds can have a significant
contribution to the mixing enthalpies. In fact, the sizable
negative values of the chemical shifts in the cation r.
substitutional alloys, e.g. Ga(x)In(l-x)As, may be important .
for stabilizing the mixture. We also deduced a simple
criterion for separating miscible from immiscible alloys.
C. Sensitivity of Defect Levels to Host Band
Structures and Impurity Potentials V.
Our calculation of defect levels for more than 30
impurities in CdTe showed that the discrepancies caused by
different host band structures and impurity potentials ranged
from less than 0.1 eV to the whole band gap (1.6 eV). This
result casts some doubt about the quantitative nature of the
empirical tight binding method for deep-level studies. We also
suggested ways to improve the theory.
D. SiGe Alloys - Band Structure and Core-Exciton
SiGe binary alloy has regained research interests recently,
because it has a potential for high-speed devices in the
strained superlattice configuration. We have applied our
-3-
p... .. . .. . . . . ..... . .. ° p . •-
. ° ° . o ° -. .. °. °. ° °° ° ° - °. o. . . ° • ° . • . . -. p .p . - ° . p. o . p, '. • " - . . .° . * . . ..'° •-p ° -

Pi
technique to obtain high-quality band structures for Si and Ge,
and have performed alloy calculation for Si(x)Ge(l-x). The
results have been checked against available optical data and
have been applied to the mobility calculation mentioned
earlier. Another interesting result is that the alloy band
parameters allowed us to correlate the Si 2p core-exciton
binding energy with its linewidth in the alloy. The observed
minimum in the linewidth near x=0.15 can be explained as a
result of competition between an intrinsic broadening due to
screening and an extrinsic alloy scattering. The most
reasonable binding energy in pure Si was found to be 0.15 eV.
This work thus has helped resolve the controversy about the
unusually large binding energy for the core exciton in Si.
pE. Calculation of the Alloy Band-Edge Properties
There are two basic techniques for calculating the band
structure in semiconductor alloys: empirical formula and
detailed theory such as the coherent-potential approximation
(CPA). The formal is handy to use, but provides very little
insight. The latter is usually very time consuming, and for
energies near band edges the numerical accuracy is often
questionable. For !II-V and most of the I-VI pseudo-binary
alloys, these difficulties can be circumvented by using
perturbation theory. Moreover, the CPA results are sensitive
-4-......

uI
the band models used for the constituent compunds. By :F *f
examining the overall structures of the Green's function, ; .
partial densities of states, and the tight-binding interaction
parameters involved in the band-edge states and in the
perturbation theory, we have concluded a procedure for a simple
but detailed calculation of the various contributions to the *
band gap bowing and the low-field electron mobility in these
alloys.
F. Dipolar Contribution to Alloy Mixing Energyand Its Implication to Long Range Order
The alloy formation energy (F.E.), defined as the
difference between tha alloy total energy and the average of
the constituents' values, and mixing entropy are two competing
factors which govern the alloy thermodynamics. While a : -
negative E favors a long-range order (LRO) at low temperature,
a positive F.E. tends to cause spinodal decomposition. It was
suggested recently that the long-range electrostatic
interaction among cations and anions contributes to a negative
F.E., and hence serves as a driving force for the LRO found in
GaAlAs grown by MBE and MOCVD. We showed analytically that,
when all terms are included, this dipolar contribution to F.E.
is positive. Thereforc, it is not a force to stabilize the LRO
phase. However, the value of the dipolar F.E. in the ordered
phase is smaller than that in the disordered one. Since the
a .|-5-
. - -* ..

initial distribution of atoms in the growth process is closer
to the LRO phase than to the spinodally decomposed one, the
dipolar force may tend to drive the system toward the former -
a metastahle phase.
G. Statistics and Micro-clustering in Alloys
One of our major efforts was to develop a statistical
theory for 5Femiconductor alloys which will cover three aspects:
energetics, statistics and phase diagram. Because of the
smallness of the mixing enthalpies, typically several Kcal/mol,
the present first-principle theory is not accurate enough for
this purpose. We found that a combination of Harrison's model
and a valence force field model provides an adequate approach.
p We then generalized Guggenheim's quasi-chemical approximation
to treat the tetrahedral clusters. Our results showed a
' non-random atomic distributions in most alloys. This
non-random distribution will affect the band structure,
mobility and mechanical properties of alloys, and will reflect
in many measurable properties such as phonon spectra, EXAFS,
- deep level spectra etc.. The study of these effects is one of
our current efforts.
6.
- 6- "I l.i
,,.... . .. . . .'. . ........ . .
r.*
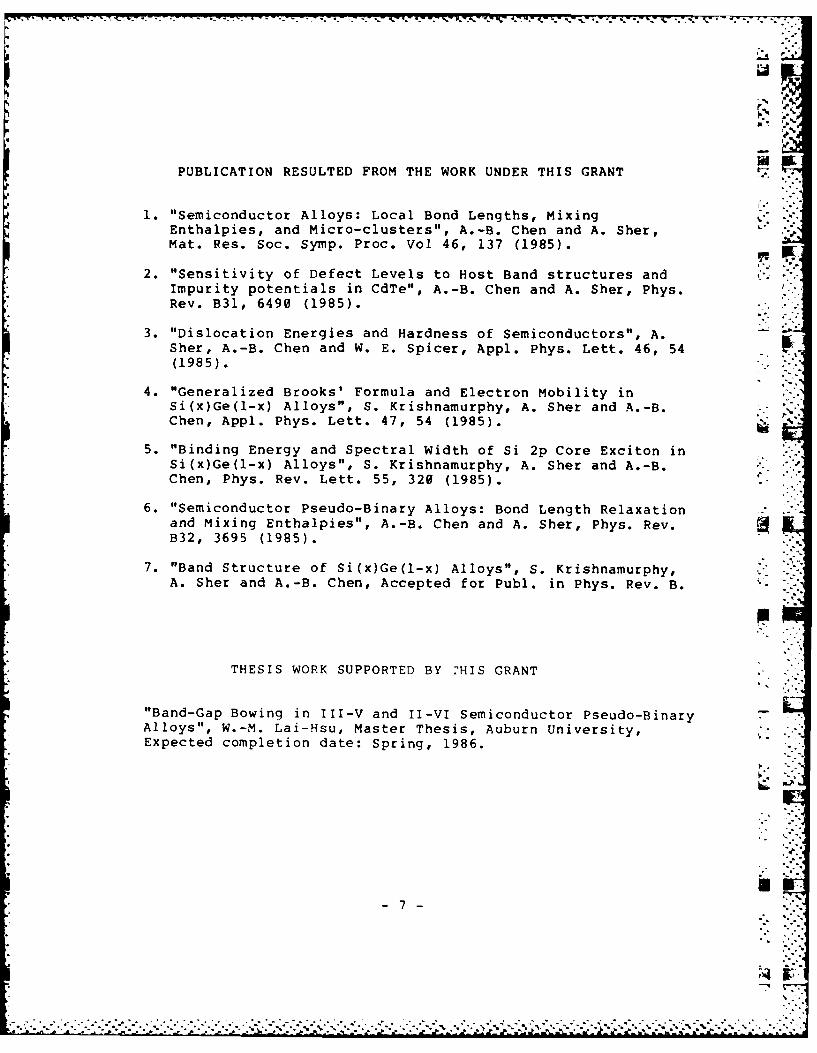
PUBLICATION RESULTED FROM THE WORK UNDER THIS GRANT
1. "Semiconductor Alloys: Local Bond Lengths, MixingEnthalpies, and Micro-clusters", A.-B. Chen and A. Sher,Mat. Res. Soc. Symp. Proc. Vol 46, 137 (1985).
2. "Sensitivity of Defect Levels to Host Band structures andImpurity potentials in CdTe", A.-B. Chen and A. Sher, Phys.Rev. B31, 6490 (1985).
3. "Dislocation Energies and Hardness of Semiconductors", A.Sher, A.-B. Chen and W. E. Spicer, Appl. Phys. Lett. 46, 54(1985).
4. "Generalized Brooks' Formula and Electron Mobility inSi(x)Ge(l-x) Alloys", S. Krishnamurphy, A. Sher and A.-B. VChen, Appl. Phys. Lett. 47, 54 (1985).
5. "Binding Energy and Spectral Width of Si 2p Core Exciton inSi(x)Ge(l-x) Alloys", S. Krishnamurphy, A. Sher and A.-B.Chen, Phys. Rev. Lett. 55, 320 (1985).
6. "Semiconductor Pseudo-Binary Alloys: Bond Length Relaxationand Mixing Enthalpies", A.-B. Chen and A. Sher, Phys. Rev.B32, 3695 (1985).
7. "Band Structure of Si(x)Ge(l-x) Alloys", S. Krishnamurphy,A. Sher and A.-B. Chen, Accepted for Publ. in Phys. Rev. B.
THESIS WORK SUPPORTED BY THIS GRANT
"Band-Gap Bowing in III-V and II-VI Semiconductor Pseudo-BinaryAlloys", W.-M. Lai-Hsu, Master Thesis, Auburn University,Expected completion date: Spring, 1986.
7 -.

S I. e I7.7.7.

PHYSICAL REVIEW B VOLUME 32, NUMBER 6 15 SEPTEMBER 1985
Semiconductor pseudobinary alloys: Bond-length relaxation and mixing enthalpies
A.-B. Chen5Department of Physics, Auburn University, Alabama 36849. .'
"%,".'° .,*
A. Sher
SRI International, Menlo Park, California 94025(Received I March 1985) ./
Harrison's bonding theory, the valence force field (VFF), and an elastic continuum are combined
in a study of the substitution energies A, and local (first-shell) bond lengths di of isoelectronic im- WWIr purities in semiconductors. Explicit expressions for A, and d , are derived, which enable us to ab-
sorb measured elastic constants into the calculation and to study the chemical effects arising fromdifferences in the covalent radii and polarities. Several models based on VFF alone are also derivedfor comparison. The full theory and at least five VFF models are found to produce impurity bondlengths in excellent agreement with experiment. The substitution energies are shown to providegood estimates of the mixing enthalpies fl of pseudobinary alloys and to predict miscibility gapsproperly. The chemical shifts in fl are found to be negative for most cation alloys but positive foranion substitutions.
I. INTRODUCTION II. IMPURITY-SUBSTITUTION ENERGY
Consider the problem of substituting an isoelectronicatom A for a B atom in a zinc-blende compound BC (e.g.,*" The discovery of a bimodal distribution of the nearest- In substitutes for Ga in GaAs, as shown in Fig. 1). In . .
- neighbor bond lengths' in Galnl,_XAs has sparked con-siderable interest in the bonding nature of semiconductoralloys. 2- 6 This finding has changed the conventional pic-ture of the alloy crystal bond configuration, which hasfar-reaching implications about the electronic structure.structural stability, and thermodynamics of these materi-als. Because of the complexity of both the structural and d 3
the potential disorder in these alloys, ab initio band-structure techniques have not yet evolved to a stage suit- ,
able for direct calculations. Therefore, we have extendedHarrison's bonding theory' to study the alloy structuralproperties." In this paper, we apply an intermediate ver-sion of the theory to the dilute-limit case of an isoelect- A
ronic impurity.A particularly useful applicatioa of the theory is its
perturbation-expansion form, in which measured elastichconstants are incorporated to obtain accurate results.
- This form is also useful for comparison with other previ-ously published models that are based on the valence-force-field (VFF) (Ref. 10) model alone. Thus, all thefactors influencing bond-length relaxation, e.g., strains. OS T!ON S OSPLACE M%'
boundary conditions, and chemical effects, can be studied. C , . "The ability to incorporate the chemical effects is one ma- "9 0 2 d
jor difference between this theory and other VFF models. 322 ,The remainder of the paper contains the following sec- 0 '0
tions. Sec. II describes a theory for calculating im purity . . ,. , ,.
substitution energies. Section III casts the theory into .3perturbation form and combines it with a %alence force . ,, .. ,
field and an elastic continuum. Several VFF model,, are 'derived in Sec. IV. The modifications of numerical re- 3 , 1 /sults due to chemical effects on local bond lengths and a]- FIG I A sketch of the flattened picture of a single impuntvloy mixing enthalpies are summarized and discussed in .4 in . C cmpound. The position and displacements forSec. V. Conclusions are drawn in the last section, Sec. VI. those atoms labeled are used in Appendix B
32 3 05 c 1985 The American Physical Society
* ' "" " " "" ' '""" "" """ "" "' :=":'" - "" "; ' ' "; -"" """"" " '"""-

3696 A.-B. CHEN AND A. SHER 32
general, the bond lengths d1 . d,. d,... for the first-, with a bond length dl, whereas U. (2) is the correspond- "' :
second-, and third-shell bonds surrounding the impurity ing probability amplitude for the antibonding state of aare different from the equilibrium values of either the BC bond of bond length d2. Finally, V' is a repulsivepure BC compound, denoted as d, or the "impurity" con- pair potential required to prevent the crystal from collaps-pound AC, denoted as d, =d( I- 0 ). If A starts being a ing and to guarantee a correct equilibrium bond length. ..free atom and B also ends being a free atom, then the en- The local perturbation, Eq. (5), is applicable because the i%ergy difference between the final and initial states is de- square root of the numerator is much smaller than thefined as the substitution energy and is given by separation between the antibonding and bonding levels "k
and the valence band is completely filled, so the interac- ,. .A,= (Edf + E)- (Epure + A) (i) tion between the bonding states only spreads the Et, levels
where EA and EB are free-atom energies for A and B, into bands without affecting the center of gravity of the Irespectively, Ed f is the total energy of the semiconductor occupied states.with a defect as sketched in Fig. I, and Epure is that of the The replacement energy AR of Eq. (2) can now be writ-pure host BC crystal. Equation (i) can be written as ten explicitly:
A5 z(Edef-Ed,)--EA EB)+(Ed,,-Epurr) AR=4[ ,AI)BB)_aB 8B
AR - (EA - E )+ A,, (2) 2Eb I) VON(I) 6EW;,B( 1, 1 ) - 6cW.c(2, !1)
where we have added and subtracted a term Ed,, , which is 1-6"-( 1,2)- 6,.c( 1,2)]. (6)the total energy of a distorted BC compound with all the The distortion energy Ad, of Eq. (2) now involves only BC"atoms held at the positions spcified in Fig. 1, except that bonds of different bond lengths. It can be treated with ex-'" the central atom is a B atom. Clearly, AR =Edf -- Ed,, is- ""
te cactly the same procedure for any given set of bond-length ,.a replacement energy, and the distortion energy distributions. Thus, a straightforward energy minimiza-Ad,,= Eds - Epure is the energy required to deform a pure tion procedure can be carried out. The accuracy of thisBC crystal from its equilibrium lattice to that specified in procedure, however, depends in turn on the accuracy ofFig. 1. AR contains all the chemical terms that arise from At -"different bond lengths and polarities between AC and BC 17 4bonds. present, Harrison's model7 with V2 cx IId 2 and V, 0: i/d"
AR can be treated most easily by Harrison's bonding and his universal parameters are only semiquantitative.theory.7 In this theory, the energy per bond relative to the We are improving the quantitative nature of the theory sovacuum. statehis tethat the full theory will yield accurate predictions of the -vacuum state is structural and thermal properties of semiconductor de-
Eb 2 fb + V +- 6E, + 6r . (3) fects and alloys.
where Eb is the energy of the bonding state constructedfrom the two hybrid orbitals facing each other along the III. PERTURBATION EXPANSION,bond direction VALENCE FORCE FIELD,
AND ELASTIC MEDIUMEb +(, +Eh - + V ,(4) As pointed out earlier, a perturbation expansion of the
with and being the energies of the anion and cati theory is instructive. This is feasible because the differ-ences A V, = V.(AC)- V2(BC) and AV 3 = V3t AC)
"-" hybnd orbitals, respectively. The antibonding energy , - 1IBCE are small compared to each individual value forhas the same form as in Eq. 4. except with a plus sign. many of the isoelectronic impurities in II-IV and I-VIi,' is called the covalent energy, which is the total elec- m n To this e ni .iu ritte n atrnc -ailoin"an emntbwenhewob- compounds. To this end, Eq. 16) is rewritten as"' ironic Hamiltonian matrix element between the two hy-
brids in question, and the polar energy V, is the differ- -,R E;( 1 )_E, I )+6[r 4 .l ,,1))C 4 , I ] b,.* ence V= - '--Eh. The c and c,. the metallization
energies, are the shifts of the bonding lesel caused by in- -bfEa .l -- 1)teractions with the neighboring antibonding states, where 4.,,- 1, r.R I 2 2 ] -.""+ and - indicate whether the common adjacent atom isa cation or anion. For example, this term for an AC bond I.[2. ,2-) ]labeled by d, in Fig. I due to an antibonding state labeledby d. is given by -here E i I I and EfI 1() are energies per bond in Eq. 3)
Uil' 821 : for AC and BC compounds, respectivel%. with the relaxed) bond length dI =dtl- b . The difference between theseEb( I -- Ea 2) energies E, and the corresponding values at their respec-
tive equilibrium bond lengths d, and d are just the strainwhereC.4 and B denote.AC and BC bonds, respectivel, energies per bond in uniform deformation:= --~. (, with c, and u' being the s- and p-term
values of the common adjacent atom C. Ubt4l) Is the E, I -4l d, 2 k 3Btd, d I dlprobability amplitude of finding an electron in the h~bnd "orbital of the C atom in the bonding state of an AC bond Eh', I Eh' d 2'R 3Bdd d,:

32 SEMICONDUCTOR PSEUDOBINARY ALLOYS: BOND-LENGTH ... 3697
where B, and B are the bulk moduli for the impurity AC versely proportional to the square of the distance from the .0and host BC crystals. The rest of the terms in Eq. (7) are center. The elastic energy in this medium can be shownall due to changes in c, caused by the differences AV 3 to be (see Appendix A)and AV2. We shall use Harrison's scaling rules to deduce t (14)them.7 Expanding Eq. (7) to second order in AV 3 and dis .... (14)Ad =d 2 -d1, we write where the effective shear coefficient is
6(E.,(2,1) -c.( I c=4[0.4(i)- .2cJ= fl Ad --g1 A V3 + h ( Ad)2 W, Ad I& V3 + U ( A V3 )' C=rr0* 1 -C1)+.24
' and u is the displacement at R. In view of the fact that I
(9) the bonds d, and d2 are coupled through the chemical Mterms in Eq. (10), the smallest logical radius R is thelwhere f, g, and so on, are appropriate derivatives second-shell atomic distance, namely R=2v'2d/v'3.
evaluated for the impurity crystal AC. When similar E x- Atoms on this boundary have displacements of the formspansions are made for the rest of the terms in Eq. (7), it u=d(,,)/V3_..... Thus, u =V'V2d/V'3 and thebecomes [with d, =d( 1-6), d, =d( 1 -6o)] elastic energy in the continuum is
SAR = AEb +(f -f)Ad -(g,-g)AV 3 +(h, +h)(Ad )2 -.." ,)--" -I-
-( W1 + W)Ad AV 3 +( U, ±U)(AV 3 )2(10) The distortion energy represented by Eq. (14) contains
+2'Bd3(6-) 2 -23Bd3 2 , (10) six different contributions (see Appendix B): the bond-
where stretching energy of the four first-shell bonds 6a82d 2, the6 terms from the first-shell bonds, #8 2d 2, the a terms %
AEb-Eb(d,) 4(d)- (-EA ) (11) from the second-shell bonds, 2a(6+2) 2 d 2, the 6 termsbetween the first- and second-shell bonds, 21(6+y) 2d2 ,is just the difference in the binding energy per bond be- t e ao h cn ebdnfi-
tween the "BC' and "AC' crystals. In Eq. (10) the coef- the f terms bete the second-shell bonds andficients fg without a subscript are those for the host BC those in the continuum,system. It is convenient to define an excess energyAE = 4/4 - AEb, which is the extra energy per bond re-quired for the impurity substitution over and above the '0d 2 [(36+X1iY) 2+(8+X 2Y )2 ]binding-energy difference between the BC and AC crys-tals. The binding-energy difference accounts for much of where X =40V'2 /(19V'Y) and X2=2-40V/2/( ! IvTI).the substitution energy; however, the correction measured To assemble all the contributions to Eq. (12), we need toby the excess energy can be significant. The excess energy consider the assignments of the elastic constants and the . .results from strain energies and chemically driven charge force constants a and 6 in VFF. While the experimentalredistributions around the defect. Using Eqs. (2) and (10) values" of C11, C 12 , and C44 can be used for the elasticand defining F =fl -f and G =gl -g, we can write AE constants, a and / have to be deduced. If Martin's origi-up to second order in A V3 and Ad as nal procedure10 (also followed by Martins and Zunger 3) is
used, then Eq. (13) alone will not produce the correct (ex-A=V-B~d (-8 0) 2-2V3Bd 3 82+FAd -G AV 3 perimental) bulk moduli. There are small corrections due
to Madelung terms, which are hard to treat in the case of+H(Ad W Ad V 3 +U(A V 3 ) +IAda (12) nonuniform distortions. A simpler procedure is adopted
where H = +h, W=wi+w, and U=u,+u. here. We use the experimental bulk moduli for B, and Breat tin Eq. (12) and experimental elastic constants to calculate
To treat the distortion energy Adg, we divide the crystalinto two regions. Inside a sphere of some radius R mea- C of Eq. (14) and then force a and f9 in the VFF to pro-sured from the impurity, the strain energy is taken to be duce the correct bulk moduli B and shear coefficientsthe valenceforcefieldlO value: C11-C1 2 . Such an approach is also consistent with .-
Harrison's bonding theory' and other approaches in which
,n t_aA(di'di)12 the Coulomb forces are automatically incorporated in theds -8d' band and bond energies, and do not need to be redundant-ly treated. With our procedure, the bulk modulus is sim-
+ - ' ,~ ,1[A(d,.d,)] 2 , (13) ply related to the force constants by B=(3a+l)/(4V3d).+id 1 7 Table I lists our a and f values. We want to point out in
advance, however, that the numerical results deducedwhere i sums over all the bonds inside R and the pairs in from our sets and those of Martin of a and 0 do not in-the P terms include those that have adjacent atoms inside troduce differences more than the present experimentalR and on the boundary. The parameters a and 0 are uncertainties in the local bond length (-0.01 A) andforce constants to be considered later. A(d-d)=d,d, the mixing enthalpies ( >0.5 kcal/mole).-d" d"' measures the change of the dot product be- Using the above procedure and adding all contributions. * .'.tween bond vectors due to distortions. Outside R we as- the excess energy per bond from Eqs. (10) and (12) is thesume an elastic continuum with radial displacements in- full perturbation theory (FPT) result . j
. ............... .
-- 7-
3698 A.-B. CHEN AND A. SHER 32
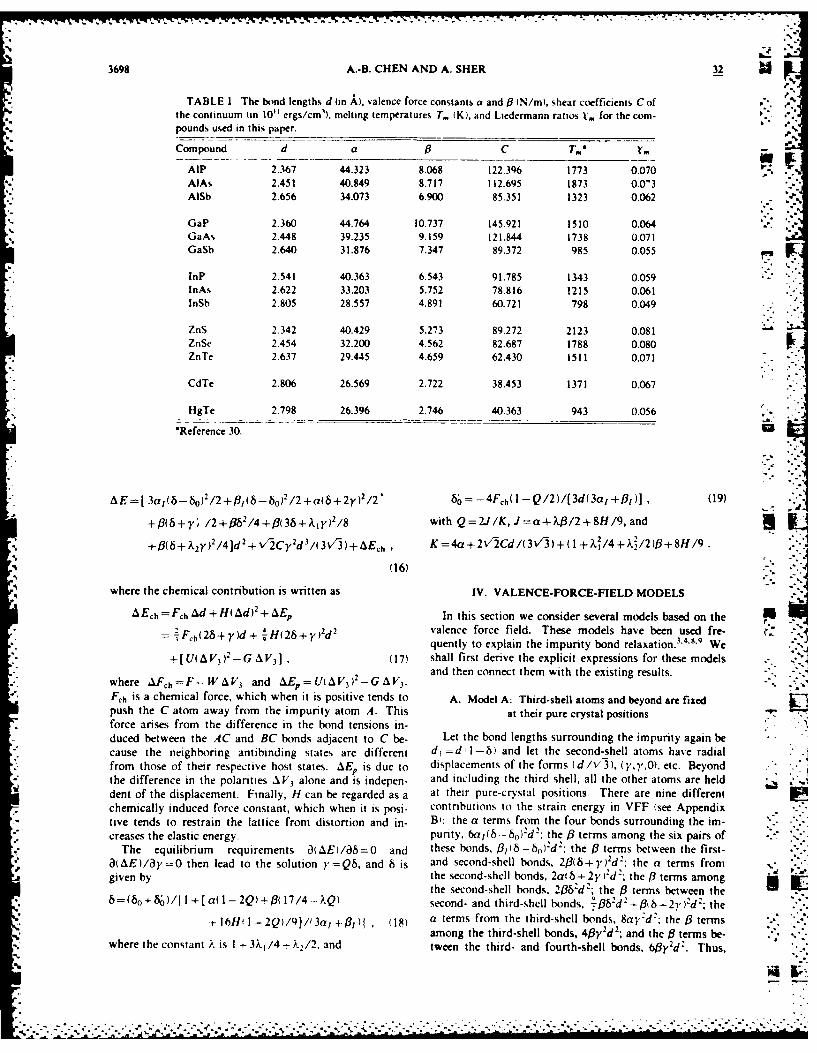
TABLE 1. The bond lengths d (in A), valence force constants a and 0 (N/m), shear coefficients C of "the continuum (in 10"l ergs/cm'), melting temperatures T. (K). and Liedermann ratios t., for the com-pounds used in this paper.
.--
Compound d a 0 C T-" .0 -
AlP 2.367 44.323 8.068 122.396 1773 0.070AlAs 2.451 40.849 8.717 112.695 1873 0.0'3AISb 2.656 34.073 6.900 85.351 1323 0.062 .
GaP 2.360 44.764 10.737 145.921 1510 0.064GaAs 2.448 39.235 9.159 121.844 1738 0.071GaSb 2.640 31.876 7.347 89.372 985 0.055
inP 2.541 40.363 6.543 91.785 1343 0.059InAs 2.622 33.203 5.752 78.816 1215 0.061lnSb 2.805 28.557 4.891 60.721 798 0.049
ZnS 2.342 40.429 5.273 89.272 2123 0.081ZnSe 2.454 32.200 4.562 82.687 1788 0.080ZnTe 2.637 29.445 4.659 62.430 1511 0.071
CdTe 2.806 26.569 2.722 38.453 1371 0.067
HgTe 2.798 26.396 2.746 40.363 943 0.056
'Reference 30. Ul
AE=[ 3a,(6- 6o)'/2+,(b -6o) 2 /2 +a(S+2y)2/2 6o= -4Fb( l -Q/2)/(3d(3a,+ 3)] , (19)
+(6+y; /2+fl62/4+fl(36--Xy) 2/8 with Q=2J/K, J=a+k13/2+8H/9, and 3+B(3+X.zy)/4]d+V2Cr d3/(3V'3)+AE,h, K=4a+2V'2Cd/3V_3)+( l+X./4+k22/2)fl+8H/9.
(16)
where the chemical contribution is written as IV. VALENCE-FORCE-FIELD MODELS
AECh =Fh Ad+H(Ad)2 +AE, In this section we consider several models based on the
=. Fch(26+r)d+ H(26+r) 2d valence force field. These models have been used fre-quently to explain the impurity bond relaxation.' ' We .
+[U(AV 3)-G AV 3] , (17) shall first derive the explicit expressions for these modelsand then connect them with the existing results.where AFch=F-WAPV3 and AEp=U(AV312-GAV,."'. -.
Feh is a chemical force, which when it is positive tends to A. Model A: Third-shell atoms and beyond are fixedpush the C atom away from the impurity atom A. This at their pure crystal positionsforce arises from the difference in the bond tensions in-duced between the AC and BC bonds adjacent to C be- Let the bond lengths surrounding the impurity again because the neighboring antibinding states are different d =d, I-8) and let the second-shell atoms have radialfrom those of their respective host states. AE is due to displacements of the forms (d/v 3), (y,',O). etc. Beyondthe difference in the polarities AV 3 alone and is indepen- and including the third shell, all the other atoms are helddent of the displacement. Finally, H can be regarded as a at their pure-crystal positions. There are nine differentchemically induced force constant, which when it is posi- contributions to the strain energy in VFF isee Appendixtive tends to restrain the lattice from distortion and in- BI: the a terms from the four bonds surrounding the im-creases the elastic energy. purity, 6at8- 80 )2d2: the 3 terms among the six pairs of
The equilibrium requirements d()AE)/a8=0 and these bonds, 8()-o)2d": the ( terms between the first-
*aAE)/ay=0 then lead to the solution y=Q8, and 8 is and second-shell bonds, 21(b- -y')d 2 ; the a terms from N..,given by the second-shell bonds, 2a(b 2y )d 2; the 13 terms among
the second-shell bonds, 2,6d 2; the )3 terms between the6=(60+8;)/I +[ a(I -2Q)-P(317/4--XQ) second- and third-shcll bonds, (bQ z2d -jB8+2y )d2; the
t 16HI -2Q)/9/(3a, fl l , (18) a terms from the third-shell bonds, 8ay,'dz; the (3 termsamong the third-shell bonds, 4(3y 2d2; and the ( terms be-
where the constant A is I + 3X /4 /2, and tween the third- and fourth-shell bonds, 6By'd-. Thus,

32 SEMICONDUCTOR PSEUDOBINARY ALLOYS: BOND-LENGTH... 3699
the excess energy (in this case 41 times the strain energy) AE -[1a1(6-6)+ -4L,6(b-b) 2 + -2ab2 + -L613b2Id2
becomesAE=[-!a(8-6)'+(22)
2E= 4a(-o' ~3(~o2 1(+) and+ -a(8 + 2y)2 _13 2 +1,0(6 +2y)'
+2 5++ 2 d2 . (20 8= 8/[1+ (a +1903/4)/(3a, + 101)] (23)
The minimization of AE with respect to 8 and y leads Eq. This expression will be used to study the effect of trunca-(20) to y= -/4, and tion.
8=80/[l +(a+ 1703/2)/(6a, +#,)I . (21)
We note that there is some ambiguity in the third con- C. Model C: Simple spring model* tribution listed above for the 13 terms between the impuri-
ty and host bonds. The value of 13 could be chosen as one If all the Pls in Eqs. (22) and (23) are set equal to zero,of these combinations fl, 1, -v(1±1 ,6), V , or other we have the simple spring model withproper combinations. Because the values of 13 and 13I are &E=[Ia(b- 80)2 + }La6]d2 (24)comparable and 13 values are much smaller than a (see2Table 1), the results for 5 and AE are not too sensitive to andthe choice. There is also some ambiguity in the values fordit0t 4 ) for the "undistorted" crystal. The -d /3 usd 6=8o/(l+ la/a,). (25)
is the simplest choice. A different choice will not affect The spring model recently discussed by Shih et al. 8 corre-the results for 8 at all, but will make AE slightly different. pnst q 2)wt as /0 ..
In fact, model A was first used by Martins and Zunger.
F:However, their expression for 5 is different from Eq. (21)because they made different choices of the two quantitiesjust mentioned. Nevertheless, Sec. IV will show that these D. Model D: VFF with the continuum connected
two expressions yield very similar results. These ambigui- to the second-shell atomsties do not occur in the full theory in Sec. III, where theimpurity-host interactions are taken into account natural- 1. Model Dlly by the replacement energy AR [see Eq. (10)].
In this case, AE only contains the first five contribu-..**B. MdelB: econ-shll tomsconecttions listed for case A plus the elastic energy in the con-
t.ode a: fSedoundelarysconc tinuum. However, the P3 terms between the second- andto afixe boudarythird-shell bonds are modified because atoms outside R in
This model corresponds to y, =0 in model A. So we the continuum now have radial displacements proportion-have al to the inverse of the square of the radius. The result is .-
'al +(6- 6) 2 -L,613(5-6,)2 + -L a(6 +2y )2+ V1(--)+182 -1(8Xy 2 +128+Xr
(26)7 7
where X1 and Xare the same as the constants that appear in Eq. (16). The corresponding equilibrium condition can be
shown to be
F. -~- (u/)l 4- [a(il-2Q).19J3/4 13l Al X/4 1k.4Q/10a, +1h/2)1 .27)
a ~where 1,88)d--18d
(2a413±3X1 13/4+ ~./2)it+ 2v- 2Cd/13 3 -.- 4 PIfl t-:L. in Eq. (16) become
2. Model 9)2 a3(6id .18
-A comparison hetv~een q 26 and the full petimrha. in Eq. 126). This difference in the .traim errerg A ill masktion theor>. Eq il hi, shusss ; A maj~or differcrnces. Fir't. the true effects of chemical force%~ if 1't froiri Eq. :h is
all the chemical terrh .ire imhsrT:t in Fq. 20'. SeC. lIdh\ com pared '...it 1:11'r, A bet icr \& .,\ to ST1'th u i hcica) l-the terms effect,, 1s to use ihe l orig eq ual on

3700 A.-B. CHEN AND A. SHER 32 .,,
ly)2c+ 3,- -+ (36+X.Iy) 2 + -- 3(6+X2y) 2]d2+ 3Cy'd
(29)
which is Eq. (16) with all the chemical terms neglected. The corresponding 6 becomes' -'. .2'0I(3a,+i ,' . 30)
with Q still given by Eq. (28). where the mixing energy is given by
E. Model E: Continuum connected A E = E,oy - (xEAc +yEBC)to the first-shell atoms =6N(t£44r 4 +EA 5 r4 5 +£LerEB )- 6N(xc4 , +YC55) :,.
In this case, y =-3V6/(8V'2) and AE only includes =6NrAE, (35)the first three contributions listed in model A plus the I,(strain energy of the continuum: where
AE= [ a,(6- )'+-L,,(6--A£= -- (EAA +END) . (36)
.+ 2 'Cdb 2 d' . (31) generalization of the random distribution.' For modest
~8vV pressure, &E is the same as the mixing enthalpy &HI.The relaxation parameter is bNow the pair interaction energies can be approximately
;ivon by related to the impurity-substitution energies by
'I I and ",
(3' 2) e ... ,0 IA L 3,+11 , (A in BC EA B)(37) I
We note that the continuum model used to estimate thei-(bond-length relaxation by Baldereschi and Hopfield9 cor- Thus, A of Eq. (36) becomesresponds to Eq. (32) without the f5 terms, which yields AE=-[I,(A in BC)+,&(B in AC)8/boA.4 to 0.5, rather than the proper values around 0.7to 0.8. =- [&E(A in BC)+AE(B in AC) . (39)
V. ALLOY MIXING ENTHALPY Usually, the experimental &H. is written as .
The impurity-substitution excess energies AE provide a AH, =x( I -x 1, (40)first estimate of the mixing enthalpies of pseudobinary al- which is equivalent to assuming a random distribution,loys. Most current thermodynamics theories of semicon- i.e., r =2x(I -x). Using this expression for r and com-ductor alloys are based on an extension of the binary solu- paring Eqs. (40) and (35), we see that the mixing enthalpytion model.' 2 In this model, the mixing Helmholtz energy parameter il is given byof an AB_ ICalloy is defined as in BC)+AE(B in AC)]. (41)
AF. = F.io1y - (xFc +yFc), (33) inThis connection provides a further check of the theory.
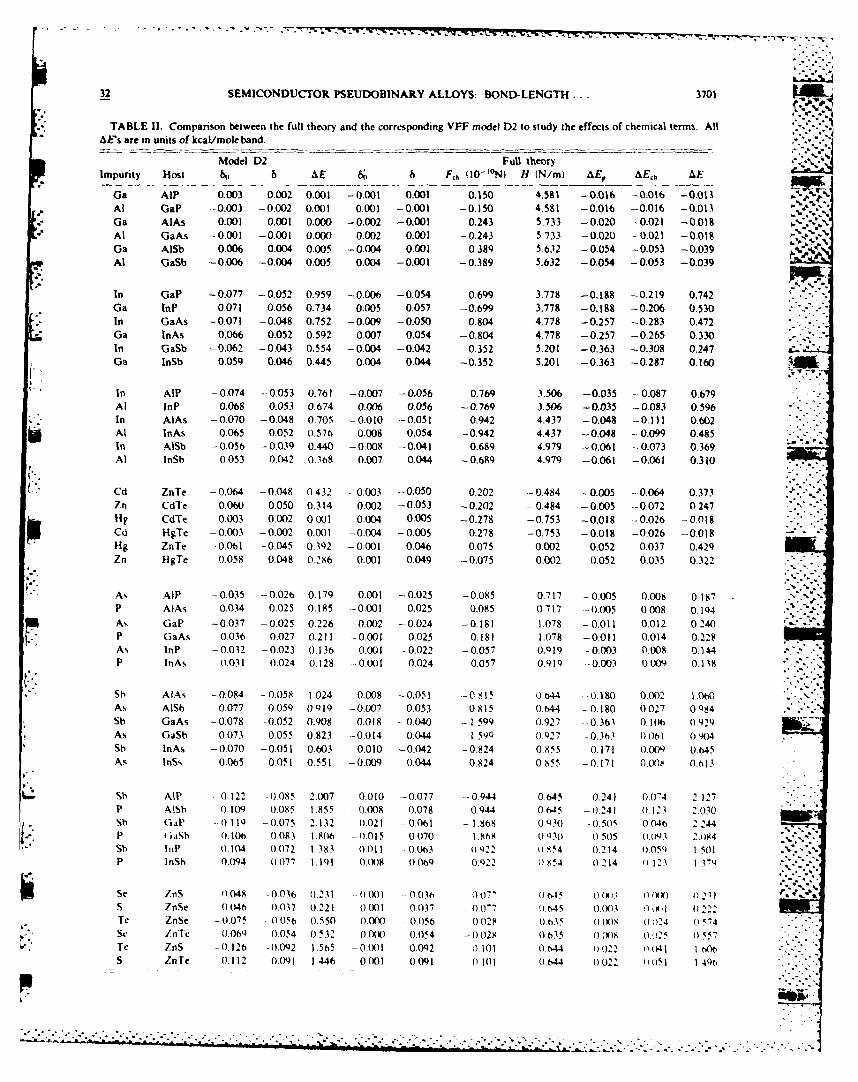
where y= I -x, and FAc and Fyc are the respective freeenergies of the pure AC and BC compounds at the same VI. NUMERICAL RESULTS AND DISCUSSIONtemperature. Because the C atoms occupy a sublattice,the nearest neighbors of A and B atoms in the alloy are A. Chemical termsthe C atoms. Thus, the pair potentials that enter thebinary solution theory are now the second-neighbor in- Table II lists bo= -d,/d, 8= 1 -d 1/ d, the excess en- ..teractions. Let NAA, NAI, and N,5 be, respectively, the ergy (per bond) AE for the full theory and its correspond-
ft. numbers of the second-neighbor AA, AB, and BB pairs, ing VFF model D2, and the terms derived from thewith corresponding pair interaction energies (44, (4B, and metallization energies. 6; [Eq. (19)], Fch. H. AE., and ,
*. EBB. For tetrahedral semiconductors, there are a total of AEch [Eq. (17)]. The appropriate derivatives f, g, h'....6N second-neighbor pairs for a crystal containing N unit [see Eq. (9)] are computed using the atomic-term values i ,cells. Denote the ratios NAA, NAB, and NB# to 6N as that we have fenerated from impurity-level' 3 and
rAA, r A t=r, and rB8, respectively. Then those ratios are structural studies.-related to the alloy composition by rNA =x--r/2 and For substitutions involving the cation pair lGa.AI), F~hr55 =y-r/2. The mixing free energy has two terms, has the same sign as b(,, which means that F h prevents
relaxation and thus tends to increase the strain energy.&Fm AEm - T AS , (34) The chemical forces H are also significant. As a result, I
- . ..... " .- -',.---. ..- ,'' '. .". .-... f,-, . . . .. . f '. . . . t
32 SEMICONDUCTOR PSEUDOBINARY ALLOYS: BOND-LENGTH... 3701 1
TABLE II. Comparison between the full theory and the corresponding VFF model D2 to study the effects of chemical terms. AllAE's are in units of kcal/mole band.
Model D2 Full theoryImpurity Host 6 &AE 6; 6 F,, (10-'°N) H (N/m) AE, AE,, AE
Ga AlP 0.003 0.002 0.001 -0,001 0.001 0.150 4.581 -0.016 -0.016 -0.01 %At GaP -0.003 -0.002 0.001 0,001 -0.001 -0.150 4.581 -0.016 -0.016 -0.013Ga AlAs 0.001 0.001 0.000 -0,002 -0.001 0.243 5.733 -0.020 -0.021 -0.018
-" At GaAs -0,001 -0.001 0.000 0,002 0.001 -0.243 5.733 -0.020 -0.021 -0.019Ga AISb 0.006 0.004 0.005 -0.004 0.001 0.389 5.632 -0.054 -0.053 -0.039Al GaSb -0.006 -0,004 0.005 0.004 -0.001 -0.389 5.632 -0.054 -0.053 -0.039
In GaP -0.077 -0.052 0.959 -0,006 -0.054 0.699 3.778 -0.188 -0.219 0.742
Ga hIP 0.071 0,056 0.734 0,005 0.057 -0.699 3.778 -0.188 -0.206 0.530In GaAs -0.071 -0.048 0.752 -0,009 -0.050 0.804 4.778 -0.257 -0.283 0.472Ga InAs 0,066 0.052 0.592 0.007 0.054 -0.804 4.778 -0.257 -0.265 0.330in GaSb -0062 -0,043 0.554 -0,004 -0.042 0.352 5.201 -0.363 -0.308 0.247Ga InSb 0.059 0.046 0.445 0.004 0.044 -0.352 5.201 -0.363 -0.287 0,160
In AIP -0.074 -0.053 0.761 -0.007 -0.056 0.769 3.506 -0.035 -0.087 0.679Al InP 0.068 0.053 0.674 0.006 0.056 -0.769 3.506 -0.035 -0.083 0.596In AlAs -0.070 -0.048 0.70S -0.010 0 0.942 4.437 -0.048 -0.111 0.602Al InAs 0.065 0.052 0.57b 0.008 0.054 -0.942 4.437 -0.048 -0.099 0.485In AISb -0056 -0.039 0.440 -0.008 -0.041 0.689 4.979 -0,061 -0.073 0.369AI InSb 0.053 0.042 0.368 0.007 0.044 -0.689 4.979 -0.061 -0.061 0.310
Cd ZnTe -0.064 -0.048 0.432 0.003 -0.050 0.202 -0.484 -0.005 -0.064 0.373Zn CdTe 0.060 0.050 0.314 0,002 -0.053 -0.202 -0.484 -0.005 --0.072 0.247tig CdTe 0.003 0.002 0.001 0.004 0.005 -0.278 -0.753 -0.018 -0.026 -0.018Cd HgTe -0,003 -0.002 0.001 -0.004 -0.005 0,278 -0.753 -0.018 -0.026 -0.018Hg ZnTe -0061 -0.045 0.392 -0,001 0.046 0.075 0.002 0.052 0.037 0.429Zn HgTe 0.058 0.048 0286 0.001 0.049 -0.075 0.002 0.052 0.035 0.322
As AlP -0.035 -- 0.026 0.179 0.001 -0.025 -0.085 0.717 -0.005 0.008 0.187
P AlAs 0.034 0.025 0.185 -0.001 0.025 0.085 0.717 -0.005 0.008 0.194As GaP -0.037 -0.025 0.226 0.002 -0.024 -0.181 1.078 -0.011 0.012 0.240P GaAs 0.036 0.027 0.211 -0.001 0.025 0.181 1.078 -0.011 0.014 0.228As lnP -0032 -0.023 0.136 0.001 -0022 -0.057 0.919 -0.003 0.008 0.144P InAs 0.031 0.024 0 128 -. 0.001 0.024 0.057 0.919 -0.003 0.009 0.138
* Sb AlAs -0.084 - 0.058 1.024 0.008 -0.051 -0,815 0.644 -0.180 0.002 1.0-,As AISb 0.077 0.059 O.Ql -0.007 0.053 0.815 0.644 -0.180 0027 0.984Sb GaAs -0,078 -0.052 0.908 0.018 --0.040 - 1.599 0.927 -0.361 0.1 ( 0929As GaSb 0,073 0.055 0.823 -0,014 0.044 1.59) 0.927 - 0.3 b 0Ot) 0.,4Sb InAs -0.070 -0.051 0.603 0.010 -0.042 -0,824 0.855 0.171 0.009 0.645As ISs 0.065 0.051 0,551 -0.009 0.044 0.824 0 855 -0 171 0(X)S 0.613
Sh AlP - 0.122 -0,085 2.007 0.010 -0,077 -- 0.944 0.645 0.241 0.074 212",P AISb 0.109 0.085 1.855 --0.008 0,078 0944 0645 -- 0.241 0.123 2030Sb GaP --0119 -0.075 2.132 0.021 -0.061 - 1.868 0030 -0.50 0046 2.244P iaSh 0.106( 0.083 1.806 -0.015 0.070 1.868 01 30 0505 0(.03 2.084Sb InP (.104 (,072 1 383 0011 0063 922 0 A54 (0.2-14 (05 1 "MP inSb 0.094 ((077 1.09 0.(X)8 0.069 0 .22 ((854 0.214 (1 123 1 371
Se znS 0.048 -0036 0.231 ().00 ((036 fl0' (1,.5 (0t7- (1 (U) 4)231
S znSe 0 046 0.037 0.221 0001 0037 0.0"7 (.645 0.003 f) 0222T ZoSe -0.075 - 0056 0.550 O.0(-) - 0.056 0 028 0 035 (1 (X) I ((24 0 5.4Sq, ZnT, 0.06 0.054 0532 0.OW0 0.054 - 0.028s .5 0 (WK 0.21 0 557Te ZnS -0,126 -0,092 1.565 -0.001 0,092 0 101 0644 022 )(t I -,.S ZnTe 0 112 0.091 1.446 0.001 0.091 0 It1 (o.44 ((((22 ()(51 1 40b
-7.-
3702 A.-B. CHEN AND A. SHER 32
all six cases involving this pair have nearly equal d, and "'..d , , i.e., the small bond-length differences are made even ,' .smaller in the alloy. The excess energies all become nega- 0
live, mainly because AE, is negative. For the systems in-9volving the (Gain) and (ln,Al) pairs, Fch has the opposite ,sign from 80, so 6 and 60 have the same sign. The chemi- '
cal force favors bond distortion. However, because H is , "positive and introduces an increase in the denominator ofEq. (18). most of the effect of 8; is cancelled. For cases 2 ,involving (Ga,ln), the polarity contributions AE, are all o
negative. The Fch Ad term is negative, but H(Ad) 2 is pos-
itive, so they cancel to a certain degree and leave AE 2- ..lowered primarily because of AE.. While AEp is still neg- J I -ative for the (ln,AI) substitutions, its magnitude is reduced °'considerably. The other chemical energies of . ,
" Fh Ad+H(Ad)2 can be as large as AE., but the overall °"reductions of AE are only a fraction of those for the 0.
" 0
(GaIn) cases. For the several il-VI systems studied, bothF~h and H are small and the net changes in 8 have the 0-
same sign as 80. However, because 60 is small in the3 02 -.
(Cd,Hg) substitutions, FCh actually causes a reversal in ,, -which the short bond length becomes shorter and thelonger one becomes longer. This is the only exceptional 0
case of this type found for all the systems studied. The *' L , , L. a 05 07 10 12
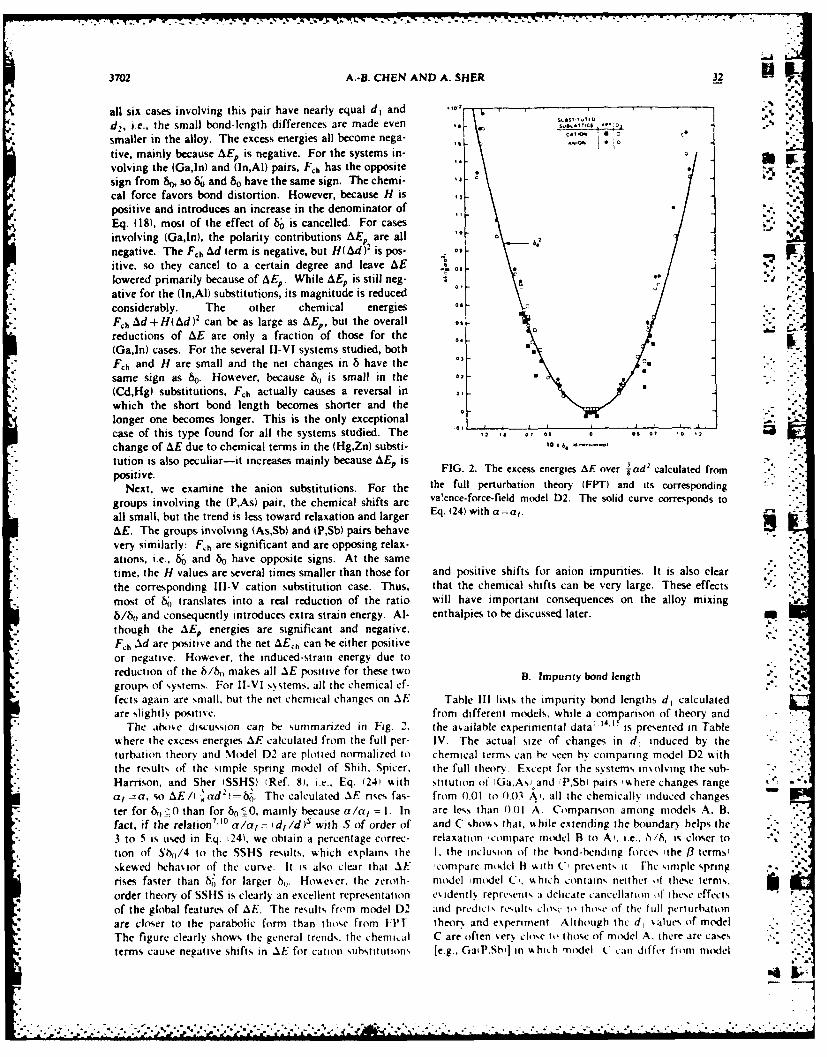
change of AE due to chemical terms in the (Hg,Zn) substi- '*tution is also peculiar-it increases mainly because AE, is-positive, thetheFIG. 2. The excess energies AE over 3 ad2 calculated from
Next, we examine the anion substitutions. For the the full perturbation theory (FPT) and its corresponding
groups involving the (P,As) pair, the chemical shifts are va'ence-force-field model D2. The solid curve corresponds to
all small, but the trend is less toward relaxation and larger Eq. (24) with a=a,.
AE. The groups involving (As,Sb) and (P,Sb) pairs behavevery similarly: F~h are significant and are opposing relax-ations, i.e., 8; and b0 have opposite signs. At the sametime, the H values are several times smaller than those for and positive shifts for anion impurities. It is also clearthe corresponding Ili-V cation substitution case. Thus, that the chemical shifts can be very large. These effects -most of b0 translates into a real reduction of the ratio will have important consequences on the alloy mixingb/bt, and consequently introduces extra strain energy. Al- enthalpies to be discussed later. .
., though the AE, energies are significant and negative,Fh Ad are positive and the net AE h can be either positiveor negative. However, the induced-strain energy due toreduction of the /br makes all AE positive for these two B. Impurty bond length .groups of systems. For I-VI systems, all the chemical ef-fects again are small, but the net chemical changes on AE Table III lists the impurity bond lengths di calculatedare slightly positive, from different models, while a comparison of theory and
The abo.e discussion can he summanzed in Fig. 2, the available experimental data 1.' is presented in Tablewhere the excess energies AE calculated from the full per- IV. The actual size of changes in d, induced by theturbation theory and Model D2 are plotted normalized to chemical terms can be seen by comparing model D2 withthe result% of the simple spring model of Shih. Spicer, the full theor. Except for the systems insolving the sub-
" Harrison, and Sher (SSHS) (Ref. 8). i.e., Eq. (241 with stitution of 'Ga.Asl and 'P.Sbi pairs %%here changes rangea, a, so AE/( -'ad -'. The calculated AE rises fas- from 0.01 to 0.01 A', all the chemically induced changester for b,,0 than for b0 =O, mainly because a/a= I. In are less than 0.01 A Comparison among models A. B.fact, if the relation7'' ° a/a = id, /d)s with S of order of and C showas that, while extending the boundary helps the3 to 5 is used in Eq. t24), we obtain a percentage correc- relaxation 'compare model B to A), i.e., 6/h, is cloer totion of Sh,/4 to the SSHS results. which explains the I. the inclusion of the bond-bending forces 'the /3 terms,skewed behavior of the curve. It is also clear that AE 'compare mtdel B vith C, present, it Fhc siniple springrises faster than 82 for larger h,,. However. the zeroth- model 'model C'. which contains neither of these terms.order theory of SSHS is clearly an excellent representation esdentl. represents a delicate cancellation of" ihee effects
" of the global features of AE. The results from model D2 and predicts results los to those of the lull perturhationare closer to the parabolic form than those from [PT theor% and experiment Although the d, values of model
* The figure clearly shows the general trends the chemial C are often .er% close to those of model A. there are casesterms cause negative shifts in AE for cation %ubstitutlo s [e.g., GaiP.Sb'] in whit h model C can differ from model
,.- -~. . . . . . . . . . -. ... . . . . . . ...' . . ", ' ".." ''". "" "d ' 'i ' ' 'd''A -"* . l f t . *. . - - . - - - - .
-.- W- - 7 1 - , - ' r -i,
32 SEMICONDUCTOR PSEUDOBINARY ALLOYS: BOND-LENGTH ... 3703 %
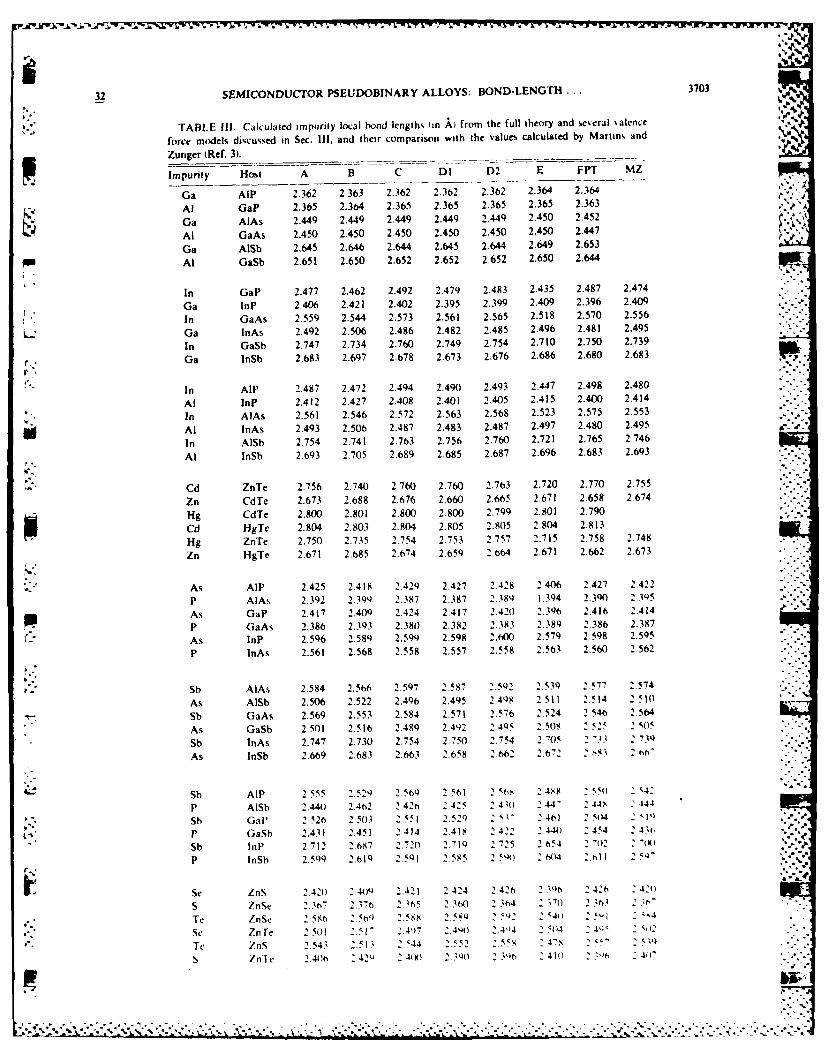
TABLE Il1. Calculated impurity local bond lengths in k) from the full theory and several salhnce
force models discussed in Sec. Ill, and their comparison with the values calculated by Martin% and
Zunger (Ref. 3).
Impurity Host A B C Dl D2 E FPT MZ
Ga AlP 2.362 2.363 2.362 2.362 2.362 2.364 2.364
Al GaP 2.365 2.364 2.365 2.365 2.365 2.365 2.363 ,Ga AlAs 2.449 2.449 2.449 2.449 2.44) 2.450 2.452
Al GaAs 2.450 2.450 2.450 2.450 2.450 2.450 2.447
Ga AlSb 2.645 2.646 2.644 2.645 2.644 2.649 2.653
Al GaSb 2.651 2.650 2.652 2.652 2.652 2.650 2.644
In GaP 2.477 2.462 2.492 2.479 2.483 2.435 2.487 2.474
Ga lnP 2.406 2.421 2.402 2.395 2.399 2.409 2.396 2.409
In GaAs 2.559 2.544 2.573 2.561 2.565 2.518 2.570 2.556
L. Ga InAs 2.492 2.506 2.486 2.482 2.485 2.496 2.481 2.495
In GaSb 2.747 2.734 2.760 2.749 2.754 2.710 2.750 2.739
Ga InSb 2.683 2.697 2.678 2.673 2.676 2.686 2.680 2.683
In AlP 2.487 2.472 2.494 2.490 2.493 2.447 2.498 2.480
Al lnP 2.412 2.427 2.408 2.401 2.405 2.415 2.400 2.414
In AlAs 2.561 2.546 2.572 2.563 2.568 2.523 2.575 2.553
Al InAs 2.493 2.506 2.487 2.483 2.487 2.497 2.480 2.495
In AlSb 2.754 2.741 2.763 2.756 2.760 2.721 2.765 2.746
Al InSb 2.693 2.705 2.689 2.685 2.687 2.696 2.683 2.693
Cd ZnTe 2.756 2.740 2760 2.760 2.763 2.720 2.770 2.755
Zn CdTe 2.673 2.688 2.676 2,660 2.665 2.671 2.658 2.674
Hg CdTe 2.800 2.801 2.800 2,800 2.799 2.801 2.790
Cd HgTe 2.804 2.803 2.804 2.805 2.805 2.804 2.813
Hg ZnTe 2.750 2.735 2.754 2.753 2.757 2.715 2.758 2.748
Zn HgTe 2.671 2.685 2.674 2.659 2.664 2.671 2.662 2.673
As AlP 2.425 2.418 2.429 2.427 2.428 2 406 2.427 .. 422
P AlAs 2.392 2.399 2.387 2.387 2.389 1.394 2.390 2 395
As GaP 2.417 2.409 2.424 2.417 2.420 2.346 2,416 2.414
P GaAs 2.386 2.393 2.380 2.382 2.383 2.389 2.386 2.387
As InP 2.596 2.589 2.599 2.598 2.600 2.579 2.598 2.595
P InAs 2.561 2.568 2.558 2.557 2.558 2.563 2.560 2,562
Sb AlAs 2.584 2.566 2.597 2.587 2.592 2.539 2.577 2.574
As AISb 2.506 2.522 2.496 2.495 2.498 2.511 2.514 2 510
Sb GaAs 2.569 2.553 2.584 2.571 2.576 2.524 2 546 2.564
As GaSh 2.501 2.516 2.489 2.4142 2.495 2 508 2 525 2 505
Sb InAs 2.747 2.730 2.754 2.750 2.754 2.705 3 2 730
As inSb 2.669 2.683 2.663 2.658 Z.662 2.672 S, 3 2 n6
L.. Sb AlP 2.555 2.52) 2.569 2.561 2 5n , 2 8 2 554 2 42
P AISh 2.440 2.42 2.4 2 ) 2.425 2 41o 2 44" 2 44)5 444
p. Sh GaP 2.526 2.503 2 551 2.520 2 537 2 46b) 2 214 ).
P GaSh 2.4.11 2.451 2.414 2.41S 2 422 2 44.) 2 454 243t2.1 2 .0 4 : (02 (W)
Sb InP 2.712 2.687 2.20 .,71 2 .725 25
P InSb 2.599 2.619 2.5Ql 2.585 2.5")o 2 64 2.l 1 2 5,. .
Se ZnS 2 42) 2.40Q 2.421 2.424 2.42, 2 .Q0 2 42k 2 420
S 7nSe 2.3,7 237o .6 3 360 2 _" 1() 2 .h3 2 .
Te tnSc 2,586 25') 2.588 2.58Q 2 42 4 .rS ZnTe 2.501 2. 492.4) 7 -2.44o 144 2 504 Q 52
Te ZnS 2.543 2.513 2.544 2.552 - .5r"( I 47 I "I 2 c,
S Znfe 2.40) 2 42', 2.4(X) 2314) 2 3410 , 4, .1
% %;

3704 A.-B. CHEN AND A. SHER 32 '
A by 0.025 A. Model A produces about the same d-Ai -J o values as model Dl, where the maximum difference in d,
U - , is only 0.015 A. Martins and Zunger' used the samemodel as model A; however, their analytic expression for ,
6 is different from that given by Eq. (21). Nevertheless, r.numerical results indicate that these two calculations :,, ,
agree to 0.01 A. The slightly different forms of strain en- 5V P0 ergies used in models D2 and DI only introduce a small
change in di, with the largest difference being less thanoo 00000 0.01 A. The first-shell continuum model (model E) allows ,
0 too little relaxation, wo while the other models produce a<
X ratio 6/6o ranging from 0.6 to 0.8, model E only ranges6 from 0.4 to 0.6. The reason that the fixed boundary in
model A works is that the effective shear coefficient Cc (see Table 1) characterizing the strain energy in the elastic ... -
N2 - continuum is large. However, model B is too rigid andN odoes not provide enough buffer between the impurityI bond and the fixed boundary.
I The comparison of the theoretical results with theavailable experimental data in Table IV indicates thatmodels B and E are the least accurate. Models A, DI, .
that of Martins and Zunger (MZ), and the full theory arecomparable in that all have an average absolute deviation
0
" I 0 of 0.012 A, which is about the experimental uncertainty in ,.
4 0 0 0 extended x-ray-absorption fine structure (EXAFS). The ,,
I I Iagreement between theory and experiment, however, is notuniform. The most surprising result in Table IV is thatthe simple spring model (model C) and its cruder version ,. . -"
used by Shih et al.8 (a=a so 6/8,=0.75, labeled asSSHS) have the smallest variance in d,, about 0.006 A.We know this does not imply that the simple springmodel represents the real picture of bond-length relaxa-
.€. 0 c 'tion. For example, if we let all the shear coefficients be 0,I Ii.e., 0==C=0 in our model, then as the range of the boun-
2 0 dary is gradually extended, the local bond length will
eventually relax to the impurity bond length d, =d,, or6= 80. This can be seen in model A from Eq. (21 , where -
6 reduces to 60/( +a/6a,), rather than 8 0/(l +a/3a,)as predicted by model C, and in model D from Eqs. (27)
7B - oand (30), 8 becomes 8o, if the continuum is taken to be.shearless. Considering that various effects are included
0 that may mask the absolute accuracy of d, predictions
(e.g., while low-temperature bond lengths are used in thecalculation, the room-temperature values of elastic con-
o stants are adopted), the agreement of various models with0 experiments in Taole IV should be regarded as excellent.
0 hih hesipe-prngmoe pedcton ifercosi-There are, however, many other impurity systems in
L - erably from other models, as is shown in Fig. 3, where 8 isplotted against bo for the full theory. Those points thatdeviate significantly from the 0.75-slope line are the sys-tems with (AsSb) or (P,Sb) substitutions. Additional EX- -.
AFS measurements on these systems are needed to testthese predictions.
C. Mixing enthalpies
Table V lists the mixing enthalpy parameters 11 ,in "
or kcal/mole) for a number of alloms estimated from Eq. (4 1'Le 0 N c 2 - for all the models considered, along with other theoreti-
. . . 'i cal ' - and experimental values.'' As already dis- *J j1"
......................................... ........ "....-.-.... - -~ .%'°..-_..-..-..-., ...-.-.- :..." .' .... :'-_.:.', .. .. ".,,.'-...- '-. -" _,"...,.. ...-. .-.. .... . . . . . ...- ,-. ... ,.. . -. . , . . ..-. . . . . . . ... .. .. ..... .... .
r1 . T
32 SEMICONDUCTOR PSEUDOBINARY ALLOYS: BOND-LENGTH... 3705
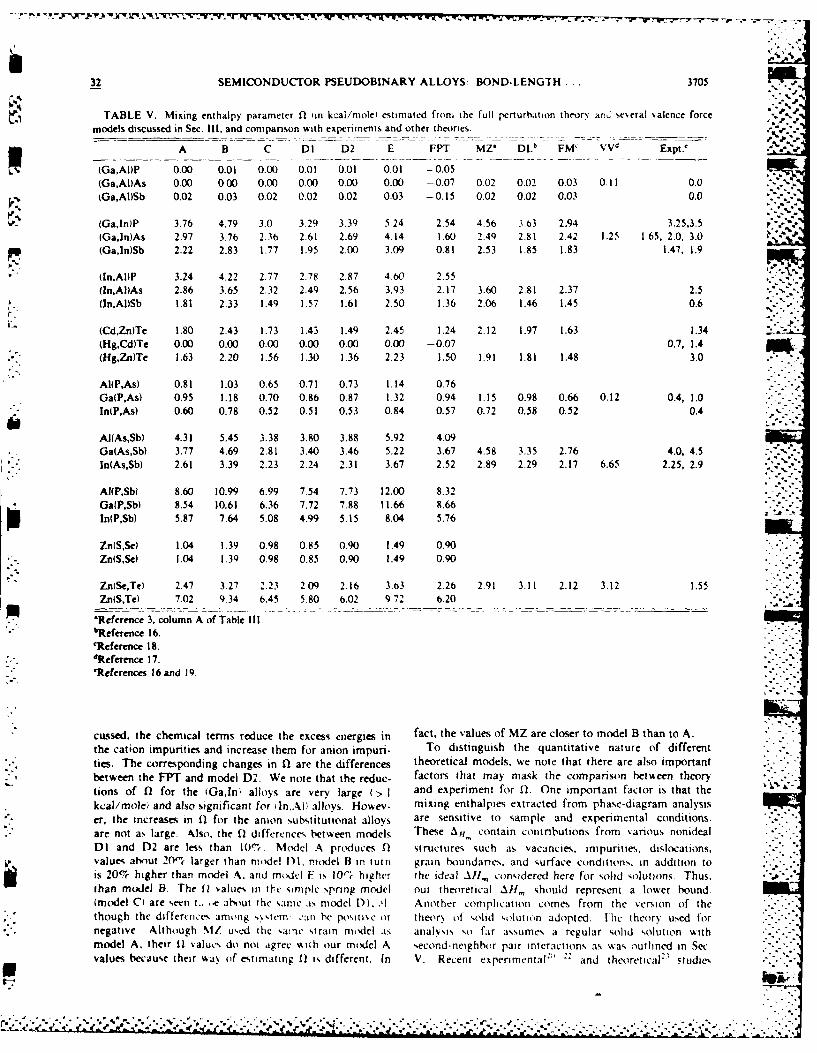
TABLE V. Mixing enthalpy parameter fl in kcal/mole estimated from the full perturbation theory and se,,eral ,alence force
models discussed in Sec. 111, and companson with experiments and other theories.
A B C DI D2 E FPT MZ* DL FM' VVd Expt,
(Ga,AI)P 0.00 0.01 0.00 0.01 0.01 0.01 -0.05(Ga,AI)As 0.00 000 0.00 0.00 0.00 0.00 -- 0.07 002 0.02 0.03 0.11 0.0(Ga,AI)Sb 0.02 0.03 0.02 0.02 0.02 0.03 -0.15 0.02 0.02 0.03 0.0
(Ga,ln)P 3.76 4.79 3.0 3.29 3.39 5.24 2.54 4.56 3.63 2.94 3.25,3.5(Ga,ln)As 2.97 3.76 2.36 2.61 2.69 4.14 1.60 2.4Q 2.81 2.42 1.25 1.65, 2.0, 3.0 - -(Ga,ln)Sb 2.22 2.83 1.77 1.95 2.00 3.09 0.81 2.53 1.85 1.83 1.47, 1.9
(In,Al)P 3.24 4.22 2.77 2.78 2.87 4 60 2.55(ln,A)As 2.86 3.65 2.32 2.49 2.56 3.93 2.17 3.60 2.81 2.37 2.5Iln.AI)Sb 1.81 2.33 1.49 1.57 1.61 2.50 1.36 2.06 1.46 1.45 0.6
(Cd,Zn)Te 1.80 2.43 1.73 1.43 1.49 2.45 1.24 2.12 1.97 1.63 1.34(Hg,Cd)Tc 0.00 0.00 0.00 0.00 0.00 0.00 -0.07 0.7, 1.4(Hg,Zn)Te 1.63 2.20 1.56 1.30 1.36 2.23 1.50 1. 91 1.81 1.48 3.0
AItP,AS) 0.81 1.03 0.65 0.71 0.73 1.14 0.76
Ga(PAs) 0.95 1.18 0.70 0.86 0.87 1.32 0.94 1.15 0.98 0.66 0.12 0.4, 1.0lnP,As) 0.60 0.78 0.52 0.51 0.53 0.84 0.57 0.72 0.58 0.52 0.4
AI(As,Sb) 4.31 5.45 3.38 3.80 3.88 5.92 4.09Ga(As,Sb) 3.77 4.69 2.81 3.40 3.46 5.22 3.67 4.58 3.35 2.76 4.0, 4.5'.In(As,Sb) 2.61 3.39 2.23 2.24 2.31 3.67 2.52 2.89 2.29 2.17 6.65 2.25, 2.9
AI(P,Sbl 8.60 10.99 6.99 7.54 7.73 12.00 8.32Ga(P,Sb) 8.54 10.61 6.36 7.72 7.88 11.66 8.66In(P,Sb) 5.87 7.64 5.08 4.99 5.15 8.04 5.76
ZnlSSe 1.04 1.39 0.98 0.85 0.90 1.49 0.90Zn(S,.Se 1.04 1.34 0.98 0.85 0.90 1.49 0.90
ZntSe,Te) 2.47 3.27 2.23 209 2.16 3.63 2.26 2.91 3.11 2.12 3.12 1.55Zn(S,Te) 7.02 9.34 6.45 5.80 6.02 9.72 6.20
'Reference 3, column A of Table Ill.bReference 16.
'Reference 18.dReference 17.IReferences 16 and 19.
cussed, the chemical terms reduce the excess energies in fact, the values of MZ are closer to model B than to A.
the cation impurities and increase them for anion impuri- To distinguish the quantitative nature of differentties. The corresponding changes in ,1 are the differences theoretical models, we note that there are also importantbetween the FPT and model D2. We note that the reduc- factors that may mask the comparison between theorytions of 02 for the (GaIn' alloys are very large (> 1 and experiment for 11. One important factor is that the
kcal/mole and also significant for iln.AI alloys. Howev- mixing enthalpies extracted from phase-diagram analysis
er, the increases in Q2 for the anion substitutional alloys are sensitive to sample and experimental conditions.are not as large. Also, the Q2 difference,, between models These Al, contain contributions from %anous nonideal
DI and D2 are less than l01 Model A prxluces fl structures such as vacancies, impurities, dislocations,values about 20"',t larger than model D1, model B in tuin grain houndanes, and surface conditions, in addition tois 20% higher than model A, and modl F is 10-t higher the ideal All,,, considered here for solid solutions. Thus,than model B. The 11 values in ?lc simplc spring model our theoretical All,,, should represent a lower bound(model C are seent., _.e about the same .iN model D1, ' Another complication comes from the version of thethough the differviices among s,,tem .'an he posit e Or theor% of ,olid solution adopted. Ilhc theory used fornegative Although MZ us d the %ainc strain model aN analvsis so far assumes a regular solid solution withmodel A. their 11 valuc, do not agree %Niih our model A second-neighhor pair interactions as was outlined in Secvalues because their saN of estimating 11 is different. In V. Recent experimental2 and thtoretical" studies ..
U%
3706 A.-B. CHEN AND A. SHER 32
SUSTOTUY DjeJPf
" 6600f ti.00
° 1
006a
,0 .
-010 00, 006 0,0
SI .006
06 5
-006/- 004" '
de 006 006 0.07 60 00
A 641
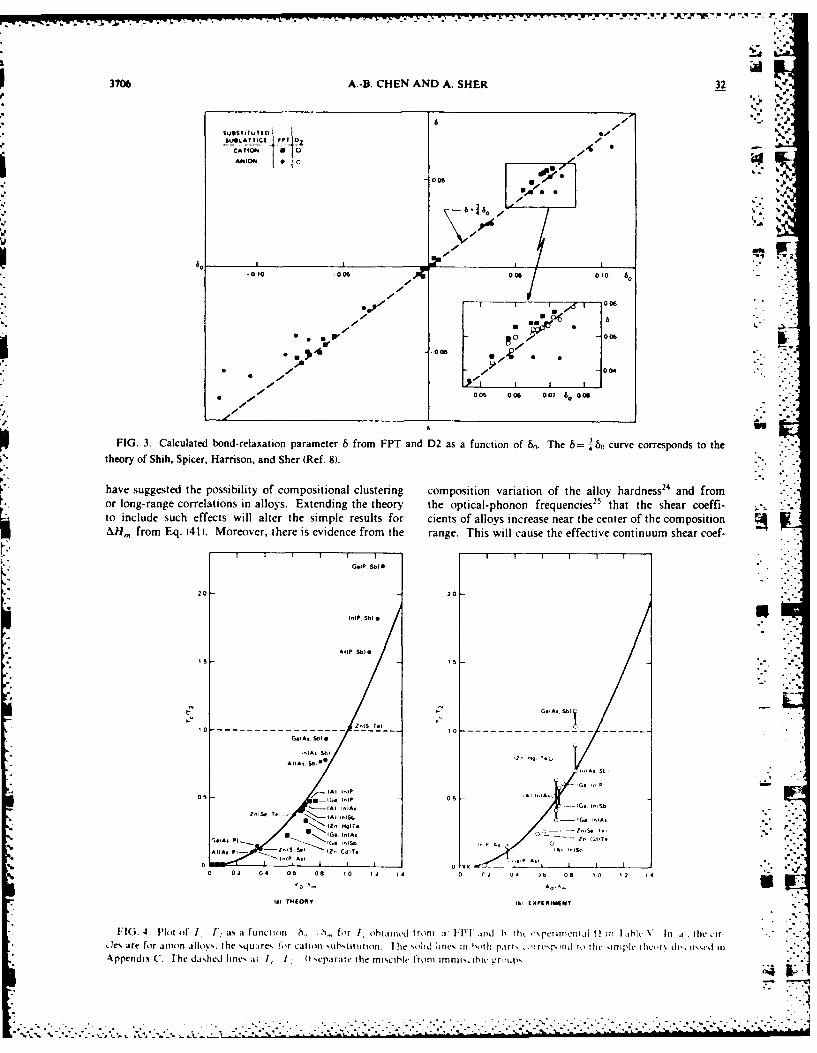
FIG. 3. Calculated bond-relaxation parameter 6 from FPT and D2 as a function of 6.. The 6= '. curve corresponds to thetheory of Shi, Spicer, Harrison, and Sher (Ref. 8)..
have suggested the possibility of compositional clustering composition variation of the alloy hardness 4 and fromor long-range correlations in alloys. Extending the theory the optical-phonon frequencies 25 that the shear coeffi- - .. :to include such effects will alter the simple results for cients of alloys increase near the center of the composition
AH,, from Eq. (41). Moreover, there is evidence from the range. This will cause the effective continuum shear coef-
G.Ip. Sb.
20 20 "
IMP Sbi 9
MIP SbOI
_I_ ISST,._-
ZnIS T. .eAs Sbj
G41A, eI@
-hA, Sb?AlIAs $II,)
o 7'. no. TI. 'O S'
A~0 'nX wonSt.
O1A1G IMlP 0A A .,
/ "- n - 1G. , .
-W AI.- 2S ,~A .,* IGo InAZn TT.
AI, l T.
T111
IAI(AI P)- '~S S.,) (Z CcilTs A. -U
0 '( I , -: A., 1 . .-
0 02 04 06 08 10 1 2 140 . 06 08 '0 2 14 ",
W~~~~~% rM.Yl-EPAMN
FIG. 4 I'lot of 1 1: as a function ,. ,, for I obtaincd from ' 1:111 ard h thr -'\prir)cnt.fl Q. ini lahlk In 'a-. the c'r-,.e are for anin alli%,, the ,qu;JrcN for cation ,uhstm tiiton. lIhe solid line, in hoth part, ',Tr'. 1 piid to thc "inpleic hcr, tfli i',uxe InI
* A ppellliS C. The dished Imes al 1, 1 f separale t he miscihle fronm imnnirsiblevrripx
7~1
... . . . . . . .. .

32 SEMICONDUCTOR PSEUDOBINARY ALLOYS: BOND-LENGTH ... 3707-'
TABLE Vl Comparison of the critical temperature T, of mixing and melting temperatures of the -
constituents T1 and T 2, in the order of their appearance in the parentheses. Also tabulated are the
averaged absolute values of b. and the ratio 6, b.,,.
System (%) (K) TT, /T, /TIT
(AI,Ga)Sb 0.6 0 0 0 0.067
(AI,Ga)As 0.1 0 0 0 0.009
(AIGa)P 0.3 0 0 0 0.029
(AIln)Sb 5.5 342 0.25 0.42 0.679
(Ga,ln)Sb 5.8 204 0.21 0.25 0.7 16
IAIln)As 6.8 547 0.29 0.45 0.687
(Ga,ln)As 6.9 403 0.23 0.34 0.697
(AIJn)P 7.1 642 0.36 0.48 0.732
(Gain)P 7.4 639 0.43 0.48 0.763
ln(P,Asi 3.2 144 0.11 0.12 0.330
Ga(PAs) 3.7 236 0.14 0.15 0.352GaPAs) 3.5 191 0.10 0.11 0.307
In(As,SbJ 6.8 635 0.52 0.79 0.840Ga(As,Sb) 7.6 924 0.53 0.94 0.844
AI(As,Sb) 8.1 1030 0.56 0.78 0.810 -
ln(PSb) 9.9 1450 1.08 1.82 1.222
Ga(P,Sb) 11.3 2180 1.25 2.21 1.256
AI(P,Sb) 11.6 2095 1.19 1.58 1.116 ,
(CdHg)Te 0.3 0 0 0 0.033 . -"
(Zn,Hg)Te 6.0 377 0.25 0.40 0.659lZn.Cd)Te 6.2 312 0.21 0.23 0.564
Zn)S,Se) 4.7 226 0.11 0.13 0.362
Zn(SeTe) 7.2 569 0.32 0.38 0.615
ZniS,Te) 11.9 1560 0.74 1.03 1.017
-..-
ficient C in Eq. 14) to be composition dependent. which tendency toward compound formation. Secondly. the
will cause fQ to increase. Despite these uncertainties, use- FPT tends to predict smaller fl values than observed ex-
ful comparisons across the board in Table V can still be perimentally, which should be expected according to our
made. discussion. To the extent that the FPT predicts the
Based on the above considerations, we can conclude correct AH,, values for an ideal solution, the difference
that models B, E, and MZ predict 1 values that are too AH.,,'-AH. may be attributed to imperfect conditions
high. We should emphasize that all the fl numbers for and deviations from the ideal solution theory.
models from A through MZ are directly calculated Finally, the calculated il values in Table V provide
without any adjustable parameters. The fact that models some guidance in separating the completely misctble al-
A, C, and DI,D2, and the FPT agree with the experiment loys from immiscible ones.2"2 In a true random alloy,
as well as or even slightly better than the one-parameter the criteria" for alloy mixing at a temperature T is that
theories, the delta-lattice (DL) model" and the model of T ' 1, where the critical temperature T,. is gisen by
% Fedder and Muller' tFM), is already quite an accomplish- nl/(2R 1, with R9 being the universal gas constant.29 For
ment. The few numbers taken from Van Vechten's calcu- an AB l C alloy to be miscible throughout the whole
lations"' (VV) indicate that the dielectric model predicts concentration range, the requirement is that both the
results at larger variance with experiments. There are two melting temperatures F, and F of the pure AC and BC
important implications about the FPT that can be drawn compounds he greater than T,. Table VI list, the salues
from Table 11. First, the theory predicts a small but neg- of T, associated with the 11 values in the FPT, the ratios
ative 11 value for several alloys. This not only means that TC /1' and T /1',. and the average absolute values of ,,
there is no miscibility gap in these alloys but also implies for the alloys considered in Table V. In Table VI. Tc is
a tendency toward ordering, in which the substitutional set equal to 7ero if il is negative and I, is chosen to be
atoms tend to be surrounded by different second-neighbor the lower ,alue of the two melting temnperaturts,. so the
species. For stoichiometnc compositions, this implies a criterion for not having a miscibility cap is F, F, I
%- j. -

a3708 A.-B. CHEN AND A. SHER 32
There is an empirical rule.@ stating that this will be satis- are derived and their results are compared with the fullfied if the lattice mismatch j 01between the two alloy perturbation theory and available experimental data. Wecomponents is less than 7.5%. However, we ind that (see found at least five models, including the FPT, that pro-Appendix C) a more precise rule is 1(!> 8.,, where duce the correct impurity bond lengths with variances for6,b = 1.6 3 Y. and V. is the ratio of the rms bond-length the compounds studied about equal to the experimentalamplitude fluctuation to the bond length at the melting uncertainties in EXAFS 1."
t 4 (_.0.01A.Hoersm
*temperature T2 . The values of T,, for the compounds in- models are oversimplified and will certainly not predictvolved-1 and the associate V, values estimated from Eqs. other proper-ties equally well. However, more expefnmen-
* 1C2 and (03) are tabulated in Table 1. The model used in tal lattice constant measurements to further test theAppendix C yields T, /T 2= 0 /mi This suggests that theory, particularly on (AsSbl and (P.Sb) substitution Sys-it is instructive to plot T, / T, as a function of :60 6 tems for which there are larger differences between dif-as is shown in Fig. 4 for the T, calculated from FPT. ferent models. are needed. It would also be instructive toThis plot is similar to the AE versus 60curve in Fig. 2 he- see if the predicted reversal for lHgCdiTc is found.cause, in fact. 11 is proportional to the sum of the AE The excess energies, of impurit> substitution are also
*values of the two constituents [see Eq. (4b)J. However, if shown to prov ide good estimiates, of the mixing enthalpies*T, /T 2 is plotted against bi8) alone, the FPT points are fl of pseudobinaryN alloys. The chemical shifts, are found
much more scattered, and those of SSHS would riot even to have a negative net continbution to 0~ for most cationexhibit a smooth simple quadratic form because the lower substitutions. but posiiie contnbutions for anion substi-melting temperature T, is not a smooth function of ., tutions. The chernical redIuction o(f Ql in Gal1ni alloys IsThis result suggests that b 8 /8 < I is a better criterion larger than I kcal. mole .30 100( ' Set eral VFFthan 180 <0.075. Figure 3 also clearly shows the chem- models and the full perturbation thetirs produce resultsical effects: all the cation-substitution alloN points lie for fl that arc as gotd as the best theories w ith one adjust- -
* below the solid curve and all the anion-substitution allovs able paraineter li stt-s . thie fullicr t0f ends to yieldhave (T, /T 2 ) values on or abovec the curse, corresponding answer', ott the low sid.e of the espt-rimertial Naluc-., which
*to negative and positive shifts in AE due to the chemical we arguc s ait sh~idlxl hL x-,ausc there are nonidealterms. Again, the curve based on the SSHS model is ant iructurvs rt:.mrit' alo irb to !I. I lie cAculated il
* excellent universal representation. From the figure. we %alues Indtu Oic rin ii purat!W LI's:tic Used to predict*see that all iP,Sb) alloys should hase miscibiliy gaps and the esisterIe I -ll J111 Mis,!hilitl> eaps. and the results*all (As.Sb) alloys are predicted to be ntiscible, although otn crlatc %t6. %ih -spe-rinents
the borderline, because the actual mixing crnthalpies aru t-ii>s. I ~ , nlmv n n Ow~ ,,o~ of the-larger than these ideal calculated s alues The figure also te tic u't. t,,i to.,i red i piese:!t ii: -el ] he per.
shows that ZnISTel has a iniscibi lit gap hilt a smal Icr I urhatri ri llut ' , -evi, s:rvt,hLed he~ 'id Its ex- -
value of TI T, than the iP.Sb alloss. de~piie the fact Tro *w r a t*.~. nd PTedl.., Is to %kt thin experi-that its 6r) value is larger. All these prediction% arte 4re.), iii. ' A ec n I. r _tss t ih largeconsistent %, ith the available experimental ex. idence ir. -ii.t I:u - . h, m. ra, s can ol>
N,~ fir-i 'r : li i :erbm i~rher> outlined in
VII. SUMMARY AND CONCLUSION Sc.II.''c , Y !, ui? L.-; i, ?If.o~? r the strongtil.ii .I~ i ! A ftr t 'i irtt in this paper
In this paper a simple theorN of defect substitution (-i t.xaiie 4l Ii~y H Iti NP -N. VN.S , O.S.ergies is formulated. The substit utioni encrg\ is corn pact. ( ).Se ..iand I I I r'i;,11 lottl, Lu ci slt l %% reii that
* separated into a replacement cnierpi A,, and a distorit) tor ifi prol,,rrt- :el.neci.t Ait IL a itinuur at-energi of the pure host crystal [see Eq. .2] Iowes cr .i aIc ite iihe se ; 'cII s a, -iratt a ifhe perturba-ngorous application of this theors requires in inpros e- tion !heir', ued, it remlains ii -x- seen it this is true forment in certain quantitatis e aspects of liarrisons boinding oilier properties. s-spe.P, i srim n 10IfiLIlls 1-irtalk. thetheor\.- particularly the elastic constants.' The most in- presenrt thcour\ has tXei CXtetided 10' stud\ allo\S' bs'
*terest ing application of this thteory presented Int this paper embe-Ldink clusters ini an cfteciiSc medi am This enablesis its perturbation form which enables us to absorb the us ito stud>% the Nind length atid cncrg\ sariationsmeasured elastic cefficienits itito the calculation anid. throughout the st hole coticentrajtioti rowne lfoweser. amore intportantly. to study the chemical effects. -The on- quant iat isc calc u atl iii tll ass .it an ii, pros entent of the
* ~~~gin o~f chemical influences, on impuritN bond relaxation acrc fharsn ttlrpoeuei*can he attributed to three mechanisms [see Eq. 171. a also -elity eXtetidcd 1t aStud\ of' the alloy electronic-chemnical force F0h that either helps or hinders lattice re- structure for Athtch a luLster CPA coberetit-potential ap-* ~~~lasartion. depending on whether it has the same or oppo- poimto in xngbhpttttliilsruualdo-
site sign front the boitd-length difference ui-d1 between dher, " IlI lhe used,the host and impturity. a chemical energN that depends onthe differenice of the polarities between the impunto arid CNWI:DMl Shost bonds. A I, and ar effectiN e elastic force constant Hithtat, whent positive, also tends to) restrain the laittice from this work heitefitted froml usefful Aictsrswili Pro-distortion. To studN the effect ot biontiaries hetwet the lessor W A H arrison mtid Piotcssr Ai /ijier ( )ttc ofcore atoms around an iin purity and thle rest of the u last ic us (A -13. C. ould like to tank I rotessor W\V Spicermedium. %artous models based otit thle %aletce force field for fit,, hospiit alit \ I he \tork is, stppi ri d in part h\ U.-S5
* ~* ~ .** * -- .* *-2..* *~*'~' . -...... *- . .- - . . - .. * - - . -
32 SEMICONDUCTOR PSEUDOBINARY ALLOYS: BOND-LENGTH ... 3709
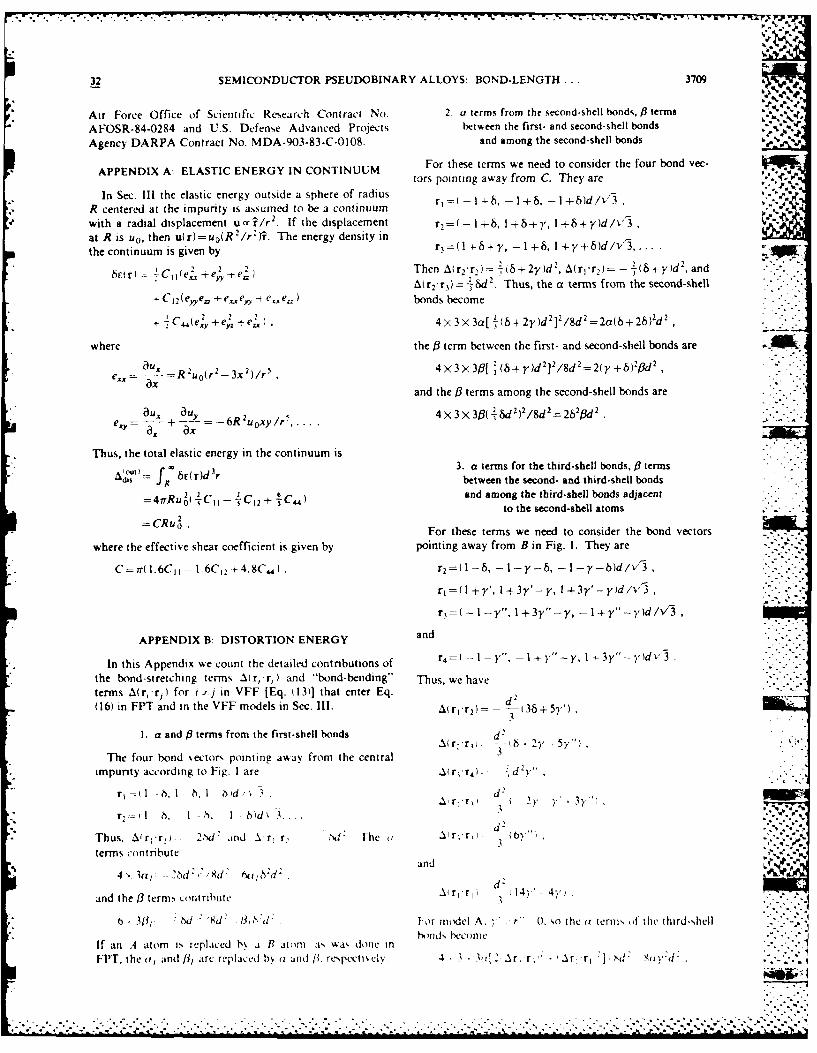
Air Force Office of Scientific Resejrch Contract No. 2. a terms from the second-shell bonds, _ terms
AFOSR-84-0284 and U.S. Defense Advanced Projects between the first- and second-shell bonds -Agency DARPA Contract No. MDA-903-83-C-0108. and among the second-shell bonds b.% \
SAPPENDIX A: ELASTIC ENERGY IN CONTINUUM For these terms we need to consider the four bond vec-tors pointing away from C. They are '%€'#
In Sec. Ill the elastic energy outside a sphere of radius t p n y . eR centered at the impurity is assumed to be a continuum r,=( - 1-6, -1+6, -l1+)d/V',
with a radial displacement uca?/r 2 . If the displacement r, =( 1+ b, I +6+y, 1 +6+y)d/V-3
at R is uo, then u(r)=uo(R /rrr. The energy density intecniumis given by r3=(1 +8+Y, - 1 +6, 1 +y+Sid/v"3 .....the continuumisgvnb
,) =Then A(r 2-r)=2 t8+2y)d2 , A(r'r)= -}(oy)d 2 and_&(0~~ ~~ C e/,+e,--e 2
A(r2'r0)= 8d 2. Thus, the a terms from the second-shellC 2( ee + exae, -i e,e, bonds become
S 2 2Lro z '" ' "
-C44(e.y +4+ +e. 4x3x3a[+(b+2y)d ]'/8d= 2a(b+228)d2
where the (3 term between the first- and second-shell bonds are Aka~u. 4 X 3 )<3fl [ -f6 y )d 212 /8d 2= 2fy ff_)2fid 2 ,.: ..
e. ---- =Ru 0 (r'-3x 2)/r, x3 -+ -/ 2-..ax
and the f3 terms among the second-shell bonds are.' Oux ~ ~~~3 2 4X3X303( d)/8d22[ d
""""'"
e, ,= --- + -- =-- 6R 2uoxy /r', .a, ax
Thus, the total elastic energy in the continuum is3. a terms for the third-shell bonds, 6 terms
fd, 8R(r)dR r between the second- and third-shell bonds
= 4 2rRu4( C - -C 1 2 ± ) and among the third-shell bonds adjacentto the second-shell atoms
=CRu For these terms we need to consider the bond vectors .- "
where the effective shear coefficient is given by pointing away from B in Fig. 1. They are
" C=ir(1.6C1 - 1.6C1 2 + 4.8C4) . r 2 = (l--, -- y-6, -I -y -b)d/v/-
r,=(l-+y', 1+ 3 y'-y, l+3y'-y)d/V"""
r3 - -y", I + 3y"- y, -1 +y"-y)d/V"3 ,'
APPENDIX B: DISTORTION ENERGY and
In this Appendix we count the detailed contributions of r4 = ( -- I - r", -1 + "- y, I -.- 3 r" 'dv3 .
the bond-stretching terms ..' r, r,) and "bond-bending" Thus, we have
terms A(r,'-r) for i 4-j in VFF [Eq. (13)] that enter Eq.
(16) in FPT and in the VFF models in Sec. III. Ar r 2 ) - -- 36+ 5y") ,
I. a and j9 terms from the first-shell bonds d 2
The four bond %ectors pointing away from the central 3
impunty according to Fig. I are A(rjr -, d ' d 2 ,
'. r, (I1 h, I h. I id x d " q
rr I h I - h. I hd, . . -.%r.
Thus. AWr-r - 2,d ,nd 21Mr r. , . The ( I . r~r, b ,
terms contribute ,-,., , ~~~and , ,' -_
4 '- lao l --'- d :;2 , t. ,; 6:d : . d '
and the 13 term, iontrihute At r'rl 14-' - 4y
0 - 3i, d* 13,d : t-or midel A, 'r" 0, so the (z terni of the third-shelli' dsbe '-come J
If an A atom is replaced b\ a B atom. ;vt wa,, done in
FPT. the o, and [31 arc replaced bh (I and [3. rcpectiscly 4 • [ Xr r , r- Sdr My '-d .
.-. ,.
---------------------------------------------------------
".%1
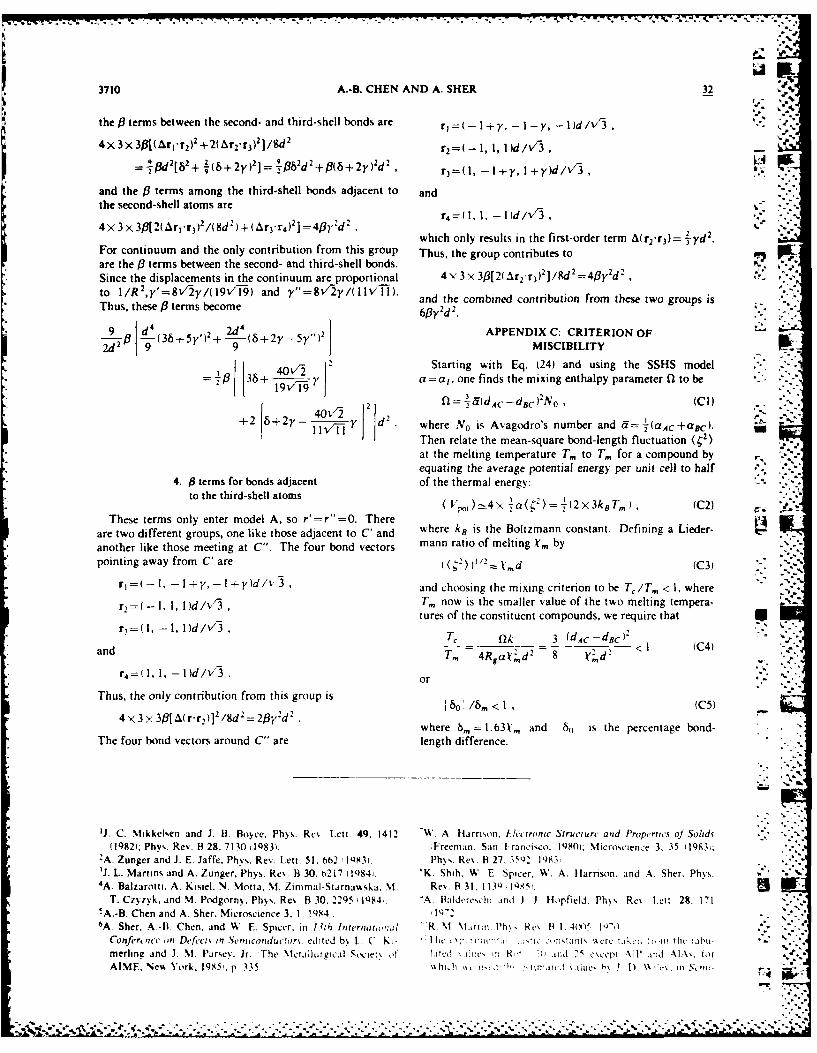
3710 A.-B. CHEN AND A. SHER 32
the/3 terms between the second- and third-shell bonds are l-y, -Iy, -l)d /v- 3" .-4x 3x 31X (Arlr2 )2 + 2( brT 3)21]/Sd2 r, = 1, 1, 1 )d/IV'3 ,
= t[+ +2r 2.68+(+r 2 r3=(I, - I+-r, I +y /¢ .....
and the 3 terms among the third-shell bonds adjacent to andthe second-shell atoms are , • 2 , , ~r4 =(, 1, -lII/' .-4 x3 x36[ 2(A r I-r3) /8d-) + (Ar3.-r4)2 ]= 4/36)d- )2/ 4=" "
which only results in the first-order term A(r 2 r3 )= 3yd2 •
For continuum and the only contribution from this group Thus, the group contributes toare the 13 terms between the second- and third-shell bonds.Since the displacements in the continuum are proportional 4N,3x3,3[2(Ar2-r3)2 ]/8d 2 =43y2 d2 "
to l/R 2 ,y'-8vy/(19"V19) and y"="8V-2y/(l l), and the combined contribution from these two groups isThus, these fl terms become 6fly'd 2.
*9 )2d APPENDIX C: CRITERION OF, 9-3 +5 ')2+-9(6+2y- 5y) 2 MISCIBILITY
S 40v2 I Starting with Eq. (24) and using the SSHS model :-
-F 36+ 1 y a =a,, one finds the mixing enthalpy parameter fl to be
+2~~~~ =&-r -1,Yi/~ -2 fl ~ d icB)2 N0 (Cl1)llVA V d 2 where N o is Avagodro's number and d=+(aAC+ac).
Then relate the mean-square bond-length fluctuation ( 2)at the melting temperature T, to T, for a compound byequating the average potential energy per unit cell to half
4. 18 terms for bonds adjacent of the thermal energy: -- .to the third-shell atoms "a'.k-C):!' ±(2x3kBT,) (C2) ,'
These terms only enter model A, so r'=r"=O. Thereare two different groups, one like those adjacent to C' and where k8 is the Boltzmann constant. Defining a Lieder-
another like those meeting at C". The four bond vectors mann ratio of melting tm by
pointing away from C' are (( 2 ))/ 2 zVd (C3)
r =( -I, - I +y, - I +y)d/v 3 and choosing the mixing criterion to be T,/T, < 1, wherer,=(- 1, 1, 1 )d/v'_3 T, now is the smaller value of the two melting tempera-
tures of the constituent compounds, we require that
r.=(I, -, 1)d/V3 , T flk 3 (d.4C-dc)"
and 2 Id < (C4)adTm 4R aV2 d' 8 S
r,= I(l . -I)d/v'3. or
Thus, the only contribution from this group is 160o'/6, < I (C5)
4 x 3 x 33[ A( r'r,)1 2./8d 2 = 2,6'r d 2.."where bm =l.63 V, and 60 is the percentage bond-
The four bond vectors around C" are length difference.
1J. C. Mfikkelsen and 1. B. Boyce, Phys. Re'% Lett. 49. 1412 W. A. Harrison, Electronc Structur' and Properties of Solids(1982); Phy'. Rev. B 28.7130 1Q83). Freeman, San Francisco, 19801: Microscience 3, 35 119831;
'A. Zunger and J. E. Jaffe, Phys. Re,%. Lett. 51. 62 !1483 . Phs,,. Re%. B 27. ('183 . ..3J. L. Martins and A. Zunger, Phys. Re'. B 30, 217 (1984'. "K. Shih, W. E. Spicer, W, A. ttarnson, and A. Sher. Phys.4A. Balzarotti. A. Kisiel. N. Motta. M. Zimmai-Starnawska. NI. Re,,. B 31. 113Q 10 85'.
T. Czyzyk. and M. Podgorn). Phs. Re% B 30. 22Q5 1984.,, "A. Baldere,chi andi J J Hpfield. Ph.,,. Re. Iett, 28. 1715A.-B. Chen and A. Sher. Microscience 3. 1 1984,. Q'26A. Sher. A-11. Chen. and W. E. Spicer. in ]3th Internat.i,:.l "R N1 Miirtin. Ph' , Rc 11 1. 4(wil _ , '
Conference )n Dcfcct% in Semiconductor . edited b% L. C K i lie ' ,r. 'll , ,t, :''n'.Ir ' 'CC 1L,'K :[,,W htn ' t a "k.
merline and J. NJ. Parsev. Jr. iThe NMeOAlur, cal Socie, Io.tc1 T1:e, 'i R-' . il; t '5 c,: epi \ll' 'Ind -]A,. fol.AIME. Neu York. l19S5. p 335 Inli iiiui- i m \S.,p ., i S,,:-.
. . . . . . . . . . . . . . . . . .-.. . . . . . . . . . -. . - -. -. " . - .... ,-- - - - - - - - - - --
32SEMICONDUCTOR PSEUDOBINARY ALLOYS: BOND-LENGTH .. 3711% conductors and Setitntas, edited by R. K. Willardson and 31, 2 561 (1985 j
A. C. Beer (Acadeici, New York, 1975), Vol. 10, p. 134. 24 N. A. Groyunova, A. S. Barshchvevskii, and D_ N. Fretjakov,12R. Kubuchi, Physica 103B, 41 (1981). in Semiconductors and Semimetals, edited by R. K. Willard-A3A.-S. Chen and A. Sher (unpublished). son and A. C. Beer (Academic, New York, 1968), Vol. 4,
14J. B. Boyce and J. C. Mikkelsen, unpublished data for Chap. 1. .Zn(Se,Te. We thank them for (licir communication prior to 25S. S. Mitra and N. E. Massa, in Handbook on Semiconductors.%publication, edited by W. Paul (North-Holland, Amsterdam, 1982), Vol. 1,
1'7"Extrapolated result-, quoted in Ref. 3. p. 29.
V 6G. B. Stringfellow, J. Cryst. Growth 27, 21 (1974); 58, 194 211L. M. Foster, J. Electrochem. Soc. Solid State Sci. Technol.(1982). 121, 1662 (1974).
171 A. Van Vechten, in Semiconductor Handbook, edited by S. 27L. M. Foster and J. F. Woods, J. Electrochemn. Soc. Solid StateP. Keller (North-Holland, Amsterdam, 1980), Vol. 3, p. 1. Sci. Technol. I118, 1175 (197 1).
18P. A. Fedders and M. W. Muller, J. Phys. Chem. Solids 45, 28R. Kubo, Statistical Mechanics (University of Tokyo Press,68501984). Tokyo, 1971), p. 336.
9M. . Pnis andIleems Pro. SlidStat Chm. 39 21The critical temperature will be reduced by a few percent if
(1472). A. Langier, Rev. Phys. AppI. 8, 2959 (1q73). more elaborate models are used. See W. Christian, in20T. P Pearshall, R. Caries, and J. C. Portal, AppI. Phys. Lett. Transformations in Metals and Alloys, 2nd ed., edited by D.
C_42, 436 (1983). W. Hopkins (Pergamon, New York, 1981), p. 194.-'IK. Kakimoto and T. Katoda. AppI. Phys. Lett. 40, 826 (1982). 30American Institute of Physics Handbook. 3rd ed., edited by D.
-22p. Parayanthal and F. H. Pollak, Phys. Rev. Lett. 52. 1922 E. Gray (McGraw-Hill, New York, 1972), pp. 9-16.
(1984). 31K. C. Hass, R. J1. Lempert, and H. Ehrenreich, Phys. Rev.23 G. P. Srivastova, J. L. Martins, and A. Zunger, Phys. Rev. B Lett. 52, 77 (1984).
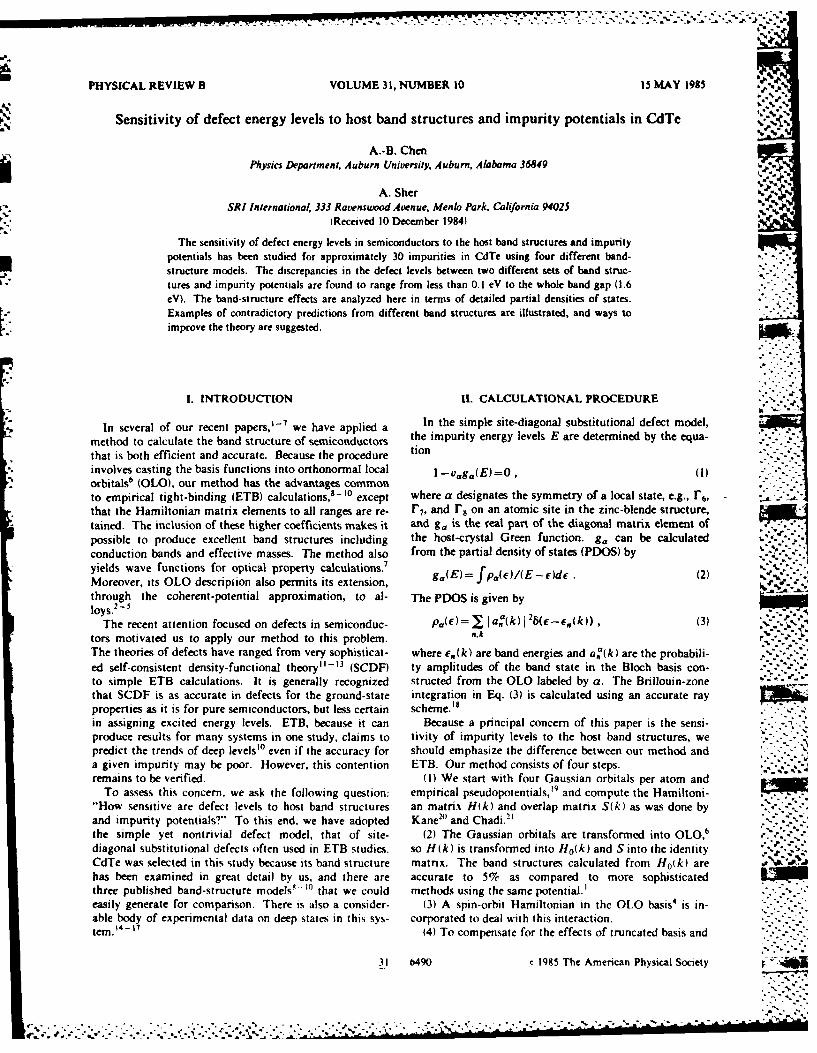
PHYSICAL REVIEW B VOLUME 31, NUMBER 10 15 MAY 1985
Sensitivity of defect energy levels to host band structures and impurity potentials in CdTe
A.-B. ChenPhysics Department, Auburn University, Auburn, Alabama 36849
A. SherSRI International, 333 Ravensuwod Avenue, Menlo Park, California 94025
(Received 10 December 1984)
The sensitivity of defect energy levels in semiconductors to the host band structures and impuritypotentials has been studied for approximately 30 impurities in CdTe using four different band- .. "structure models. The discrepancies in the defect levels between two different sets of band struc-tures and impurity potentials are found to range from less than 0.1 eV to the whole band gap (.6eV). The band-structure effects are analyzed here in terms of detailed partial densities of states.Examples of contradictory predictions from different band structures are illustrated, and ways to ."-
improve the theory are suggested.
I. INTRODUCTION It. CALCULATIONAL PROCEDURE " .
In several of our recent papers," - we have applied a In the simple site-diagonal substitutional defect model,
method to calculate the band structure of semiconductors the impurity energy levels E are determined by the equa-
that is both efficient and accurate. Because the procedure tion
involves casting the basis functions into orthonormal local I - vag a (E) =0, (1)orbitals6 (OLO), our method has the advantages commonto empirical tight-binding (ETB) calculations,8 - o except where a designates the symmetry of a local state, e.g., r 6,that the Hamiltonian matrix elements to all ranges are re- r7, and rF on an atomic site in the zinc-blende structure,tained. The inclusion of these higher coefficients makes it and g. is the real part of the diagonal matrix element ofpossible to produce excellent band structures including the host-crystal Green function. g, can be calculatedconduction bands and effective masses. The method also from the partial density of states (PDOS) byyields wave functions for optical property calculations7Moreover, its OLO description also permits its extension, (2)through the coherent-potential approximation, to a- The PDOS is given by
loys.2-5
The recent attention focused on defects in semiconduc- Pa(E) = Iaa'(k)1 2 (e -e(k)) , (3) ."" i
tors motivated us to apply our method to this problem. n, V.
The theories of defects have ranged from very sophisticat- where e(k) are band energies and a,'(k) are the probabili-ed self-consistent density-functional theory" - 3 (SCDF) ty amplitudes of the band state in the Bloch basis con- -.-.. ,to simple ETB calculations. It is generally recognized structed from the OLO labeled by a. The Brillouin-zonethat SCDF is as accurate in defects for the ground-state integration in Eq. (3) is calculated using an accurate rayproperties as it is for pure semiconductors, but less certain scheme.S-in assigning excited energy levels. ETB, because it can Because a principal concern of this paper is the sensi-produce results for many systems in one study, claims to tivity of impurity levels to the host band structures, wepredict the trends of deep levels' even if the accuracy for should emphasize the difference between our method and .a given impurity may be poor. However, this contention ETB. Our method consists of four steps. -- -. ,
remains to be verified. (I) We start with four Gaussian orbitals per atom andTo assess this concern, we ask the following question: empirical pseudopotentials,' 9 and compute the Hamiltoni-
"How sensitive are defect levels to host band structures an matrix H(k) and overlap matrix S(k) as was done byand impurity potentials?" To this end, we have adopted Kane20 and Chadi.2' "-'the simple yet nontrivial defect model, that of site- (2) The Gaussian orbitals are transformed into OLO.,diagonal substitutional defects often used in ETB studies. so H(k) is transformed into Ho(k) and S into the identityCdTe was selected in this study because its band structure matrix. The band structures calculated from H0(k) arehas been examined in great detail by us, and there are accurate to 5% as compared to more sophisticatedthree published band-structure models8 - )0 that we could methods using the same potential.'easily generate for comparison. There is also a consider- (3) A spin-orbit Hamiltonian in the OLO basis4 is in-able body of experimental data on deep states in this sys- corporated to deal with this interaction.tem.14
- 1 4) To compensate for the effects of truncated basis and .
31 6490 c 1985 The American Physical Society -
€'%-~ ~ ~ ~ ~ ~~~~~~7 .7- .-. .% ,.°•."!# ' -. -, -. '.. . - .. ..- . '. " . ...-. " -, -
€,_' .' .'.. -. ''." .. ' '. .'..°...2 " .. :,:.- -" -

=71=77-.
31 SENSITIVITY OF DEFECT ENERGY LEVELS TO HOST... 6491 MS
nonlocal potentials, a perturbation Hamiltonian H, is-added. H I has the same form as a truncated ETB Hamil- 4tonian. The parameters in H, are adjusted to fine tunethe important band energies and effective masses.' -
Although both ETB and our methods are empirical, 0
there are two major differences.
(1) While most ETB retains the H matrix elements only 5. 7 o4
to the first- or second-neighbor shell, ours extends to a M. Iranges, so that the high Fourier components needed to >produce the sharp band curvatures are properly given.
(2) Our method can directly generate wave functions for cccalculation of other properties. z ,
Thus, while our method yields more accurate band struc- 's;tures, it retains much of the advantage of ETB, namely 0 - -
the computational speed and a simple direct-spacedescription of the Hamiltonian. pal
11. BAND STRUCTURES AND PARTIAL (C ).lDENSITIES OF STATES t
Figure 1 depicts the four band structures to be con- r x w L r K.Uxr x w L r K.U Xsidered for CdTe. Our result is in panel (a); panels (b) k (21da)
(Ref. 8) and (c) (Ref. 9) are two ETB band structures withthe Hamiltonian matrix elements truncated at second FIG. 1. Four band structures of CdTe used for comparative " -neighbors. (Because different parameters were selected, studies: (a) present work, (b) Ref. 8, (c) Ref. 9, and (d) Ref. 10.these two band structures are not identical.) Panel (d)(Ref. 10) results from the use of five basis orbitals peratom; the extra one is an excited s state. All these bandstructures are adjusted to have the proper fundamental 2.0 L
* band gap of 1.6 eV. The principal differences one sees onfirst inspection are in the band curvatures, especially theconduction bands. The effective mass at the bottom of 1.0 .
the conduction band in panel (a) is 0. 1 times the free-electron mass, in agreement with experiment,17 while inother panels it is more than twice as large. 00 .
Figure 2 shows the densities of states (DOS) for each of ~ 20W
the band structures in Fig. 1. While the valence bands at _"least exhibit general common features, the conduction 1 I.0""bands are almost unrecognizable as representing the same i'-
compound. In panels (c) and (d), for example, there is a Dsecond band gap above the fundamental gap. Also note __ __ _ _
that there are two extra narrow peaks associated with the 2.0two extra excited s orbitals (one for Cd and the other forTe) included in the calculation.
To analyze the band effects on defect levels [see Eqs. (I 'o.and (2)], the DOS is further decomposed into partial den- >sities of states for rF(s), r-7(p !/), and Frip l') states on "' -
the Cd and Te sites, as shown in Figs. 3-6. The rF 0o.PDOS are not shown because they are nearly the same as 2.0 1d)r7 with only a slight upward energy shift. These PDOSshow how the "atomic" levels evolve into band states.These curves contain useful information about many 1.0properties, e.g., the relation between the crystal bonding
and atomic energies. and how potential disorder in alloysaffects different parts of the bands, 2 - in addition to de- 00 12 -8 -4 0 4 8 12fect lesels studied here. ENERGY (ev)
The rCd PDOS shown in Fig. 3 split between theconduction and valence hands. It is generally assumed FIG. 2 )ensmities of otates ca)eulated from the four band
that the cation s5tate% in IiI-V and Il-VI compounds structureN in Fig. I
"°if
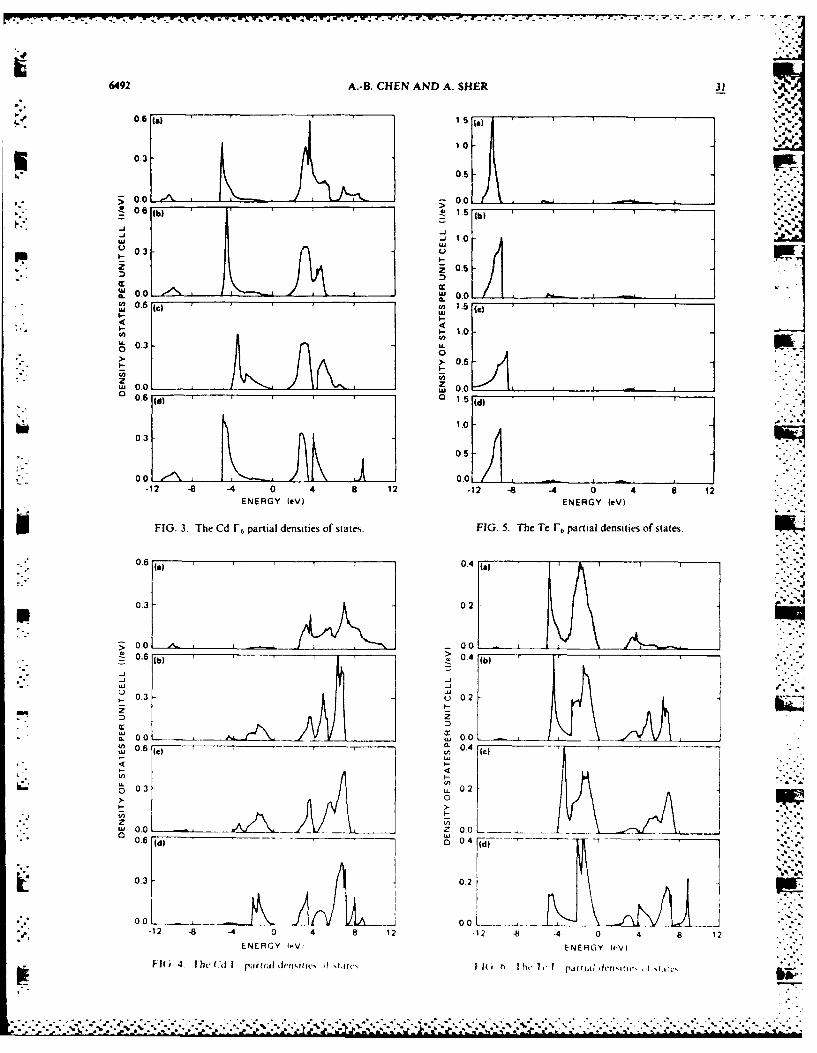
6492 A.-B. CHEN AND A. SHER 31
o0.3u0
'" t n _0o.3 .
'- 0.0 - 0 -
14 0.6 , , , 15"
II 0.3 1.0-. --.
v.~> 0 -.
"'" 00 L -0.0" " " °
L~. --'
-12 "8 -4 0 4 a 12 -12 "8 -4 0 4 6 12 ,...'ENERGY (eV) ENERGY (eV)
FIG. 3. The Cd F, partial densities of states. FIG. 5. The Te 1-, partial densities of states.
,-2 06 ,)0.4 .
" .0 A. 00 A,
__ _ _ __ __j
-- I-- _ __
•wool ... . .__ ___ __ _ o:. _1
2.3 0 52
.60
>0:-. .o. /6a. 0.0 0.0 o "
S06 0 .. 4 Cc
o 0.3 *. ~ 02
0.1 -8 -4 0 4L .8 124 8 --ENERGY (PV) ENERGY (rV)
F-lif. 4 rhc X Cd ~rii Ic~tu ~u~Fl hc Ic I patril 4lriwiv 'r .lrc
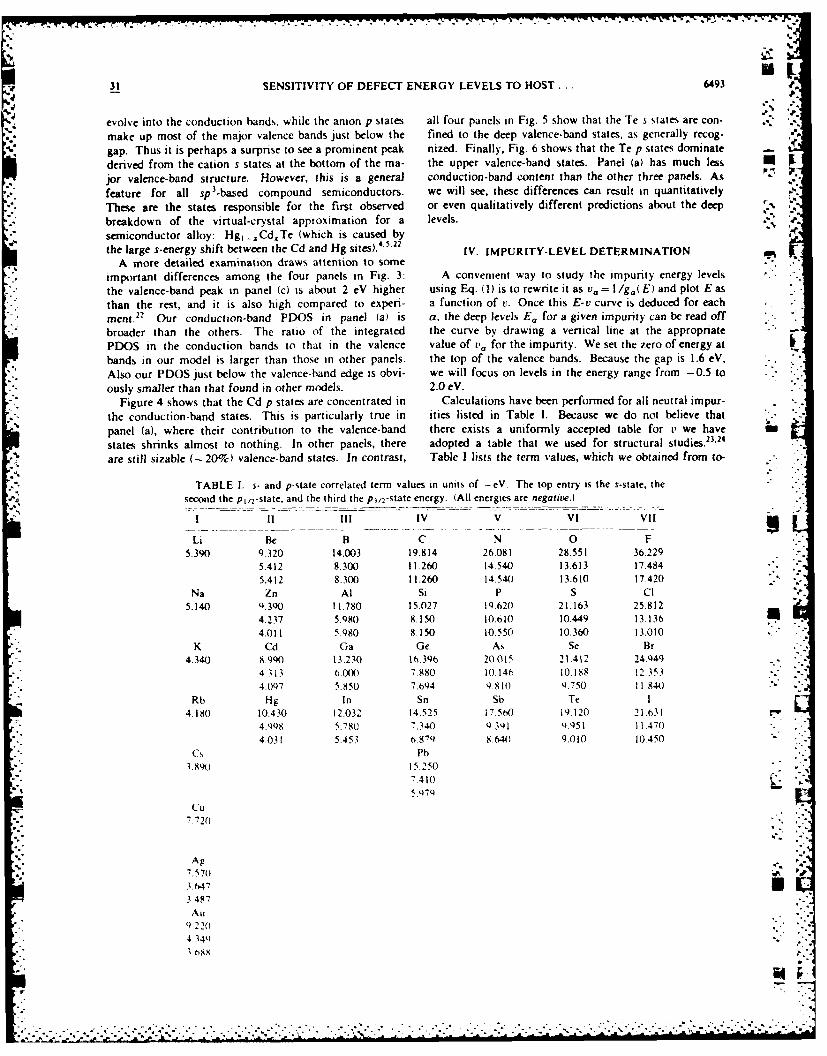
7 31 SENSITIVITY OF DEFECT ENERGY LEVELS TO HOST ... 6493
evolve into the conduction bands, while the anion p states all four panels in Fig. 5 show that the Te s states are con- .
make up most of the major valence bands just below the fined to the deep valence-band states, as generally recog-
gap. Thus it is perhaps a surprise to see a prominent peak nized. Finally, Fig. 6 shows that the Te p states dominate
derived from the cation s states at the bottom of the ma- the upper valence-band states. Panel (a) has much less U
jor valence-band structure. However, this is a general conduction-band content than the other three panels. As "
feature for all sp3 -based compound semiconductors. we will see, these differences can result in quantitatively
These are the states responsible for the first observed or even qualitatively different predictions about the deep
" breakdown of the virtual-crystal approximation for a levels.
semiconductor alloy: Hgn-.,CdTe (which is caused bythe large s-energy shift between the Cd and Hg sites).' 5 22 IV. IMPURITY-LEVEL DETERMINATION
A more detailed examination draws attention to someimportant differences among the four panels in Fig. 3: A convenient way to study the impurity energy levels
the valence-band peak in panel (c) is about 2 eV higher using Eq. (1) is to rewrite it as va = I/ga(E) and plot E as
than the rest, and it is also high compared to experi- a function of v. Once this E-v curve is deduced for each
ment. 22 Our conduction-band PDOS in panel (a is a, the deep levels EG for a given impurity can be read off
broader than the others. The ratio of the integrated the curve by drawing a vertical line at the appropriatePDOS in the conduction bands to that in the valence value of va for the impurity. We set the zero of energy at
bands in our model is larger than those in other panels, the top of the valence bands. Because the gap is 1.6 eV,
Also our PDOS just below the valence-band edge is obvi- we will focus on levels in the energy range from -0.5 to
ously smaller than that found in other models. 2.0 eV.
Figure 4 shows that the Cd p states are concentrated in Calculations have been performed for all neutral impur-
the conduction-band states. This is particularly true in ities listed in Table 1. Because we do not believe that
panel (a), where their contribution to the valence-band there exists a uniformly accepted table for v we have
states shrinks almost to nothing. In other panels, there adopted a table that we used for structural studies.23,
24
are still sizable (_ 20%) valence-band states. In contrast, Table I lists the term values, which we obtained from to-
TABLE I. s- and p-state correlated term values in units of - eV The top entry is the s-state, thesecond the pin-state, and the third the p3/-state energy. (All energies are negative.)
I i Ill IV V VI VII
Li Be B C N 0 F5.390 9.320 14.003 19.814 26.081 28.551 36.229
5.412 8.300 I1 .260 14.540 13.613 17.4845.412 8.300 11.260 14.540 13.610 17.420
Na Zn Al Si P S CI5.140 9.390 11.780 15.027 19.620 21.163 25.812
4.237 5.980 8.150 10.610 10.449 13.1364.011 5.980 8.150 10.550 10.360 13.010
K Cd Ga Ge As Se Br4.340 8.990 13.230 16.396 20.015 21.41., 24.449
4.313 6.( X) 7880 10.14b 10.168 12.3534.(097 5.850 7.694 9. 810 .750 I1 840
Rb Hg In Sn Sb Te 14.180 10.430 12.032 14.525 17.5W 19.120 21.631
4.9Q8 5.780 7.340 9.39l 9.951 11.470
4.031 5.453 6.879 .640 9.010 10.450Cs PB
.. 890 15.250
7.4105.979 L
C U7.720
%-A
7.570
3.6473 487
Au1) 2204.34""lt)8s5
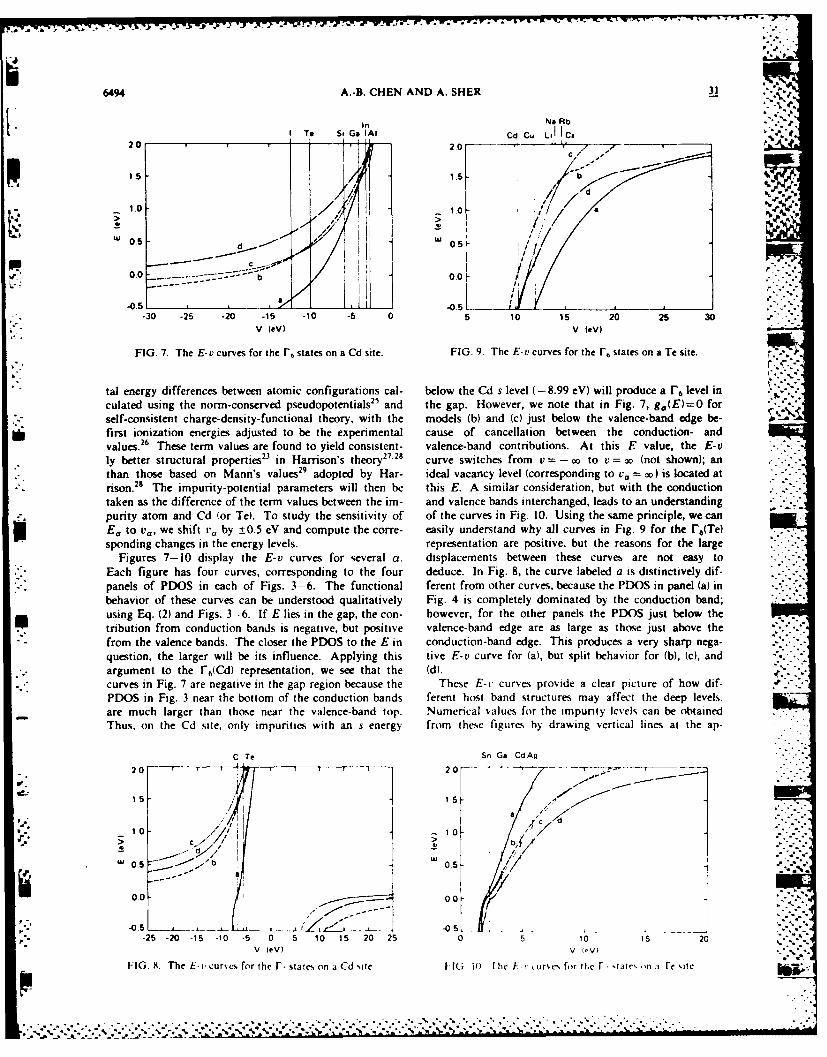
6494 A.-B. CHEN AND A. SHER 31
InG A No Rb SA*
Io To Si Go "1"
20 20ACd C. LI CA2.0 _ ._- , I_
1.5 1.5 "
1.0 oa>a
d 0.5
-0 .5 -0 . _5- - ---30 -25 -20 -15 -10 -5 0 5 10 15 20 25 30
V (eV) V (eV)
FIG. 7. The E-v curves for the r, states on a Cd site. FIG. 9. The E-v curves for the r6 states on a Te site.
tal energy differences between atomic configurations cal- below the Cd s level (- 8.99 eV) will produce a r 6 level inculated using the norm-conserved pseudopotentials2' and the gap. However, we note that in Fig. 7, g.(E)=O forself-consistent charge-density-functional theory, with the models (b) and (c) just below the valence-band edge be-first ionization energies adjusted to be the experimental cause of cancellation between the conduction- andvalues.2 6 These term values are found to yield consistent- valence-band contributions. At this E value, the E-vly better structural properties2 3 in Harrison's theory27 2s curve switches from v =-oo to v = oo (not shown); an
' - than those based on Mann's values29 adopted by Har- ideal vacancy level (corresponding to v. = oo) is located atrison.28 The impurity-potential parameters will then be this E. A similar consideration, but with the conductiontaken as the difference of the term values between the im- and valence bands interchanged, leads to an understandingpurity atom and Cd (or Tel. To study the sensitivity of of the curves in Fig. 10. Using the same principle, we canE , to v, we shift t _+ by ±0.5 eV and compute the corre- easily understand why all curves in Fig. 9 for the r6 (Te)sponding changes in the energy levels, representation are positive, but the reasons for the large
Figures 7-10 display the E-v curves for several a. displacements between these curves are not easy toEach figure has four curves, corresponding to the four deduce. In Fig. 8, the curve labeled a is distinctively dif-
- panels of PDOS in each of Figs. 3-6. The functional ferent from other curves, because the PDOS in panel (a) inbehavior of these curves can be understood qualitatively Fig. 4 is completely dominated by the conduction band;using Eq. (2) and Figs. 3-6. If E lies in the gap, the con- however, for the other panels the PDOS just below thetribution from conduction bands is negative, but positive valence-band edge are as large as those just above thefrom the valence bands. The closer the PDOS to the E in conduction-band edge. This produces a very sharp nega-question, the larger will be its influence. Applying this tive E-v curve for (a), but split behavior for (b), (c), andargument to the r 6 (Cd) representation, we see that the (d.curves in Fig. 7 are negative in the gap region because the These E-r curves provide a clear picture of how dif-PDOS in Fig. 3 near the bottom of the conduction bands ferent host band structures may affect the deep levels.are much larger than those near the valence-band top. Numerical values for the impurity levels can be obtainedThus, on the Cd site, only impurities with an s energy from these figures by drawing vertical lines at the ap-
C Te Sn Ga CdAg
2 0,-,, -, 2 V - "--
V . 5
I Z,
"' " '-"0 5t o - 1 : ; :C 4,
00o-
i, .- 25 -20 .AS -10 -5 0 5 10 Is 20 25 0 5 10 15 20"'V eV) V ( Vt .l2..
FIG. X. The E- 'curves. for he r. state-. on aCd sine tl(i It) The I-- c,,rs'c for l .t atc .l'n re Ste :
-. ..*, -*.°_l. • " "D "" ," "" ',,* - "" " % '"
% S """ "'" "" "" '",'' '.'" '
: ; : : : : : : . . ; .-.' - . ; ' ' ' ' ' ' ' -' .- ' ' ' ' ' ' ' ' '- . . . . . . . .

- ,--- --
31 SENSITIVITY OF DEFECT ENERGY LEVELS TO HOST... 6495
propriate impurity potentials (i.e., differences between the p levels on a Cd site. For example, the filled p level of Cterm values listed in Table I), as has been shown for on a Cd site in model (a) is a resonance state just belowseveral representative impurities. To provide a more the valence-band edge but is a donor state in the otherquantitative comparison, Table II lists some calculated models. Similarly, model (a) puts the neutral Te antisite- and - of the gap [E(F7)=0.48 'impurity levels E. and the corresponding changes AE. defect p levels at about 4 adue to the i-eV change in v.. eV and E(rg)=0.95 eV], while other models assign them
V. RESULTS AND CONCLUSION as resonance states inside the conduction bands. We alsonote that the discrepancies between different models are
To summarize we recall that band models (b) and (c) not uniform, but vary with va. Consider F6(Cd) for ex-are the same second-neighbor ETB with two different sets ample. All four models yield the same ordering and aboutof parameters, and model (d) is a first-neighbor ETB with the same energies for the group-III impurities Al, In, andone extra s orbital per atom. Our model [model (a)] has Ga. However, as v becomes more negative, the splittingthe form of ETB but is derived in a very different manner between the curves increases, so the discrepancies becomeand includes all the long-range interactions. Therefore, larger [- I eV difference between models (a) and (d) for Iwe expect that the results from models (b) and (c) will be impurity]. Similarly, for the r 7 (Te) states, all four modelsclose, model (d) will have larger discrepancies from (b) put the Sn impurity energies close to the valence-bandand (c) than that between (b) and (c), and model (a) will edge, but the agreement deteriorates as v increases.differ even more. This is evident from Figs. 7-10 and Regarding the sensitivity of energy levels to impurityTable I. We found the energies for the Fr(Cd), r 7(Te), potentials, Table II shows that a l-eV shift in va producesand F8(Te) states produced by models (b) and (c) agree a change in Ea ranging from less than 0.1 to 0.65 eV.within 0.1 eV. For the other states, i.e., F 6(Te), r 7 (Cd), Very little is known about the size or trends in errors in-and r 8(Cd), the energies from (b) and (c) are qualitatively troduced in va from the use of atomic term values. How-similar, but the difference can be as large as 0.4 eV. The ever, we know that the discrepancy of va between two dif-largest discrepancy between models (d) and (b) [or (c)] is ferent tables of atomic term values can be larger than 2more than 0.5 eV, and that between (a) and other models eV. This discrepancy translates into an uncertainty of lessis more than I eV. The largest difference comes from the than 0.1 to more than I eV in the impurity energy levels,
TABLE II. Defect energy levels E and changes AE due to a t-eV change in the impurity-potential parameter. All energies are inunits of eV. V0 stands for ideal vacancy.
Model (a) Model Ib) Model (c) Model (d)Defect E AE E AE E AE E %E
F, on Cd site- Ga 1.29 0.39 1.42 0.24 1.33 0.23 1.57 0.18" C -0.21 0.09 0.38 0.09 0.36 0.13 0,74 0.08
Si 0.67 0.30 1.02 0.10 0.93 0.19 1.27 0.15p 0.19 0.11 0.39 0.09 0.38 0.08 0.75 0.08O < -0.5 - 0.02 0.02 0.04 0.01 0.32 0.02Te --0.13 0.13 0.44 0.10 0.42 0.08 0.79 0.09CI < --0.5 006 0.03 0.10 0.02 041 0.04V, - -0.5 --0.5 -0.30 -020
I. on Cd site
C -0.02 0.37 1 32 022 J.'9 0.20 1.39 0.19Si 1.57 0.65 ,2.0 2.0 -2.0p 0.16 0.38 1 4$ 0,26 1.73 02-3 1.52 0.210 0.5 0.8() 0.14 122 u13 I 03 0.12Te 0.48 0.55 1.00 0 29 1X 0.23 1.6t 0.24C . 0.5 o.9t1 (1 29 0 14 1.0Q 0.14vl- 05 ().(X) 21 0.0b
r.. on re se) 0)14 2') 2' 1)22 1.15 0.35 0176 0.25
Cu 0.5 (54 042 0 12 (052 0.03 0.32
1 on It site ___"_
Ag I S11 (0 1,2 6 122 1 21 t) '() 020
Cd I o o W.4 ii (( 21 (5 0.20 ,t 05 0,22Ga (1 48 0.4Q 161 11 0.55 012 04.0 0.30St 00 1)-1 (I 1)1, 0.3 0,01 4 0 1 072
Sn (2. 4 ,1' Ii l( (13 0.24 002 0)29
," ..-... ... ..-.. ....................................................................................................

o -
6496 A.-B. CHEN AND A. SHER 31 . '
which is comparable to that due to different host band latter have been shown to be sensitive to the details of thestructures. partial densities of states.
Putting this large uncertainty in the deep levels against To establish the credibility of ETB in defect studies,a band gap of 1.6 eV, we are left with great doubts about one needs to look at the problem more seriously. Thethe predictability of this oversimplified theory. Unfor. most difficult and yet important task is to develop a bettertunately, the experimental means available for identifying %%ay for determining the Hamiltonian matrix elements.microdefects in semiconductors are still very limited, and Haas et al.5 and Harrison7- 25 have suggested using thethe ab initio band theory is still not capable of accurately atomic term values as the diagonal matnx elements. Our
r. predicting the energy levels. Thus, there is a great temp- work1- 4 has suggested using a universal long-range in-tation to use simple theories like the one earned out here teraction to improve the accuracy of the conductionto help with the identifications. To illustrate this point, bands. Several studies '27 2 S.3 3 have also pointed out seal-consider the following examples: Table 11 shows that Li ing rules of the matrix elements. A combination of theseon a Te site has an s level of 0. 14 eV in model (a), so one ideas may lead to an acceptable model. Secondly, bothmay be tempted to relate it to the acceptor state identified the bonding and deep-level states of impurities should beexperimentally.' However, this is not the hydrogenic ac- studied at the same time in order to provide correlated in-ceptor state on a Cd site, as one might anticipate. One formation for defect identification. Finally, more realisticmight also want to assign the 1, and - gap states for the models should be examined. Besides the substitutionalTe antisite p levels on the Cd site found from model (a) as site-diagonal defects, one should consider the possibilitythose seen in expenments. 5
, " Because of the large uncer- of interstitial, paired, and even more complex defects.tainty in the calculation, these results should be regarded One also needs to deal with long-range impurity poten-as suspicious surprises rather than theoretical confirma- tials, possible charge shifts, and lattice distortions. Pro-tions. gress in all these areas can be expected if the calculation is
The results presented here should not discourage con- constantly correlated with experiments and availabletinued research on the ETB approach, but improvement is ab initio theory.clearly needed. Work ranging from universal2 3' 2 7
.30 to
specificA t '12 structural studies to our band calculations
and alloy studies' - 7 indicates that the ETB type of theory ACKNOWLEDGMENTSis practical for both bonding properties and electronicstructures. The reason that ETB works well for some This %,ork was supported by AFOSR Contract No.properties, e.g., photoemission spectra and bonding prop- F49620-81-KOO12 and Grant No. AFOSR-4-O2g2. A.-erties. but not for impurity levels, is that the former de- B. Chen would like to thank Professor W. E. Spicer ofpend only on the gross total density of states, while the Stanford University for his hospitality.
IA.-B Chen and A. Sher, Phys. Re,.. B 22, 3886 (1980. Vl 13:A.-B. Chen and A. Sher. Phys. Re'. B 23, 5645 (181 '_"C F. Jone,. Ntr. I tundqui,. ano t1) I I,. J , "c
'A.-B .Chen and A. Sher. PhNs. Re'. B 23. 5300 1981, SI lethn,,i 21. .'
'A -1. Chen and A Sher, J Vac Sec Fechnol. 121. 13S,'82) 'R 1 Colrlm , and . MJ ;:I] J \'C , %,,I 1 .,, A1.5W F Spicer, J. A. Silberinan, J Morgan. J. 1 ndau. J A. Wil- ,l983
son. A -B. Chen, and A. Sher. Phy', Re', leit 14Q, 14:" :'K K K.aria.'.. wil] I- ( Br,,krn. In. -R., 5 .'. -(19S 2,. 1064.
'A.-B. Chen and A. Sher. Phv,". Re% B 26. t(03 (10,2 -." -1B (hcn. fh ,' Re% B 16. ")1 !,--A.-B Chen, S. Phokaichaipalana. and A. Sher. Ph5 Rev. 11 ;1) J C(hid. J P 'a~tt. ind i [ tti: (ii, Re \I
23. 53 0,1981), 30',k ,-8K. C. ia's,. H. Ehrenreich. and B Velick',. I'h'.' Rc B 27. -'E 0 Kanc Ph\, R % 1 13. '4 ',
5160 l983, -1) J Chadi. Ph'., Re% h 16, 5
'C. A. Swart.. M. S Da , and r. (i. Mc(ili, J Vac Sci Tech- 3J A Silhbrman. P M tar. I 5,r .m, N '.5,., J
nol. 121. 1t9 1l982,. Vac Sci te'.hnI 21 42 i'J,.''
IOA. Kohavashi, 0. F Sanke,. and J. D Do,. l'h\ R.,e R 25, 'A.- (hen and A ,het'. \I;cr.,r. . . . "'6367 11)82! -4A Sher. ..- B (l. ' i h. co %k
IJ. Bernholc. N. 0 I ipan. and S I Pantehds. Ph\, Re'\. B tunal . ('onJt 'r.-rh ': 0,',,,. m.,n ,', . ' .. . - , r.,
21. 3545 f1Q80W C. Kimerling and J 5. Par. '. Ii hc NI- ., .f 1 \1,12G, A. Baraff. 1:. ) Kane. and M. Schluter, Phv'- Re', B 21. of -IMt-. I q0,. p
5662 1I80 -"G. B Bacheci. D tt,rnrn,,. ,n. . \i. . ,, Re'.
13G. 1; Bachelei. M. Schluler. and G A. l1araff. Phv. Re%. B 26, 41 9Q ( r Q-27. 2545 983,, '6C. Kitel. I, d Cr : , . j . :, t':, J , :, A ,, ,
14K. Zanin, in .Semicondijctomr' and Scmrni,i edied h% R .c Newk York, )t , p '~I .1.1' I
Willardson and A C Beer .- cadeniic V-. ,rk. 07X). 2W A tarri,,nu.,I,,.,, C ,: : , ,.. - N .
•. --------------------------------------

31 SENSITIVITY OF DEFECT ENERGY LEVELS TO HOST... 6497
(Freeman, San Francisco, 1980). 10D. Gi. Pettifor and R. Podloucky, Phys Rev. Lett. 53, 826
2'1 B. Man AtmcSrcue acltos : ate-ok53,826 (1984)17
ingoue orTecnialInoratinSpinfiedVigiia 33. . ndrse, . laeandMAndersen, ev B17
1967). 129(17)

VOLt ME 55, NLN'tr 3 PHYSICAL REVIEW LETTERS 15 JULY 1985
Binding Energy and Spectral Width of Si 2p Core Excitons in SinGer_- Alloys
S. Krishnamurthy and A. SherPhi sial Electronis Laboratry. SRI Internatonal. Menlo Park. California 94025
and
A.-B. Chen"' '!.6 Department of Physics, Auburn University, Auburn. Alabama 36849
A calculation is presented to explain the anomalous experimental behavior of the Si 2p core-exciton binding energy and linewidth in SiGe.-, alloys. The observed minimum in the linewidthnear x =0- 015 can be explained as the result of a competition between intrinsic broadening due toscreening and extrinsic alloy broadening. For pure Si, the binding energy is estimated to be0.15 ± 0.05 eV and the width is shown to be smaller than that observed at x -0.15.
PACS numbers: 71.55.Fr, 71.35.+z, 78.70Dm
Until 1984, the Si 2p core exciton was believed to tonian and X(E) is the self-energy. The site-diagonalhave an anomalously large binding energy. t - O Later, Green's function is denoted asNewman and Dow ni proposed a radically different pic- F (E) = (0. G ( 10.), (2)ture in which the Si 2p core exciton is in fact a reso-nance with a negative binding energy. They further where 0. is a localized orbital of specified symmetry.predicted that the exciton binding energy remains neg- Here we only need to consider a = s for AI symmetry.ative throughout most of the Si1Get-x alloy composi- The corresponding function in pure Si is denoted astion range, except near x ---0.20 where it becomes F°(E). Following the theoretical treatment of deeppositive. In a recent experiment, t 2 Bunker et al. found substitutional-impurity levels,1 the core-exciton levelan anomalous sharpening of the exciton spectra near for pure Si is determined byx =0.15- the data were interpreted to support theNewman-Dow point of view. Yet the most recent ex- F((E) V -Er')-1. (3)periment'3 still suggests a positive value for the bind- where Es ' is the site potential seen by an s electron ining energy E°o in silicon. bulk silicon, and V is a central-potential parameter.
In this Letter, we present a calculation that offers a For a chosen value of Vb, Eq. (3) can be solved for E,plausible resolution to the above problem. In our and vice versa. Then E° = E- E, where E° is thetheory, the calculated Si 2p core-exciton binding ener- conduction-band edge in pure silicon. Because of thegy fb(.x) and the linewidth A(x) in Si.Ge 1 1 alloys uncertainties in the value of experimental E° andare sensitively dependent on the parameter E° . A theoretical 1, we treat E° (or V) as a parameter. Thecomparison of the calculated Ax) with the expert- binding energy Eb in a SiGe,_. alloy can be calculat-ment' 2 suggests a positive value 0.15 ± 0.05 for E° . ed by solvingThe anomalous experimental spectrum' 2 near x - 0. 15is explained as a result of a competition between an in- F(E) - V 1, (E)] (4)trinsic broadening A/ due to screening and an extrinsic *-alloy broadening AA . In the present theory, there is noneed to suppose that the exciton suddenly changes its , - xES' + (1 - )fGe (5)character from an extended effective-mass-like state toa deep localized state. Then Eb is given by
We need to calculate E4 and .1 = -/+ -%4 as a func- -b= E,- E. (6)tion of alloy concentration x The calculations arebased on a quantitative coherent-potential-ipprox- The calculated values of the conduct ion-hand edgeimatio, (('PA) hand structure Details of the CPA and the exciton level measured relative to the top ofcalculations will he presented elsewhere. Belovk. we the valence hand are plotted in Fig. I The band gap *.-
briefly discuss a Green's-function method for calculat- increases with x with a slope discontinuity at = 0.15ing Eb and A 4 The dashed lines a. 1, and c represent exciton levels
The one-particle effective (Freen's function in CPA obtaint I with Eb = 0.1, 0 15, and 0.30 eV. respective- ,--takes the form ly. The binding energy Lb is also an increasing func-
tion of x, with a slope discontinuity near - 0 15(i (t.i = [ t (.) ] " I ) The CPA introduces a slight bowing in E, and -'
where II is i h \ rluatl-Lr, siail ipproximainon Ilamil- Strinati I0 has calculated the variation of A/ with lb
.320 19 5 The American Physical Societv
I--.i~

.7 . .
VOtILME55, Nt MiIR 3 PHYSICAL REVIEW LETTERS l5.itvI985
0.
030 Eb01 r
} ~~~ ~ 2 1S?22 ---- ... -°°. -',
08 -- ' -. ' -,-. ----
07 0.15 An i,,
ir E 0 0 15 leVI
II
02706 %'
00 02 04 06 08 1 0 024
X
FIG. 1. Variation of the band gap (solid line) and the Si -"
2p core-exciton level with x in SiGe, , alloys. The energy o 18is measured from the top of the valence band. The dashedcurves a. b, and c represent exciton levels calculated with 0 15 0 5 .-
Eb°=0.l. 0.15. and 0.3 eV. respectively
by replacing the short-range Coulomb potential with a 024 - - i3 -
spherical square well of variable depth and a screenedCoulomb tail. Strinali's results can be used to estimate 021
A, corresponding to the calculated Lb. A/ decreases 0 1erapidly with E, then saturates for larger Eb.
The contribution to the natural linewidth from the osalloy broadening is calculated by a consideration of the --------- -------------
electron part of the exciton wave function, di, The q, 0 10 o4 6
is expanded in a linear combination of the s part of the x _ .1.conduction-band wave functions 6: FIG 2. Variation of A (solid lines) and A, (dashed lines)
with x for three E°0 values,.,(k ) = , . 6 (k . (7)
The calculated A, which is the sum of At and A 4 , isWe found that alloy scattering is only moderate and s plotted against _v in Fig. 2 for three values of E. In allscattering is dominant, thus, the alloy broadening three panels, the dashed curve represents A, and theA(E) is well approximated by solid line represents A. It is seen from Fig. I that the N.
EL) -x ( I - .V)2 ImF,( E), (8) exciton level follows the A' edge of the conduction. .band. Hence the binding energy Eb. relative to the
where 8, is the difference between E sl and L-Ce, conduction band edge, remains almost constant (for aHence, the alloy-broadening contribution to A is relat- given Eb)) until the minimum switches from the X'ed to the alloy broadening of the band states. edge to the L edge. Because of the change in the slopeA,(k. E) of L,. Fb decreases rapidly when L becomes the
minimum. Correspondingly. A, varies slowly until theIA 4 ,l,,(k)AA(E) 1,(k)) X to L crossover and then increases rapidly. This
feature is clearly seen in Fig. 2. -
I (,.,A,(k.E) For E2= 015-, , the A, and A 4 are comparable nearX= 0.50. and , dominates for all small. x and large v.These two competing mechanisms give a relative
=fp,( E)A 4 ()dE minimum near . r0.15. a broader maimum nearA 0.50, and a smaller minimum for pure silicon As,
= ( )hrfi L7()dL (9) E is decreased, the relative mininunis, shifted to jlarger x. e.g. the minimum shifts to 0.20 for
The integral in Eq. (9) is esaluated numericallk. [= 0 10 eV For L,?= 0 .15 eV. the posiiton of thc
321
•"......................... .............................................

V tLt 11 55, Nt,,lt R 3 PHYSICAL REVIEW LETTERS 15 jitt', l9 .
relative minimum is in agreement with the experi- E° ( - -0.10 eV) would be obtained When long-ment 2 (By measuring the relatise width at k . 0.15 range interactions are included, howe.er, the ahoeto that .% = I. one can make a better estimate of F,".) resonance state becomes a shallow donor level, whichTo correlate the theory with experiment, the calculated is the experimental situation for a P impurity in Si
iA2 is compared with the measured'2 (A.) -i(di./ Our results suggest that ' for core excitons in Si isdE)m, in Fig. 3, where ,AAt is the edge step and deeper than those implied by alchemy approximations(du/dE)m,, are the maximum values of the derivative However, if we use the alchemy approximation as aof absorption spectra with respect to photon energy. means of scaling, the value of V for Ge 3p core eci-Because the experimental values are given in arbitrar tons should be deeper than that for Si 2pcore excitons.units, the values are normalized to agree at x=0.5. ence, the curve corresponding to E° = 0.30 i Fig 2The observed anomalous behavior near v = 0.15 and should be a reasonable estimate for Ge 3p core-excitonthe qualitative x dependence in that region is clearly binding energy in alloys. Therefore, we do not expectreplicated by the theory. However, the calculation to see an anomalous behavior of A in alloys for thispredclts a larger maximum at k = 1. It would be in- case.teresting to have experiments that cover the entire In summary, the present calculations of the Si 2prange of x to further test this prediction. core-exciton binding energy and linewidth suggest that
For larger values of Eb , the calculated Eb is also the exciton level is about 0.15 +0.05 eV below thelarge and hence A/ decreases slowly with x. Because conduction-band edge for pure Si It follows the A'the broadening is determined mainly bt r
-%4. the edge for .x > 0 15 in the SiGe_, allos, and Eb maylinewidth is expected to be small for 0 and _% - I eventually reach zero in the dilute limit .% - 0 Ouronlh. this occurs for E"= 0.30 eV For negative values ,alue for Eb) represents the lower end of the previousof, I. fb remains negative for all .alues of .x. Accord- measurements,1 - ' but is in good agreement with a re-ingl., the linewidth is broad for all x, and there would cent experimental 13 value of 0.120 + 0.03 eV. By con-be no such anomaly as in Fig 3 sidering the intrinsic linewidth and the alloyv broaden-
T he c-alculations presented in this Letter are slightly ing. we can explain the observed relative minimum indifferent from alchemy approximationsY We treat the the linewidth near . = 0.15, without requiring a sud-cerrtral-cell potential I as a parameter and narrow its den change of the exciton character. On the basis of'range from other considerations. We examine values this calculation, we expect the corresponding width inof I- E., of -. 49. --7 09. and -6 56 eV, corre- pure Si to be even smaller than that observed nearsponding to E.' values of 0 30. 0.15. and 0.10 eV. = 0 15 We further argue that the binding energ. ofrespecti\.cl. If the strict alchem approximation were Ge 3p core excitons should be larger than that of Si 2ptaken, the valuc of I - E s' would be EP Es ' = -4,59 core excitons and there should be no anomaly in theeV in the tight-binding approximation, and a negative Ge 3plinewidth in alloys.
This work was supported in part by the U S. Depart-ment of Defense Advanced Research Projects Agency.under Contract No MDA 903-83-C-0108 and the AirU 1 0 Force Office of Science Research through Grant NoAFOSR-84-0282 One of us (A.-B.C.) would like tothank Professor W L Spicer for his hospitality atStanford Unliersat.
-1
05iititng professor at Stanlord Uners" '
1W Eberherdi. (. Kalkoffen. ( Kun,. ) 1. A.spne,. andM (ardona. Ph%,, Siatu, Solidi (hI 88. 135 11Q'8)
-M Altarelh and D L )e\ter. Phys Re\ I ett 29. 1100o 2 - - 3F C Brown. R S Bachrach. and M Sk N)w ki. Ph,,
0 02 04 06 08 0":. Re% BI15. 4781 (IQ9 7) /.X 4R S Bauer. R S Bk hra,.h.. " C McMcnamin ,d I) 1
FIG 3 1 he calculated I -; "values (solid line) .oipared -\spnes. Nuovo (inento 39B. 409 '-71,with thee eperimenial results (marks) from Rl'f 12 The S% largimondo and J 1 Roc Ph%,, I et: 59A. 464-.ilie ol caicculied A Si) is 0 12" ek lhe experiment T (I 1 7 1
niorniji/cd to the heors t X - hi 5 ( Nrgariuondo, I 'rJn'LION. \ ( ' Nitt,l md II S
322

Vol L ME 55, NIL MH1 K 3 PHYSICAL REVIEW LETTERS 15 JULY 1985
U-delmdn. Solid State Commun 36. 298 (1980) flIK E Nc%%man and J D) Dow, Solid State (ommun 50.7 C Kun, J Ph>"s (Paris),.Collonj 39. C4-119 (19781 587 (19841914 P. lljalmarson, If. Buttner, and 1. 1). Dow, Phy% Re%, 12B A Bunker, S 1. Hfulbert. I P Stod, and F C Brown.
B 24. 6010 (198 1) Phys Rev Lett 53, 2157 (1984Y.9M Allarelli, Phys. Rev. Lett. 46. 205 (1981). 13S. E. Schnatterly and K. D. Carson, Bull. Am. Phys. Soc10G. Strinati. Phys. Rev. Lett. 49, 1519 (1982) 30. 416 11985) ~
a-. -323
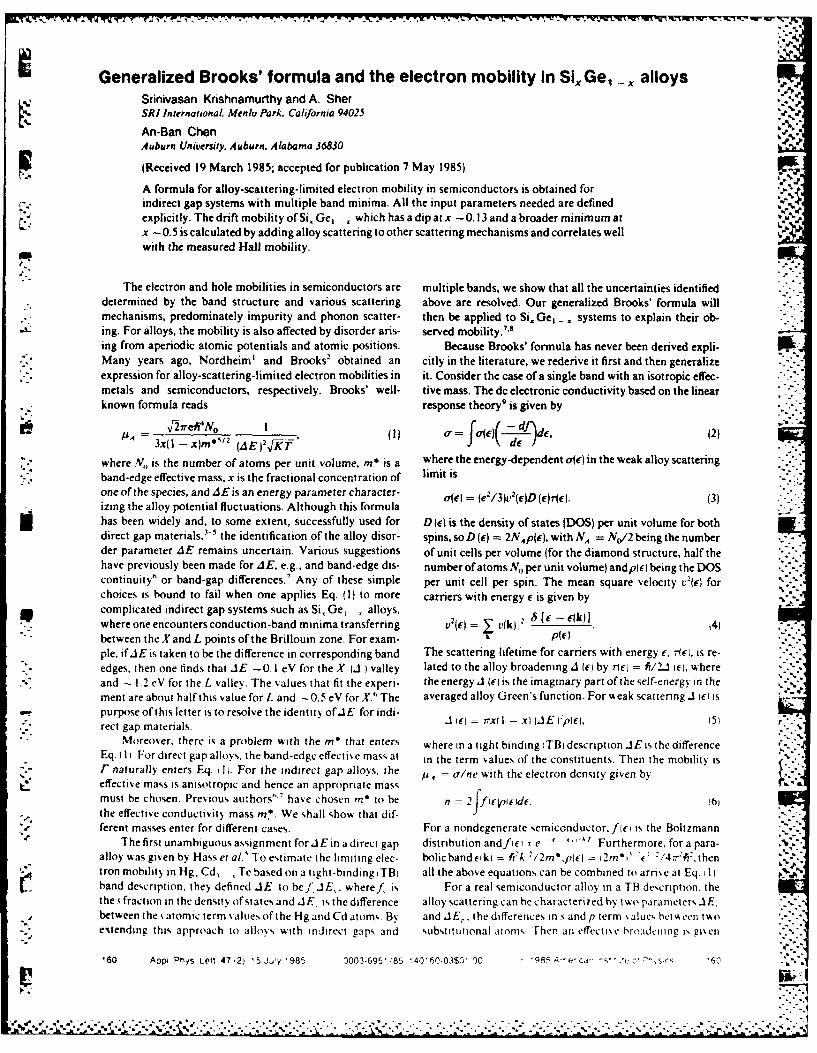
Generalized Brooks' formula and the electron mobility in SiGe, _ alloysSrinivasan Krishnamurthy and A. SherSRI International Menlo Park. California 94023
An-Ban Chen 4b :Auburn University. Auburn, Alabama 36830
(Received 19 March 1985; accepted for publication 7 May 1985)
A formula for alloy-scattering-limited electron mobility in semiconductors is obtained forindirect gap systems with multiple band minima. All the input parameters needed are definedexplicitly. The drift mobility of Si. Ge, -, which has a dip at x - 0.13 and a broader minimum at 'l.1
x - 0.5 is calculated by adding alloy scattering to other scattering mechanisms and correlates wellwith the measured Hall mobility.
The electron and hole mobilities in semiconductors are multiple bands, we show that all the uncertainties identified. determined by the band structure and various scattering above are resolved. Our generalized Brooks' formula will. mechanisms, predominately impurity and phonon scatter- then be applied to Si. Ge, -. systems to explain their ob-
-' ing. For alloys, the mobility is also affected by disorder aris- served mobility.'-'ing from aperiodic atomic potentials and atomic positions. Because Brooks' formula has never been derived expli-Many years ago, Nordheim' and Brooks' obtained an citly in the literature, we rederive it first and then generalize
,_*' expression for alloy-scattering-limited electron mobilities in it. Consider the case of a single band with an isotropic effec- .- -
metals and semiconductors, respectively. Brooks' well- tive mass. The dc electronic conductivity based on the linear. known formula reads response theory' is given by
, N( =d (2)3x(1 -x)m*"12 (AE ( 2 fT
where N,, is the number of atoms per unit volume, m* is a where the energy-dependent oje) in the weak alloy scatteringband-edge effective mass, x is the fractional concentration of limit isoneof the species, and AEis an energy parameter character- = (e2/3(r 2(e(D(e)re). (3)
izing the alloy potential fluctuations. Although this formulahas been widely and, to some extent, successfully used for D (e) is the density of states IDOS) per unit volume for bothdirect gap materials. - the identification of the alloy disor- spins, so D (e) = 2NAp(e), with NA = No/2 being the numberder parameter 4E remains uncertain. Various suggestions of unit cells per volume (for the diamond structure, half thehave previously been made for AE, e.g., and band-edge dis- number of atoms N, per unit volume) andp(cl being the DOScontinuity' or band-gap differences.' Any of these simple per unit cell per spin. The mean square velocity t,2(c) forchoices is bound to fail when one applies Eq. (1) to more carriers with energy e is given bycomplicated indirect gap systems such as Si, Ge, , alloys,where one encounters conduction-band minima transferring v2 ( = _ v(k)[ -41between the .I and L points of the Brillouin zone. For exam- P)"pie, if iE is taken to be the difference in corresponding band The scattering lifetime for carriers with energy c, r~eI, is re-edges, then one finds that .IE -0.1 eV for the X I4 ) valley lated to the alloy broadening A (c) by rite = h/2.3 i), whereand - 1.2 eV for the L valley. The values that fit the experi- the energy A wi is the imaginary part of the self-energy in the - ,ment are about half this value for Land -0.5 eV for X." The averaged alloy Green's function. For w eak scattering A (i ispurpose of this letter is to resolve the identity ofJE for indi-rect gap materials. A ici = rrxfl - x) WE)p(fl, 15)
Moreover. there is a problem with the m* that enters whereinatight binding TBidescription JEisthedifferenceEq. I. For direct gap alloys, the band-edge effectise mass at in the term values of the constituents. Then the mobility isr naturally enters Eq. I i. For the indirect gap alloys, the a/ne with the e r ny n,u . /, = orn ihteelectron density given by .:
Ik:. effective mass is anisotropic and hence an appropriate massmust be chosen. Previous au'hors"" have chosen m* to be n = 2 ifteof)dc. !0e.the effective conductivity mass m!. We shall show that dif- f-ferent masses enter for different cases. For a nondegenerate semiconductor, f (j is the Boltzmann
The first unambiguous assignment forJ Ein a direct gap distribution andf fi -, e . . ' Furthermore, for a para-alloy was given by Hass et al.' I o estimate the limting elec- bolicbandciki = h-k /2m*,p(c = (2m*i' c /417.:€, then ,tron mobility in Hg, Cd, , Te based on a tight-binding IB all the above equations can be combined to arn,,e at Eq. I I,band description, they defined AE to be] fJE,, wheref, is For a real semiconductor alloy in a TB decription, thethe s fraction in the density of states and iE, is the difference alloy scattering can be characterized by two paramneter, 1E,.-between thes atomic term values of the Hg and Cd atom,,. By and IE,, the differences in .s and p term % alue, bei een twoextending this approach to alloys with indirect gaps and substitutional atom, Then an effectie brohadcimne i, gien
160 Aop PhyS Left 4712) 15 J.oy 1985 0003-695' 85 '40"6003$ 0 , 985 4-e.ca, , c ''ss '62 -'"
....................... ... . ... .. ~.... ... .. ::5:

by I ABLE I C:kulation parameter-.
Wrm+tpe/P, (7) "S ysmswherep,,p, are partial density of states (PDOS) and J, and ,A. are similar to Eq. (5), with p replaced by p, and p,, re- M'(X) 0, 9aspectively. For Hg, . Cd Te, the s disorder is predomin- ,?( 1.m,, jent"' and one can neglect AEP. Defining p, =f~p (and mIL) 0.082m.p, = fpp), one arrives at E,1 0.8941 + 0.042 -x4 0.i91x;
A z irx(l - x) (f.E, )2p. E0( .75% + I 0860x 4 0.3306x-'A,.(x) 0.333 + 0.OSz (0.x<0 31
Thus as was pointed out by Hass et a1., f,'AE, plays the role 0339 + 0.03x 10 3,.x,. 0of AE in this special case where AE,, can be neglected. A, (X1 0 632 + 0.13x
For an alloy with a single indirect gap minimum, onehas to consider both s and p contributions to the alloy broad-ening and the masses that enter p and v2. Again, Eqs. (2H6) ly with the concentration, so m*' and m* are assumed to be '.
can be combined to yield constant and assigned the values 0.97 and 0.19 for the Xminima and 1.64 and 0.082 for the L minima, respectively.
0A The calculated energy gaps for the X(A ) follows the func-
(e~i4N,11 2r) tional form E' = a + bx + cx2 and for L is given by E "
=3x(l -x)mm*?*(m)"2(kT)"N,(f4. E +f 2 E ] - A + Bx + Cx2. All the parametersofourcalculationsare
SP 8) listed in Table 1.To correlate the calculation with the measured mobili-
where mi, and m,* are respectively the longitudinal and the ties, we need to have an estimate of scattering rates lI/t, duetransverse mass at the band edge, and N,. is the number of to impurities and phonons. A crude approximation is to as-equivalent minima, e.g., 6 for Si. The conductivity massm* sume l/to foragivenvalleytobethesameastheappropriate '-
comes from averaging v2 in Eq. (2) and is given by 3(2/m1* constituent's values and add to it the alloy scattering rate I/ ,+ Im*) '. Equation (9) clearly identifies the masses and rA. Then the average mobility and the mobility from the ith
the energy parameter that enter Brooks' formula. minimum in the alloy areNext we consider a still more complicated case where
the contribution to the mobility comes from more than one p =
band. For example, in Si0 Ge, _ the X and L minima crossnearx = 0.15. " There are now two contributions to the net (Mj,-I = uo)- +(,t4[', (12)conductivity, so a = Xa, where i is X or L. The quantities u,' is given by Eq. 10) and p? are the measured drift mobili-v,(c). D, (c), and N, (c) now take different values for different ties for Si or Ge. 2 The drift mobility, calculated from Eq.bands. The structure of r, (c) requires more careful consider- (12), is plotted as a function of alloy concentration x in Fig. I.ation. The complication comes from the fact that the effec- For x <0.05 and xo0.20, the energy difference betweentive broadening , is still given by Eq. (7), but p,, p,. and p the X and L edges is large enough so there is a negligiblecontain contributions from both the bands. The proper ex- contribution to the mobility from the higher minima. In thepressions arep = 2,p, N'. and p, = Yf,, N,.p, where i = X Si, Get _ system, the s scattering is predominent. BecauseorL, a = sorp. and N,' = 6. N' = 4. The equation for is -.
-2 j .9--
J (cl= rX(I - X)(f,:,,cA, 5Xp N ).-(9)I. , -
The mobility associated with the ith band is defined as " _u, = a,/(n,e). then,-
-= 1 - ...101
3x(l -to [mrm,*(2mr,' ],
x ~~de )i I I- I_ AN: .Vp,tE "
Thus, the generalized formula no longer has the explicit
x and F dependences of the original Brooks' form. Howe% er.Sall the quantities needed-the masses, the scattering param-* eters iE,. the band gaps, and the fractions/f,, -- can be e,,al- -2. _____ ,
uated theoretically without resorting to experinientally fit- ., " - "ted parameters. To demonstrate, we shall apply Eq. (10) to la ne electron drft mobit% and the expcnmenial
Si, Ge1 , .. The band quantities are obtained from our CPA I'ill mobilit% da'.hed line, ftrm Ref' 6 and 8 arc plotted a'. a function ofcalculation. ' We found that the effective masses vary weak- allio. concentrataon
161 Aopp Phys Lett Vol 47, No 2 15 July 1985 Krishnamurthy, Sher and Chen 161
............................. '.........................:-.-.---.-...-...)*.o.* .' . . - - ' * 4 -. . * -
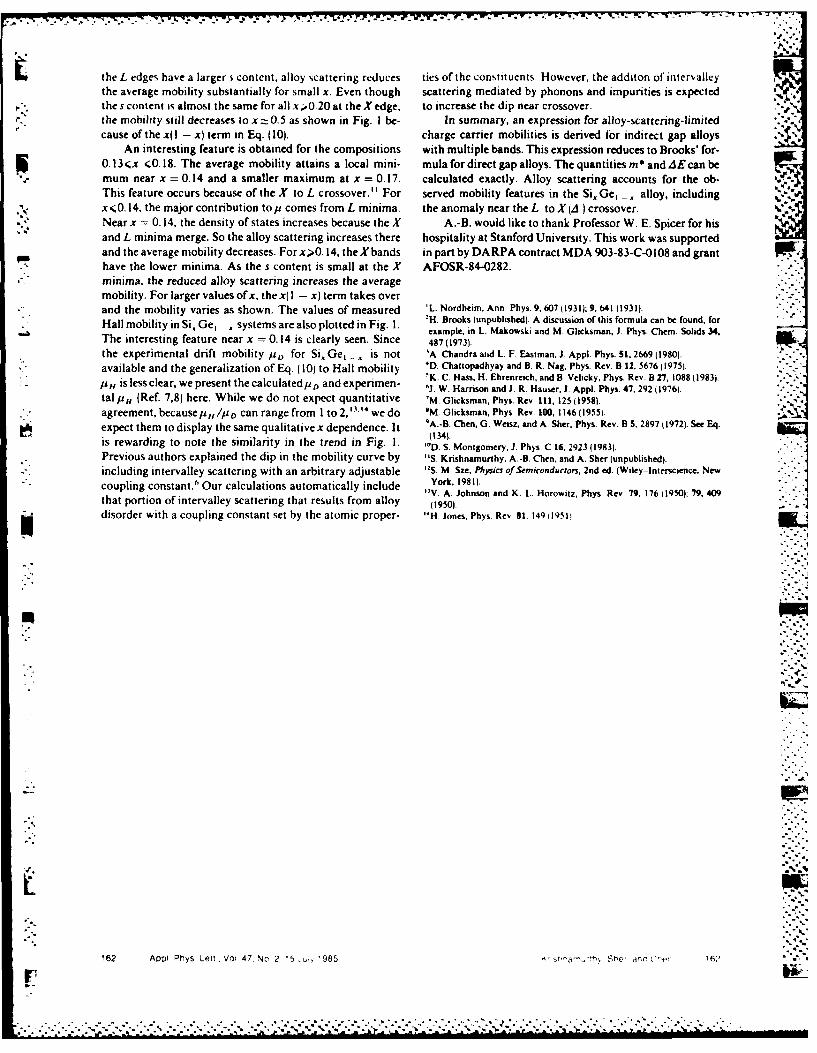
the L edges have a larger s content, alloy scattering reduces ties of the constituents. However, the additon of intervalleythe average mobility substantially for small x. Even though scattering mediated by phonons and impurities is expectedthe s content is almost the same for all x ;,0.20 at the X edge, to increase the dip near crossover.the mobility still decreases to x zO. 5 as shown in Fig. I be- In summary, an expression for alloy-scattering-limited " ,
. cause of the x(I - x) term in Eq. (10). charge carrier mobilities is derived Jor indirect gap alloys %An interesting feature is obtained for the compositions with multiple bands. This expression reduces to Brooks' for-
0.13<x <0.18. The average mobility attains a local mini- mula for direct gapalloys. The quantities m* andAEcan bemum near x = 0.14 and a smaller maximum at x = 0.17. calculated exactly. Alloy scattering accounts for the ob-This feature occurs because of the X to L crossover." For served mobility features in the Si. Ge, • alloy, including" 'x(<0.14, the major contribution topu comes from L minima the anomaly near the L to X (A) crossover.Near x = 0.14, the density of states increases because the X A.-B. would like to thank Professor W. E. Spicer for hisand L minima merge. So the alloy scattering increases there hospitality at Stanford University. This work was supportedand the average mobility decreases. For x>O. 14, the X bands in part by DARPA contract MDA 903-83-C-0108 and granthave the lower minima. As the s content is small at the X AFOSR-84-0282.minima, the reduced alloy scattering increases the averagemobility. For larger values of x, the x( I - x) term takes overand the mobility varies as shown. The values of measured 'L. Nordheim, Ann Phys. 9, 60711931); 9. 641 (1931).Hall mobility in Si, Ge1 systems are also plotted in Fig. I. H. Brooks (unpublished). A discussion of this formula can be found, forl m t example, in L. Makowski and M. Glicksman, J. Phys. Chem. Solids 34.The interesting feature near x = 0.14 is clearly seen. Since 487 (1973.
the experimental drift mobility i o for Si, Ge, is not 'A. Chandra ajd L. F. Eastman, J. Appl. Phys. 1, 2669(1980).available and the generalization of Eq. (10) to Hall mobility 4D. Chattopadhyay and B. R. Nag, Phys. Rev. B 12. 5676 (19751.
'K. C. Hass. H. Ehrenreich, and B. Velicky, Phys. Rev. B 27, 1088(1983)._ H is less clear, we present the calculatedU D and experimen- 1J. W. Hamson and J. R. Hauser, .. Appl. Phys. 47. 292119761.tal , (Ref. 7,8) here. While we do not expect quantitative 'M. Glicksman, Phys. Rev. Itl, 125 J1958).
agreement, becausepl,//pO can range from I to 2, 1.14 we do M. Glicksman, Phys Rev. 100, 1146 (1955).expect them to display the same qualitative x dependence. It 'A.-B. Chen. G. Weisz. and A Sher. Phys. Rev. B 5, 2897 (1972). See Eq.is rewarding to note the similarity in the trend in Fig. 1. D. S. Montgomery, 1. Phys C 162923 (1983).
Previous authors explained the dip in the mobility curve by "S. Krishnamurthy. A.-B. Chen. and A. Sher (unpublished).including intervalley scattering with an arbitrary adjustable "S. M. Sze. Physics of Semiconductor3, 2nd ed. (Wiley-lnterscience, Newcoupling constant.' Our calculations automatically include York,hn981). K. L. Horowitz. Phys. Rev 79. 176 (19501; 79. 409"V. A. Johnson andK..HootPhsRe7,16 10;"/,49" "that portion ofintervalley scattering that results from alloy (1950).disorder with a coupling constant set by the atomic proper- "H Jones. Phys. Rev 81. 149 1951
".4
". -
162 AopI Phys Lett Vo! 47 No 2 '5 u '985 I sr'Oa, .'h s Sheirr Chp" 16? ,
-.--.'...-..... ..... . ... ..S

137
t.
SEMICONDUCTOR ALLOYS: LOCAL BOND LENGTHS,MIXING ENTHALPIES, AND MICROCLUSTERS
A.B. CHEN. ANt) A. S , ERt*Physics Department, Auburn University, AL 36849tSRI International, Menlo Park, CA 94025
ABSTRACT
Several recent theoretical studies of the local structure of semiconductor alloys aresummarized. First, dilute limit calculations of local bond lengths and mixing enthapiesare discussed. These calculations include effects due to both bond length and bond-angle distortions, as well as local chemical rearrangements. Then, a new statisticaltheory of concentrated alloys is described. Deviations from random alloy distributions(microclusters) are predicted.
INTRODUCTION
This paper summarizes our recent theoretical studies directed toward understand-ing the microscopic structures of pseudo-binary semiconductor alloys A1BtC. We firstpresent a detailed calculation of the local bond length relaxation in the dilute limitX - 0. i.e. the case where an A atom is substituted for a B atom in a BC compound.The mixing enthalpy parameter 0i is found to be related to small excess substitutionenergies. These excess energies are calculated directly through a minimization pro-
cedure. Thus, the accuracy of the predicted f is not limited by trying to find smalldifferences between large numbers. The theory is then generalized to concentratedalloys using statistics based on combinations of tetrahedral clusters of five atoms. Ourresults predict that microclustering occurs in a majority of alloys. We conclude by iden-tifying systematic correlations between the theory and several experiments.
Before discussing the calculation, it is useful to provide some background aboutthe structure of these alloys. It was customary to assume that these alloys have twosublattices in which the C atoms occupy one sublattice. and A and B atoms are ran-domly distributed on the other. This picture, referred to as the virtual crystal appoxi-mation \'CA). implies that the nearest-neighbor (nn) bond lengths in the alloy are the
-oncentration weivhed average values. i.e. d~c = dBc d 4- d (1-x d whrethe values "%ith a superscript Ol denote the pure-crystal values. On the other hand.according to Pauling's covalent radii approximation (CR4), the local bond length,retain their respective pure-crystal values. i.e. dAC = dk1 and dB = dgJ
If we define bo d ) 7 d and 6 = (d d>,cl / d. then the ratio bib, in VC-\-,Pr(,. but iti ('RA it I Vaever. .likkelsen and Boyce' found from their EXAF..
.\P,rrlnm o n \ thet ih tin bond lengths do not fit either \('.-\ r ('t\.
Instead. they foutI Oh v:mlue of to be lose to 3/4. Since then. similar '\t.riro'-..hae been ione f,,r a numb er of zinc- blende psetido-hinarY allis. and Ow 3,A ,:,
ape:ar to be quite g-icral.
;? i-,
S. e o yo % •,S~* ~e..*..,hSc, .4
2"..."
- ,"-. --_ :_'-.' c..'. _.' ._ .• -. ". X " --: . , -.'.".'" .".' .. : .'"... .'..."..". .. ".. ." ..""....".. .. .".-"..'....".'-..".... ., .
r,1%7
*13
DILUTE LIMIT
The dilute limit is the easiest case but is still not trivial, its solution providesboth end-point results (x = 0 and 1), as well as insight into the extension to the concen-trated alloy case. A complete description or this case is being reported elsewhere; here -
we summarize the essential results. The substitution energy A. for an A atom replar nga. B atom in a BC compound is calculated and minimized to find the relaxedconfiguration. A, can be written As A. 4 (ANEb + AE, + aE~h), where A~b is thebinding energy difference between the AC and BC compounds. AE, is the strain energy, .
and AEch is a chemical energy shift. All AE' a are energies per bond. Then.AE =AE, + AEch is the excess energy per bond for the impurity substitution. AF, iscalculated by dividing the crystal into two regions. Outside R (which is the distance of-the second-shell atoms to the impurity), the distorted crystal is treated as ali elastic continuum with a radial displacement field which is inversely proportional to th suare ofthe radial distance, so 4E,(")I I/4RCu'. where C is an effective %hear coefficient.
%C =s(1.6 (C11 C12) + 4.8 C44), (1) a
and u is the magnitude of the displacement at R. Inside R, the strain energy A,(nI istreated with a valence force field (XTpF).( 21 Finally, the chemical energy shirt AEch is Cal--culated from Harrison's model and arises from changes in the metalization energies"caused by different bond lengths Ad EdB - dAC and covalent energiesAV 3 EEV 3 (4AC) -VO(C). Note that .5, (dkJ - dr) / d6T and6 = (d~d - dAc) /del in this dilute limit, so the excess energy %E ran he expanded up
to second order in 6. u. and A\' 3 For a given pair A and B. NE is an explicit function or6 and u. Minimization of AE with respect to 6 and U leads to the equilibriumi local
bond length dAC and energy AE. Then. aE is used to estimate the mixing enthClp 'parameter 0 in the mixing enthalpy Ili = x(l-x)() bN
Q ' 2IAE (.A in BC) + .1E (B in AC)). 2
A systematic comparison %%ith other models based on strain energy alone showsthat an increase of the range of the fixed boundary R increasps the relaxation of d", . .e.'it causes 616, to incrase. The inclio~in of the bond angle restoring force, on the other
hiandl. reduces the relaxation. It turns out that a delicate cancellation of I hre t%%'effects causes a iiopie sj.ring modl pointedl out by 1hi etai SI il *
rat' results. In ti i notel 6 1~ 1 - l,'3 ci/at). where i- andol areo the listretching force constants for the iost (BC) and the impurity AI A' crst als Wih(k2o at, t his model predicts 6 = 3/41,, ror a zinc- blende alloy. klt lo'jeh our full pert ir-hiationti heior- FIIT anl the \TF cidi (,f Nfartin and Zlunger tMl 'lredict i., with
anrt cat lsoit deviation ci-niparAdle to, the .'\perirttieta! itr"rtaiiitv ofl 01.1A. t.
-ittiple sp'rit:m cii Id s evn better.
u-l with i ,it l :n.;jw-%l all :ir:ii, 'c our th,.'rY antd I 'Il -ctt ' %ail. the* ''xi 'r
ci ut %, s.! 'set ru lii its 1\ ttier liarn the (ioe parattiet Fr ihe. rid". Ait .- llijuc '.,
let-v pcC'.i- -a 'ais i ',ti f ,r all1 thre-e Ca. All all-s. the fnacgniti
W) C to 74)l ' C itt n d re-e n tv. _' rie calc iliated Ii val let, also provide guidance i
se parat in ti nis-ile frin cii i ci c i, ',l s. In a ran loin all In'. the cri terin for alloI-
4C V- I
%U
tt 2 .' I -

mixing for all x is T > T., where the critical temperature T is given by T, 0/11with R. being the universal gas constant. Figure I is a plot of T,/T2 against
1601 / 1I 1 where T2 is the lower of the two constituent's melting temperatures, and6. = 1.63 %, with xm being the ratio of rms bond length amplitude fluctuation to thebond length at T2. The simple spring model gives Tc/T 2 = (60/b.?) as indicated by the
* solid curves.
There is an empirical rule stating that a miscibility gap will occur if 140
between two alloy components exceeds 7.5%. However, if Tc/T 2 is plotted againstKII . the simple spring model would not exhibit a smooth simple quadratic curve, and
our theoretical points would be much more scattered. This suggests that
0 /. 1 > I is a better criterion than I oI > 0.075. Figure 2 also clearly showsthe chemical effects, namely negative and positive chemical energies AEct for cation andanion substitutions respectively. The full theory and the experiments correlate withinthe experimental uncertainties. The simple SSHS model clearly is an excellent universalrepresentation. However, Tc/T 2 varies faster than quadratically for larger 1616values, as born out from both the experimental data and the full theory.
CONCENTRATED ALLOYS
Turn now to the concentrated alloy case. First, an improved statistical model isrequired. We have extended regular solution theory based on pair energies to one rorfi~e'atom clusters. For an AB-.,C alloy, the building blocks are clusters of
A(m)B14-rn)C, where mn ranges from 0 to 4. For a given alloy concentration x and for agiven set of energies (, associated with these clusters, we have derived expressions for
the cluster population distribution x. =_ / N. where N is the total number of unit
cells -and iT.~ is the averaged number of cells with A(m)B(4-M)C clusters. The partition
function Z is obtained using a steepest descents argument which then yields the mixingIlelinhotz free energy AF. The result reduces to Guggenheim's tetrahedron caset' 1 ifpair potentials tfor the second- neighbors) are assumed . Another major difference is that
only need to solve a single quartic equation, while Guggenheim needed to solve four
-imultaneous quactic equations.
The key to the problem. however, lies in the calculation of the energies (m. if one
:.ssirne5 that the size of the tetrahedra for all rn-clusters at a given alloy concentration
t:4~es n the corrcesp~ondin~g VC.A values but allows the central C atom to relax, then the%
n, . functions of x behave like those shown in Figure 2(a). There are at least two *'
i.4t1A. inthi',slt First, the energies ar- t-o large and would corresponl to, Q
vi'Marty tivies the experimental values, Sec nd. at x 0.7-5, 0.5. and 0.2. thesv
eno,es rnpl% coinr,und formation for A3 BIC4. A~~'.and AIB 3C4. respectively.ahic ~ 4post-t, the known tendency for rpinodal decomiposition of Galn,,As at
'a1'. lb 'a ver, If the local cell volume of each -luster is allowed to he in trechailI
*.ii~ri'm aith a conjtitmoo rnelfiurn with an effective shear coe.fficient
- '1 ahere the C value ftr t he luro Material is givi(n by F+I. Il
he,,. -h, cocrr-.-nlit energies t. as a functio)n of x are given !it Figure 2(b)1, a bir
-~ . w. IIsa rev.otiable valu~e of rnisitz rnthalp and ,,orrecily predicts the enlicyw"I ' Pinodal lercimposition at low% temnperaiture. 'Alt It this set of ,ene ries. one ran
* rs ili the cluster distribution \nM. and, 7,,mlare them with the corresp( ndittg
%alie' for a rstidorn alloys i e. x~ = j4.,N "'- x)" l. Figure :1 shows the ipeviation
f,,,m ranitonnes Ax. x xrn*s as a function of x for tour arbitrarily -hosen groath
M Mi
.................................... .......................................................................................................................
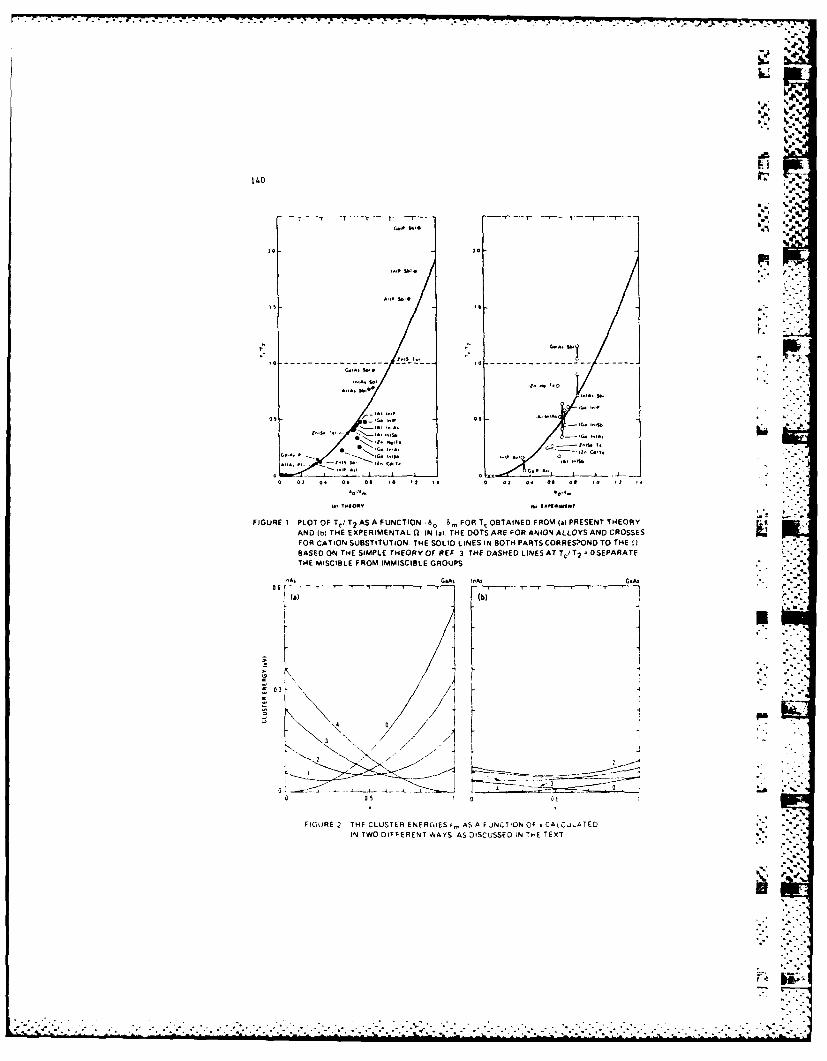
b. %I
140%*3,
S .. sJ
0. -. ' - -- ---
20J-
02+ 0. 0.. 08 -0.2 0. o a 1
FI R II. ,FA TE M .. TH .A -A........8
BASED ,.o THE -ML T
A.G.A G.M@
"06[-%
K .+ I.,,o.,, 0 .
-,7 . ,, o,.o . ...
.t,,.- .:ev ,,. , + , .... :f.:
-4-
FIGURE 1 PLOT OF Tc/ T2 AS A FUNCTION OF CA LFOR Tc OBTAINEDFROMla PRESENT THEORYAND (hi THE EXPERIMENTAL G IN Ii), THE DOTS ARE FOR ANION ALLOYS AND CROSSES KFOR CATION SUBSTITUTION THE SOLID LINES IN BOTH PARTS CORRES.'OND TO THE +. ( '
BASED ON THE SIMPLE THEORY OF REF 3 THE DASHED LINES AT T/T 2 - OSEPARATETHE MISCIBLE FROM IMMISCIBLE GROUPS,..'%
:t.A, GsA. OAR, G .A,si °
' 0 0S
IN TwO DIFFERENT WAYS AS DISCUJSSED IN THE TEXT
%
- . .
. . .. . . . . . . . ." + " + ' " - + ... . . . " " , ' ' - ' . " . . . ... . . " " "
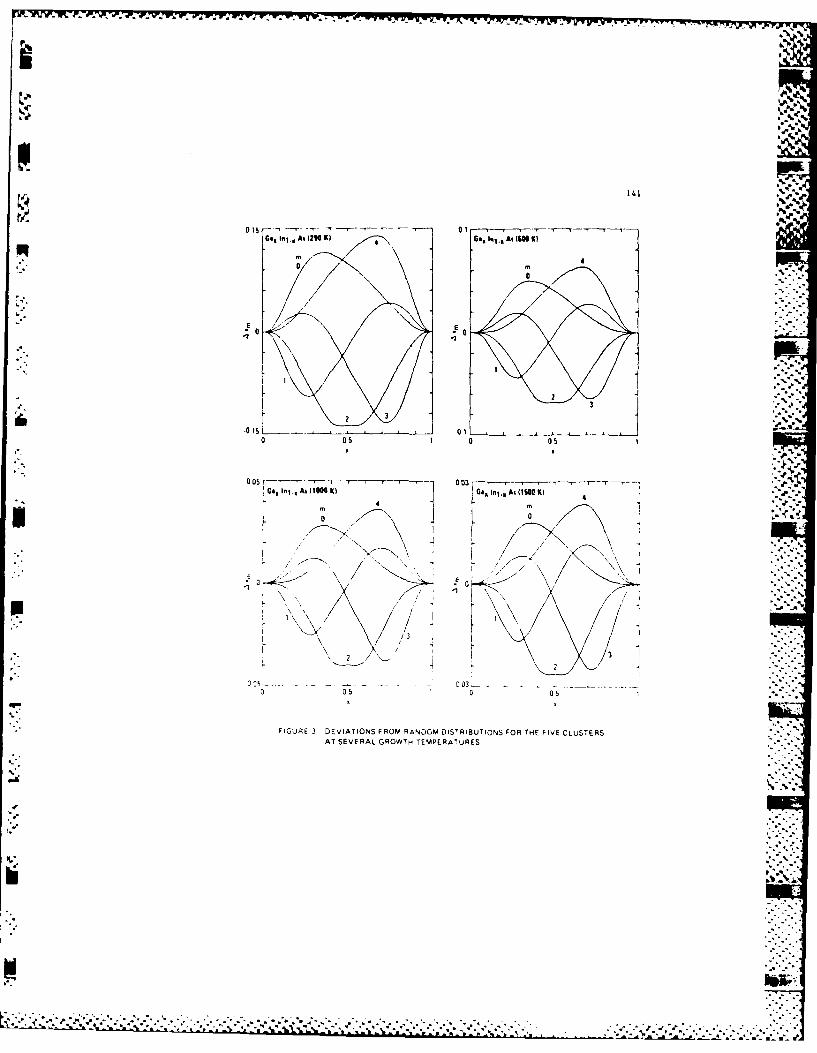
0- - - - - -- r -0 - - - - - w -- r--Go, 1*! . . As (2" K) Go, G la"1- As (600 K) T "
0 "%° °, ,/
00 is0
0r-0 -7) 0 0 00
Goo lol As 11----Ga . . .. 6K
-0 0E ,'-<'-"
12- o \-- .
2
D03
S.. . 0 . 0.5 ,:...
0 05 5
"-" FIGURE 3 DEVIATIONS FROM RANDOM DISTRIBUTIONS FOR THE FIVE CLUSTERS
AT SEVERAL GROWTHm TEMPERATURES
0 05 -'--~ ' ' 00:'-A
&a,1 1,AIUOK GaInj.A,(IPK) --.,-:
0I
*___
"N"b
°.U1 .,.:./...
° o, , . - - , ,o ,. • % " . o . . - . . • . • . . , o . . . .
Band structures of Si,,Gel-., alloys
Srinivasan Krishnamurthy and A. Sber
SRI International, Menlo Park, Calfornia 94025
and
A.-B. Chen
Physics Department, Auburn University, Auburn, Alabama 36849

ABSTRACT
Starting from realistic band structures of the constituent materials, the electronic
structure of SixGet, alloys are obtained in the coherent potential approximation (CPA).
Various quantities, including the bowing parameter of the fundamental gap and the '- >
energies of several optical gaps, the masses, and the linewidths of the E0 and E1 transi-
tions, are calculated on the basis of both diagonal and off-diagonal CPA. All of the
band-energy and line-width predictions are in good agreement with experiments. Fur-
thermore, the theory yields alloy-scattering-limited electron-drift mobility in qualitative
agreement with experimental results.
1'
7-7
. . . . .. . . . . . . . . . ~ ... _ _ _
1. INTRODUCTION
Semiconductor alloys offer the freedom to design material properties by choosing
appropriate alloy constituents. In some cases, the physical properties of the alloys can
be quite different from those of the constituents,(1°4) In recent years, there has been a
renewed interest in Si1,Gel-, alloys(S) and superlattices.(5-10) Because silicon is the most
technologically advanced semiconductor, the results on SiGe systems have many poten-
. tial applications.
The lattice constants of silicon and germanium differ by -4%. Hence, the strain
introduced in the formation of SixGei. x alloys can affect the band structure(10) and the . -
adl transport properties.(8) Prior authors used virtual crystal approximation (VCA)(11, 12 )
and coherent potential approximation (CPA)(1 3 ) to study the band structure and related
properties. Either because of less accurate band structures of the constituent materials,
or because of the approximations involved in the alloy formalism, these calculations
predicted only trends of specific quantities, not quantitatively accurate results. Because
the s-state site potentials (,) for silicon and germanium differ by approximately 1.5 eV,
VCA cannot accurately describe effective masses and other finer details of the band
U structure. Because of the use of poor basis functions, earlier CPA work(13 ) predicted
alloy broadening of conduction band states substantially differing from experiment. The
purpose of this paper is to correct these flaws and treat transport phenomena.
Because of a substantial difference between the site potentials and lattice constants
of silicon and germanium, we incorporated both chemical and structural disorder in thecalculation of the electronic structure of SixGei_ alloys. Thus, both diagonal and off-
diagonal CPA are included in the predicted band structure and related quantities. Parts
of the band structure have been used to study the Si-2p core-exciton(14) and the alloy
0J mobilities.(15) A comprehensive report of the calculations and results is presented here. .'
2

t- -° - - -- "
- ' •
%
The rest of the paper is arranged as follows. The detailed procedure of fitting sili-
con and germanium band structures is given in Section II. The VCA, CPA, and off-
diagonal CPA calculations are described in Section III. The results and interpretation of
the alloy band structures and mobility are given in Section IV.
C-,
P
1I. BAND STRUCTURE BASIS
In order to derive an accurate alloy band structure, one must start from a realistic
band structure of the constituent materials. Chen and Sher have developed a
method(16) following a prescription of Kane(17 ) and Chadi(18) that includes all long-
range interactions, and then fine tuned the band structure with an adjustable local Ham-
iltonian. Because the details have already been published,(16,1 9 ) the underlying method .
will be presented here in brief.
Gaussian orbitals of the type a ( a can be s, Px, py, or p) for each sublattice in a
cell are used to construct the corresponding Bloch basis. In this basis set, the overlap
matrix and the Hamiltonian derived from empirical pseudopotentials can be calcu-
lated.(1 7 ,18 ) It is possible to cast the problem in a basis set of Gaussian orbitals in
which, in crystal units (cu), the same exponential factors apply for all Ill-V corn- -
pounds.(1 9 ) In this universal basis, the overlap matrix and the kinetic energy matrix are
same for all III-V compounds. Then, by a unitary transformation, the basis set is ortho-
normalized.(20) The Hamiltonian in this new basis set is denoted H0(k). The band
structure resulting from this method reproduces the results of elaborate band structure *-.
calculations within a few percent throughout the Brillouin zone (BZ). To establish accu-
rately certain important band structure features adjacent to the gap, an extra small 8x8
3
. .. -
- -- - - - - - - --"-- ---- - - - - . . . . . . . . ..". . . . .... . ..- .. ." ".-. . . ..-", -- -.. ..- ".
a' ' y
.. t y ' -' ': ' 'a ' J - : y ' '- - J rJ 2 - ' '-
7V .. IV..L W
% P
4.. .. i .- ,
Hamiltonian matrix HI(k) is added to H0(k). This HI(V) has the form of a tight-binding
(TB) Hamiltonian, in which only the nearest neighbor interactions are included, and
stimulates the effect of nonlocal pseudopotentials and an expanded orbital set. The total
Hamiltonian, H(f), in this orthonormalized basis set is diagonalized to obtain the band
energies and the corresponding wave functions.
Following this procedure with the same exponential factor = 0.26 in the Gaus-
sian orbitals for both silicon and germanium, the matrix H0() is obtained. For silicon
and germanium, H, contains 6 adjustable parameters: namely, the corrections to the
term values A, and A. and to the nearest-neighbor interactions V., Vp, V., and V..-
The values of A., A, V, and VxX are determined from fitting the three experimental , .
energy gaps(21-28) at r(k = 0): r2, - rF, r 5 - r2,, and F, - r2, , and the photo-
F: electric threshold (PT) values -5.07 and -4.80 eV for silicon and germanium respec--.-. ".
tively.(29) The remaining parameters Vsp and Vx are obtained from the experimental
values(2128,30) of the gaps XI, - X1, and LI, - L3, Some adjustments in these input
•. quantities are made to obtain an overall good band structure with more accurate
effective masses. Table I lists the empirical pseudopotential form factors and the param-
eters used to obtain the band structure. The calculated band structures and experimen-
tal values are given in Table II. From Table II, one can see that an excellent fit to the
, silicon and germanium band structure is obtained: All the calculated values lie within
the experimental uncertainties. The optical difference between L1 c and L3U, r2, and ls-
are in excellent agreement with the known optical transition values.
Although the calculated effective transverse masses agree very well with experi-
ment, the effective longitudinal mass for germanium is less than the experimental value. -:
This is due mainly to our attempt to have a common f and the choice of local pseudopo-
tentials, causing H0( ) to be the same in crystal units (cu) for both germanium and
4
. .. ,
.**::-°.:.
silicon. Because of the common H0(i), the alloy disorder is contained in these adjusted
parameters. This H0 would also be useful for the interface and superlattice(30) prob-
lems. If we grant ourselves the freedom to adjust Vx, longitudinal effective mass in ger-
manium can be fitted to the experimental value. When VV is changed, the L1,, L, , will
also change. We have chosen not to do this because little is gained for the extra com- 7
plexity. For an indirect gap semiconductor, the important effective mass used in tran-
sport studies is the conductivity mass, 3 (l/mei + 2/met) - Because m 1 >> m*et in
germanium, m', will not be much different if a less accurate value of m°,n is used. More-
over, the Si Gel_. alloys which have potential device applications are in the silicon-rich
region, where the effective mass at the L edge is not expected to affect the further stu-
d ies.
It is important to note that an excellent fit to the experimental values can be
obtained with only seven adjustable parameters (/3, A,, Ap, Vs, V.p, VXX Vvy). with fi
being universal in cu. The calculated band structure of silicon and germanium are
shown in Fig. 1(a) and 1(b) respectively. The characteristic indirect gaps are clearly
seen. These band structures compare favorably with the best results available, and, in
contrast with those obtained in the usual empirical TB approaches, produce good con-
duction bands.
•1 .' " .
5
. . . . . . . . . . . .. . * ~ ,*,t 4. * . . . . *. * **** ~ ~ - . °°.
A... -- I. . . . . . . . . .
III. ALLOY CALCULATION
A. VCA
Because we have the same H0 ) matrix for both silicon and germanium, it is only 7
the H, matrices of the constituents in scaled VCA which distinguishes them. In this
approximation, the diagonal elements of the alloy Hamiltonian R(f) are simply the
concentration-weighted average of the corresponding elements of the pure silicon and P .
7. germanium Hamiltonians, whereas the off-diagonal elements of RI() are obtained by
assuming a 1/d 2 dependence. HRK) can be diagonalized to obtain the VCA band struc-
ture for various concentrations, x. The VCA band structures for x 0.1 and 0.5 are -
shown in Fig. 1(c) and 1(d) respectively.
B. Diagonal CPA
An earlier work on CPA band structure of SiGe alloys(13) is based on a local but
energy-dependent pseudopotential approximation. While the value of the scattering
potential parameter was 1.49 eV, close to our value, the calculation predicted too-large
linewidths in the E. spectrum and essentially no effect on the electron mobility. With
the availability of a set of good basis functions and constituent band structures, more
S'-realistic band structures of the alloy can be obtained.
In the current model, we have a TB Hamiltonian, which contains matrix elements
to all ranges. The simplest alloy model is to assume that the important disorder resides
only in the diagonal matrix elements, c, and e . In our model, the e S and eo" differ by
.. ..
-' -'_*
"e'e"-'"-''-." -".'.-'. , : -'-"-" ,'-"-" "-- . "'"'-"','.'."'"'-";>'" '' . ',' -"-". "..', ".. ."'"',-','-'-."'"'-'," "'-'-"'" ."-". ."'"'.

1.4 eV whrea c i ad eG, iffer by 0.21 eV. For the present, we neglect the disorder1.46~ eV hra S n 0 d
in the off-diagonal element. Mathematically, we have
".4
whereT is a fcc lattice vector identifying a site, and VT is the 8x8 diagonal matrix with
eleens . S C5 U e -Cpin the orthonormal lclobtsI j>;jdenotes
thetwoatos i th unt clllabeledt 1,o represents s or p symmetry, and IC and ?",, are
theconcentrtio-wegh edaverage values of 9 and p silicon and germanium term value
energies.
The one particle alloy Green's function is defined as
G. 1 (Z) = 1(2)
Z - H~j4
We are after the configuration average of this Green's function, which, in effective
medium theory, is replaced by an effective Green's function G,
G(Z) 1()I
7
* . . .. . .-.. . -- . . . . . . . . . . . . . . .
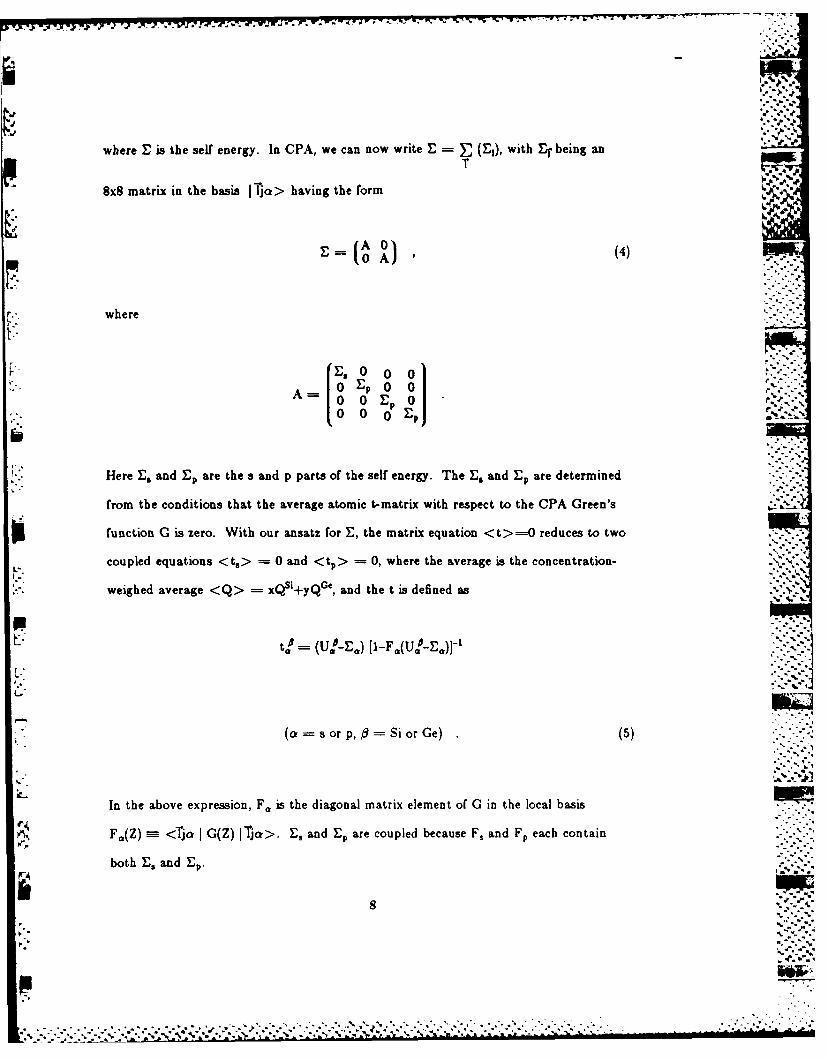
........ ......
.1a
where E is the self energy. In CPA, we can now write E T (E,), with ET being an
T
8x8 matrix in the basis Ijar> having the form 6
E A 0) (4)
(0 A .--":where
C
10 EP 0 0 ,.-
Ar =A = 0 0 E P 0 e ' -
0 0 a an r
Here E, and E are the s and p parts of the self energy. The E. and EP are determined
from the conditions that the average atomic t-matrix with respect to the CPA Green's
function G is zero. With our ansatz for E, the matrix equation <t>=O reduces to two
coupled equations <t,> = 0 and <t > =0, where the average is the concentration-.-
weighed average <Q> = xQSI+yQGe, and the t is defined as
I-,..I._ --"" ta -----~t (U.-E.) [l-F,(V O-E-j- ":"-. ""
(at=sorp,=SiorGe) (5).. .- ..i.
In the above expression, F. is the diagonal matrix element or G in the local basis
F0 (Z) - <TJjo I G(Z) I-Jc>. E. and Ep are coupled because F, and Fp each contain
both E, and Ep.
• .....-. o. ..... .... ............ .. ... .. ... .. ... .. ... "'..
- '," " "."- -" "- " "" ."-"' "" " "" ' ' ' "" ." "., ,,- L .-". .'_-'-' " " ; " -". .* ' " '"" " " " " ** '""" "" " " "" " " " " " -.-''' " - "' . ..... . . . . . . .
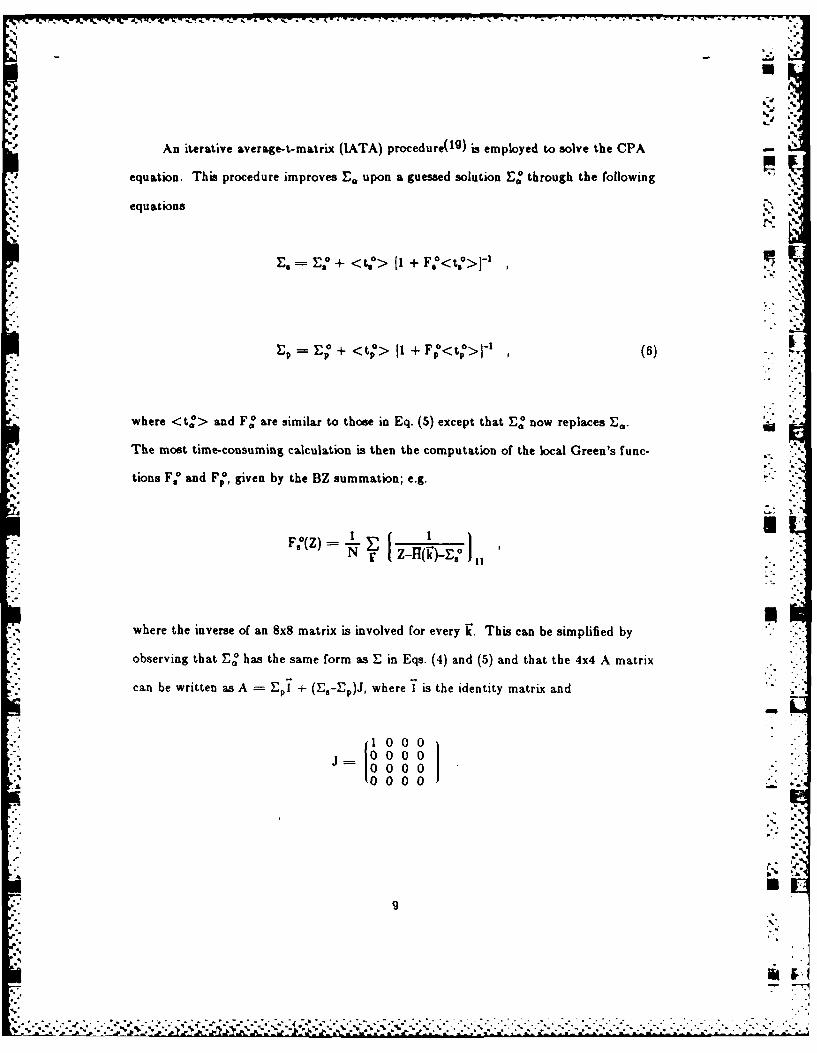
'.o
°t'"_ _ An iterative average-t- matrix (IATA) procedure0g) is employed to solve the CPA,-t
equation. This procedure improves E.o upon a guessed solution E* through the following "
equations 0[, "
i. E, = EO + < to [I + FO<t,o0>1-,
i -_- , ,L
E O E + < tp> 11+ FO<tO>Il'()-
.m .•
where <t v> avrare similar to those in Eq. (5) except that E now replaces E.
The most time-consuming clculation is then the computation of the lcal Green's func-g
eutions F 'ad
F, given by the BZ summation; e.g.
•X ) t 7 r,
.P. . a.a..
where the inverse of an s matrix is involved for every This can be simplified by
observing that o has the same form as E in Eqs. (4) and (5) and th e 4x4 A matrix func
%4
can be written as A pi + ( s- p)J, where "1 is the identity matrix and": "
1000J o00-'
000
S".
'.!
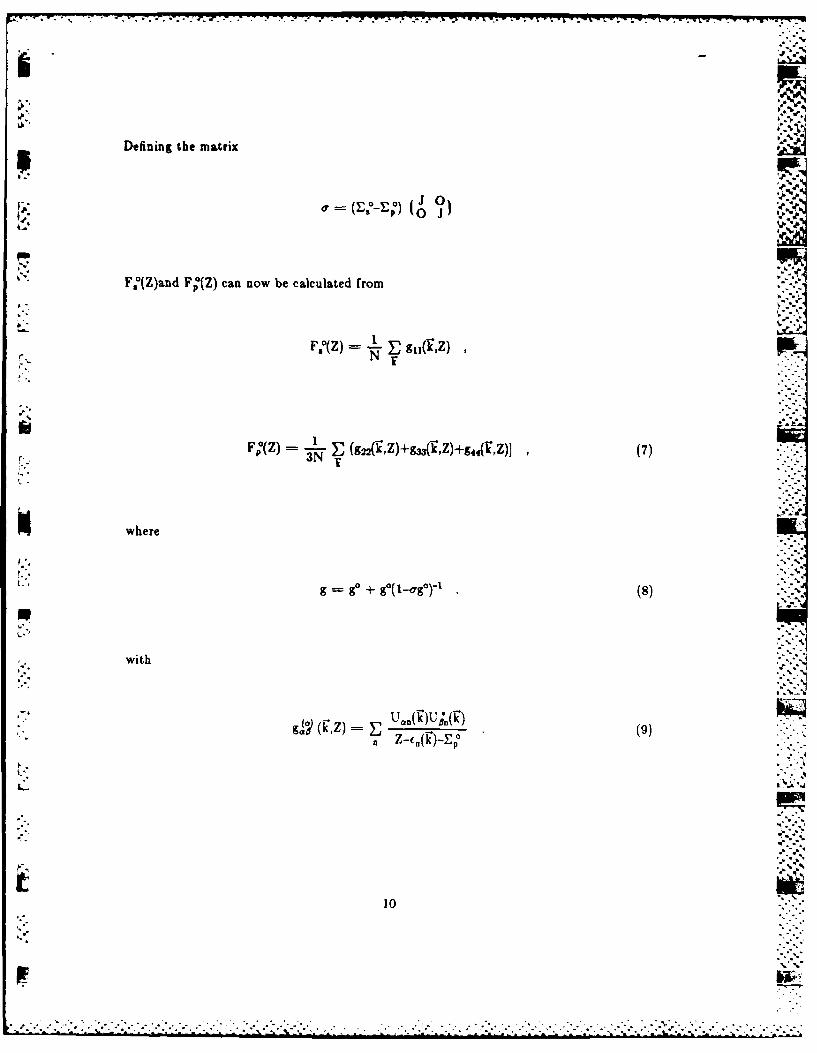
P~, Al
Defining the matrix
F(Z)and F?(Z) can now be calculated from
Nv
FpZ 1 g2k~ MVZ+4(,) (7)3N
* where
g e g + go(1.-cga l (8
with
g~(k,Z) ZUDk)fl)
10
. . . . . . .. ..

7 77w..i
In Eq. (9), e (j) is the band energy in VCA and {Ua,(')) satisfy the following Eigen
equation:
'!
Because the a matrix has only two nonzero elements, the matrix inversion in Eq. (8) is
obtained analytically.
A substantial reduction in computer time is made possible by using an analytical
continuation method.(32) In this method, E, and E. are calculated as a function com-
plex Z, and then, using the analytical properties of the self energy and Green's functions,
they are interpolated for real Z. Because the functions E., E., and G are smooth for
complex Z, the CPA iterations and BZ integrations can be carried out with substantially
less computer time. U
For the concentration x -0.10 and x - 0.50, the L and X(A) gap respectively are
preferred. The L to X(A) crossover takes place near x ; 0.15. The CPA correction to
L and X edges at x = 0.10, 0.15, and 0.50 should be good enough to study the quantita-
tive variation of band gap in SixGeix alloys. Hence, the calculations are carried out for
these three cases. In addition, because the experimental results are available for x
0.109, CPA calculations are also done here for comparison. As expected, E, is much
larger than Ep for all the cases. The self energy as a function of energy is plotted in
Fig. 2 for an x = 0.50 alloy.
1].
-. "
11
"2' a)
C. Off-Diagonal CPA
As mentioned earlier, silicon and germanium differ in their lattice constant by
-4%. In order to include the effect of the structural disorder, the CPA calculation is
repeated next with off-diagonal (OD) disorder included. By an application of the molec-
ular coherent potential approximation (MCPA)(3 3 ), Hass et al. included OD disorder in
the CPA calculation of A' XA' I 1-,B semiconductor alloys.(34) Assuming that B atoms
occupy the sites of an ordered zinc-blende virtual lattice, they modeled the dominant
structural effect as the difference in A' -B and A' ' -B hopping matrix elements. Hence,
the chemical and structural disorder effects are treated as random variations of eA, V1 ,
V2A , where the symbols have their usual meaning.( 3 5)
The extension of the method to Si.Gej_ alloys is not straightforward, mainly "
because silicon and germanium can occupy both sublattices; hence, there can be no
ordered virtual lattice in this case. If we choose the tetrahedral unit cell as the molecu-
lar unit for MCPA, we see that the disorder is not cell diagonal. However, by choosing -
an appropriate basis set, we can make the intercell interaction be the highest order
effect. We start with a hybrid basis h->i obtained from the sp3 hybrid orbitals.(35) (-
The hybrids 1 through 4 (i = 1-4) are obtained from orbitals centered on a sublattice I-
site, and the states 5 through 8 (i = 5-8) are those from the orbitals located at the four
nearest neighbor sites on sublattice 11. The Bloch basis states, corresponding to A1, T 2
symmetries, j k >j located on an I-site (i 1-4) and Il-site (i 5-8) are obtained from
the corresponding hybrid states given by the relation
I>i cj I, >, (10)
I. ° -12
.. . . . . . .. . . . . . . .
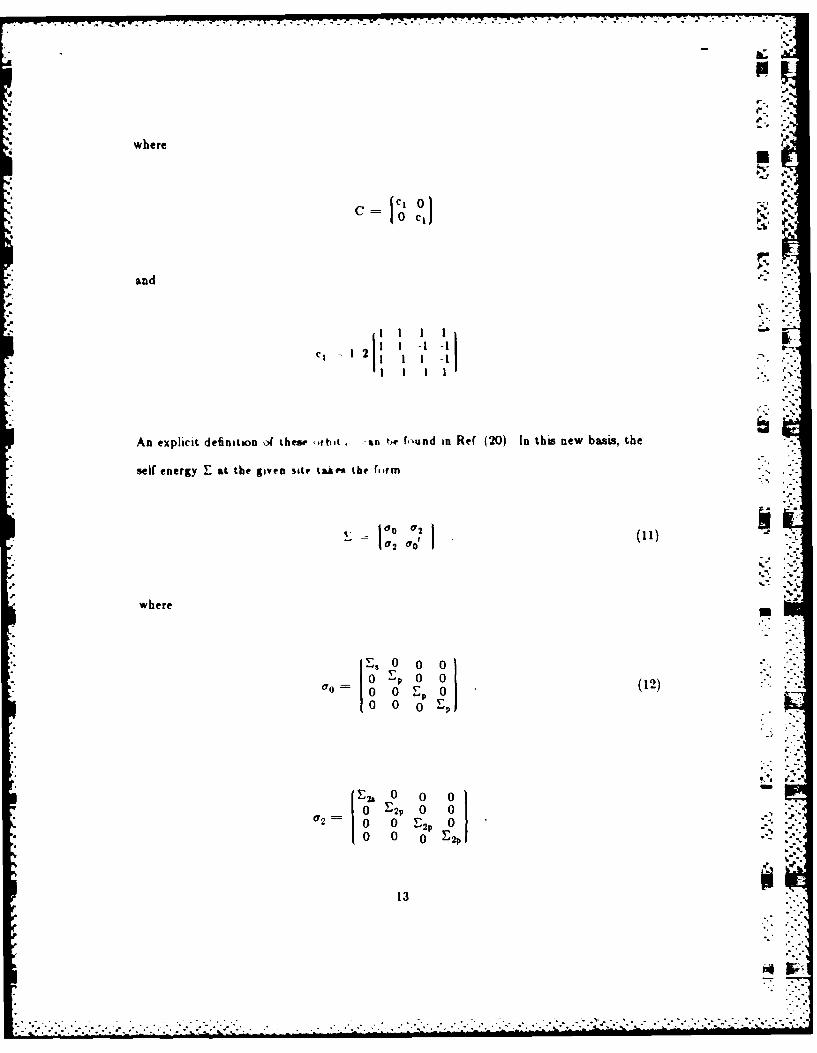
where
0 C%
and
C, 1 2 1 11 1 :
,; A n explicit de finit on 4 the se ,,fb it -n t, e ,und in R ef (20) In this new b ais, the . .
self energy E at the iven site ta e th, f,,rm "- -
"
where
I I ] "
0 0 0 (12)
JE2t. 0
-
0o E2o 0 0,a20 00 E2
o" 01 (122 [ 0 0 0 -
0 0 0 2p
13
,41,.-°,

01 0 oh 01Lb 0
O o L%
and
Lb _ 1(3E. .Ej)(34
The self energies can be obtained again from the IATA iteration procedure.
where
Z -E.(ZX)
with
+Ri E)Q =E(Z,i)Q
<«T>> x <TA >+y<TB>
14

r n r r ~ .fl '' ..
and
< .,> 4 " X3 3, tAA + 4 tA A S<TA> = x tA, + 4xy tAAB + 6x2 y2 t"A,. + 4.. A Si .(116) l
with a similar expression for <TB>. Physically, for a given A atom at the center, the
other four atoms in the molecular unit cell can be all A atoms, 3 A atoms and 1 B atom,
2 of each I A atom and 3 B atoms, or all four can be B atoms. <'i, > or <TB>
represents the configuration-averaged t-matrices, and < <T> > is the concentration-
weighted average of the configuration. By exploiting the symmetry, as seen in Eq. (11),
one can reduce this problem to solving two 2x2 coupled matrix equations. Eq. (14) can
be iterated to obtain E., EPI, E, and E2p. After every iteration, we get a new set of ,
E., Ep , E2p, and Eh': The new set has not been tested to see if Ehb is still given
by Eq. (13). In our calculation, we did not iterate to obtain a new Eh' instead we fixed
it by the relation given in Eq. (13). The error introduced by this approximation is n
expected to be very small. As in the case of diagonal CPA, the computation can be sub- - -
stantially reduced by the method of analytical continuation.(32) -
--
IV. DISCUSSION
A. E0 and El Optical Transition
The VCA values of E0 (r,. - F25 ) and Eo' (F1 s - r 2 ) and their measured . -
values are plotted as a function of x in Fig. l(e). Because the measurements(36) are " ,
made at room temperature, the experimental values are smaller than the values
15
.. . -.. ,-..,-. ... .. ,.....-.-..-.--..,..-.-........-,.- . -.......... --.--........-..

which are not present in our calculations, is expected to form a more accurate basis for .. .
comparison with the experiments. As seen from Fig. 1(e), the theoretical and the experi-
mental values both have a linear variation with x. Similar calculations of El (LI, - LYs)
also have a linear variation on x and are in qualitative agreement with experiments.(36)
From the CPA self energies E. and E p, it is straightforward to calculate the correc-
tion to the VGA bands. The calculated complex band structure is plotted for x: 0.50
in Fig. (3). The CPA corrections are shown only in the vicinity of the band gap. The
shaded portion represents the half-width of that energy state. Because s-scattering is
dominant in these alloys, we see that the major disorder lies in the conduction band.
The topmast valence band, with its rich p-content is least affected. The CPA band
structure is used to calculate the E0 and E, peak positions for x t0.10, o0.10, 0.15, and
0.50 concentrations. The calculations and the data from Reference (36) show a small
bowing that is not seen on the scale of Fig. 1(e).
The self energies E,, 2ps and E2, are calculated in MCPA for the x 0.50
alloy. As in the case of CPA, the self energies associated with s-symmetry are much
larger than the ones associated with the p-symmetry. While E2 is found to be very
small, E2p is at least an order of magnitude smaller-almost zero. However, the ImE,
obtained by CPA and MCPA differ considerably. As seen from Fig. 4, the difference .
increases as one goes away from the band edge. Therefore, the lifetime associated with
the alloy disorder is decreased by the inclusion of OD structural disorder. In addition,
the OD disorder lowers the conduction band, introducing an extra bowing. The
E and El values are reduced by 27 and 12 meV respectively. The VGA, CPA, and
MCPA values of Eo and E, are listed in Table 1i.
16
...............................--..... .... ... .. ,
.-'
The half-width of the alloy states is calculated from the imaginary part of the
CPA self energies. The half-width of the lowest-lying conduction band of Si.sGe0.s alloy
is plotted in Fig. 5 as a function of K. in the [1001 direction. The calculated half-width .
is 186 meV for the r21 state and decreases to zero at the band edge. Because of the
negligible alloy broadening of the topmost valence band state, the half-width correspond-
ing to the E0 transition, A(E 0 ), is 186 meV, which is approximately one-half of the previ-
ously published CPA results.(13) The CPA value of the half-width corresponding to the ",
El transition, A(EI), is 31 meV. Because of the increase in the imaginary part of the self --
energies, the MCPA values of the half-widths of the E0 and El transitions are 206 meV
and 32 meV respectively. Because the complete E0 peak is not shown in the published
electroreflectance spectrum(36), it is difficult to estimate the corresponding half-width.
However, one can conclude from the spectrum of the x = 0.458 alloy that the half-width
of the El transition is considerably smaller ( " 50 meV) than that of the E0 transition.
The agreement between the experimental and the theoretical values can be regarded as
good because there are errors in estimating the width from the published spectra, and we . -
have neglected the extrinsic broadening due to the apparatus used in the experiments.
In order to make a more accurate comparison with the experiments, the CPA
values of A(E 0 ) and A(EI) are calculated for the x 0.109 alloy. The calculated half-
widths of the E0 and El transitions are 13 and 2 meV respectively. From the spectrum,
we estimate the corresponding values to be 8 to 15 meV and 3 to 6 meV. We see that
CPA values are in excellent agreement with these experiments. Because x is small, the
inclusion of off-diagonal disorder is not expected to change the calculated values- .
significantly.
17
SI
• , .

B. Energy Gap
The fundamental gaps of these alloys are calculated as a function of concentration.
The VCA gap is an increasing function of x with a slope discontinuity at x - 0.11. The -.. ,
conduction band minimum changes from L-point to X(A)-point at this crossover. In %
addition to the band gap, the effective electron masses and the band edge Ko are also
calculated. When the X(A) gap is preferred, the band edge moves linearly from
at (0.9,0,0),,i0.15 to (0.8,0,0).,_j. The effective masses at a given minimum increase
linearly from their pure germanium values to the corresponding pure silicon values. MW
Using CPA self energies, the band gap, band masses, and the band edge are also
calculated. The position of the band minimum did not change by virtue of the inclusion
of off-diagonal disorder. While the effective transverse mass remains almost the same as
the VCA value, the longitudinal mass has a maximum of 12%/ enhancement. Because
the real part of CPA self energies is negative in the forbidden gap region, an extra bow-
ing is introduced to the VCA energy gap. Because of this bowing, the L-X(A) crossover
takes place near x - 0.13. The VCA, CPA, and experimental(36) bowing parameters
are 0.06, 0.18 and 0.24 respectively. The calculated energy gap is plotted as a function
of x in Fig. 6.
Because of the negligible change in the effective masses, the corresponding values in
the pure materials are used in the calculation of the alloy-scattering-limited electron
mobility. The CPA X-gap E9x and L-gap E9L are fitted to a polynomial form. The gen-
eralized Brooks' formula that is applicable to the alloys with an indirect gap and multi-
pie bands is used.(15) The calculated electron drift mobility and the experimental Hall
mobility(l) are plotted in Fig. 7, where the theory explains the qualitative behavior of .
experimental results.(1) As observed,( 5 ) even a few percent alloy concentration can
reduce the drift mobility substantially. It can be seen that the rate of decrease near ", -
18
. * . . . . .. . . . . . . ..

0 and x = I are quite different. This is because the L-edge has more s content than the
X-edge. Because the s scattering is dominant in these alloys, the L electrons are scat-
tered more than the X electrons. Precisely for this reason, one observes a dip in the '.
mobility near the L to X(A) crossover. For x < 0.13, the minimum gap is the L gap.
After the crossover, the minimum gap is the X(A) gap, and the reduced alloy scattering
increases the average mobility. For still larger x, the mobility decreases because of the
increased alloy disorder. All these features are clearly seen in Fig. 7. While our calcula-
tions include the inter-valley scattering mediated by alloy disorder, the effect of other
scattering mechanisms is expected to increase the dip near the crossover.
The calculated alloy scattering rate for the holes is several orders smaller than that
for the electrons, because (1) the valence band edge has dominant p content, (2) the p-
scattering parameter (A( , 0.21) is only 1/7 of Aes, which alone decreases the scatter-
ing rate for holes by a factor of 50, and (3) finally, the imaginary part of the self-energy 4.
is proportional to the density of states, which approaches zero at the band edge. Hence,
the hole mobility in this system is insensitive to alloy disorder.
In MCPA, the conduction band is pushed down, because of an increase in the ima-
ginary part of the self energy, giving rise to an additional bowing in the fundamental:.3gap. For an x = 0.50 alloy, the gap is reduced by 7 meV. The bowing parameter,
including the MCPA correction, is 0.21, which is in excellent agreement with
experiment.(37 )
It is interesting to compare the results of our calculations with those of Hass et
al.(34) In their calculations on the Gal-In.As alloy, CPA introduced an extra bowing in
the fundamental gap. However, after the MCPA corrections, the total scattering was
diminished and the results were similar to VCA results. These results were explained in
terms of the relative strength and sign of the atomic term values and V2 • We extend
19 '
-.
.-...• .... . ................................................................................................. 2 2 '2

their argument to SixGei. x alloys. The hybrid level of silicon is higher than that of ger-
manium. Because of its shorter bond length, the V2 of silicon is larger than that of ger-
manium. Thus, in this case, both effects combine to give more disorder in the conduc-
tion and valence bands. Therefore, the scattering is enhanced in these alloys. This
explains the increase in the imaginary part of the self energy due to inclusion of OD
disorder in our calculation.
In conclusion, we have incorporated both chemical and structural disorder into the
calculation of the CPA band structure of SixGei-x alloys. The calculation, based on a
realistic band structure of silicon and germanium, suggests that the band gap is an
increasing function of x with a slope discontinuity at x - 0.13. The linewidths of the -
E0 and El transitions calculated by CPA and MCPA are in good agreement with experi-
ments. Addition of the structural disorder to the diagonal CPA decreases the band gap
slightly but increases the s-part of the self energy considerably over certain energy
- -ranges. The calculated alloy-scattering-limited electron-drift mobility is in qualitative
agreement with the observed Hall mobilities.
ACKNOWLEDGMENTS
This work was supported in part by Grant AFOSR-84-0282 and DARPA/AFOSR
PR: FQ8671-851100. A.-B. Chen would like to thank Professor W.E. Spicer for his hos-
pitality at Stanford University.
.4 ,-0
20""°-, • o .
* .. '
REFERENCES
IM. Glicksman, Phys. Rev. 111, 125 (1958); Phys. Rev. 100, 1146 (1955).
2 B.A. Bunker, S.L. Hulbert, J.P. Stotl, and FOC. Brown, Phys. Rev. Lett. 58, 2157 V
(1984).
3 H.J. Lee, L.Y. Juravel, and J.C. Woolley, Phys. Rev. B21, 659 (1980).
4 N. Lifshitz, A. Jayaraman, and R.A. Logan, Phys. Rev. B21, 670 (1980).
5 H.M. Manasevit, 1.S. Gergis, and A.B. Jones, Appi. Phys. Lett. 41, 464 (1982); J. Elec.
Materials 12, 637 (1983).
6 S. Krishnamurthy and J.A. Moriarty, Superlattices and Microstructures 1, 209 (1985);
Phys. Rev. B in press (1985).
7 j.C. Bean, L.C. Feldman, A.T. Flory, S. Nakahara, and I.K. Robinson, J. Vac. Sci.
Technol. A2, 436 (1984).
8 R. People, J.C. Bean, D.V. Lang, A.M. Sergent, H.L. Stormer, K.W. Wecbt, R.T.
Lynch, and K. Baldwin, Appi. Phys. Lett. 45, 1231 (1984).
9 F. Cerdeira, A. Pinczuk, and J.C. Bean, Phys. Rev. B81, 1202 (1985).
1 0 T.P. Pearsall, F.H. Pollak, and J.C. Bean, Bull. Am. Phys. Soc 30, 266 (1985).
1 1 K.E. Newman and J.D. Dow, Phys. Rev. B330, 1929 (198-1).
12NI.Z. Huang and W.Y. Ching, Superlattices and %ficrostructuresi 1, 137 (1985).
La
21
1166600"
........ .~ . -
-. A
13 D. Stroud and H. Ebrenreich, Phys. Rev. Be, 3197 (1970).
1 4 S. Krishnamurtby, A. Sher, and A.-B. Chen, Phys. Rev. Lett., in press (July 1985).
15S. Krishnamurtby, A. Sher, and A.-B. Chen, Appi. Phys. Lett., in press (1985).
16 A.-B. Chen and A. Sher, Phys. Rev. B2, 3886 (1980).
1 7 E.O. Kane, Phys. Rev. BIS, 3478 (1976).
18 D.J. Chadi, Phys. Rev. B16, 3572 (1977).
19 A.-B. Chen and A. Sher, Phys. Rev. B23 5360 (1981).
2 0 A...B. Cheui and A. Sher, Phys. Rev. B!26, 6603 (1982).
2 1 R.R.L. Zucca, J.P. Walter, Y.R. Shen, and M.L. Cohen, Solid State Commun. 8, 627
(1970).
2 2 R.R.L. Zucca and Y.R. Shen, Phys. Rev. BI, 2668 (1970).
23 M. Welkowsky and R. Braunstein, Phys. Rev. B5, 497 (1972).
2 4 R.A. Pollak, L. Ley, S. Kowalcyzk, D.A. Shirley, J. Joannopolos, D.J. Chadi, and M.L.
Cohen, Phys. Rev. Lett. 29, 1103 (1973).
2 5L. Ley, R.A. Pollak, F.R. McFeely, S.P. Kowalcyzk, and D.A. Shirley, Phys. Rev. B9,
600 (1974).
26W.D. Grobman and D.E. Eastman, Phys. Rev. Lett. 29, 1508 (1972).
2 7 D.E. Eastman, W.D. Grobman, J.L. Freeouf, and M. Erbudak, Phys. Rev. B9, 3473
(1974).
'22
28W.E. Spicer and R.C. Eden, Proceedings of the Ninth Inter national Con!. Ph pa. Semi-
conductors, 1968 (Nauka, Leningrad, 1969), Vol. 1, p. 61.
29G. W. Cobeli and F.G. Allen, Phys. Rev. A 245, 137 (1965).
3 0 j.R. Cheliskowsky and M.L. Cohen, Phys. Rev. B14, 556 (1976); and the references
cited therein.
3 1 J.A. Moriarty and S. Krishnamurthy, J. Appi. Phys. 54, 1892 (1983).
3 2 K.C. Hass, B. Velicky, and H. Ehrenreich, Phys. Rev. B29, 3697 (1984).
3 3 F. Ducastelle, J. Phys. C7, 1795 (1974). .
3 4 K.C. Hass, R.J. Lampert, and H. Ebrenreich, Phys. Rev. Lett. 5e, 77 (1984).
3 5 W.A. Harrison, Electronic Structure and the Properties of Solids,, (W.H. Freeman and
Co., San Francisco, 1980) p. 65.
3 6 j.S. Kline, F.H. Pollak, and M. Cardona, Helv. Phys. Acta. 41, 968 (1968). '.,
3 7 R. Braunstein, A.R. Moore, and F. Herman, Phys. Rev. 109, 695 (1958).
23
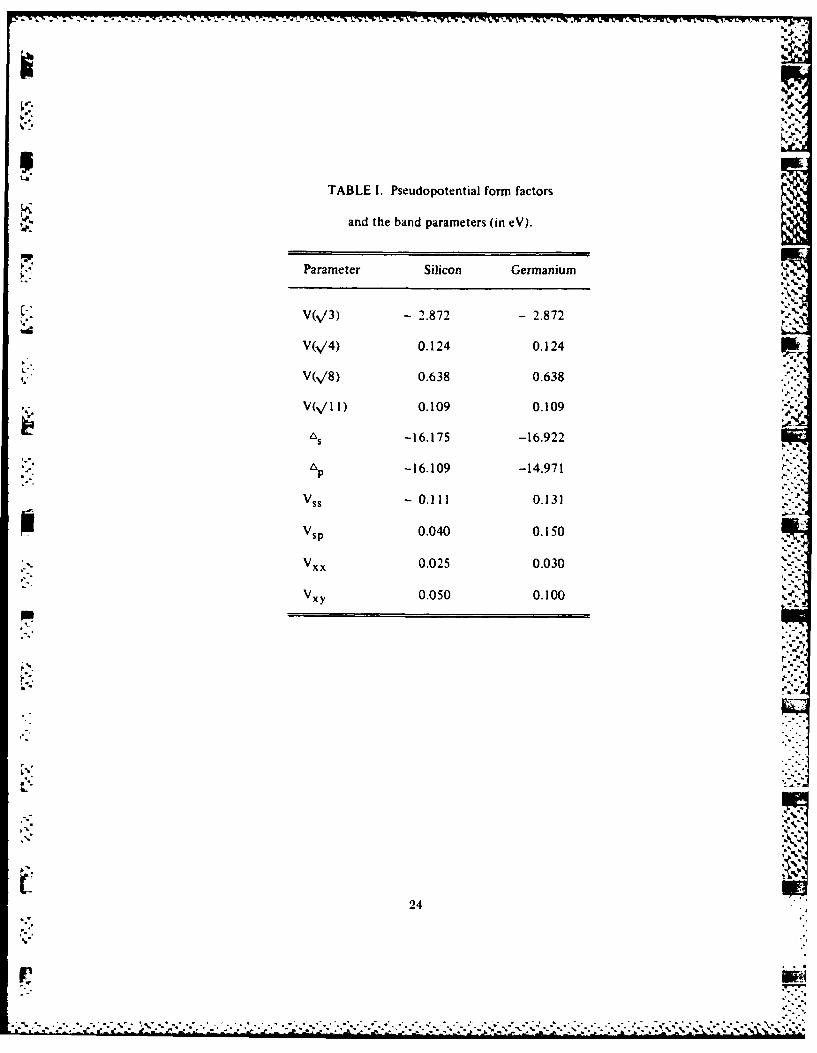
TABLE]1. Pseudopotential form factors
adthe band paaees(in eV).
Parameter Silicon Germanium
KV(, 3) -2.872 - 2.872
V4) 0.124 0.124
V(8)0.638 0.638
VV1) 0.109 0.109
LS-16.175 -16.922
-16.109 -14.971
v - 0.11! 0.131
*s 0.040 0.150
v 0.025 0.030 -
v 0.050 0.100
24

TABLE [1. Band structure of silicon and germanium U
(all energies are expressed in eV).
Silicon Germanium
Bands Calculated EXPTLa/EPMb Calculated EXPTLa/EPMb
r, -12.60 -12.4 ± 0.6 -12.56 -12.6 ± 0.3
L2 , -10.26 - 9.3 ± 0.4 -10.74 -10.6± 0.5
LI- 6.99 -6.8 ±0.2 - 7.65 - 7.4 ±0.3
X1v - 8.29 - 9.20
X4- 2.55 - 2.55
L3'v - 1.11 - 1.2 0.2 - 1.13 - 1.1 ±0.2
r 2 5 v 0.0 0.0 0.0 0.0
Lc2.24 0.76 0.763 i.-.
"2'c 4.10 4.00 ± 0.05 0.99 0.99
r- 5c 3.43 3.40 3.24
XIC 1.34 1.17 0.95
L3'c 4.34 4.16
E 1.11 1.11 0.76 0.76
K0 (0.8,0,0) (0.8.0,0) (0.5.0.5.0.5) (0.5.0.5.0.5)
mel 0.89 0.91 1.09 1.59
met 0.16 0.19 0.077 0.082
MV 0.35 0.50 0.28 0.34
(a) References 21-28 ., .
(b) Reference 30
4k.5
z?,'.

TABLE 11l. Calculated values of E0 . El and their respective half-widths
tA(E 0) and N~E, (all energies are in eV).
X Quantity VCA CPA MCPA
0.10 E0 1.290 1.248 -
qE)0.011 -
J. l2.016 1.995 -
NE0 ) 0.001 -
0.109 E0 2.028 2.009 -
j I(E0 ) 0.013 -
E 1 1.318 1.275 -
A(El) 0.002 -
j0.15 E0 1.442 1.382
NE 0.032 -
E,2.083 2.051 -
apnE 1 0.00-1-
0.50 EO 2.517 2.418 2.391
NE0 ) 0.186 0.206
E,2.578 2.510 2.498
'%(Ej 0.0308 0.0319 --
26
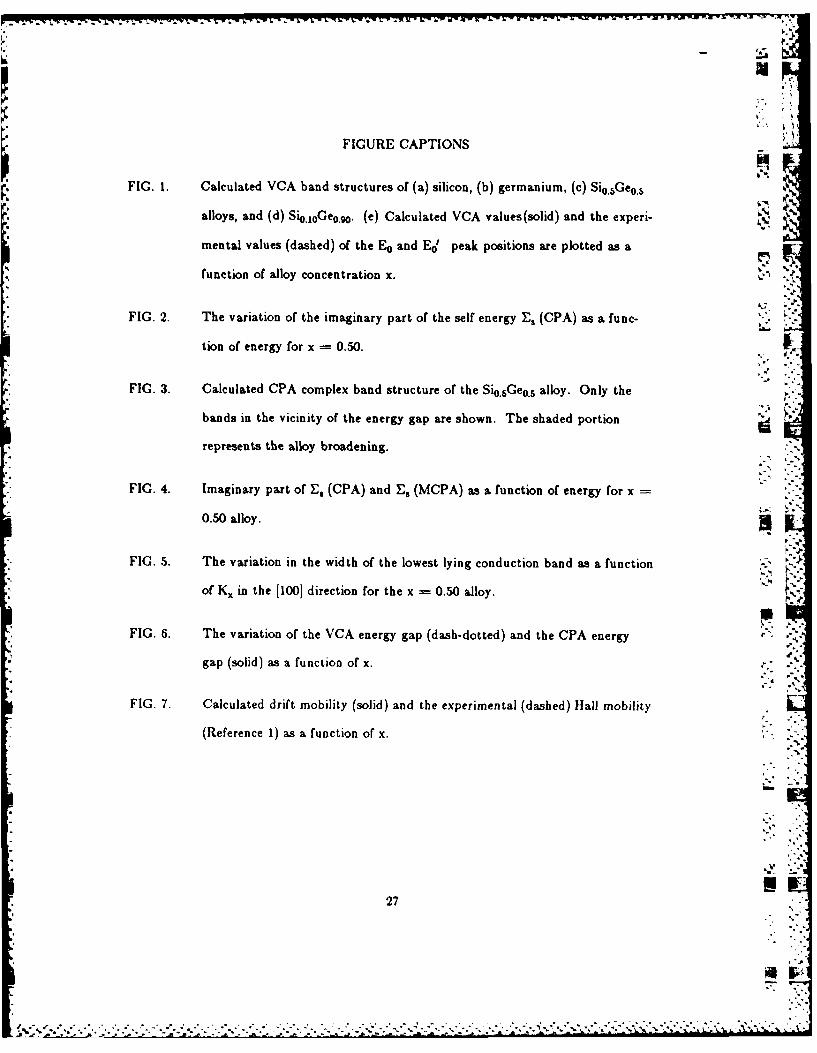
* ,j
FIGURE CAPTIONS
FIG. 1. Calculated VCA band structures of (a) silicon, (b) germanium, (c) Si0 .sGeo.s
alloys, and (d) Sio oGeog0 . (e) Calculated VCA values(solid) and the experi-
mental values (dashed) of the E0 and E0' peak positions are plotted as a
function of alloy concentration x.
FIG. 2. The variation of the imaginary part of the self energy E, (CPA) as a func-
tion of energy for x 0.50.
FIG. 3. Calculated CPA complex band structure of the Si0 .6Ge 0.s alloy. Only the
bands in the vicinity of the energy gap are shown. The shaded portion
represents the alloy broadening.
FIG. 4. Imaginary part of E, (CPA) and E. (MCPA) as a function of energy for x
0.50 alloy. 5
FIG. 5. The variation in the width of the lowest lying conduction band as a function '
of KX in the [1001 direction for the x = 0.50 alloy.
FIG. 6. The variation of the VCA energy gap (dash-dotted) and the CPA energy
gap (solid) as a function of x.
FIG. 7. Calculated drift mobility (solid) and the experimental (dashed) Hall mobility
(Reference 1) as a function of x.
27
A.
S. . .. .-.
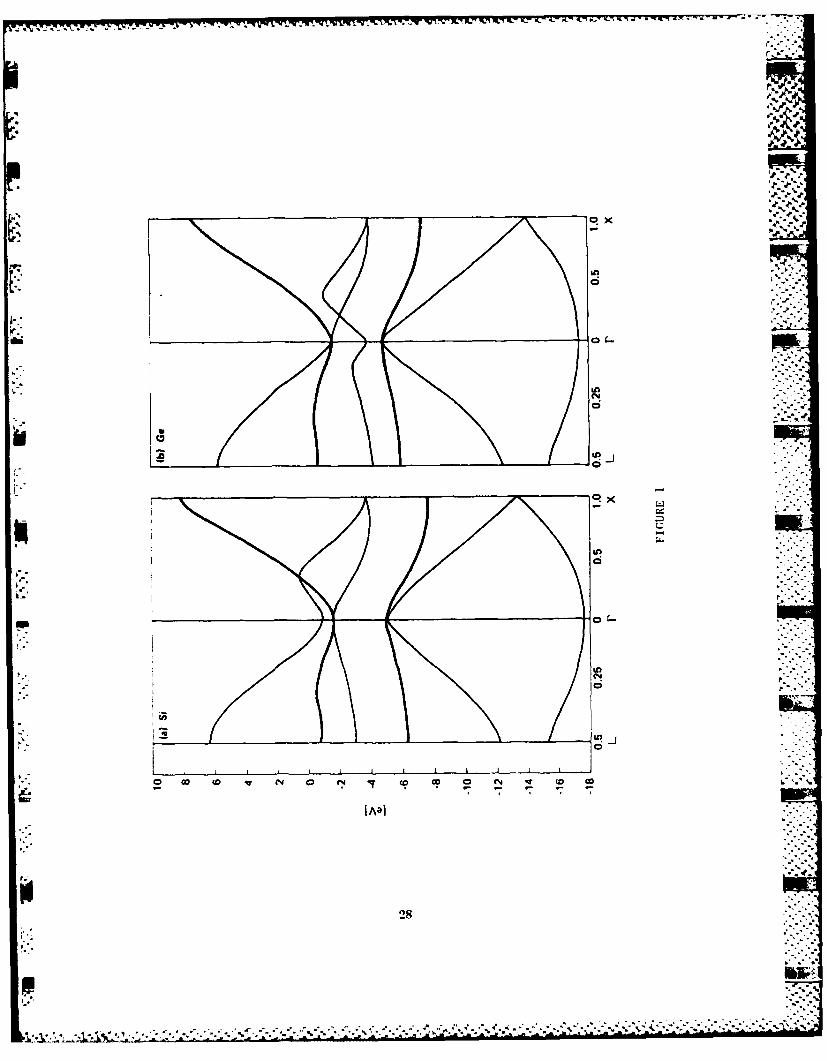
C!r x
5LD1
OX
CID ID e 0 C4 t
IA8]
28g

H.
Li
*..* *..I.
.6 *'. I..-. '..~h~
x
L
0
C,
.9
C0U
x .-. N
U
C,
o
U
-J
p.
W (0 ~ N 0 N ~ (0 ~ 0 N ~ CD m~.* - -
4 -P.I /~~J4
U.w 29 .
* SI
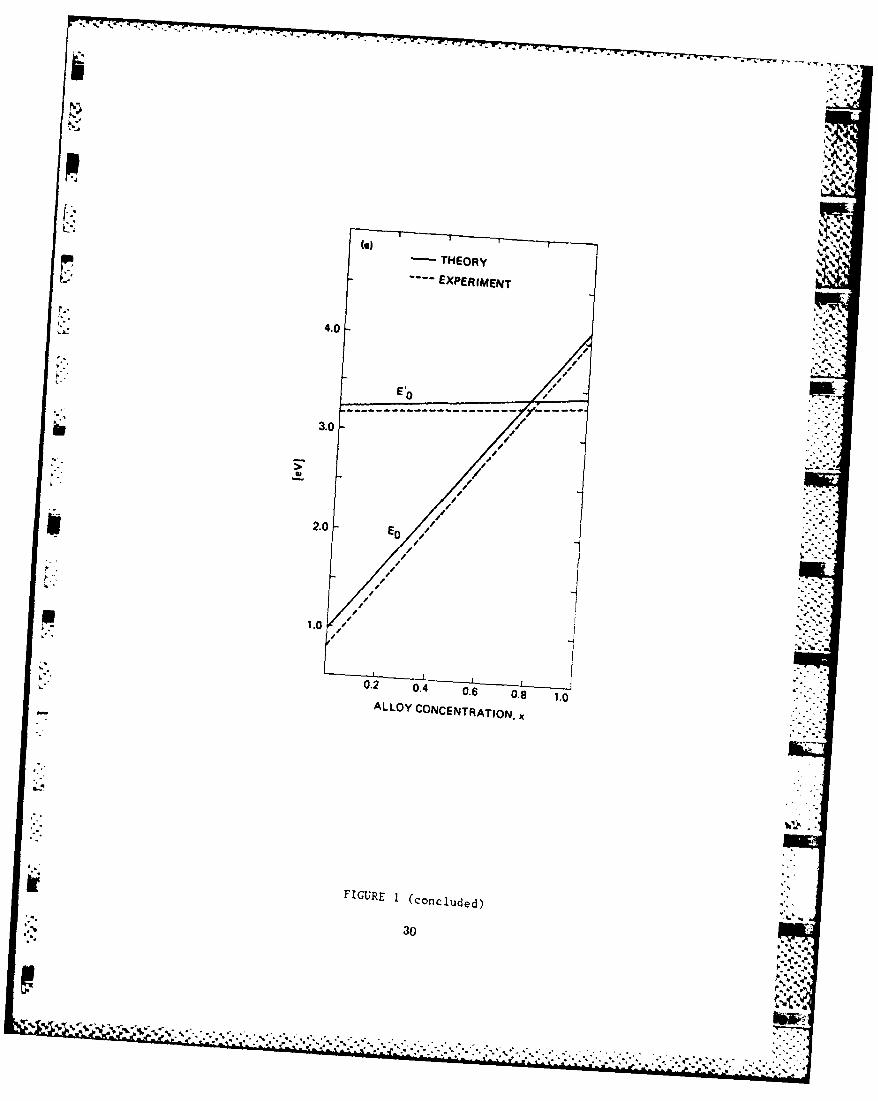
THEORYEXPERIMENT
4.04
3.0 J
&0.2 0.4 0.6 0.8 1.0- ALLOY CONCENTRATION. x
FIGURE I (concluded)
.3 30
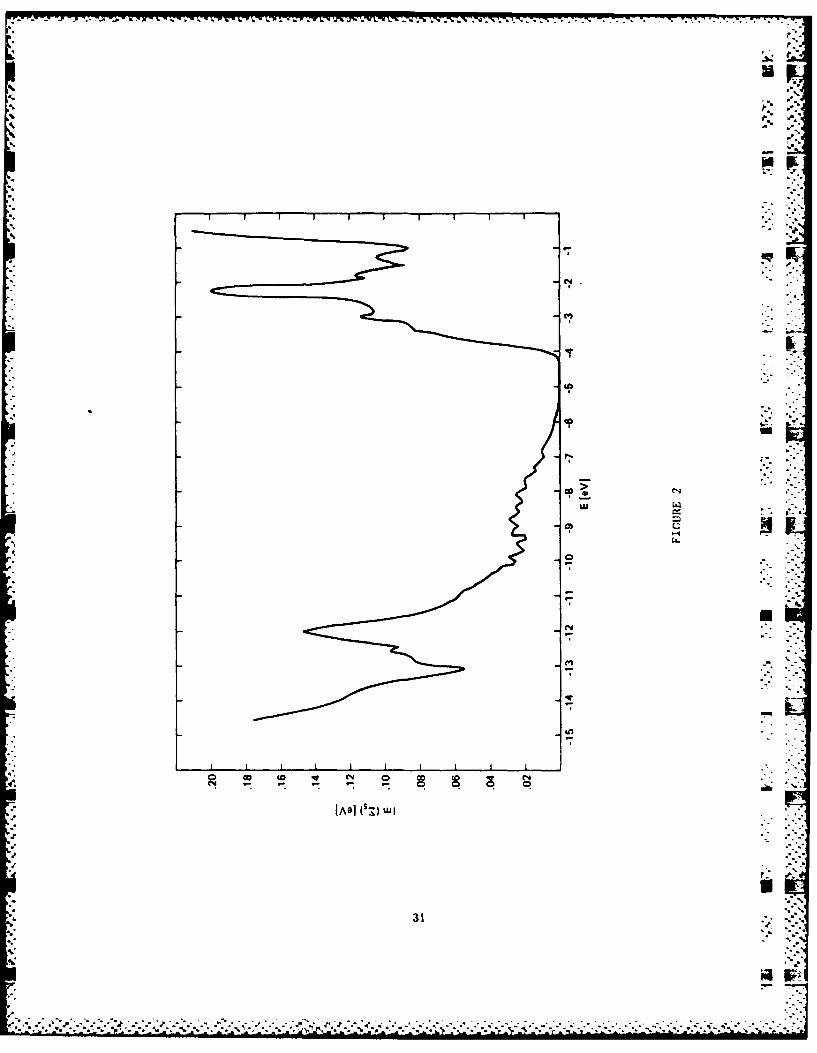
311

-2.4 -
-2.08-.
-2.4-
-2.8-
-5.2-
-6.4-
L\ N
FIGURE 3 ,-
32

W.~~~ P.- T.7-
I0.1"
0.170 ----- WITH OFF DIAGONAL
ONLY DIAGONAL //
K 'I0.10-I - -
0.05
0.01
-4.3 -4.0 -3.5 -3.0E [eV]
-4 I I
FIGLRE 4 d
33 ''
..................................................................

200
160-
L 120-
40-
0l0 0.2 0.4 0.6 0.8 1.0
Kx
p
bR6
FIGURE 5
34
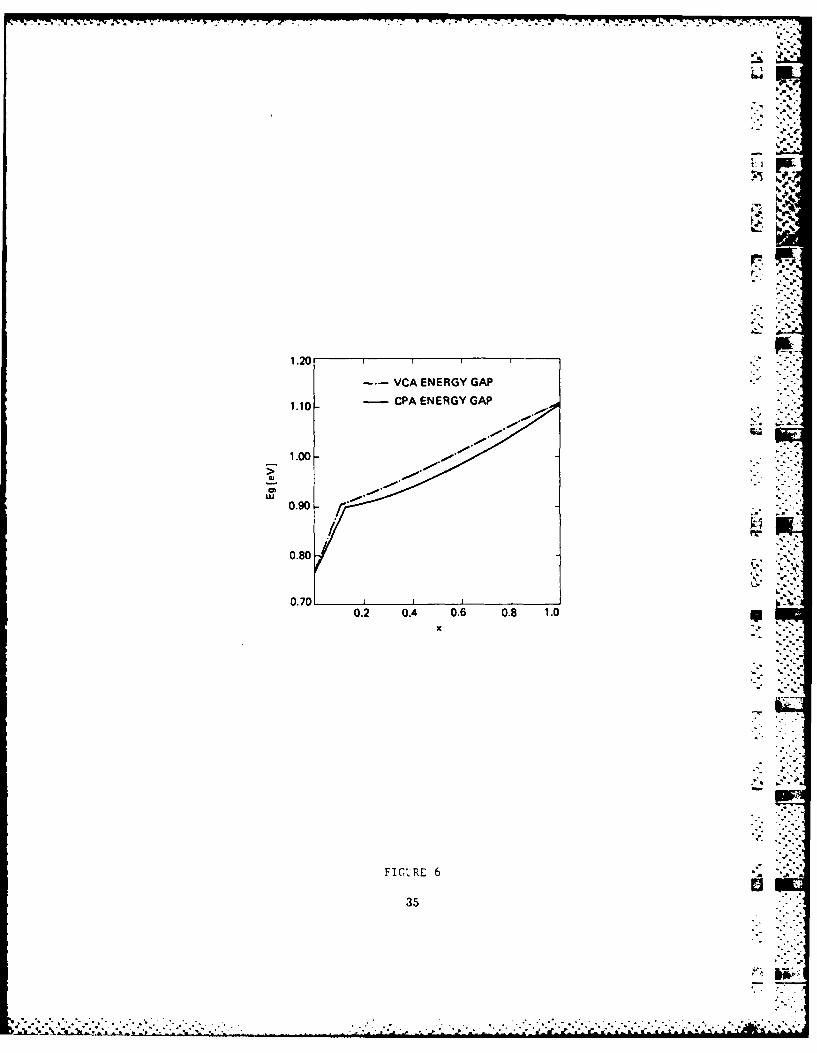
1.20
1.0.9
LL.
0.2C 0. 0. 0.8 1.
---VCA ENERGY GAP.-
1.10 - CPA ENERGY GAP
0.u -- i
0.80 r" ""
0.7 ILJ 1 A0.2 0.4 0.6 0.8 1.0n
%a.."
FIGULRE 6
35
......................*..*.-... .. -. :.--
-a, -.a .
- *- a . ..
..... .... .... .. a 1
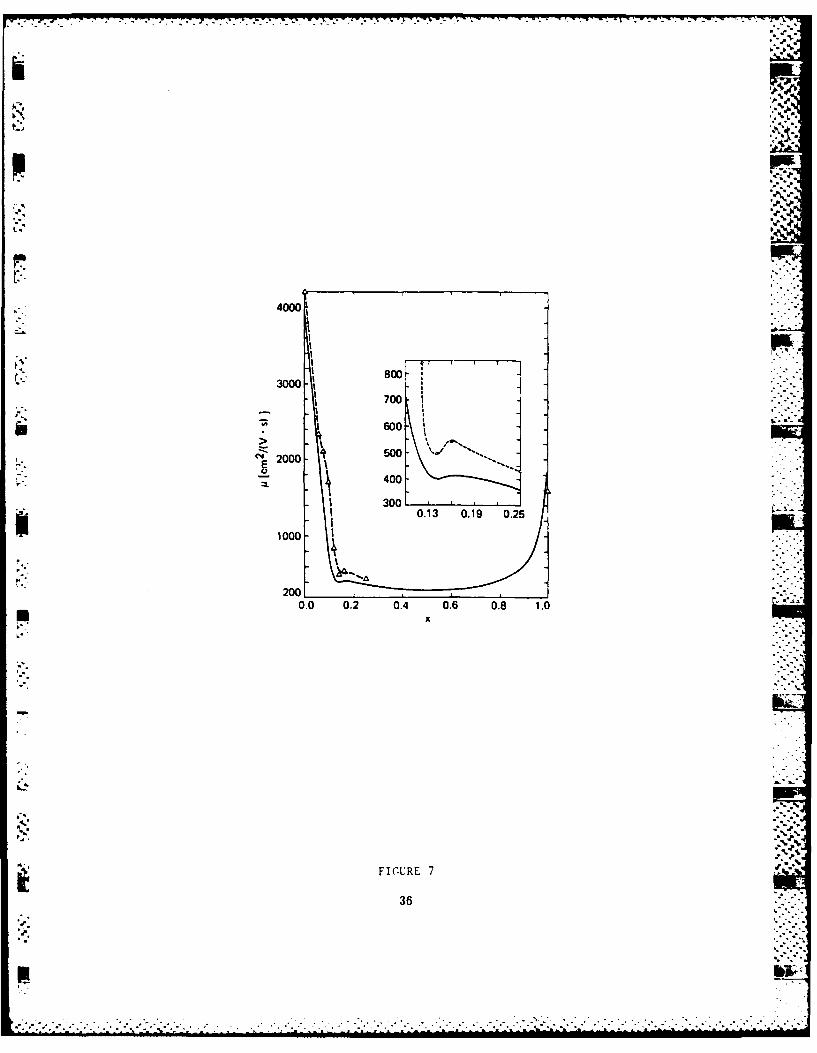
4000
3000w O~r800
700 1
- I 600-
~20O0 500
U 400
0.0 0.2 0.4 0.6 0.8 1.0
FIGURE 7
36

L ,1*
N
beeh.~"-
.1,
.1~
J.
%~ N
--- "be
~6~86N[
~k Id
/1 N.1'
'I, ~%
* ..