ieq-05 mls-gis
DESCRIPTION
EarthquakeTRANSCRIPT
Geographic Information System
M. L. Sharma
Department of earthquake Engineering
Indian Institute of technology Roorkee
Roorkee – 247 667
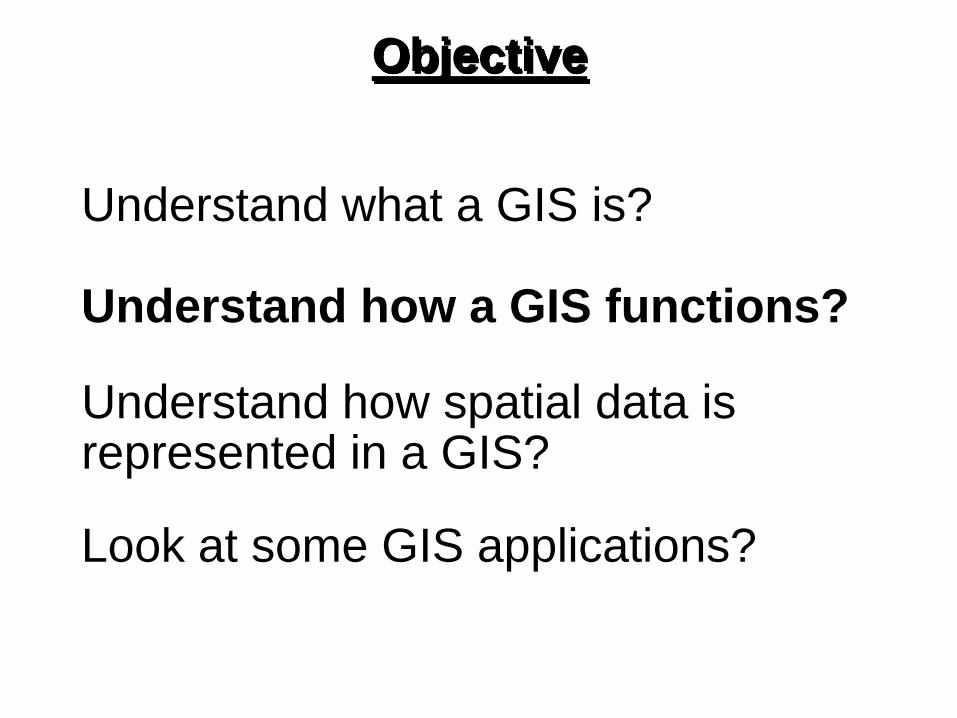
Objective
Understand how a GIS functions?
Understand what a GIS is?
Look at some GIS applications?
Understand how spatial data is represented in a GIS?
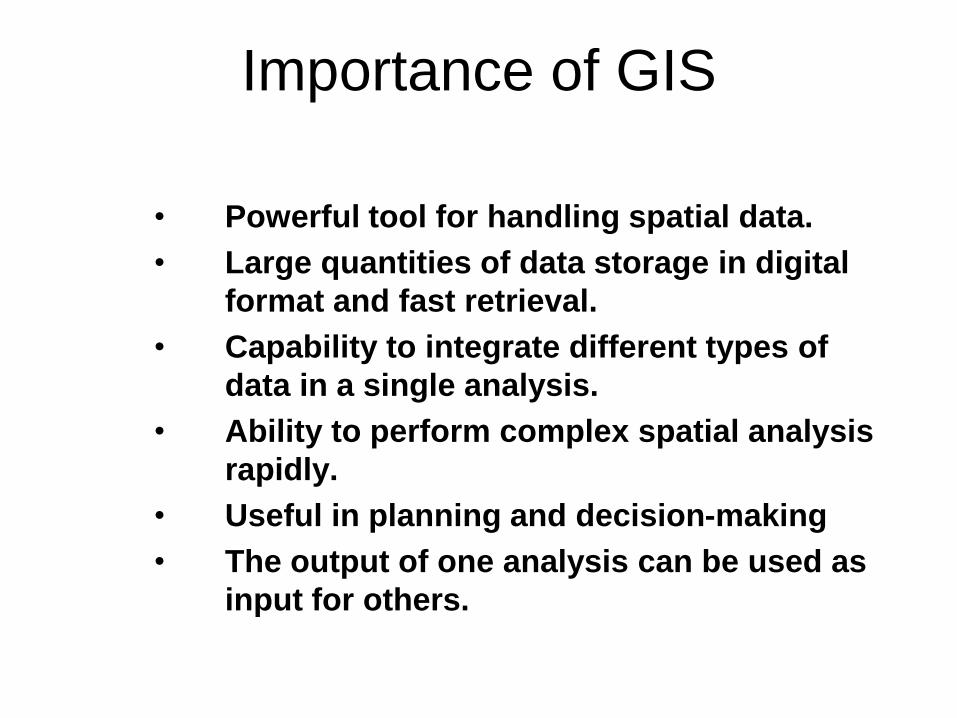
Importance of GIS
• Powerful tool for handling spatial data.
• Large quantities of data storage in digital
format and fast retrieval.
• Capability to integrate different types of
data in a single analysis.
• Ability to perform complex spatial analysis
rapidly.
• Useful in planning and decision-making
• The output of one analysis can be used as
input for others.
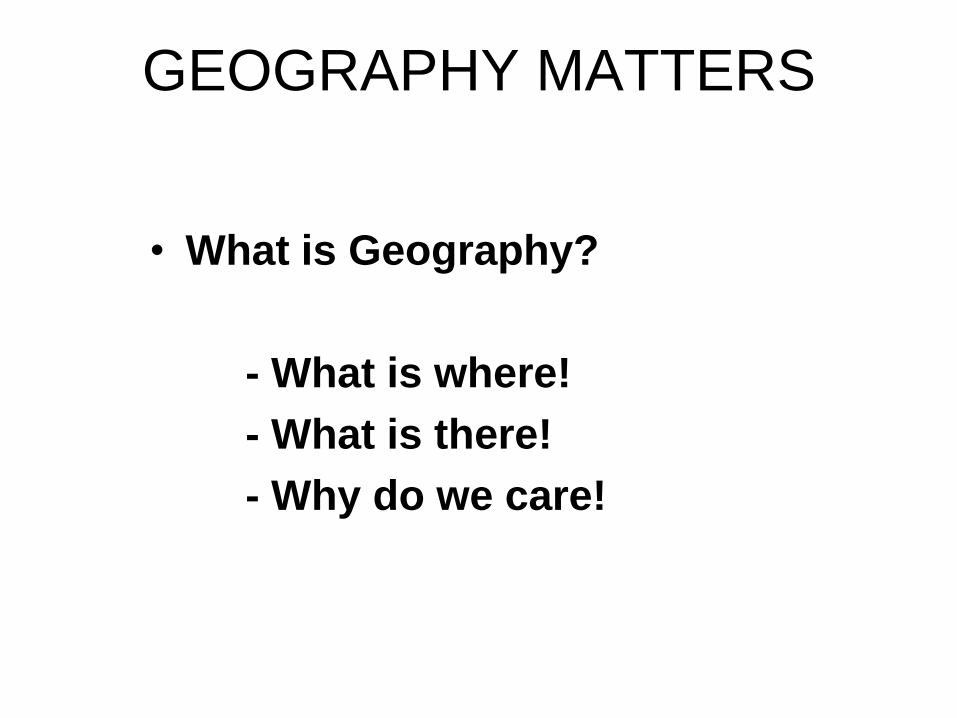
GEOGRAPHY MATTERS
• What is Geography?
- What is where!
- What is there!
- Why do we care!
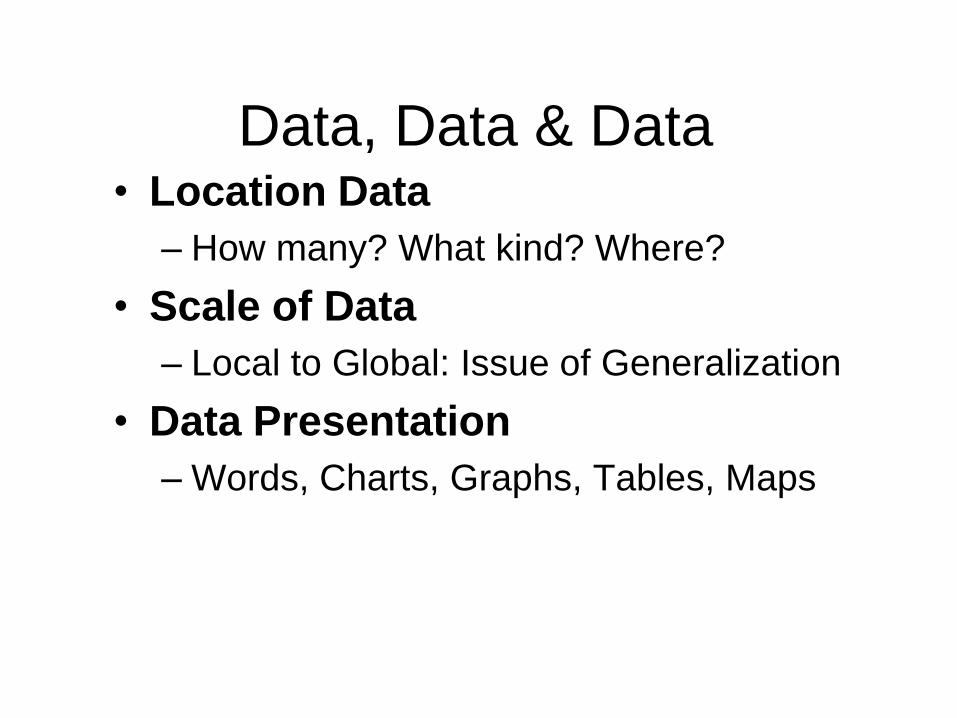
Data, Data & Data • Location Data
– How many? What kind? Where?
• Scale of Data
– Local to Global: Issue of Generalization
• Data Presentation
– Words, Charts, Graphs, Tables, Maps
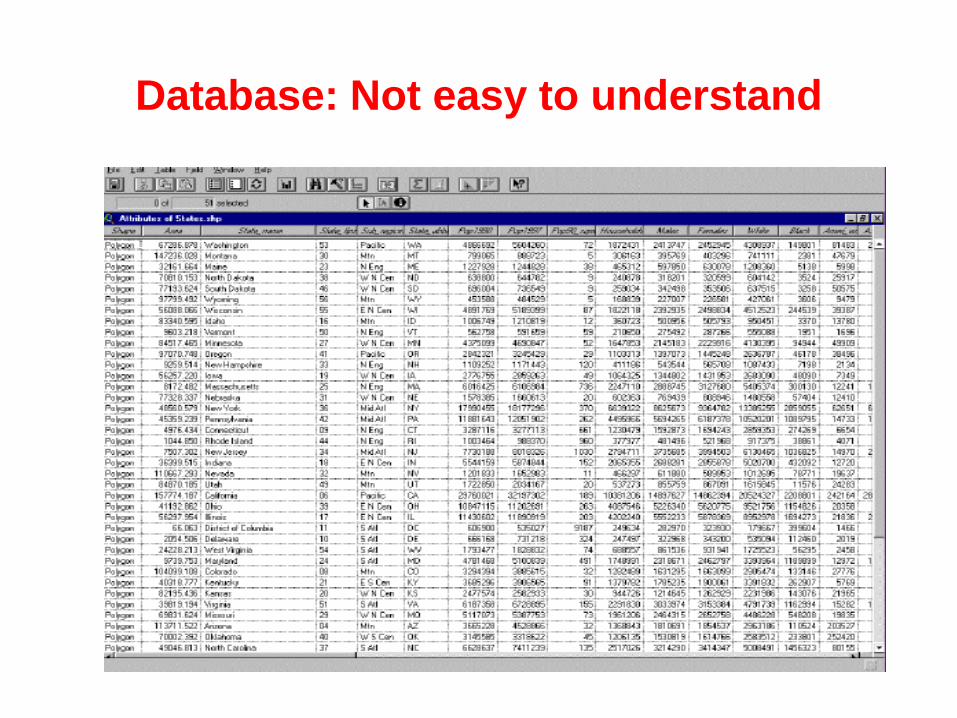
Database: Not easy to understand
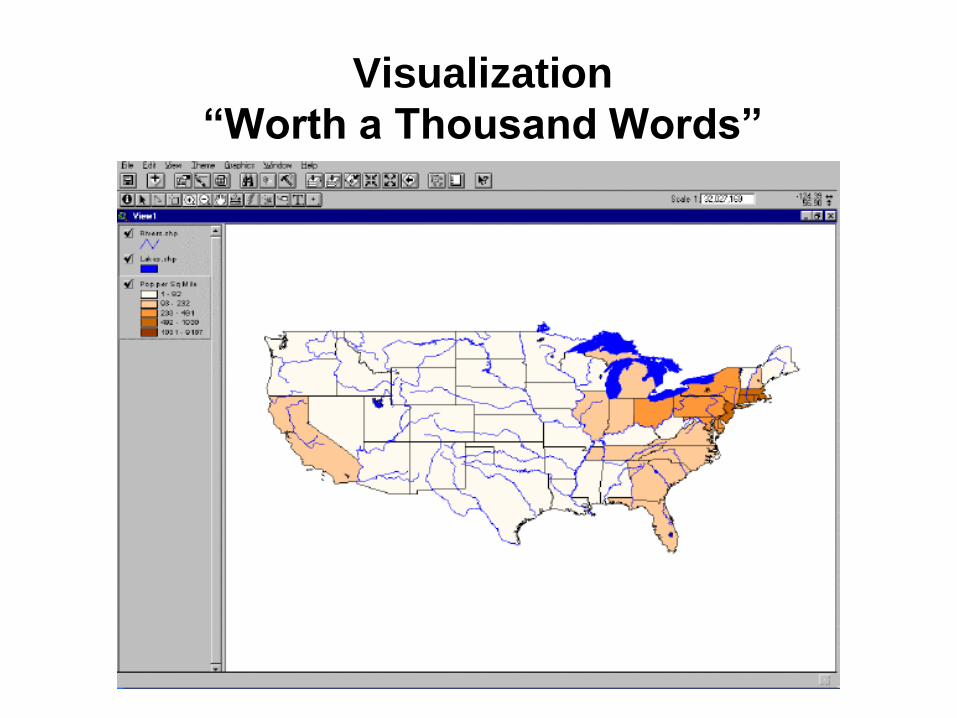
Visualization
“Worth a Thousand Words”
Exploring Data using GIS….
Turns Data into…..
Information and Knowledge
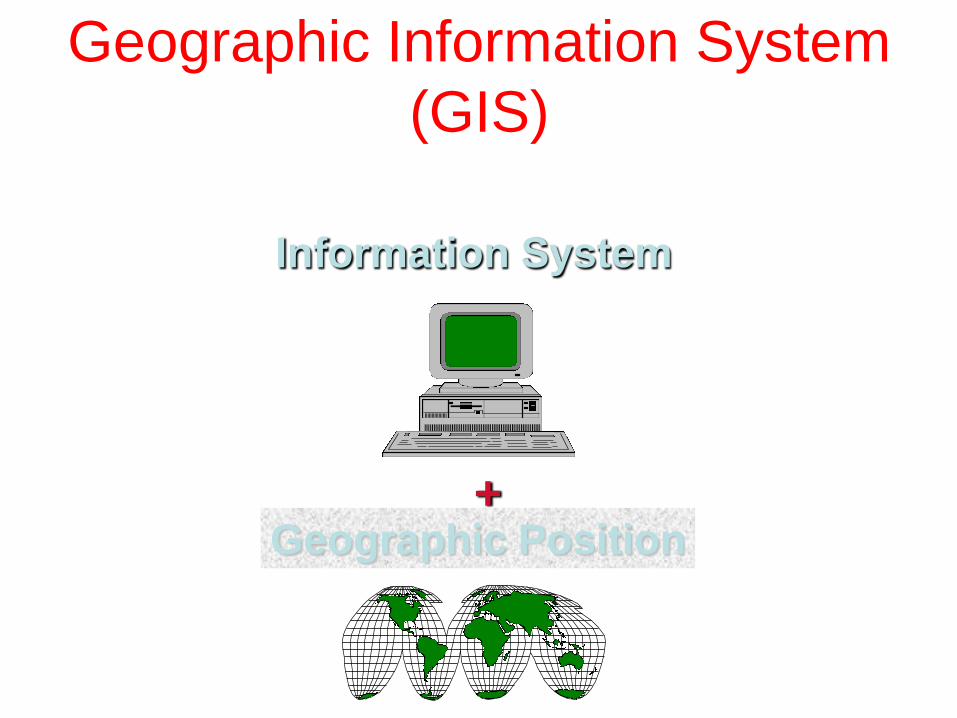
Geographic Information System
(GIS)
+
Information System
Geographic Position
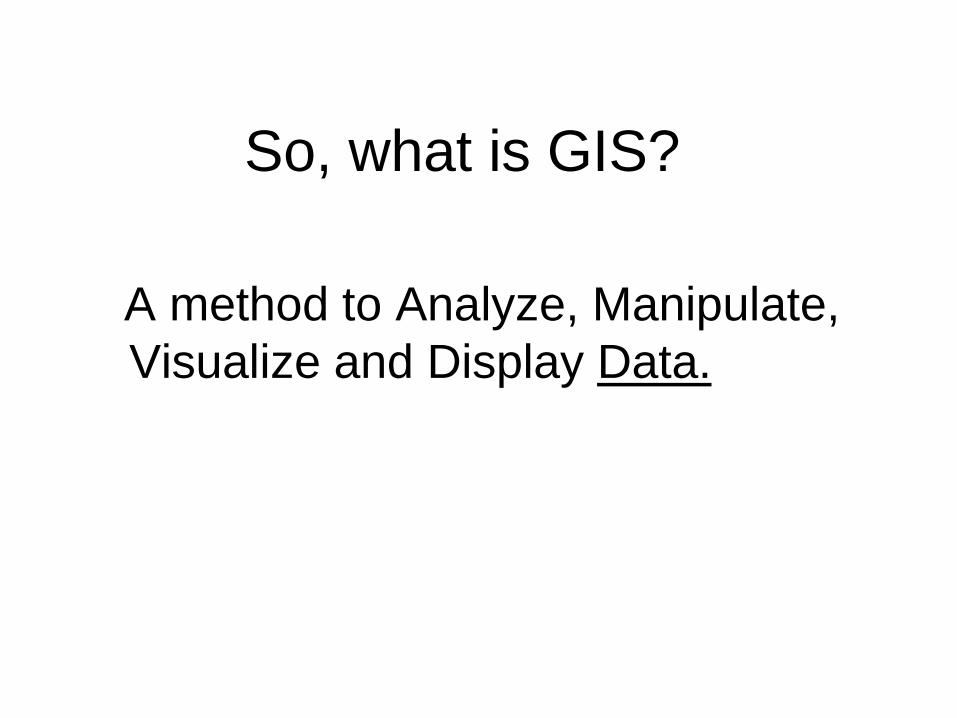
So, what is GIS?
A method to Analyze, Manipulate,
Visualize and Display Data.
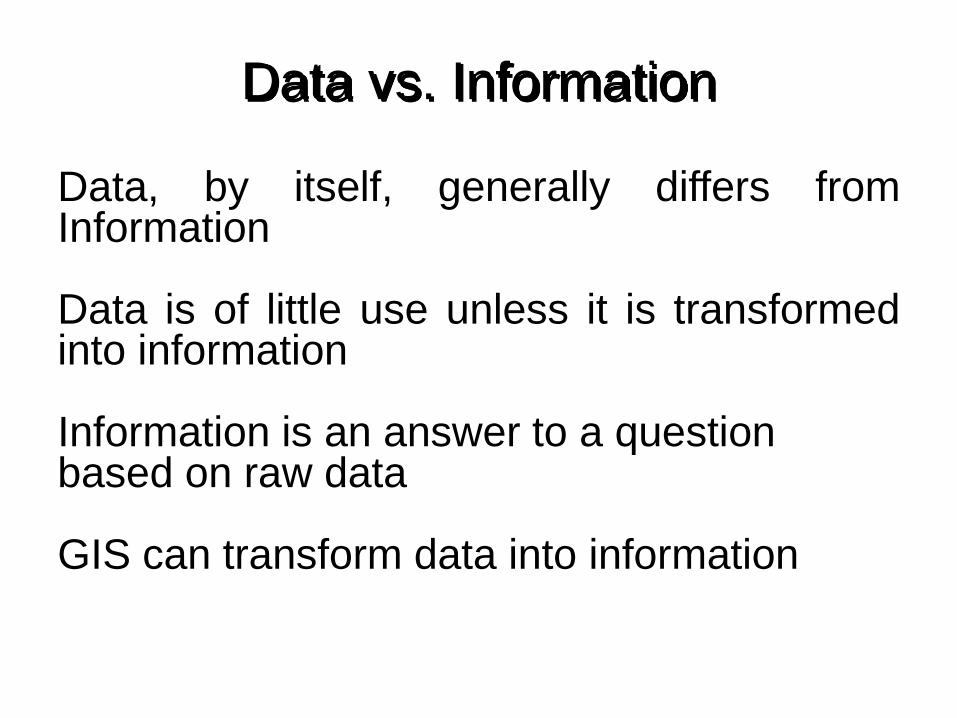
Data vs. Information
Data, by itself, generally differs from Information Data is of little use unless it is transformed into information Information is an answer to a question based on raw data GIS can transform data into information
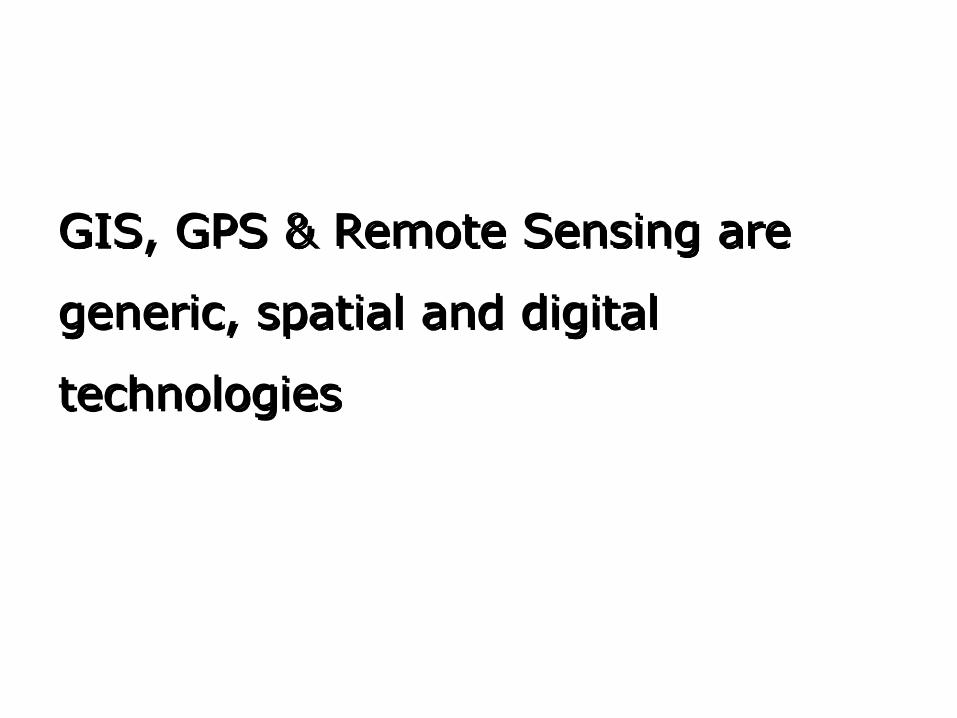
GIS, GPS & Remote Sensing are
generic, spatial and digital
technologies
13
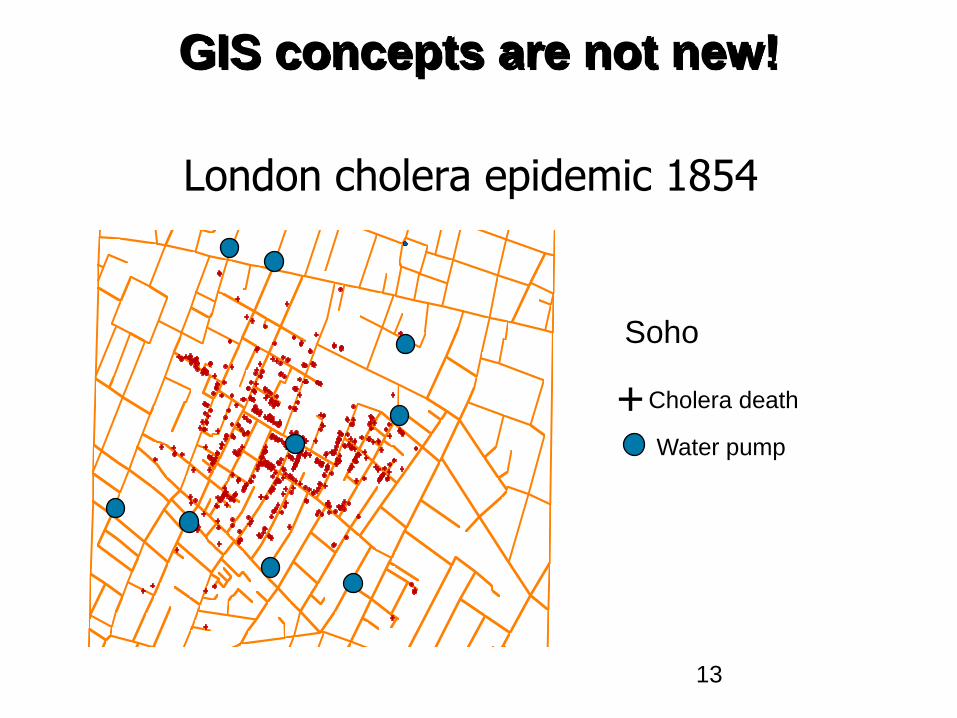
GIS concepts are not new!
London cholera epidemic 1854
Cholera death
Water pump
Soho
+
14
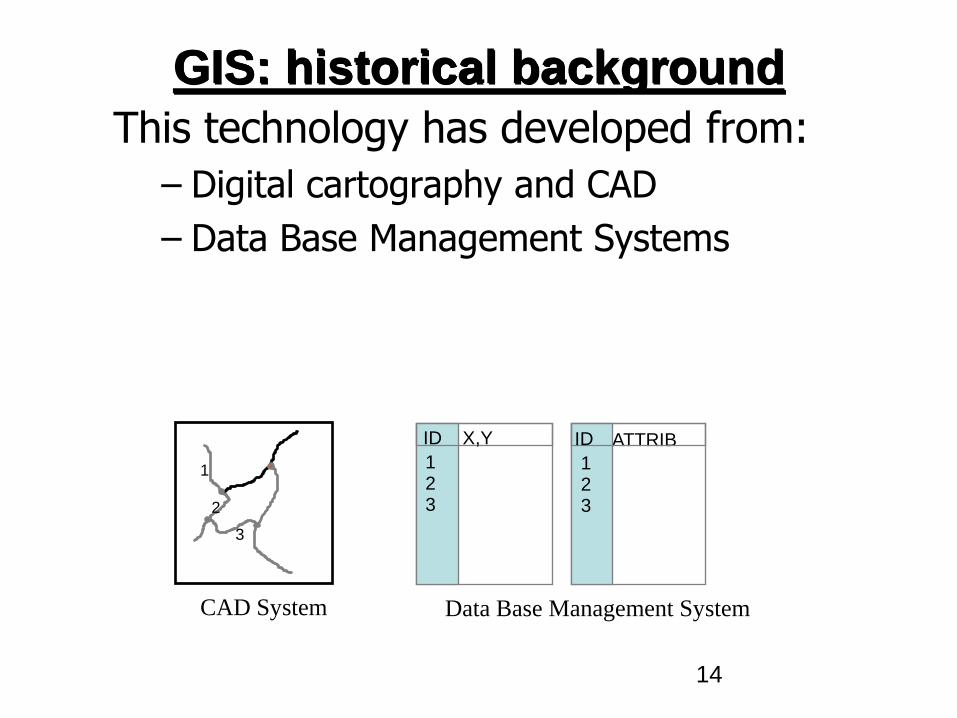
GIS: historical background
This technology has developed from:
– Digital cartography and CAD
– Data Base Management Systems
1
2
3
ATTRIB ID X,Y
1 2 3
ID
1 2 3
CAD System Data Base Management System
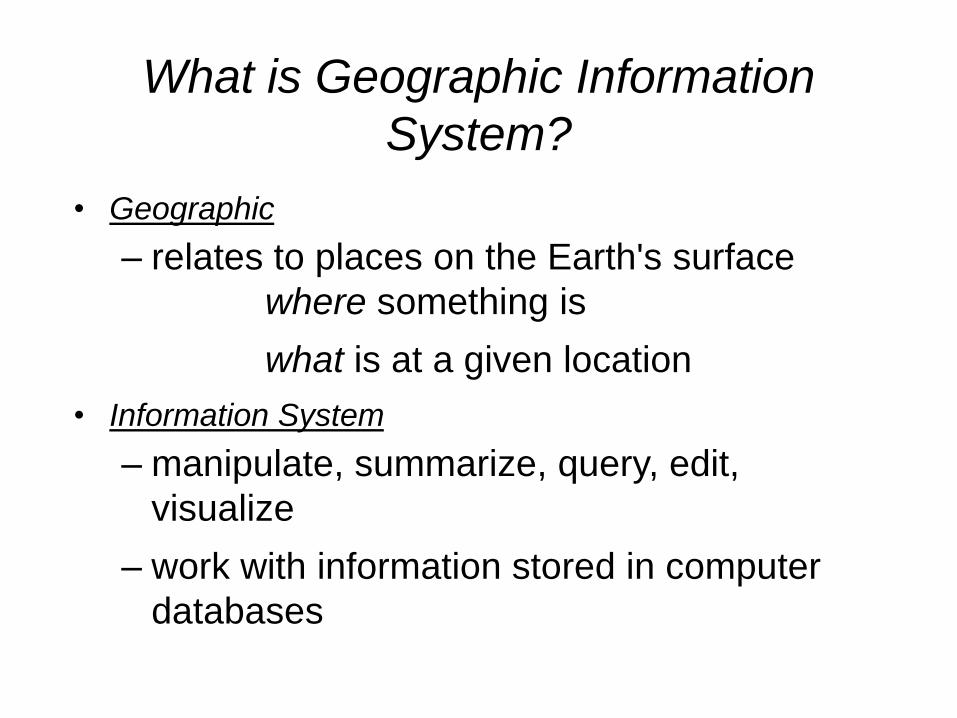
What is Geographic Information
System?
• Geographic
– relates to places on the Earth's surface
where something is
what is at a given location
• Information System
– manipulate, summarize, query, edit,
visualize
– work with information stored in computer
databases

GEOGRAPHIC INFORMATION
SYSTEM
• The collection of data about the spatial
distribution of significant properties of the
Earth‟s surface in the form of maps by
navigators, geographers, and surveyors has
long been an important part of activities of
organized society.
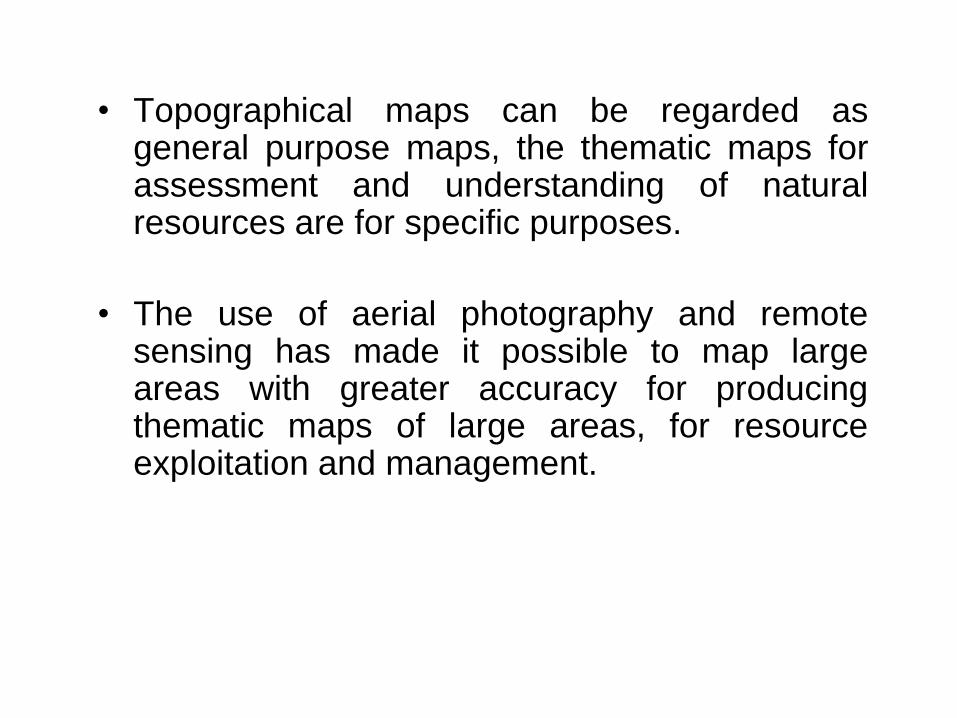
• Topographical maps can be regarded as general purpose maps, the thematic maps for assessment and understanding of natural resources are for specific purposes.
• The use of aerial photography and remote sensing has made it possible to map large areas with greater accuracy for producing thematic maps of large areas, for resource exploitation and management.
GEOGRAPHIC INFORMATION
SYSTEM
• Handling of large volume of data for
quantitative spatial variation of data requires
appropriate tool to process the spatial data
using statistical methods and time series
analysis.
• Introduction of computer assisted cartography, many new tools were developed to perform spatial analysis of the data and to produce maps in desired formats.
• These operations required a powerful set of tools for collecting, storing, retrieving, transforming, and displaying spatial data from the real world for a particular set of purposes.
• This set of tools constitutes a Geographic Information System (GIS).
DEFINITION OF GIS
• A Geographic Information System should be thought of as being much more than means of coding, storing, and retrieving the data about the aspects of earth‟s surface, because these data can be accessed, transformed, and manipulated interactively for studying environmental process, analyzing the results for trends, or anticipating the possible results of planning decisions.
• Geographical Information System is associated with basic terms, Geography and Information system. The literal interpretation of geography is „writing about the Earth‟. In writing about the Earth, geographers deal with the spatial relationship of land with man.
DEFINITION OF GIS
• A key tool in studying the spatial relationships
is the map which is a graphical portrayal of
spatial relationships and phenomena over a
small segment of the Earth or the entire Earth.
• On the other hand, an information system is a
chain of operations that consists of from
planning the observation to using the
observation-derived information in some
decision making process.
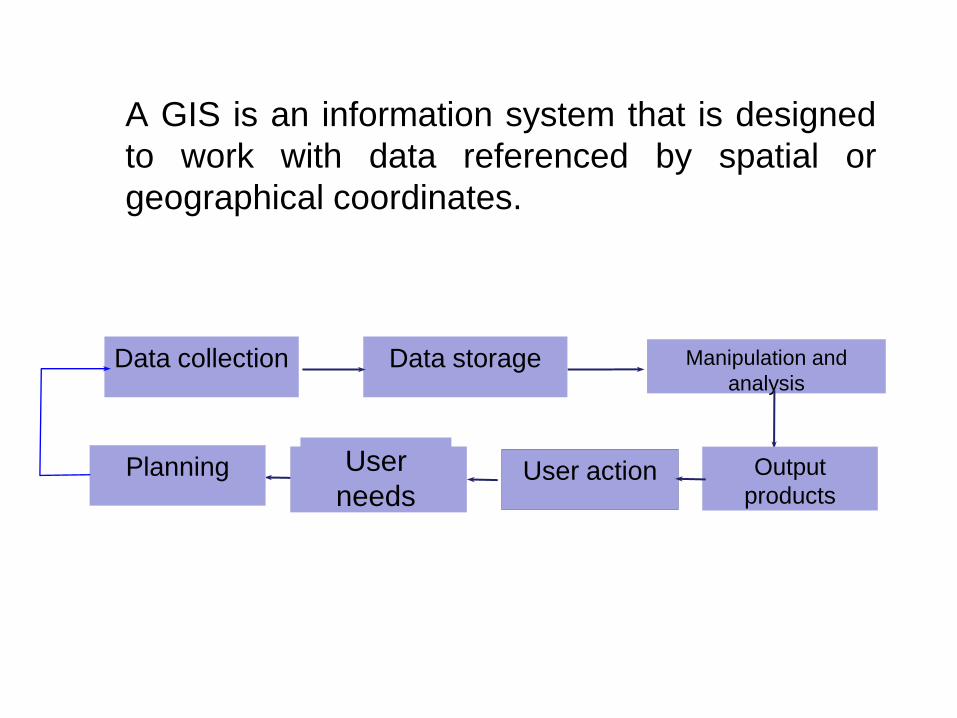
• A GIS is an information system that is designed
to work with data referenced by spatial or
geographical coordinates.
Manipulation and
analysis Data collection Data storage
Output
products User action Planning User
needs
DEFINITION OF GIS
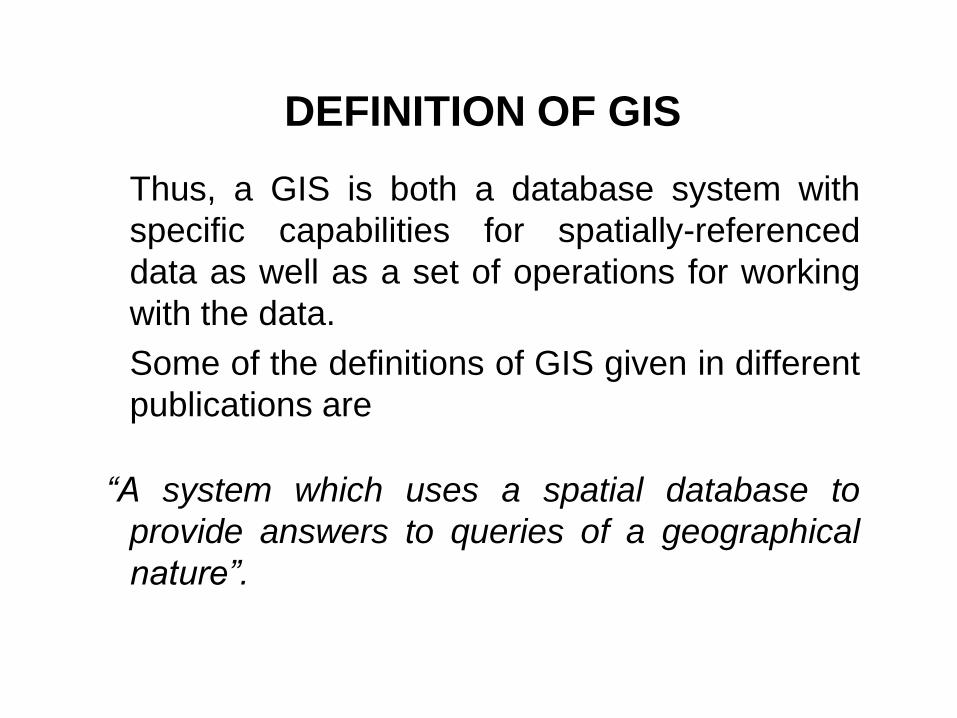
• Thus, a GIS is both a database system with
specific capabilities for spatially-referenced
data as well as a set of operations for working
with the data.
• Some of the definitions of GIS given in different
publications are
“A system which uses a spatial database to
provide answers to queries of a geographical
nature”.
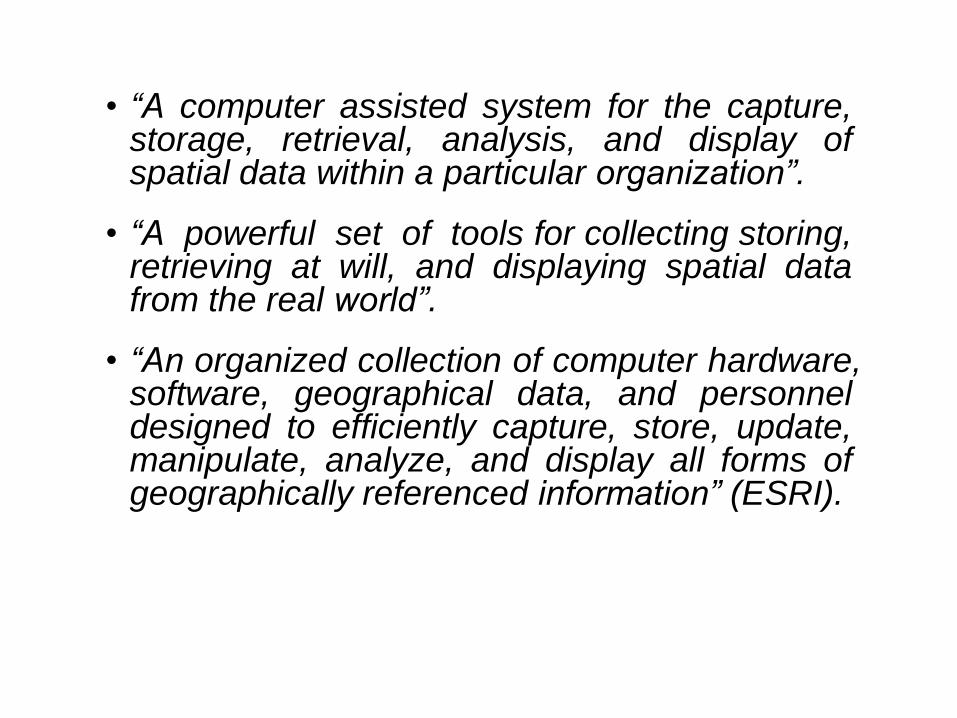
• “A computer assisted system for the capture, storage, retrieval, analysis, and display of spatial data within a particular organization”.
• “A powerful set of tools for collecting storing, retrieving at will, and displaying spatial data from the real world”.
• “An organized collection of computer hardware, software, geographical data, and personnel designed to efficiently capture, store, update, manipulate, analyze, and display all forms of geographically referenced information” (ESRI).
DEFINITION OF GIS
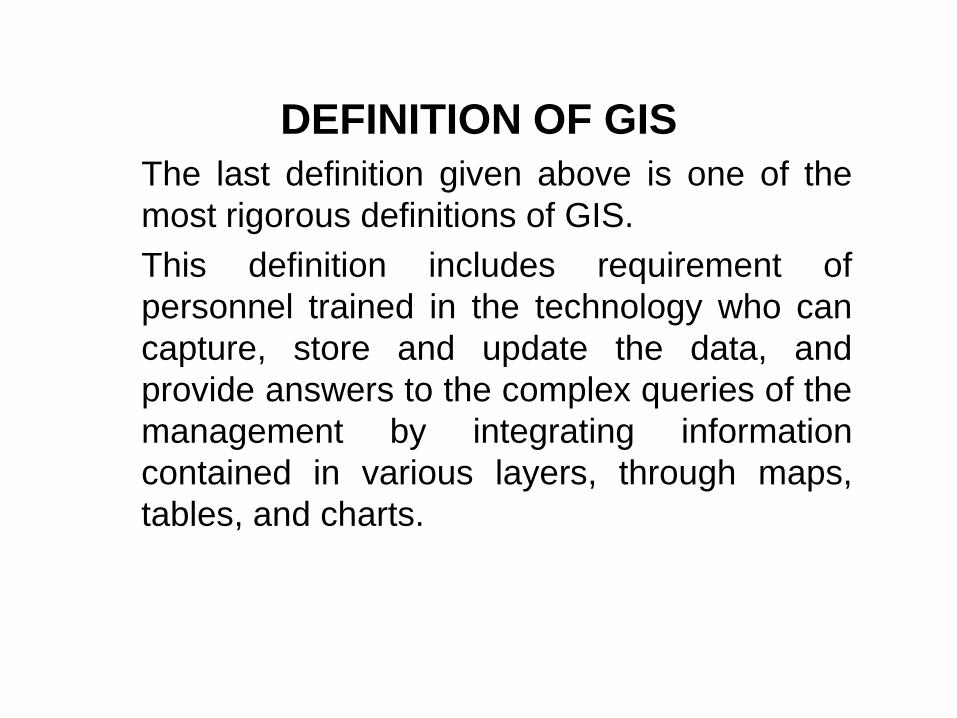
• The last definition given above is one of the
most rigorous definitions of GIS.
• This definition includes requirement of
personnel trained in the technology who can
capture, store and update the data, and
provide answers to the complex queries of the
management by integrating information
contained in various layers, through maps,
tables, and charts.
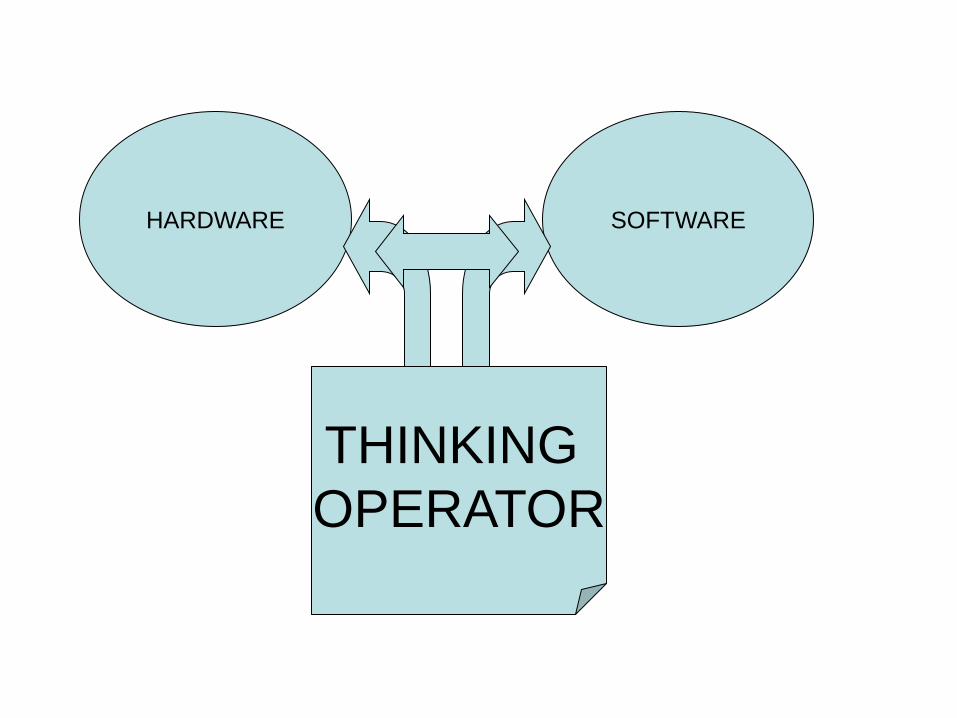
HARDWARE SOFTWARE
THINKING
OPERATOR
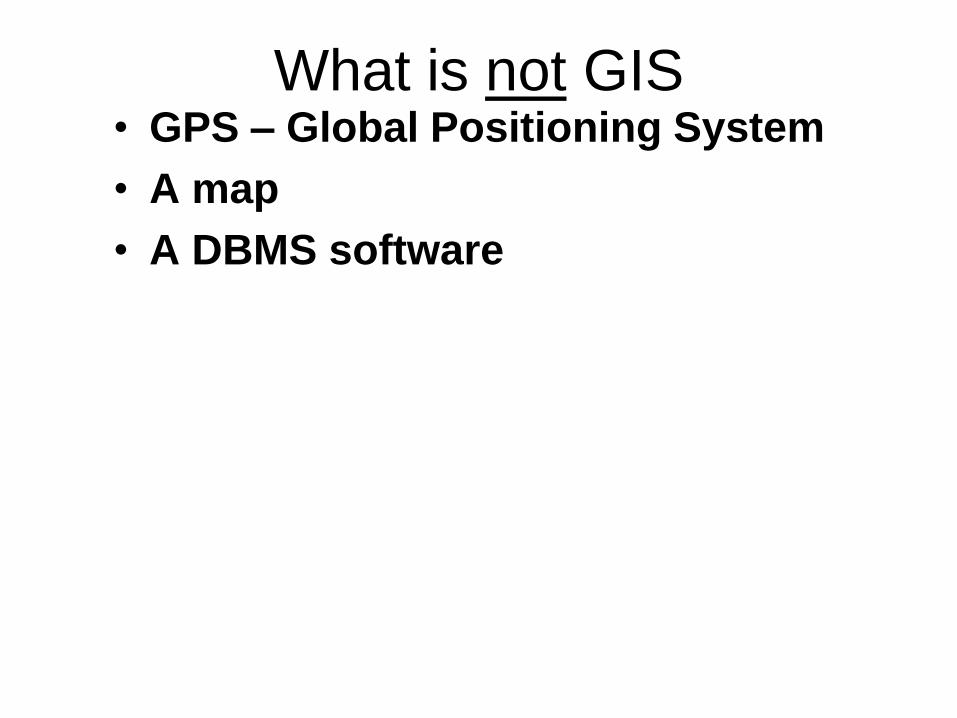
What is not GIS • GPS – Global Positioning System
• A map
• A DBMS software
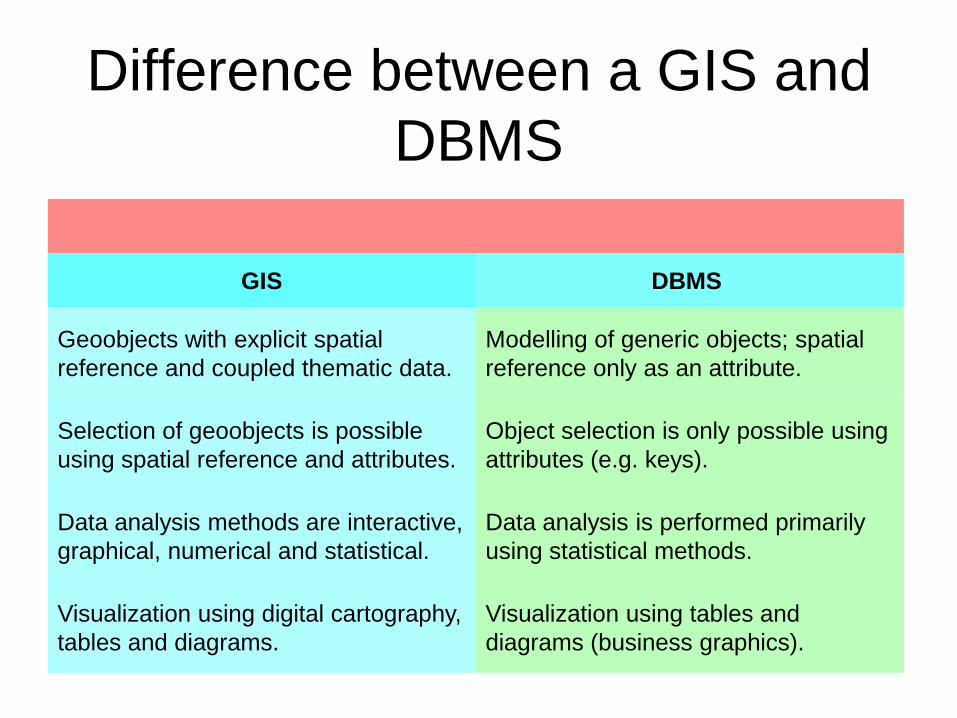
Difference between a GIS and
DBMS
GIS DBMS
Geoobjects with explicit spatial
reference and coupled thematic data.
Modelling of generic objects; spatial
reference only as an attribute.
Selection of geoobjects is possible
using spatial reference and attributes.
Object selection is only possible using
attributes (e.g. keys).
Data analysis methods are interactive,
graphical, numerical and statistical.
Data analysis is performed primarily
using statistical methods.
Visualization using digital cartography,
tables and diagrams.
Visualization using tables and
diagrams (business graphics).
Components of GIS
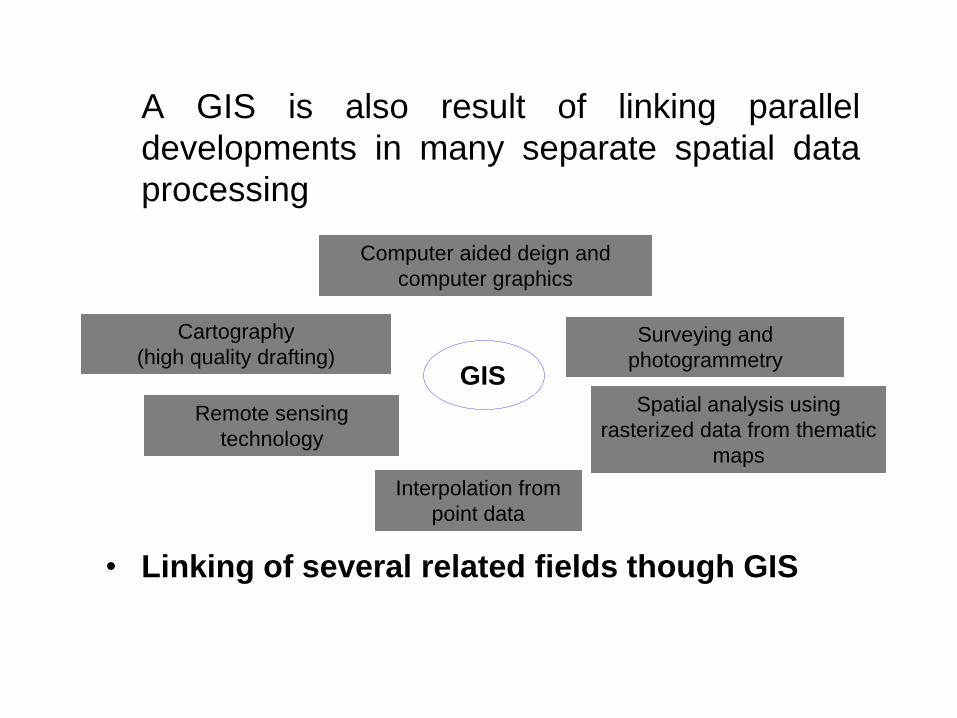
• A GIS is also result of linking parallel
developments in many separate spatial data
processing
• Linking of several related fields though GIS
Computer aided deign and
computer graphics
Surveying and
photogrammetry
Cartography
(high quality drafting)
Spatial analysis using
rasterized data from thematic
maps
Remote sensing
technology
Interpolation from
point data
GIS
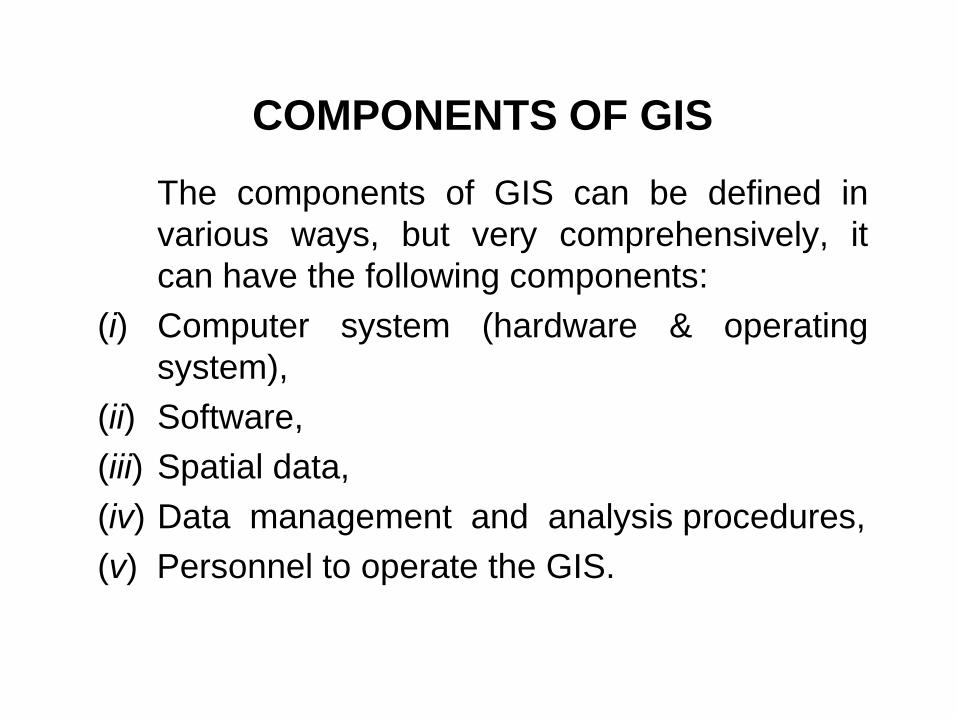
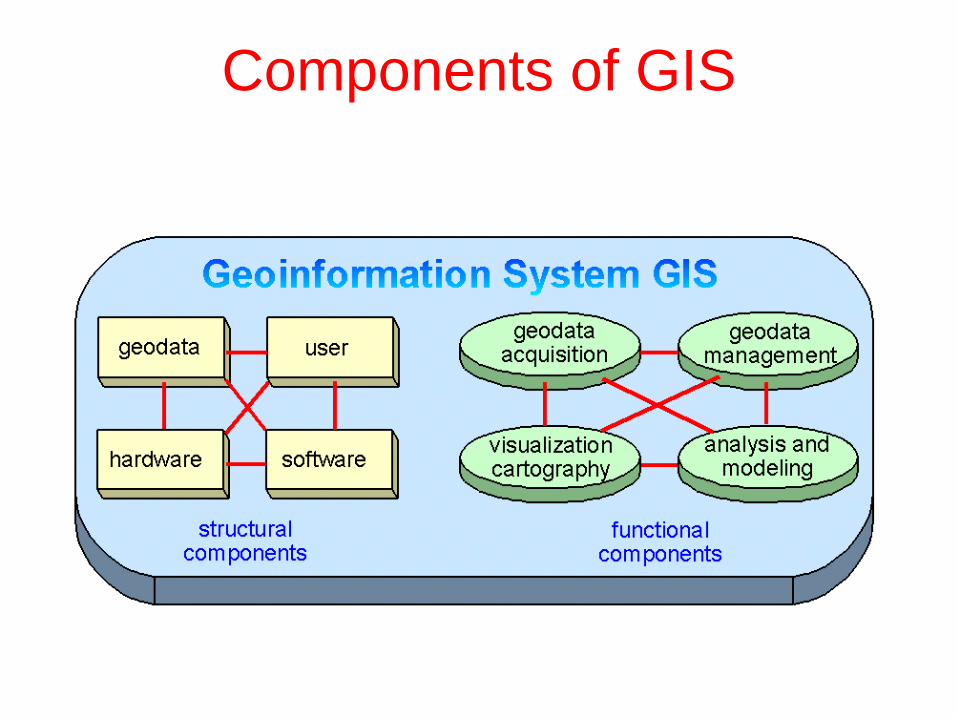
COMPONENTS OF GIS
• The components of GIS can be defined in
various ways, but very comprehensively, it
can have the following components:
(i) Computer system (hardware & operating
system),
(ii) Software,
(iii) Spatial data,
(iv) Data management and analysis procedures,
(v) Personnel to operate the GIS.
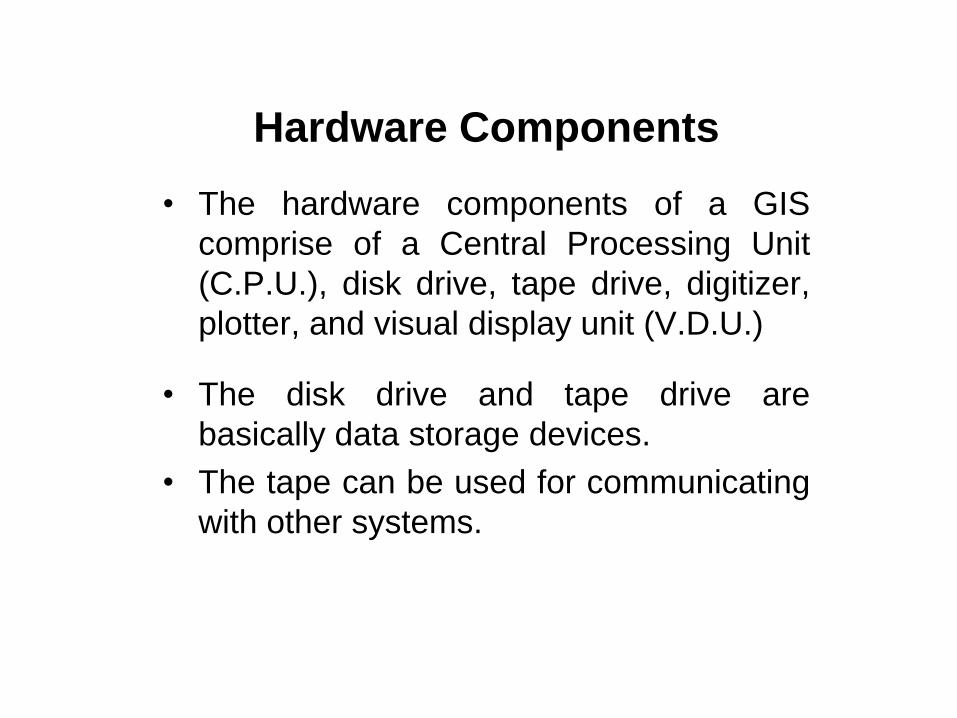
Hardware Components
• The hardware components of a GIS
comprise of a Central Processing Unit
(C.P.U.), disk drive, tape drive, digitizer,
plotter, and visual display unit (V.D.U.)
• The disk drive and tape drive are
basically data storage devices.
• The tape can be used for communicating
with other systems.
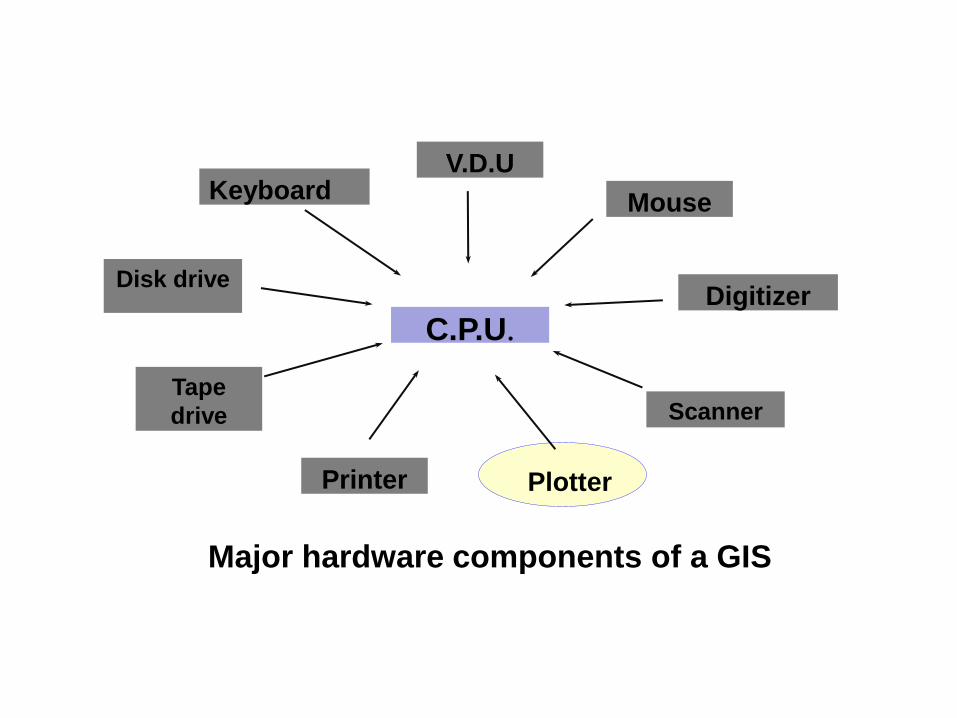
Major hardware components of a GIS
V.D.U Keyboard Mouse
Digitizer
Scanner
Plotter Printer
Disk drive
Tape
drive
C.P.U.
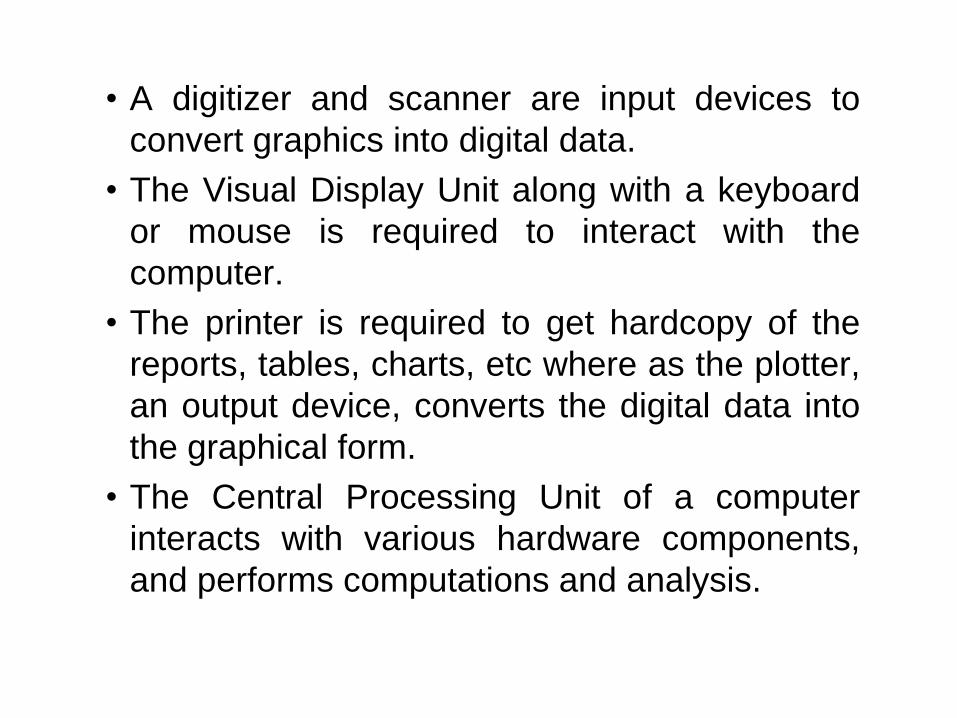
• A digitizer and scanner are input devices to
convert graphics into digital data.
• The Visual Display Unit along with a keyboard
or mouse is required to interact with the
computer.
• The printer is required to get hardcopy of the
reports, tables, charts, etc where as the plotter,
an output device, converts the digital data into
the graphical form.
• The Central Processing Unit of a computer
interacts with various hardware components,
and performs computations and analysis.
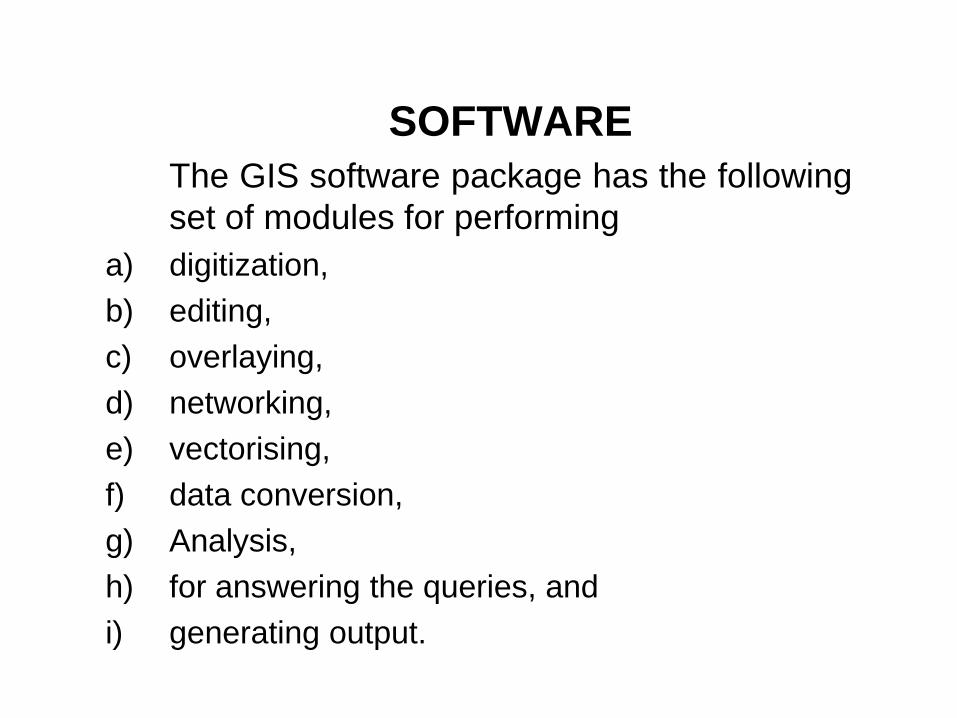
• SOFTWARE
• The GIS software package has the following
set of modules for performing
a) digitization,
b) editing,
c) overlaying,
d) networking,
e) vectorising,
f) data conversion,
g) Analysis,
h) for answering the queries, and
i) generating output.
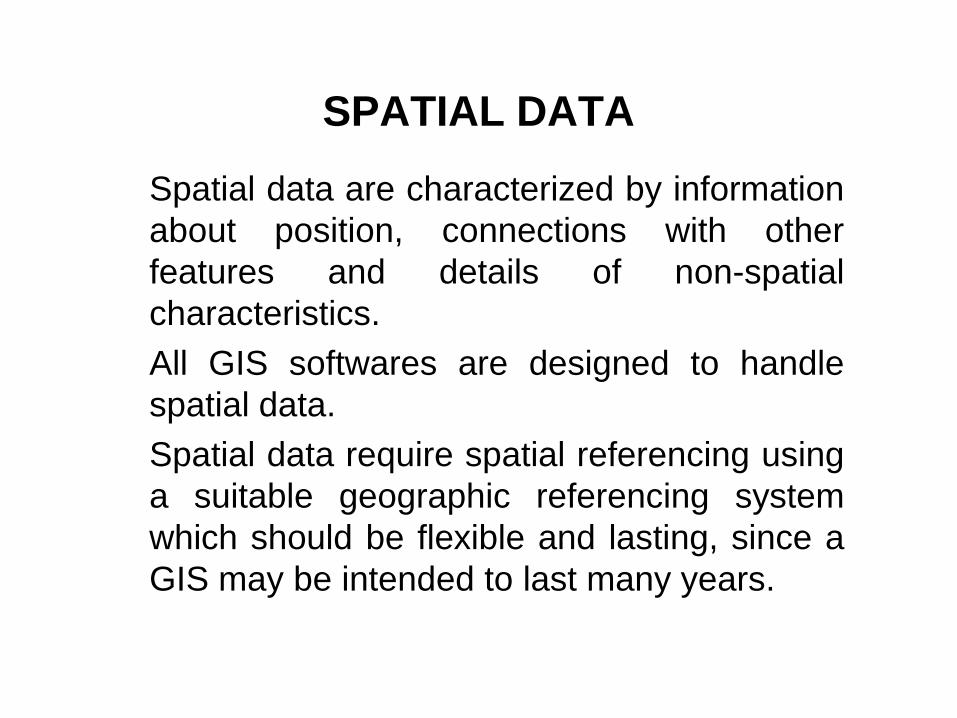
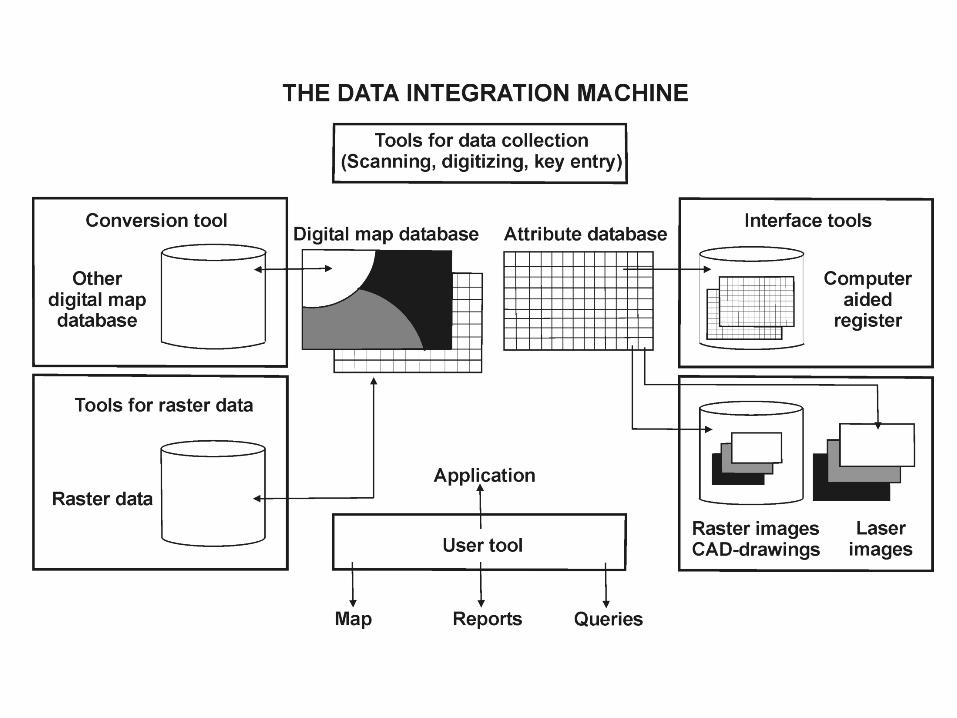
SPATIAL DATA
• Spatial data are characterized by information
about position, connections with other
features and details of non-spatial
characteristics.
• All GIS softwares are designed to handle
spatial data.
• Spatial data require spatial referencing using
a suitable geographic referencing system
which should be flexible and lasting, since a
GIS may be intended to last many years.
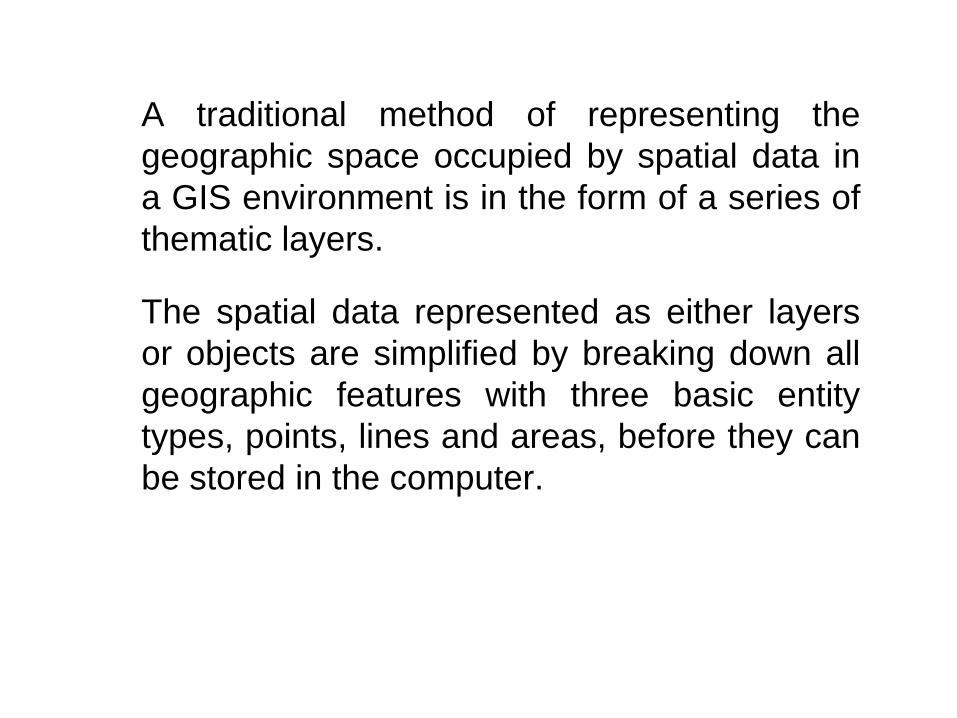
• A traditional method of representing the
geographic space occupied by spatial data in
a GIS environment is in the form of a series of
thematic layers.
• The spatial data represented as either layers
or objects are simplified by breaking down all
geographic features with three basic entity
types, points, lines and areas, before they can
be stored in the computer.
DATA MANAGEMENT & ANALYSIS
• Input data in the forms of spatial data and
non-spatial data, and information about their
linkages, and updating of data are the most
expensive and time-consuming part of any
GIS project.
• Data input is the process of converting data
from its existing form to one that can be used
by the GIS.
• The management of data in GIS includes
storage, organization, and retrieval using a
database management system (DBMS).
• The DMBS should provide support for multiple
users and multiple databases allowing
efficient updating and minimizing the
redundant information.
• It should also allow data independence,
security, and integrity.
GIS analysis procedures include
a) storage and retrieval capabilities for presenting the required information,
b) queries allowing the user to look at patterns in the data,
c) prediction or modeling capabilities to have information about what data might be at different time and place.
d) The data output in GIS depends on cost constraints, the type of users, and output devices available.
Personnel Operating GIS
• A GIS project requires trained personnel who
can plan, implement and operate the system.
• They should also be capable of making
decisions on the basis of the output. The
success of any GIS project depends upon
the skill and training of the personnel
handling the project.
GEOGRAPHICAL CONCEPTS
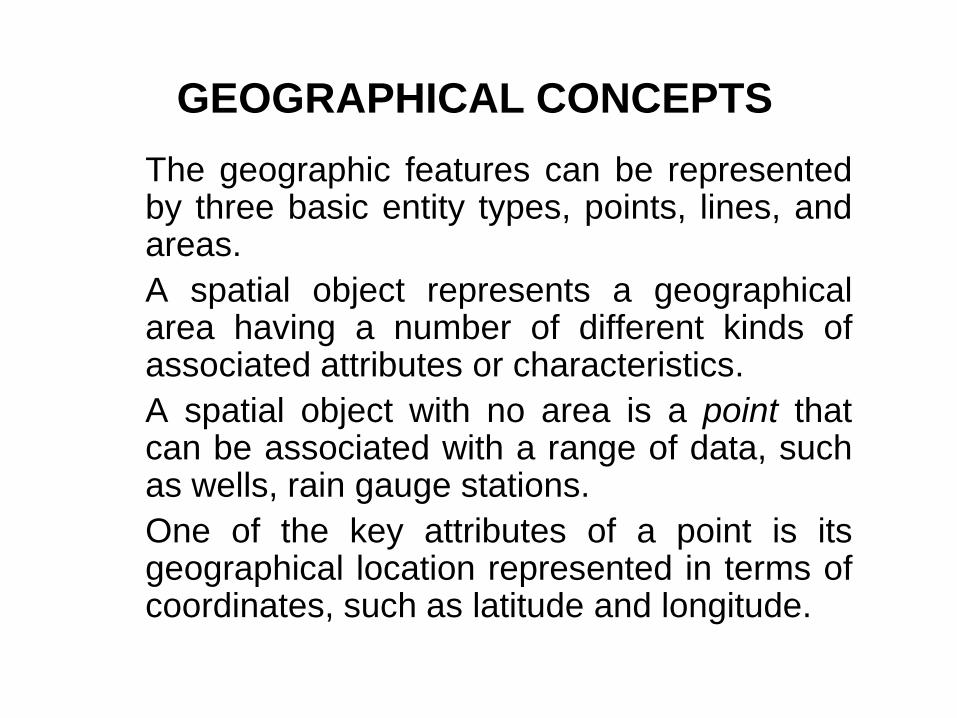
• The geographic features can be represented by three basic entity types, points, lines, and areas.
• A spatial object represents a geographical area having a number of different kinds of associated attributes or characteristics.
• A spatial object with no area is a point that can be associated with a range of data, such as wells, rain gauge stations.
• One of the key attributes of a point is its geographical location represented in terms of coordinates, such as latitude and longitude.

GEOGRAPHICAL CONCEPTS • When a spatial object is made up of a
connected sequence of points, it is referred to as a line.
• Lines have only linear dimension, i.e., they do no have width, and a specified location is given on one side of the line and not on the line itself.
• Attributes to a line could be the number of the wells that the line separates in an area having wells.
• Nodes are defined as the special kinds of points that usually indicate the junction between lines or the ends of line segments.
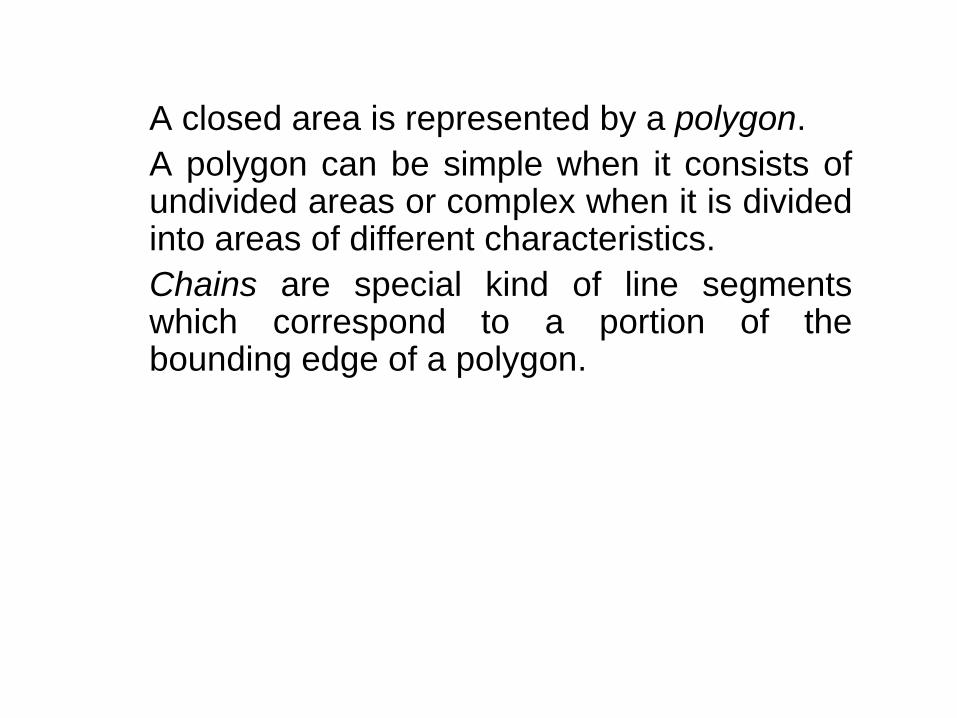
• A closed area is represented by a polygon.
• A polygon can be simple when it consists of undivided areas or complex when it is divided into areas of different characteristics.
• Chains are special kind of line segments which correspond to a portion of the bounding edge of a polygon.
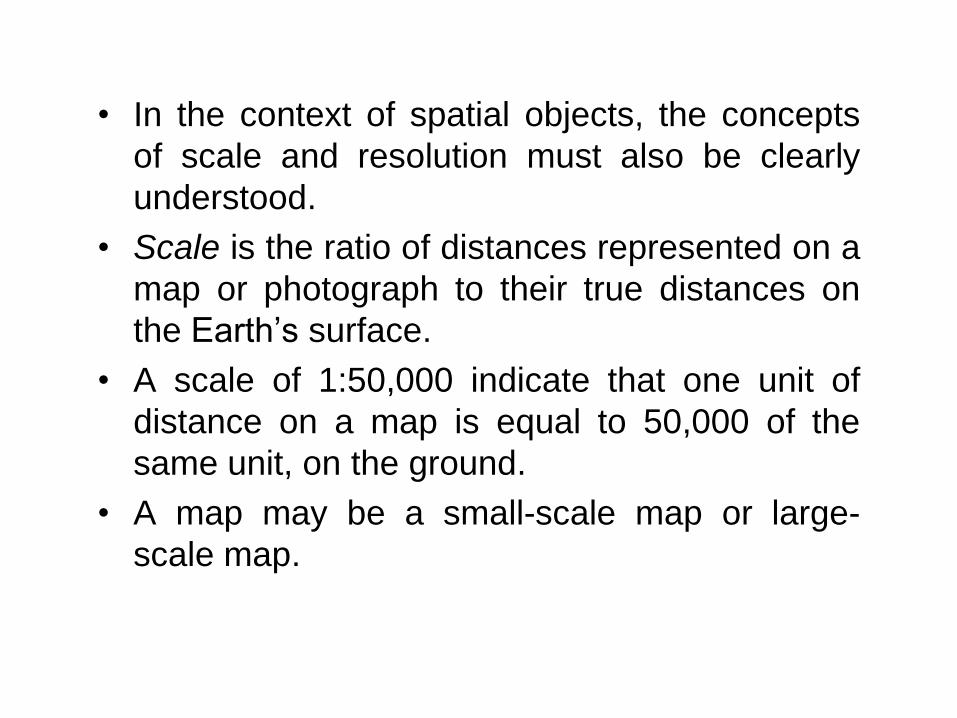
• In the context of spatial objects, the concepts
of scale and resolution must also be clearly
understood.
• Scale is the ratio of distances represented on a
map or photograph to their true distances on
the Earth‟s surface.
• A scale of 1:50,000 indicate that one unit of
distance on a map is equal to 50,000 of the
same unit, on the ground.
• A map may be a small-scale map or large-
scale map.
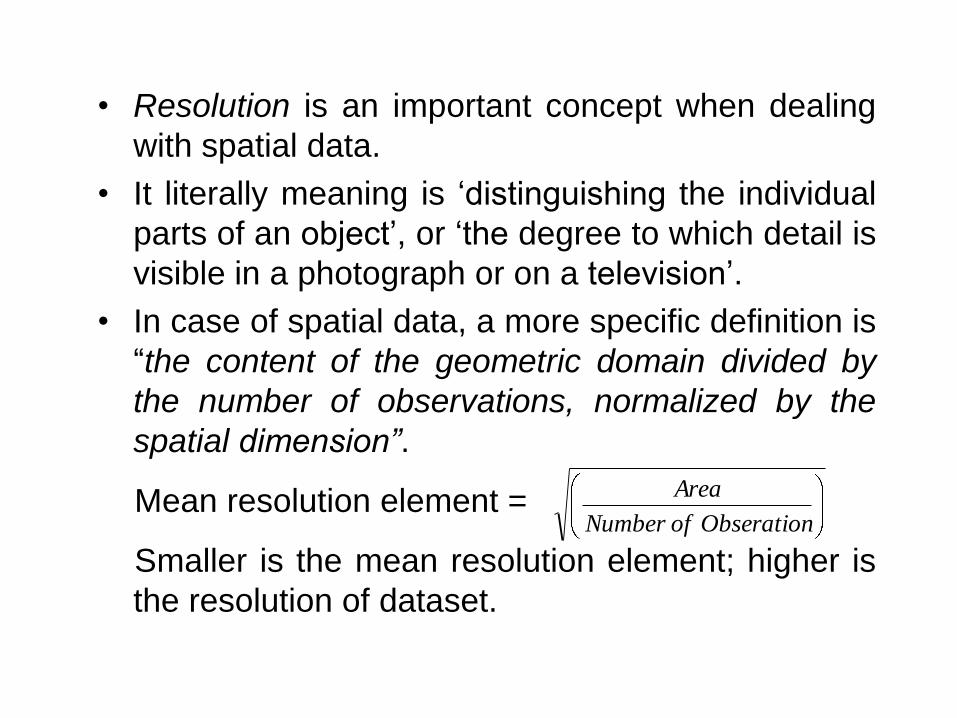
• Resolution is an important concept when dealing
with spatial data.
• It literally meaning is „distinguishing the individual
parts of an object‟, or „the degree to which detail is
visible in a photograph or on a television‟.
• In case of spatial data, a more specific definition is
“the content of the geometric domain divided by
the number of observations, normalized by the
spatial dimension”.
Mean resolution element =
Smaller is the mean resolution element; higher is
the resolution of dataset.
ObserationofNumber
Area
INPUT DATA FOR GIS Input data for GIS cover all aspects of capturing spatial
data and the attribute data. The sources of spatial data are
existing maps, aerial photographs, satellite imageries, field
observations, and other sources. The spatial data not in
digital form are converted into standard digital form using
digitizer or scanner for use in GIS.
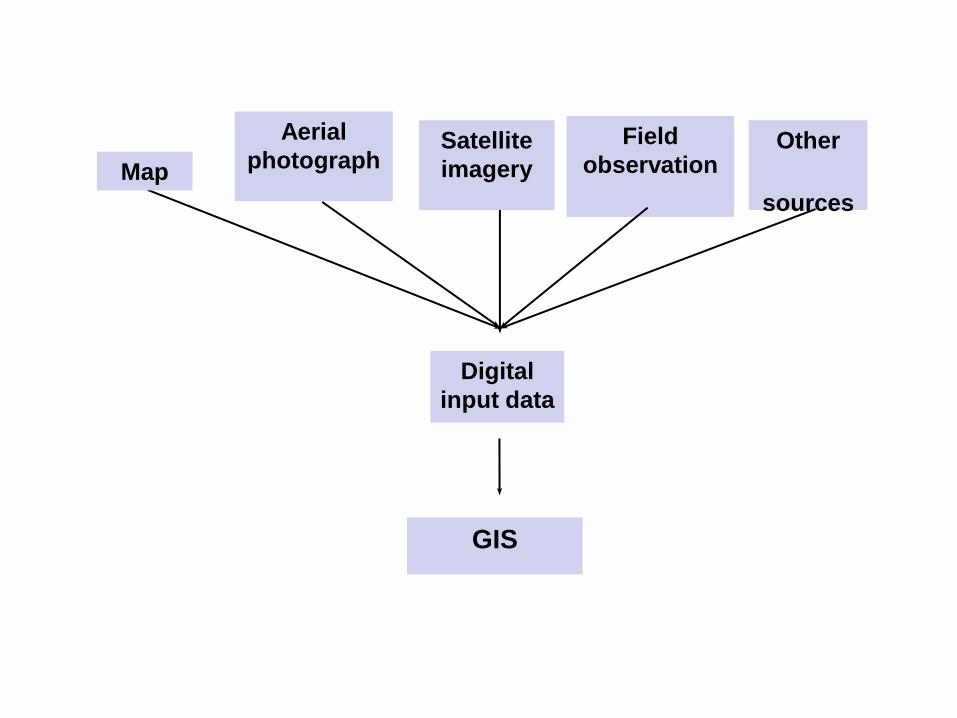
GIS
Other
sources
Aerial
photograph Satellite
imagery
Field
observation
Digital
input data
Map
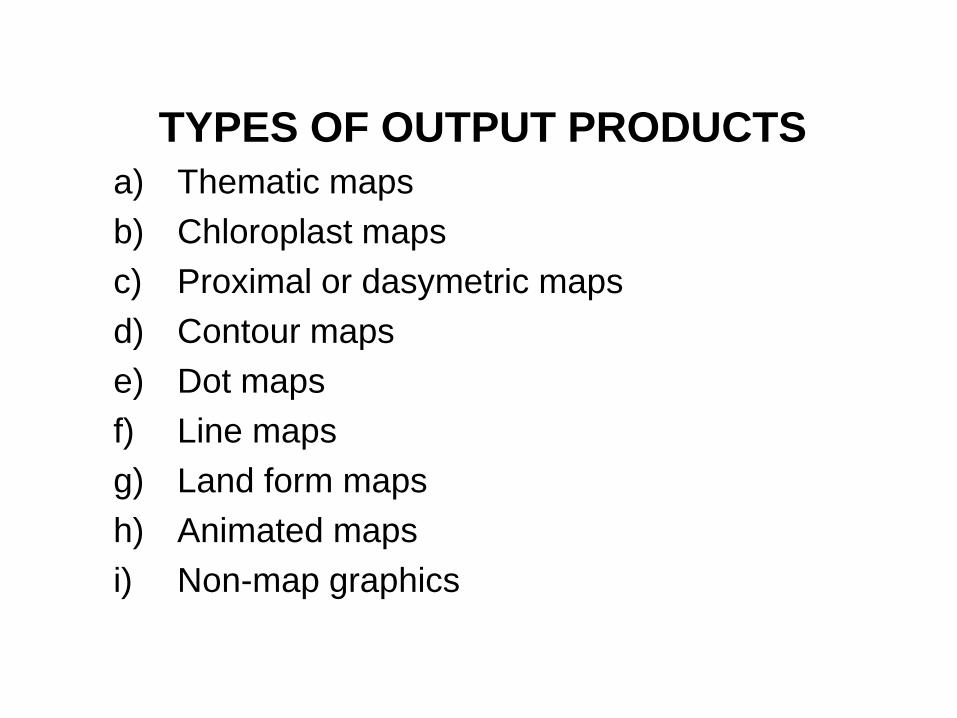
TYPES OF OUTPUT PRODUCTS
a) Thematic maps
b) Chloroplast maps
c) Proximal or dasymetric maps
d) Contour maps
e) Dot maps
f) Line maps
g) Land form maps
h) Animated maps
i) Non-map graphics
• Thematic maps concentrate on spatial variations of a single phenomenon (e.g., population) or the relationship between phenomena (e.g., different classes of land cover).
• Choropleth maps are typically used to communicate the relative magnitudes of continuous variables as they occur within the boundaries of unit areas (e.g., average annual per capita income as it varies by country).
• In these maps, different tones, colours, and shading patterns are used to convey the variations in different areas.
• Proximal or dasymetric maps focus on the
location and magnitude of areas exhibiting
relative uniformity (e.g., land cover classes).
• Different colours and shading patterns are
used to describe differences in the thematic
values.
Contour maps represent quantities by lines of
equal value to emphasize gradients among
the values. Contour lines may be used to
indicate variation in topography of a region,
high and low pressure regions
• Dot maps depict spatial distribution of
features by varying numbers of uniform dots
(e.g., population)
• Line maps show the direction and magnitude
of potential or actual flow (e.g., to show
sources and destinations as well as the
volume of product transported from one state
to others).
• Land form maps depict the earth‟s surface as
it were viewed from an oblique aerial point
view.
• Animated maps are generally used to display
sequences through time (e.g., growth of a city
as its population and area increase through
time).
• Some users/analysts prefer to get the results of analysis displayed by means of non-map graphics.
• Some of the simple and common graphic presentation techniques are
a) Bar charts
b) Pie charts
c) Scatter plots
d) Histograms
• Bar charts used to illustrate difference in an
attribute between categories (e.g., time-
varying distribution of land use in an area
such as urban, suburban, and rural).
• Pie charts for displaying information by dividing
a circle into sectors representing proportions of
the whole (e.g., in a state percentage of rural,
suburban, and urban population).
• Scatter plots for displaying behaviour of one
attribute verses another attribute (e.g., yield
and applied fertilizer).
• Histograms to show the distribution of a
single attribute to examine the way the
attribute is apportioned among the different
possible values (e.g., percentage of
education at primary, secondary, higher, and
other levels).
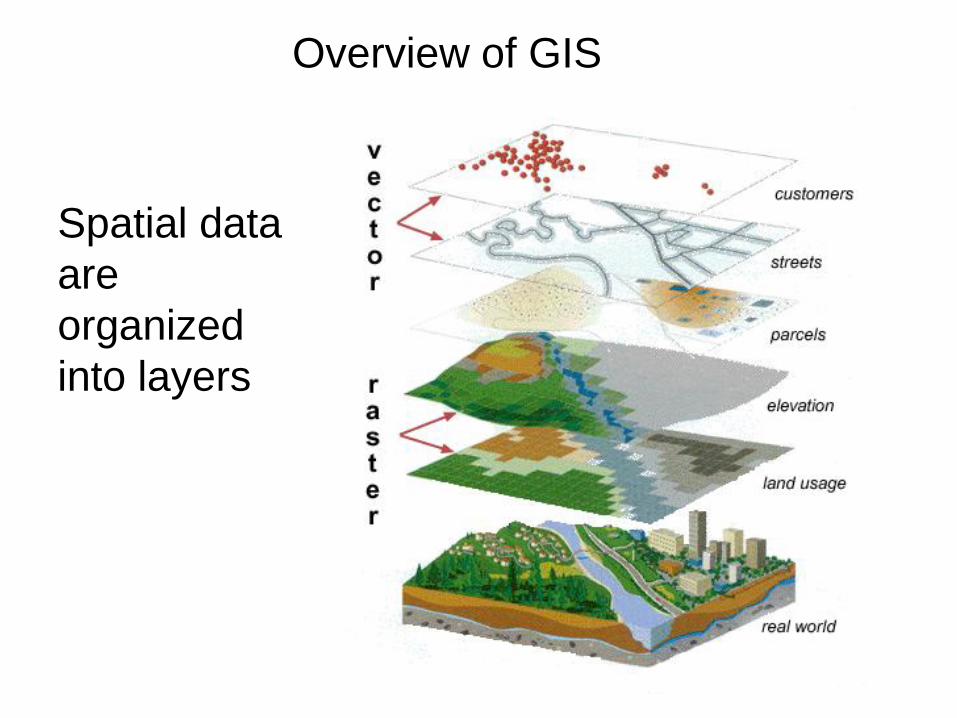
Overview of GIS
Spatial data
are
organized
into layers
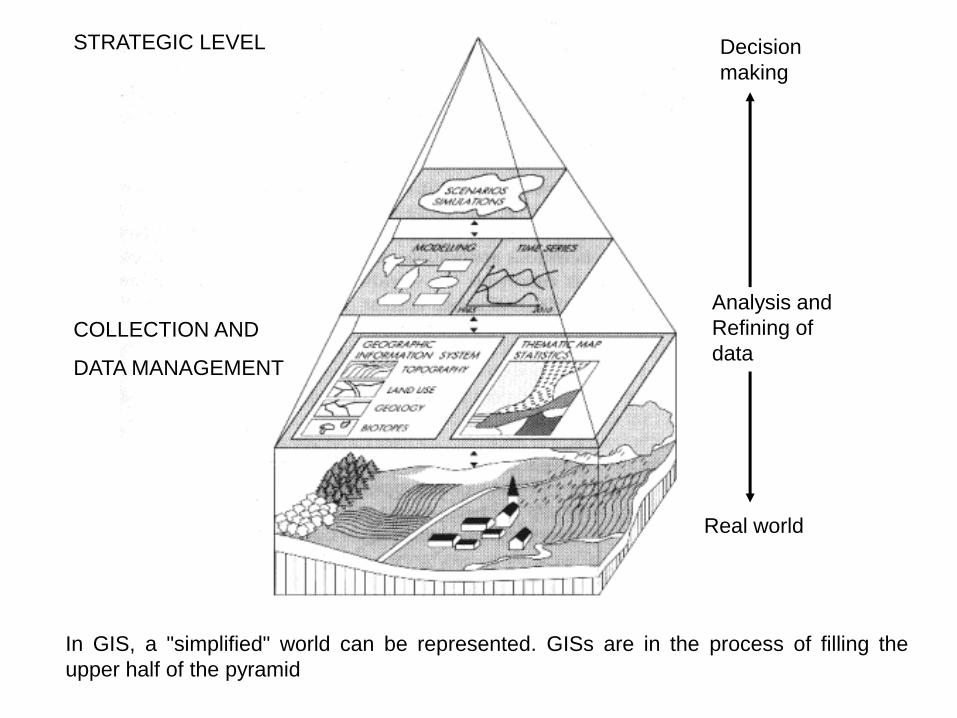
In GIS, a "simplified" world can be represented. GISs are in the process of filling the
upper half of the pyramid
STRATEGIC LEVEL
COLLECTION AND
DATA MANAGEMENT
Decision
making
Analysis and
Refining of
data
Real world
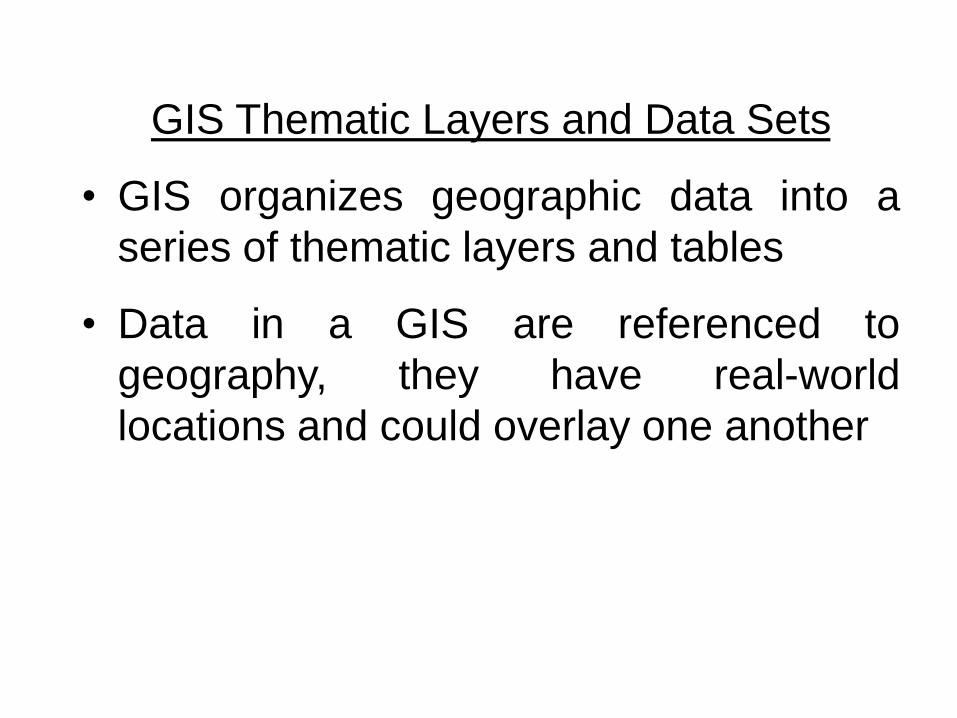
GIS Thematic Layers and Data Sets
• GIS organizes geographic data into a
series of thematic layers and tables
• Data in a GIS are referenced to
geography, they have real-world
locations and could overlay one another
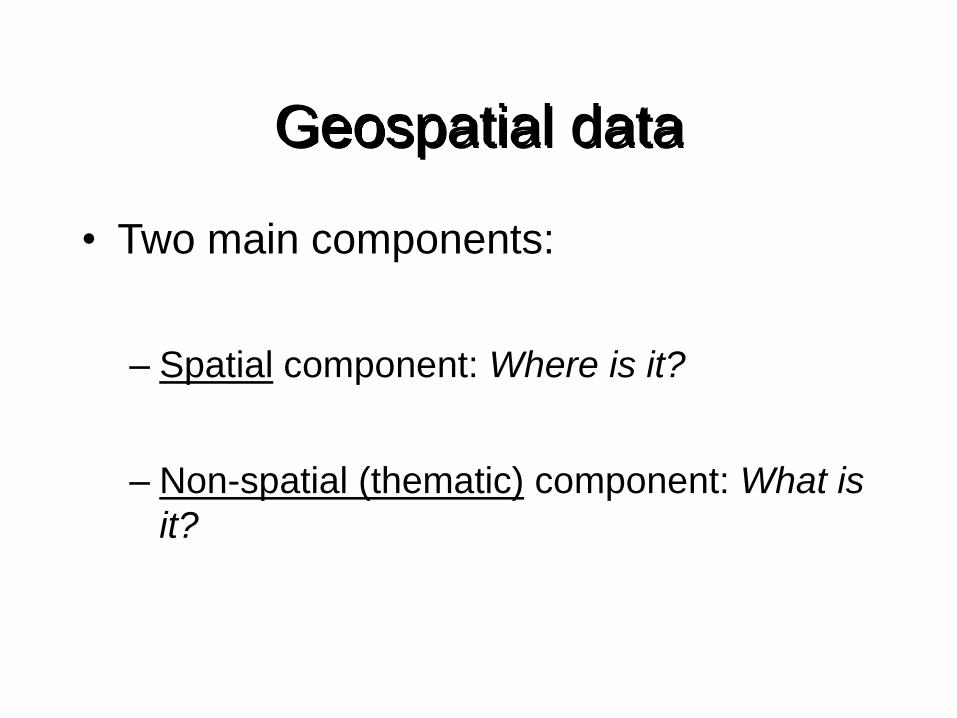
Geospatial data
• Two main components:
– Spatial component: Where is it?
– Non-spatial (thematic) component: What is
it?
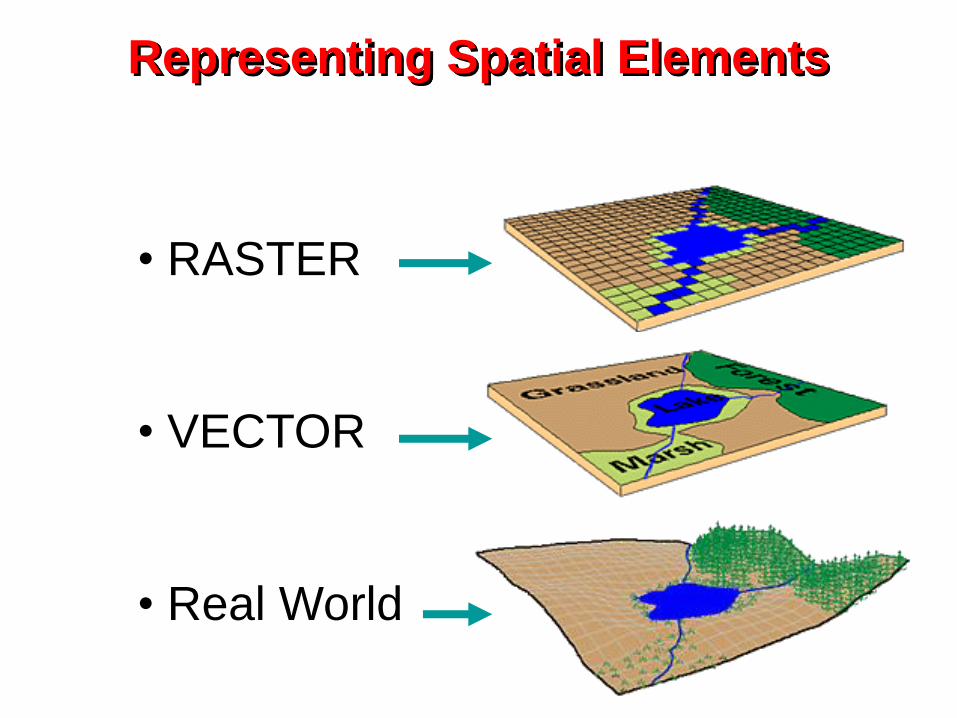
Representing Spatial Elements
• RASTER
• VECTOR
• Real World
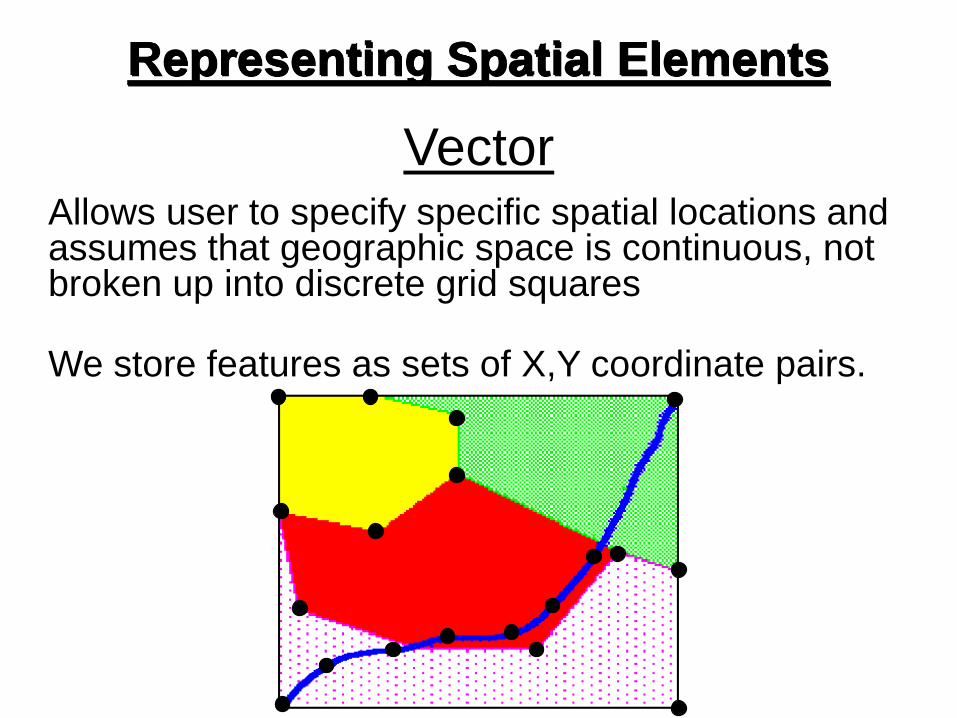
Vector Allows user to specify specific spatial locations and assumes that geographic space is continuous, not broken up into discrete grid squares
We store features as sets of X,Y coordinate pairs.
Representing Spatial Elements
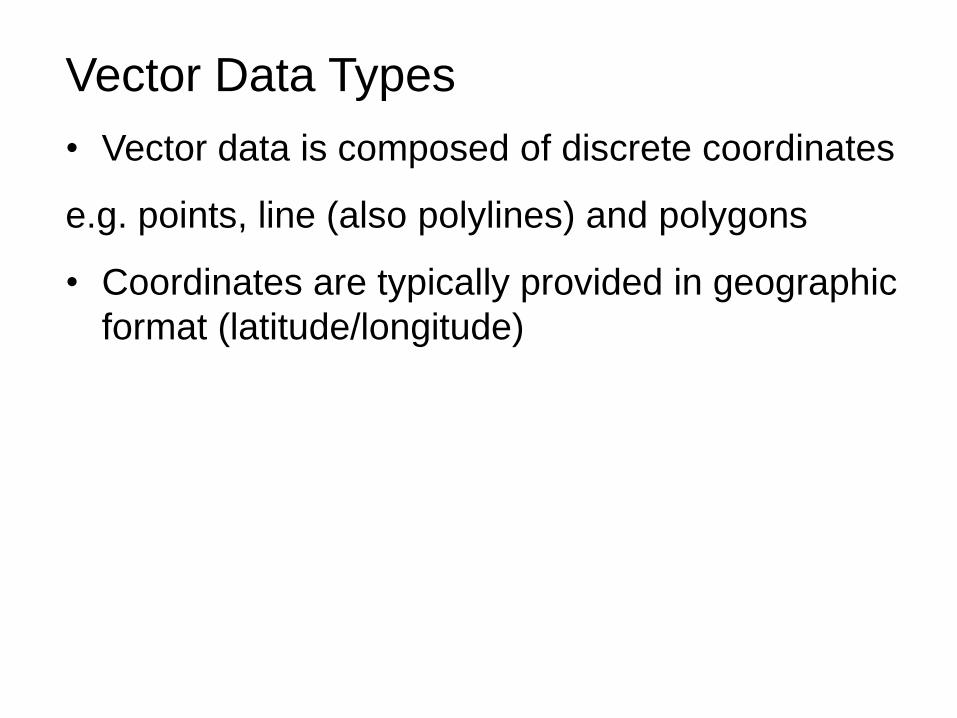
Vector Data Types
• Vector data is composed of discrete coordinates
e.g. points, line (also polylines) and polygons
• Coordinates are typically provided in geographic
format (latitude/longitude)
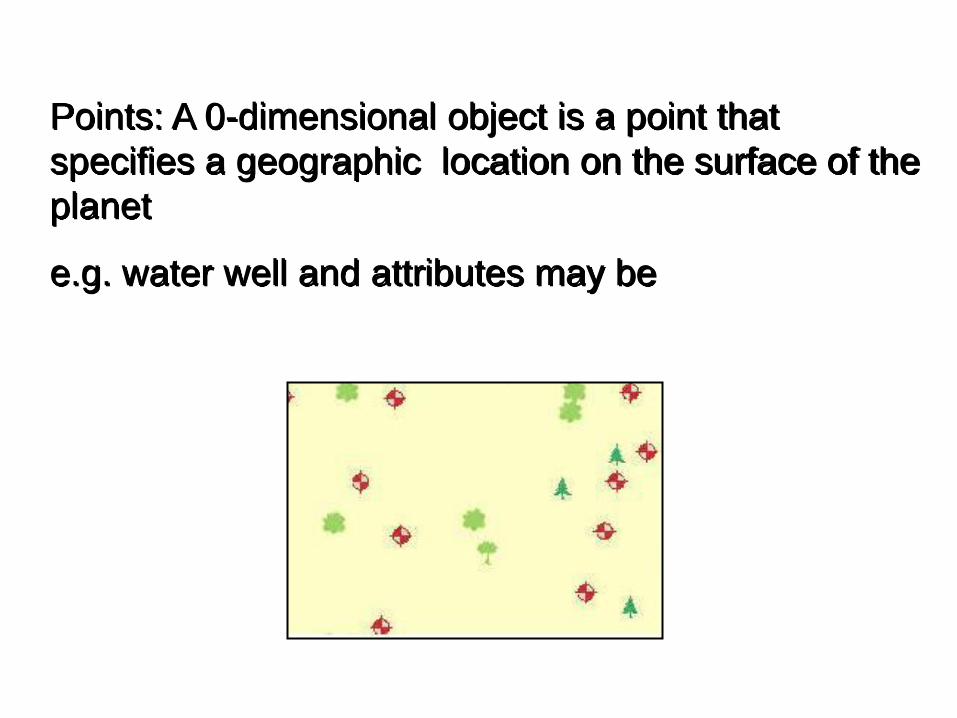
Points: A 0-dimensional object is a point that
specifies a geographic location on the surface of the
planet
e.g. water well and attributes may be
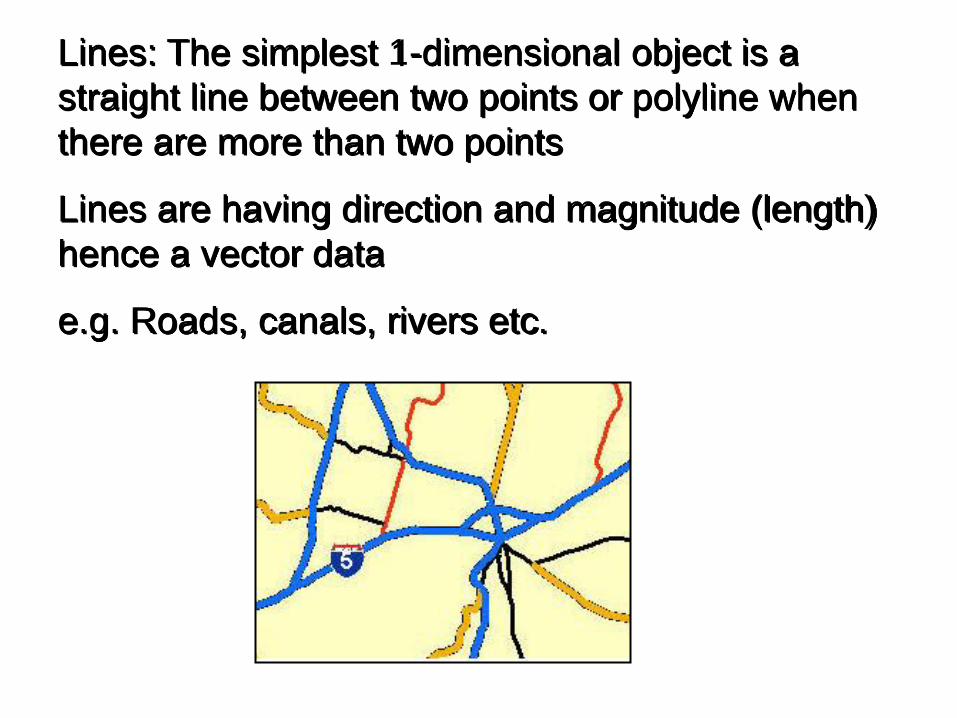
Lines: The simplest 1-dimensional object is a
straight line between two points or polyline when
there are more than two points
Lines are having direction and magnitude (length)
hence a vector data
e.g. Roads, canals, rivers etc.
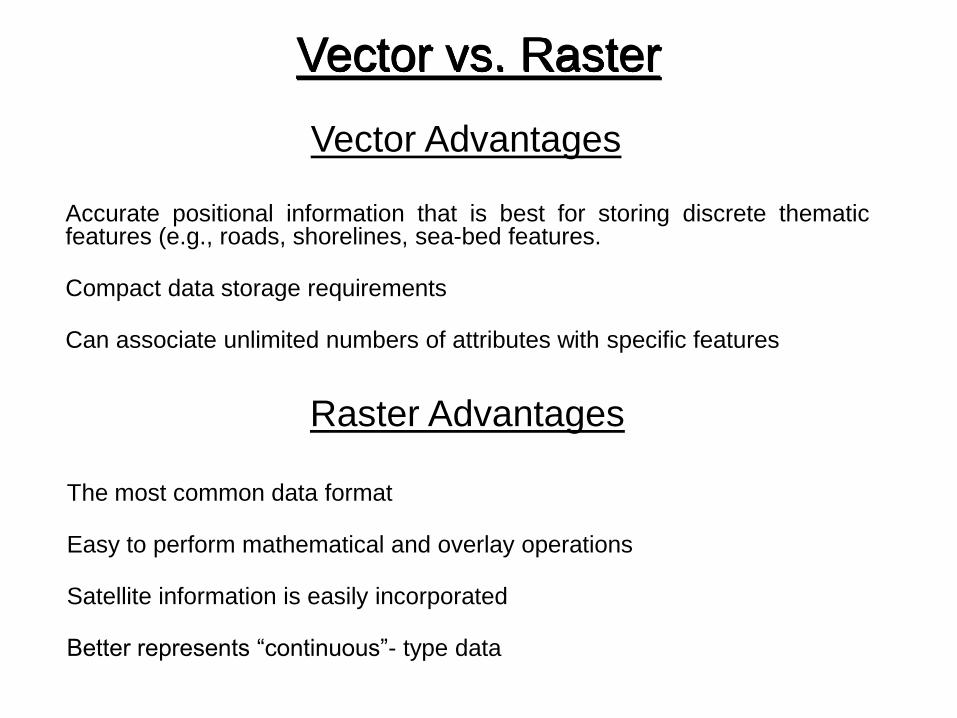
Vector vs. Raster
Raster Advantages
The most common data format
Easy to perform mathematical and overlay operations
Satellite information is easily incorporated
Better represents “continuous”- type data
Vector Advantages
Accurate positional information that is best for storing discrete thematic features (e.g., roads, shorelines, sea-bed features.
Compact data storage requirements
Can associate unlimited numbers of attributes with specific features
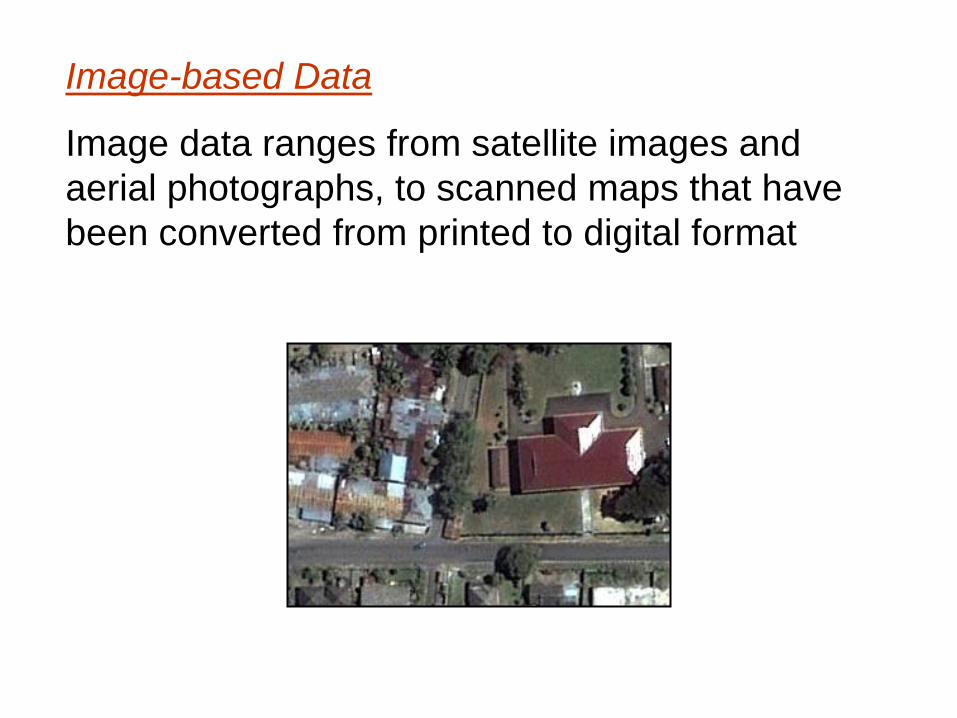
Image-based Data
Image data ranges from satellite images and
aerial photographs, to scanned maps that have
been converted from printed to digital format
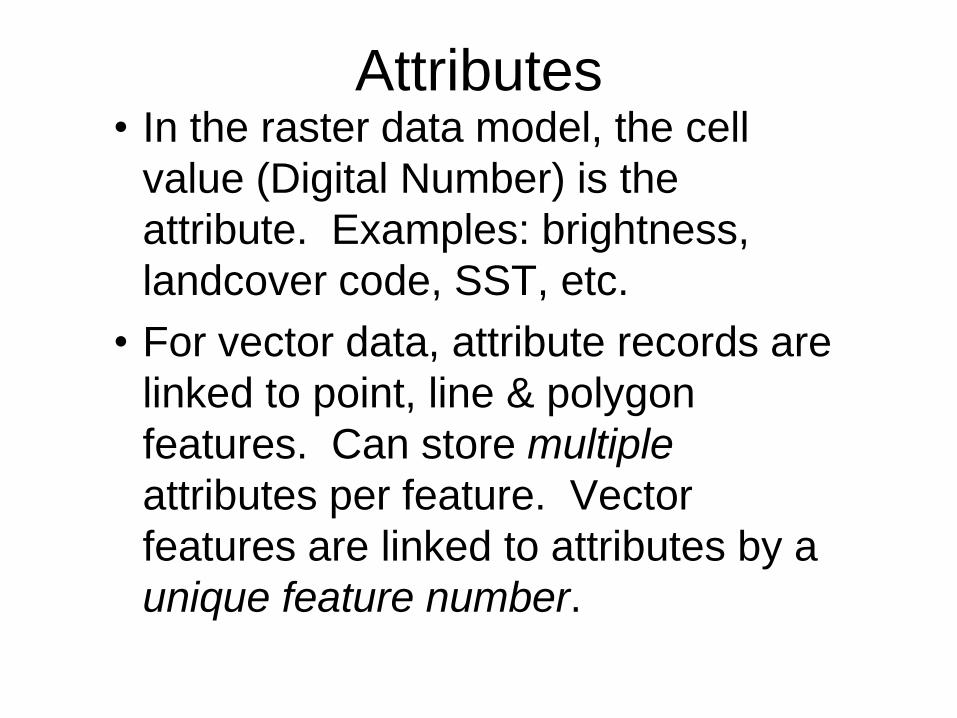
Attributes • In the raster data model, the cell
value (Digital Number) is the
attribute. Examples: brightness,
landcover code, SST, etc.
• For vector data, attribute records are
linked to point, line & polygon
features. Can store multiple
attributes per feature. Vector
features are linked to attributes by a
unique feature number.
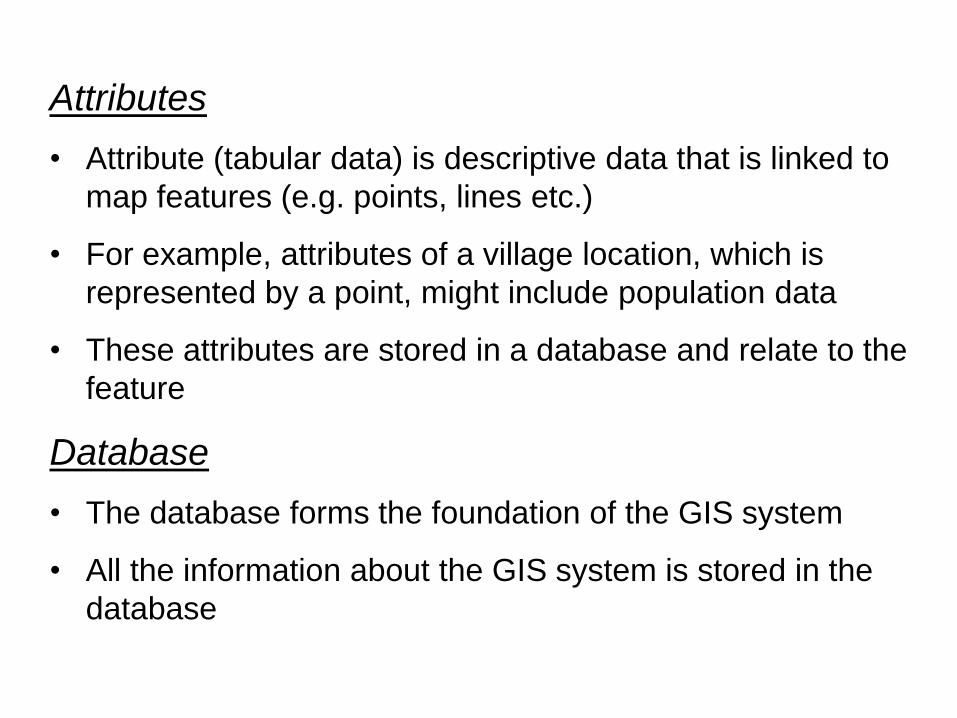
Attributes
• Attribute (tabular data) is descriptive data that is linked to
map features (e.g. points, lines etc.)
• For example, attributes of a village location, which is
represented by a point, might include population data
• These attributes are stored in a database and relate to the
feature
Database
• The database forms the foundation of the GIS system
• All the information about the GIS system is stored in the
database
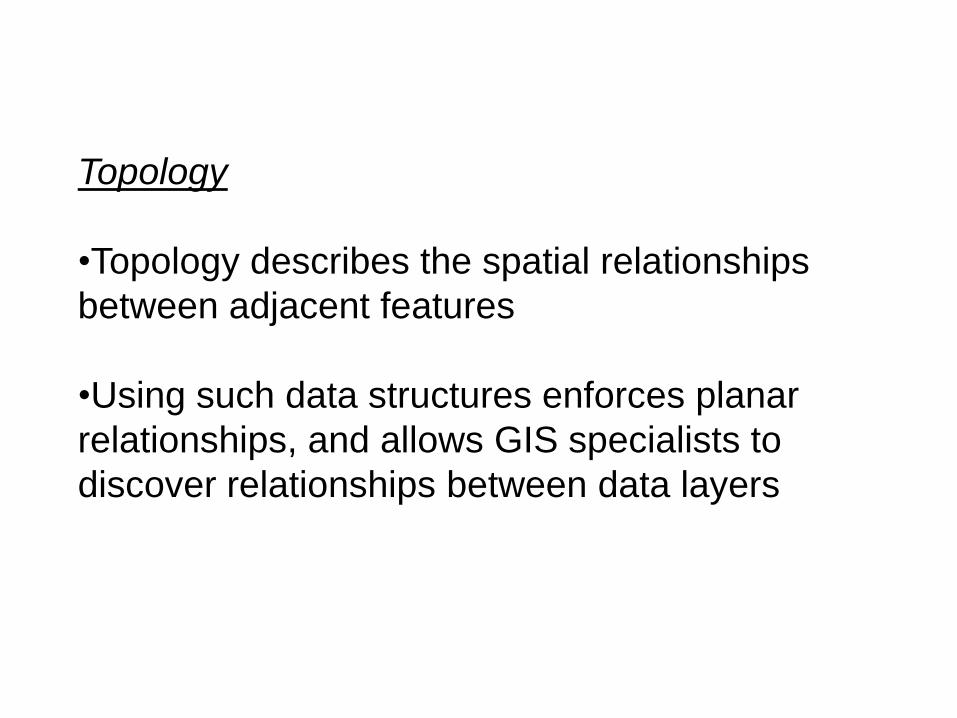
Topology
•Topology describes the spatial relationships
between adjacent features
•Using such data structures enforces planar
relationships, and allows GIS specialists to
discover relationships between data layers
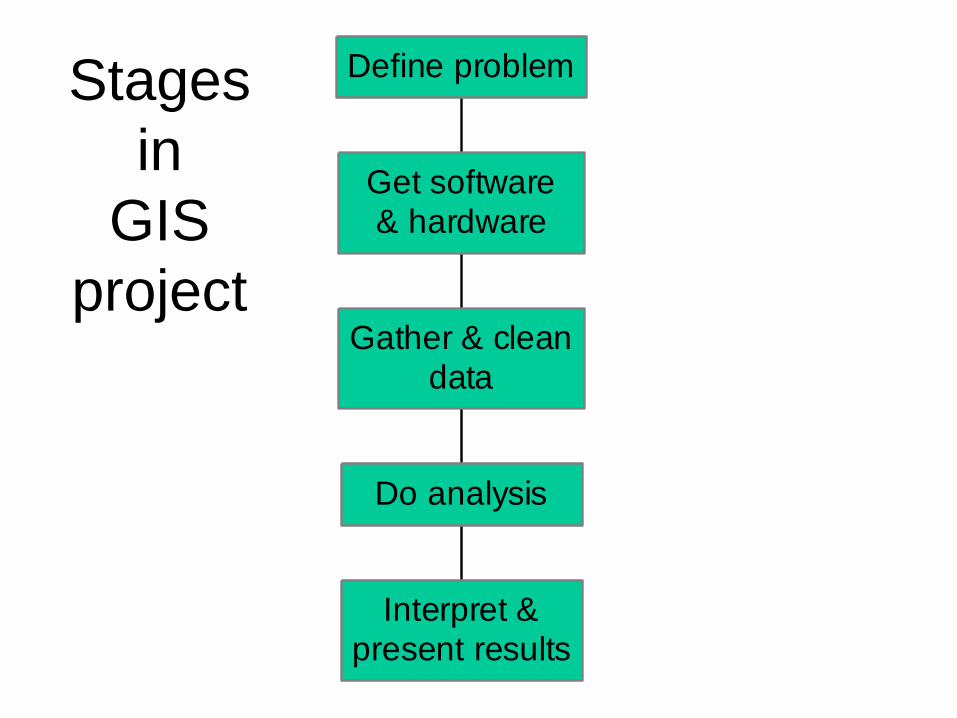
Stages
in
GIS
project
Interpret &
present results
Do analysis
Gather & clean
data
Get software
& hardware
Define problem
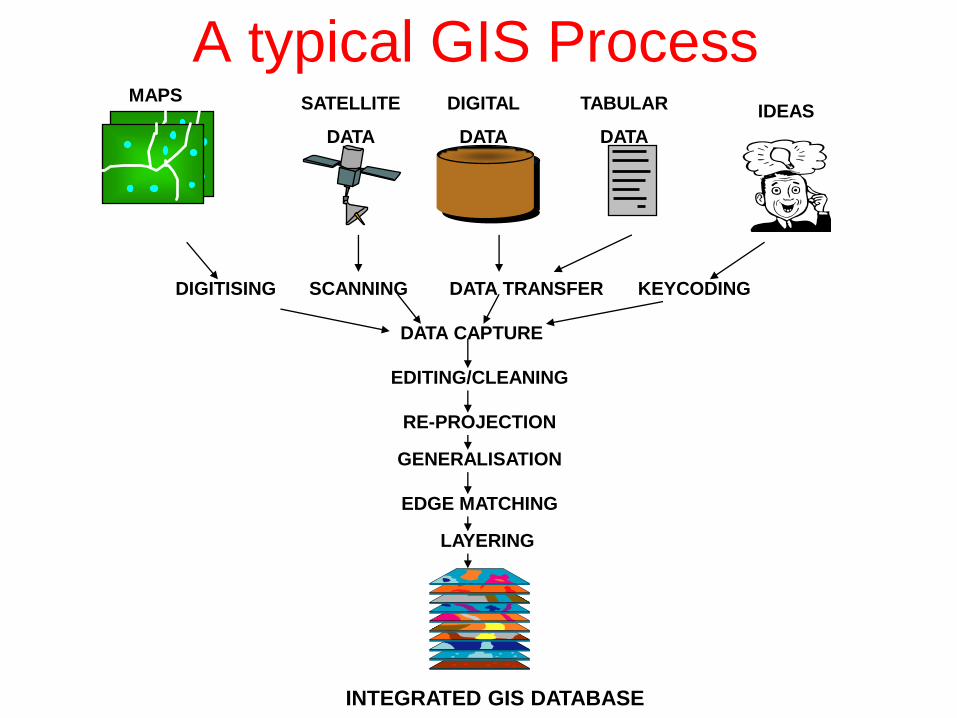
A typical GIS Process MAPS SATELLITE
DATA
DIGITAL
DATA
TABULAR
DATA
IDEAS
DIGITISING SCANNING DATA TRANSFER KEYCODING
DATA CAPTURE
EDITING/CLEANING
RE-PROJECTION
GENERALISATION
EDGE MATCHING
LAYERING
INTEGRATED GIS DATABASE
APPLICATION OF GIS
• GIS finds its application in all those areas where professionals are involved in management and planning utilizing analysis of large amount of geographical data that relates to space, typically involving positional data.
• Positional data determine where things are or perhaps, where they were or will be. In other words, it is dealing with questions related to geographic space. Some of the typical applications may be as under.
(i) A forest manager may want to optimize production of timber using data on soil and current tree stand distribution under a number of operational constraints.
APPLICATION OF GIS
• A geologist may be interested in identifying
the best dam site by analyzing the
earthquake data of the area, and rock
formation characteristics.
(ii) A geoinformatics engineer may want to
determine the best sites for his company‟s
relay stations taking into account the land
prices, topography, etc.
• GIS is used to study the phenomena which are man-made or natural.
• Urban planning essentially requires a thorough understanding of the interrelationships between various entities such as road connectivity, schools, hospitals, police stations, etc., with respect to human settlements.
• On the other hand, in geomorphology, ecology, and soil studies, natural phenomena, such as rock formation, plate tectonics, distribution of soils, are analyzed.
• GIS applications also consist of study of both natural as well as man-made entities together.
• The study of effect of human activity on the environment, referred to as environmental impact assessment involves analysis of data about both natural and man-made features.
• A study on the growing industrial units in an area is a problem of environmental impact assessment.
• GIS has distinct application in feasibility studies such as site suitability and simulation studies in erosion modeling.