ifc financials, projects, and portfolio 2010
TRANSCRIPT

IFC
Financials,
Projects,
and Portfolio
2010


2 Management’s Discussion and Analysis 2 Overview 3 Financial Summary 6 Client Services 12 Treasury Services 15 Enterprise Risk Management 22 Critical Accounting Policies 24 Results of Operations 31 Governance 33 Consolidated Financial Statements and
Internal Control Reports 33 Management’s report regarding effectiveness of
internal control over external fi nancial reporting 35 Independent Auditors’ report on management’s assertion regarding effectiveness of internal control over external fi nancial reporting 37 Consolidated balance sheets 38 Consolidated income statements 39 Consolidated statements of comprehensive income 40 Consolidated statements of changes in capital 41 Consolidated statements of cash fl ows 43 Consolidated statement of capital stock and voting power 44 Notes to consolidated fi nancial statements 88 Independent Auditors’ Report 89 Project Commitments 90 Europe & Central Asia 94 East Asia and the Pacifi c 96 Latin America and the Caribbean 102 Middle East and North Africa 104 South Asia 106 Sub-Saharan Africa 112 Global 114 Investment Portfolio 114 Statement of Cumulative Gross Commitments 118 Company Listing
TABLE OF CONTENTS

p2
Management’s Discussion and Analysis
I. OverviewInternational Finance Corporation (IFC or the Corporation) is an international organization, established in 1956, to further economic growth in its developing member countries by pro-moting private sector development. IFC is a member of the World Bank Group, which also comprises the International Bank for Reconstruction and Development (IBRD), the International Development Association (IDA), the Multilateral Investment Guarantee Agency (MIGA), and the International Centre for Settlement of Investment Disputes (ICSID). It is a legal entity separate and distinct from IBRD, IDA, MIGA, and ICSID, with its own Articles of Agreement, share capital, fi nancial structure, man-agement, and staff. Membership in IFC is open only to member countries of IBRD. As of June 30, 2010, IFC’s entire share capital was held by 182 member countries.
IFC’s principal investment products are loans and equity invest-ments, with smaller debt securities and guarantee portfolios. IFC
also plays a catalytic role in mobilizing additional funding from other investors and lenders, either through cofi nancing or through loan participations, underwritings, and guarantees. In addition to project fi nance, corporate lending and resource mobilization, IFC offers an array of fi nancial products and advisory services to pri-vate businesses in the developing world with a view to fulfi lling its developmental mission. It also advises member governments on how to create an environment hospitable to the growth of private enterprise and foreign investment. Unlike most other multilateral institutions, IFC does not accept host government guarantees of its exposures. IFC raises virtually all of the funds for its lending activities through the issuance of debt obligations in the inter-national capital markets, while maintaining a small borrowing window with IBRD. Equity investments are funded from net worth. During the year ended June 30, 2010 (FY10), IFC had an authorized borrowing program of up to $9.5 billion, and up to $2.0 billion to allow for possible prefunding during FY10 of the funding program for the year ending June 30, 2011 (FY11).
IFC’s capital base and its assets and liabilities, other than its equity investments, are primarily denominated in US dollars. IFC seeks to minimize foreign exchange and interest rate risks by closely matching the currency and rate bases of its liabilities in various currencies with assets having the same characteristics. IFC manages any non-equity investment related residual currency and interest rate risks by utilizing currency and interest rate swaps and other derivative instruments.
The Management Discussion and Analysis contains forward looking statements which may be identifi ed by such terms as
“anticipates,” “believes,” “expects,” “intends,” “plans” or words of similar meaning. Such statements involve a number of assump-tions and estimates that are based on current expectations, which are subject to risks and uncertainties beyond IFC’s control. Consequently, actual future results could differ materially from those currently anticipated.

p3
MANAGEMENT’S DISCUSSION AND ANALYSIS
II. Financial Summary
BASIS OF PREPARATION OF IFC’S CONSOLIDATED FINANCIAL STATEMENTS
The accounting and reporting policies of IFC conform to account-ing principles generally accepted in the United States (US GAAP).
Up to and including the year ended June 30, 1999, IFC prepared one set of fi nancial statements and footnotes, complying with both US GAAP and International Financial Reporting Standards (IFRS). However, principally due to material differences between US Financial Accounting Standards Board’s (FASB) Accounting Standards Codifi cation (ASC) Topic 815, Derivatives and Hedg-ing (Topic 815) (formerly FASB Statement of Financial Accounting Standards No. 133, Accounting for Derivative Instruments and Hedging Activities), and its counterpart in IFRS, IAS No. 39, Financial Instruments Recognition and Measurement, it has not been possible for IFC to satisfy the requirements of both US GAAP and IFRS via one set of fi nancial statements since the year ended June 30, 2000.
IFC is actively monitoring developments related to accounting standards and the primary basis for preparation of its consoli-dated fi nancial statements, all with a view to the necessary systems and controls to manage its various lines of business. IFC will pres-ent its consolidated fi nancial statements for FY10 in accordance with US GAAP. IFC continues to plan to transition from US GAAP to IFRS and will continue to re-evaluate the timetable for this transi-tion during FY11. During FY10, IFC has continued to use account-ing pronouncements that expand the use of fair values in its FY10 consolidated financial statements, broadly consistent with its planned overall approach to the transition to IFRS. These account-ing policies are discussed in more detail in Note A to IFC’s FY10 consolidated fi nancial statements.
FINANCIAL PERFORMANCE SUMMARY
From year to year, IFC’s net income is affected by a number of factors, principally income generated from its equity investment portfolio (principally dividends, realized capital gains on equity sales and unrealized gains and losses on equity investments); the magnitude of provisions for losses against its loans and guaran-tees; impairment of equity investments; loans in nonaccrual status; recoveries of interest on loans formerly in nonaccrual status; and income from liquid assets.
A significant part of IFC’s liquid assets trading portfolio is invested in fi xed income securities, including asset-backed securi-ties (ABS) and mortgage-backed securities (MBS) which are also subject to external market factors that signifi cantly affect the value of such securities, adding variability to income.
Net income also includes net gains and losses on non-trading fi nancial instruments accounted for at fair value and grants to IDA.
IFC reported income before net losses on non-trading fi nan-cial instruments and grants to IDA of $2,285 million in FY10, as compared to a loss of $153 million in the year ended June 30, 2009 (FY09) and income of $1,938 million in the year ended June 30, 2008 (FY08).
The signifi cant improvement in income before net losses on other non-trading fi nancial instruments and grants to IDA in FY10 when compared to FY09 was principally as a result of a generally improved operating environment for IFC’s investment and liquid asset portfolios in FY10 as compared with that experienced in FY09. This improved fi nancial performance in FY10 when com-pared to FY09 resulted from: (i) lower impairment write-downs on equity investments; (ii) higher realized capital gains on equity sales and unrealized gains on equity investments accounted for at fair value in net income; (iii) lower provisions for losses on loans and guarantees; (iv) higher income from liquid asset trading activities; and (v) lower charges on borrowings.
IFC reported net losses on non-trading fi nancial instruments of $339 million in FY10 as compared with a net gain of $452 million in FY09 and a net gain of $109 million in FY08, resulting in income before grants to IDA of $1,946 million in FY10, as compared to $299 million in FY09 and $2,047 million in FY08.
Grants to IDA totaled $200 million in FY10, as compared to $450 million in FY09 and $500 million in FY08. Accordingly, net income (in accordance with US GAAP) totaled $1,746 million in FY10, as compared with a net loss of $151 million in FY09, and net income of $1,547 million in FY08.
IFC’s net income (loss) for the past five fiscal years ended June 30, is presented below (US$ millions):
*As restated.
2006*
–500 0 500 1,000 1,500 2,000 2,500 3,000
2007*
2008
2009
2010

p4
MANAGEMENT’S DISCUSSION AND ANALYSIS II. Financial Summary
The table below presents selected fi nancial data for the last fi ve fi scal years (in millions of US dollars, except where otherwise stated):
AS OF AND FOR THE YEARS ENDED JUNE 30 2010 2009 2008 2007 2006
Net income highlights:Income from loans and guarantees $ 801 $ 871 $ 1,065 $ 1,062 $ 804(Provision) release of provision for losses on loans & guarantees (155) (438) (38) 43 (15)Income (loss) from equity investments 1,638 (42) 1,688 2,292 1,224 Of which: Realized capital gains on equity sales 1,290 990 1,219 1,941 928 Dividends and profi t participations 285 311 428 385 323 Unrealized gains (losses) on equity investments 240 (299) 12 – – Non-monetary gains on equity investments 28 14 177 – – Equity investment impairment write-downs (203) (1,058) (140) (40) (57) Other, net (2) – (8) 6 30Income from debt securities 108 71 163 27 7Income from liquid asset trading activities 815 474 473 618 444Charges on borrowings (163) (488) (782) (801) (603)Other income 176 153 113 99 109Other expenses (743) (629) (555) (500) (477)Foreign currency transaction (losses) gains on non-trading activities (82) 10 (39) (5) 6Expenditures for advisory services (101) (129) (123) (96) (55)Expenditures for PBG and IFC SME Ventures for IDA countries (9) (6) (27) – (35)
Income (loss) before net gains and losses on other non-trading fi nancial instruments accounted for at fair value and grants to IDA 2,285 (153) 1,938 2,739 1,409Net (losses) gains on other non-trading fi nancial instruments (339) 452 109 (99) (145)
Income before grants to IDA 1,946 299 2,047 2,640 1,264Grants to IDA (200) (450) (500) (150) –
Net income (loss) $ 1,746 $ (151) $ 1,547 $ 2,490 $ 1,264
Consolidated balance sheet highlights:Total assets $ 61,075 $ 51,483 $ 49,471 $ 40,599 $ 38,547Liquid assets, net of associated derivatives 21,001 17,864 14,622 13,269 12,730Loans, equity investments, and debt securities, net 25,944 22,214 23,319 15,796 12,787Borrowings drawn-down and outstanding, including fair value adjustments 31,106 25,711 20,261 15,879 14,967
Total capital $ 18,359 $ 16,122 $ 18,261 $ 14,017 11,141
Of which: Undesignated retained earnings $ 14,307 $ 12,251 $ 12,366 $ 10,604 $ 7,868 Designated retained earnings 481 791 826 606 852 Capital stock 2,369 2,369 2,366 2,365 2,364 Accumulated other comprehensive income (AOCI) 1,202 711 2,703 442 57

MANAGEMENT’S DISCUSSION AND ANALYSIS II. Financial Summary
p5
AS OF AND FOR THE YEARS ENDED JUNE 30 2010 2009 2008 2007 2006
Financial ratios:1Return on average assets (GAAP basis)2 3.1% (0.3)% 3.4% 6.3% 3.2%Return on average assets (non-GAAP basis)3 3.8% (1.1)% 3.7% 8.6% 4.7%Return on average capital (GAAP basis)4 10.1% (0.9)% 9.6% 19.8% 12.1%Return on average capital (non-GAAP basis)5 11.8% (3.0)% 9.0% 21.1% 13.3%Cash and liquid investments as a percentage of next three years’ estimated net cash requirements 71% 75% 62% 85% 112%External funding liquidity level6 190% 163% 96% 95% n/aDebt to equity ratio7 2.2:1 2.1:1 1.6:1 1.4:1 1.6:1Total reserves against losses on loans to total disbursed portfolio8 7.4% 7.4% 5.5% 6.5% 8.3%Capital measures: Capital to risk-weighted assets ratio9 n/a 44% 48% 57% 54% Total Resources Required ($ billions)10 12.8 10.9 10.4 8.0 n/a Total Resources Available ($ billions)11 16.8 14.8 15.0 13.8 n/a Strategic capital12 4.0 3.9 4.6 5.8 n/a Deployable strategic capital13 2.3 2.3 3.1 4.4 n/a Deployable Strategic Capital as a percentage of Total Resources Available 14% 16% 21% 32% n/a
1 Certain fi nancial ratios as described below are calculated excluding the effects of unrealized gains and losses on investments, other non-trading fi nancial instruments, AOCI,
and impacts from consolidated Variable Interest Entities (VIEs).
2 Net income for the fi scal year as a percentage of the average of total assets at the end of such fi scal year and the previous fi scal year.
3 Net income excluding unrealized gains and losses on certain investments accounted for at fair value, income from consolidated VIEs, and net gains and losses on non-trading fi nancial instruments accounted for at fair value, as a percentage of total disbursed loan and equity investments (net of reserves) at cost, liquid assets net of repos, and other assets averaged for the current period and previous fi scal year.
4 Net income for the fi scal year as a percentage of the average of total capital (excluding payments on account of pending subscriptions) at the end of such fi scal year and the previous fi scal year.
5 Net income excluding unrealized gains and losses on certain investments accounted for at fair value, income from consolidated VIEs, and net gains and losses on non-trading fi nancial instruments accounted for at fair value, as a percentage of paid in share capital and retained earnings (before certain unrealized gains and losses and exclud-ing cumulative designations not yet expensed) averaged for the current period and previous fi scal year.
6 Beginning June 30, 2007, IFC’s liquidity policy was revised so that IFC is to maintain a minimum level of liquidity, consisting of proceeds from external funding to cover at least 65% of the sum of (i) 100% of committed but undisbursed straight senior loans; (ii) 30% of committed guarantees; and (iii) 30% of committed client risk management products.
7 The ratio of outstanding borrowings plus outstanding guarantees to subscribed capital plus undesignated retained earnings (less cumulative unrealized gains and losses on loans, equity investments, and other non-trading fi nancial instruments accounted for at fair value in net income) at the end of the fi scal year.
8 Total reserves against losses on loans to total disbursed loan portfolio is defi ned as reserve against losses on loans as a percentage of the total disbursed loan portfolio at the end of the fi scal year.
9 The ratio of capital (including paid-in capital, retained earnings, and portfolio (general) loan loss reserves) to risk-weighted assets, both on- and off-balance sheet. The ratio does not include designated retained earnings reported in total capital on IFC’s consolidated balance sheet. IFC’s Board of Directors has approved the use of a risk-based economic capital framework beginning in FY08. Parallel use of the capital to risk-weighted assets ratio has now been discontinued.
10 The minimum capital required consistent with the maintenance of IFC’s AAA rating. It is computed as the aggregation of risk-based economic capital requirements for each asset class across the Corporation.
11 Paid in capital plus retained earnings net of designated retained earnings plus general and specifi c reserves against losses on loans. This is the level of available resources under IFC’s risk-based economic capital adequacy framework.
12 Total resources available less total resources required.
13 90% of total resources available less total resources required.

p6
III. Client Services
BUSINESS OVERVIEW
In partnership with private investors, IFC assists in fi nancing the establishment, improvement, and expansion of private sector enterprises by making investments where suffi cient private capital is not otherwise available on reasonable terms. IFC seeks to bring together domestic and foreign private capital and experienced management and thereby create conditions conducive to the fl ow of private capital (domestic and foreign) into productive invest-ments in its developing member countries. In this way, IFC plays a catalytic role in mobilizing additional funding from other investors and lenders through parallel loans, loan participations, partial credit guarantees, securitizations, loan sales, and risk sharing facil-ities (core resource mobilization). In addition to project fi nance, corporate lending and resource mobilization, IFC offers an array of fi nancial products and advisory services to private businesses in the developing world with a view to fulfi lling its developmental mission. IFC also advises member governments on how to create an environment hospitable to the growth of private enterprise and foreign investment.
IFC’s activities are guided by fi ve strategic pillars: (i) strengthen-ing the focus on frontier markets; (ii) building enduring partner-ships with clients in emerging markets; (iii) addressing climate change and ensuring social and environmental sustainability; (iv) promoting private sector growth in infrastructure, health, education, and the food supply chain; and (v) developing local fi nancial markets. IFC’s strategic priorities are aligned with the World Bank Group’s strategic directions.
INVESTMENTS
IFC’s investments are normally made in its developing member countries. The Articles of Agreement mandate that IFC shall invest in productive private enterprise. The requirement for private ownership does not disqualify enterprises that are partly owned by the public sector if such enterprises are organized under local commercial and corporate law, operate free of host government control in a market context and according to profi tability criteria, and/or are in the process of being totally or partially privatized.
IFC’s main investment activity is project and corporate fi nanc-ing. This encompasses “greenfi eld” projects, expansions, and modernizations. IFC also provides fi nancing to selected compa-nies for ongoing investment programs. In addition, IFC facilitates fi nancing through fi nancial intermediaries, covering project and general purpose lending and specialized lending products such as leasing, trade, and mortgage fi nance. These fi nancial inter-mediaries function either as IFC’s borrower, on-lending to private sector companies at their own risk, or as IFC’s agent, identifying com panies for direct loans from IFC.
IFC applies stringent tests of enterprise soundness, project viability, additionality, and developmental impact in determining the eligibility of projects for its investments.
IFC’s investment cycle can be divided into twelve main stages:■ Business development ■ Board of Directors’ review■ Early review and approval■ Appraisal (due diligence) ■ Commitment■ Investment review ■ Disbursement■ Negotiations ■ Project supervision■ Public notifi cation ■ Evaluation ■ Closing
IFC carefully supervises its projects to monitor project perfor-mance and compliance with contractual obligations and with IFC’s internal policies and procedures. IFC’s Board of Directors (Board or Board of Directors) is informed of such matters and of recom-mended courses of action at regular intervals.
ADVISORY SERVICES
Advisory services have become a more substantial and important part of IFC’s business and a critical tool for extending IFC’s reach and impact. IFC’s advisory services cycle can be divided into six main stages:■ Business development ■ Implementation/Supervision■ Early review ■ Project completion■ Appraisal ■ Evaluation
IFC ASSET MANAGEMENT COMPANY
IFC Asset Management Company LLP (AMC), a wholly-owned subsidiary of IFC, mobilizes capital from outside IFC’s traditional investor pool. AMC serves as a fund manager and mobilizes third-party capital to invest in its funds. IFC is a co-investor in such funds.
At June 30, 2010 (FY10-end) AMC has assets under manage-ment1 of $3.9 billion, $1,275 million in the IFC Capitalization (Equity) Fund, LP (the Equity Capitalization Fund); $1,725 million in the IFC Capitalization (Subordinated Debt) Fund, L.P. (the Sub-Debt Capitalization Fund); and $900 million in the IFC African, Latin American and Caribbean Fund, L.P. (the ALAC Fund). The Equity Capitalization Fund and the Sub-Debt Capitalization Fund are collectively referred to as the Capitalization Funds.
The Capitalization Funds, established in FY09, are jointly funded by $1 billion from IFC and $2 billion from a third-party investor: the IFC Capitalization (Equity) Fund, L.P. (the Equity Capitalization Fund); and the IFC Capitalization (Subordinated Debt) Fund, L.P. (the Sub-Debt Fund).
The Equity Capitalization Fund and the Sub-Debt Capitalization Fund are designed to support banks considered vital to the fi nan-cial system of an emerging market country.
1 Assets under management are generally based upon how investment advisory and administrative fees are calculated (including total assets, committed assets, or other measures).
MANAGEMENT’S DISCUSSION AND ANALYSIS

p7
As of June 30, 2010, IFC had disbursed $128 million and other investors have disbursed $82 million to the Equity Capitalization Fund (IFC: $13 million – June 30, 2009; other investors: $8 mil-lion June 30, 2009). As of June 30, 2010, the fund has disbursed $208 million to three investees ($20 million to one investee as of June 30, 2009).
As of June 30, 2010, IFC and other investors have disbursed $2 million to the Sub-Debt Capitalization Fund and no amounts have been disbursed by the fund to investees.
The ALAC Fund was established in FY10 to make investments in companies or other entities located in the Sub-Saharan Africa, Latin America and/or the Caribbean. The ALAC Fund is currently a $900 million fund, $180 million from IFC and $720 million from fi ve other third party investors.
As of June 30, 2010, IFC has disbursed $3 million and other investors have disbursed $13 million to the ALAC Fund. As of June 30, 2010, no amounts have been disbursed by the fund to investees.
OTHER INITIATIVES
IFC has launched a series of initiatives to assist the private sector address the challenges introduced by the global fi nancial crisis that began in FY09. These initiatives are expected to combine IFC funds with contributions mobilized from various sources, including governments and other international fi nancial institutions. IFC’s initiatives are designed to address both the immediate and long-term needs of IFC’s clients.
IFC’s initiatives include:
Trade FinanceLaunched in FY05, the Global Trade Finance Program (GTFP) pro-vides guarantees for trade transactions in emerging markets, pri-marily supporting small and medium enterprises. In addition, IFC has launched a global trade liquidity program (GTLP), an initiative that brings together governments, development fi nance institu-tions, and commercial banks to provide funding for trade fi nance in emerging markets. The GTLP commenced operations in the fourth quarter of FY09.
IFC’s FY10 commitments include $3.5 billion ($2.4 billion – FY09) relating to GTFP. IFC’s FY10 commitments include $0.3 billion ($0.5 billion – FY09), and FY10 resources mobilized include $1.6 bil-lion ($1.4 billion – FY09), relating to GTLP.
InfrastructureThe Infrastructure Crisis Facility is a facility that includes debt and equity components and provides short- to medium-term fi nanc-ing for infrastructure projects. It also includes advisory services to help governments design or redesign public-private-partnership projects.
Microfi nanceThe Microfinance Enhancement Facility (MEF) is designed to address the challenge of restricted availability of micro-fi nance services. As of June 30, 2010, IFC has approval to provide $150 mil-lion to MEF and anticipates other investors would provide an addi-tional $332 million.
Managing Troubled AssetsIFC has created a Debt and Asset Recovery Program to make direct investments in entities with good fundamentals that require debt restructuring as a result of the global fi nancial crisis. The program is to invest in nonperforming loan pools, select servicers, and distressed asset funds, targeted in East Asia and the Pacifi c, Latin America and the Caribbean, and Europe and Central Asia.
INVESTMENT PROGRAM SUMMARY
CommitmentsIn FY10, IFC entered into new commitments totaling $12.7 billion, compared with $10.5 billion in FY09. In addition, IFC mobilized resources totaling $5.4 billion, compared with $4.0 billion in FY09. FY10 and FY09 commitments and core resources mobilized (as described in more detail in “Investment Products”) comprised the following:
FY10 FY09
Commitments2 Loans $ 5,721 $ 5,959Equity investments 2,974 2,069Guarantees: GTFP 3,464 2,380 Other 468 99Client risk management 37 40
Total commitments $ 12,664 $ 10,547
B-loans $ 1,247 $ 1,858Structured fi nance 797 169Parallel loans 734 374Sales of loans and other mobilization 379 –
Total B-loans, structured fi nance, parallel loans and other mobilization $ 3,157 $ 2,401
AMC: IFC Capitalization Equity Fund $ 118 $ 8 IFC Capitalization Sub-debt Fund 65 – IFC African, Latin American and Caribbean Fund 53 –
Total AMC $ 236 $ 8
Other initiatives: Global Trade Liquidity Program 1,580 1,400 Debt and Asset Recovery Program 237 – Microfi nance Enhancement Facility 123 155 Infrastructure Crisis Facility 45 –
Total other initiatives $ 1,985 $ 1,555
Total core resource mobilization $ 5,378 $ 3,964
Core resource mobilization ratio 0.42 0.38
2 Debt security commitments are included in loans and equity investments based on their predominant characteristics.
MANAGEMENT’S DISCUSSION AND ANALYSIS III. Client Services

p8
DISBURSEMENTS
IFC disbursed $6.8 billion for its own account in FY10 ($5.6 billion in FY09): $4.9 billion of loans ($4.4 billion in FY09), $1.6 billion of equity investments ($1.1 billion in FY09), and $0.3 billion of debt securities ($0.1 billion in FY09).
DISBURSED INVESTMENT PORTFOLIO
IFC’s total disbursed investment portfolio (a non-US GAAP perfor-mance measure) was $25.4 billion at June 30, 2010 ($22.4 billion at June 30, 2009), comprising the disbursed loan portfolio of $18.2 bil-lion ($16.8 billion at June 30, 2009), the disbursed equity portfolio of $5.4 billion ($4.1 billion at June 30, 2009), and the disbursed debt security portfolio of $1.8 billion ($1.5 billion at June 30, 2009).
IFC’s disbursed investment portfolio is diversifi ed by sector and geographic region with a focus on strategic high development impact sectors such as fi nancial markets and infrastructure.
The following charts show the distribution of the disbursed investment portfolio by geographical region and sector as of June 30, 2010, and June 30, 2009:
Distribution by Region
FY10 FY09
Distribution by Sector
DISBURSED B-LOANS
The portfolio of disbursed and outstanding B-loans which are serviced by IFC at June 30, 2010, totaled $6.3 billion, as compared with $6.7 billion at June 30, 2009.
Additional information on IFC’s investment portfolio as of and for the years ended June 30, 2010, and June 30, 2009, can be found in Notes B, D, E, F, G, H and I to IFC’s FY10 consolidated fi nancial statements.
Investment Products LOANS
Loans generally have the following characteristics:■ Term: typically amortizing with final maturities generally for
seven to 12 years, although some loans have been extended for tenors as long as 20 years.
■ Currency: primarily in major convertible currencies, princi-pally US dollar, and to a lesser extent, Euro, Swiss franc, and Japanese yen, but with a growing local currency loan portfolio.
■ Interest rate: typically variable (or fixed and swapped into variable).
■ Pricing: refl ects such factors as market conditions and country and project risks.
Latin America and Caribbean
Europe and Central Asia
Asia
Middle East and North Africa
Sub-Saharan Africa
Other
Finance and insurance
Electric power
Oil, gas and mining
Transportation and warehousing
Collective investment vehicles
Information
Food and beverages
Nonmetallic mineral product manufacturing
Chemicals
Industrial consumer products
Agriculture and forestry
Utilities
Wholesale and retail trade
Health Care
Primary metals
Pulp and paper
Accommodation and tourism services
Construction and real estate
Textiles, apparel and leather
Education services
0 5 10 15 20 25 30 35 40 45
FY09 FY10
Percentage
Latin America and Caribbean
Europe and Central Asia
Asia
Middle East and North Africa
Sub-Saharan Africa
Other
MANAGEMENT’S DISCUSSION AND ANALYSIS III. Client Services

p9
IFC’s loans traditionally have been made in major currencies, based on client demand and on IFC’s ability to hedge loans in these currencies through the use of mechanisms such as cross-currency swaps or forward contracts. Fixed-rate loans and loans in currencies other than US dollars are normally economically hedged, using currency and/or interest rate swaps, into US dollar variable rate assets.
There has been a growing demand for IFC to offer local cur-rency products. IFC typically offers local currency products in other currencies where it can hedge the local currency loan cash fl ows back into US dollars using swap markets. IFC’s disbursed loan portfolio at June 30, 2010 includes $2.1 billion of currency products denominated in Russian rubles, Indian rupees, Chinese renminbi, Philippine pesos, Colombian pesos, Indonesian rupiah, South African rand, Brazilian reais, Mexican pesos, and New Turkish lira ($1.9 billion at June 30, 2009).
IFC’s disbursed loan portfolio totaled $18.2 billion at June 30, 2010 ($16.8 billion at June 30, 2009). The carrying value of IFC’s loan portfolio on IFC’s consolidated balance sheet (comprising the disbursed loan portfolio together with adjustments as detailed in Note D to IFC’s FY10 Consolidated Financial Statements) grew 9% to $16.7 billion at June 30, 2010 ($15.3 billion at June 30, 2009).
Loans comprise 72% of the disbursed investment portfolio as of June 30, 2010 (75% at June 30, 2009) and 64% of the carry-ing value of the investment portfolio as of June 30, 2010 (69% at June 30, 2009).
At June 30, 2010, 74% (74% at June 30, 2009) of IFC’s disbursed loan portfolio was US dollar-denominated.
The currency composition of the disbursed loan portfolio at June 30, 2010, and June 30, 2009, is shown below:
Currencies
EQUITY INVESTMENTS
IFC’s equity investments are typically in the form of common or preferred stock which is not mandatorily redeemable by the issuer or puttable to the issuer by IFC and are usually denominated in the currency of the country in which the investment is made.
IFC’s disbursed equity portfolio totaled $5.4 billion at June 30, 2010 ($4.1 billion at June 30, 2009), an increase of 32%.
The carrying value of IFC’s equity investment portfolio (com-prising the disbursed equity portfolio together with adjustments as detailed in Note D to IFC’s FY10 Consolidated Financial Statements) grew 42% to $7.5 billion at June 30, 2010 ($5.3 billion at June 30, 2009).
The fair value of IFC’s equity portfolio3 was $11.0 billion at June 30, 2010 ($8.5 billion at June 30, 2009).
Equity investments accounted for 21% of IFC’s disbursed invest-ment portfolio at June 30, 2010, compared with 18% at June 30, 2009 and 29% of the carrying value of the investment portfolio at June 30, 2010 (24% at June 30, 2009).
DEBT SECURITIES
Debt securities are typically in the form of bonds and notes issued in bearer or registered form, securitized debt obligations (e.g., ABS, MBS, and other collateralized debt obligations) and preferred shares, which are mandatorily redeemable by the issuer or puttable to the issuer by IFC.
IFC’s disbursed debt security portfolio totaled $1.8 billion at June 30, 2010 ($1.5 billion at June 30, 2009).
The carrying value of IFC’s debt securities portfolio (compris-ing the disbursed debt security portfolio together with adjust-ments as detailed in Note D to IFC’s FY10 Consolidated Financial Statements) was $1.8 billion at June 30, 2010 ($1.5 billion at June 30, 2009).
Debt securities accounted for 7% of IFC’s disbursed investment portfolio at June 30, 2010 (7% at June 30, 2009) and 7% of the carrying value of the investment portfolio at June 30, 2010 (7% at June 30, 2009).
GUARANTEES AND PARTIAL CREDIT GUARANTEES
IFC offers partial credit guarantees to clients covering, on a risk-sharing basis, client obligations on bonds and/or loans. IFC’s guarantee is available for debt instruments and trade obligations of clients and covers commercial as well as noncommercial risks. IFC will provide local currency guarantees, but when a guarantee is called, the client will generally be obligated to reimburse IFC in US dollar terms. Guarantee fees are consistent with IFC’s loan pric-ing policies. During FY10, IFC signed $2.7 billion of guarantees, $2.1 billion in FY09.
3 Including “equity-like” securities classifi ed as debt securities in IFC’s consolidated balance sheet and equity-related options.
US dollars
Euro
Russian rubles
Indian rupees
Chinese renminbi
Philippine pesos
Colombian pesos
Indonesian rupiah
South African rand
Brazilian reais
Mexican pesos
New Turkish lira
Other
0 2,000 4,000 6,000 8,000 10,000 12,000 14,000
FY09 FY10
MANAGEMENT’S DISCUSSION AND ANALYSIS III. Client Services

p10
CORE RESOURCE MOBILIZATION
Core Resource mobilization is defi ned as fi nancing from entities other than IFC that becomes available to clients due to IFC’s direct involvement in raising resources. lFC fi nances only a portion, usu-ally not more than 25%, of the cost of any project. All IFC-fi nanced projects, therefore, require other fi nancial partners. IFC mobilizes such private sector fi nance from other entities through loan partic-ipations, parallel loans, partial credit guarantees, securitizations, loan sales, and risk sharing facilities. In FY09, IFC launched AMC and a number of other initiatives, each with a core resource mobili-zation component, and revised its resource mobilization defi nition accordingly to include these in the measure. The components of core resource mobilization are as follows:
B-LoansThe principal direct means by which IFC mobilizes such private sector fi nance is through the sale of participations in its loans (B-loans), known as the B-loan program. Through the B-loan pro-gram, IFC has worked primarily with commercial banks but also with nonbank fi nancial institutions in fi nancing projects since the early 1960s.
Whenever it participates a loan, IFC will always make a loan for its own account (an A-loan), thereby sharing the risk alongside its loan participants. IFC acts as the lender of record and is respon-sible for the administration of the entire loan, including the B-loan. IFC charges fees to the borrower at prevailing market rates to cover the cost of the B-loan.
B-loan commitments were $1,247 million in FY10 ($1,858 million in FY09).
Structured FinanceStructured fi nance comprises partial credit guarantees, securitiza-tions and risk sharing facilities. Structured fi nance commitments, net, defi ned as the amount of fi nancing with a risk position equal to, or senior to, that of IFC’s risk participation in the transaction, totaled $797 million in FY10 ($169 million in FY09).
Parallel LoansLoans from other fi nancial institutions that IFC helped raise for clients and received a fee, but for which IFC is not the lender of record, arranged by IFC in FY10 were $734 million ($374 million in FY09).
Sales of Loans and Other MobilizationLoans originally disbursed and reported on IFC’s balance sheet that were subsequently sold and other mobilization totaled $379 million in FY10 ($0 in FY09).
AMC
Amounts committed by investors other than IFC through Funds managed by AMC totaled $236 million in FY10 ($8 million – FY09), comprising $118 million in respect of the Equity Capitalization Fund ($8 million – FY09), $65 million in respect of the Subordinated Debt Capitalization Fund ($0 – FY09), and $53 million in respect of ALAC Fund ($0 – FY09).
OTHER INITIATIVES
Amounts committed by entities other than IFC to IFC’s other initia-tives totaled $1,985 million in FY10, comprising: $1,580 million in respect of GTLP ($1,400 million – FY09); $237 million in respect of the Debt and Asset Recovery Program ($0 – FY09); $123 million in respect of the Microfi nance Enhancement Facility ($155 million – FY09); and $45 million in respect of the Infrastructure Crisis Facility ($0 – FY09).
CORE RESOURCE MOBILIZATION RATIO
The core resource mobilization ratio is defi ned as:
Loan participations + parallel loans + sales of loans + non-IFC investment part of structured fi nance +
non-IFC commitments in initiatives + non-IFC investments committed in funds managed by AMC
Commitments (IFC investments + IFC portion of structured fi nance +
IFC commitments in new initiatives + IFC investments committed in funds managed by AMC)
For each dollar that IFC committed, IFC mobilized (in the form of B-loans, parallel loans, sales of loans, the non-IFC portion of structured fi nance and the non-IFC commitments in initiatives, and the non-IFC investments committed in funds managed by AMC) $.42 in FY10 ($0.38 in FY09).
CLIENT RISK MANAGEMENT PRODUCTS
IFC provides derivative products to its clients to allow them to hedge their interest rate, currency or commodity price exposures. IFC intermediates between its developing country clients and derivatives market makers in order to provide IFC’s clients with full market access to risk management products.
MANAGEMENT’S DISCUSSION AND ANALYSIS III. Client Services

p11
ADVISORY SERVICES
Advisory services have become a more substantial and important part of IFC’s business and a critical tool for extending IFC’s reach and expanding IFC’s impact. Advisory services contribute sig-nifi cantly to IFC’s additionality by improving the business enabling environment for the private sector as well as the capabilities of private fi rms and service providers. IFC provides such services to promote sustainable private sector investment in developing countries. Through this work, which is funded in partnership with governments and other donors, IFC contributes to development where opportunities for development may be limited.
Through June 30, 2010, IFC’s advisory services were organized into fi ve business lines.■ Investment Climate: to help governments of developing and
transitional countries improve the operating environment for businesses.
■ Access to Finance: to help increase the availability and afford-ability of fi nancial services, focusing particularly on micro, small, and medium enterprises.
■ Corporate Advice: to offer corporate advice to existing and potential investment clients.
■ Environment and Social Sustainability: to promote the large-scale adoption of business models that are both profi table and good for the environment and social development.
■ Infrastructure Advice: to help generate investment opportuni-ties that result in long-term economic growth and better living standards for IFC’s client countries.To strengthen client and strategic focus, beginning July 1, 2010,
IFC’s advisory services business lines were reorganized as follows:■ The former Corporate Advice and Environmental and
Social Sustainability business lines were consolidated into
a Sustainable Business Advisory business line, providing a one-stop-shop for AS with real sector clients.
■ The former Infrastructure Advice business line was re-positioned into the Public-Private Partnership (PPP) Transaction Advisory business line, recognizing its focus on support to governments in designing and implementing PPP transactions in sectors that went beyond infrastructure.
■ The Investment Climate and Access to Finance business lines remained substantially unchanged, focusing on support to gov-ernments and to fi nancial intermediary clients, respectively.Donor funds mobilized (new signed commitments) for advisory
services in FY10 totaled $181 million.The advisory services portfolio at June 30, 2010 included
736 projects with an approved value of $859 million. 226 new proj-ects were approved in FY10, with an approved value of $206 million.
Assets held in Trust Funds pending utilization in advisory services business at June 30, 2010, and June 30, 2009, including $191 million at June 30, 2010 ($187 million at June 30, 2009) of funds provided by IFC in its capacity as a donor are summarized below (US$ millions):
June 30, 2010 June 30, 2009
Executed by IFC(*) $ 904 $ 662Recipient-executed(*) 8 12Financial intermediary fund – 3
Total $ 912 $ 677
(*) includes donor funds for investments.
MANAGEMENT’S DISCUSSION AND ANALYSIS III. Client Services

p12 p12
IV. Treasury Services
LIQUID ASSETS
IFC invests its liquid assets portfolio in highly rated fi xed and fl oat-ing rate instruments issued by, or unconditionally guaranteed by, governments, government agencies and instrumentalities, mul-tilateral organizations, and high quality corporate issuers; these include ABS and MBS, time deposits, and other unconditional obligations of banks and financial institutions. Diversification in multiple dimensions ensures a favorable risk return profi le.
IFC manages the market risk associated with these investments through a variety of hedging techniques including derivatives, principally currency and interest rate swaps and fi nancial futures.
IFC’s liquid assets are invested in fi ve separate portfolios, inter-nally named P0 through P4. All fi ve portfolios are accounted for as trading portfolios.
IFC’s liquid assets portfolio can be summarized as follows:
PORTFOLIO
FAIR VALUE
($ BILLIONS)* COMPRISING MANAGED BY INVESTED IN BENCHMARK
P0 $0.5($0.8)
Proceeds from discount note program and cash infl ows from investment operations
IFC’s Treasury Department
Money market instruments Overnight US dollar LIBID
P1 $13.1($10.4)
Proceeds from market borrowings invested pending disbursement of operational loans
IFC’s Treasury Department
Principally global government bonds, ABS, bank deposits, and high quality corporate bonds generally swapped into 3-month US dollar LIBOR
Custom-created index of a series of six, equally weighted 6-month LIBID deposits that mature on the 15th of each month – average life of 3 months**
P2 $6.1($5.7)
Primarily IFC’s paid-in capital and accumulated earnings that have not been invested in equity and quasi-equity investments or fi xed-rate loans
IFC’s Treasury Department
US Treasuries, ABS, and other sovereign and agency issues
Lehman Brothers US 1–3 year maturity Treasury Index***
P3 $0.7($0.5)
An outsourced portion of the P1 portfolio
External managers appointed by IFC
Global government bonds and other high quality corporate bonds as well as mortgage-backed securities
Same as for P1
P4 $0.6($0.5)
An outsourced portion of the P2 portfolio
External managers appointed by IFC
Global government bonds, and other high quality corporate bonds as well as mortgage-backed securities
Sames as for P2
Total $21.0 bn ($17.9 bn)
*** at June 30, 2010 (June 30, 2009)
*** The net duration of the P1 and P3 benchmarks is approximately 0.25 years.
*** The net duration of the P2 and P4 benchmark is 1.9 years. The benchmark was changed on March 31, 2009 from the Lehman Intermediate Treasury index, which had a duration of approximately 3.8 years.
MANAGEMENT’S DISCUSSION AND ANALYSIS

p13
MANAGEMENT’S DISCUSSION AND ANALYSIS IV. Treasury Services
IFC has a flexible approach to managing the liquid assets portfolios by making investments on an aggregate portfolio basis against its benchmark within specifi ed risk parameters. In implementing these portfolio management strategies, IFC uti-lizes derivative instruments, including futures and options, and takes positions in various sectors and countries. All positions are swapped back into US dollars.
All liquid assets are managed according to an investment authority approved by IFC’s Board of Directors and investment guidelines approved by IFC’s Corporate Risk Committee, a sub-committee of IFC’s Management Team.
A P6 portfolio was created in FY08 in support of IFC’s local cur-rency lending capabilities. The P6 portfolio contains the proceeds of liquidity raised in local currency prior to disbursement and is managed by IFC’s Treasury Department against local interbank rate indices. At June 30, 2010 this portfolio contained short-term money market instruments denominated in Brazilian reais, Russian rubles and Mexican pesos. The P6 portfolio totaled $0.3 billion at June 30, 2010 ($0.4 billion at June 30, 2009). A P7 portfolio was created in FY10, which contains the after-swap proceeds from variable-rate borrowings denominated and invested in Euros. The P7 portfolio was less than $10 million at June 30, 2010.
FUNDING RESOURCES
IFC’s funding resources (comprising borrowings, capital and retained earnings) as of June 30, 2010 and June 30, 2009 are as follows:
FY10 FY09
BorrowingsThe major source of IFC’s borrowings is the international capital markets. Under the Articles of Agreement, IFC may borrow in the public markets of a member country only with approvals from that member and also the member in whose currency the borrow-ing is denominated. IFC borrowed (after the effect of borrowing-related derivatives) $8.8 billion during FY10 ($9.1 billion in FY09 and $6.2 billion in FY08). In addition, IFC’s Board of Directors has authorized the repurchase and/or redemption of debt obligations issued by IFC, which enhances the liquidity of IFC’s borrowings. During FY10, IFC repurchased and retired $0.9 billion of outstand-ing debt ($1.05 billion in FY09; $43 million in FY08), generating gains on buybacks of $62 million in FY10 ($61 million – FY09; $2 mil-lion – FY08).
IFC diversifi es its borrowings by currency, country, source, and maturity to provide fl exibility and cost-effectiveness. IFC also has a developmental role in helping open up new domestic markets to foreign issuers in its member countries. In FY10 IFC borrowed in eleven currencies and in fi nal maturities ranging from 1 to 30 years. Outstanding market borrowings have remaining maturities rang-ing from less than one year to approximately 30 years, with a weighted average remaining contractual maturity of 6.5 years at June 30, 2010 (7.3 years at June 30, 2009). Actual maturities may differ from contractual maturities due to the existence of call fea-tures in certain of IFC’s borrowings.
Market borrowings are generally swapped into fl oating-rate obligations denominated in US dollars. As of June 30, 2010, IFC had gross payables from borrowing-related currency swaps of $13.7 billion ($12.7 billion at June 30, 2009) and from borrowing-related interest rate swaps in the notional principal payable amount of $23.1 billion ($16.5 billion at June 30, 2009). After the effect of these derivative instruments is taken into consideration, 98% of IFC’s market borrowings at June 30, 2010 were vari-able rate US dollar-denominated, substantially unchanged from June 30, 2009.
IFC’s mandate to help develop domestic capital markets can result in providing local currency funds for onlending to its cli-ents rather than being swapped into US dollars. At June 30, 2010, $0.3 billion of non-US dollar-denominated market borrowings in Chinese renminbi and C.F.A. francs were used for such purposes. In addition, the $0.1 billion Brazilian reais borrowing funded a non-investment portfolio loan as opposed to being swapped into US dollars.
The weighted average cost of market borrowings after currency and interest rate swap transactions was 0.5% at June 30, 2010 (1.4% at June 30, 2009).
In the fourth quarter of FY09, IFC launched a short term discount note program to provide an additional liquidity management tool for IFC and to support certain of IFC’s crisis response initiatives. The discount note program provides for issuances with maturities ranging from overnight to one year. At June 30, 2010, $1.4 billion was outstanding under this program ($0 – June 30, 2009).
Borrowings from market sources
Discount Note Program Borrowing from IBRD Paid-in capital
Retained earnings
Borrowings from market sources
Borrowing from IBRD
Paid-in capital
Retained earnings

p14
Capital and Retained EarningsAs of June 30, 2010, IFC’s total capital as reported in IFC’s con-solidated balance sheet amounted to $18.4 billion, up from the June 30, 2009 level of $16.1 billion. At June 30, 2010, total capital comprised $2.4 billion of paid-in capital, substantially unchanged from June 30, 2009, $14.8 billion of retained earnings ($13.0 billion at June 30, 2009), and $1.2 billion of accumulated other compre-hensive income ($0.7 billion at June 30, 2009).
As of June 30, 2010 and 2009, IFC’s authorized capital was $2.45 billion, of which $2.37 billion was subscribed and paid in.
Special Capital IncreaseOn July 20, 2010, the Board of Directors recommended that the Board of Governors approve an increase in the authorized share capital of IFC of $130 million, to $2,580 million, and the issuance of $200 million of shares (including $70 million of unallocated shares).
The Board of Governors also recommended that the Board of Governors approve an increase in Basic Votes aimed at enhanc-ing the voice and participation of developing and transition countries (DTCs) and requiring an amendment to IFC’s Articles of Agreement. Currently the voting power of each IFC member is the sum of its Basic Votes, fi xed at 250 votes per member, and its share votes, with one vote for each share of IFC stock held. At pres-ent, Basic Votes represent 1.88% of total IFC voting power. Once the amendment to the Articles of Agreement becomes effec-tive, the Basic Votes of each member shall be the number of votes that results from an equal distribution among all members of 5.55% of the aggregate sum of the voting power of all members.
The above is expected to result in a shift of the voting power to DTCs by 6.07% to 39.48%.
Designations of Retained EarningsBeginning in the year ended June 30, 2004 (FY04), IFC began a process of designating retained earnings to increase its sup-port of advisory services and, subsequently, for performance-based grants (year ended June 30, 2005 (FY05)), grants to IDA (year ended June 30, 2006 (FY06)), the Global Infrastructure Project Development Fund (FY08), and IFC SME Ventures for IDA Countries (FY08). The levels and purposes of retained earnings designations are set based on Board-approved principles, which are applied each year to assess IFC’s fi nancial capacity and to determine the maximum levels of retained earnings designations.
Amounts available to be designated are determined based on a Board-approved income-based formula and, beginning in FY08,
on a principles-based Board-approved fi nancial distribution policy, and are approved by IFC’s Board of Directors. Expenditures for the various approved designations are recorded as expenses in IFC’s consolidated income statement in the year in which they occur, and have the effect of reducing retained earnings desig-nated for this specifi c purpose.
On August 5, 2009, IFC’s Board of Directors approved a desig-nation of $200 million of IFC’s retained earnings for grants to IDA and concurrently reallocated $70 million of the unutilized balances of prior year designations relating to performance-based grants, $70 million of the unutilized balances of prior year designations relating to the Global Infrastructure Project Development Fund and $60 million of the unutilized balances relating to IFC SME Ventures for IDA countries. On October 7, 2009, IFC’s Board of Governors noted with approval the designations and realloca-tions approved by IFC’s Board of Directors on August 5, 2009. Accordingly, IFC recorded $200 million as an expense for grants to IDA in IFC’s FY10 consolidated income statement, leaving a remaining indicative program for Grants to IDA for the IDA 15 replenishment of up to $600 million.
On June 23, 2010, IFC’s Board of Directors approved a transfer of $5 million of the unutilized balance of prior period designations relating to performance-based grants to advisory services.
At June 30, 2010, retained earnings comprised $14.3 billion of undesignated retained earnings ($12.3 billion at June 30, 2009; and $12.4 billion at June 30, 2008), $0.3 billion of retained earnings designated for advisory services ($0.4 billion at June 30, 2009; and $0.4 billion at June 30, 2008), $0.1 billion of retained earnings des-ignated for PBG ($0.2 billion at June 30, 2009; 0.2 billion at June 30, 2008), less than $0.05 billion of retained earnings designated for the Global Infrastructure Project Development Fund ($0.1 bil-lion at June 30, 2009; $0.1 billion at June 30, 2008), and less than $0.05 billion of retained earnings designated for IFC SME Ventures for IDA countries ($0.2 billion at June 30, 2009; and $0.2 billion at June 30, 2008).
FY10 DesignationsOn August 5, 2010, IFC’s Board of Directors approved a desig-
nation of $600 million of IFC’s retained earnings for grants to IDA and $10 million of IFC’s retained earnings for advisory services. These designations are expected to be noted with approval by the Board of Governors, and thereby concluded in FY11.
MANAGEMENT’S DISCUSSION AND ANALYSIS IV. Treasury Services

p15
MANAGEMENT’S DISCUSSION AND ANALYSIS
V. Enterprise Risk ManagementIn executing its sustainable private sector development business, IFC assumes various kinds of risks. IFC’s management has defi ned a comprehensive enterprise risk management framework, within which it recognizes six main risk groupings: strategic and repu-tational risk, credit risk, fi nancial risk, operational risk, environ-mental and social risk, and legal risk. The Risk Management Vice Presidency has oversight responsibility for credit, fi nancial and operational risk. Environmental and social risk is managed by the Advisory Services Vice Presidency while legal risk is overseen by the General Counsel Vice Presidency. The Corporation proactively manages all aforementioned risk categories through a Corporate Risk Committee, a subset of the Management Team, which reviews all risk policies and sets risk standards for the Corporation. The Corporate Operations Committee, a subset of the Management Group, has oversight for strategic and reputational risk in both investment and advisory activities.
Active management of these risks is a key determinant of IFC’s success and its ability to maintain a stable capital and earnings base, and is an essential part of its operations. As part of its enter-prise risk management framework, IFC has adopted several key fi nancial and exposure policies.
FY10 ENTERPRISE RISK HIGHLIGHTS
After the stand-alone Risk Management Vice Presidency was established in FY07, the risk management function in IFC have continued to be enhanced in FY10 through integration and
expansion of existing functions and in some cases, establishing new capacity for additional functions.
The global fi nancial crisis has highlighted the critical impor-tance of ensuring a sound fi nancial structure and the urgent need for more proactive risk management practices. Through FY10, IFC continued to dedicate signifi cant additional resources to all areas of risk management.
The principal measures IFC has taken in this regard include: ■ Improving and developing the tools and models needed for
measuring risk and developing a forward-looking framework to allow for better management of capital adequacy, liquid-ity and resource utilization through the Integrated Risk Management Department which is mandated to work closely with Investment Departments and the Treasury Department on assessing and managing credit, market and liquidity risk on an enterprise-wide basis.
■ Continuing to expand IFC’s operational risk assessment and management capabilities, including the roll out of Risk and Control Self Assessment for all signifi cant business processes.
■ Continuing to streamline and strengthen operating processes and enhancing reporting effectiveness and accountability through an ongoing Business Process Improvement initiative.
■ Continuing to strengthen internal controls especially around accounting and fi nancial reporting, advisory service activities, and information technology expenditures.
■ Enhancing the existing framework for economic capital, risk adjusted return on capital and asset allocation to allow for a forward-looking management of capital adequacy.
■ Developing and/or implementing important risk management tools including enhanced risk rating systems for early risk identi-fi cation and heightened portfolio supervision. These tools allow for greater decentralization and more accountability for pricing, performance measurement and portfolio management.
Strategic Additionality Devt Impact Strategic Fit
Credit Customer Country Counterparty Sector Product
Financial Market Liquidity Funding
Environmental and Social Operational People Systems Processes External Events
Reputational
Legal

p16
IFC has been experiencing strong growth in all its businesses and is focused on implementing its strategic objective of becom-ing a client-driven organization, providing global knowledge and local expertise with decentralized decision- making. In parallel, IFC has stepped up its efforts to maintain asset quality, enhance the independence of its risk management function, and reaffi rm the enterprise-wide nature of its mandate.
In line with IFC’s decentralization strategy, there is an increased shift of risk functions to key field offices and a mapping of Washington, DC-based risk specialists to regions. During FY10, IFC increased risk management staffi ng and placed credit risk and special operations offi cers and other risk disciplines in the Hong Kong, Istanbul and Johannesburg regional hubs in order to improve the timeliness and quality of the risk decisions process. At the same time, risk standards and controls are continuing to be centrally managed.
During FY10, IFC increased its focus on proactive portfolio management by continuing to reach out to clients to help them assess their vulnerabilities in light of the global economic crisis. Throughout the year, a number of stress tests were performed to review risks in IFC’s investment portfolio.
The comprehensiveness of the risk process at IFC necessitates reviews of economic and social risks, corporate governance stan-dards, and integrity risk of clients, in addition to the more tradi-tional credit quality and operational concerns.
IFC’s risk management framework has allowed the Corporation to respond quickly and effectively to the global economic crisis.
In FY10, the Integrated Risk Management Department pre-pared an integrated risk management framework report for the Board to provide an integrated and holistic picture of risk man-agement activities within IFC and is working towards aligning this report with the annual integrated risk monitoring report prepared by IBRD starting in FY11.
STRATEGIC AND REPUTATIONAL RISK
IFC defi nes strategic risk as the potential reputation, fi nancial, and other consequences of a failure to achieve its strategic mission and, in particular, its sustainable development mandate.
The overall management of strategic risk is effected through the defi nition and implementation of an annual strategy for meet-ing IFC’s mission and guidelines for its investment operations, advisory services, and treasury activities. The strategy is devel-oped with Senior Management by the Corporate Strategy Department, and is approved by the Board of Directors. The Independent Evaluation Group conducts ex post evaluations of the implementation of IFC’s strategy on an ongoing basis.
IFC’s commitment to quality enterprise risk management, par-ticularly on the environment and social front, continues to gain acceptance with our strategic partners, as the “Equator Principles” announced in FY05 have now become an established standard for fi nancial institutions engaged in fi nance in the emerging markets. Responsibility for managing these economic and social risk prin-ciples, both internally and in liaison with other fi nancial institutions rests with the Environment and Social Development Department.
In addition, IFC addresses corporate governance risks by assessing its clients’ commitment to, and implementation of,
good corporate governance regimes as part of the investment process. IFC is focused on ensuring that the evolving principles of corporate governance are accepted and practiced by our clients, and great emphasis is placed on leading in the develop-ment of these standards in this area. The Development Financial Institution (DFI) Statement on corporate governance of FY09 has led to an effort to develop a common set of tools, based on IFC’s corporate governance methodology, for assessing corporate gov-ernance for adoption by DFIs. Responsibility for managing corpo-rate governance (both internally and within the operations of our clients’ operations) rests with the Corporate Governance unit of the Department of Corporate Advice.
More broadly, the responsibility for management of the integ-rity and reputational risks associated with the selection of clients and partners rests with the operational departments. Support and knowledge sharing are provided by the Business Risk Department.
Communication activities related to reputational risk are man-aged by the Corporate Relations Department, which provides advice on strategic and crisis communications to mitigate and manage the potential and actual reputation risk both at the corpo-rate and the project level throughout the investment cycle.
Given the nature and scope of products and services that IFC provides its clients in furtherance of its development mandate, operational or business confl icts of interest can arise in the normal course of its activities. IFC recognizes that adverse reputational, client-relationship and other implications can arise if such con-fl icts are not properly managed. In order to properly manage operational or business confl icts, IFC has implemented processes directed at (i) the identifi cation of such confl icts as and when they arise (ii) the application of mitigation measures specifi cally tailored to the circumstances pertaining to the identifi ed confl icts.
The key guiding principles and policies established as part of the framework for managing strategic risk are as follows:
Guiding Principles for IFC’s OperationsCatalytic role: IFC will seek above all to be a catalyst in facilitat-ing productive investments in the private sector of its developing member countries. It does so by mobilizing fi nancing from both foreign and domestic investors from the private and public sectors.
Business partnership: IFC functions like a business in partner-ship with the private sector. Thus, IFC takes the same commercial risks as do private institutions, investing its funds under the disci-pline of the marketplace.
Additionality: IFC participates in an investment only when it can make a special contribution not offered or brought to the deal by other investors.
IFC Sanctions ProceduresIn FY07, IFC established a set of procedures to sanction parties involved in IFC projects committing corrupt, fraudulent, collusive, coercive or obstructive practices. In April 2010 the World Bank Group concluded an agreement with other multilateral develop-ment banks (MDBs) whereby entities debarred by one MDB may be sanctioned for the same misconduct by the other participating development banks. The enhanced emphasis on combating fraud and corruption does not change the high expectations IFC has always held for its staff, clients and projects, including due dili-gence and commitment to good corporate governance.
MANAGEMENT’S DISCUSSION AND ANALYSIS V. Enterprise Risk Management

p17
MANAGEMENT’S DISCUSSION AND ANALYSIS V. Enterprise Risk Management
FY10 STRATEGIC RISK HIGHLIGHTS
IFC’s Environmental and Social Policies have become widely rec-ognized as best practice with 10 further international commercial banks adopting them in the form of the Equator Principles. To date and as of August 5, 2010, 68 leading international fi nancial institutions have adopted these principles, including 17 from emerging markets.
IFC defi nes environment and social risk as the risk that IFC’s sustainability policy and performance standards are not achieving their objectives.
IFC integrates environment and social risk management throughout its investment cycle and helps companies (primarily in IFC’s loan and equity portfolios, but also in advisory services) pro-actively identify, avoid and address risks in the following key ways:■ Environment and social due diligence (including risk analysis)■ Project-specific advice to meet IFC environmental and
social standards.■ Project-specifi c business risk management services.■ Guidance and training for commercial banks, private equity
funds and other fi nancial intermediaries.■ Annual monitoring and continuous improvement of environ-
mental, social and business performance.■ Assurance to shareholders and stakeholders.
IFC’s Environment and Social Department develops environ-mental and social standards and assesses risk for all projects and for IFC as a whole in addition to maintaining a quantitative and qualitative methodology of risk rating IFC’s investment portfolio through the Environmental and Social Risk Rating score. In 2006, IFC introduced an internal Environment and Social Management System, to ensure that IFC’s Performance Standards and Disclosure Policy are applied correctly and systematically by IFC in every investment project, with quality in implementation and a focus on the outcome that the clients must achieve.
In light of the fi nancial crisis, IFC has increased environmental and social supervision visits and interactions with clients based upon portfolio stress testing. IFC’s Performance Standards are a global good adopted by other commercial banks through the Equator Principles. IFC periodically updates its Sustainability Policy and Performance Standards to ensure IFC continues to play a leadership role in setting global environmental and social prac-tice and to ensure the Performance Standards remain consistent with the evolving sustainability agenda.
CREDIT RISK
IFC defines credit risk as the potential reduction in value of on- and off-balance sheet assets due to a deteriorating credit profi le of its clients, the countries in which it invests, or a fi nancial counterparty. Credit risk is incurred in two areas of IFC’s opera-tions: (i) investment operations, where IFC provides loans, invests in debt securities and equity investments, provides guarantees and acts as a derivatives counterparty for clients in its developing member countries; and (ii) treasury, where credit risk is incurred with counterparties in IFC’s liquid asset, borrowing and asset- liability management. As part of its mandate, IFC is prohibited from accepting sovereign government guarantees of repayment
on its investments and, therefore, incurs commercial and sover-eign risk on its investments.
Until June 30, 2008, IFC’s Risk Management and Financial Policy Department had oversight responsibility for overall fi nancial risk management and, in addition, monitored and controlled credit risk arising in IFC’s treasury activities. Effective July 1, 2008, this responsibility was assumed by a combination of the Integrated Risk Management and Credit Review Departments. The Credit Review Department plays a key role with respect to IFC’s credit risk exposures to clients in developing countries. At origination of new investments, the Credit Review Department analyzes infor-mation obtained from the investment departments and provides an independent review of the credit risk of the transaction. After commitment, the quality of IFC’s investment portfolio is moni-tored according to supervision principles and procedures defi ned in the Operational Policies and Procedures. Responsibility for the day-to-day monitoring and management of credit risk in the portfolio rests with the portfolio management units of individual investment departments. Their assessments are subject to quar-terly review, on a sample basis, by the Loss Provisioning Division of the Accounting and Financial Operations Department and by the Credit Review Department.
IFC’s investment portfolio is subject to a number of operational and prudential limits, including limitations on single project/client exposure, single country exposure, and segment concentration. Similarly, credit policies and guidelines have been formulated cov-ering treasury operations; these are subject to annual review and approval by the Corporate Risk Committee.
Credit risk across IFC’s investment portfolio is monitored and managed by the Corporate Portfolio Management Department through the review of equity valuations, proactive identifi cation of emerging risks and portfolio stress testing in focus sub-portfolios.
For jeopardy investments, the Depar tment of Special Operations provides rapid response and focused attention on portfolio projects that require more sophisticated workout and restructuring. Early involvement is the key to recovery when projects get into difficulty. To help enable early involvement, seasoned professionals from Special Operations Department are part of the regional crisis response teams looking at potential issues with IFC’s investments. IFC instituted objective criteria for the Department of Special Operations involvement in troubled projects three years ago and in FY10, strengthened that criterion to ensure earlier intervention given the ongoing effects of the fi nancial crisis.
The credit risk of loans is quantifi ed in terms of the probability of default, loss given default and exposure at risk. These risk param-eters are used to determine risk based economic capital for capital adequacy, capital allocation and internal risk management pur-poses as well as for setting general loan loss reserves and limits.
While top-down economic capital measures are well integrated into IFC’s risk management framework, IFC Management rec-ognizes the need to enhance the Corporation’s use of economic capital in making investment-level decisions. To this end, several enhancements were made to IFC’s economic capital framework during FY10. These enhancements include the introduction of additional risk differentiation into the required economic capital ratios; translation of country limits from the existing notional

p18
exposure limits into economic capital-based limits; and a process for allocating capital by department being developed for imple-mentation in FY11.
Treasury counterparty credit risk is managed by the Integrated Risk Management Department to mitigate potential losses from the failure of a trading counterparty to fulfi ll its contractual obli-gations. General counterparty eligibility criteria are set by IFC’s Board-approved Asset-Liability Management and Derivative Products Authorization and Liquid Asset Management General Investment Authorization. IFC Counterparties are subject to con-servative eligibility criteria and are currently restricted to banks and fi nancial institutions with high quality credit ratings by leading international credit rating agencies.
The eligibility criteria and limits of Treasury counter parties are stipulated by Liquid Asset Investment Guidelines and Treasury Counterparty Credit Limits Guidelines, both of which are approved by the Corporate Risk Committee.
Specifi cally, IFC has adopted the following key fi nancial policies and guidelines:
Investment Operations1. IFC does not normally fi nance for its own account more than
25% of a project’s cost.2. Total exposure to a single obligor may not exceed an eco-
nomic capital limit of $75 million (economic capital required is dependent upon the product mix, as different products have different risks and therefore require different levels of capital support) and a nominal limit of $300 million based on disbursed/ outstanding exposures.
3. Total exposure to an economic group of obligors may not exceed an economic capital limit of $200 million and a nominal limit of $800 million based on disbursed outstanding exposures.
Portfolio Management 1. The maximum economic capital exposure in a country cannot
exceed 7% of IFC’s total resources available (total resources available is defi ned as the sum of (i) paid-in-capital (ii) retained earnings net of designations and certain unrealized gains/losses; and (iii) total loan loss reserves and economic capital exposure is calculated as a percentage of exposures at risk (100% of outstanding + 75% of undisbursed portfolio, based on required economic capital ratios determined by product).
2. Economic capital exposure limits ranging from 3% to 7% of total resources available are set for each country, based on the size of its economy and risk rating.
3. IFC lender of record exposure in a country (outstanding) may not exceed 10% of a country’s total long-term external debt for Heavily Indebted Poor Countries and 5% for all other countries. Exceptions for countries with low levels of external debt may be made by the Corporate Risk Committee. Lower trigger levels are set for certain countries.
4. IFC’s total exposure (outstanding net of specifi c reserves on loans) to a single risk sector (i.e., business sectors that are heav-ily infl uenced by a single, identifi able, world price index) may not exceed 12% of net worth plus general reserves on loans. Lower review trigger levels are set for single sectors, and individually for the fi nance and insurance sector, based on IFC’s net worth plus general reserves on loans and the country exposure level.
5. IFC’s committed exposure in guarantees that are subrogated in local currency is limited to $300 million for currencies for which there are no adequate currency and interest rate risk hedging instruments as determined by IFC’s Treasury Department at the time of commitment. There is a sublimit of $100 million for an individual currency under this limit.
Treasury Operations1. Counterparties are subject to conservative eligibility criteria.
For derivative instruments IFC’s counterparties are currently restricted to banks and fi nancial institutions with a high qual-ity credit rating (with a mark-to-market agreement) by leading international credit rating agencies.
2. Exposures to individual counterparties are subject to concen-tration limits. For derivatives, exposure is measured in terms of replacement cost for measuring total potential exposure. Institution-specifi c limits are updated at least quarterly based on changes in the total size of IFC derivatives portfolio or as needed according to changes in counterparty’s fundamental situation or credit status.
3. To limit exposure, IFC signs collateral agreements with coun-terparties that require the posting of collateral when net mark-to-market exposure exceeds certain predetermined thresholds, which decrease as a counterparty’s credit rating deteriorates. IFC also requires that low quality counterparties should not have more than 30% of total net-of-collateral exposures.
4. Because counterparties can be downgraded during the life of a transaction, the agreements provide an option for IFC to termi-nate all swaps if the counterparty is downgraded below invest-ment grade or if other early termination events occur that are standard in the market.
5. For exchange-traded instruments, IFC limits credit risk by restricting transactions to a list of authorized exchanges, con-tracts and dealers, and by placing limits on the Corporation’s position in each contract.
FY10 CREDIT RISK HIGHLIGHTS
The global credit cycle rebounded to positive in FY10 fueled by accommodative fiscal policy and high levels of liquidity, char-acterized by low spreads and low yields. In contrast, FY08 and FY09 have been characterized by signifi cant volatility in credit markets. The quality of IFC’s investment portfolio, as measured by the aggregate risk rating improved as recovery took root in emerging markets.
IFC does not recognize income on loans where collectibility is in doubt or payments of interest or principal are past due more than 60 days unless management anticipates that collection of interest is expected in the near future.
The amount of nonaccruing loans as a percentage of the dis-bursed loan portfolio4, a key indicator of loan portfolio perfor-mance, increased to 4.8% at June 30, 2010 (2.7% at June 30, 2009). The principal amount outstanding on nonaccrual loans totaled $877 million at June 30, 2010, an increase of $420 million (92%) from the June 30, 2009, level of $457 million.
4 Excluding “loan-like” debt securities.
MANAGEMENT’S DISCUSSION AND ANALYSIS V. Enterprise Risk Management

p19
MANAGEMENT’S DISCUSSION AND ANALYSIS V. Enterprise Risk Management
Total reserves against losses on loans at June 30, 2010, increased to $1,349 million ($1,238 million at June 30, 2009), driven by an increase in specifi c loan loss reserves of $132 million. General loan loss reserves decreased by $21 million during FY10, due to improved credit risk ratings on unimpaired loans. Total reserves against losses on loans are equivalent to 7.4% of the disbursed loan portfolio, unchanged from June 30, 2009.
The fi ve-year trend of nonaccruing loans is presented below:
Nonaccruing Loans
IFC operates under the assumption that the guarantee port-folio is exposed to the same idiosyncratic and systematic risks as IFC’s loan portfolio and the inherent, probable losses in the guarantee portfolio need to be covered by an allowance for loss. The allowance at June 30, 2010, was $24 million ($14 million at June 30, 2009), based on the year-end portfolio, and is included in payables and other liabilities on IFC’s consolidated balance sheet. The increase in allowance for the year, $10 million for FY10 ($3 million decrease for FY09), is included in the (provision) release of provision for losses on loans and guarantees in the consolidated income statement.
During FY10, IFC suffered no losses (FY09 – $3 million) due to rehedging costs related to terminating existing swap exposures.
In accordance with IFC’s key fi nancial policies and guidelines noted above, IFC holds collateral in the amount of $1,476 million at June 30, 2010 ($1,139 million – June 30, 2009).
FINANCIAL RISK
IFC defi nes fi nancial risk in three components: (a) the potential inability to realize asset values in its portfolio suffi cient to meet obligations to disburse funds as they arise (liquidity risk); (b) the potential inability to access funding at reasonable cost (funding risk); and (c) a deterioration in values of fi nancial instruments or positions due to changes in market variables such as interest and exchange rates and the volatility thereof (market risk).
KEY FINANCIAL POLICIES AND GUIDELINES
IFC operates under a number of key fi nancial policies and guidelines as detailed below, which have been approved by its Board of Directors:1. Disbursed equity plus quasi-equity investments (net of impair-
ment write-downs) may not exceed 100% of net worth.2. Minimum liquidity (liquid assets plus undrawn borrowing com-
mitments from IBRD) must be suffi cient at all times to cover at least 45% of IFC’s estimated net cash requirements for the next three years.
3. Matched-funding policy: Loans are funded with liabilities hav-ing the same characteristics in terms of interest rate basis and currency and, for fi xed rate loans, duration except for Board-approved new products involving asset-liability mismatches. IFC maintains a minimum level of liquidity, consisting of pro-ceeds from external funding, that covers at least 65% of the sum of: (i) 100% of committed but undisbursed straight senior loans; (ii) 30% of committed guarantees; and (iii) 30% of committed cli-ent risk management products.
4. IFC is required to maintain a minimum level of total resources (including paid-in capital, total loss reserves and retained earn-ings, net of designations) equal to total potential losses for all on- and off-balance sheet exposures estimated at levels consis-tent with the maintenance of a AAA rating.In addition, under IFC’s Articles of Agreement, as long as IFC
has outstanding borrowings from IBRD, IFC’s leverage, as mea-sured by the ratio of IFC’s outstanding debt (borrowings plus out-standing guarantees) to IFC’s net worth (using subscribed capital), may not exceed 4.0 to 1.
The impact of the global fi nancial crisis, though subsiding in some regions, continues to be severe for many vulnerable coun-tries. IFC has taken great strides in addressing the needs of the private sector in emerging markets, while proactively managing its own capital position and fi nancial risk. The overall fi nancial risk for IFC is defi ned by the adequacy of its fi nancial resources to meet potential future fi nancial needs. The Corporation’s future fi nancial strength is dependent on many factors including: the economic environment; equity returns; future designations; and the rate of growth and capital usage for IFC’s portfolio.
LIQUIDITY RISK
The primary instruments for maintaining suffi cient liquidity are IFC’s liquid asset portfolios, including the P6 portfolio and, begin-ning in FY10, the P7 portfolio: ■ P0, which is generally invested in short-dated deposits, money mar-
ket funds, fi xed certifi cates of deposits, one-month fl oater securities and repos, refl ecting its use for short-term funding requirements.
■ P1 and P2, which are generally invested in: (a) high quality for-eign sovereign, sovereign-guaranteed and supranational fi xed income instruments; (b) US Treasury or agency instruments; (c) high quality ABS rated by at least two rating agencies and/or other high quality notes issued by corporations; (d) MBS; (e) interest rate futures and swaps to manage currency risk in the portfolio, as well as its duration relative to benchmark; and (f) cash deposits and repos.
2006*
0 200 400 600 800 1,000
0 1 2 3 4 5 6
2007*
2008
2009
2010
$ millions
Percentage
$ millions Percentage of disbursed loans

p20
■ P3, which is an outsourced portion of the P1 portfolio (managed by external managers).
■ P4, which is an outsourced portion of the P2 portfolio (managed by external managers).
■ P6, which is invested in short-term local currency money market instruments and local government securities.
■ P7, which consists of after-swap proceeds from variable-rate borrowings denominated and invested in Euros.
FY10 LIQUIDITY RISK HIGHLIGHTS
On June 30, 2010, IFC’s liquidity level stood at $21.0 billion ($17.9 billion on June 30, 2009). Current levels of liquid assets also represented 190% of the sum of (i) 100% of committed but undis-bursed straight senior loans; (ii) 30% of committed guarantees; and (iii) 30% of committed client risk management products (163% on June 30, 2009).
FUNDING RISK
IFC’s primary objective with respect to managing funding risk is, through the adoption of the key fi nancial policies described above, to maintain its triple-A credit ratings and, thereby, maintain access to market funding as needed at the lowest possible cost.
The risk of higher funding costs is also reduced by IFC’s annual funding targets, the US$ billion-dollar benchmark bonds, and the Discount Note Program. Accessing the capital markets for fi nanc-ing establishes investor confi dence, liquidity, price transparency, and a diversifi ed investor base, all of which help to reduce fi nanc-ing cost. IFC’s Discount Note Program was launched in June 2009 to provide swift access to funded liquidity, to complement tradi-tional funding sources, and to provide a natural funding source for GTFP.
FY10 FUNDING RISK HIGHLIGHTS
During FY10, IFC raised $8.8 billion, net of derivatives ($9.1 bil-lion in FY09 and $6.2 billion in FY08). The outstanding balance under the Discount Note Program at June 30, 2010 was $1.4 billion. Funding costs compared to US$ LIBOR for IFC increased signifi -cantly during FY09 as credit spreads for IFC widened. During FY10, credit spreads for IFC narrowed somewhat but remained wider than those generally experienced by IFC in FY09 and prior.
MARKET RISK
IFC’s exposure to market risk is minimized by adopting the matched-funding policy noted above and by using deriva-tive instruments to convert assets and liabilities into fl oating rate US dollar assets and liabilities with similar duration.
INVESTMENT OPERATIONS
Interest rate and currency exchange risk associated with fi xed rate and/or non-US dollar lending is hedged via currency and interest rate swaps that convert cash fl ows into variable rate US dollar fl ows.
Exposures to market risk resulting from derivative transactions with clients, which are intended to facilitate clients’ risk manage-ment, are minimized by entering into offsetting positions with highly rated market counterparties.
LIQUID ASSET PORTFOLIOS
The P0, P1 and P3 portfolios are managed to variable rate US dol-lar benchmarks, on a portfolio basis. To this end, a variety of derivative instruments are used, including short-term, over-the-counter foreign exchange forwards (covered forwards), interest rate and currency swaps, and exchange-traded interest rate futures and options. IFC also takes both long and short posi-tions in securities in the management of these portfolios to their respective benchmarks.
The primary source of market risk in the liquid asset portfolios is the P2 and P4 portfolios, which are managed to Barclay’s 1-3 year US Treasury Index benchmark. P2 represents the portion of IFC’s capital not disbursed as equity investments, and the benchmark refl ects the chosen risk profi le for this un-invested capital (Paid-in capital and retained earnings). P4 represents an outsourced portion of the P2 portfolio. In addition, the P1 and P3 portfolios contain a degree of market risk (e.g., spread risk).
The P6 portfolio consists of foreign currency proceeds raised locally through swaps and other funding instruments to provide more fl exible local currency loan products to clients.
The P7 portfolio is managed to six equal-weighted EURIBID deposits maturing at the next six monthly reset dates of out-standing liabilities, rebalanced at each calendar month-end.
BORROWING ACTIVITIES
Access to funding is maximized, and cost is minimized, by issuing debt securities in various capital markets in a variety of currencies, sometimes using complex structures. These structures include borrowings payable in multiple currencies, or borrowings with principal and/or interest determined by reference to a specifi ed index such as a reference interest rate, or one or more foreign exchange rates.
Market risk associated with fi xed rate obligations and struc-tured instruments entered into as part of IFC’s funding program is generally mitigated by using derivative instruments to convert them into variable rate US dollar obligations, consistent with the matched-funding policy.
ASSET-LIABILITY MANAGEMENT
While IFC’s matched-funding policy provides a signifi cant level of protection against currency and interest rate risk, IFC can be exposed to residual market risk in its overall asset and liability
MANAGEMENT’S DISCUSSION AND ANALYSIS V. Enterprise Risk Management
p21
MANAGEMENT’S DISCUSSION AND ANALYSIS V. Enterprise Risk Management
management of the funded balance sheet. This residual market risk is monitored by the Asset-Liability Management group within the Treasury and Integrated Risk Management Departments.
Residual currency risk arises from events such as changes in the level of non-US dollar loan loss reserves. This risk is managed by monitoring the aggregate position in each lending currency and hedging the exposure when the net asset or liability position exceeds $5 million equivalent.
Residual interest rate risk may arise from two main sources:■ Assets that are fully match-funded at inception, which can
become mismatched over time due to write-downs, prepay-ments, or rescheduling; and
■ Differing interest rate reset dates on assets and liabilities.This residual risk is managed by measuring the sensitivity of
the present value of assets and liabilities in each currency to each basis point change in interest rates, with an action trigger of $50,000 for a one basis point parallel move in the yield curve.
FY10 MARKET RISK HIGHLIGHTS
Total liquid asset returns (comprising interest, realized and unreal-ized gains and losses, and foreign currency transaction (losses) gains) were $815 million in FY10 ($474 million in FY09 and $473 mil-lion in FY08), of which $393 million was attributable to the P0, P1 and P3 portfolios ($156 million in FY09 and $93 million in FY08), $422 million was attributable to the P2 and P4 portfolios ($318 mil-lion in FY09 and $345 million in FY08)5. The overall market environ-ment in FY10 and the resulting impact on the performance of IFC’s liquid assets portfolios are discussed in more detail in “Results of Operations”.
Foreign currency transaction losses on non-trading activities for FY10 included in net income were $82 million ($10 million gains in FY09 and $39 million losses in FY08). Foreign currency trans-action gains on investments in debt securities accounted for as available-for-sale for FY10 included in Other Comprehensive Income (OCI) were $53 million ($69 million losses in FY09 and $85 million gains in FY08).
OPERATIONAL RISK
Consistent with “Internal Convergence of Capital Measurement and Capital Standards, A Revised Framework” issued by the Basel Committee on Banking Supervision in June 2004, IFC defines operational risk as the risk of loss resulting from inadequate or failed internal processes, people and systems or from external events.
During FY10, the Corporate Risk Committee approved an Operational Risk Management (ORM) directive that establishes the approach and roles and responsibilities for ORM in the Corporation. Responsibility for the implementation of the direc-tive and procedures for managing and monitoring operational risk rests with the Business Risk Department.
5 In addition, FY08 income from liquid assets included $35 million from the P6 potfolio. Beginning in FY09, income from the P6 portfolio ($27 million in FY10; $42 million in FY09) is reported in other income.
IFC’s ORM approach is designed to ensure that operational risks are identifi ed, assessed, and managed so as to minimize potential adverse impacts, thus enabling a determination, for each area (people, systems, processes and external events), which risks IFC will: (i) manage internally, as part of its ongoing business; (ii) miti-gate through contingency planning; or (iii) transfer to third parties, whether by subcontracting, outsourcing, or insurance.
IFC seeks to mitigate the risks it manages internally by maintain-ing a comprehensive system of internal controls that is designed not only to identify the parameters of various risks but also to monitor and control those areas of particular concern.
IFC utilizes risk transfer, including insurance, at both the project and the institutional levels for mitigation of low frequency and high severity operational risks. At both levels, IFC identifi es and evalu-ates risks, determines available contractual transfer and insur-ance options, implements the optimal structure, and tracks its effectiveness over time. IFC also insures its corporate assets and operations against catastrophic losses where commercially viable.
Other key components of IFC’s operational risk management approach include:■ Operational risk assessment and measurement based on mar-
ket practices and tools.■ Adoption of the COSO6 control framework as the basis for its
evaluation of the effectiveness of its internal controls over fi nan-cial reporting.
■ Ongoing independent review of the effectiveness of IFC’s inter-nal controls in selected key areas and functions performed by the Internal Audit Vice Presidency of the World Bank Group.
■ Promoting data integrity in the Corporation based on its Data Management Policy, overseen by the Information Quality Group within the Accounting and Financial Operations depart-ment and through a network of Departmental Data Stewards.
■ Ensuring that processes and controls are in place to manage the risks in new products and initiatives before they are executed, through a New Products/Initiatives Assessment Group with rep-resentation from key business and support functions.
FY10 OPERATIONAL RISK MANAGEMENT HIGHLIGHTS
IFC is continuing a multiyear effort to analyze and develop enhanced methodologies for identifying, measuring, monitoring and manag-ing operational risk in its key activities. During FY10, IFC:■ Implemented a corporate-wide roll-out of its Risk and Control
Self Assessment methodology.■ Developed and piloted other operational risk management
methodologies and tools, including risk events tracking, root cause analysis and scenario analysis.
■ Undertook studies of selected processes to analyze operational risks therein and formulate actions to improve operational risk management.
■ Conducted events to promote and raise awareness of opera-tional risk management, including inviting experts from exter-nal organizations to share experiences and market practices on operational risk-related topics.
6 COSO refers to the Internal Control – Integrated Framework formulated by the Committee of Sponsoring Organizations of the Treadway Commission, which was convened by the US Congress in response to the well-publicized irregularities that occurred in the fi nancial sector in the United States during the late 1980s.

p22
VI. Critical Accounting PoliciesThe Notes to IFC’s FY10 consolidated fi nancial statements contain a summary of IFC’s signifi cant accounting policies, including a dis-cussion of recently adopted accounting standards and accounting and fi nancial reporting developments. Certain of these policies are considered to be “critical” to the portrayal of IFC’s fi nancial condition, since they require management to make diffi cult, com-plex or subjective judgments, some of which may relate to matters that are inherently uncertain.
These policies include: (i) Determining the level of reserves against losses in the
loan portfolio; (ii) Determining the level and nature of impairment for equity
investments and debt securities carried at fair value with changes in fair value being reported in OCI and for equity investments accounted for at cost less impairment (where impairment is determined with reference to fair value);
(iii) Determining the fair value of certain equity investments, debt securities, loans, liquid assets, borrowings and derivatives, which are accounted for at fair value with changes in fair value being reported in net income and OCI; and
(iv) Determining the future pension and postretirement benefi t costs and obligations using actuarial assumptions based on financial market interest rates, past experience, and man-agement’s best estimate of future benefit changes and economic conditions.
Many of IFC’s fi nancial instruments are classifi ed in accordance with the fair value hierarchy established by accounting standards for fair value measurements and disclosures where the fair value and/or impairment is estimated based on internally developed models or methodologies utilizing significant inputs that are non-observable.
RESERVE AGAINST LOSSES ON LOANS
IFC considers a loan as impaired when, based on current informa-tion and events, it is probable that IFC will be unable to collect all amounts due according to the loan’s contractual terms. The reserve against losses for impaired loans refl ects management’s judgment of the present value of expected future cash flows discounted at the loan’s effective interest rate. The reserve against losses for loans includes an estimate of probable losses on loans inherent in the portfolio but not specifi cally identifi able. The reserve is established through periodic charges to income in the form of a provision for losses on loans. Loans written off, as well as any subsequent recoveries, are recorded through the reserve.
MANAGEMENT’S DISCUSSION AND ANALYSIS V. Enterprise Risk Management
IFC also continues to focus on its preparedness to react to an emergency situation that could disrupt its normal operations.
During FY10 IFC:■ In collaboration with IBRD, successfully completed a change
in roles of its data centers. The out-of-town, lower risk, facility shared with IBRD has become IFC’s primary data center and the downtown, higher risk, facility now serves as the secondary data center. As part of this project IFC also implemented an “active-active” environment for virtually all critical corporate applica-tions, increasing the resiliency of its systems.
■ Developed business continuity plans for all departments based in Washington, and updated plans for country offi ces where needed.
■ Conducted home-based working exercises in Washington departments and other key locations to test IFC’s ability to maintain essential operations through remote access. These exercises proved to be excellent preparation for the winter storms in the Washington, DC area.
■ Maintained Emergency Management Teams in all regions; con-ducted emergency simulation exercises, in cooperation with IBRD, in its Washington, DC offices and in the regional hub offi ces; and held emergency management workshops in the larger country offi ces in each region.
Internal Control Over Financial Reporting and Disclosure Controls and ProceduresIn FY10, IFC continued its practice of conducting an annual assess-ment of its internal controls over external fi nancial reporting based on the criteria for effective internal control described by the COSO framework. Between FY06 and FY09, management had not sought the attestation to its published assertion on internal controls previ-ously provided by IFC’s external auditors. In FY10, IFC’s external auditors have provided an attestation report that management’s assertion regarding the effectiveness of internal control over exter-nal fi nancial reporting is fairly stated in all material respects.
Management has carried out an evaluation of internal control over external fi nancial reporting for the purpose of determining if there were any changes made in internal controls during the fi scal year covered by this report, that had materially affected, or would be reasonably likely to materially affect IFC’s internal control over external fi nancial reporting. As of June 30, 2010 no such signifi cant changes had occurred.
Disclosure controls and procedures are those processes which are designed to ensure that information required to be disclosed is accu-mulated and communicated to management, as appropriate to allow timely decisions regarding required disclosure by IFC. Management has undertaken an evaluation of the effectiveness of such controls and procedures. Based on that evaluation, management has concluded that these controls and procedures were effective as of June 30, 2010.

p23
The assessment of the adequacy of reserves against losses for loans is highly dependent on management’s judgment about factors such as its assessment of the fi nancial capacity of borrow-ers, geographical concentration, industry, regional and macro-economic conditions, and historical trends. Due to the inherent limitation of any particular estimation technique, management utilizes a capital pricing and risk framework to estimate the prob-able losses on loans inherent in the portfolio but not specifi cally identifi able. This Board-approved framework uses actual loan loss history and aligns the loan loss provisioning framework with IFC’s capital adequacy framework.
The reserve against losses on loans is separately reported in the consolidated balance sheet as a reduction of IFC’s total loans. Increases or decreases in the reserve level are reported in the income statement as provision for losses or release of provi-sion for losses on loans, and guarantees. The reserve against losses on loans relates only to the Client Services segment of IFC (see Note T to the FY10 consolidated fi nancial statements for fur-ther discussion of IFC’s business segments).
EQUITY AND DEBT SECURITY IMPAIRMENT
IFC assesses all equity investments accounted for at fair value through OCI and all equity investments accounted for at cost less impairment for impairment each quarter. When impairment is identifi ed and is deemed to be other than temporary, the equity investment is written down to its impaired value, which becomes the new cost basis in the equity investment. IFC generally pre-sumes that all equity impairments are deemed to be other than temporary. Impairment losses on equity investments accounted for at cost less impairment are not reversed for subsequent recov-eries in value of the equity investment until it is sold. Recoveries in value on equity investments accounted for at fair value through OCI that have been the subject of an other-than-temporary impairment write-down are reported in OCI until sold.
IFC assesses all debt security investments accounted for at fair value through OCI for impairment each quarter. When impairment is identifi ed, the entire impairment is recognized in net income if certain conditions are met (as detailed in Note A to IFC’s FY10 con-solidated fi nancial statements). However, if IFC does not intend to sell the debt security and it is not more likely than not that IFC will be required to sell the security, but the security has suffered a credit loss, the credit-related impairment loss is recognized in net income and the non-credit related loss is recognized in OCI.
MANAGEMENT’S DISCUSSION AND ANALYSIS vi. critical accounting policies
VALUATION OF FINANCIAL INSTRUMENTS WITH NO QUOTED MARKET PRICES
IFC reports at fair value all of its derivative instruments, all of its liq-uid asset trading securities and certain borrowings, loans, equity investments and debt securities. In addition, certain features in various investment agreements contain embedded or stand-alone derivatives that, for accounting purposes, are separately accounted as either derivative assets or liabilities, including puts, caps, fl oors, and forwards. IFC classifi es all fi nancial instruments accounted for at fair value based on the fair value hierarchy estab-lished by accounting standards for fair value measurements and disclosures as described in more detail in Notes A and R to IFC’s FY10 consolidated fi nancial statements.
Many of IFC’s fi nancial instruments accounted for at fair value have fair values that are based on unadjusted quoted market prices or using models where the signifi cant assumptions and inputs are market-observable. The fair values of fi nancial instruments valued using models where the signifi cant assumptions and inputs are not market-observable are generally estimated using complex pricing models of the net present value of estimated future cash fl ows. Management makes numerous assumptions in developing pricing models, including an assessment about the counterparty’s fi nancial position and prospects, the appropriate discount rates, interest rates, and related volatility and expected movement in foreign currency exchange rates. Changes in assumptions could have a signifi cant impact on the amounts reported as assets and liabilities and the related unrealized gains and losses reported in the income statement and statement of OCI. The fair value com-putations affect both the Client Services and Treasury segments of IFC (see Note T to the FY10 consolidated fi nancial statements for further discussion of IFC’s business segments).
PENSION AND OTHER POSTRETIREMENT BENEFITS
IFC participates, along with IBRD and MIGA, in pension and postretirement benefi t plans that cover substantially all of their staff members. All costs, assets and liabilities associated with the plans are allocated between IBRD, IFC and MIGA based upon their employees’ respective participation in the plans. The underlying actuarial assumptions used to determine the projected benefi t obligations, fair value of plan assets and funded status associated with these plans are based on fi nancial market interest rates, past experience, and management’s best estimate of future benefi t changes and economic conditions. For further details, please refer to Note V to the FY10 consolidated fi nancial statements.

p24
The following paragraphs detail signifi cant variances between FY10 and FY09, and FY09 and FY08, covering the periods included in IFC’s FY10 consolidated fi nancial statements. Certain amounts in FY09 and FY08 have been reclassifi ed to conform to the current year’s presentation. Where applicable, the following paragraphs reflect reclassified prior year comparative information. Such reclassifi cations had no effect on net income or total assets.
FY10 Versus FY09
IFC has reported income before net losses on other non-trading fi nancial instruments accounted for at fair value and grants to IDA of $2,285 million, $2,438 million higher than the loss before net gains and losses on other non-trading fi nancial instruments accounted for at fair value and grants to IDA of $153 million in FY09.
The significant improvement in income before net losses on non-trading fi nancial instruments and grants to IDA in FY10 when compared to FY09 was principally as a result of a generally improved operating environment for IFC’s investment and liquid asset port-folios in FY10 as compared with that experienced in FY09. This
resulted in: (i) lower impairment write-downs on equity investments; (ii) higher realized capital gains on equity sales and unrealized gains on equity investments accounted for at fair value in net income; (iii) lower provisions for losses on loans and guarantees; (iv) higher income from liquid asset trading activities; and (v) lower charges on borrowings.
IFC reported net losses on non-trading fi nancial instruments of $339 million in FY10 as compared with a net gain of $452 million in FY09, resulting in income before grants to IDA of $1,946 million in FY10, as compared to $299 million in FY09.
Grants to IDA totaled $200 million in FY10, as compared to $450 million in FY09. Accordingly, net income (in accordance with US GAAP) totaled $1,746 million in FY10, as compared with a net loss of $151 million in FY09.
A more detailed analysis of the components of IFC’s net income follows.
INCOME FROM LOANS AND GUARANTEES
IFC’s primary interest earning asset is its loan portfolio. Income from loans and guarantees for FY10 totaled $801 million, com-pared with $871 million in FY09, a decrease of $70 million.
VII. Results of Operations
OVERVIEW
The overall market environment has a signifi cant infl uence on IFC’s fi nancial performance.The main elements of IFC’s net income and comprehensive income and infl uences on the level and variability of net income and com-
prehensive income from year to year are:
ELEMENTS SIGNIFICANT INFLUENCES
Net income:Yield on interest earning assets Market conditions including spread levels, and degree of competition. Nonaccruals and
recoveries of interest on loans formerly in nonaccrual status and income from participation notes on individual loans are also included in income from loans.
Liquid asset income Realized and unrealized gains and losses on the liquid asset portfolios, which are driven by external factors such as: the interest rate environment; and liquidity of certain asset classes within the liquid asset portfolio.
Income from the equity investment portfolio Performance of the equity portfolio (principally realized capital gains, dividends, equity impairment write-downs and unrealized gains and losses on equity investments).
Provisions for losses on loans and guarantees Risk assessment of borrowers and actual and forecasted levels of default.Noninterest income and expense Level of advisory services provided by IFC to its clients, the level of expense from the staff
retirement and other benefi ts plans, and the approved administrative and other budgets.Net unrealized gains and losses on non-trading fi nancial instruments accounted for at fair value
Principally, differences between changes in fair values of borrowings, including IFC’s credit spread, and associated derivative instruments and unrealized gains associated with the investment portfolio including puts, warrants and stock options which in part are dependent on the global climate for emerging markets.
Grants to IDA Level of Board of Governors-approved grants to IDA.
Other comprehensive income:Unrealized gains and losses on listed equity investments and debt securities accounted for as available-for-sale
Global climate for emerging markets equities and company-specifi c performance. Such equity investments are valued using unadjusted quoted market prices and debt securities are valued using internally developed models or methodologies utilizing inputs that may be observable or non-observable.
Unrecognized net actuarial gains and losses and unrecognized prior service costs on benefi t plans
Returns on pension plan assets and the key assumptions that underlie projected benefi t obligations, including fi nancial market interest rates, past experience, and management’s best estimate of future benefi t changes and economic conditions.
MANAGEMENT’S DISCUSSION AND ANALYSIS

p25
MANAGEMENT’S DISCUSSION AND ANALYSIS VII. Results of Operations
The disbursed loan portfolio grew by $1,449 million, from $16,748 million at June 30, 2009 to $18,197 million at June 30, 2010. The overall interest rate environment was lower in FY10 than in FY09.
The weighted average contractual interest rate on loans at June 30, 2010 was 4.6%, versus 5.0% at June 30, 2009, refl ecting the lower over-all interest rate environment existing at June 30, 2010 as compared with June 30, 2009. These factors combined resulted in $203 million lower interest income than in FY09. Commitment and fi nancial fees were $29 million higher than in FY09. Recoveries of interest on loans being removed from non-accrual status, net of reversals of income on loans being placed in nonaccrual status, were $3 million higher in FY10 as compared to FY09. Income from IFC’s participation notes, over and above minimum contractual interest, was $3 million lower in FY10 than in FY09. Unrealized gains on loans accounted for at fair value were $104 million higher than in FY09.
INCOME FROM EQUITY INVESTMENTS
Income from the equity investment portfolio increased by $1,680 million from a loss of $42 million in FY09 to income of $1,638 million in FY10.
IFC generated realized gains on equity investments, including recoveries of previously written-off equity investments and net of losses on sales of equity investments, for FY10 of $1,290 million, as compared with $990 million for FY09, an increase of $300 mil-lion. IFC sells equity investments where IFC’s developmental role was complete, and where pre-determined sales trigger levels had been met and, where applicable, expiration of lock ups.
Total realized gains on equity investments are concentrated – in FY10, 9 investments generated individual capital gains in excess of $20 million for a total of $867 million, or 67%, of the FY10 gains, compared to 9 investments that generated individual capital gains in excess of $20 million for a total of $723 million, or 73%, of the FY09 gains. A signifi cant amount of gains ($885 million) were real-ized during the last three months of FY09, principally driven by the sale of one investment in the Oil, Gas and Mining sector that gen-erated a gain of $592 million.
Dividend income totaled $285 million, as compared with $311 million in FY09. Consistent with FY09, a signifi cant amount of IFC’s dividend income in FY10 was due to returns on IFC’s joint ventures in the oil, gas and mining sectors accounted for under the cost recovery method, which totaled $60 million in FY10, as com-pared with $56 million in FY09.
Unrealized gains on equity investments that are accounted for at fair value through net income in FY10 totaled $240 million, as compared with losses of $299 million in FY09.
INCOME FROM DEBT SECURITIES
Income from debt securities increased to $108 million in FY10 from $71 million in FY09, an increase of $37 million. The majority of the increase was attributable to higher unrealized gains on debt secu-rities accounted for at fair value and higher non-monetary gains on debt securities, resulting from conversions to equity investments, in FY10 when compared with FY09. Unrealized gains on debt secu-rities accounted for at fair value were $23 million higher in FY10 as compared to FY09.
PROVISION FOR LOSSES ON LOANS AND GUARANTEES
The quality of IFC’s loan portfolio, as measured by country risk ratings and credit risk ratings was substantially unchanged during FY10. Non-performing loans as a percentage of the disbursed loan portfolio increased from 2.7% of the disbursed loan portfolio at June 30, 2009 to 4.8% of the disbursed loan portfolio at June 30, 2010. The increase in non-performing loans was largely due to two loans each with principal outstanding in excess of $100 million being placed in non-performing status during FY10. IFC recorded a provision for losses on loans and guarantees of $155 million in FY10 ($153 million in specifi c provisions, $8 million release in port-folio provisions, and $10 million provision in respect of guaran-tees) as compared to $438 million in FY09 ($109 million in specifi c provisions, $332 million in portfolio provisions, and $(3) million in respect of guarantees). On June 30, 2010, IFC’s total reserves against losses on loans were 7.4% of the disbursed loan portfolio (7.4% at June 30, 2009).
Specifi c reserves against losses at June 30, 2010 of $432 million ($300 million at June 30, 2009) are held against impaired loans of $984 million ($552 million), a coverage ratio of 44% (55%).
INCOME FROM LIQUID ASSET TRADING ACTIVITIES
Income from liquid asset trading activities comprises interest from time deposits and securities, net gains and losses on trading activi-ties, and a small currency translation effect. The liquid assets port-folio, net of derivatives and securities lending activities, increased from $17.9 billion at June 30, 2009, to $21.0 billion at June 30, 2010.
Income from liquid asset trading activities totaled $815 million in FY10 ($474 million in FY09). In FY10, all liquid asset portfolios outperformed their respective benchmarks. In FY09, the P1, P2, P3 and P4 portfolios underperformed their respective bench-marks and the P0 portfolio outperformed its benchmark. The main cause of the underperformances when compared to benchmark in FY09 was the poor performance of the holdings of ABS and MBS.
In addition to interest income of $358 million, the portfolio of ABS and MBS showed fair value gains totaling $419 million in FY10. Holdings in other products, including US Treasuries, global government bonds, high quality corporate bonds and derivatives generated $36 million of gains in FY10 and substantially all hold-ings in the liquid asset portfolio paid on schedule in FY10.
At June 30, 2010, trading securities with a fair value of $177 million are classifi ed as Level 3 securities ($856 million on June 30, 2009).
The P1 portfolio generated a return7 of $376 million in FY10, a return of 3.44%. In FY09, the P1 portfolio generated a return of $130 million, or 0.53%. The externally managed P3 portfolio, man-aged against the same variable rate benchmark as the P1 portfolio, returned $14 million in FY10, or 2.81%, $16 million higher than the $(2) million, or 0.65%, return in FY09.
The P2 and externally-managed P4 portfolios returned $404 mil-lion (7.28%) and $18 million (3.68%) in FY10, respectively, as com-pared to $293 million (5.87%) and $25 million (6.40%) in FY09.
IFC’s P0 portfolio earned $3 million in FY10, a total return of 0.36%, as compared to $28 million (1.70%) in FY09.
7 Return percentages are reported gross of fees.

p26
Charges on BorrowingsIFC’s charges on borrowings decreased by $325 million, from $488 million in FY09 to $163 million in FY10, largely refl ecting the lower US dollar interest rate environment, when comparing FY10 and FY09. During FY10, IFC bought back $0.9 billion of its mar-ket borrowings ($1.05 billion in FY09). Charges on borrowings of $163 million in FY10 ($488 million in FY09) are reported net of gains on buybacks of $62 million ($61 million in FY09).
The weighted average rate of IFC’s borrowings outstand-ing from market sources, after the effects of borrowing-related derivatives, and excluding short-term borrowings issued under the Discount Note Program, fell during the year from 1.4% at June 30, 2009 to 0.5% at June 30, 2010. The size of the borrowings portfolio (excluding the short-term Discount Note Program), net of borrowing-related derivatives and before fair value adjustments, increased by $3.0 billion during FY10 from $25.8 billion at June 30, 2009, to $28.8 billion at June 30, 2010.
OTHER INCOME
Other income of $176 million for FY10 was $23 million higher than in FY09 ($153 million). Other income in FY10 includes income from the P6 local currency liquidity portfolio of $27 million ($42 million in FY09).
OTHER EXPENSES
Administrative expenses (the principal component of other expenses) increased by $82 million (14%) from $582 million in FY09 to $664 mil-lion in FY10. The increase in administrative expenses was largely due to increases in the following categories: (i) salary and related benefi ts; (ii) reinstatement of variable pay programs in FY10; and (iii) infor-mation technology and security. Administrative expenses include the grossing-up effect of certain revenues and expenses attributable to IFC’s reimbursable program and jeopardy projects ($36 million in FY10, as compared with $31 million in FY09). IFC recorded an expense from pension and other postretirement benefit plans in FY10 of $69 million, as compared with $34 million in FY09.
EXPENDITURES FOR ADVISORY SERVICES
Expenditures for advisory services in FY10 totaled $101 million, $28 million or 22% lower than expenditures for advisory services of $129 million in FY09.
PERFORMANCE-BASED GRANTS AND IFC SME VENTURES FOR IDA COUNTRIES
Expenditures were $9 million in FY10 ($6 million in FY09).
NET GAINS AND LOSSES ON OTHER NON-TRADING FINANCIAL INSTRUMENTS
As discussed in more detail in Note A to IFC’s FY10 consolidated fi nancial statements, IFC accounts for certain fi nancial instruments at fair value with unrealized gains and losses on such fi nancial instruments being reported in net income, namely: (i) all swapped market borrowings; and (ii) all equity investments in which IFC has greater than 20% holdings and/or equity and fund investments which, in the absence of the Fair Value Option, would be required to be accounted for under the equity method. All other non- trading derivatives, including stand-alone and embedded deriva-tives in the loan, equity and debt security portfolios continue to be accounted for at fair value.
The resulting effects of fair value accounting for these non-trading fi nancial instruments on net income in FY10 and FY09 can be summarized as follows (US$ millions):
FY10 FY09
Unrealized (losses) gains on market borrowings and associated derivatives, net $ (226) $ 381Unrealized losses on derivatives associated with loans (98) (65)Unrealized gains on derivatives associated with debt securities 28 25Net (losses) gains on derivatives associated with equity investments (43) 111
Net (losses) gains on other non-trading fi nancial instruments accounted for at fair value $ (339) $ 452
The largest component of net gains and losses on other non-trading financial instruments in FY10 was on market borrow-ings and associated derivatives. Changes in fair value of IFC’s market borrowings and associated derivatives, net includes the impact of changes in IFC’s own credit spread when measured against US$ LIBOR. As credit spreads widen, unrealized gains are recorded and when credit spreads narrow, unrealized losses are recorded (notwithstanding the impact of other factors, such as changes in risk-free interest and foreign currency exchange rates). The magnitude and direction (gain or loss) can be volatile from period to period but do not alter the cash fl ows. IFC’s policy is to generally match currency, amount and timing of cash fl ows on mar-ket borrowings with cash fl ows on associated derivatives entered into contemporaneously.
Prior to FY09, IFC’s own credit spread had been relatively stable at sub-LIBOR rates – as such, there was no signifi cant reported volatility associated with fair valuing IFC’s market borrowings and associated derivatives. Beginning in the second quarter of FY09 and extending into the third quarter of FY09 as the global fi nancial crisis worsened, IFC’s own credit spreads, consistent with all supranationals and other triple-A rated institutions widened considerably but narrowed somewhat during the fourth quar-ter, although remaining LIBOR-plus at June 30, 2009. In FY10, as appetite for risk in international capital markets slowly recovered, reverted partially but credit spreads remained elevated relative to the levels that prevailed before FY09. As a result, IFC reported an unrealized loss for FY10 of $226 million, as compared to an unreal-ized gain of $381 million in FY09.
IFC reported a net loss on derivatives associated with equity investments (principally put options, stock options, conversion
MANAGEMENT’S DISCUSSION AND ANALYSIS VII. Results of Operations

p27
MANAGEMENT’S DISCUSSION AND ANALYSIS VII. Results of Operations
features and warrants) of $43 million in FY10. As emerging markets equities decline, IFC’s put options, stock warrants, and conversion features entered into in part as an exit strategy became more valu-able, resulting in unrealized net gains, and vice-versa. Gains/Losses are highly concentrated, with fi ve derivatives accounting for $56 mil-lion of gains and fi ve derivatives accounting for $84 million of losses in FY10 (fi ve derivatives accounting for $105 million of gains and fi ve derivatives accounting for $55 million of losses in FY09).
GRANTS TO IDA
During FY10, IFC recorded a grant to IDA of $200 million, as com-pared with $450 million in FY09.
OTHER COMPREHENSIVE INCOME
Unrealized Gains and Losses on Equity Investments and Debt SecuritiesIFC’s investments in debt securities and equity investments that are listed in markets that provide readily determinable fair values at fair value are classifi ed as available-for-sale, with unrealized gains and losses on such investments being reported in OCI until realized. When realized, the gain or loss is transferred to net income. Changes in unrealized gains and losses on equity invest-ments and debt securities being reported in OCI are signifi cantly impacted by (i) the global environment for emerging markets; and (ii) the realization of gains on sales of such equity investments and debt securities.
The net change in unrealized gains and losses on equity invest-ments and debt securities in OCI can be summarized as follows:
FY10 FY09
Net unrealized gains and losses on equity investments arising during the year: Unrealized gains $ 1,117 $ 180 Unrealized losses (198) (1,294) Reclassifi cation adjustment for realized gains and impairment write-downs included in net income (313) (357)
Net unrealized gains (losses) on equity investments $ 606 $ (1,471)
Net unrealized gains and losses on debt securities arising during the year Unrealized gains $ 181 $ 57 Unrealized losses (61) (294)Reclassifi cation adjustment for realized gains, non credit-related portion of impairment
write-downs which were recognized in net income and impairment write-downs included in net income (43) 63
Net unrealized gains (losses) on debt securities $ 77 $ (174)
Total unrealized gains (losses) on equity investments and debt securities $ 683 $ (1,645)
UNRECOGNIZED NET ACTUARIAL GAINS AND LOSSES AND UNRECOGNIZED PRIOR SERVICE COSTS ON BENEFIT PLANS
Changes in the funded status of pension and other post retirement benefi t plans are recognized in OCI, to the extent they are not recognized in net income under periodic benefit cost for the year. During FY10, IFC experienced a decrease in the current value adjustment for unrecognized net periodic pension cost of $192 million, primarily refl ecting a lower increase in the fair value of plan assets as compared to the increase in the projected benefi t obligation.
FY09 VERSUS FY08
IFC has reported a loss before net gains and losses on other non-trading fi nancial instruments accounted for at fair value and grants to IDA of $153 million, $2,091 million lower than income before net gains and losses on other non-trading fi nancial instruments accounted for at fair value of $1,938 million in FY08. Income before grants to IDA totaled $299 million in FY09, as compared with $2,047 million in FY08. Grants to IDA were $450 million in FY09 as compared to $500 million in FY08, resulting in an overall net loss (in accordance with US GAAP) of $151 million in FY09 as compared to net income of $1,547 million in FY08.
FY09 results were significantly negatively impacted by the global fi nancial crisis, which resulted in signifi cantly higher impair-ment write-downs on equity investments and higher provisions for losses on loans, both specifi c provisions and portfolio provi-sions . Income from liquid asset trading activities was substan-tially unchanged between FY08 and FY09 with a significant improvement in performance occurring in the latter months of FY09 relating to IFC’s holdings of ABS and MBS. Net income in FY09 benefi ted by signifi cant unrealized gains on IFC’s swapped mar-ket borrowings accounted for at fair value as credit spreads for IFC widened considerably, particularly in the fi rst nine months of FY09. As credit spreads began to narrow in the fourth quarter of FY09, there was a partial reversal of unrealized gains recorded in the fi rst nine months of FY09.
A more detailed analysis of the components of IFC’s net income follows.
INCOME FROM LOANS AND GUARANTEES
IFC’s primary interest earning asset is its loan portfolio. Income from loans and guarantees for FY09 totaled $871 million, com-pared with $1,065 million in FY08, a decrease of $194 million.
The disbursed loan portfolio grew by $1,412 million, from $15,336 million at June 30, 2008 to $16,748 million at June 30, 2009. However, the interest rate environment was lower in FY09 than in FY08. The weighted average contractual interest rate on loans at June 30, 2009 was 5.0%, versus 6.6% at June 30, 2008. These fac-tors combined resulted in $135 million lower income than in FY08. Commitment and fi nancial fees were $14 million lower than in FY08. Recoveries of interest on loans being removed from non-accrual status, net of reversals of income on loans being placed in nonaccrual status, were $2 million higher in FY09 as compared to FY08. Income from IFC’s participation notes, over and above

p28
minimum contractual interest, was $3 million lower in FY09 than in FY08. Unrealized losses on loans accounted for at fair value were $44 million higher than in FY08.
INCOME FROM EQUITY INVESTMENTS
Income from the equity investment portfolio decreased by $1,730 million from income of $1,688 million in FY08 to a loss of $42 million in FY09.
IFC generated realized gains on equity investments, including recoveries of previously written-off equity investments and net of losses on sales of equity investments, for FY09 of $990 million, as compared with $1,219 million for FY08, a decrease of $229 mil-lion. IFC sells equity investments where IFC’s developmental role was complete, and where pre-determined sales trigger levels had been met and, where applicable, expiration of lock ups.
A signifi cant portion of these gains ($381 million) were realized during the last three months of FY09 as IFC took advantage of the overall recovery in emerging markets during the fourth quarter of FY09.
Total realized gains on equity investments are concentrated – in FY09, 9 investments generated individual capital gains in excess of $20 million for a total of $723 million, or 73%, of the FY09 gains, compared to 15 investments that generated individual capital gains in excess of $20 million for a total of $863 million, or 62%, of the FY08 gains.
Dividend income totaled $311 million, as compared with $428 million in FY08. Consistent with FY08, a signifi cant amount of IFC’s dividend income in FY09 was due to returns on IFC’s joint ventures in the oil, gas and mining sectors accounted for under the cost recovery method, which totaled $56 million in FY09, as com-pared with $59 million in FY08.
Unrealized losses on equity investments that are accounted for at fair value through net income in FY09 totaled $299 million, as compared with gains of $12 million in FY08. Consistent with overall trends in emerging markets, IFC reported unrealized losses in the fi rst nine months of FY09 of $353 million and unrealized gains in the last three months of FY09 of $54 million.
INCOME FROM DEBT SECURITIES
Income from debt securities decreased to $71 million in FY09 from $163 million in FY08, a decrease of $92 million. The majority of the decrease was attributable to lower realized gains on sales of debt securities in FY09 when compared with FY08. Realized gains on debt securities were $96 million lower in FY09 as com-pared to FY08. There was one individually signifi cant realized gain in FY08 that did not recur in FY09.
PROVISION FOR LOSSES ON LOANS AND GUARANTEES
As noted above, the quality of IFC’s loan portfolio, as measured by country risk ratings and credit risk ratings deteriorated dur-ing FY09 as a result of worsening economic conditions. Loan performance, however, remained solid with non-performing
loans as a percentage of the disbursed loan portfolio increasing marginally from 2.4% of the disbursed loan portfolio at June 30, 2008 to 2.7% of the disbursed loan portfolio at June 30, 2009. As a result, IFC recorded a provision for losses on loans and guar-antees of $438 million in FY09 ($109 million in specifi c provisions, $332 million in portfolio provisions, and $(3) million in respect of guarantees) as compared to $38 million in FY08 ($(34) million in specific provisions, $71 million of portfolio provisions and $1 million in respect of guarantees). On June 30, 2009, IFC’s total reserves against losses on loans were 7.4% of the disbursed loan portfolio (5.5% at June 30, 2008).
INCOME FROM LIQUID ASSET TRADING ACTIVITIES
Income from liquid asset trading activities comprises interest from time deposits and securities, net gains and losses on trad-ing activities, and a small currency translation effect. The liquid assets portfolio, net of derivatives and securities lending activities, increased from $14.6 billion at June 30, 2008, to $17.9 billion at June 30, 2009.
Income from liquid asset trading activities totaled $474 million in FY09 ($473 million in FY08). In both FY09 and FY08, the P1, P2, P3 and P4 portfolios underperformed their respective bench-marks and the P0 portfolio outperformed its benchmark. As in FY08, the main cause of the underperformances when compared to benchmark in FY09 was the poor performance of the holdings of ABS and MBS.
Negative income on the ABS and MBS portfolio in FY09 was more than offset by positive income from the cash and treasury security portfolio. Increased risk aversion led to lower treasury yields and price appreciation on the treasury portfolio. In addition to interest income of $510 million, holdings of treasury securities showed $334 million of gains in FY09 and the portfolio of ABS and MBS suffered further mark-to-market declines in the first nine months of FY09 but rebounded during FY09 Q4 and after seven consecutive quarters of losses, the Corporation recorded gains of $177 million in the fourth quarter of FY09. Overall, fair value losses on ABS and MBS totaled $368 million in FY09. All holdings in the liquid asset portfolio paid on schedule in FY09. At June 30, 2009, trading securities with a fair value of $856 million are classifi ed as Level 3 ($319 million on June 30, 2008).
The P1 portfolio generated a return of $130 million in FY09, a return of 0.53%. In FY08, the P1 portfolio generated a return of $(10) million, or (0.06)%. The externally managed P3 portfolio, man-aged against the same variable rate benchmark as the P1 portfolio, returned $(2) million in FY09, or 0.65%, $32 million lower than the $30 million, or 3.13%, return in FY08.
The P2 and externally-managed P4 portfolios returned $293 mil-lion (5.87%) and $25 million (6.40%) in FY09, respectively, as com-pared to $332 million (5.71%) and $13 million (2.90%) in FY08.
IFC’s P0 portfolio earned $28 million in FY09, a total return of 1.70%, as compared to $73 million (4.44%) in FY08.
Income from IFC’s P6 local currency liquidity portfolio totaled $42 million in FY09 ($35 million in FY08).
MANAGEMENT’S DISCUSSION AND ANALYSIS VII. Results of Operations

p29
MANAGEMENT’S DISCUSSION AND ANALYSIS VII. Results of Operations
CHARGES ON BORROWINGS
IFC’s charges on borrowings decreased by $294 million, from $782 million in FY08 to $488 million in FY09, largely refl ecting the decreased US dollar interest rate environment, when comparing FY09 and FY08. During FY09, IFC bought back $1.05 billion of its market borrowings. Charges on borrowings of $488 million in FY09 ($782 million in FY08) are reported net of gains on buybacks of $61 million ($2 million in FY08). The weighted average cost of IFC’s borrowings outstanding from market sources, after the effects of borrowing-related derivatives, fell during the year from 2.8% at June 30, 2008 to 1.4% at June 30, 2009. The size of the borrow-ings portfolio, net of borrowing-related derivatives and before fair value adjustments, increased by $6.2 billion in FY09 from $19.6 bil-lion at June 30, 2008, to $25.8 billion at June 30, 2008.
OTHER INCOME
Other income of $153 million for FY09 was $40 million higher than in FY08 ($113 million). Other income in FY09 includes income from the P6 local currency liquidity portfolio of $42 million, which, in FY08, was reported in income from liquid assets trading activities.
OTHER EXPENSES
Administrative expenses (the principal component of other expenses) increased by $33 million (6%) from $549 million in FY08 to $582 million in FY09, principally refl ecting the signifi cant increase in business volumes anticipated at the beginning of FY09 and associated Board-approved administrative budget increases, which were offset in part by cost controls put in place by IFC as the global financial crisis worsened. Administrative expenses include the grossing-up effect of certain revenues and expenses attributable to IFC’s reimbursable program and jeopardy projects ($31 million in FY09, as compared with $33 million in FY08). IFC recorded an expense from pension and other post-retirement benefi t plans in FY09 of $34 million, as compared with $3 million in FY08.
EXPENDITURES FOR ADVISORY SERVICES
Expenditures for advisory services in FY09 totaled $129 million, $6 million or 5% higher than expenditures for advisory services of $123 million in FY08. The increase refl ects the continued growth in demand for IFC’s advisory services.
PERFORMANCE-BASED GRANTS AND IFC SME VENTURES FOR IDA COUNTRIES
Expenditures were $6 million in FY09 ($27 million in FY08).
NET GAINS AND LOSSES ON OTHER NON-TRADING FINANCIAL INSTRUMENTS
As discussed in more detail in Note A to IFC’s FY09 consolidated fi nancial statements, IFC accounts for certain fi nancial instruments at fair value with unrealized gains and losses on such fi nancial instruments being reported in net income, namely: (i) all swapped market borrowings; and (ii) all equity investments in which IFC has greater than 20% holdings and/or equity and fund investments which, in the absence of an election of fair value accounting, would be required to be accounted for under the equity method. All other non-trading derivatives, including stand-alone and embed-ded derivatives in the loan, equity and debt security portfolios continue to be accounted for at fair value.
The resulting effects of fair value accounting for these non-trading fi nancial instruments on net income in FY09 and FY08 can be summarized as follows (US$ millions):
FY09 FY08
Unrealized gains on market borrowings and associated derivatives, net $ 381 $ 17Unrealized (losses) gains on derivatives associated with loans (83) 8Unrealized gains (losses) on derivatives associated with debt securities 1 (2)Net gains on derivatives associated with equity investments 153 86
Net gains on other non-trading fi nancial instruments accounted for at fair value $ 452 $ 109
The largest component of net gains and losses on other fi nan-cial instruments in FY09 was on market borrowings and associated derivatives. Changes in fair value of IFC’s market borrowings and associated derivatives, net includes the impact of changes in IFC’s own credit spread when measured against US$ LIBOR. As credit spreads widen, unrealized gains are recorded and when credit spreads narrow, unrealized losses are recorded (notwithstanding the impact of other factors, such as changes in risk-free interest and foreign currency exchange rates). The magnitude and direction (gain or loss) can be volatile from period to period but do not alter the cash fl ows. IFC’s policy is to gener-ally match currency, amount and timing of cash fl ows on market borrowings with cash fl ows on associated derivatives entered into contemporaneously.
Prior to FY09, IFC’s own credit spread had been relatively stable at sub-LIBOR rates – as such, there was no signifi cant reported volatility associated with fair valuing IFC’s market borrowings and associated derivatives. Beginning in the second quarter of FY09 and extending into the third quarter of FY09 as the global fi nancial crisis worsened, IFC’s own credit spreads, consistent with all supranationals and other triple-A rated institutions widened considerably but narrowed somewhat during the fourth quarter, although remaining LIBOR-plus at June 30, 2009. As a result, IFC reported a credit to net income for FY09 of $381 million, as com-pared to $17 million in FY08.

p30
IFC reported a net gain on derivatives associated with equity investments (principally put options, stock options, conversion features and warrants) of $153 million in FY09. As emerging mar-kets equities declined in FY09, IFC’s put options, stock warrants, and conversion features entered into in part as an exit strategy became more valuable, resulting in unrealized net gains. Such gains are highly concentrated, with fi ve derivatives accounting for $105 million of gains and fi ve derivatives accounting for $55 million of losses in FY09 (fi ve derivatives accounting for $103 million, or 94%, of the gains in FY08).
GRANTS TO IDA
During FY09, IFC recorded a grant to IDA of $450 million, as com-pared with $500 million in FY08.
OTHER COMPREHENSIVE INCOME
Unrealized Gains and Losses on Equity Investments and Debt SecuritiesIFC’s investments in debt securities and equity investments that are listed in markets that provide readily determinable fair values at fair value are classifi ed as available-for-sale, with unrealized gains and losses on such investments being reported in OCI until realized. When realized, the gain or loss is transferred to net income. Changes in unrealized gains and losses on equity invest-ments and debt securities being reported in OCI are signifi cantly impacted by (i) the global environment for emerging markets; and (ii) the realization of gains on sales of such equity investments and debt securities.
During the fi rst nine months of FY09, IFC recorded a charge to OCI in the amount of $2,077 million relating to equity investments and debt securities as global emerging markets experienced significant declines. In the fourth quarter of FY09, as emerg-ing markets rallied, IFC recorded a credit to OCI in the amount
of $432 million, resulting in a full year charge to OCI in the amount of $1,645 million in respect of equity investments and debt securities.
The net change in unrealized gains and losses on equity invest-ments and debt securities in OCI can be summarized as follows:
FY09 FY08
Net unrealized losses on equity investments arising during the year: Unrealized gains $ 180 $ 694 Unrealized losses (1,294) (602) Reclassifi cation adjustment for realized gains and impairment write-downs
included in net income (357) (570)
Net unrealized losses on equity investments $ (1,471) $ (478)
Net unrealized (losses) gains on debt securities arising during the year Unrealized gains $ 57 $ 232 Unrealized losses (294) (106)Reclassifi cation adjustment for realized gains, non credit-related portion of impairment
write-downs which were recognized in net income and impairment write-downs included in net income 63 (104)
Net unrealized (losses) gains on debt securities $ (174) $ 22
Total unrealized (losses) gains on equity investments and debt securities $ (1,645) $ 456
Unrecognized Net Actuarial Gains and Losses and Unrecognized Prior Service Costs on Benefi t Plans
Changes in the funded status of pension and other post retirement benefi t plans are recognized in OCI, to the extent they are not recognized in net income under periodic benefit cost for the year. During FY09, IFC experienced a decrease in the current value adjustment for unrecognized net periodic pension cost of $346 million, primarily refl ecting lower fair value of plan assets, with a lower relative decline in projected benefi t obligation.
MANAGEMENT’S DISCUSSION AND ANALYSIS VII. Results of Operations

p31
MANAGEMENT’S DISCUSSION AND ANALYSIS
VIII. GovernanceMANAGEMENT CHANGES
During FY10, the following changes occurred in the senior man-agement of IFC:
Mr. Gavin E.R. Wilson was appointed CEO, IFC Asset Management Company LLC, effective July 1, 2009 and became a part of IFC’s Management Team effective September 30, 2009.
Mr. Janamitra Devan was appointed Vice President, Financial and Private Sector Development, effective October 19, 2009.
Mr. Rashad Kaldany’s title became Vice President, Asia, Eastern Europe, Middle East and North Africa, effective February 1, 2010.
Mr. Jyrki Koskelo’s title became Vice President, Global Industries, effective February 1, 2010.
Mr. Thierry Tanoh’s title became Vice President, Sub-Saharan Africa, Latin America and the Caribbean, and Western Europe, effective February 1, 2010.
Subsequent to June 30, 2010, the following changes are expected to occur, in the senior management of IFC:
Ms. Nina Shapiro has announced her intention to retire as Vice President, Finance and Treasurer, effective September 30, 2010.
Mr. Michel G. Maila has announced his intention to step down from his duties as Vice President, Risk Management, effective September 15, 2010.
GENERAL GOVERNANCE
IFC’s decision-making structure is comprised of the Board of Governors, the Board of Directors, the President, the Executive Vice President and CEO, other Offi cers and Staff. The Board of Governors is the highest decision-making authority. The Board of Governors has delegated to the Board of Directors authority to exercise all of the powers of IFC except those reserved to the Governors under the Articles of Agreement.
BOARD MEMBERSHIP
In accordance with its Articles of Agreement, members of IFC’s Board are appointed or elected by their member governments. These Directors are neither offi cers nor staff of IFC. The President is the only management member of the Board, serving as a non-voting member and as Chairman of the Board.
The Board has established several Committees including:■ Committee on Development Effectiveness■ Audit Committee■ Budget Committee■ Personnel Committee■ Ethics Committee■ Committee on Governance and Administrative Matters
The Board and its Committees function in continuous session at the principal offi ces of the World Bank Group, as business requires. Each Committee’s terms of reference establishes its respective roles and responsibilities. As Committees do not vote on issues, their role is primarily to serve the full Board in discharg-ing its responsibilities.
The Board of Directors is responsible for the conduct of the general operations of IFC. The Directors are also responsible for presenting to the Board of Governors, at the Annual meetings, an audit of accounts, an administrative budget, and an annual report on operations and policies as well as other matters.
MEMBERSHIP
The Audit Committee consists of eight members of the Board. Membership on the Committee is determined by the Board, based upon nominations by the Chairman of the Board, following informal consultation with the Directors.
KEY RESPONSIBILITIES
The Audit Committee is appointed by the Board to assist it in the oversight and assessment of IFC’s fi nances and accounting, including the effectiveness of financial policies, the integrity of fi nancial statements, the system of internal controls regarding fi nance, accounting and ethics (including fraud and corruption), and fi nancial and operational risks. The Audit Committee also has the responsibility for reviewing the performance and recom-mending to the Board the appointment of the external auditor, as well as monitoring the independence of the external auditor. The Audit Committee participates in oversight of the internal audit function and reviews the annual internal audit plan and meets with the Auditor General in executive session. In the execution of its role, the Audit Committee discusses with management, the external auditors, and the internal auditors, fi nancial issues and policies, which have a bearing on IFC’s fi nancial position and risk-bearing capacity. The Committee also reviews with the external auditor the fi nancial statements prior to their publication and recommends them for approval of the Board of Directors. The Audit Committee updated its terms of reference in July 2009.
EXECUTIVE SESSIONS
Under the Committee’s Terms of Reference, members of the Committee may convene in executive session at any time, without management present. The Committee meets separately in execu-tive session with the external and internal auditors.

p32
ACCESS TO RESOURCES AND TO MANAGEMENT
Throughout the year, the Audit Committee receives a large volume of information, which supports the preparation of the fi nancial statements. The Audit Committee meets both formally and infor-mally throughout the year to discuss relevant matters. Directors have complete access to management. The Audit Committee reviews and discusses with management topics contemplated in their Terms of Reference.
The Audit Committee has the capacity, under exceptional cir-cumstances, to obtain advice and assistance from outside legal, accounting or other advisors as deemed appropriate.
Staff members’ ethical obligations to the institution are embod-ied in its core values and principles of staff employment. In sup-port of this commitment, the institution has in place a code of conduct, entitled Living our Values (the Code). The Code applies to all staff worldwide and is available on IBRD’s Web site, www.worldbank.org.
In addition to the Code, Staff and Administrative Manuals, guid-ance for staff is also provided through programs, training mate-rials, and other resources. Managers are responsible for ensuring that internal systems, policies, and procedures are consistently aligned with the World Bank Group’s business conduct framework.
IFC has in place procedures for the receipt, retention and handling of recommendations and concerns relating to business conduct identifi ed during accounting, internal control and audit-ing processes.
The World Bank Group has both an Ethics HelpLine and a Fraud and Corruption hotllne. A third-party service offers numerous methods of world wide communication. Other reporting channels include phone, email, anonymously, or through confi dential sub-mission through a website.
The World Bank Group’s Staff Rules clarify and codify the obliga-tions of staff in reporting suspected fraud, corruption or other mis-conduct that may threaten operations or governance of the World Bank Group. Additionally, these rules offer protection from retaliation.
AUDITOR INDEPENDENCE
The appointment of the external auditor of IFC is governed by a set of Board-approved principles. Key features of those principles include:■ Prohibition of the external auditor from the provision of all non
audit-related services;■ All audit-related services must be pre-approved on a case-
by case basis by the Board, upon recommendation of the Audit Committee;
■ Mandatory rebidding of the external audit contract every fi ve years;External auditors are appointed to a fi ve-year term of service. This
is subject to annual reappointment based on the recommendation of the Audit Committee and approval of a resolution by the Board.
MANAGEMENT’S DISCUSSION AND ANALYSIS VIII. Governance

p33
Page 39 INTERNATIONAL FINANCE CORPORATION

p34
Page 40 INTERNATIONAL FINANCE CORPORATION
p35
Page 41 INTERNATIONAL FINANCE CORPORATION

p36
Page 42 INTERNATIONAL FINANCE CORPORATION

p37
Page 43 INTERNATIONAL FINANCE CORPORATION
The notes to the consolidated financial statements are an integral part of these statements
CONSOLIDATED BALANCE SHEETS
as of June 30, 2010 and June 30, 2009
(US$ millions) 2010 2009 Assets Cash and due from banks ....................................................................................................... $ 528 $ 380 Time deposits ......................................................................................................................... 5,435 3,877 Trading securities - Notes C and R ......................................................................................... 23,428 20,243 Securities purchased under resale agreements ...................................................................... 539 544
Investments - Notes B, D, E, F, R and U Loans ($450 - June 30, 2010 and $386 - June 30, 2009 at fair value) (net of reserves against losses of $1,349 - June 30, 2010 and $1,238 - June 30, 2009) - Notes D, E and R .................................................................... 16,660 15,328 Equity investments ($4,918 - June 30, 2010 and $3,243 - June 30, 2009 at fair value) - Notes B, D and R ...................................................................................... 7,469 5,344
Debt securities - Notes D, F and R....................................................................................... 1,815 1,542 Total investments ........................................................................................................ 25,944 22,214 Derivative assets - Notes Q and R ........................................................................................... 2,688 2,195 Receivables and other assets - Note J .................................................................................... 2,513 2,030 Total assets .................................................................................................................. $ 61,075 $ 51,483 Liabilities and capital Liabilities Securities sold under repurchase agreements and payable for cash collateral received ............................................................................................. $ 8,393 $ 6,388 Borrowings outstanding - Notes K and R ............................................................................. From market sources at amortized cost .......................................................................... 1,851 399 From market sources at fair value ................................................................................... 29,205 25,261 From International Bank for Reconstruction and Development at amortized cost ............ 50 51 Total borrowings ......................................................................................................... 31,106 25,711 Derivative liabilities - Notes Q and R ................................................................................... 1,140 1,553 Payables and other liabilities - Note L .................................................................................. 2,077 1,709 Total liabilities ................................................................................................................. 42,716 35,361 Capital Capital stock, authorized 2,450,000 shares of $1,000 par value each - Note M Subscribed and paid-in ................................................................................................... 2,369 2,369 Accumulated other comprehensive income - Note O ........................................................... 1,202 711 Retained earnings - Note O ................................................................................................. 14,788 13,042 Total capital .................................................................................................................... 18,359 16,122 Total liabilities and capital ........................................................................................... $ 61,075 $ 51,483

p38
Page 44 INTERNATIONAL FINANCE CORPORATION
The notes to the consolidated financial statements are an integral part of these statements.
CONSOLIDATED INCOME STATEMENTS
for each of the three years ended June 30, 2010
(US$ millions) 2010 2009 2008 Income from investments Income from loans and guarantees - Note E ........................................................... $ 801 $ 871 $ 1,065 Provision for losses on loans and guarantees - Note E ........................................... (155) (438) (38) Income (loss) from equity investments - Note G ...................................................... 1,638 (42) 1,688 Income from debt securities - Note F ...................................................................... 108 71 163 Income from investments ............................................................................ 2,392 462 2,878 Income from liquid asset trading activities - Note C .................................................... 815 474 473 Charges on borrowings - Note K ................................................................................ (163) (488) (782) Income from investments and liquid asset trading activities, after charges on borrowings ............................................................................ 3,044 448 2,569 Other income Service fees ........................................................................................................... 70 39 58 Other – Notes B and N .......................................................................................... 106 114 55 Total other income ........................................................................................... 176 153 113 Other expenses Administrative expenses - Note W ......................................................................... (664) (582) (549) Expense from pension and other postretirement benefit plans - Note V ................. (69) (34) (3) Other – Note B ....................................................................................................... (10) (13) (3) Total other expenses ....................................................................................... (743) (629) (555) Foreign currency transaction (losses) gains on non-trading activities .......................... (82) 10 (39) Expenditures for advisory services - Note O ............................................................... (101) (129) (123) Expenditures for performance-based grants and for IFC SME Ventures for IDA countries - Note O ........................................................................................... (9) (6) (27) Income (loss) before net (losses) gains on other non-trading financial instruments accounted for at fair value and grants to IDA .......................... 2,285 (153) 1,938 Net (losses) gains on other non-trading financial instruments accounted for at fair value - Note P .............................................................................................. (339) 452 109 Income before grants to IDA ................................................................................. 1,946 299 2,047 Grants to IDA - Note O ............................................................................................... (200) (450) (500) Net income (loss) ...................................................................................................... $ 1,746 $ (151) $ 1,547

p39
Page 45 INTERNATIONAL FINANCE CORPORATION
The notes to the consolidated financial statements are an integral part of these statements.
CONSOLIDATED STATEMENTS OF COMPREHENSIVE INCOME
for each of the three years ended June 30, 2010
(US$ millions) 2010 2009 2008 Net income (loss) ...................................................................................................... $ 1,746 $ (151) $ 1,547 Other comprehensive income (loss) Net unrealized gains (losses) on debt securities arising during the year ................................................................................................... 120 (237) 126 Less: reclassification adjustment for realized gains included in net income......... (14) (6) (81) Less: reclassification adjustment for non-monetary exchanges included in net income ............................................................................ (32) (2) (23) Less: reclassification adjustment for non credit-related portion of impairment write-downs which were recognized in net income .................................. - (34) - Add: reclassification adjustment for impairment write-downs included in net income .............................................................................................. 3 105 - Net unrealized gains (losses) on debt securities ............................................. 77 (174) 22 Net unrealized gains (losses) on equity investments arising during the year ........... 919 (1,114) 92 Less: reclassification adjustment for realized gains included in net income ......... (390) (810) (570) Add: reclassification adjustment for impairment write-downs included in net income .............................................................................................. 77 453 - Net unrealized gains (losses) on equity investments ....................................... 606 (1,471) (478) Unrecognized net actuarial gains (losses) and unrecognized prior service credits (costs) on benefit plans ...................................................................................... (192) (346) (206) Total other comprehensive income (loss) .......................................................... 491 (1,991) (662) Total comprehensive income (loss) ......................................................... $ 2,237 $ (2,142) $ 885

p40
Page 46 INTERNATIONAL FINANCE CORPORATION
The notes to the consolidated financial statements are an integral part of these statements.
CONSOLIDATED STATEMENTS OF CHANGES IN CAPITAL
for each of the three years ended June 30, 2010
(US$ millions) Retained earnings Accumulated other comprehensive Capital Undesignated Designated Total income - Note O stock † Total capital
At July 1, 2007 ………………………….. $ 11,039 $ 606 $ 11,645 $ 3,365 $ 2,365 $ 17,375 Year ended June 30, 2008 Net income…………………………….. 1,547 1,547 1,547 Other comprehensive loss .................. (662) (662) Expenditures against designated retained earnings - Note O………... 650 (650) - - Designations of retained earnings - Note O………... (870) 870 - - Payments received for capital stock subscribed…………... - 1 1
At June 30, 2008………………………….$ 12,366 $ 826 $ 13,192 $ 2,703 $ 2,366 $ 18,261 Cumulative effect of adoption of FSP FAS 115-2 - Note O….. 1 1 (1) - At June 30, 2008 after cumulative effect adjustments……………………$ 12,367 $ 826 $ 13,193 $ 2,702 $ 2,366 $ 18,261 Year ended June 30, 2009 Net loss………………………………… (151) (151) (151) Other comprehensive loss .................. (1,991) (1,991) Expenditures against designated retained earnings - Note O………... 585 (585) - - Designations of retained earnings - Note O………... (550) 550 - - Payments received for capital stock subscribed…………... - 3 3
At June 30, 2009………………………... $ 12,251 $ 791 $ 13,042 $ 711 $ 2,369 $ 16,122 Year ended June 30, 2010 Net income……………………………. 1,746 1,746 1,746 Other comprehensive income ............ 491 491 Expenditures against designated retained earnings - Note O………... 310 (310) - -
At June 30, 2010………………………... $ 14,307 $ 481 $ 14,788 $ 1,202 $ 2,369 $ 18,359
† Capital stock includes payments received on account of pending subscriptions.

p41
Page 47 INTERNATIONAL FINANCE CORPORATION
The notes to the consolidated financial statements are an integral part of these statements.
CONSOLIDATED STATEMENTS OF CASH FLOWSfor each of the three years ended June 30, 2010
(US$ millions) 2010 2009 2008 Cash flows from investing activities Loan disbursements .............................................................................................. $ (4,907) $ (4,356) $ (5,076) Investments in equity securities .............................................................................. (1,617) (1,153) (1,622) Investments in debt securities ................................................................................ (269) (131) (952) Loan repayments ................................................................................................... 3,016 2,274 2,658 Equity redemptions ................................................................................................ 1 4 29 Debt securities repayments ................................................................................... 92 31 15 Sales of loans ......................................................................................................... 11 - 59 Sales of equity investments .................................................................................... 1,633 1,382 1,590 Sales of debt securities .......................................................................................... 13 8 155 Net cash used in investing activities .......................................................... (2,027) (1,941) (3,144) Cash flows from financing activities Medium and long-term borrowings New issues ......................................................................................................... 8,566 8,980 6,024 Retirement ......................................................................................................... (5,819) (3,017) (2,210) Medium and long-term borrowings related derivatives, net ................................. 261 117 154 Short-term borrowings, net ..................................................................................... 1,404 - - Capital subscriptions ............................................................................................... - 3 1 Net cash provided by financing activities ................................................. 4,412 6,083 3,969 Cash flows from operating activities Net income (loss) .................................................................................................... 1,746 (151) 1,547 Adjustments to reconcile net income (loss) to net cash (used in) provided by operating activities: Realized gains on debt securities and gains on non-monetary exchanges ......... (46) (8) (104) Realized gains on equity investments and gains on non-monetary exchanges ... (1,318) (1,004) (1,396) Unrealized (gains) losses on loans accounted for at fair value under the Fair Value Option ........................................................................... (42) 62 18 Unrealized gains on debt securities accounted for at fair value under the Fair Value Option… ........................................................................ (23) - - Unrealized (gains) losses on equity investments accounted for at fair value under the Fair Value Option ............................................................................ (240) 299 (12) Provision for losses on loans and guarantees ..................................................... 155 438 38 Impairment losses on debt securities .................................................................. 3 8 - Equity investment impairment write-downs ......................................................... 203 1,058 140 Net discounts paid on retirement of borrowings…………………………………..... (7) (17) (5) Net realized gains on extinguishment of borrowings ........................................... (62) (61) (2) Foreign currency transaction losses (gains) on non-trading activities.................. 82 (10) 39 Net losses (gains) on other non-trading financial instruments accounted for at fair value .............................................................................. 339 (452) (109) Change in accrued income on loans, time deposits and securities .................... (37) (21) (38) Change in payables and other liabilities ............................................................. 634 (3,210) (1,742) Change in receivables and other assets ............................................................. (162) 2,705 1,129 Change in trading securities and securities purchased and sold under resale and repurchase agreements ................................................................ (2,085) (8,156) 2,990 Net cash (used in) provided by operating activities .................................. (860) (8,520) 2,493 Change in cash and cash equivalents ........................................................................ 1,525 (4,378) 3,318 Effect of exchange rate changes on cash and cash equivalents ................................ 181 (127) 83 Net change in cash and cash equivalents .................................................................. 1,706 (4,505) 3,401 Beginning cash and cash equivalents ........................................................................ 4,257 8,762 5,361 Ending cash and cash equivalents ......................................................................... $ 5,963 $ 4,257 $ 8,762 Composition of cash and cash equivalents Cash and due from banks ....................................................................................... $ 528 $ 380 $ 344 Time deposits ........................................................................................................ 5,435 3,877 8,418 Total cash and cash equivalents ........................................................................ $ 5,963 $ 4,257 $ 8,762

p42
Page 48 INTERNATIONAL FINANCE CORPORATION
The notes to the consolidated financial statements are an integral part of these statements.
CONSOLIDATED STATEMENTS OF CASH FLOWSfor each of the three years ended June 30, 2010
(US$ millions) 2010 2009 2008 Supplemental disclosure Change in ending balances resulting from currency exchange rate fluctuations: Loans outstanding ............................................................................................. $ (267) $ (535) $ 421 Debt securities .................................................................................................. 59 (131) 85 Borrowings ......................................................................................................... (411) 414 (725) Borrowing-related currency swaps ..................................................................... 410 (391) 679 Loan and debt security-related currency swaps ................................................. 128 702 (494) Client risk management-related currency swaps................................................. (1) 2 - Charges on borrowings paid, net ............................................................................ $ 209 $ 527 $ 827 Non-cash item: Loan and debt securities conversion to equity, net .............................................. $ 172 $ 41 $ 109

p43
Page 49 INTERNATIONAL FINANCE CORPORATION
The notes to the consolidated financial statements are an integral part of these statements.
CONSOLIDATED STATEMENT OF CAPITAL STOCK AND VOTING POWER
as of June 30, 2010
(US$ thousands)
Capital stock Voting power Amount Percent Number Percent Members paid of total of votes of total
Afghanistan .......................$ 111 * 361 0.01 Albania .............................. 1,302 0.05 1,552 0.06 Algeria ............................... 5,621 0.24 5,871 0.24 Angola ............................... 1,481 0.06 1,731 0.07 Antigua and Barbuda ......... 13 * 263 0.01 Argentina ........................... 38,129 1.61 38,379 1.59 Armenia ............................. 992 0.04 1,242 0.05 Australia ............................ 47,329 2.00 47,579 1.97 Austria ............................... 19,741 0.83 19,991 0.83 Azerbaijan ......................... 2,367 0.10 2,617 0.11 Bahamas, The ................... 335 0.01 585 0.02 Bahrain .............................. 1,746 0.07 1,996 0.08 Bangladesh ....................... 9,037 0.38 9,287 0.38 Barbados ........................... 361 0.02 611 0.03 Belarus .............................. 5,162 0.22 5,412 0.22 Belgium ............................. 50,610 2.14 50,860 2.11 Belize ................................. 101 * 351 0.01 Benin ................................. 119 0.01 369 0.02 Bhutan ................................ 720 0.03 970 0.04 Bolivia ................................ 1,902 0.08 2,152 0.09 Bosnia and Herzegovina ... 620 0.03 870 0.04 Botswana ........................... 113 * 363 0.02 Brazil ................................. 39,479 1.67 39,729 1.65 Bulgaria ............................. 4,867 0.21 5,117 0.21 Burkina Faso ..................... 836 0.04 1,086 0.04 Burundi .............................. 100 * 350 0.01 Cambodia .......................... 339 0.01 589 0.02 Cameroon .......................... 885 0.04 1,135 0.05 Canada .............................. 81,342 3.43 81,592 3.38 Cape Verde ....................... 15 * 265 0.01 Central African Republic .... 119 0.01 369 0.02 Chad ................................... 1,364 0.06 1,614 0.07 Chile .................................. 11,710 0.49 11,960 0.50 China ................................. 24,500 1.03 24,750 1.02 Colombia ........................... 12,606 0.53 12,856 0.53 Comoros ............................ 14 * 264 0.01 Congo, Dem. Rep. of ..... 2,159 0.09 2,409 0.10 Congo, Republic of ............ 131 0.01 381 0.02 Costa Rica ......................... 952 0.04 1,202 0.05 Côte d'Ivoire ...................... 3,544 0.15 3,794 0.16 Croatia ............................... 2,882 0.12 3,132 0.13 Cyprus ............................... 2,139 0.09 2,389 0.10 Czech Republic ................. 8,913 0.38 9,163 0.38 Denmark ............................ 18,554 0.78 18,804 0.78 Djibouti .............................. 21 * 271 0.01 Dominica ........................... 42 * 292 0.01 Dominican Republic .......... 1,187 0.05 1,437 0.06 Ecuador ............................. 2,161 0.09 2,411 0.10 Egypt, Arab Republic of ..... 12,360 0.52 12,610 0.52 El Salvador ........................ 29 * 279 0.01 Equatorial Guinea .............. 43 * 293 0.01 Eritrea ................................ 935 0.04 1,185 0.05 Estonia .............................. 1,434 0.06 1,684 0.07 Ethiopia ............................. 127 0.01 377 0.02 Fiji ...................................... 287 0.01 537 0.02 Finland ............................... 15,697 0.66 15,947 0.66 France ............................. 121,015 5.11 121,265 5.02 Gabon ................................ 1,268 0.05 1,518 0.06 Gambia, The ...................... 94 * 344 0.01 Georgia .............................. 1,380 0.06 1,630 0.07 Germany .......................... 128,908 5.44 129,158 5.35 Ghana ................................ 5,071 0.21 5,321 0.22 Greece ............................... 6,898 0.29 7,148 0.30 Grenada ............................ 74 * 324 0.01 Guatemala ......................... 1,084 0.05 1,334 0.06 Guinea ............................... 339 0.01 589 0.02 Guinea-Bissau ................... 18 * 268 0.01 Guyana .............................. 1,392 0.06 1,642 0.07 Haiti ................................... 822 0.03 1,072 0.04 Honduras ........................... 495 0.02 745 0.03 Hungary ............................. 10,932 0.46 11,182 0.46 Iceland ............................... 42 * 292 0.01 India ................................... 81,342 3.43 81,592 3.38 Indonesia ........................... 28,539 1.20 28,789 1.19 Iran, Islamic Republic of .... 1,444 0.06 1,694 0.07 Iraq .................................... 147 0.01 397 0.02 Ireland ............................... 1,290 0.05 1,540 0.06 Israel .................................. 2,135 0.09 2,385 0.10 Italy .................................... 81,342 3.43 81,592 3.38 Jamaica ............................. 4,282 0.18 4,532 0.19 Japan ............................... 141,174 5.96 141,424 5.86 Jordan ............................... 941 0.04 1,191 0.05 Kazakhstan ........................ 4,637 0.20 4,887 0.20 Kenya ................................ 4,041 0.17 4,291 0.18 Kiribati ............................... 12 * 262 0.01 Korea, Republic of ............. 15,946 0.67 16,196 0.67 Kosovo .............................. 1,454 0.06 1,704 0.07 Kuwait ................................ 9,947 0.42 10,197 0.42 Kyrgyz Republic ................ 1,720 0.07 1,970 0.08 Lao People's Dem. Rep. ... 278 0.01 528 0.02 Latvia ................................. 2,150 0.09 2,400 0.10
Capital stock Voting power Amount Percent Number Percent Members paid of total of votes of total
Lebanon ............................$ 135 0.01 385 0.02 Lesotho .............................. 71 * 321 0.01 Liberia ................................ 83 * 333 0.01 Libya .................................. 55 * 305 0.01 Lithuania ............................ 2,341 0.10 2,591 0.11 Luxembourg ...................... 2,139 0.09 2,389 0.10 Macedonia, FYR of ............ 536 0.02 786 0.03 Madagascar ....................... 432 0.02 682 0.03 Malawi ............................... 1,822 0.08 2,072 0.09 Malaysia ............................ 15,222 0.64 15,472 0.64 Maldives ............................ 16 * 266 0.01 Mali .................................... 451 0.02 701 0.03 Malta .................................. 1,615 0.07 1,865 0.08 Marshall Islands ................ 663 0.03 913 0.04 Mauritania .......................... 214 0.01 464 0.02 Mauritius ............................ 1,665 0.07 1,915 0.08 Mexico ............................... 27,589 1.16 27,839 1.15 Micronesia, Fed. States of .. 744 0.03 994 0.04 Moldova ............................. 1,192 0.05 1,442 0.06 Mongolia ............................ 144 0.01 394 0.02 Montenegro ....................... 1,035 0.04 1,285 0.05 Morocco ............................. 9,037 0.38 9,287 0.38 Mozambique ...................... 322 0.01 572 0.02 Myanmar ........................... 666 0.03 916 0.04 Namibia ............................. 404 0.02 654 0.03 Nepal ................................. 822 0.03 1,072 0.04 Netherlands ....................... 56,131 2.37 56,381 2.33 New Zealand ..................... 3,583 0.15 3,833 0.16 Nicaragua .......................... 715 0.03 965 0.04 Niger .................................. 147 0.01 397 0.02 Nigeria ............................... 21,643 0.91 21,893 0.91 Norway .............................. 17,599 0.74 17,849 0.74 Oman ................................. 1,187 0.05 1,437 0.06 Pakistan ............................. 19,380 0.82 19,630 0.81 Palau ................................. 25 * 275 0.01 Panama ............................. 1,007 0.04 1,257 0.05 Papua New Guinea ........... 1,147 0.05 1,397 0.06 Paraguay ........................... 436 0.02 686 0.03 Peru ................................... 6,898 0.29 7,148 0.30 Philippines ......................... 12,606 0.53 12,856 0.53 Poland ............................... 7,236 0.31 7,486 0.31 Portugal ............................. 8,324 0.35 8,574 0.36 Qatar ................................. 1,650 0.07 1,900 0.08 Romania ............................ 2,661 0.11 2,911 0.12 Russian Federation ........... 81,342 3.43 81,592 3.38 Rwanda ............................. 306 0.01 556 0.02 Samoa ............................... 35 * 285 0.01 Sao Tome and Principe ..... 439 0.02 689 0.03 Saudi Arabia ...................... 30,062 1.27 30,312 1.26 Senegal ............................. 2,299 0.10 2,549 0.11 Serbia ................................. 1,803 0.08 2,053 0.09 Seychelles ......................... 27 * 277 0.01 Sierra Leone ...................... 223 0.01 473 0.02 Singapore .......................... 177 0.01 427 0.02 Slovak Republic ................. 4,457 0.19 4,707 0.19 Slovenia ............................. 1,585 0.07 1,835 0.08 Solomon Islands ................ 37 * 287 0.01 Somalia ............................. 83 * 333 0.01 South Africa ....................... 15,948 0.67 16,198 0.67 Spain ................................. 37,026 1.56 37,276 1.54 Sri Lanka ........................... 7,135 0.30 7,385 0.31 St. Kitts and Nevis ............. 638 0.03 888 0.04 St. Lucia ............................ 74 * 324 0.01 Sudan ................................ 111 * 361 0.01 Swaziland .......................... 684 0.03 934 0.04 Sweden ............................. 26,876 1.13 27,126 1.12 Switzerland ........................ 41,580 1.75 41,830 1.73 Syrian Arab Republic ......... 194 0.01 444 0.02 Tajikistan ........................... 1,212 0.05 1,462 0.06 Tanzania ............................ 1,003 0.04 1,253 0.05 Thailand ............................. 10,941 0.46 11,191 0.46 Timor-Leste ....................... 777 0.03 1,027 0.04 Togo .................................. 808 0.03 1,058 0.04 Tonga ................................ 34 * 284 0.01 Trinidad and Tobago ......... 4,112 0.17 4,362 0.18 Tunisia ............................... 3,566 0.15 3,816 0.16 Turkey ............................... 14,545 0.61 14,795 0.61 Turkmenistan ..................... 810 0.03 1,060 0.04 Uganda .............................. 735 0.03 985 0.04 Ukraine .............................. 9,505 0.40 9,755 0.40 United Arab Emirates ........ 4,033 0.17 4,283 0.18 United Kingdom ................. 121,015 5.11 121,265 5.02 United States ..................... 569,379 24.03 569,629 23.59 Uruguay ............................. 3,569 0.15 3,819 0.16 Uzbekistan ......................... 3,873 0.16 4,123 0.17 Vanuatu ............................. 55 * 305 0.01 Venezuela, Rep. Boliv. de . 27,588 1.16 27,838 1.15 Vietnam ............................. 446 0.02 696 0.03 Yemen, Republic of ........... 715 0.03 965 0.04 Zambia .............................. 1,286 0.05 1,536 0.06 Zimbabwe .......................... 2,120 0.09 2,370 0.10 Total June 30, 2010 $ 2,369,396 100.00+ 2,414,896 100.00+ Total June 30, 2009 $ 2,369,396 100.00+ 2,414,896 100.00+
* Less than .005 percent. + May differ from the sum of the individual percentages shown because of rounding.

p44
Page 50 INTERNATIONAL FINANCE CORPORATION
NOTES TO CONSOLIDATED FINANCIAL STATEMENTS
PURPOSE The International Finance Corporation (IFC), an international organization, was established in 1956 to further economic development in its member countries by encouraging the growth of private enterprise. IFC is a member of the World Bank Group, which also comprises the International Bank for Reconstruction and Development (IBRD), the International Development Association (IDA), the Multilateral Investment Guarantee Agency (MIGA), and the International Centre for Settlement of Investment Disputes (ICSID). Each member is legally and financially independent. Transactions with other World Bank Group members are disclosed in the notes that follow. IFC’s activities are closely coordinated with and complement the overall development objectives of the other World Bank Group institutions. IFC, together with private investors, assists in financing the establishment, improvement and expansion of private sector enterprises by making loans, equity investments and investments in debt securities where sufficient private capital is not otherwise available on reasonable terms. IFC’s share capital is provided by its member countries. It raises most of the funds for its investment activities through the issuance of notes, bonds and other debt securities in the international capital markets. IFC also plays a catalytic role in mobilizing additional funding from other investors and lenders through parallel loans, loan participations, partial credit guarantees, securitizations, loan sales, risk sharing facilities, and fund investments through the IFC Asset Management Company, LLC and other IFC crisis initiatives. In addition to project finance and resource mobilization, IFC offers an array of financial and technical advisory services to private businesses in the developing world to increase their chances of success. It also advises governments on how to create an environment hospitable to the growth of private enterprise and foreign investment. NOTE A – SUMMARY OF SIGNIFICANT ACCOUNTING AND RELATED POLICIES The consolidated financial statements include the financial statements of IFC, three subsidiaries, and three variable interest entities (VIEs) (see Notes B and U). The accounting and reporting policies of IFC conform with accounting principles generally accepted in the United States of America (US GAAP). On August 5, 2010, the Board of Directors of IFC (the Board) approved these consolidated financial statements for issue. Consolidated financial statements presentation – Certain amounts in the prior years have been reclassified to conform to the current year’s presentation. Functional currency – IFC’s functional currency is the United States dollar (US dollars or $). Use of estimates – The preparation of the consolidated financial statements requires management to make estimates and assumptions that affect the reported amounts of assets and liabilities and disclosure of contingent assets and liabilities at the date of the consolidated financial statements and the reported amounts of income and expense during the reporting periods. Actual results could differ from these estimates. A significant degree of judgment has been used in the determination of: the reserve against losses on loans and impairment of debt securities and equity investments; estimated fair values of financial instruments accounted for at fair value (including equity investments, debt securities, loans, trading securities and derivative instruments); projected benefit obligations, fair value of pension and other postretirement benefit plan assets, and net periodic pension income or expense. There are inherent risks and uncertainties related to IFC’s operations. The possibility exists that changing economic conditions could have an adverse effect on the financial position of IFC. IFC uses internal models to determine the fair values of derivative and other financial instruments and the aggregate level of the reserve against losses on loans and impairment of equity investments. IFC undertakes continuous review and respecification of these models with the objective of refining its estimates, consistent with evolving best practices appropriate to its operations. Changes in estimates resulting from refinements in the assumptions and methodologies incorporated in the models are reflected in net income in the period in which the enhanced models are first applied. Fair Value Option and Fair Value Measurements – IFC has adopted the Financial Accounting Standards Board’s (FASB) Accounting Standards Codification (ASC) Topic 820, Fair Value Measurements and Disclosures (ASC 820) (formerly Statement of Financial Accounting Standards (SFAS) No. 157, Fair Value Measurements) and the Fair Value Option subsections of ASC Topic 825, Financial Instruments (ASC 825 or the Fair Value Option) (formerly SFAS No. 159, The Fair Value Option for Financial Assets and Financial Liabilities). ASC 820 defines fair value, establishes a framework for measuring fair value and a fair value hierarchy that prioritizes the inputs to valuation techniques used to measure fair value into three broad levels and applies to all items measured at fair value, including items for which impairment measures are based on fair value. ASC 825 permits the measurement of eligible financial assets, financial liabilities and firm commitments at fair value on an instrument-by-instrument basis, that are not otherwise permitted to be accounted for at fair value under other accounting standards. The election to use the Fair Value Option is available when an entity first recognizes a financial asset or liability or upon entering into a firm commitment. The Fair Value Option IFC has elected the Fair Value Option for the following financial assets and financial liabilities existing at the time of adoption of ASC 820 and subsequently entered into: (i) direct investments in securities and other financial interests (e.g. loans) in which IFC has significant influence in investees; (ii) direct equity investments representing 20 percent or more ownership but in which IFC does not have significant influence and certain
investments in Limited Liability Partnerships (LLPs) and Limited Liability Companies (LLCs) that maintain specific ownership accounts and loans or guarantees to such investees; and
(iii) all market borrowings, except for such borrowings having no associated derivative instruments. All borrowings for which the Fair Value Option has been elected are associated with existing derivative instruments used to create a fair value-like or cash flow-like hedge relationship. Measuring at fair value those borrowings for which the Fair Value Option has been elected at fair value mitigates the earnings volatility caused by measuring the borrowings and related derivative differently (in the absence of a designated accounting hedge) without having to apply ASC 815’s complex hedge accounting requirements. The Fair Value Option was not elected for all borrowings from IBRD and all other market borrowings because such borrowings fund assets with similar characteristics.

p45
Page 51 INTERNATIONAL FINANCE CORPORATION
NOTES TO CONSOLIDATED FINANCIAL STATEMENTS
Measuring at fair value those equity investments that would otherwise require equity method accounting simplifies the accounting and renders a carrying amount on the consolidated balance sheet based on a measure (fair value) that IFC considers superior to equity method accounting. For the investments that otherwise would require equity method accounting for which the Fair Value Option is elected, ASC 825 requires the Fair Value Option to also be applied to all eligible financial interests in the same entity. IFC has disbursed loans to certain of such investees, therefore, the Fair Value Option is also applied to those loans. IFC elected the Fair Value Option for equity investments with 20% or more ownership where it does not have significant influence so that the same measurement method (fair value) will be applied to all equity investments with more than 20% ownership. In addition, IFC has elected the Fair Value Option for certain hybrid instruments in the investment portfolio. Fair Value Measurements ASC 820 defines fair value as the price that would be received to sell an asset or transfer a liability (i.e., an exit price) in an orderly transaction between independent, knowledgeable and willing market participants at the measurement date assuming the transaction occurs in the entity’s principal (or most advantageous) market. Fair value must be based on assumptions market participants would use (inputs) in determining the price and measured assuming the highest and best use for the asset by market participants. The highest and best use of the IFC assets and liabilities measured at fair value is considered to be in exchange, therefore, their fair values are determined based on a transaction to sell or transfer the asset or liability on a standalone basis. Under ASC 820, fair value measurements are not adjusted for transaction costs. Upon the adoption of ASC 820, and pursuant to ASC 830, IFC now reports equity investments that are listed in markets that provide readily determinable fair values at fair value, with unrealized gains and losses being reported in other comprehensive income. The fair value hierarchy established by ASC 820 gives the highest priority to unadjusted quoted prices in active markets for identical unrestricted assets and liabilities (Level 1), the next highest priority to observable market based inputs or unobservable inputs that are corroborated by market data from independent sources (Level 2) and the lowest priority to unobservable inputs that are not corroborated by market data (Level 3). Fair value measurements are required to maximize the use of available observable inputs. Level 1 primarily consists of financial instruments whose values are based on unadjusted quoted market prices. It includes IFC’s equity investments which are listed in markets that provide readily determinable fair values, government issues and money market funds in the liquid assets portfolio, and market borrowings that are listed on exchanges. Level 2 includes financial instruments that are valued using models and other valuation methodologies. These models consider various assumptions and inputs, including time value, yield curves, volatility factors, prepayment speeds, default rates, loss severity and current market and contractual pricing for the underlying asset, as well as other relevant economic measures. Substantially all of these inputs are observable in the market place, can be derived from observable data or are supported by observable levels at which market transactions are executed. Financial instruments categorized as Level 2 includes non-exchange-traded derivatives such as interest rate swaps, cross-currency swaps, certain asset-backed securities, as well as the majority of trading securities in the liquid asset portfolio, and the portion of IFC’s borrowings accounted for at fair value not included in Level 1. Level 3 consists of financial instruments whose fair value is estimated based on internally developed models or methodologies utilizing significant inputs that are non-observable. It also includes financial instruments whose fair value is estimated based on price information from independent sources that cannot be corroborated by observable market data. Level 3 includes equity investments that are not listed in markets that provide readily determinable fair values, all loans for which IFC has elected the Fair Value Option, all of IFC’s debt securities in the investment portfolio, and certain hard-to-price securities in the liquid assets portfolio. Translation of currencies – Assets and liabilities not denominated in US dollars, other than disbursed equity investments, are expressed in US dollars at the exchange rates prevailing at June 30, 2010 and June 30, 2009. Disbursed equity investments, other than those accounted for at fair value, are expressed in US dollars at the prevailing exchange rates at the time of disbursement. Income and expenses are recorded based on the rates of exchange prevailing at the time of the transaction. Transaction gains and losses are credited or charged to income. Loans – IFC originates loans to facilitate project finance, restructuring, refinancing, corporate finance, and/or other developmental objectives. Loans are recorded as assets when disbursed. Loans are generally carried at the principal amounts outstanding adjusted for net unamortized loan origination costs and fees. It is IFC’s practice to obtain collateral security such as, but not limited to, mortgages and third-party guarantees. Certain loans are carried at fair value in accordance with the Fair Value Option as discussed above. Unrealized gains and losses on loans accounted for at fair value under the Fair Value Option are reported in income from loans and guarantees on the consolidated income statement. IFC enters into loans with income participation, prepayment and conversion features; these features are bifurcated and separately accounted for in accordance with ASC 815 if they meet the definition of a derivative, are not considered to be clearly and closely related to their host loan contracts and their host loan contracts are not accounted for at fair value through net income. Otherwise, these features are accounted for as part of their host loan contracts in accordance with IFC’s accounting policies for loans as indicated herein. Revenue recognition on loans – Interest income and commitment fees on loans are recorded as income on an accrual basis. Net loan origination costs and fees are amortized over the estimated life of the originated loan to which the fees relate; such amortization is determined using the interest method unless the loan is a revolving credit facility in which case amortization is determined using the straight-line method. Prepayment fees are recorded as income when received in freely convertible currencies.

p46
Page 52 INTERNATIONAL FINANCE CORPORATION
NOTES TO CONSOLIDATED FINANCIAL STATEMENTS
IFC does not recognize income on loans where collectability is in doubt or payments of interest or principal are past due more than 60 days unless management anticipates that collection of interest will occur in the near future. Any interest accrued on a loan placed in nonaccrual status is reversed out of income and is thereafter recognized as income only when the actual payment is received. Interest not previously recognized but capitalized as part of a debt restructuring is recorded as deferred income, included in the consolidated balance sheet in payables and other liabilities, and credited to income only when the related principal is received. Such capitalized interest is considered in the computation of the reserve against losses on loans in the consolidated balance sheet. Reserve against losses on loans – IFC recognizes impairment on loans not carried at fair value in the consolidated balance sheet through the reserve against losses on loans, recording a provision or release of provision for losses on loans in net income, which increases or decreases the reserve against losses on loans. Individually impaired loans are measured based on the present value of expected future cash flows to be received, observable market prices, or for loans that are dependent on collateral for repayment, the estimated fair value of the collateral. Management determines the aggregate level of the reserve against losses on loans, taking into account established guidelines and its assessment of recent portfolio quality trends. The guidelines include internal country and loan risk ratings, and the impairment potential of the loan portfolio based on IFC’s historical portfolio loss experience on mature loans. The reserve against losses on loans reflects estimates of both identified probable losses on individual loans (specific reserves) and probable losses inherent in the portfolio but not specifically identifiable (portfolio reserves). The determination of identified probable losses represents management’s judgment of the creditworthiness of the borrower. Reserves against losses are established through a review of individual loans undertaken on a quarterly basis. IFC considers a loan as impaired when, based on current information and events, it is probable that IFC will be unable to collect all amounts due according to the loan’s contractual terms. Unidentified probable losses are the losses incurred at the reporting date that have not yet been specifically identified. The risks inherent in the portfolio that are considered in determining unidentified probable losses are those proven to exist by past experience and include: country systemic risk; the risk of correlation or contagion of losses between markets; uninsured and uninsurable risks; nonperformance under guarantees and support agreements; and opacity of, or misrepresentation in, financial statements. Loans are written-off when IFC has exhausted all possible means of recovery, by reducing the reserve against losses on loans. Such reductions in the reserve are partially offset by recoveries associated with previously written-off loans. Equity investments – IFC invests primarily for developmental impact; IFC does not seek to take operational, controlling, or strategic equity positions within its investees. Equity investments are acquired through direct ownership of equity instruments of investees, as a limited partner in LLPs and LLCs, and/or as an investor in private equity funds. Revenue recognition on equity investments – Equity investments which are listed in markets that provide readily determinable fair values are accounted for as available-for-sale securities at fair value with unrealized gains and losses being reported in other comprehensive income in accordance with ASC Topic 320, Investments - Debt and Equity Securities (ASC 320) (formerly SFAS No. 115, Accounting for Certain Investments in Debt and Equity Securities). As noted above under “Fair Value Option and Fair Value Measurements”, direct equity investments in which IFC has significant influence, direct equity investments representing 20 percent or more ownership but in which IFC does not have significant influence and certain investments in LLPs and LLCs that maintain specific ownership accounts are accounted for at fair value under the Fair Value Option. Direct equity investments in which IFC does not have significant influence and which are not listed in markets that provide readily determinable fair values are carried at cost less impairment. IFC’s investments in certain private equity funds in which IFC is deemed to be the Primary Beneficiary of a VIE, as the presumption of control by the fund manager or the general partner has been overcome, are fully consolidated into IFC’s books. Certain equity investments, for which recovery of invested capital is uncertain, are accounted for under the cost recovery method, such that receipts of freely convertible currencies are first applied to recovery of invested capital and then to income from equity investments. The cost recovery method is principally applied to IFC's investments in its oil and gas unincorporated joint ventures (UJVs). IFC’s share of conditional asset retirement obligations related to investments in UJVs are recorded when the fair value of the obligations can be reasonably estimated. The obligations are capitalized and systematically amortized over the estimated economic useful lives. Unrealized gains and losses on equity investments accounted for at fair value under the Fair Value Option are reported in income from equity investments on the consolidated income statement. Unrealized gains and losses on equity investments listed in markets that provide readily determinable fair values which are accounted for as available-for-sale are reported in other comprehensive income. Dividends and profit participations received on equity investments are generally recorded as income when received in freely convertible currencies. Realized gains on the sale or redemption of equity investments are measured against the average cost of the investments sold and are generally recorded as income in income from equity investments when received in freely convertible currencies. Capital losses are recognized when incurred. IFC enters into put and call option and warrant agreements in connection with equity investments; these are accounted for in accordance with ASC 815 to the extent they meet the definition of a derivative. Impairment of equity investments – Equity investments accounted for at cost less impairment and available-for-sale are assessed for impairment each quarter. When impairment is identified, it is generally deemed to be other than temporary, and the equity investment is written down to the impaired value, which becomes the new cost basis in the equity investment. Such other than temporary impairments are recognized in net income. Subsequent increases in the fair value of available-for-sale equity investments are included in other comprehensive income - subsequent decreases in fair value, if not other than temporary impairment, also are included in other comprehensive income.

p47
Page 53 INTERNATIONAL FINANCE CORPORATION
NOTES TO CONSOLIDATED FINANCIAL STATEMENTS
Debt securities – Debt securities in the investment portfolio are classified as available-for-sale and carried at fair value on the consolidated balance sheet with unrealized gains and losses included in accumulated other comprehensive income until realized. Realized gains on sales of debt securities and interest on debt securities is included in income from debt securities on the consolidated income statement. Certain debt securities are carried at fair value in accordance with the Fair Value Option as discussed above. Unrealized gains and losses on debt securities accounted for at fair value under the Fair Value Option are reported in income from debt securities on the consolidated income statement. IFC invests in certain debt securities with conversion features; these features are accounted for in accordance with ASC 815 to the extent they meet the definition of a derivative. Impairment of debt securities – In determining whether an unrealized loss on debt securities is temporary, IFC considers all relevant information including the length of time and the extent to which fair value has been less than amortized cost, whether IFC intends to sell the debt security or whether it is more likely than not that IFC will be required to sell the debt security, the payment structure of the obligation and the ability of the issuer to make scheduled interest or principal payments, any changes to the ratings of a security, and relevant adverse conditions specifically related to the security, an industry or geographic sector. Debt securities in the investment portfolio are assessed for impairment each quarter. Beginning April 1, 2009, when impairment is identified, the entire impairment is recognized in net income if (1) IFC intends to sell the security, (2) it is more likely than not that IFC will be required to sell the security before recovery, or (3) IFC does not expect to recover the entire amortized cost basis of the security. However, if IFC does not intend to sell the security and it is not more likely than not that IFC will be required to sell the security but the security has suffered a credit loss, the impairment charge will be separated into the credit loss component, which is recognized in net income, and the remainder which is recorded in other comprehensive income. The impaired value becomes the new amortized cost basis of the debt security. Subsequent increases and decreases - if not an additional other-than-temporary impairment - in the fair value of debt securities are included in other comprehensive income. The difference between the new amortized cost basis of debt securities for which an other-than-temporary impairment has been recognized in net income and the cash flows expected to be collected is accreted to interest income using the effective yield method. Significant subsequent increases in the expected or actual cash flows previously expected are recognized as a prospective adjustment of the yield. Prior to April 1, 2009, an identified impairment was generally deemed to be other-than-temporary unless IFC was able to demonstrate it had the ability and intent to hold the debt security for the period for which recovery was anticipated. Debt securities that were impaired and for which the impairment was deemed to be other than temporary were written down to the impaired value, which became the new cost basis in the debt security. Other-than-temporary impairments were recognized in net income. Guarantees – IFC extends financial guarantee facilities to its clients to provide credit enhancement for their debt securities and trade obligations. IFC offers partial credit guarantees to clients covering, on a risk-sharing basis, client obligations on bonds and/or loans. Under the terms of IFC's guarantees, IFC agrees to assume responsibility for the client’s financial obligations in the event of default by the client (i.e., failure to pay when payment is due). Guarantees are regarded as issued when IFC commits to the guarantee. Guarantees are regarded as outstanding when the underlying financial obligation of the client is incurred, and this date is considered to be the “inception” of the guarantee. Guarantees are regarded as called when IFC’s obligation under the guarantee has been invoked. There are two liabilities associated with the guarantees: (1) the stand-ready obligation to perform and (2) the contingent liability. The fair value of the stand-ready obligation to perform is recognized at the inception of the guarantee unless a contingent liability exists at that time or is expected to exist in the near term. The contingent liability associated with the financial guarantee is recognized when it is probable the guarantee will be called and when the amount of guarantee called can be reasonably estimated. All liabilities associated with guarantees are included in payables and other liabilities, and the receivables are included in other assets on the consolidated balance sheet. When the guarantees are called, the amount disbursed is recorded as a new loan, and specific reserves against losses are established, based on the estimated probable loss. Guarantee fees are recorded in income as the stand-ready obligation to perform is fulfilled. Commitment fees on guarantees are recorded as income on an accrual basis. Designations of retained earnings – IFC establishes funding mechanisms for specific Board approved purposes through designations of retained earnings. Designations of retained earnings for grants to IDA are recorded as a transfer from undesignated retained earnings to designated retained earnings when the designation is approved by the Board of Governors. All other designations are recorded as a transfer from undesignated retained earnings to designated retained earnings when the designation is noted with approval by the Board of Directors. Total designations of retained earnings are determined based on IFC’s annual income before expenditures against designated retained earnings and net gains and losses on other non-trading financial instruments accounted for at fair value in excess of $150 million, and contemplating the financial capacity and strategic priorities of IFC. Expenditures resulting from such designations are recorded as expenses in IFC’s consolidated income statement in the year in which they are incurred, also having the effect of reducing the respective designated retained earnings for such purposes. Expenditures are deemed to have been incurred when IFC has ceded control of the funds to the recipient. If the recipient is deemed to be controlled by IFC, the expenditure is deemed to have been incurred only when the recipient disburses the funds to a non-related party. On occasion, recipients which are deemed to be controlled by IFC make investments. In such cases, IFC includes those assets on its consolidated balance sheet until the recipient disposes of or transfers the asset or IFC is deemed to no longer be in control of the recipient. These investments have had no material impact on IFC’s financial position, results of operations, or cash flows. Investments resulting from such designations are recorded on IFC’s consolidated balance sheet in the year in which they occur, also having effect of reducing the respective designated retained earnings for such purposes.

p48
Page 54 INTERNATIONAL FINANCE CORPORATION
NOTES TO CONSOLIDATED FINANCIAL STATEMENTS
Liquid asset portfolio – IFC’s liquid funds are invested in government, agency and government-sponsored agency obligations, time deposits and asset-backed, including mortgage-backed, securities. Government and agency obligations include positions in high quality fixed rate bonds, notes, bills, and other obligations issued or unconditionally guaranteed by governments of countries or other official entities including government agencies and instrumentalities or by multilateral organizations. Asset-backed and mortgage-backed securities include agency and non-agency residential mortgage-backed securities, commercial mortgage-backed securities, consumer, auto- and student loans-backed securities, commercial real estate collateralized debt obligations and collateralized loan obligations. The liquid asset portfolio, as defined by IFC, consists of: time deposits and securities; related derivative instruments; securities purchased under resale agreements, securities sold under repurchase agreements and payable for cash collateral received; receivables from sales of securities and payables for purchases of securities; and related accrued income and charges. Securities and related derivative instruments within IFC’s liquid asset portfolio are classified as trading and are carried at fair value with any changes in fair value reported in income from liquid asset trading activities. Interest on securities and amortization of premiums and accretion of discounts are also reported in income from liquid asset trading activities. Gains and losses realized on the sale of trading securities are computed on a specific security basis. IFC classifies cash and due from banks and time deposits (collectively, cash and cash equivalents) as cash and cash equivalents in the consolidated statement of cash flows because they are generally readily convertible to known amounts of cash within 90 days of acquisition. Repurchase and resale agreements – Repurchase agreements are contracts under which a party sells securities and simultaneously agrees to repurchase the same securities at a specified future date at a fixed price. Resale agreements are contracts under which a party purchases securities and simultaneously agrees to resell the same securities at a specified future date at a fixed price. It is IFC’s policy to take possession of securities purchased under resale agreements, which are primarily liquid government securities. The market value of these securities is monitored and, within parameters defined in the agreements, additional collateral is obtained when their value declines. IFC also monitors its exposure with respect to securities sold under repurchase agreements and, in accordance with the terms of the agreements, requests the return of excess securities held by the counterparty when their value increases. Repurchase and resale agreements are accounted for as collateralized financing transactions and recorded at the amount at which the securities were acquired or sold plus accrued interest. Borrowings – To diversify its access to funding, and reduce its borrowing costs, IFC borrows in a variety of currencies and uses a number of borrowing structures, including foreign exchange rate-linked, inverse floating rate and zero coupon notes. Generally, IFC simultaneously converts such borrowings into variable rate US dollar borrowings through the use of currency and interest rate swap transactions. Under certain outstanding borrowing agreements, IFC is not permitted to mortgage or allow a lien to be placed on its assets (other than purchase money security interests) without extending equivalent security to the holders of such borrowings. Substantially all borrowings are carried at fair value under the Fair Value Option with changes in fair value reported in net gains and losses on other non-trading financial instruments accounted for at fair value in the consolidated income statement. Interest on borrowings and amortization of premiums and accretion of discounts are reported in charges on borrowings. Risk management and use of derivative instruments – IFC enters into transactions in various derivative instruments for financial risk management purposes in connection with its principal business activities, including lending, investing in debt securities and equity investments, client risk management, borrowing, liquid asset portfolio management and asset and liability management. All derivative instruments are recorded on the consolidated balance sheet at fair value as derivative assets or derivative liabilities. Where they are not clearly and closely related to the host contract, certain derivative instruments embedded in loans, debt securities and equity investments are bifurcated from the host contract and recorded at fair value as derivative assets and liabilities. The fair value at inception of such embedded derivatives is excluded from the carrying value of the host contracts on the consolidated balance sheet. Changes in fair values of derivative instruments used in the liquid asset portfolio are recorded in income from liquid asset trading activities. Changes in fair values of derivative instruments other than those in the liquid asset portfolio are recorded in net gains and losses on other non-trading financial instruments accounted for at fair value. The risk management policy for each of IFC’s principal business activities and the accounting policies particular to them are described below. Lending activities IFC’s policy is to closely match the currency, interest rate basis, and maturity of its loans and borrowings. Derivative instruments are used to convert the cash flows from fixed rate US dollar or non-US dollar loans into variable rate US dollars. IFC has elected not to designate any hedging relationships for all lending-related derivatives. Client risk management activities IFC enters into derivatives transactions with its clients to help them hedge their own currency, interest rate, or commodity risk, which, in turn, improves the overall quality of IFC’s loan portfolio. To hedge the market risks that arise from these transactions with clients, IFC enters into offsetting derivative transactions with matching terms with authorized market counterparties. Changes in fair value of all derivatives associated with these activities are reported in net income in net gains and losses on other non-trading financial instruments accounted for at fair value. Fees and spreads charged on these transactions are recorded in other income in the consolidated income statement on an accrual basis.

p49
Page 55 INTERNATIONAL FINANCE CORPORATION
NOTES TO CONSOLIDATED FINANCIAL STATEMENTS
Borrowing activities IFC issues debt securities in various capital markets with the objectives of minimizing its borrowing costs, diversifying funding sources, and developing member countries’ capital markets, sometimes using complex structures. These structures include borrowings payable in multiple currencies, or borrowings with principal and/or interest determined by reference to a specified index such as a stock market index, a reference interest rate, a commodity index, or one or more foreign exchange rates. IFC uses derivative instruments with matching terms, primarily currency and interest rate swaps, to convert such borrowings into variable rate US dollar obligations, consistent with IFC’s matched funding policy. IFC elected to carry at fair value, under the Fair Value Option, all market borrowings for which a derivative instrument is used to create a fair value-like or cash flow-like hedge relationship. Changes in the fair value of such borrowings and the associated derivatives are reported in net gains and losses on other non-trading financial instruments accounted for at fair value in the consolidated income statement. Liquid asset portfolio management activities IFC manages the interest rate, currency and other market risks associated with certain of the time deposits and securities in its liquid asset portfolio by entering into derivative transactions to convert the cash flows from those instruments into variable rate US dollars, consistent with IFC’s matched funding policy. The derivative instruments used include short-term, over-the-counter foreign exchange forwards (covered forwards), interest rate and currency swaps, and exchange-traded interest rate futures and options. As the entire liquid asset portfolio is classified as a trading portfolio, all securities (including derivatives) are carried at fair value with changes in fair value reported in income from liquid asset trading activities. No derivatives in the liquid asset portfolio have been designated as hedging instruments under ASC 815. Asset and liability management In addition to the risk managed in the context of its business activities detailed above, IFC faces residual market risk in its overall asset and liability management. Residual currency risk is managed by monitoring the aggregate position in each lending currency and reducing the net excess asset or liability position through sales or purchases of currency. Interest rate risk arising from mismatches due to write-downs, prepayments and re-schedulings, and residual reset date mismatches is monitored by measuring the sensitivity of the present value of assets and liabilities in each currency to each basis point change in interest rates. IFC monitors the credit risk associated with these activities by careful assessment and monitoring of prospective and actual clients and counterparties. In respect of liquid assets and derivatives transactions, credit risk is managed by establishing exposure limits based on the credit rating and size of the individual counterparty. In addition, IFC has entered into master agreements governing derivative transactions that contain close-out and netting provisions and collateral arrangements. Under these agreements, if IFC’s credit exposure to a counterparty, on a mark-to-market basis, exceeds a specified level, the counterparty must post collateral to cover the excess, generally in the form of liquid government securities or cash. IFC does not offset the fair value amounts of derivatives and obligations to return cash collateral associated with these master netting agreements. As of June 30, 2010, IFC had no outstanding obligations to return cash collateral under master netting agreements. Loan participations – IFC mobilizes funds from commercial banks and other financial institutions (Participants) by facilitating loan participations, without recourse. These loan participations are administered and serviced by IFC on behalf of the Participants. The disbursed and outstanding balances of loan participations that meet the applicable accounting criteria are accounted for as sales and are not included in IFC’s consolidated balance sheet. All other loan participations are accounted for as secured borrowings and are included in loans on IFC’s consolidated balance sheet, with the related secured borrowings included in payables and other liabilities on IFC’s consolidated balance sheet. Pension and other postretirement benefits – IBRD has a defined benefit Staff Retirement Plan (SRP), a Retired Staff Benefits Plan (RSBP) and a Post-Employment Benefits Plan (PEBP) that cover substantially all of its staff members as well as the staff of IFC and of MIGA. The SRP provides regular pension benefits and includes a cash balance plan. The RSBP provides certain health and life insurance benefits to eligible retirees. The PEBP provides pension benefits administered outside the SRP. All costs associated with these plans are allocated between IBRD, IFC, and MIGA based upon their employees’ respective participation in the plans. In addition, IFC and MIGA reimburse IBRD for their share of any contributions made to these plans by IBRD. The net periodic pension and other postretirement benefit income or expense allocated to IFC is included in income or expense from pension and other postretirement benefit plans in the consolidated income statement. IFC includes a receivable from IBRD in receivables and other assets, representing prepaid pension and other postretirement benefit costs. Variable Interest Entities – The Variable Interest Entities Subsections of ASC Topic 810, Consolidation (the ASC 810 VIE Subsections), (formerly FASB Interpretation No. 46, Consolidation of Variable Interest Entities - an interpretation of ARB No. 51, which was amended in December 2003, by FASB Interpretation No. 46, (revised December 2003) Consolidation of Variable Interest Entities - an interpretation of ARB No. 51) defines certain variable interest entities (VIEs) and require parties to such entities to assess and measure variable interests in the VIEs for the purposes of determining possible consolidation of the VIEs. Variable interests can arise from financial instruments, service contracts, guarantees, leases or other arrangements with a VIE. An entity that will absorb a majority of a VIE’s expected losses or expected residual returns is deemed to be the primary beneficiary of the VIE and must include the assets, liabilities, and results of operations of the VIE in its consolidated financial statements. IFC has a number of investments in VIEs that it manages and supervises in a manner consistent with other portfolio investments. Note U provides further details regarding IFC’s variable interests in VIEs.

p50
Page 56 INTERNATIONAL FINANCE CORPORATION
NOTES TO CONSOLIDATED FINANCIAL STATEMENTS
Recently adopted accounting standards – In December 2007, the FASB issued SFAS No. 141 (Revised 2007), Business Combinations (SFAS No. 141(R)). SFAS No. 141(R) replaced SFAS No. 141, Business Combinations, but retained its fundamental requirement that the acquisition method of accounting (formerly referred to as the purchase method) be used for all business combinations and for the acquirer to be identified for each business combination. Among other things, SFAS No. 141(R) requires the acquirer to recognize the assets acquired, liabilities assumed and any non-controlling interest in the acquiree at the acquisition date measured at their fair values, with limited exceptions. SFAS No. 141(R) requires acquisition related costs to be recognized separately from the acquisition. Acquirers in a step acquisition must recognize the identifiable assets and liabilities, as well as the full amount of the non-controlling interests in the acquiree, at the full amounts of their fair value under SFAS No. 141(R). SFAS No. 141(R) is effective prospectively to business combinations/acquisitions on or after the beginning of the first annual reporting period beginning on or after December 15, 2008 (which is the year ended June 30, 2010 for IFC) and did not have a material impact on IFC’s financial position, results of operations or cash flows. Effective July 1, 2009, SFAS No. 141(R) is ASC Topic 805, Business Combinations. In December 2007, the FASB issued SFAS No. 160, Noncontrolling Interests in Consolidated Financial Statements - an amendment of ARB No. 151 (SFAS No. 160). SFAS No. 160 clarifies that non-controlling interests in a consolidated entity should be reported as equity in the consolidated financial statements. It requires consolidated net income to be reported at amounts attributable to both the parent and the non-controlling interest and disclosure on the consolidated statement of income of the amounts of income attributable to the parent and to the non-controlling interest. SFAS No. 160 clarifies that all changes in a parent’s ownership interest that do not result in loss of control are equity transactions and requires that a parent recognize gain or loss when a subsidiary is deconsolidated. SFAS No. 160 is effective for fiscal years, and interim periods within those fiscal years, beginning on or after December 15, 2008 (which is the year ended June 30, 2010 for IFC) and did not have a material impact on IFC’s financial position, results of operations or cash flows. Effective July 1, 2009, the provisions of SFAS No. 160 are included in ASC 810. In March 2008, the FASB issued SFAS No. 161, Disclosures about Derivative Instruments and Hedging Activities (SFAS No. 161). SFAS No. 161, requires enhanced disclosures about derivatives and hedging activities to enable a better understanding of their effects on the reporting entity’s financial position, financial performance, and cash flows. It is effective for the first set of financial statements for a reporting period, annual or interim, that begins after November 15, 2008, which was the three months ended March 31, 2009 for IFC. Effective July 1, 2009, the provisions of SFAS No. 161 are included in ASC 815. In May 2008, the FASB issued SFAS No. 162, The Hierarchy of Generally Accepted Accounting Principles (SFAS No. 162). SFAS No. 162 identifies the sources of accounting principles and the framework for selecting the principles to be used in the preparation of financial statements of nongovernmental entities that are presented in accordance with US GAAP. SFAS No. 162 was effective November 15, 2008. Adoption of SFAS No. 162 did not have a material impact on IFC’s financial position, results of operations or cash flows. On October 10, 2008, the FASB issued FASB Staff Position (FSP) No. FAS 157-3, Determining the Fair Value of a Financial Asset When a Market for That Asset Is Not Active (FSP FAS 157-3). FSP FAS 157-3 was effective upon its release and clarifies the application of SFAS No. 157 in a market that is not active and provides an example to illustrate key considerations in determining the fair value of a financial asset when the market for that asset is not active. FSP FAS 157-3 did not have a material impact on IFC’s financial position, results of operations or cash flows. Effective July 1, 2009, the provisions of FSP FAS 157-3 are included in ASC 820. On September 12, 2008, the FASB issued FSP FAS 133-1 and FIN 45-4, Disclosures about Credit Derivatives and Certain Guarantees: An Amendment of FASB Statement No. 133 and FASB Interpretation No. 45; and Clarification of the Effective date of FASB Statement No. 161 (FSP FAS 133-1 and FIN 45-4). FSP FAS 133-1 and FIN 45-4 amends SFAS No. 133 to require a seller of credit derivatives, including credit derivatives embedded in hybrid instruments, to provide disclosures for each credit derivative (or group of similar credit derivatives) for each statement of financial position presented and clarifies the effective date for SFAS No. 161 (see third preceding paragraph above for effective date of SFAS No. 161). FSP FAS 133-1 and FIN 45-4 was effective for annual or interim reporting periods ending after November 15, 2008 (which was the three months ended December 31, 2008 for IFC). Effective July 1, 2009, the provisions of FSP FAS 133-1 and FIN 45-4 are included in ASC 815. In December 2008, FASB issued FSP FAS 132(R)-1, Employers’ Disclosures about Postretirement Benefit Plan Assets, now included in ASC 715-20, which requires additional disclosures about employer’s plan assets of a defined benefit pension or other postretirement plan. This FSP is first applicable to IFC’s consolidated financial statements for the year ended June 30, 2010 and has resulted in additional disclosures being made in Note V to IFC’s consolidated financial statements. On December 11, 2008, the FASB issued FSP FAS 140-4 and FIN 46(R)-8, Disclosures by Public Entities (Enterprises) about Transfers of Financial Assets and Interests in Variable Interest Entities (FSP FAS 140-4 and FIN 46(R)-8). FSP 140-4 and FIN 46(R)-8 requires additional disclosures about transfers of financial assets and an enterprise’s involvement with VIEs, including Qualifying Special Purpose Entities (QSPEs). Transferors of financial assets must disclose (1) the terms of any arrangements that could require them to provide financial or other support to a transferee (including VIEs and non-transferor QSPEs for which the transferor is the primary beneficiary, sponsor or servicer or in which the transferor has a significant variable interest) and (2) the type and amount of financial or other support provided during the period to those transferees that was not contractually required and the reasons for providing it. FSP FAS 140-4 and FIN 46(R)-8 also requires disclosure of (1) the details of any Special Purpose Entities (SPEs) involved in a transfer, including the nature, purpose, size, and activities of the SPE, and how it was financed, (2) with respect to VIEs (a) the method of determining whether an enterprise is the primary beneficiary of a VIE, including significant judgments and assumptions made, and (b) whether the consolidation conclusion has changed in the most recent financial statements, (3) with respect to QSPEs for which the enterprise is the sponsor or the servicer (a) details about the QSPE including the nature, purpose, size, and activities of the QSPE, and how it is financed, and (b) the enterprise’s maximum exposure to loss as a result of its involvement with the QSPE, and (4) how servicing assets and liabilities are reported under FAS 140. FSP FAS 140-4 and FIN 46(R)-8 were effective for the first interim or fiscal reporting period ending after December 15, 2008 (which was the three months ended December 31, 2008 for IFC). Effective July 1, 2009, the provisions of FSP FAS 140-4 and FIN 46(R) are included in ASC Topic 860, Transfers and Servicing.

p51
Page 57 INTERNATIONAL FINANCE CORPORATION
NOTES TO CONSOLIDATED FINANCIAL STATEMENTS
On January 12, 2009, the FASB issued FSP EITF 99-20-1, Amendments to Impairment Guidance of EITF Issue No. 99-20 (FSP EITF 99-20-1). FSP EITF 99-20-1 amends the impairment model in EITF 99-20 for certain investments in securitized financial assets to remove its exclusive reliance on “market participant” estimates of future cash flows used in determining fair value, thus allowing the reporting entity to apply reasonable judgment in assessing whether an other-than-temporary impairment has occurred with respect to those investments. FSP EITF 99-20-1 was effective for interim and annual reporting periods ending after December 15, 2008 (which was the three months ended December 31, 2008 for IFC) and did not have a material impact on IFC’s financial position, results of operations or cash flows. Effective July 1, 2009, FSP EITF 99-20-1 is included in ASC 325, Investments-Other: Subtopic 40, Beneficial Interests in Securitized Financial Assets. In June 2009, the FASB Issued SFAS No. 165, Subsequent Events (SFAS No. 165). SFAS No. 165 establishes general standards of accounting for and disclosure of events that occur after the balance sheet date but before financial statements are issued. It sets forth the period after the balance sheet date during which events or transactions must be evaluated for recognition or disclosure, the circumstances under which events or transactions occurring after balance date should be recognized in the financial statements, and the related disclosures that should be made. SFAS No. 165 was effective for interim and annual financial statements ending after June 15, 2009 (which was the year ended June 30, 2009 for IFC). The adoption of SFAS No. 165 had no material impact on IFC’s financial position, results of operations or cash flows. Effective July 1, 2009, SFAS No. 165 is ASC Topic 855, Subsequent Events. On April 9, 2009, the FASB issued FSP FAS 157-4, Determining Fair Value When the Level of Activity for an Asset or Liability Have Significantly Decreased and Identifying Transactions That Are Not Orderly (FSP FAS 157-4). FSP FAS 157-4 provides additional guidance for estimating fair value in inactive markets and for distressed transactions. Under FSP FAS157-4, reporting entities are required to determine whether there has been a significant decrease in market activity for an asset or liability, in which case further analysis of transactions and quoted prices is needed to determine if significant adjustment is necessary to arrive at an estimate of fair value in accordance with SFAS No. 157. Reporting entities are also required to evaluate whether a transaction was orderly based on the weight of the evidence. If the transaction was orderly or the reporting entity does not have sufficient information to conclude whether the transaction was orderly, the reporting entity must consider that transaction price when estimating fair value - the amount of weight placed on that transaction price will depend on the facts and circumstance with less weight being placed on transactions where there is not sufficient information to conclude whether the transaction was orderly. If the transaction was not orderly, the reporting entity must place little, if any weight, on that transaction price. Regardless of the valuation techniques used, companies must include appropriate risk adjustments that reflect an orderly transaction between market participants under current market conditions. FSP FAS 157-4 also requires additional disclosures of the inputs and valuation techniques used to measure fair value and a discussion of any changes in those techniques. FSP FAS 157-4 was effective for the first interim or annual reporting period ending after June 15, 2009 (which was the three months ended June 30, 2009 for IFC) and must be prospectively applied. The adoption of FSP FAS 157-4 had no material impact on IFC’s financial position, results of operations or cash flows. Effective July 1, 2009, the provisions of FSP FAS 157-4 are included in ASC 820. On April 9, 2009, the FASB issued FSP FAS 115-2 and FAS 124-2, Recognition and Presentation of Other-Than-Temporary Impairments, (FSP FAS 115-2 and 124-2). FSP 115-2 and 124-2 modifies the indicator of other-than-temporary impairment (OTTI) for debt securities and incorporates factors currently included in other authoritative literature into the model for determining whether a debt security is other-than-temporarily impaired. Among other things, FSP FAS115-2 and 124-2 changes the amount of OTTI recognized in net income when there is a credit loss component to an impairment of a debt security which the reporting entity does not intend to sell and is not more likely than not to be required to sell prior to recovery of its amortized cost basis. In those situations the OTTI representing credit losses must be recognized in net income - the noncredit-related portion must be recognized in other comprehensive income. In addition, FSP FAS 115-2 and 124-2 requires disclosures regarding the types of debt and equity securities held, unrealized loss positions for which OTTI has not been recognized, the reasons that a portion of an OTTI was not recognized in net income and the methodology and significant inputs used to determine the portion of OTTI recognized in net income. FSP FAS 115-2 and 124-2 was effective for interim and annual reporting periods ending after June 15, 2009 (which was the three months ended June 30, 2009 for IFC) and must be applied to existing and new investments held as of the beginning of the interim period of adoption. IFC adopted FSP FAS 115-2 and 124-2 effective April 1, 2009. The adoption of FSP FAS 115-2 and 124-2 resulted in the reclassification of non-credit-related OTTI on debt securities to other comprehensive income of $34 million in the year ended June 30, 2009. Effective July 1, 2009, the provisions of FSP FAS 115-2 and 124-2 are included in ASC 320, Section 35, Subsequent Measurement. On April 9, 2009, the FASB issued FSP 107-1 and APB 28-1, Interim Disclosures About Fair Value of Financial Instruments (FSP FAS 107-1 and APB 28-1). FSP FAS 107-1 and APB 28-1 requires disclosure about the fair value of financial instruments for interim reporting periods that were previously required only for annual reporting periods. FSP FAS 107-1 and APB 28-1 are effective for interim periods ending after June 15, 2009 (which was the three months ended September 30, 2009 for IFC). Effective July 1, 2009, the provisions of FSP FAS 107-1 and APB 28-1 are included in ASC 825. In June 2009, the FASB issued Accounting Standards Update (ASU) No. 2009-01, [ASC] Topic 105, Generally Accepted Accounting Standards amendments based on SFAS No. 168, The FASB Accounting Standards Codification™ and the Hierarchy of Generally Accepted Accounting Principles (ASC 105). ASC 105 establishes the FASB Accounting Standards Codification™ (Codification) as the source of authoritative U.S. generally accepted accounting principles (GAAP) recognized by the FASB to be applied by nongovernmental entities. On July 1, 2009, the Codification superseded all then-existing non-SEC accounting and reporting standards. Following ASC 105, the FASB will not issue new standards in the form of SFASs, FINs, FSPs or EITF abstracts. Instead, it will issue Accounting Standards Updates, which will serve only to update the Codification. ASC 105 is effective for financial statements issued for interim and annual periods ending after September 15, 2009 (which was the three months ended September 30, 2009 for IFC). The Codification’s content carries the same level of authority effectively superseding SFAS No. 162. ASC 105 did not have a material impact on IFC’s financial position, results of operations or cash flows.

p52
Page 58 INTERNATIONAL FINANCE CORPORATION
NOTES TO CONSOLIDATED FINANCIAL STATEMENTS
In August 2009, the FASB issued ASU No. 2009-05, Measuring Liabilities at Fair value (ASU 2009-05). ASU 2009-05 reaffirms that the fair value of a liability assumes the transfer of a liability to a market participant as of the measurement date; that is the liability is presumed to continue and is not settled with the counterparty. ASU 2009-05 emphasizes that a fair value measurement of a liability includes non-performance risk and that such risk does not change after transfer of the liability. ASU 2009-05 precludes the separate adjustment of the fair value measurement for the impact of a restriction on the transfer of a liability. ASU 2009-05 is effective for the first interim or annual reporting period beginning after its issuance (which was the three months ended December 31, 2009 for IFC) and did not have a material impact on IFC’s financial position, results of operations or cash flows.
In September 2009, the FASB issued ASU No. 2009-12, Investments in Certain Entities That Calculate Net Asset Value per Share (or Its Equivalent) (ASU 2009-12). ASU 2009-12 provides guidance on measuring the fair value of certain alternative investments and offers a practical expedient (net asset value) for measuring the fair value of investments in certain entities that calculate net asset value per share. ASU 2009-12 is effective for interim and annual periods ending after December 15, 2009 (which was the three months ended December 31, 2009 for IFC) and did not have a material impact on IFC’s financial position, results of operations or cash flows. In January 2010, the FASB issued ASU No. 2010-06, Fair Value Measurements and Disclosures (Topic 820): Improving Disclosures about Fair Value Measurements (ASU 2010-06). ASU 2010-06 amends ASC 820 to add new disclosures requirements for transfers in and out of Level 1 and 2 measurements and separate disclosures about gross purchases, sales, issuances, and settlements relating to Level 3 measurements. It also clarifies existing fair value disclosure requirements about the level of disaggregation and about inputs and valuation techniques used to measure fair value. ASU 2010-06 is effective for the first interim or annual period beginning after December 31, 2009 (which is the three months ended March 31, 2010 for IFC) except for the requirement to provide the Level 3 activity of gross purchases, sales, issuances and settlements, which will be effective for fiscal years beginning after December 15, 2010 and for interim periods within those fiscal years (which will be the year ending June 30, 2012 and three months ending September 30, 2011 for IFC). IFC adopted the requirements of ASC 2010-06 for the three months ended March 31, 2010 (except for the requirements which will be effective for periods beginning after June 30, 2010) without a material impact on IFC’s financial position, results of operations or cash flows. In January 2010, the FASB issued ASU No. 2010-02, Consolidation (Topic 810): Accounting and Reporting for Decreases in Ownership of a Subsidiary - a Scope Clarification (ASU 2010-02) and ASU No. 2010-03, Extractive Industries - Oil and Gas (Topic 932): Oil and Gas Reserve Estimation and Disclosures (ASU 2010-03) . ASU 2010-02 affects entities that experience a decrease in ownership in a subsidiary or that exchange a group of assets that constitutes a business for an equity interest in another entity and clarifies that the scope of the decrease in ownership provisions of Subtopic 810-10. ASU 2010-02 is affective beginning in the period that an entity adopts SFAS No. 160 (which is the year ended June 30, 2010 for IFC). ASU 2010-02 did not have a material impact on IFC’s financial position, results of operations or cash flows. ASU 2010-03 affects entities that engage in oil- and gas-producing activities and, among other things, expands the definition of oil- and gas- producing activities to include the extraction of saleable hydrocarbons and other non-renewable natural resources that are intended to be upgraded into synthetic oil and gas, amends the definition of proved oil and gas reserves to indicate what prices must be used when estimating whether reserves are economical to produce and clarifies that an entity’s equity method investments must be considered in determining whether it has significant oil- and gas- producing activities. ASU is effective for annual reporting periods ending on or after December 31, 2009 (which is the year ended June 30, 2010 for IFC). ASU 2010-03 did not have a material impact on IFC’s financial position, results of operations or cash flows. Accounting and financial reporting developments – In June 2009, the FASB issued SFAS No. 166, Accounting for Transfers of Financial Assets - an amendment of FASB Statement No. 140 (SFAS No. 166). SFAS No. 166 removes the concept of a qualifying special-purpose entity (QSPE) from Statement 140 and removes the exception from applying FIN 46 to QSPEs. It clarifies Statement 140’s objective of determining whether a transferor has surrendered control over transferred financial assets, and limits the circumstances in which a financial asset, or portion of a financial asset, should be derecognized when the entire financial asset has not been transferred and/or when the transferor has continuing involvement with the transferred financial asset. SFAS No. 166 defines the term participating interest to establish specific conditions for reporting a transfer of a portion of a financial asset as a sale. If the transfer does not meet those conditions, a transferor must account for the transfer as a sale only if it transfers an entire financial asset and surrenders control over the entire transferred assets in accordance with the conditions in Statement 140, as amended. SFAS No. 166 requires that a transferor recognize and initially measure at fair value all assets obtained and liabilities incurred as a result of a transfer of a financial asset. SFAS No. 166 also requires enhanced financial statement disclosures about transfers of financial assets and a transferor’s continuing involvement in transferred financial assets. SFAS No. 166 is effective as of the beginning of the reporting entity’s first annual reporting period that begins after November 15, 2009 (which is the year ending June 30, 2011 for IFC) and for interim periods within that first annual reporting period. IFC is evaluating the provisions of SFAS No. 166. Once effective, SFAS No. 166 will be ASC Topic 860, Transfers and Servicing. In June 2009, the FASB issued SFAS No. 167, Amendments to FASB Interpretation No. 46(R) (SFAS No. 167). SFAS No. 167 amends FIN 46(R) to require the analysis of whether the reporting entity’s variable interests give it a controlling financial interest in a VIE. If so, the reporting entity is considered to be the primary beneficiary and must consolidate the VIE. SFAS No. 167 defines a controlling interest as an interest having both the power to direct the activities that most significantly impact the VIE’s economic performance and the obligation to absorb losses of or the right to receive benefits from the VIE that could potentially be significant to the VIE. SFAS No. 167 requires on-going assessments of whether the reporting entity is the primary beneficiary of a VIE and eliminates the quantitative approach previously required for determining the primary beneficiary of a VIE. SFAS No. 167 also amends FIN 46(R) to require a troubled debt restructuring to be considered an event that requires reconsideration of whether an entity is a VIE and whether a reporting entity is the primary beneficiary of a VIE. SFAS No. 167 requires enhanced disclosures aimed at providing more transparent information about an enterprise’s involvement in VIE’s and nullifies FASB FSP 140-4 and FIN 46(R)-8. However, the content of the enhanced disclosures is generally consistent with that previously required by FSP FAS 140-4 and FIN 46(R)-8. SFAS No. 167 is effective as of the beginning of the reporting entity’s first annual reporting period that begins after November 15, 2009 (which is the year ending June 30, 2011 for IFC) and for interim periods within that first annual reporting period. IFC is evaluating the provisions of SFAS No. 167. Once effective, the provisions of SFAS No. 167 will be included in the VIE Subsections of ASC 810.

p53
Page 59 INTERNATIONAL FINANCE CORPORATION
NOTES TO CONSOLIDATED FINANCIAL STATEMENTS
In October 2009, the FASB issued ASU No. 2009-13, Revenue Recognition (Topic 605): Multiple-Deliverable Revenue Arrangements - a consensus of the FASB Emerging Issues Task Force (ASU 2009-13). ASU 2009-13 addresses the unit of accounting for arrangements involving multiple deliverables and how arrangement consideration should be allocated to the separate units of accounting, when applicable, and applies to all deliverables in contractual arrangements in all industries in which a vendor will perform multiple revenue generation activities. ASU 2009-13 is effective for fiscal years beginning on or after June 15, 2010 (which is the year ending June 30, 2011 for IFC). ASU 2009-13 is not expected to have a material impact on IFC’s financial position, results of operations or cash flows. In December 2009, the FASB issued ASU No. 2009-17, Transfers and Servicing (Topic 860): Accounting for Transfers of Financial Assets (ASU 2009-16) and ASU No. 2009-17, Consolidations (Topic 810): Improvements to Financial Reporting by Enterprises Involved with Variable Interest Entities (ASU 2009-17). ASU 2009-16 and ASU 2009-17 formally update the ASC for the provisions of SFAS No. 166 and SFAS No. 167, respectively. In February 2010, the FASB issued ASU No. 2010-09, Subsequent Events (Topic 855): Amendments to Certain Recognition and Disclosure Requirements (ASU 2010-09) and ASU No. 2010-10, Consolidation (Topic 810): Amendments for Certain Investment Funds (ASU 2010-10), and in March 2010 issued ASU 2010-11, Derivatives and Hedging (Topic 815): Scope Exception Related to Embedded Credit Derivatives (ASU 2010-11). ASU 2010-09 adds the term “SEC filer” to the ASC Master Glossary; requires (1) SEC filers and (2) certain other entities to evaluate subsequent events through the date the financial statements are issued; requires all other entities to evaluate subsequent events through the date the financial statements are available to be issued; and exempts SEC filers from disclosing the date through which subsequent events have been evaluated. ASU 2010-09 was effective upon issuance and had no material impact on IFC’s financial position, results of operations or cash flows. ASU 2010-10 defers application of SFAS No. 167 for a reporting enterprise’s interest in certain entities if (1) the entity either has all the attributes of an investment company as specified in the ASC or is an entity for which it is industry practice to account for its assets at fair value through earnings, (2) the reporting enterprise does not have an explicit or implicit obligation to fund losses of the entity that could be potentially significant to that entity, and (3) the entity is not a securitization entity, an asset-backed financing entity, or an entity that was formerly considered a qualifying special purpose entity, as well as interests in entities that are required to comply with or operate in accordance with requirements that are similar to those included in Rule 2a-7 of the Investment Company Act of 1940. ASU 2010-10 is effective beginning as of the first annual reporting period that begins after November 15, 2009 (which is the year ending June 30, 2011 for IFC). IFC is evaluating the provisions of ASU 2010-10. ASU 2010-11 addresses application of the scope exception for certain embedded credit derivatives contained in ASC 815-15-15-8 and 15-9 (formerly paragraph 14B of FAS No. 133) and is effective on the first day of the first fiscal quarter beginning after June 15, 2010 (which is the three months ending September 30, 2010 for IFC). ASU 2010-11 is not expected to have a material impact on IFC’s financial position, results of operations or cash flows. In April 2010, the FASB issued ASU No. 2010-18, Receivables (Topic 310): Effect of a Loan Modification When the Loan is Part of a Pool That is Accounted for as a Single Asset (ASU 2010-18), and in May, 2010, the FASB issued ASU No. 2010-19, Foreign Currency (Topic 830): Foreign Currency Issues: Multiple Currency exchange rates - An announcement made by the staff of the U.S. Securities and Exchange Commission (ASU 2010-19). ASU 2010-18 clarifies that modifications of loans that are accounted for within a pool under ASC Subtopic 310-30, Receivables – Loans and Debt Securities Acquired with Deteriorated Credit Quality (Subtopic 310-30), do not result in the removal of those loans from the pool even if the modification of those loans would otherwise be considered a troubled debt restructuring; that is the reporting entity must continue to consider whether the pool itself is impaired if the expected cash flows of the pool change. ASU 2010 is effective for modifications of loans accounted for within pools under Subtopic 310-30 occurring in the first interim or annual period ending on or after July 15, 2010 (which is the three months ending September 30, 2010 for IFC) and is not expected to have a material impact on IFC’s financial position, results of operations or cash flows. In March 2010, the Patient Protection and Affordable Care Act (the PPACA) and the Health Care Education Reconciliation Act of 2010 (HCERA), became law (collectively, the “Act”). The Act seeks to reform the U.S. health care system and its various provisions will become effective over the next eight years. IFC is currently evaluating the impact of the Act. In addition, during the year ended June 30, 2010, the FASB issued and/or approved various other ASUs. IFC analyzed and implemented the new guidance, as appropriate, with no material impact on either the financial position, results of operations or cash flows of IFC.

p54
Page 60 INTERNATIONAL FINANCE CORPORATION
NOTES TO CONSOLIDATED FINANCIAL STATEMENTS
NOTE B – SCOPE OF CONSOLIDATION IFC Asset Management Company, LLC (AMC) IFC has established a wholly owned subsidiary, AMC, to mobilize capital from outside IFC’s traditional investor pool and to manage third party capital. AMC is consolidated into IFC’s financial statements. At June 30, 2010, IFC has provided $2 million of capital to AMC. At June 30, 2010, AMC manages three Funds - IFC Capitalization (Equity) Fund, L.P. (the Equity Capitalization Fund); IFC Capitalization (Subordinated Debt) Fund, L.P. (the Sub-Debt Capitalization Fund); and IFC African, Latin American and Caribbean Fund, L.P. (the ALAC Fund) (collectively, the AMC Funds). The Equity Capitalization Fund The purpose of the Equity Capitalization Fund is to make investments in eligible banks. IFC, as a limited partner, intends to invest $775 million in the Equity Capitalization Fund, subject to IFC Board of Directors approval of IFC’s pro rata share of investments to be made by the Equity Capitalization Fund. IFC is a limited partner of the Equity Capitalization Fund and accounts for this interest under the Fair Value Option. Until June 30, 2010, IFC Capitalization (Equity) Fund (GP), LLC, a wholly-owned subsidiary of IFC, was the general partner of the Equity Capitalization Fund. On June 30, 2010, IFC’s general partnership interest in IFC Capitalization (Equity) Fund (GP), LLC was transferred to AMC. At June 30, 2010, IFC has provided $128 million of capital to the Equity Capitalization Fund ($13 million - June 30, 2009). The Sub-Debt Capitalization Fund The purpose of the Sub-Debt Capitalization Fund is to make investments in eligible banks. IFC, as a limited partner, intends to invest $225 million in the Sub-Debt Capitalization Fund, subject to IFC Board of Directors approval of IFC’s pro rata share of investments to be made by the Sub-Debt Capitalization Fund. IFC is a limited partner of the Sub-Debt Capitalization Fund and accounts for this interest under the Fair Value Option. Until June 30, 2010, IFC Capitalization (Subordinated Debt) Fund (GP), LLC, a wholly-owned subsidiary of IFC, was the general partner of the Sub-Debt Capitalization Fund. On June 30, 2010, IFC’s general partnership interest in IFC Capitalization (Subordinated Debt) Fund (GP) LLC was transferred to AMC. At June 30, 2010, IFC has provided less than $0.5 million of capital to the Sub-Debt Capitalization Fund. The ALAC Fund The purpose of the ALAC Fund is to make investments in companies located in Sub-Saharan Africa, Latin America and the Caribbean. IFC intends to invest $180 million in the ALAC Fund, subject to IFC Board of Directors approval of IFC’s pro rata share of investments to be made by the ALAC Fund. IFC Founder Partner LLC, a wholly owned subsidiary of IFC, is a limited partner of the ALAC Fund and accounts for this interest under the Fair Value Option. IFC African, Latin American and Caribbean Fund (GP) LLC (ALAC Fund GP), a wholly-owned subsidiary of AMC, is the general partner of the ALAC Fund. ALAC Fund GP is ultimately consolidated into IFC’s consolidated financial statements. At June 30, 2010, IFC has provided $3 million of capital to the ALAC Fund ($0 - June 30, 2009). Impact of Consolidation As a result of the consolidation of AMC, IFC Capitalization (Subordinated Debt) Fund (GP), LLC, IFC Capitalization (Equity) Fund (GP), LLC, and IFC African, Latin American and Caribbean Fund (GP), LLC, IFC’s consolidated balance sheet at June 30, 2010 includes $6 million in receivables and other assets (less than $0.5 million - June 30, 2009), less than $0.5 million in equity investments ($0 - June 30, 2009) and less than $0.5 million in payables and other liabilities ($0 - June 30, 2009). Other income in IFC’s consolidated income statement includes $7 million during the year ended June 30, 2010 (less than $0.5 million - year ended June 30, 2009 and $0 - year ended June 30, 2008) and other expenses includes $2 million during the year ended June 30, 2010 ( $0 - years ended June 30, 2009 and 2008).

p55
Page 61 INTERNATIONAL FINANCE CORPORATION
NOTES TO CONSOLIDATED FINANCIAL STATEMENTS
NOTE C – LIQUID ASSET PORTFOLIO The composition of IFC’s liquid asset portfolio included in the consolidated balance sheet captions is as follows (US$ millions): June 30, 2010 June 30, 2009 Assets Cash and due from banks $ 74 $ 11 Time deposits 5,060 3,429 Trading securities 23,428 20,243 Securities purchased under resale agreements 539 544 Receivables and other assets: Receivables from unsettled security trades 1,075 604 Accrued interest income on time deposits and securities 130 108 Accrued income on derivative instruments 9 9 Derivative assets 153 105 Total assets 30,468 25,053 Liabilities Payables and other liabilities: Payables for unsettled security trades 857 619 Accrued charges on derivative instruments 36 25 Securities sold under repurchase agreements and payable for cash collateral received 8,393 6,388 Derivative liabilities 181 157 Total liabilities 9,467 7,189 Total net liquid asset portfolio $ 21,001 $ 17,864 The liquid asset portfolio is denominated primarily in US dollars; investments in other currencies, net of the effect of associated derivative instruments that convert non-US dollar securities into US dollar securities, represent 2.2% of the portfolio at June 30, 2010 (2.6% - June 30, 2009). Trading securities Trading securities comprises: Year ended June 30, 2010 At June 30, 2010 Fair value Weighted average average daily balance Fair value contractual (US$ millions) (US$ millions) maturity (years) Government, agency and government-sponsored agency obligations $ 7,910 $ 8,207 2.4 Asset-backed securities 6,172 5,757 19.2 Corporate securities 8,097 9,008 2.6 Money market funds 1,077 456 1.0 Total trading securities $ 23,256 $ 23,428 Year ended June 30, 2009 At June 30, 2009 Fair value Weighted average average daily balance Fair value contractual (US$ millions) (US$ millions) maturity (years) Government, agency and government-sponsored agency obligations $ 6,231 $ 8,160 2.5 Asset-backed securities 4,886 4,964 19.6 Corporate securities 2,603 6,427 2.5 Money market funds 1,090 692 1.0 Total trading securities $ 14,810 $ 20,243 The expected maturity of the asset-backed securities may be significantly shorter than the contractual maturity, as reported above, due to prepayment features. Trading securities at June 30, 2010 includes securities with a fair value of $1,009 million, which are rated less than triple-A by one or more Rating Agency ($872 million - June 30, 2009).

p56
Page 62 INTERNATIONAL FINANCE CORPORATION
NOTES TO CONSOLIDATED FINANCIAL STATEMENTS
Income from liquid asset trading portfolio
Income from the liquid asset trading portfolio for the years ended June 30, 2010, June 30, 2009 and June 30, 2008 comprises (US$ millions): 2010 2009 2008 Interest income $ 358 $ 510 $ 662 Net gains (losses) on trading activities: Realized gains 127 334 80 Unrealized gains (losses) 328 (368) (276) Net gains (losses) on trading activities 455 (34) (196) Foreign currency transaction gains (losses) 2 (2) 7 Total income from liquid asset trading portfolio $ 815 $ 474 $ 473 Net gains (losses) on trading activities comprises net gains on asset-backed and mortgage-backed securities of $419 million in the year ended June 30, 2010 ($368 million losses - year ended June 30, 2009; $474 million losses - year ended June 30, 2008) and net gains on other trading securities of $36 million in the year ended June 30, 2010 ($334 million gains - year ended June 30, 2009; $278 million gains - year ended June 30, 2008). The annualized rate of return on the trading liquid asset portfolio, calculated as total income from liquid asset trading portfolio divided by fair value average daily balance, during the year ended June 30, 2010, was 3.5% (3.2% - year ended June 30, 2009; 3.5% - year ended June 30, 2008). After the effect of associated derivative instruments, the liquid asset portfolio generally reprices within one year. Collateral The estimated fair value of securities held by IFC at June 30, 2010 as collateral, in connection with derivatives transactions and purchase and resale agreements, that may be sold or repledged was $1,476 million ($1,139 million - June 30, 2009). Collateral given by IFC to a counterparty in connection with repurchase agreements that may be sold or repledged by the counterparty approximates the amounts classified as Securities sold under repurchase agreements and payable for cash collateral received. NOTE D – INVESTMENTS The carrying value of investments at June 30, 2010 and June 30, 2009 comprises (US$ millions): June 30, 2010 June 30, 2009 Loans Loans at amortized cost $ 17,559 $ 16,180 Less: Reserve against losses on loans (1,349) (1,238) Net loans 16,210 14,942 Loans accounted for at fair value under the Fair Value Option (outstanding principal balance $488 - June 30, 2010, $466 - June 30, 2009) 450 386 Total Loans 16,660 15,328 Equity investments Equity investments at cost less impairment 2,551 2,101 Equity investments accounted for at fair value as available-for-sale* (cost $1,450 - June 30, 2010, $963 - June 30, 2009) 3,012 1,927 Equity investments accounted for at fair value under the Fair Value Option (cost $1,391 - June 30, 2010, $1,041 - June 30, 2009) 1,906 1,316 Total equity investments 7,469 5,344 Debt securities Debt securities accounted for at fair value as available-for-sale (amortized cost $1,490 - June 30, 2010, $1,500 - June 30, 2009) 1,609 1,542 Debt securities accounted for at fair value under the Fair Value Option (amortized cost $183 - June 30, 2010, $0 - June 30, 2009) 206 - Total debt securities 1,815 1,542 Total carrying value of investments $ 25,944 $ 22,214 * Unrealized gains on equity investments accounted for at fair value as available-for-sale at June 30, 2010 excludes $20 million ($12 million at June 30, 2009) in respect of equity investments that were previously listed in markets that provided readily determinable fair values that currently do not provide readily determinable fair values.

Page 63 INTERNATIONAL FINANCE CORPORATION
NOTES TO CONSOLIDATED FINANCIAL STATEMENTS
The distribution of the investment portfolio by sector and by geographical region and a reconciliation of total disbursed portfolio to carrying value of investments is as follows (US$ millions): June 30, 2010 June 30, 2009 Sector Equity Debt Equity Debt Loans investments securities Total Loans investments securities Total Finance and insurance $ 5,392 $ 2,452 $ 1,320 $ 9,164 $ 5,525 $ 1,871 $ 1,252 $ 8,648 Electric power 2,205 166 73 2,444 1,689 199 69 1,957 Oil, gas and mining 1,625 323 25 1,973 1,350 282 15 1,647 Transportation and warehousing 1,381 111 5 1,497 1,192 37 5 1,234 Collective investment vehicles 65 1,013 1 1,079 17 639 - 656 Information 841 106 62 1,009 722 71 57 850 Food and beverages 964 5 35 1,004 957 43 - 1,000 Nonmetallic mineral product manufacturing 881 79 2 962 885 94 3 982 Chemicals 759 126 15 900 761 152 13 926 Industrial and consumer products 660 160 55 875 527 93 22 642 Agriculture and forestry 670 161 11 842 642 140 11 793 Utilities 315 269 22 606 106 151 - 257 Wholesale and retail trade 511 62 5 578 485 60 5 550 Health care 235 212 79 526 207 112 65 384 Primary metals 480 40 - 520 520 3 - 523 Pulp and paper 412 85 - 497 437 49 - 486 Accommodation and tourism services 406 5 21 432 336 28 16 380 Construction and real estate 180 23 15 218 196 49 - 245 Textiles, apparel and leather 143 3 5 151 138 3 6 147 Education services 47 7 - 54 30 - - 30 Other 25 23 21 69 26 27 6 59 Total disbursed portfolio $ 18,197 $ 5,431 $ 1,772 $ 25,400 $ 16,748 $ 4,103 $ 1,545 $ 22,396 June 30, 2010 June 30, 2009 Geographical Region Equity Debt Equity Debt Loans investments securities Total Loans investments securities Total Latin America and Caribbean $ 4,839 $ 1,270 $ 866 $ 6,975 $ 4,598 $ 995 $ 736 $ 6,329 Europe and Central Asia 5,030 1,322 221 6,573 4,728 1,064 247 6,039 Asia 4,401 1,320 398 6,119 4,278 1,113 322 5,713 Middle East and North Africa 1,656 745 45 2,446 1,504 565 38 2,107 Sub-Saharan Africa 1,744 564 131 2,439 1,361 297 131 1,789 Other 527 210 111 848 279 69 71 419 Total disbursed portfolio $ 18,197 $ 5,431 $ 1,772 $ 25,400 $ 16,748 $ 4,103 $ 1,545 $ 22,396 June 30, 2010 June 30, 2009 Equity Debt Equity Debt Loans investments securities Total Loans investments securities Total Total disbursed portfolio $ 18,197 $ 5,431 $ 1,772 $ 25,400 $ 16,748 $ 4,103 $ 1,545 $ 22,396 Reserves against losses on loans (1,349) (1,349) (1,238) (1,238) Unrealized losses on loans accounted for at fair value under the Fair Value Option (38) (38) (80) (80) Unamortized deferred loan origination
fees, net and other (108) (108) (102) (102) Disbursed amount allocated to a related financial instrument reported separately in other assets or derivative assets (42) (53) (7) (102) (8) (6) (14) Unrealized gains on equity investments held by consolidated VIEs 14 14 10 10 Unrealized gains on equity investments accounted for at fair value as available-for-sale 1,562 1,562 964 964 Unrealized gains on equity investments accounted for at fair value under the Fair Value Option 515 515 275 275 Unrealized gains on debt securities accounted for at fair value as available-for-sale 27 27 3 3 Unrealized gains on debt securities accounted for at fair value under the Fair Value Option 23 23 - - Carrying value of investments $ 16,660 $ 7,469 $ 1,815 $ 25,944 $ 15,328 $ 5,344 $ 1,542 $ 22,214

p58
Page 64 INTERNATIONAL FINANCE CORPORATION
NOTES TO CONSOLIDATED FINANCIAL STATEMENTS
NOTE E – LOANS AND GUARANTEES Loans The currency composition and average contractual rate of the disbursed loan portfolio are summarized below: June 30, 2010 June 30, 2009 Average Average Amount contractual Amount contractual (US $ millions) rate (%) (US $ millions) rate (%) US dollar $ 13,409 3.9 $ 12,312 4.4 Euro 2,311 3.9 2,170 4.2 Russian ruble 362 11.6 314 11.4 Indian rupee 340 8.5 233 8.2 Chinese renminbi 294 5.2 291 5.2 Philippine pesos 247 8.6 242 8.4 Colombian pesos 207 10.4 214 11.2 Indonesian rupiah 194 11.2 250 11.7 South African rand 156 10.1 128 11.1 Brazilian real 135 10.1 102 12.7 Mexican peso 80 5.7 75 5.7 New Turkish lira 51 13.2 2 14.7 Other currencies: OECD currencies 180 4.6 201 5.7 Non-OECD currencies 231 7.6 214 8.2 Total disbursed loan portfolio $ 18,197 4.6 $ 16,748 5.0 After the effect of interest rate swaps and currency swaps, IFC’s loans are principally denominated in variable rate US dollars. Loans in all currencies are repayable during the years ending June 30, 2011 through June 30, 2015 and thereafter, as follows (US$ millions): 2011 2012 2013 2014 2015 Thereafter Total Fixed rate loans $ 572 $ 665 $ 518 $ 612 $ 302 $ 1,381 $ 4,050 Variable rate loans 2,503 2,232 1,977 1,942 1,506 3,987 14,147 Total disbursed loan portfolio $ 3,075 $ 2,897 $ 2,495 $ 2,554 $ 1,808 $ 5,368 $ 18,197 At June 30, 2010, 22% of the disbursed loan portfolio consisted of fixed rate loans (21% - June 30, 2009), while the remainder was at variable rates. At June 30, 2010, the disbursed loan portfolio included $130 million of loans serving as collateral under secured borrowing arrangements ($148 million - June 30, 2009). IFC’s disbursed variable rate loans generally reprice within one year. Income from loans and guarantees for the years ended June 30, 2010, June 30, 2009 and June 30, 2008, comprise the following (US$ millions): 2010 2009 2008 Interest income $ 676 $ 879 $ 1,015 Commitment fees 33 29 28 Other financial fees 50 25 40 Unrealized gains (losses) on loans accounted for at fair value under the Fair Value Option 42 (62) (18) Income from loans and guarantees $ 801 $ 871 $ 1,065

p59
Page 65 INTERNATIONAL FINANCE CORPORATION
NOTES TO CONSOLIDATED FINANCIAL STATEMENTS
Reserves against losses on loans Changes in the reserve against losses on loans for the years ended June 30, 2010, June 30, 2009 and June 30, 2008, are summarized below (US$ millions): Year ended June 30, 2010 Specific Portfolio Total reserves reserves reserves Beginning balance $ 300 $ 938 $ 1,238 Provision for (release of provision for) losses on loans 153 (8) 145 Write offs (18) - (18) Recoveries of previously written off loans 5 - 5 Foreign currency transaction adjustments (9) (13) (22) Other adjustments 1 - 1 Ending balance $ 432 $ 917 $ 1,349 Year ended June 30, 2009 Specific Portfolio Total reserves reserves reserves Beginning balance $ 219 $ 629 $ 848 Provision for losses on loans 109 332 441 Write offs (41) - (41) Recoveries of previously written off loans 15 - 15 Foreign currency transaction adjustments (1) (23) (24) Other adjustments (1) - (1) Ending balance $ 300 $ 938 $ 1,238 Year ended June 30, 2008 Specific Portfolio Total reserves reserves reserves Beginning balance $ 291 $ 541 $ 832 Provision for (release of provision for) losses on loans (34) 71 37 Write offs (47) - (47) Recoveries of previously written off loans 8 - 8 Foreign currency transaction adjustments 5 17 22 Other adjustments (4) - (4) Ending balance $ 219 $ 629 $ 848 The provision for losses on loans and guarantees in the consolidated income statement for the year ended June 30, 2010 includes $10 million in respect of guarantees ($3 million release of provision - year ended June 30, 2009; $1 million provision - year ended June 30, 2008). At June 30, 2010 the accumulated reserve for losses on guarantees, included in the consolidated balance sheet in payables and other liabilities, was $24 million ($14 million - June 30, 2009). Other adjustments comprise reserves against interest capitalized as part of a debt restructuring. Loans on which the accrual of interest has been discontinued amounted to $877 million at June 30, 2010 ($457 million - June 30, 2009). Interest income not recognized on nonaccruing loans during the year ended June 30, 2010 totaled $59 million ($47 million - year ended June 30, 2009; $78 million - year ended June 30, 2008). Interest income recognized on loans in nonaccrual status, related to current and prior years, during the year ended June 30, 2010 was $22 million ($18 million - year ended June 30, 2009; $19 million - year ended June 30, 2008) on a cash basis. The average recorded investment in impaired loans during the year ended June 30, 2010, was $768 million ($450 million - year ended June 30, 2009; $390 million - year ended June 30, 2008). The recorded investment in impaired loans at June 30, 2010 was $984 million ($552 million - June 30, 2009). Guarantees Under the terms of IFC’s guarantees, IFC agrees to assume responsibility for the client’s financial obligations in the event of default by the client, where default is defined as failure to pay when payment is due. Guarantees entered into by IFC generally have maturities consistent with those of the loan portfolio. Guarantees signed at June 30, 2010, totaled $2,721 million ($2,055 million - June 30, 2009). Guarantees of $1,889 million that were outstanding (i.e., not called) at June 30, 2010 ($1,365 million - June 30, 2009), were not included in loans on the IFC’s consolidated balance sheet. The outstanding amount represents the maximum amount of undiscounted future payments that IFC could be required to make under these guarantees.
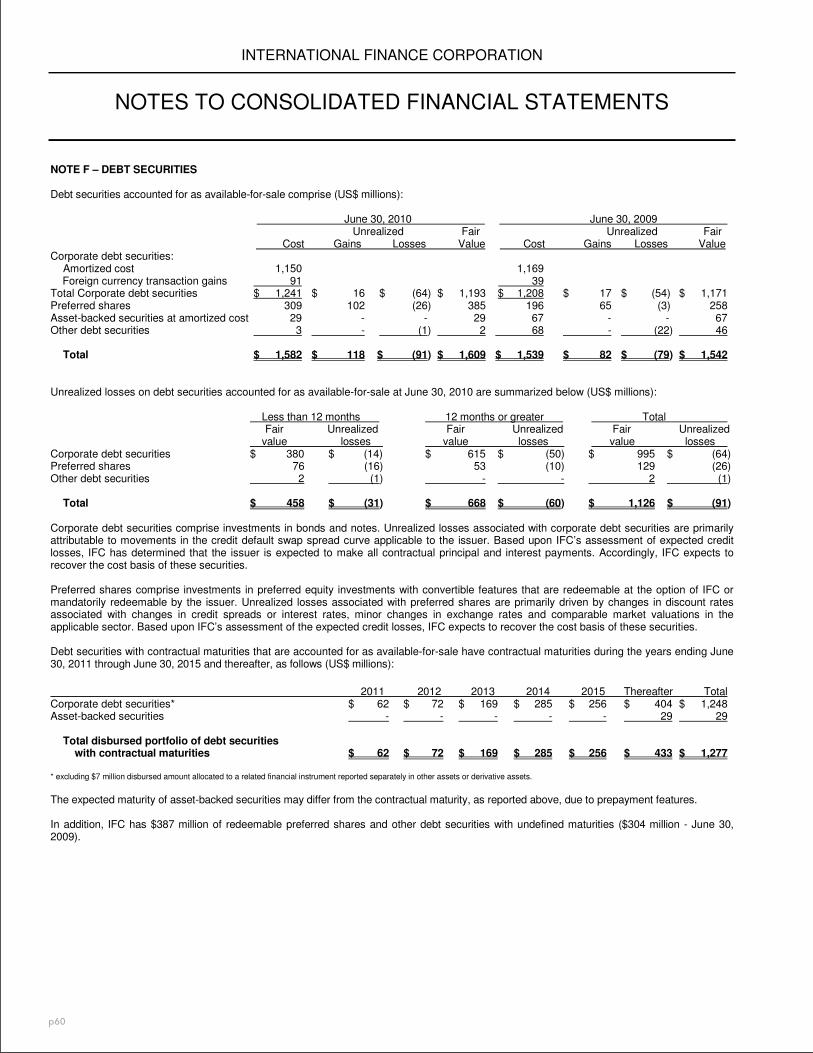
p60
Page 66 INTERNATIONAL FINANCE CORPORATION
NOTES TO CONSOLIDATED FINANCIAL STATEMENTS NOTE F – DEBT SECURITIES Debt securities accounted for as available-for-sale comprise (US$ millions): June 30, 2010 June 30, 2009 Unrealized Fair Unrealized Fair Cost Gains Losses Value Cost Gains Losses Value Corporate debt securities: Amortized cost 1,150 1,169 Foreign currency transaction gains 91 39 Total Corporate debt securities $ 1,241 $ 16 $ (64) $ 1,193 $ 1,208 $ 17 $ (54) $ 1,171 Preferred shares 309 102 (26) 385 196 65 (3) 258 Asset-backed securities at amortized cost 29 - - 29 67 - - 67 Other debt securities 3 - (1) 2 68 - (22) 46 Total $ 1,582 $ 118 $ (91) $ 1,609 $ 1,539 $ 82 $ (79) $ 1,542 Unrealized losses on debt securities accounted for as available-for-sale at June 30, 2010 are summarized below (US$ millions): Less than 12 months 12 months or greater Total Fair Unrealized Fair Unrealized Fair Unrealized value losses value losses value losses Corporate debt securities $ 380 $ (14) $ 615 $ (50) $ 995 $ (64) Preferred shares 76 (16) 53 (10) 129 (26) Other debt securities 2 (1) - - 2 (1) Total $ 458 $ (31) $ 668 $ (60) $ 1,126 $ (91) Corporate debt securities comprise investments in bonds and notes. Unrealized losses associated with corporate debt securities are primarily attributable to movements in the credit default swap spread curve applicable to the issuer. Based upon IFC’s assessment of expected credit losses, IFC has determined that the issuer is expected to make all contractual principal and interest payments. Accordingly, IFC expects to recover the cost basis of these securities. Preferred shares comprise investments in preferred equity investments with convertible features that are redeemable at the option of IFC or mandatorily redeemable by the issuer. Unrealized losses associated with preferred shares are primarily driven by changes in discount rates associated with changes in credit spreads or interest rates, minor changes in exchange rates and comparable market valuations in the applicable sector. Based upon IFC’s assessment of the expected credit losses, IFC expects to recover the cost basis of these securities. Debt securities with contractual maturities that are accounted for as available-for-sale have contractual maturities during the years ending June 30, 2011 through June 30, 2015 and thereafter, as follows (US$ millions): 2011 2012 2013 2014 2015 Thereafter Total Corporate debt securities* $ 62 $ 72 $ 169 $ 285 $ 256 $ 404 $ 1,248 Asset-backed securities - - - - - 29 29 Total disbursed portfolio of debt securities with contractual maturities $ 62 $ 72 $ 169 $ 285 $ 256 $ 433 $ 1,277 * excluding $7 million disbursed amount allocated to a related financial instrument reported separately in other assets or derivative assets. The expected maturity of asset-backed securities may differ from the contractual maturity, as reported above, due to prepayment features. In addition, IFC has $387 million of redeemable preferred shares and other debt securities with undefined maturities ($304 million - June 30, 2009).

p61
Page 67 INTERNATIONAL FINANCE CORPORATION
NOTES TO CONSOLIDATED FINANCIAL STATEMENTS The currency composition and average contractual rate of debt securities with contractual maturities that are accounted for as available-for-sale are summarized below: June 30, 2010 June 30, 2009 Average Average Amount contractual Amount contractual (US $ millions) rate (%) (US $ millions) rate (%) Brazilian real $ 806 9.0 $ 734 12.7 US dollar 205 3.7 302 3.9 Euro 6 3.5 33 4.1 Other non-OECD currencies 260 6.4 212 10.0 Total disbursed portfolio of debt securities with contractual maturities* $ 1,277 7.6 $ 1,281 9.9 After the effect of interest rate swaps and currency swaps, IFC’s debt securities with contractual maturities that are accounted for as available-for-sale are principally denominated in variable rate US dollars. Income from debt securities for the years ended June 30, 2010, June 30, 2009 and June 30, 2008, comprise the following (US$ millions): 2010 2009 2008 Interest income $ 35 $ 64 $ 49 Realized gains on debt securities 14 6 81 Unrealized gains (losses) on debt securities accounted for at fair value under the Fair Value Option 23 - - Gains on non-monetary exchanges 32 2 23 Impairment losses on debt securities: Total other-than-temporary impairment losses (3) (42) - Portion of losses recognized in other comprehensive income - 34 - Net impairment losses recognized in net income (3) (8) - Dividends 7 7 10 Total income from debt securities $ 108 $ 71 $ 163 NOTE G – EQUITY INVESTMENTS
Income (loss) from equity investments for the years ended June 30, 2010, June 30, 2009 and June 30, 2008 comprises the following (US$
millions): 2010 2009 2008 Realized gains on equity investments $ 1,290 $ 990 $ 1,219 Unrealized gains (losses) on equity investments accounted for at fair value under the Fair Value Option 240 (299) 12 Gains on non-monetary exchanges 28 14 177 Dividends and profit participations 285 311 428 Release (amortization) of UJVs conditional asset retirement obligations 3 (2) (1) Other-than-temporary impairment losses: Equity investments at cost less impairment (126) (605) (140) Equity investments available-for-sale (77) (453) - Total other- than-temporary impairment losses on equity investments (203) (1,058) (140) Custody, fees and other (5) 2 (7) Total income (loss) from equity investments $ 1,638 $ (42) $ 1,688 Dividends and profit participations include $60 million ($56 million - year ended June 30, 2009; $59 million - year ended June 30, 2008) of receipts received in freely convertible currency, net of cash disbursements, in respect of investments accounted for under the cost recovery method, for which cost has been fully recovered. Equity investments include several private equity funds that invest primarily in emerging markets across a range of sectors and that are accounted for at fair value under the Fair Value Option. These investments cannot be redeemed with the funds. Instead, the nature of the investments in this class is that distributions are received through the liquidation of the underlying assets of the funds. IFC estimates that the underlying assets of the funds would be liquidated over five to eight years. The fair values of all these funds have been determined using the net asset value of IFC’s ownership interest in partners’ capital and totaled $1,175 million as of June 30, 2010 ($716 million as of June 30, 2009). The unfunded commitment obligations related to these funds totaled $1,006 million as of June 30, 2010 ($648 million as of June 30, 2009).

p62
Page 68 INTERNATIONAL FINANCE CORPORATION
NOTES TO CONSOLIDATED FINANCIAL STATEMENTS
NOTE H – INVESTMENT TRANSACTIONS COMMITTED BUT NOT DISBURSED OR UTILIZED Loan, equity and debt security commitments signed but not yet disbursed, and guarantee and client risk management facilities signed but not yet utilized are summarized below (US$ millions): June 30, 2010 June 30, 2009 Investment transactions committed but not disbursed: Loans, equity investments and debt securities $ 10,491 $ 9,870 Investment transactions committed but not utilized: Guarantees 832 690 Client risk management facilities 124 104 Total investment transactions committed but not disbursed or utilized $ 11,447 $ 10,664 The disbursements of investment transactions committed but not disbursed or utilized are generally subject to fulfillment of conditions of disbursement. NOTE I – LOAN PARTICIPATIONS Loan participations signed as commitments for which disbursement has not yet been made and loan participations disbursed and outstanding which are serviced by IFC for participants are as follows (US$ millions): June 30, 2010 June 30, 2009 Loan participations signed as commitments but not disbursed $ 759 $ 1,318 Loan participations disbursed and outstanding which are serviced by IFC $ 6,336 $ 6,669 NOTE J – RECEIVABLES AND OTHER ASSETS Receivables and other assets are summarized below (US$ millions): June 30, 2010 June 30, 2009 Receivables from unsettled security trades $ 1,075 $ 604 Accrued interest income on time deposits and securities 135 111 Accrued income on derivative instruments 400 379 Accrued interest income on loans 238 225 Prepaid pension and other postretirement benefit costs 59 228 Headquarters building: Land 89 89 Building 218 214 Less: Building depreciation (73) (57) Headquarters building, net 234 246 Deferred charges and other assets 372 237 Total receivables and other assets $ 2,513 $ 2,030
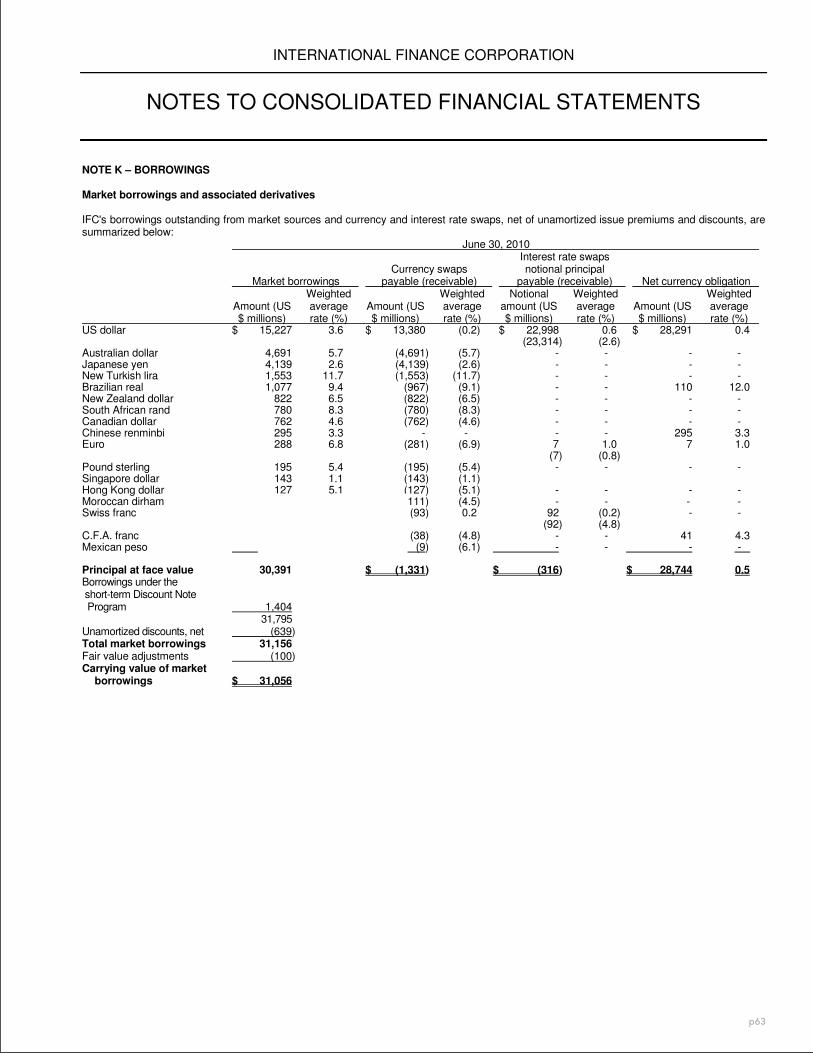
p63
Page 69 INTERNATIONAL FINANCE CORPORATION
NOTES TO CONSOLIDATED FINANCIAL STATEMENTS
NOTE K – BORROWINGS Market borrowings and associated derivatives IFC's borrowings outstanding from market sources and currency and interest rate swaps, net of unamortized issue premiums and discounts, are summarized below: June 30, 2010 Interest rate swaps Currency swaps notional principal Market borrowings payable (receivable) payable (receivable) Net currency obligation Weighted Weighted Notional Weighted Weighted Amount (US average Amount (US average amount (US average Amount (US average $ millions) rate (%) $ millions) rate (%) $ millions) rate (%) $ millions) rate (%) US dollar $ 15,227 3.6 $ 13,380 (0.2) $ 22,998 0.6 $ 28,291 0.4 (23,314) (2.6) Australian dollar 4,691 5.7 (4,691) (5.7) - - - - Japanese yen 4,139 2.6 (4,139) (2.6) - - - - New Turkish lira 1,553 11.7 (1,553) (11.7) - - - - Brazilian real 1,077 9.4 (967) (9.1) - - 110 12.0 New Zealand dollar 822 6.5 (822) (6.5) - - - - South African rand 780 8.3 (780) (8.3) - - - - Canadian dollar 762 4.6 (762) (4.6) - - - - Chinese renminbi 295 3.3 - - - - 295 3.3 Euro 288 6.8 (281) (6.9) 7 1.0 7 1.0 (7) (0.8) Pound sterling 195 5.4 (195) (5.4) - - - - Singapore dollar 143 1.1 (143) (1.1) Hong Kong dollar 127 5.1 (127) (5.1) - - - - Moroccan dirham 111 4.5 (111) (4.5) - - - - Swiss franc 93 4.8 (93) 0.2 92 (0.2) - - (92) (4.8) C.F.A. franc 79 4.5 (38) (4.8) - - 41 4.3 Mexican peso 9 6.1 (9) (6.1) - - - - Principal at face value 30,391 $ (1,331) $ (316) $ 28,744 0.5 Borrowings under the short-term Discount Note Program 1,404 31,795 Unamortized discounts, net (639) Total market borrowings 31,156 Fair value adjustments (100) Carrying value of market borrowings $ 31,056

p64
Page 70 INTERNATIONAL FINANCE CORPORATION
NOTES TO CONSOLIDATED FINANCIAL STATEMENTS June 30, 2009 Interest rate swaps Currency swaps notional principal Market borrowings payable (receivable) payable (receivable) Net currency obligation Weighted Weighted Notional Weighted Weighted Amount (US average Amount (US average amount (US average Amount (US average $ millions) rate (%) $ millions) rate (%) $ millions) rate (%) $ millions) rate (%) US dollar $ 13,319 3.6 $ 12,413 (1.2) $ 16,379 1.6 $ 25,401 1.4 (16,710) (3.3) Japanese yen 4,757 2.6 (4,757) (2.6) - - - - Australian dollar 2,964 6.0 (2,964) (6.0) - - - - South African rand 1,492 9.1 (1,492) (9.1) - - - - New Turkish lira 927 12.6 (927) (12.6) - - - - New Zealand dollar 824 7.1 (824) (7.1) - - - - Pound sterling 800 5.6 (800) (5.6) - - - - Canadian dollar 702 4.6 (702) (4.6) - - - - Euro 358 6.0 (358) (6.0) - - - - Chinese renminbi 293 3.3 - - - - 293 3.3 Brazilian real 250 10.6 (148) (9.7) - - 102 12.0 Hong Kong dollar 244 5.1 (244) (5.1) - - - - Moroccan dirham 125 4.5 (125) (4.5) - - - - Swiss franc 94 4.8 (94) (0.2) 93 0.2 - - (93) (4.8) C.F.A. franc 48 4.8 (44) (4.8) - - 4 4.8 Mexican peso 15 7.0 (15) (7.0) - - - - Principal at face value 27,212 $ (1,081) $ (331) $ 25,800 1.4 Unamortized discounts, net (677) Total market borrowings 26,535 Fair value adjustments (875) Carrying value of market borrowings $ 25,660 The net currency obligations in Chinese renminbi, Brazilian real and C.F.A. franc at June 30, 2010 have funded on-balance sheet loans with similar characteristics in such currencies. The weighted average rate of IFC’s borrowings outstanding from market sources after currency and interest rate swap transactions was 0.5% at June 30, 2010 (1.4% - June 30, 2009). The weighted average remaining maturity of IFC’s borrowings from market sources was 6.5 years at June 30, 2010 (7.3 years - June 30, 2009). Charges on borrowings for the year ended June 30, 2010 include $4 million of interest expense on secured borrowings ($7 million - year ended June 30, 2009; $11 million - year ended June 30, 2008) and is net of $62 million of gains on buybacks of market borrowings ($61 million - June 30, 2009; $2 million - year ended June 30, 2008). The net nominal amount receivable from currency swaps of $1,331 million and the net notional amount receivable from interest rate swaps of $316 million at June 30, 2010 ($1,081 million and $331 million - June 30, 2009), shown in the above table, are represented by currency and interest rate swap assets at fair value of $1,798 million and currency and interest rate swap liabilities at fair value of $575 million ($1,300 million and $896 million - June 30, 2009), included in derivative assets and derivative liabilities, respectively, on the consolidated balance sheet. Short term market borrowings IFC’s short-term Discount Note Program has maturities ranging from overnight to one year. The amount outstanding under the program at June 30, 2010 is $1,404 million ($0 at June 30, 2009). Charges on borrowings for the year ended June 30, 2010, includes $2 million in respect of this program. Borrowings from IBRD Borrowings outstanding from IBRD are summarized below: June 30, 2010 June 30, 2009 Principal Weighted Principal Weighted amount average amount average (US$ millions) cost (%) (US$ millions) cost (%) Saudi Arabian riyal $ 50 4.0 $ 50 4.0 US dollar - - 1 8.0 Total borrowings outstanding from IBRD $ 50 $ 51 The weighted average remaining maturity of borrowings from IBRD was 4.2 years at June 30, 2010 (7.8 years - June 30, 2009). Charges on borrowings for the year ended June 30, 2010, includes $2 million ($2 million - year ended June 30, 2009; $3 million - year ended June 30, 2008) in respect of borrowings from IBRD.

p65
Page 71 INTERNATIONAL FINANCE CORPORATION
NOTES TO CONSOLIDATED FINANCIAL STATEMENTS Maturity of borrowings The principal amounts repayable on borrowings outstanding in all currencies, gross of any premiums or discounts, during the years ending June 30, 2011, through June 30, 2015, and thereafter are summarized below (US$ millions): 2011 2012 2013 2014 2015 Thereafter Total Borrowings from market sources $ 3,840 $ 2,199 $ 5,326 $ 7,368 $ 4,190 $ 7,468 $ 30,391 Borrowings under the short-term Discount Note Program 1,404 - - - - - 1,404 Borrowings from IBRD - 8 8 8 9 17 50 Total borrowings, gross $ 5,244 $ 2,207 $ 5,334 $ 7,376 $ 4,199 $ 7,485 31,845 Unamortized discounts, net (639) Fair value adjustments (100) Carrying value of borrowings $ 31,106 After the effect of interest rate and currency swaps, IFC’s borrowings generally reprice within one year. NOTE L – PAYABLES AND OTHER LIABILITIES Payables and other liabilities are summarized below (US$ millions): June 30, 2010 June 30, 2009 Accrued charges on borrowings $ 421 $ 357 Accrued charges on derivative instruments 138 207 Payables for unsettled security trades 857 619 Secured borrowings 130 148 Accounts payable, accrued expenses and other liabilities 442 345 Deferred income 89 33 Total payables and other liabilities $ 2,077 $ 1,709 NOTE M – CAPITAL TRANSACTIONS IFC's authorized share capital was increased to $2,450 million through two capital increases in 1992. No subscribed shares remain unpaid at June 30, 2010. During the year ended June 30, 2010, no shares, at a par value of $1,000 each, were subscribed and paid by member countries (3,104 shares at a par value of $1,000 each - year ended June 30, 2009; 532 shares at a par value of $1,000 each - year ended June 30, 2008). Under IFC’s Articles of Agreement, in the event a member withdraws from IFC, IFC and the member may negotiate on the repurchase of the member’s capital stock on such terms as may be appropriate under the circumstances. Such agreement may provide, among other things, for a final settlement of all obligations of the member to IFC. If such an agreement is not made within six months after the member withdraws or such other time as IFC and the member may agree, the repurchase price of the member’s capital stock shall be the value thereof shown by the books of IFC on the day when the member withdraws. The repurchase of capital stock is subject to certain conditions including payments in installments, at such times and in such available currency or currencies as IFC reasonably determines, taking into account the financial position of IFC. IFC’s Articles of Agreement also provide for the withdrawing member to repay losses on loans and equity investments in excess of reserves provided on the date of withdrawal. NOTE N – OTHER INCOME Other income for the year ended June 30, 2010, predominantly comprises $26 million of fees collected from clients for expenses incurred by IFC, included in administrative expenses ($22 million - year ended June 30, 2009; $23 million - year ended June 30, 2008), $17 million of income from consolidated entities after eliminations ($3 million - year ended June 30, 2009; $7 million - year ended June 30, 2008) and income under other reimbursable arrangements of $7 million ($5 million - year ended June 30, 2009; $6 million - year ended June 30, 2008).

p66
Page 72 INTERNATIONAL FINANCE CORPORATION
NOTES TO CONSOLIDATED FINANCIAL STATEMENTS
NOTE O – RETAINED EARNINGS DESIGNATIONS AND RELATED EXPENDITURES AND ACCUMULATED OTHER COMPREHENSIVE INCOME Designated retained earnings The components of designated retained earnings and related expenditures are summarized below (US$ millions):
On August 5, 2009, IFC’s Board of Directors approved a designation of $200 million of IFC’s retained earnings for grants to IDA and concurrently reallocated $70 million of the unutilized balances of prior year designations relating to performance-based grants, $70 million of the unutilized balances of prior year designations relating to the Global Infrastructure Project Development Fund and $60 million of the unutilized balances relating to IFC SME Ventures for IDA countries. On October 7, 2009, IFC’s Board of Governors noted with approval the designations and reallocations approved by IFC’s Board of Directors on August 5, 2009. On June 23, 2010, IFC’s Board of Directors approved a transfer of $5 million of the unutilized balances of prior period designations relating to performance-based grants to advisory services. Accumulated other comprehensive income The components of accumulated other comprehensive income at June 30, 2010 and June 30, 2009 are summarized as follows (US$ millions): June 30, 2010 June 30, 2009 Net unrealized gains on debt securities $ 118 $ 41 Net unrealized gains on equity investments 1,582 976 Unrecognized net actuarial (losses) gains and unrecognized prior service costs on benefit plans (498) (306) Total accumulated other comprehensive income $ 1,202 $ 711
Grants to IDA
Advisory services
Performance-based grants
SME
Ventures for IDA
countries
GlobalInfrastructure
Project Development
Fund
Total
designated retained earnings
At July 1, 2007 $ - $ 391 $ 215 $ - $ - $ 606
Year ended June 30, 2008
Expenditures against designated retained earnings
(500)
(123) (27)
(650)
Designations of retained earnings 500 170 100 100 870
At June 30, 2008 $ - $ 438 $ 188 $ 100 $ 100 $ 826
Year ended June 30, 2009 Expenditures against designated retained
earnings (450)
(129) (5)
(1)
(585)
Designations of retained earnings 450 100 550
At June 30, 2009 $ - $ 409 $ 183 $ 99 $ 100 $ 791
Year ended June 30, 2010 Expenditures against designated retained
earnings
(200)
(101) (7)
(2)
(310)
Designations/Reallocations of retained earnings
200
(70)
(60)
(70)
-
Transfers 5 (5) -
At June 30, 2010 $ - $ 313 $ 101 $ 37 $ 30 $ 481

p67
Page 73 INTERNATIONAL FINANCE CORPORATION
NOTES TO CONSOLIDATED FINANCIAL STATEMENTS
NOTE P – NET GAINS AND LOSSES ON OTHER NON-TRADING FINANCIAL INSTRUMENTS ACCOUNTED FOR AT FAIR VALUE Net (losses) gains on other non-trading financial instruments accounted for at fair value for the years ended June 30, 2010, June 30, 2009 and June 30, 2008, comprises (US$ millions): 2010 2009 2008 Unrealized (losses) gains on market borrowings accounted for at fair value: Credit spread component $ (324) $ 668 $ (34) Interest rate, foreign exchange and other components (451) (452) 48 Total unrealized (losses) gains on market borrowings (775) 216 14 Unrealized gains on derivatives associated with market borrowings 549 165 3 Net unrealized (losses) gains on market borrowings and associated derivatives (226) 381 17 Unrealized losses on derivatives associated with loans (98) (65) (4) Unrealized gains (losses) on derivatives associated with debt securities 28 25 (2) Net (losses) gains on derivatives associated with equity investments (43) 111 98 Net (losses) gains on other non-trading financial instruments accounted for at fair value $ (339) $ 452 $ 109 As discussed in Note A, “Summary of significant accounting and related policies”, market borrowings with associated derivatives are accounted for at fair value under the Fair Value Option. Differences arise between the movement in the fair value of market borrowings and the fair value of the associated derivatives primarily due to the different credit characteristics. The change in fair value reported in “Net unrealized gains on market borrowings and associated derivatives” includes the impact of changes in IFC's own credit spread. As credit spreads widen, unrealized gains are recorded and when such credit spreads narrow, unrealized losses are recorded (notwithstanding the impact of other factors, such as changes in risk-free interest and foreign currency exchange rates). The magnitude and direction (gain or loss) can be volatile from period to period but do not alter the cash flows on the market borrowings. NOTE Q – DERIVATIVE AND OTHER FINANCIAL INSTRUMENTS As discussed in Note A, “Summary of significant accounting and related policies”, IFC enters into transactions in various derivative instruments for financial risk management purposes in connection with its principal business activities, including lending, investing in debt securities, equity investments, client risk management, borrowing, liquid asset management and asset and liability management. None of these derivative instruments are designated as hedging instruments under ASC Topic 815. Note A describes how and why IFC uses derivative instruments. The fair value of derivative instrument assets and liabilities by risk type at June 30, 2010 and June 30, 2009 is summarized as follows (US$ millions):
June 30, 2010 June 30, 2009
Consolidated balance sheet location Fair value Fair value Derivative assets Interest rate $ 647 $ 361 Foreign exchange 50 200 Interest rate and currency 1,653 1,299 Equity 337 327 Other derivative 1 8 Total derivative assets $ 2,688 $ 2,195 Derivative liabilities Interest rate $ 327 $ 314 Foreign exchange 36 202 Interest rate and currency 777 1,037 Total derivative liabilities $ 1,140 $ 1,553

p68
Page 74 INTERNATIONAL FINANCE CORPORATION
NOTES TO CONSOLIDATED FINANCIAL STATEMENTS
The effect of derivative instruments contracts on the consolidated income statement for the years ended June 30, 2010 and June 30, 2009 is summarized as follows (US$ millions): Derivative instrument category Consolidated income statement location June 30, 2010 June 30, 2009 Interest rate Income from loans and guarantees (44) $ (17) Income from liquid asset trading activities (298) (67) Charges on borrowings 403 150 Other income 5 19 Net (losses) gains on other non-trading financial instruments accounted for at fair value 331 54 Foreign exchange Foreign currency transaction (losses) gains on non-trading activities 4 (68) Income from liquid asset trading activities 88 - Net (losses) gains on other non-trading financial instruments accounted for at fair value (5) (4) Interest rate and currency Income from loans and guarantees (173) (140) Income from debt securities (65) (63) Income from liquid asset trading activities (11) (6) Charges on borrowings 715 450 Foreign currency transaction (losses) gains on non-trading activities 539 322 Net (losses) gains on other non-trading financial instruments accounted for at fair value 146 19 Service fees 7 - Equity Net (losses) gains on other non-trading financial instruments accounted for at fair value (30) 158 Other derivative instruments Income (loss) from equity investments - 6 Net (losses) gains on other non-trading financial instruments accounted for at fair value (6) 7 Total $ 1,606 $ 820 The income related to each derivative instrument category includes realized and unrealized gains and losses on both derivative instruments and nonderivative instruments. At June 30, 2010, the outstanding volume, measured by US$ equivalent notional, of interest rate contracts was $36,446 million, foreign exchange contracts was $3,201 million and interest rate and currency contracts was $20,356 million. At June 30, 2010, there were 138 equity contracts and 2 other derivative contracts related to IFC’s loan and equity investment portfolio recognized as derivatives assets or liabilities under ASC Topic 815. IFC enters into interest rate and currency derivative instruments under standard industry contracts that contain credit risk-linked contingent features with respect to collateral requirements. Should IFC’s credit rating be downgraded from the current AAA, the credit support annexes of these standard swap agreements detail, by swap counterparty, the collateral requirements IFC must satisfy in this event. The aggregate fair value of derivatives containing a credit risk-linked contingent feature in a net liability position was $157 million at June 30, 2010. At June 30, 2010 IFC had no collateral posted under these agreements. If IFC was downgraded from the current AAA to AA+, then collateral in the amount of less than $1 million would be required to be posted against net liability positions with counterparties at June 30, 2010.

p69
Page 75 INTERNATIONAL FINANCE CORPORATION
NOTES TO CONSOLIDATED FINANCIAL STATEMENTS
NOTE R – FAIR VALUE MEASUREMENTS Many of IFC’s financial instruments are not actively traded in any market. Accordingly, estimates and present value calculations of future cash flows are used to estimate the fair values. Determining future cash flows for fair value estimation is subjective and imprecise, and minor changes in assumptions or methodologies may materially affect the estimated values. The excess or deficit resulting from the difference between the carrying amounts and the fair values presented does not necessarily reflect the realizable values, since IFC generally holds loans, borrowings and other financial instruments with contractual maturities with the aim of realizing their historical values. The estimated fair values reflect the interest rate environments as of June 30, 2010 and June 30, 2009. In different interest rate environments, the fair value of IFC’s financial assets and liabilities could differ significantly, especially the fair value of certain fixed rate financial instruments. Reasonable comparability of fair values among financial institutions is not likely, because of the wide range of permitted valuation techniques and numerous estimates that must be made in the absence of secondary market prices. This lack of objective pricing standards introduces a greater degree of subjectivity and volatility to these derived or estimated fair values. Therefore, while disclosure of estimated fair values of financial instruments is required, readers are cautioned in using these data for purposes of evaluating the financial condition of IFC. The fair values of the individual financial instruments do not represent the fair value of IFC taken as a whole. The methodologies used and key assumptions made to estimate fair values as of June 30, 2010, and June 30, 2009, are summarized below. Liquid assets - The primary pricing source for the liquid assets is valuations obtained from external pricing services (vendor prices). The most liquid securities in the liquid asset portfolio are exchange traded futures and options and US Treasuries. For exchange traded futures and options, exchange quoted prices are obtained and these are classified as Level 1 in accordance with ASC 820. Liquid assets valued using quoted market prices are also classified as Level 1. US Treasuries are valued using index prices and also classified as Level 1. The remaining liquid assets valued using vendor prices are classified as Level 2 or Level 3 based on the results of IFC’s evaluation of the vendor's pricing methodologies. Most vendor prices use some form of matrix pricing methodology to derive the inputs for projecting cash flows or to derive prices. When vendor prices are not available, liquid assets are valued internally by IFC using yield pricing approach or comparables model approach and these are classified as Level 2 or Level 3 depending on the degree that the inputs are observable in the market. The critical factors in valuing liquid assets in both Level 2 and Level 3 are the estimation of cash flows and yield. Other significant inputs for valuing corporate securities, quasi-government securities and sovereign or sovereign-guaranteed securities include reported trades, broker/dealer quotes, benchmark securities, option adjusted spread curve, volatilities, and other reference data. In addition to these inputs, valuation models for securitized or collateralized securities use collateral performance inputs, such as weighted average coupon rate, weighted average maturity, conditional prepayment rate, constant default rate, vintage, and credit enhancements. Derivative instruments - The various classes of derivative instruments include foreign exchange contracts, interest rate and currency contracts, equity contracts and other derivative contracts. Certain over the counter derivatives in the liquid asset portfolio priced in-house are classified as Level 2, while certain over the counter derivatives priced using external manager prices are classified as Level 3. Fair values for derivative instruments are derived by determining the present value of estimated future cash flows using appropriate discount rates and option specific models where appropriate. The significant inputs used in valuing the various classes of derivative instruments are presented below: Classes Significant Inputs Interest rate contracts Inter-bank yield curves, foreign exchange basis curve and yield curves specified to index floating rates. Foreign exchange Foreign exchange rate, inter-bank yield curves and foreign exchange basis curve. Interest rate and currency rates Foreign exchange rate, inter-bank yield curves, foreign exchange basis curve and yield curves specified to index floating rates. Equity Equity spot price, volatility, risk free rate, dividend yield, expiry date, discount rate, strike price, discount rate and option period. Other derivative contracts Foreign exchange rate, inter-bank yield curves, foreign exchange basis curve, yield curves specified to index, floating rates and inflation curve, swaption volatility matrix, equity spot price, volatility and dividend yield. Loans and loan commitments - Fair values of loans were determined on the basis of discounted cash flows, incorporating credit default swap spreads and expected recovery rates, risk free rate, amortization schedule and investment risk rating and were classified as Level 3. Certain loans contain embedded conversion and/or income participation features. If not bifurcated as standalone derivatives, these features were considered in determining the loans’ fair value based on the quoted market prices or other calculated values of the equity investments into which the loans are convertible and the discounted cash flows of the income participation features. Equity investments - Equity investments valued using quoted prices in active markets are classified as Level 1. Investments in funds were valued using net asset values and classified under Level 3 . Equity investments, other than investments in funds, without available market prices were valued using valuation techniques appropriate to the investment such as recent transactions ( IFC’s purchase price, price that is in the process of negotiation, or recent trade price from third party transactions), discounted cash flows, and relative valuation through the use of comparables. Such equity investments were classified as Level 3.

p70
Page 76 INTERNATIONAL FINANCE CORPORATION
NOTES TO CONSOLIDATED FINANCIAL STATEMENTS The below table presents the significant inputs for the discounted cash flow model and the relative valuation through use of comparables approach: Valuation techniques Banking and non-banking Insurance companies Others financial institutions Discounted cash flow model Asset growth rate, discount rate, terminal value multiple or perpetual growth rate, cost of equity,
return on assets, target leverage and recovery rate. Relative valuations through Price/Book Value, and Price/Book Value, Enterprise Value/EBITDA, the use of comparables Price/Earnings. Price/Embedded Value, and Enterprise Value/Sales, Appraisal Value Price /Book Value, Price/Earnings, Price/EBITDA, and Price/Sales. Debt securities - Debt securities in IFC’s investment portfolio do not have available market prices and are valued using discounted cash flow approaches . All debt securities are classified as Level 3. Significant inputs used for valuations of significant classes of debt securities are presented below: Classes Significant Inputs Corporate debt securities Risk free rate, amortization schedule, investment risk rating, Credit Default Swap (CDS) spreads and recovery rate. Asset Backed Securities Risk free rate, asset risk rating, CDS spreads, recovery rate and correlation parameter, CDS spread, ratings of class notes, index rates, default rate, prepayment rate, recovery rate, recovery lag, delinquency rate and optional redemption option. Borrowings - Fair values derived by using quoted prices in active markets are classified as Level 1. Fair values derived by determining the present value of estimated future cash flows using appropriate discount rates and option specific models where appropriate are classified as Level 2. The significant inputs used in valuing borrowings classified as Level 2 are presented below: Classes Significant Inputs Structured bonds Foreign exchange rate and inter-bank yield curves, IFC's credit curve and swaption volatility matrix, foreign exchange rate volatility, equity spot price, volatility and dividend yield. Unstructured bonds Inter-bank yield curve and IFC's credit curve.

p71
Page 77 INTERNATIONAL FINANCE CORPORATION
NOTES TO CONSOLIDATED FINANCIAL STATEMENTS Fair value of assets and liabilities Estimated fair values of IFC’s financial assets and liabilities and off-balance sheet financial instruments at June 30, 2010 and June 30, 2009 are summarized below (US$ millions). IFC’s credit exposure is represented by the estimated fair values of its financial assets. Note A provides a summary of IFC’s significant accounting policies. June 30, 2010 June 30, 2009 Carrying Carrying amount Fair value amount Fair value Financial assets Cash and due from banks, time deposits, securities and securities purchased under resale agreements $ 29,930 $ 29,930 $ 25,044 $ 25,044 Investments: Loans, net 16,660 17,172 15,328 15,238 Cost method equity investments 2,551 5,228 2,101 4,689 Equity investments accounted for at fair value as available-for-sale 3,012 3,012 1,927 1,927 Equity investments accounted for at fair value under the Fair Value Option 1,906 1,906 1,316 1,316 Total equity investments 7,469 10,146 5,344 7,932 Debt securities accounted for at fair value as available-for-sale 1,609 1,609 1,542 1,542 Debt securities accounted for at fair value under the Fair Value Option 206 206 - - Total debt securities 1,815 1,815 1,542 1,542 Total investments 25,944 29,133 22,214 24,712 Derivative assets: Borrowings-related 1,798 1,798 1,300 1,300 Liquid asset portfolio-related and other 154 154 231 231 Investment-related 658 658 629 629 Client risk management-related 78 78 35 35 Total derivative assets 2,688 2,688 2,195 2,195 Other investment-related financial assets 33 244 - 25 Financial liabilities Securities sold under repurchase agreements and payable for cash collateral received 8,393 8,393 6,388 6,388 Market and IBRD borrowings outstanding 31,106 31,117 25,711 25,718 Derivative liabilities: Borrowings-related 575 575 896 896 Liquid asset portfolio-related and other 181 181 280 280 Investment-related 306 306 342 342 Client risk management-related 78 78 35 35 Total derivative liabilities 1,140 1,140 1,553 1,553
Other investment-related financial assets comprise standalone options and warrants that do not meet the definition of a derivative. The fair value of loan commitments amounted to $20 million at June 30, 2010 ($20 million - June 30, 2009). Fair values of loan commitments were based on discounted cash flows.

Page 78 INTERNATIONAL FINANCE CORPORATION
NOTES TO CONSOLIDATED FINANCIAL STATEMENTS
Fair value hierarchy The following tables provide information as of June 30, 2010 and June 30, 2009, about IFC’s financial assets and financial liabilities measured at fair value on a recurring basis. As required by ASC 820, financial assets and financial liabilities are classified in their entirety based on the lowest level input that is significant to the fair value measurement (US$ millions): At June 30, 2010 Level 1 Level 2 Level 3 Total Trading securities:
Money market funds $ 456 $ - $ - $ 456 Treasury securities 7,052 173 - 7,225 Foreign government bonds 131 273 - 404 Government guaranteed bonds 314 6,252 - 6,566 Supranational bonds - 150 14 164 Foreign municipal bonds - 480 - 480 Agency bonds 3 26 - 29 Foreign agency bonds - 932 - 932 Agency residential mortgage-backed securities - 657 - 657 Asset-backed securities - 2,625 55 2,680 Foreign asset-backed securities - 86 - 86 Corporate bonds - 1,359 - 1,359 Commercial mortgage-backed securities - 750 - 750 Foreign residential mortgage-backed securities - 570 - 570 Non-agency residential mortgage-backed securities - 822 - 822 Collateralized debt and collateralized loan obligations - 106 108 214 Other 34 - - 34
Total trading securities 7,990* 15,261 177 23,428 Loans (outstanding principal balance $488) - - 450 450 Equity investments:
Banking and non-banking financial institutions 1,201 - 835 2,036 Insurance companies - - 33 33 Funds 2 - 1,177 1,179 Others 1,226 - 444 1,670
Total equity investments 2,429 - 2,489 4,918 Debt securities:
Corporate debt securities - - 1,316 1,316 Preferred shares - - 464 464 Asset-backed securities - - 29 29 Other debt securities - - 6 6
Total debt securities - - 1,815 1,815 Derivative assets:
Interest rate contracts - 647 - 647 Foreign exchange - 50 - 50 Interest rate and currency rates - 1,653 - 1,653 Equity - - 337 337 Other derivative contracts - - 1 1
Total derivative assets - 2,350 338 2,688
Total assets at fair value $ 10,419 $ 17,611 $ 5,269 $ 33,299 Borrowings:
Structured bonds $ - $ 4,439 $ - $ 4,439 Unstructured bonds 12,020 12,746 - 24,766
Total borrowings (outstanding principal balance $29,944**) 12,020 17,185 - 29,205 Derivative liabilities:
Interest rate contracts - 327 - 327 Foreign exchange - 36 - 36 Interest rate and currency rates - 777 - 777
Total derivative liabilities - 1,140 - 1,140
Total liabilities at fair value $ 12,020 $ 18,325 $ - $ 30,345 * includes securities priced at par plus accrued interest, which approximates fair value, with a fair value of $561 million at June 30, 2010. ** includes discount notes (not under the short-term Discount Note Program), with original maturities greater than one year, with principal due at maturity of $2,499 million, with a fair value of $1,958 million as of June 30, 2010. Note: For the year ended June 30, 2010 there were no transfers between Level 1 and Level 2 or vice versa.

p73
Page 79 INTERNATIONAL FINANCE CORPORATION
NOTES TO CONSOLIDATED FINANCIAL STATEMENTS At June 30, 2009 Level 1 Level 2 Level 3 Total Trading securities:
Money market funds $ 692 $ - $ - $ 692 Treasury securities 5,911 1,311 - 7,222 Foreign government bonds - 101 - 101 Government guaranteed bonds - 4,237 - 4,237 Supranational bonds - 267 - 267 Municipal bonds - 562 - 562 Agency bonds 4 378 - 382 Foreign agency bonds - 99 - 99 Agency residential mortgage-backed securities - 2,785 - 2,785 Asset-backed securities - 1,449 283 1,732 Foreign asset-backed securities - 49 10 59 Corporate bonds - 101 - 101 Commercial mortgage-backed securities - 491 1 492 Foreign residential mortgage-backed securities - 45 53 98 Non-agency residential mortgage-backed securities - 754 328 1,082 Collateralized debt and collateralized loan obligations - 151 181 332
Total trading securities 6,607* 12,780 856 20,243 Loans (outstanding principal balance $466) - - 386 386 Equity investments 1,667 - 1,576 3,243 Debt securities:
Corporate debt securities - - 1,171 1,171 Preferred shares - - 258 258 Asset-backed securities - - 67 67 Other debt securities - - 46 46
Total debt securities - - 1,542 1,542 Derivative assets - 1,860 335 2,195
Total assets at fair value $ 8,274 $ 14,640 $ 4,695 $ 27,609 Borrowings (outstanding principal balance $26,813**) $ 8,533 $ 16,728 $ - $ 25,261 Derivative liabilities - 1,553 - 1,553
Total liabilities at fair value $ 8,533 $ 18,281 $ - $ 26,814
* includes securities priced at par plus accrued interest, which approximates fair value, with a fair value of $711 million at June 30, 2009. ** includes discount notes, with original maturities greater than one year, with principal due at maturity of $2,132 million, with a fair value of $1,494 million as of June 30, 2009.

p74
Page 80 INTERNATIONAL FINANCE CORPORATION
NOTES TO CONSOLIDATED FINANCIAL STATEMENTS
The following tables present the changes in the carrying value of IFC’s Level 3 financial assets and financial liabilities for the years ended June 30, 2010 and June 30, 2009 (US$ millions): Level 3 trading securities for the year ended June 30, 2010 Asset Mortgage Supranational Collateralized Total backed backed bonds loan and debt securities securities obligations Balance as of July 1, 2009 $ 293 $ 382 $ $ 181 $ 856 Transfers into Level 3 (***) - - 17 - 17 Transfers out of Level 3 (****) (293) (382) - (55) (730) Net gains (losses) (realized and unrealized) for the year ended June 30, 2010 in: Net income (loss) - - (3) 2 (1) Purchases, issuances, sales and settlements: Purchases 55 - - - 55 Settlements and others - - - (20) (20) Balance as of June 30, 2010 $ 55 $ - $ 14 $ 108 $ 177 For the year ended June 30, 2010: Net unrealized (losses) gains included in net income $ - $ - $ (4) $ 2 $ (2) Level 3 loans and debt securities for the year ended June 30, 2010 Loans Debt securities Corporate Preferred Asset Others Total securities shares backed securities Balance as of July 1, 2009 $ 386 $ 1,171 $ 258 $ 67 $ 46 $ 1,542 Net gains (realized and unrealized) for the year ended June 30, 2010 in: Net income (loss) 37 34 31 6 - 71 Other comprehensive income (loss) - 27 22 (4) - 45 Purchases, issuances, sales and settlements: Purchases - 150 115 - 4 269 Issuances 106 - - - - - Sales - - (13) - - (13) Settlements and others (79) (66) 51 (40) (44) (99) Balance as of June 30, 2010 $ 450 $ 1,316 $ 464 $ 29 $ 6 $ 1,815 For the year ended June 30, 2010: Net unrealized gains included in net income $ 36 $ 13 $ 6 $ - $ - $ 19 Net unrealized gains included in other comprehensive income $ - $ 37 $ 39 $ - $ - $ 76 (***) Transfers into Level 3 are due to lack of observable market data resulting from a decrease in market activity for these securities as of June 30, 2010. (****)Transfers out of Level 3 are due to availability of observable market data resulting from an increase in market activity for these securities as of June 30, 2010.
Note: IFC’s policy is to recognize transfers in and transfers out at the beginning of the reporting period.

p75
Page 81 INTERNATIONAL FINANCE CORPORATION
NOTES TO CONSOLIDATED FINANCIAL STATEMENTS
Level 3 equity investments for the year ended June 30, 2010 Banking and Insurance Funds Others Total non-banking companies institutions Balance as of July 1, 2009 $ 555 $ 3 $ 719 $ 299 $ 1,576 Transfers into Level 3 (***) - - - - - Transfers out of Level 3 (****) (226) - - (30) (256) Net gains (losses) (realized and unrealized) for the year ended June 30, 2010 in: Net income (loss) 56 - 186 93 335 Other comprehensive income (loss) 372 27 - (9) 390 Purchases, issuances, sales and settlements: Purchases 25 - 373 110 508 Sales (7) - (101) (11) (119) Settlements and others 60 3 - (8) 55 Balance as of June 30, 2010 $ 835 $ 33 $ 1,177 $ 444 $ 2,489 For the year ended June 30, 2010: Net unrealized gains included in net income $ 49 $ - $ 122 $ 74 $ 245 Net unrealized gains (losses) included in other comprehensive income $ 379 $ 27 $ - $ (9) $ 397 Level 3 derivative assets for year ended June 30, 2010 Derivative assets Equity Others Total Balance as of July 1, 2009 $ 328 $ 7 $ 335 Net gains (losses) (realized and unrealized) for the year ended June 30, 2010 in: Net income (loss) (29) (6) (35) Purchases, issuances, sales and settlements: Purchases 66 - 66 Settlements and others (28) - (28) Balance as of June 30, 2010 $ 337 $ 1 $ 338 For the year ended June 30, 2010: Net unrealized gains included in net income $ 3 $ 1 $ 4 Level 3 financial assets and financial liabilities for the year ended June 30, 2009 Trading Equity Debt Derivative Derivative securities Loans investments securities assets liabilities Balance as of July 1, 2008 $ 319 $ 248 $ 1,387 $ 1,620 $ 110 $ (13) Net gains (losses) (realized and unrealized) for the year ended June 30, 2009 in: Net income (loss) (199) (74) (191) (55) 200 13 Other comprehensive income (loss) - - 1 (180) - - Purchases, issuances and settlements, net (159) 212 593 157 (29) - Transfers in (out) of Level 3 895 - (214) - 54 - Balance as of June 30, 2009 $ 856 $ 386 $ 1,576 $ 1,542 $ 335 $ - For the year ended June 30, 2009: Net unrealized gains (losses) included in net loss $ (199) $ (75) $ (204) $ 2 $ 155 $ - Net unrealized gains (losses) included in other comprehensive loss $ - $ - $ 29 $ (149) $ - $ - (***) Transfers into Level 3 are due to lack of observable market data resulting from a decrease in market activity for these securities as of June 30, 2010. (****)Transfers out of Level 3 are due to availability of observable market data resulting from an increase in market activity for these securities as of June 30, 2010.
Note: IFC’s policy is to recognize transfers in and transfers out at the beginning of the reporting period.

p76
Page 82 INTERNATIONAL FINANCE CORPORATION
NOTES TO CONSOLIDATED FINANCIAL STATEMENTS
Gains and losses (realized and unrealized) from trading securities, loans, equity investments and debt securities included in net income for the period are reported on the consolidated income statement in income from liquid asset trading activities, income from loans and guarantees, income (loss) from equity investments and income (loss) from debt securities, respectively. As of June 30, 2010, equity investments, accounted for at cost less impairment, with a carrying amount of $607 million were written down to their fair value of $469 million ($1,661 million and $1,038 million - June 30, 2009) pursuant to ASC 320, Section 10-35, Overall, Subsequent Measurements, paragraph 17 et al thereof (formerly FSP SFAS No. 115-1 and 124-1, The Meaning of Other-Than-Temporary Impairment and its Application to Certain Investments), resulting in a loss of $138 million, which was included in income from equity investments in the consolidated income statement during the year ended June 30, 2010 (loss of $623 million - year ended June 30, 2009). The amount of the write down was based on a Level 3 measure of fair value. NOTE S – CURRENCY POSITION IFC conducts its operations for loans, debt securities, equity investments, time deposits, trading securities, and borrowings in multiple currencies. IFC’s policy is to minimize the level of currency risk by closely matching the currency of its assets (other than equity investments and quasi-equity investments) and liabilities by using hedging instruments. IFC’s equity investments in enterprises located in its developing member countries are typically made in the local currency of the country. As a matter of policy, IFC carries the currency risk of equity investments and quasi-equity investments and funds these investments from its capital and retained earnings. The following table summarizes IFC’s exposure in major currencies at June 30, 2010 and June 30, 2009 (US$ millions): June 30, 2010 Fair value Japanese Other and other US dollar Euro yen currencies adjustments Total Assets Cash and cash equivalents $ 2,600 $ 2,007 $ 3 $ 1,353 $ - $ 5,963 Trading securities 21,332 1,484 - 612 - 23,428 Securities purchased under resale agreements 448 - - 91 - 539 Investments: Loans 13,258 2,284 38 2,429 - 18,009
Less: Reserve against losses on loans (1,013) (173) (2) (161) - (1,349) Net loans 12,245 2,111 36 2,268 - 16,660 Equity investments - - - 7,469 - 7,469 Debt securities 677 79 - 1,059 - 1,815 Total investments 12,922 2,190 36 10,796 - 25,944 Derivative assets 5,691 316 4,137 10,061 (17,517) 2,688 Receivables and other assets 1,546 306 59 602 - 2,513 Total assets $ 44,539 $ 6,303 $ 4,235 $ 23,515 $ (17,517) $ 61,075 Liabilities Securities sold under repurchase agreements and payable for cash collateral received $ 7,754 $ 550 $ - $ 89 $ - $ 8,393 Borrowings 16,235 288 4,141 10,442 - 31,106 Derivative liabilities 10,759 4,077 36 4,048 (17,780) 1,140 Payables and other liabilities 1,367 90 55 565 - 2,077 Total liabilities $ 36,115 $ 5,005 $ 4,232 $ 15,144 $ (17,780) $ 42,716

p77
Page 83 INTERNATIONAL FINANCE CORPORATION
NOTES TO CONSOLIDATED FINANCIAL STATEMENTS
June 30, 2009 Fair value Japanese Other and other US dollar Euro yen currencies adjustments Total Assets Cash and cash equivalents $ 3,717 $ 97 $ 3 $ 440 $ - $ 4,257 Trading securities 19,897 338 - 8 - 20,243 Securities purchased under resale agreements 544 - - - - 544 Investments: Loans 12,157 2,149 39 2,221 - 16,566
Less: Reserve against losses on loans (984) (156) (2) (96) - (1,238) Net loans 11,173 1,993 37 2,125 - 15,328 Equity investments - - - 5,344 - 5,344 Debt securities 563 33 - 946 - 1,542 Total investments 11,736 2,026 37 8,415 - 22,214 Derivative assets 5,383 363 4,755 8,163 (16,469) 2,195 Receivables and other assets 1,582 111 53 284 - 2,030 Total assets $ 42,859 $ 2,935 $ 4,848 $ 17,310 $ (16,469) $ 51,483 Liabilities Securities sold under repurchase agreements and payable for cash collateral received $ 6,116 $ 272 $ - $ - $ - $ 6,388 Borrowings 12,117 356 4,759 8,479 - 25,711 Derivative liabilities 13,778 1,884 39 3,021 (17,169) 1,553 Payables and other liabilities 1,393 29 48 239 - 1,709 Total liabilities $ 33,404 $ 2,541 $ 4,846 $ 11,739 $ (17,169) $ 35,361 NOTE T – SEGMENT REPORTING For management purposes, IFC’s business comprises two segments: client services and treasury services. The client services segment consists primarily of lending, investing in debt and equity securities, and advisory services activities. Operationally, the treasury services segment consists of the borrowing, liquid asset management, asset and liability management and client risk management activities. Consistent with internal reporting, net income or expense from asset and liability management and client risk management activities in support of client services is allocated to the client services segment. The assessment of segment performance by senior management includes net income for each segment, return on assets, and return on capital employed. IFC’s management reporting system and policies are used to determine revenues and expenses attributable to each segment. Consistent with internal reporting, administrative expenses are allocated to each segment based largely upon personnel costs and segment headcounts. Transactions between segments are immaterial and, thus, are not a factor in reconciling to the consolidated data.

p78
Page 84 INTERNATIONAL FINANCE CORPORATION
NOTES TO CONSOLIDATED FINANCIAL STATEMENTS
An analysis of IFC’s major components of income and expense by business segment for the years ended June 30, 2010, June 30, 2009 and June 30, 2008, is given below (US$ millions): 2010 2009 2008 Client Treasury Client Treasury Client Treasury services services Total services services Total services services Total Income from loans and guarantees $ 786 $ 15 $ 801 $ 857 $ 14 $ 871 $ 1,054 $ 11 $ 1,065 Provision for losses on loans and guarantees (155) - (155) (438) - (438) (38) - (38) Income (loss) from equity investments 1,638 - 1,638 (42) - (42) 1,688 - 1,688 Income from debt securities 108 - 108 71 - 71 163 - 163 Income from liquid asset trading activities - 815 815 - 474 474 - 473 473 Charges on borrowings (117) (46) (163) (303) (185) (488) (528) (254) (782) Other income 176 - 176 153 - 153 113 - 113 Other expenses (730) (13) (743) (617) (12) (629) (547) (8) (555) Foreign currency transaction (losses) gains on non-trading activities (82) - (82) 10 - 10 (39) - (39) Expenditures for advisory services (101) - (101) (129) - (129) (123) - (123) Expenditures for performance -based grants and for IFC SME Ventures for IDA countries (9) - (9) (6) - (6) (27) - (27) Net (losses) gains on other non-trading financial instruments accounted for at fair value (113) (226) (339) 71 381 452 92 17 109 Grants to IDA (200) - (200) (450) - (450) (500) - (500) Net income (loss) $ 1,201 $ 545 $ 1,746 $ (823) $ 672 $ (151) $ 1,308 $ 239 $ 1,547 Geographical segment data in respect of client services is disclosed in Note D, and the composition of Liquid Assets is provided in Note C. NOTE U – VARIABLE INTEREST ENTITIES An entity is subject to the ASC 810 VIE Subsections and is called a variable interest entity (VIE) if it lacks: (1) equity that is sufficient to permit the entity to finance its activities without additional subordinated financial support from other parties; or (2) equity investors who have decision-making rights about the entity’s operations or if it has equity investors who do not absorb the expected losses or receive the expected returns of the entity proportionally to their voting rights. A VIE is consolidated by its primary beneficiary, which is the party involved with the VIE that absorbs a majority of the expected losses or receives a majority of the expected residual returns or both. An enterprise may hold significant variable interests in VIEs, which are not consolidated because the enterprise is not the primary beneficiary. Primary beneficiary IFC has identified three VIEs in which IFC is deemed to be the primary beneficiary at June 30, 2010, and which have been consolidated into these consolidated financial statements. In October 2009, IFC created a special purpose vehicle, Hilal Sukuk Company, to facilitate a $100 million Sukuk under IFC’s borrowings program. Hilal Sukuk Company is a variable interest entity of which IFC is deemed to be primary beneficiary. Accordingly, it has been consolidated into these consolidated financial statements. The consolidation of Hilal Sukuk Company had no material impact on these consolidated financial statements. The other two consolidated VIEs are in the Collective investment vehicles sector in the Latin America and Caribbean region. As a result of the consolidation of the two investments described above, IFC’s consolidated balance sheet at June 30, 2010 includes additional assets of $14 million in equity investments ($10 million - June 30, 2009), $1 million in receivables and other assets ($0 - June 30, 2009), and additional liabilities of $4 million in payables and other liabilities ($3 million - June 30, 2009). Related to the consolidation of these VIEs, other income includes$10 million during the year ended June 30, 2010 ($2 million - year ended June 30, 2009 and $7 million - year ended June 30, 2008) and other expenses includes $6 million during the year ended June 30, 2010 ($12 million - year ended June 30, 2009 and $1 million - year ended June 30, 2008).

p79
Page 85 INTERNATIONAL FINANCE CORPORATION
NOTES TO CONSOLIDATED FINANCIAL STATEMENTS
Significant variable interests IFC has identified 104 investments in VIEs in which IFC is not the primary beneficiary but in which it is deemed to hold significant variable interests at June 30, 2010 (83 investments - June 30, 2009). The majority of these VIEs do not involve securitizations or other types of structured financing. IFC is usually the minority investor in these VIEs. These VIEs are mainly: (a) investment funds, where the general partner or fund manager does not have substantive equity at risk; (b) operating entities where the total equity investment is considered insufficient to permit such entity to finance its activities without additional subordinated financial support; and (c) entities where the operating activities are so narrowly defined by contracts (e.g. concession contracts) that equity investors are considered to lack decision making ability. IFC’s involvement with these VIEs includes investments in equity interests and senior or subordinated interests, guarantees and risk management arrangements. These VIEs are recorded on IFC’s consolidated balance sheet primarily in equity investments, loans, debt securities, and other liabilities, as appropriate. Based on the most recent available data from these VIEs, the size, including committed funding, of the VIEs in which IFC is deemed to hold significant variable interests totaled $12,424 million at June 30, 2010 ($9,552 million - June 30, 2009). IFC’s total investment in and maximum exposure to loss to these investments in VIEs in which IFC is deemed to hold significant variable interests, comprising both disbursed amounts and amounts committed but not yet disbursed, was $3,260 million at June 30, 2010 ($2,817 million - June 30, 2009). The sector and geographical regional analysis of IFC’s investments in and arrangements with these VIEs at June 30, 2010 is as follows (US$ millions): June 30, 2010 Sector Equity Debt Risk Loans investments securities Guarantees management Total Transportation and warehousing $ 505 $ 41 $ 5 $ - $ 8 $ 559 Utilities, oil, gas and mining 460 70 10 7 - 547 Electric power 465 5 4 - - 474 Finance and insurance 216 29 113 3 14 375 Collective investment vehicles 31 250 - - - 281 Information 203 12 8 - - 223 Food and beverages 138 10 5 - - 153 Primary metals 95 - - - - 95 Construction and real estate 91 2 - - - 93 Agriculture and forestry 82 3 - - - 85 Nonmetallic mineral product manufacturing 41 43 - - - 84 Industrial and consumer products 72 4 - - - 76 Wholesale and retail trade 54 15 5 - - 74 Health care 20 20 - - - 40 Accommodation and tourism services 34 3 - - - 37 Pulp and paper 31 - - - - 31 Textiles, apparel and leather 20 2 - - - 22 Other 11 - - - - 11 Total VIE investments $ 2,569 $ 509 $ 150 $ 10 $ 22 $ 3,260 June 30, 2010 Geographical Region Equity Debt Risk Loans investments securities Guarantees management Total Asia $ 1,086 $ 99 $ 63 $ - $ - $ 1,248 Europe and Central Asia 444 90 11 - - 545 Latin America and Caribbean 397 104 14 7 6 528 Middle East and North Africa 327 62 - - 2 391 Sub-Saharan Africa 204 59 - 3 - 266 Other 111 95 62 - 14 282 Total VIE investments $ 2,569 $ 509 $ 150 $ 10 $ 22 $ 3,260

p80
Page 86 INTERNATIONAL FINANCE CORPORATION
NOTES TO CONSOLIDATED FINANCIAL STATEMENTS
NOTE V – PENSION AND OTHER POSTRETIREMENT BENEFITS
IBRD, IFC and MIGA participate in a defined benefit Staff Retirement Plan (SRP), a Retired Staff Benefits Plan (RSBP) and a Post-Employment Benefits Plan (PEBP) that cover substantially all of their staff members.
The SRP provides pension benefits and includes a cash balance plan. The RSBP provides certain health and life insurance benefits to eligible retirees. The PEBP provides certain pension benefits administered outside the SRP. IFC uses a June 30 measurement date for its pension and other postretirement benefit plans. The amounts presented below reflect IFC’s respective share of the costs, assets and liabilities of the plans. All costs, assets and liabilities associated with these plans are allocated between IBRD, IFC and MIGA based upon their employees’ respective participation in the plans. Costs allocated to IBRD are then shared between IBRD and IDA based on an agreed cost sharing ratio. IDA, IFC and MIGA reimburse IBRD for their proportionate share of any contributions made to these plans by IBRD. Contributions to these plans are calculated as a percentage of salary. The following table summarizes the benefit costs associated with the SRP, RSBP, and PEBP allocated to IFC for the fiscal years ended June 30, 2010, June 30, 2009 and June 30 2008 (US$ millions): SRP RSBP PEBP 2010 2009 2008 2010 2009 2008 2010 2009 2008 Benefit cost Service cost $ 60 $ 69 $ 64 $ 12 $ 12 $ 10 $ 6 $ 5 $ 4 Interest cost 107 109 92 14 14 11 5 5 3 Expected return on plan assets (141) (172) (169) (14) (16) (15) - - - Amortization of prior service cost 2 2 2 * * - * * - Amortization of unrecog- nized net loss 11 - - 5 3 1 2 3 - Net periodic pension cost (income) $ 39 $ 8 $ (11) $ 17 $ 13 $ 7 $ 13 $ 13 $ 7 * Less than $0.5 million
The expenses for the SRP, RSBP, and PEBP are included in expense from pension and other postretirement benefit plans. For the fiscal years ended June 30, 2010, June 30, 2009 and June 30, 2008, expenses for these plans of $69 million, $34 million and $3 million, respectively, were allocated to IFC. The following table summarizes the projected benefit obligations, fair value of plan assets, and funded status associated with the SRP, RSBP, and PEBP for IFC for the fiscal years ended June 30, 2010 and June 30, 2009 (US$ millions). Since the assets for the PEBP are not held in an irrevocable trust separate from the assets of IBRD, they do not qualify for off-balance sheet accounting and are therefore included in IBRD's investment portfolio. IFC has recognized a receivable (prepaid asset) from IBRD and a payable (liability) to IBRD equal to the amount required to support the plan. The assets of the PEBP are invested in fixed income instruments. SRP RSBP PEBP 2010 2009 2010 2009 2010 2009 Projected benefit obligations Beginning of year $ 1,555 $ 1,649 $ 208 $ 217 $ 77 $ 77 Service cost 60 69 12 12 6 5 Interest cost 107 109 14 14 5 5 Participant contributions 24 23 2 2 - - Plan amendment - 3 - - - - Benefits paid (78) (71) (5) (5) (4) (4) Actuarial loss (gain) 259 (227) 36 (32) 16 (6) End of year 1,927 1,555 267 208 100 77 Fair value of plan assets Beginning of year 1,815 2,239 176 198 - - Participant contributions 24 23 2 2 - - Actual return on assets 232 (392) 21 (36) - - Employer contributions 48 16 18 17 - - Benefits paid (78) (71) (5) (5) - - End of year 2,041 1,815 212 176 - - Funded status 114 260 (55) (32) (100) (77) Accumulated benefit obligations $ 1,388 $ 1,099 $ 267 $ 208 $ 91 $ 67

p81
Page 87 INTERNATIONAL FINANCE CORPORATION
NOTES TO CONSOLIDATED FINANCIAL STATEMENTS
The $114 million overfunded status relating to SRP at June 30, 2010 ($260 million - June 30, 2009), is included in receivables and other assets on the consolidated balance sheet. The following tables present the amounts included in accumulated other comprehensive income relating to Pension and Other Postretirement Benefits (US$ millions): Amounts included in accumulated other comprehensive income in fiscal year ended June 30, 2010: SRP RSBP PEBP Total Net actuarial loss $ 329 $ 102 $ 60 $ 490 Prior service cost 7 - 1 8 Net amount recognized in accumulated other comprehensive income $ 336 $ 102 $ 61 $ 498
Amounts recognized in accumulated other comprehensive income in fiscal year ended June 30, 2009: SRP RSBP PEBP Total Net actuarial loss $ 172 $ 78 $ 46 $ 296 Prior service cost 9 - 1 10 Net amount recognized in accumulated other comprehensive income $ 181 $ 78 $ 47 $ 306
The estimated amounts that will be amortized from accumulated other comprehensive income into net periodic benefit cost in the fiscal year ending June 30, 2010 are as follows (US$ millions):
SRP RSBP PEBP Total Net actuarial loss $ 20 $ 6 $ 3 $ 29 Prior service cost 2 - - 2 Amount estimated to be amortized into net periodic benefit cost $ 22 $ 6 $ 3 $ 31 Assumptions The actuarial assumptions used are based on financial market interest rates, past experience, and management’s best estimate of future benefit changes and economic conditions. Changes in these assumptions will impact future benefit costs and obligations. The expected long-term rate of return for the SRP assets is a weighted average of the expected long-term (10 years or more) returns for the various asset classes, weighted by the portfolio allocation. Asset class returns are developed using a forward-looking building block approach and are not strictly based on historical returns. Equity returns are generally developed as the sum of expected inflation, expected real earnings growth and expected long-term dividend yield. Bond returns are generally developed as the sum of expected inflation, real bond yield, and risk premium/spread (as appropriate). Other asset class returns are derived from their relationship to equity and bond markets. The expected long-term rate of return for the RSBP is computed using procedures similar to those used for the SRP. The discount rate used in determining the benefit obligation is selected by reference to the year-end AAA and AA corporate bonds. Actuarial gains and losses occur when actual results are different from expected results. Amortization of these unrecognized gains and losses will be included in income if, at the beginning of the fiscal year, they exceed 10 percent of the greater of the projected benefit obligation or the market-related value of plan assets. If required, the unrecognized gains and losses are amortized over the expected average remaining service lives of the employee group.

p82
Page 88 INTERNATIONAL FINANCE CORPORATION
NOTES TO CONSOLIDATED FINANCIAL STATEMENTS The following tables present the weighted-average assumptions used in determining the projected benefit obligations and the net periodic pension costs for the fiscal years ended June 30, 2010, June 30, 2009 and June 30, 2008: Weighted average assumptions used to determine projected benefit obligation (%) SRP RSBP PEBP 2010 2009 2008 2010 2009 2008 2010 2009 2008 Discount rate 5.75 7.00 6.75 6.00 7.00 6.75 5.75 7.00 6.75 Rate of compensation increase 6.20 6.70 7.00 6.20 6.70 7.00 Health care growth rates - at end of fiscal year 7.00 7.00 7.25 Ultimate health care growth rate 4.25 4.75 5.50 Year in which ultimate rate is reached 2022 2017 2016 Weighted average assumptions used to determine net periodic pension cost (%) SRP RSBP PEBP 2010 2009 2008 2010 2009 2008 2010 2009 2008 Discount rate 7.00 6.75 6.25 7.00 6.75 6.25 7.00 6.75 6.25 Expected return on plan assets 7.75 7.75 7.75 7.75 8.25 8.25 Rate of compensation increase 6.70 7.00 6.50 6.70 7.30 6.50 Health care growth rates: -at end of fiscal year 7.00 7.25 6.80 Ultimate health care growth rate 4.75 5.50 4.75 Year in which ultimate rate Is reached 2017 2016 2012 The medical cost trend rate can significantly affect the reported postretirement benefit income or costs and benefit obligations for the RSBP. The following table shows the effects of a one-percentage-point change in the assumed healthcare cost trend rate (US$ millions): One-percentage-point increase One-percentage-point decrease Effect on total service and interest cost $ 7 $ (5) Effect on postretirement benefit obligation 52 (41) Investment strategy The investment policies establish the framework for investment of the plan assets based on long-term investment objectives and the trade-offs inherent in seeking higher investment returns while also managing risk. A key component of the investment policy is to establish a strategic asset allocation representing the policy portfolio (neutral mix of assets) around which the plans are invested. The strategic asset allocations for the plans are reviewed in detail and reset about every three to five years, with an annual review of key assumptions.
The key long-term objective is to target and secure asset performance that is reasonable in relation to the growth rate of the underlying liabilities and the assumed sponsor contribution rates. This is particularly so in the case of the SRP, which has liabilities that can be projected with a reasonable level of confidence based on the actuarial assumptions. Portion of the SRP portfolio is dedicated to partially hedging the real interest rate risk inherent in the plan liabilities using US Treasury inflation-protected securities (TIPS). Given the relatively long investment horizons of the SRP and RSBP of approximately 10 years, and the relatively modest liquidity needs over the short-term to pay benefits and meet other cash requirements, the focus of the investment strategy is on generating sustainable long-term investment returns through various assets classes and strategies including equity, quasi-equity, private equity and real estate.
The strategic asset allocation is derived using a mix of quantitative analysis that incorporates expected returns and volatilities by asset class as well as correlations across the asset classes, and qualitative considerations such as desired liquidity needs of the plans. The strategic asset allocation is comprised of a diversified portfolio drawn from among fixed-income, equity, real return and absolute return strategies. The target asset allocations for the SRP and RSBP were approved in October 2007 and February 2009, respectively.

p83
Page 89 INTERNATIONAL FINANCE CORPORATION
NOTES TO CONSOLIDATED FINANCIAL STATEMENTS The following table presents the actual and target asset allocation at June 30, 2010 and June 30, 2009 by asset category for the SRP and RSRP (%). SRP RSBP Target % of Plan assets Target % of Plan assets allocation allocation 2010 2010 2009 2010 2010 2009 Asset class Fixed income 26.0 40.6 37.0 31.5 35.7 34.0 Listed equity 14.0 15.5 16.0 24.0 22.6 23.0 Private equity 15.0 19.8 17.3 22.0 25.6 23.0 Real estate 12.5 7.4 7.5 6.0 5.7 6.0 Hedge funds and active overlay 25.0 13.3 18.4 16.5 10.4 14.0 Timber 2.5 0.6 0.4 - - - Infrastructure 2.5 1.0 0.7 - - - Commodities 2.5 1.8 2.7 - - - Total 100.0 100.0 100.0 100.0 100.0 100.0 Concentrations of Risk in Plan Assets
The assets of the SRP and RSBP are diversified across a variety of asset classes. Investments in these asset classes are further diversified across funds, managers, strategies, geographies and sectors to limit the impact of any individual investment. Despite such level of diversification, equity market risk remains the primary source of the plan overall return volatility.
Risk management practices Risk management is an integral part of managing the assets of the plans. Liability driven management and asset diversification are central to the overall investment strategy and risk management approach for the SRP. The surplus volatility risk (defined as annualized deviation of asset returns relative to that of liabilities) is considered the primary indicator of the SRP overall investment risk in the asset allocation process. The investment risk is regularly monitored at the absolute level, as well as at the relative levels with respect to policy benchmarks and in the case of the SRP, to the liabilities. Credit risk is initiated through the application of the eligibility criteria and concentration limits for transactions with individual issues. Counterparty risk exposure on over-the-counter derivatives is mitigated through the use of master netting arrangements and collateral. The Plan manages its liquidity risk primarily by investing a portion of the asset base in securities that are either very liquid or can be liquidated at a fairly short notice and at a reasonable price. The level of illiquid asset classes appropriate in the portfolio also takes into account projected liquidity requirements. Risk management for different asset classes is tailored to their specific characteristics and is an integral part of external manager due diligence. In addition, monitoring of performance (both manager and asset class) against benchmarks and compliance with investment guidelines are carried out as part of the risk monitoring process.

p84
Page 90 INTERNATIONAL FINANCE CORPORATION
NOTES TO CONSOLIDATED FINANCIAL STATEMENTS
Fair value measurements
All plan assets are measured at fair value on recurring basis. The following table presents the fair value hierarchy of major categories of plans assets as of June 30, 2010 (US$ millions):
Fair value measurements on a recurring basis SRP RSBP Level 1 Level 2 Level 3 Total Level 1 Level 2 Level 3 Total
Debt securities Time Deposits $ - $ 32 $ - $ 32 $ - $ 3 $ - $ 3 Securities purchased under resale agreements 42 - - 42 6 - - 6 Government and agency securities 508 39 - 547 19 29 - 48 Corporate and convertible bonds - 86 1 87 - 16 - 16 Asset-backed securities - 22 9 31 - 1 * 1 Mortgage-backed securities - 127 4 131 - 3 * 3 Total Debt securities 550 306 14 870 25 52 * 77 Equity securities US common stocks 51 - - 51 5 - - 5 Non-US common stocks 162 - - 162 19 - - 19 Mutual funds 9 - - 9 1 - - 1 Real estate investment trusts (REITS) 33 - - 33 * - - * Total Equity securities 255 - - 255 25 - - 25 Commingled funds - 104 - 104 - 22 - 22 Private equity - - 406 406 - - 55 55 Hedge funds - 213 78 291 - 15 7 22 Derivative assets /liabilities 1 (1) - - - 1 - 1 Short sales - (2) - (2) - - - - Real estate (including Infrastructure and timber - - 136 136 - - 12 12 Other assets /liabilities**, net - - - (19) - - - (1) Total Assets $ 806 $ 620 $ 634 $ 2,041 $ 50 $ 90 $ 74 $ 213 * Less than $0.5 million. ** Includes receivables and payables carried at amounts that approximate fair value. Valuation methods and assumptions
In December 2009, FASB issued ASU 2009-12, Investments in Certain Entities that Calculate Net Asset Value per Share (or its Equivalent). The ASU reduces complexity and improves consistency and comparability in the application of Fair Value Measurement and Disclosure guidance. The ASU is applicable for investors who report investments that utilize net asset value (NAV) for fair value and is therefore applicable for IBRD’s pension plans.
The following are general descriptions of asset categories, as well as the valuation methodologies and inputs used to determine the fair value of each major category of plan assets. It is important to note that the investment amounts in the asset categories shown in the table above may be different from the asset category allocation shown in the Investment Strategy section of the note. Asset classes in the table above are grouped by the characteristics of the investments held. The asset class break-down in the Investment Strategy section is based on management’s view of the economic exposures after considering the impact of derivatives and certain trading strategies.
Debt securities
Debt securities include time deposits, U.S. treasuries and agencies, debt obligations of foreign governments and debt obligations in corporations of domestic and foreign issuers. Fixed income also includes investments in asset backed securities such as collateralized mortgage obligations and mortgage backed securities. These securities are valued by independent pricing vendors at quoted market prices for the same or similar securities, where available. If quoted market prices are not available, fair values are based on discounted cash flow models using market-based parameters such as yield curves, interest rates, volatilities, foreign exchange rates and credit curves. Some debt securities are valued using techniques which require significant unobservable inputs. The selection of these inputs may involve some judgment. Plan management believes its estimates of fair value are reasonable given its processes for obtaining securities prices from multiple independent third-party vendors, ensuring that valuation models are reviewed and validated, and applying its approach consistently from period to period. Unless quoted prices are available, money market instruments and securities purchased under resale agreements are reported at face value which approximates fair value.
Equity securities
Equity securities (including REITS) are invested in companies in various industries and countries. Investments in public equity listed on securities exchanges are valued at the last reported sale price on the last business day of the fiscal year.

p85
Page 91 INTERNATIONAL FINANCE CORPORATION
NOTES TO CONSOLIDATED FINANCIAL STATEMENTS
Commingled funds
Commingled funds are typically common or collective trusts reported at NAV as provided by the investment manager or sponsor of the fund based on valuation of underlying investments, and reviewed by management.
Private equity
Private equity includes investments primarily in leveraged buyouts, distressed investments and venture capital funds across North America, Europe and Asia in a variety of sectors. A large number of these funds are in the investment phase of their life cycle. Private Equity investments do not have a readily determinable fair market value and are reported at NAV provided by the fund managers, and reviewed by management, taking into consideration the latest audited financial statements of the funds. The underlying investments are valued using inputs such as cost, operating results, discounted future cash flows and trading multiples of comparable public securities.
Real estate
Real estate includes several funds which invest in core real estate as well as non-core type of real estate investments such as debt, value add, and opportunistic equity investments. Real estate investments do not have a readily determinable fair market value and are reported at NAV provided by the fund managers, and reviewed by management, taking into consideration the latest audited financial statements of the funds. The valuations of underlying investments are based on income and/or cost approaches or comparable sales approach, and taking into account discount and capitalization rates, financial conditions, local market conditions among others.
Hedge fund investments
Hedge fund investments include those seeking to maximize absolute returns using a broad range of strategies to enhance returns and provide additional diversification. Hedge Funds include investments in equity, event driven, fixed income, multi strategy and macro relative value strategies. These investments do not have a readily determinable fair market value and are reported at NAVs provided by external managers or fund administrators (based on the valuations of underlying investments) on a monthly basis, and reviewed by management, taking into consideration the latest audited financial statements of the funds.
Investments in hedge funds and commingled funds can typically be redeemed at NAV within the near term while investments in private equity and real estate are inherently long term and illiquid in nature with a quarter lag in reporting by the fund managers. For the June 30, 2010 reporting of those asset classes with a reporting lag, management estimates are based on the latest available information taking into account underlying market fundamentals and significant events through the balance sheet date.
Investment in derivatives
Investment in derivatives such as equity or bond futures, swaps, options and currency forwards are used to achieve a variety of objectives that include hedging interest rates and currency risks, gaining desired market exposure of a security, an index or currency exposure and rebalancing the portfolio. Over-the-counter derivatives are reported using valuations based on discounted cash flow methods incorporating market observable inputs.
The following tables present a reconciliation of Level 3 assets held during the year ended June 30, 2010. A large number of hedge fund investments that are redeemable within 90 days of the period end were transferred out of Level 3 into Level 2 following new additional guidance provided by the accounting standard setters (US$ millions): SRP: Fair value measurements using significant unobservable inputs
Corporate Asset- Mortgage- Private Real Hedge Total and backed backed equity estate funds
convertible securities securities debt
__________________________________________________________________________________________________________________ Beginning of the fiscal year $ 1 $ 6 $ 31 $ 320 $ 113 $ 318 $ 789 Actual return on plan assets: Relating to assets still held at the reporting date * 1 4 50 (3) 59 111 Relating to assets sold during the period * 1 * 23 2 8 34 Purchase, issuance and settlements, net * 2 (3) 13 24 (113) (77) Transfers in (out) * (1) (28) - - (194) (223) Balance at end of fiscal year $ 1 $ 9 $ 4 $ 406 $ 136 $ 78 $ 634 * Less than $0.5 million

p86
Page 92 INTERNATIONAL FINANCE CORPORATION
NOTES TO CONSOLIDATED FINANCIAL STATEMENTS
RSBP: Fair value measurements using significant unobservable inputs Corporate Asset- Mortgage- Private Real Hedge Total
And backed backed Equity Estate Funds Convertible Securities Securities Debt
__________________________________________________________________________________________________________________ Beginning of the fiscal year $ * $ 1 $ 1 $ 43 $ 10 $ 25 $ 80 Actual return on plan assets: Relating to assets still held at the reporting date - - * 7 (1) 2 8 Relating to assets sold during the period - - - 3 * 1 4 Purchase, issuance and settlements, net - (1) * 2 3 (9) (5) Transfers in (out) - * (1) - - (12) (13) Balance at end of fiscal year $ * $ * $ * $ 55 $ 12 $ 7 $ 74 * Less than $0.5 million
Estimated future benefits payments The following table shows the benefit payments expected to be paid in each of the next five years and subsequent five years. The expected benefit payments are based on the same assumptions used to measure the benefit obligation at June 30, 2010 (US$ millions): SRP RSBP PEBP Before Medicare Medicare Part D subsidy Part D subsidy July 1, 2010 - June 30, 2011 $ 75 $ 5 $ - $ 6 July 1, 2011 - June 30, 2012 81 5 - 6 July 1, 2012 - June 30, 2013 88 6 - 7 July 1, 2013 - June 30, 2014 94 7 - 7 July 1, 2014 - June 30, 2015 100 8 - 8 July 1, 2015 - June 30, 2020 597 57 1 48 Expected contributions IFC’s contribution to the SRP and RSBP varies from year to year, as determined by the Pension Finance Committee, which bases its judgment on the results of annual actuarial valuations of the assets and liabilities of the SRP and RSBP. The best estimate of the amount of contributions expected to be paid to the SRP and RSBP for IFC during the fiscal year beginning July 1, 2010 is $50 million and $22 million, respectively. NOTE W – SERVICE AND SUPPORT PAYMENTS IFC obtains certain administrative and overhead services from IBRD in those areas where common services can be efficiently provided by IBRD. This includes shared costs of the Boards of Governors and Directors, and other services such as communications, internal auditing, administrative support, supplies, and insurance. IFC makes payments for these services to IBRD based on negotiated fees, chargebacks and allocated charges, where chargeback is not feasible. Expenses allocated to IFC for the year ended June 30, 2010, were $39 million ($41 million - year ended June 30, 2009; $34 million - year ended June 30, 2008).

p87
Page 93 INTERNATIONAL FINANCE CORPORATION
NOTES TO CONSOLIDATED FINANCIAL STATEMENTS
NOTE X – MANAGEMENT OF TRUST FUNDS Donor funds for Advisory Services and Other Initiatives IFC administers funds received from and on behalf of donors and/or partners (Trust Funds) that are restricted for specific uses in accordance with applicable administration agreements and/or fiscal agency agreements. Specified uses could include, for example, Advisory Services work including feasibility studies, project preparation, implementation of global and regional programs, and research and training programs. IFC may also make contributions to these specific uses of funds in accordance with terms approved by IFC’s Board. The IFC contributions can be commingled with donor funds under administration in accordance with administration agreements with donors or fiscal agency agreements, where applicable. The IFC contributions and donor funds are placed in trust and are held in a separate investment portfolio, managed by IBRD, which is not commingled with IFC’s liquid assets. IFC funding is included in the consolidated balance sheet of IFC until such time as IFC cedes control of the funds to the recipient. Execution may be carried out through: a recipient-executed trust fund, an IFC-executed trust fund or a financial intermediary fund. IFC-executed Trust Funds involve IFC execution of activities as described in relevant administration agreements or IFC Board documents, which define the terms and conditions for use of the funds. Spending authority is exercised by IFC, subject to any restrictions contained in the administration agreements. Recipient-executed Trust Funds involve activities carried out by a recipient third-party "executing agency." IFC enters into agreements with and disburses funds to these recipients, who then exercise spending authority to meet the objectives and comply with terms stipulated in the agreements. IFC also enters into financial intermediary fund arrangements under which IFC’s services are limited to the role of fiscal agent pursuant to a fiscal agency agreement. Such funds are to be held and disbursed in accordance with the fiscal agency agreement. Donor funds for investment purposes IFC also administers donor funds received for investment purposes through Trust Funds. Investments with donor funds are made by IFC as a trustee or implementing entity for the account of donors, and thus IFC does not bear the financial risk nor is entitled to the financial benefits of these donor-funded investments. Therefore, funds received from donors and investments made by IFC for the account of donors are not recognized on IFC’s consolidated balance sheet. Funds received from donors for investment purposes amounted to $1,042 million at June 30, 2010 ($122 million at June 30, 2009). Disbursements from such donor funds amounted to $785 million at June 30, 2010 ($37 million at June 30, 2009). Guarantees committed by donors amounted to $44 million at June 30, 2010 ($38 million at June 30, 2009). NOTE Y – CONTINGENCIES In the normal course of its business, IFC is from time to time named as a defendant or co-defendant in various legal actions on different grounds in various jurisdictions. Although there can be no assurances, based on the information currently available, IFC’s Management does not believe the outcome of any of the various existing legal actions will have a material adverse effect on IFC’s financial position, results of operations or cash flows.

p88
Page 90 INTERNATIONAL FINANCE CORPORATION
INDEPENDENT AUDITORS REPORT

p89
PROJECT COMMITMENTS
PROJECT COMMITMENTS
This table includes projects signed and processed during FY10. All amounts are given in U.S. dollars, regardless of the currency of the transaction.
Under the Global Trade Finance Program, IFC provides guaran-tee coverage of bank risk in emerging markets, where confi rming banks need risk mitigation to support their export clients because of limited capacity for country and bank exposure.
NOTE ON CATEGORIZATION OF PROJECTS:
Projects are assigned a category of A, B, or C, according to their potential environmental and social impacts – or FI, in the case of investments through fi nancial intermediaries that on-lend to clients whose projects may present environmental and social risks.
Category A: Projects with potential signifi cant adverse social or environmental impacts that are diverse, irreversible, or unprecedented.
Category B: Projects with potential limited adverse social or environ-mental impacts that are few in number, generally site-specifi c, largely reversible, and readily addressed through mitigation measures.
Category C: Projects with minimal or no adverse social or envi-ronmental impacts, including certain fi nancial intermediary (FI) projects with minimal or no adverse risks.
Category FI: All FI projects excluding those that are Category C projects. FI projects are required to establish and maintain a Social and Environmental Management System to ensure that their investments meet IFC’s requirements.

p90
PROJECT COMMITMENTS Fiscal Year 2010
IFC Region Country Name Company Name
Environment & Social
Category Code
IFC Loan & Quasi-Loan
Commitments ($)
EUROPE AND CENTRAL ASIA
Albania National Commercial Bank Sh.A. C 0
Armenia ACBA Leasing FI 3,000,000
Armeconombank C 0
Ameriabank CJSC FI 15,000,000
Elite Group CJSC B 5,400,000
Azerbaijan AzeriGazbank C 0
DEMIRBANK OJSC C 0
UniBank C 0
JSC Bank Respublika FI 20,000,000
Belarus Priorbank Joint Stock Company C 0
JSC Belgazprombank C 0
Detroit Belarus Juice Co. B 0
MINSK TRANSIT BANK C 0
Belarusian Bank for Small Business FI 5,000,000
JSC BPS-BANK (Formerly Belpromstroibank) C 0
OMA LLC B 7,000,000
Belarusky Narodny Bank FI 5,000,000
Bosnia and Herzegovina Raiffeisen Bank d.d. Bosnia and Herzegovina C 0
Bulgaria Schwarz Group B 22,548,000
Kronospan Bulgaria EOOD B 24,822,000
Georgia TBC Bank C 0
Bank of Georgia C 0
JSC Bank Republic FI 20,000,000
HungaryOrszagos Takarekpenztar es Kereskedelmi Bank Rt
C 0
Kazakhstan Bank CenterCredit FI 85,000,000
Kaspi Bank C 0
JSC ATF Bank FI 60,000,000
Ust-Kamenogorsk Poultry Farm JSC B 2,000,000
Kyrgyz Republic UniCredit Bank OJSC FI 10,000,000
Macedonia, Former Yugoslav NLB Tutunska banka, A.D. Skopje FI 33,966,250
Republic of Moldova RED UNION FENOSA S.A. B 15,000,000
BC Moldova Agroindbank S.A. FI 15,000,000
Poland Fundusz Mikro SP. Z.O.O. FI 14,725,475
Republic of Kosovo Newko Balkan LLC B 6,453,720
Romania Schwarz Group B 52,612,000
ProCredit Bank S.A. C 0
Banca Transilvania S.A. FI 71,385,000
MedLife S.A. B 12,411,000
Russian Federation NBD Bank C 0
Open Joint Stock Company Commercial Bank “Center-invest”
FI 30,985,760
Sevtekhnotrans B 30,000,000
Vyksa Steel Works B 70,000,000
Credit Bank of Moscow FI 40,000,000
RosEvroBank Joint Stock Commercial Bank C 0
Forus Bank C 0
ZAO Locko Bank C 0
PromSvyazBank C 0

p91
IFC Equity & Quasi-Equity
Commitments ($)
Risk Management
Commitments ($)
Trade Finance Guarantee
Commitments ($)
Non-Trade Finance Guarantee
Commitments ($)
Total Commitments for IFC’s
Own Account ($)
Syndications Commitments
($)
0 0 2,276,546 0 2,276,546 0
0 0 0 0 3,000,000 0
0 0 1,021,671 0 1,021,671 0
0 0 10,058,131 0 25,058,131 0
0 0 0 0 5,400,000 0
0 0 2,247,855 0 2,247,855 0
0 0 3,752,096 0 3,752,096 0
0 0 2,477,925 0 2,477,925 0
0 0 1,343,909 0 21,343,909 0
0 0 598,608 0 598,608 0
0 0 23,207,542 0 23,207,542 0
1,326,096 0 0 0 1,326,096 0
0 0 2,902,996 0 2,902,996 0
0 0 0 0 5,000,000 0
0 0 15,067,196 0 15,067,196 0
0 0 0 0 7,000,000 0
8,336,984 0 61,462 0 13,398,447 0
0 0 1,703,973 0 1,703,973 0
0 0 0 0 22,548,000 14,398,000
0 0 0 0 24,822,000 0
0 2,000,000 0 0 2,000,000 0
0 5,000,000 9,327,990 0 14,327,990 0
0 0 382,710 0 20,382,710 0
0 0 0 430,342 430,342 0
100,000,000 0 84,966,611 0 269,966,611 0
0 0 4,024,880 0 4,024,880 0
0 0 0 0 60,000,000 0
0 0 0 0 2,000,000 0
0 0 0 0 10,000,000 0
0 0 0 0 33,966,250 0
0 0 0 0 15,000,000 0
0 0 0 0 15,000,000 0
0 0 0 0 14,725,475 0
0 0 0 0 6,453,720 0
0 0 0 0 52,612,000 43,194,000
2,723,575 0 0 0 2,723,575 0
0 0 0 0 71,385,000 0
0 0 0 0 12,411,000 0
0 0 247,460 0 247,460 0
0 0 0 0 30,985,760 0
0 0 0 0 30,000,000 0
0 0 0 0 70,000,000 0
0 0 133,334,281 0 173,334,281 0
0 0 10,488,984 0 10,488,984 0
0 2,000,000 0 0 2,000,000 0
0 0 36,908,481 0 36,908,481 0
0 0 1,444,999 0 1,444,999 0

p92
IFC Region Country Name Company Name
Environment & Social
Category Code
IFC Loan & Quasi-Loan
Commitments ($)
EUROPE AND CENTRAL ASIA
MDM Bank C 0
Asian-Pacifi c Bank (Open joint-stock company)
C 0
Asteros Technology Solutions Holding Ltd. C 0
Avtokran OJSC B 27,084,672
Municipal Unitarian Enterprise Ufavodokanal B 17,214,311
ZAO Monocrystal B 10,000,000
Republic of Maryi El B 20,003,334
Brunswick Leasing Limited C 0
Transcapitalbank FI 30,000,000
FactorRus C 0
OOO Northern Capital Gateway, Ltd. B 94,314,500
Borets International Ltd. B 50,000,000
OOO Logopark Don B 30,000,000
MDM Bank, Open Joint Stock Company FI 0
Kulon Yugros ZAO B 14,443,548
Russian Hotel Investments BV B 30,450,110
Serbia ProCredit Bank Serbia FI 24,822,000
Kronospan SRB d.o.o. B 29,786,400
Societe Generale Banka Srbija AD Beograd FI 49,644,000
Tajikistan First Microfi nance Bank of Tajikistan C 0
Open Joint Stock Company, Bank Eskhata C 0
Turkey Akbank FI 75,000,000
Finans Finansal Kiralama A.S. FI 40,000,000
Yapi Kredi Finansal Kiralama A.O. FI 45,000,000
Sekerbank T.A.S. FI 45,096,000
Sarten Ambalaj Sanayi ve Ticaret A.S. B 10,000,000
Eurasia CP Jersey L.P. FI 0
Akenerji Elektrik Uretim A.S. A 75,000,000
Assan Aluminyum Sanayi ve Ticaret Anonim Sirketi
B 0
TCE Ege Konteyner Terminal Isletmeleri A.S. B 20,000,000
Ukraine Raiffeisen Bank Aval C 0
CJSC Myronivsky Hliboproduct B 50,000,000
PJSC OTP Bank C 0
Evrotek Group B 0
Megabank FI 20,000,000
The State Export Import Bank of Ukraine C 0
Mriya Agro Holding Public Limited B 50,000,000
Globino Meat Processing Plant B 25,000,000
Uzbekistan Hamkorbank, Joint Stock Commercial Bank FI 2,000,000
Eastern Europe Region Coopest S.A. FI 4,943,050
Veolia Voda S.A. B 0
KG EOS Holding GmbH & Co. C 48,000,000
SVD22 B 0
Southern Europe Region Gorenje, d.d. B 62,055,000
CEE Special Situations Fund L.P. FI 0
ADM CEECAT Recovery Fund L.P. FI 0
Green for Growth Fund FI 31,337,775
PROJECT COMMITMENTS Fiscal Year 2010

p93
IFC Equity & Quasi-Equity
Commitments ($)
Risk Management
Commitments ($)
Trade Finance Guarantee
Commitments ($)
Non-Trade Finance Guarantee
Commitments ($)
Total Commitments for IFC’s
Own Account ($)
Syndications Commitments
($)
0 0 33,843,157 0 33,843,157 0
0 0 13,218,044 0 13,218,044 0
2,500,000 0 0 0 2,500,000 0
0 0 0 0 27,084,672 0
0 0 0 0 17,214,311 0
0 0 0 0 10,000,000 0
0 0 0 0 20,003,334 0
20,000,000 0 0 0 20,000,000 0
0 5,000,000 23,119,126 0 58,119,126 0
5,000,000 0 0 0 5,000,000 0
0 0 0 0 94,314,500 0
0 0 0 0 50,000,000 0
0 0 0 0 30,000,000 10,000,000
0 0 0 0 0 246,769,600
0 0 0 0 14,443,548 0
2,974,949 0 0 0 33,425,059 0
0 0 0 0 24,822,000 0
0 0 0 0 29,786,400 0
0 0 0 0 49,644,000 0
438,000 0 0 0 438,000 0
0 0 552,150 0 552,150 0
0 0 0 0 75,000,000 0
0 0 0 0 40,000,000 0
0 0 0 0 45,000,000 0
50,000,000 0 21,988,992 0 117,084,992 0
0 0 0 0 10,000,000 0
13,586,500 0 0 0 13,586,500 0
0 0 0 0 75,000,000 0
0 0 0 0 0 10,000,000
0 0 0 0 20,000,000 0
0 0 35,708,240 0 35,708,240 0
0 0 0 11,250,000 61,250,000 0
0 0 105,665 0 105,665 0
5,000,000 0 0 0 5,000,000 0
0 0 0 0 20,000,000 0
0 0 33,130,869 0 33,130,869 0
0 0 0 0 50,000,000 0
0 0 0 0 25,000,000 0
3,200,000 0 0 0 5,200,000 0
0 0 0 0 4,943,050 0
140,327,500 0 0 0 140,327,500 0
0 0 0 0 48,000,000 0
122,925,000 0 0 0 122,925,000 0
30,731,236 0 0 0 92,786,236 0
25,927,950 0 0 0 25,927,950 0
47,552,750 0 0 0 47,552,750 0
0 0 0 0 31,337,775 0

p94
PROJECT COMMITMENTS Fiscal Year 2010
IFC Region Country Name Company Name
Environment & Social
Category Code
IFC Loan & Quasi-Loan
Commitments ($)
EUROPE AND CENTRAL ASIA
Cambodia ACLEDA Bank Plc C 0
China Bank of Shanghai C 0
Industrial Bank C 0
BioVeda China Fund L.P. FI 0
Hangzhou Rural Cooperative Bank C 0
Neophotonics, Inc. C 0
Epure International Pte Ltd. B 34,000,000
Tianjin Binhai Rural Commercial Bank Corporation
C 0
MicroCred China C 0
Jiangsu Financial Leasing Co.,Ltd. FI 0
Yaohua Group B 30,000,000
Chengdu Small Enterprise Credit Guarantee Co., Ltd.
C 0
Deyang City Commercial Bank FI 0
Xiwang Sugar Holdings Company Limited B 20,000,000
Beijing Shuoren Hitech Energy Technology Co., Ltd.
C 5,000,000
Sanchuan Energy Development Co., Ltd. B 23,200,000
Asia Water Fund FI 0
Xi’an Yinqiao Biological Science and Technology Company, Ltd.
B 11,000,000
China WindPower Group Limited B 45,000,000
Healthway Medical Corporation Limited B 0
CFPA Microfi nance Management Co. FI 0
Universtar Science & Technology (Shenzhen) Co., Ltd.
B 0
Shenzhen VTB FI 0
Crane Medical Pte Ltd. B 15,000,000
Paedia Nutrition Company Ltd. B 4,000,000
Indonesia PT. Bank Hana Indonesia C 0
PT. Bank Hana Indonesia FI 15,000,000
Structured Student Financing Risk Sharing Facility
C 0
Bank Andara C 0
PT Jakarta International Container Terminal B 30,000,000
Bank BTPN FI 70,000,000
PT Trada Maritime Tbk B 35,000,000
Lao People’s Democratic Republic
ANZ Vientiane Commercial Bank Limited C 0
Mongolia XacBank Ltd. C 0
XacBank Ltd. FI 5,000,000
Khan Bank of Mongolia, Ulanbaatar, Mongolia C 0
Papua New Guinea Bank South Pacifi c FI 30,000,000
PNG MicroFinance C 0
Digicel (PNG) Limited C 80,000,000
K.K. Kingston Holdings Limited B 0
Philippines Banco de Oro Unibank Inc. FI 0
Bank of the Philippine Islands FI 0
SunPower Philippines Manufacturing Ltd. B 75,000,000
Solomon Islands Gold Ridge Mining Limited A 35,000,000
EAST ASIA AND PACIFIC

p95
IFC Equity & Quasi-Equity
Commitments ($)
Risk Management
Commitments ($)
Trade Finance Guarantee
Commitments ($)
Non-Trade Finance Guarantee
Commitments ($)
Total Commitments for IFC’s
Own Account ($)
Syndications Commitments
($)
0 0 515,362 0 515,362 0
38,380,405 0 0 0 38,380,405 0
21,326,809 0 0 0 21,326,809 0
30,000 0 0 0 30,000 0
16,373,332 0 300,000 0 16,673,332 0
2,000,000 0 0 0 2,000,000 0
0 0 0 0 34,000,000 0
36,618,501 0 0 0 36,618,501 0
1,257,351 0 0 0 1,257,351 0
21,279,098 0 0 0 21,279,098 0
0 0 0 0 30,000,000 0
12,000,000 0 0 0 12,000,000 0
31,329,146 0 0 0 31,329,146 0
5,000,000 0 0 0 25,000,000 0
3,000,000 0 0 0 8,000,000 0
2,450,000 0 0 0 25,650,000 0
20,000,000 0 0 0 20,000,000 0
0 0 0 0 11,000,000 0
10,000,000 0 0 0 55,000,000 0
10,000,000 0 0 0 10,000,000 0
5,770,484 0 0 0 5,770,484 0
20,000,000 0 0 0 20,000,000 0
2,930,017 0 0 0 2,930,017 0
0 0 0 0 15,000,000 0
0 0 0 0 4,000,000 0
5,000,000 0 0 0 5,000,000 0
0 0 0 0 15,000,000 0
0 0 0 2,380,820 2,380,820 0
2,056,927 0 0 0 2,056,927 0
0 0 0 0 30,000,000 40,000,000
0 0 0 0 70,000,000 0
0 0 0 0 35,000,000 0
400,000 0 0 0 400,000 0
1,324,841 0 0 0 1,324,841 0
0 0 0 0 5,000,000 0
0 0 808,840 0 808,840 0
53,871,433 0 0 0 83,871,433 0
178,173 0 0 0 178,173 0
0 0 0 0 80,000,000 0
3,922,675 0 0 0 3,922,675 0
22,500,000 0 0 0 22,500,000 0
0 0 0 21,299,255 21,299,255 0
0 0 0 0 75,000,000 0
0 0 0 0 35,000,000 0

p96
IFC Region Country Name Company Name
Environment & Social
Category Code
IFC Loan & Quasi-Loan
Commitments ($)
EUROPE AND CENTRAL ASIA
Thailand Standard Bank Plc FI 26,000,000
Solar Power (Korat 1) Company Limited B 0
Vietnam Asia Commercial Bank C 0
Saigon Thuong Tin Commercial Joint Stock Bank
C 0
Theodore Alexander HCM Ltd. B 10,000,000
Vietnam Technological and Commercial Joint Stock Bank
FI 24,000,000
Vietnam Export Import Commercial Joint Stock Bank
C 0
An Binh Commercial Joint Stock Bank C 0
Antara Holdings (Asia) Ltd. C 0
SN Power Holdings Singapore, Inc. C 1,000,000
Masan Group Corporation B 40,000,000
East Asia and Pacifi c Region Salamander Energy Plc B 12,500,000
Cambodia-Laos Development Fund, S.C.A. FI 0
Clean Resources Asia Growth Fund, L.P. FI 0
LATIN AMERICA AND CARIBBEAN
Antigua and Barbuda American University of Antigua Limited C 30,000,000
Argentina BBVA Banco Frances S.A. C 0
Companias Asociadas Petroleras S.A. B 30,000,000
Banco de Galicia y Buenos Aires, S.A. C 0
Banco Itau Argentina S.A. C 0
Banco Patagonia S.A. FI 30,000,000
Banco Supervielle S.A. C 0
Standard Bank Argentina S.A. C 0
Pan American Energy LLC B 50,000,000
Banco CMF S.A. C 0
ALUAR ALUMINIO ARGENTINO S.A.I.C. B 0
Exolgan S.A. C 0
Grupo ASSA Worldwide S.L. C 5,000,000
Banco Bradesco Argentina S.A. C 0
Belize Atlantic Bank Belize C 0
Bolivia Banco Mercantil S.A. C 0
Banco Ganadero C 0
Banco de Credito C 0
Brazil TriBanco Brazil FI 15,000,000
Ideal Invest S.A. C 0
Anhanguera Educacional Participações S.A. B 28,694,405
Banco Industrial e Comercial S.A. FI 25,000,000
Banco ABC BRASIL S.A. C 0
Banco Indusval S.A. C 0
Banco Daycoval S.A. FI 25,000,000
Banco Fibra S.A. C 0
Banco Pine S.A. C 0
CIPEF Constellation Coinvestment Fund L.P. B 0
NBC BANK BRASIL S.A. BANCO MULTIPLO C 0
Banco Sofi sa S.A. C 0
Centro de Apoio aos Pequenos Empreendimentos do Estado do Maranhao
FI 1,594,684
EAST ASIA AND PACIFIC
PROJECT COMMITMENTS Fiscal Year 2010

p97
IFC Equity & Quasi-Equity
Commitments ($)
Risk Management
Commitments ($)
Trade Finance Guarantee
Commitments ($)
Non-Trade Finance Guarantee
Commitments ($)
Total Commitments for IFC’s
Own Account ($)
Syndications Commitments
($)
0 0 0 0 26,000,000 0
1,699,892 0 0 0 1,699,892 0
0 0 5,000,000 0 5,000,000 0
0 0 78,757,114 0 78,757,114 0
0 0 0 0 10,000,000 0
0 0 167,837,710 0 191,837,710 0
0 0 30,251,373 0 30,251,373 0
0 0 12,670,581 0 12,670,581 0
211,000 0 0 0 211,000 0
0 0 0 0 1,000,000 0
0 0 0 0 40,000,000 0
0 0 0 0 12,500,000 0
4,000,000 0 0 0 4,000,000 0
25,000,000 0 0 0 25,000,000 0
0 0 0 0 30,000,000 0
0 0 18,409 0 18,409 0
0 0 0 0 30,000,000 22,000,000
0 0 17,577,233 0 17,577,233 0
0 0 6,886,927 0 6,886,927 0
0 0 3,279,288 0 33,279,288 0
0 0 1,839,861 0 1,839,861 0
0 0 14,317,149 0 14,317,149 0
0 0 0 0 50,000,000 103,000,000
0 0 10,540,723 0 10,540,723 0
25,000,000 0 0 0 25,000,000 0
0 1,125,000 0 0 1,125,000 0
0 0 0 0 5,000,000 0
0 0 1,384,920 0 1,384,920 0
0 0 665,676 0 665,676 0
0 0 5,488,510 0 5,488,510 0
0 0 5,695,025 0 5,695,025 0
0 0 6,551,885 0 6,551,885 0
0 0 0 0 15,000,000 0
6,713,287 0 0 0 6,713,287 0
0 0 0 0 28,694,405 0
0 0 86,876,500 28,919,286 111,876,500 0
0 0 116,300,000 0 116,300,000 0
0 0 56,520,390 0 56,520,390 0
0 0 95,000,000 0 120,000,000 139,165,850
0 0 225,048,674 0 225,048,674 0
0 0 120,000,000 0 120,000,000 0
103,000,000 0 0 0 103,000,000 0
0 0 25,550,000 0 25,550,000 0
0 0 18,741,063 0 18,741,063 0
0 0 0 0 1,594,684 0

p98
PROJECT COMMITMENTS Fiscal Year 2010
IFC Region Country Name Company Name
Environment & Social
Category Code
IFC Loan & Quasi-Loan
Commitments ($)
EUROPE AND CENTRAL ASIA
Foz do Brasil S.A. B 50,000,000
Brookfi eld Incorporacoes S.A. B 30,000,000
Ensino Superior Bureau Juridico S.A. B 35,000,000
Banco Industrial do Brasil S.A. C 0
Banco WestLB do Brasil S.A. C 0
Chile DUOC UC B 30,000,000
Central Termoelectrica Andino B 0
Bco Internacional S.A. C 0
Colombia BANCOLOMBIA S.A. FI 11,750,000Fundacion Mundo Mujer FI 6,000,000Caruquia S.A. E.S.P. C 0Termofl ores S.A. E.S.P. B 52,500,000Corporacion Universitaria Minuto de Dios B 8,000,000Guanaquitas S.A. E.S.P. C 0Energy International Corp. B 16,500,000Greystar Resources B 0Bancamia S.A. FI 0Productos Naturales de la Sabana S.A. Alqueria
B 15,000,000
Santa Marta International Terminal Company, S.A.
B 16,750,000
Colombia Movil S.A. E.S.P. B 40,000,000Reintegra SAS FI 25,000,000
Costa Rica Banco Promerica de Costa Rica, S.A. FI 6,000,000Banco Improsa S.A. FI 20,000,000
Dominican Republic Banco BHD S.A. FI 20,000,000Banco Multiple Leon, S.A. C 0Corporacion Aeroportuaria del Este, S.A. B 20,000,000Linea Clave Internacional, S.A. B 5,000,000
Ecuador Moderna Alimentos S.A. B 8,000,000El Salvador Banco Agricola S.A. C 0Guatemala Banco Industrial S.A. (Guatemala) C 0
Banco GyT Continental S.A. C 0Comunicaciones Celulares S.A. B 35,000,000Grupo Solid Guatemala, S.A. B 10,000,000
Guyana Small Business Development Finance Trust Inc.
FI 300,000
Haiti Grupo M, S.A. B 0Grupo M, S.A. C 3,000,000Eurasian Minerals Inc. C 0E-Power S.A. B 16,000,000Societe de Construction d’Immeubles et d’Ouvrages Publics S.A.
B 7,500,000
Honduras International Shopping Centers Holdings, Inc-ISC
B 15,000,000
Banco Popular Covelo C 0Banco Financiera Comercial Hondurena S.A. (Banco Ficohsa)
C 0
Banco Atlantida S.A. C 0BANCO DEL PAIS S.A. C 0
Mexico Grupo Calidra, S.A. de C.V. B 5,000,000Banco Mercantil del Norte, S. A. Institucion de Banca Multiple
FI 0
GMAC Financiera C 1,438,889Banco del Bajio, S.A. C 0
LATIN AMERICA AND CARIBBEAN

p99
IFC Equity & Quasi-Equity
Commitments ($)
Risk Management
Commitments ($)
Trade Finance Guarantee
Commitments ($)
Non-Trade Finance Guarantee
Commitments ($)
Total Commitments for IFC’s
Own Account ($)
Syndications Commitments
($)
0 0 0 0 50,000,000 0
17,000,000 0 0 0 47,000,000 0
0 0 0 0 35,000,000 0
0 0 15,100,000 0 15,100,000 0
0 0 29,000,000 0 29,000,000 0
0 0 0 0 30,000,000 0
0 0 0 0 0 10,000,000
0 0 40,000,000 0 40,000,000 0
11,750,000 0 0 0 23,500,000 00 0 0 0 6,000,000 00 350,000 0 0 350,000 00 0 0 0 52,500,000 10,000,0000 0 0 0 8,000,000 00 350,000 0 0 350,000 00 0 0 0 16,500,000 0
4,865,233 0 0 0 4,865,233 010,000,000 0 0 0 10,000,000 0
5,000,000 0 0 0 20,000,000 0
0 0 0 0 16,750,000 0
0 0 0 0 40,000,000 00 0 0 0 25,000,000 00 0 9,770,496 0 15,770,496 00 0 2,495,000 0 22,495,000 00 0 0 0 20,000,000 00 0 1,516,271 0 1,516,271 00 0 0 0 20,000,000 00 0 0 0 5,000,000 00 0 0 0 8,000,000 00 0 16,802,258 0 16,802,258 00 0 2,566,597 0 2,566,597 00 0 39,706,292 0 39,706,292 00 0 0 0 35,000,000 100,000,0000 0 0 0 10,000,000 00 0 0 0 300,000 0
0 0 0 0 0 3,000,0000 0 0 0 3,000,000 0
874,751 0 0 0 874,751 00 0 0 0 16,000,000 10,000,0000 0 0 0 7,500,000 0
0 0 0 0 15,000,000 0
1,463,558 0 0 0 1,463,558 00 0 52,011,007 0 52,011,007 0
0 0 28,600,113 0 28,600,113 00 0 3,810,007 0 3,810,007 00 0 0 0 5,000,000 0
150,000,000 0 0 0 150,000,000 0
0 0 0 187,933 1,626,823 04,011,442 0 0 0 4,011,442 0

p100
PROJECT COMMITMENTS Fiscal Year 2010
IFC Region Country Name Company Name
Environment & Social
Category Code
IFC Loan & Quasi-Loan
Commitments ($)
EUROPE AND CENTRAL ASIA
Grupo Finterra, S.A. DE C.V. Sociedad Financiera de Objeto Múltiple, Entidad No Regulada
FI 1,112,966
Banco Monex, S.A. Institucion de Banca Multiple
C 0
Agrofi nanzas S.A. de C.V. FI 0
Hoteles City Express, S.A.P.I. de C.V. B 0
Leasing Operations de Mexico. S. de R.L. de C.V.
FI 0
Celsol SA de C.V. B 10,000,000
Eurus S.A.P.I. de C.V. A 71,000,000
Sistema Integral de Abasto Rural S.A.P.I de C.V.
B 0
Solida Master Trust FI 0
Nicaragua ECOM Agroindustrial Corp. Ltd. B 9,000,000
Banco de la Produccion S.A. C 0
Banco de Finanzas C 0
Banco de America Central, S.A. C 0
Panama QBE del Istmo Reinsurance Company, Inc. C 0
Electron Investment, S.A. A 40,000,000
Multi Financial Group C 0
Paraguay UABL Limited C 0
Interbanco S.A. C 0
Financiera El Comercio S.A.E.C.A. FI 0
Banco Continental S.A.E.C.A. C 0
Banco Regional S.A. C 0
Banco Bilbao Vizcaya Argentaria Paraguay S.A.
FI 30,000,000
NFD Agro Limited B 0
Agrihold Management Corp. B 5,000,000
Sudameris Bank C 0
Peru Anglo American Quellaveco S.A. C 0
Metropolitan Municipality of Lima (Municipalidad Metropolitana de Lima)
FI 0
Banco Interamericano de Finanzas S.A. – BIF C 0
BPZ Resources, Inc. C 9,938,000
Titulizadora Peruana Sociedad Titulizadora S.A.
C 0
Protecta C 0
Enfoca Discovery 1 L.P. FI 0
Gas Natural de Lima y Callao S.A. B 50,000,000
Antares Minerals Inc. B 0
Servicio de Agua Potable y Alcantarillado de Lima S.A.
B 64,394,409
Saint Lucia Bank of Saint Lucia Limited C 0
Trinidad and Tobago Unicell Paper Mills Caribbean Ltd. (UPMCL) C 0
Uruguay Nuevo Banco Comercial S.A. C 0
Central America Region International Shopping Centers Holdings, Inc-ISC
B 10,000,000
ECOM Agroindustrial Corp. Ltd. B 15,000,000
Hospiteum Corporation B 14,000,000
Latin America Region La Hipotecaria C 25,000,000
LATIN AMERICA AND CARIBBEAN

p101
IFC Equity & Quasi-Equity
Commitments ($)
Risk Management
Commitments ($)
Trade Finance Guarantee
Commitments ($)
Non-Trade Finance Guarantee
Commitments ($)
Total Commitments for IFC’s
Own Account ($)
Syndications Commitments
($)
0 0 0 0 1,112,966 0
0 0 2,800,000 0 2,800,000 0
-18,019 0 0 0 -18,019 0
20,000,000 0 0 0 20,000,000 0
15,630,923 0 0 0 15,630,923 0
1 0 0 0 10,000,001 0
0 0 0 0 71,000,000 27,555,555
2,482,584 0 0 0 2,482,584 0
50,000,000 0 0 0 50,000,000 0
0 0 0 0 9,000,000 0
0 0 3,573,000 0 3,573,000 0
0 0 5,240,397 0 5,240,397 0
0 0 582,960 0 582,960 0
19,000,000 0 0 0 19,000,000 0
0 5,000,000 0 0 45,000,000 0
0 0 40,910,932 0 40,910,932 0
0 1,300,000 0 0 1,300,000 0
0 0 1,409,966 0 1,409,966 0
1,200,000 0 0 0 1,200,000 0
0 0 7,039,509 0 7,039,509 0
0 0 10,548,993 0 10,548,993 0
0 0 40,026,710 0 70,026,710 0
5,000,000 0 0 0 5,000,000 0
0 0 0 0 5,000,000 0
0 0 100,000 0 100,000 0
30,000,000 0 0 0 30,000,000 0
0 0 0 31,684,563 31,684,563 0
0 0 3,000,000 0 3,000,000 0
7,599,416 0 0 0 17,537,416 0
73,710 0 0 329,000 402,710 0
413,959 0 0 0 413,959 0
15,000,000 0 0 0 15,000,000 0
0 0 0 0 50,000,000 0
6,811,680 0 0 0 6,811,680 0
0 0 0 0 64,394,409 0
0 0 6,573,816 0 6,573,816 0
0 600,000 0 0 600,000 0
0 0 3,302,500 0 3,302,500 0
0 0 0 0 10,000,000 0
0 0 0 0 15,000,000 0
0 0 0 0 14,000,000 0
3,500,000 0 0 0 28,500,000 0

p102
PROJECT COMMITMENTS Fiscal Year 2010
IFC Region Country Name Company Name
Environment & Social
Category Code
IFC Loan & Quasi-Loan
Commitments ($)
EUROPE AND CENTRAL ASIA
GeoPark Holdings Limited C 0
Ignia Fund I, L.P. FI 0
SEAF Caribbean Growth Fund FI 0
Yellowpepper Holding Corp. C 0
Kordsa Brasil S.A. B 25,000,000
MIDDLE EAST AND NORTH AFRICA
Afghanistan Areeba Afghanistan Limited C 0
Afghanistan International Bank CJSC C 0
Algeria Maghreb Leasing Algerie S.P.A. C 0
Egypt EFG Hermes Holding S.A.E. FI 0
Ahli United Bank (Egypt) S.A.E. C 0
Wadi Holdings B 25,000,000
MENA Joint Investment Fund S.C.A., SICAV-SIF
FI 0
Alexandria Portland Cement Company B 0
Sphinx Turnaround Fund S.C.A. FI 0
African Export-Import Bank C 50,000,000
Orient Investment Properties Limited A 0
Iraq Credit Bank of Iraq S.A. C 0
Malia Invest Limited B 14,000,000
Jordan Zara Investment Holding Company Limited B 1,800,000
Jordan Phosphate Mines Co. (JPMC) B 50,000,000
Union Bank C 0
Microfund for Women (MFW) FI 0
Capital Bank of Jordan C 0
Bank of Jordan Ltd. C 0
Tamweelcom FI 3,000,000
Lebanon Habib Bank Limited (HBL) C 0
Bank of Beirut C 0
Fransabank SAL (Fransabank) C 0
Byblos Bank S.A.L. FI 0
Banque Libano-Francaise C 0
BLC bank S.A.L. C 0
Morocco Argan Infrastructure Fund, LLC, PCC FI 0
Kasbah Resources Limited B 0
Oman Bank of Beirut C 0
Pakistan Habib Bank Limited (HBL) C 0
MCB Bank Limited C 0
Askari Commercial Bank Limited C 0
Soneri Bank Limited C 0
Engro Polymer & Chemicals Ltd. C 0
United Bank Limited C 0
Habib Metropolitan Bank Ltd. C 0
Meezan Bank Limited C 0
Bank Alfalah Limited C 0
SilkBank Limited C 0
Allied Bank Limited C 0
Qasim International Container Terminal B 30,000,000
Bank Al Habib Limited C 0
LATIN AMERICA AND CARIBBEAN
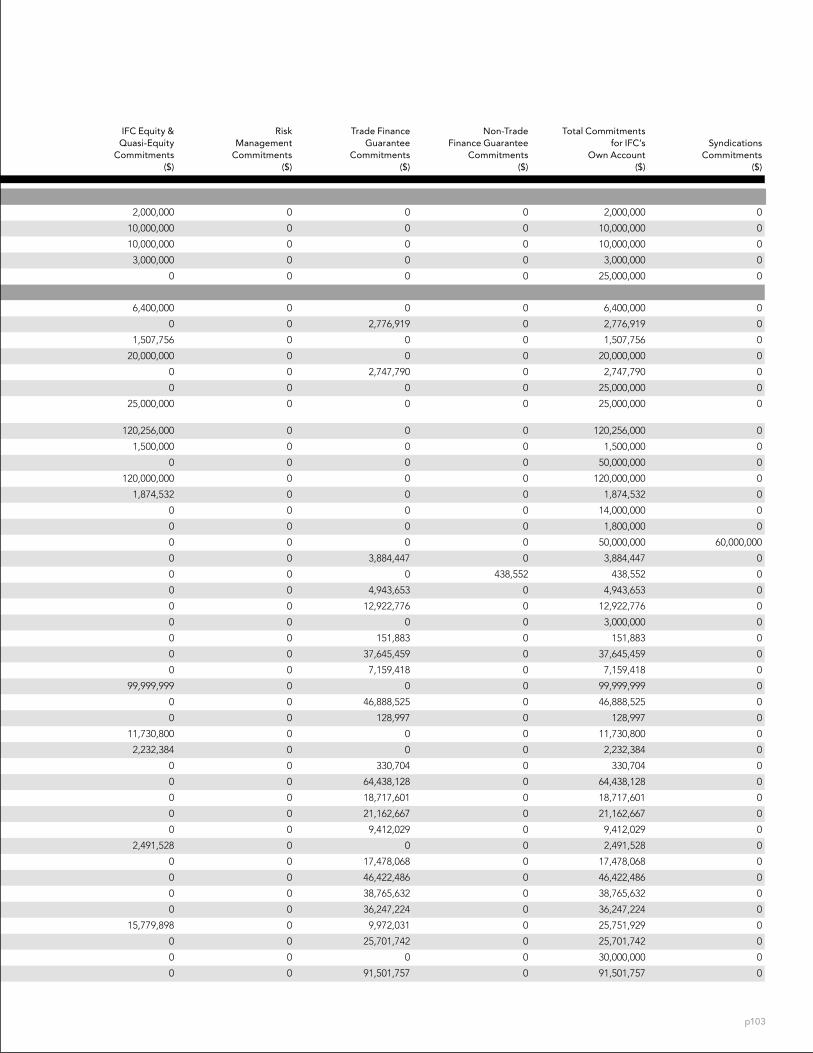
p103
IFC Equity & Quasi-Equity
Commitments ($)
Risk Management
Commitments ($)
Trade Finance Guarantee
Commitments ($)
Non-Trade Finance Guarantee
Commitments ($)
Total Commitments for IFC’s
Own Account ($)
Syndications Commitments
($)
2,000,000 0 0 0 2,000,000 0
10,000,000 0 0 0 10,000,000 0
10,000,000 0 0 0 10,000,000 0
3,000,000 0 0 0 3,000,000 0
0 0 0 0 25,000,000 0
6,400,000 0 0 0 6,400,000 0
0 0 2,776,919 0 2,776,919 0
1,507,756 0 0 0 1,507,756 0
20,000,000 0 0 0 20,000,000 0
0 0 2,747,790 0 2,747,790 0
0 0 0 0 25,000,000 0
25,000,000 0 0 0 25,000,000 0
120,256,000 0 0 0 120,256,000 0
1,500,000 0 0 0 1,500,000 0
0 0 0 0 50,000,000 0
120,000,000 0 0 0 120,000,000 0
1,874,532 0 0 0 1,874,532 0
0 0 0 0 14,000,000 0
0 0 0 0 1,800,000 0
0 0 0 0 50,000,000 60,000,000
0 0 3,884,447 0 3,884,447 0
0 0 0 438,552 438,552 0
0 0 4,943,653 0 4,943,653 0
0 0 12,922,776 0 12,922,776 0
0 0 0 0 3,000,000 0
0 0 151,883 0 151,883 0
0 0 37,645,459 0 37,645,459 0
0 0 7,159,418 0 7,159,418 0
99,999,999 0 0 0 99,999,999 0
0 0 46,888,525 0 46,888,525 0
0 0 128,997 0 128,997 0
11,730,800 0 0 0 11,730,800 0
2,232,384 0 0 0 2,232,384 0
0 0 330,704 0 330,704 0
0 0 64,438,128 0 64,438,128 0
0 0 18,717,601 0 18,717,601 0
0 0 21,162,667 0 21,162,667 0
0 0 9,412,029 0 9,412,029 0
2,491,528 0 0 0 2,491,528 0
0 0 17,478,068 0 17,478,068 0
0 0 46,422,486 0 46,422,486 0
0 0 38,765,632 0 38,765,632 0
0 0 36,247,224 0 36,247,224 0
15,779,898 0 9,972,031 0 25,751,929 0
0 0 25,701,742 0 25,701,742 0
0 0 0 0 30,000,000 0
0 0 91,501,757 0 91,501,757 0

p104
PROJECT COMMITMENTS Fiscal Year 2010
IFC Region Country Name Company Name
Environment & Social
Category Code
IFC Loan & Quasi-Loan
Commitments ($)
EUROPE AND CENTRAL ASIA
Laraib Energy Ltd. B 35,000,000
Mashal LNG Holding BV C 3,000,000
Engro Chemicals Pakistan Limited B 50,000,000
Saudi Arabia Saudi Orix Leasing Company (SOLC) FI 20,000,000
Riyad Bank C 0
Syrian Arab Republic Bank of Syria and Overseas C 0
West Bank and Gaza Alrafah Microfi nance Bank C 0
Bank of Palestine C 0
AMAL C 0
Yemen, Republic of Saba Islamic Bank C 0
MENA Region Nuqul Group B 30,000,000
FIMBank Plc C 0
First Education Holding B.S.C. (c) B 0
Kuwait Energy Company KSCC B 50,000,000
Intaj Capital II L.P. FI 0
Gulf Agency Company Ltd. B 35,000,000
City Group Company K.S.C. B 30,000,000
Zulekha Healthcare Holding Limited B 24,000,000
Metito Utilities Limited B 0
SOUTH ASIA
Bangladesh BRAC Bank C 0
Eastern Bank Limited C 0
Southeast Bank Limited C 0
Export Import Bank of Bangladesh Ltd. C 0
SEAF Bangladesh Ventures FI 0
Bhutan Bhutan National Bank Limited C 0
India Infrastructure Development Finance Company Limited
FI 75,000,000
Snowman Frozen Foods Limited B 0
Continental Carbon India Limited B 3,904,000
Heartland Information Services C 0
Apollo Tyres Limited B 30,000,000
Kotak Mahindra Bank Limited C 0
Atul Limited B 12,500,000
Jain Irrigation Systems Ltd. B 15,000,000
The Federal Bank Limited C 0
Petronet LNG Limited B 0
Financial Information Network & Operations Pvt. Ltd.
C 0
VenturEast Proactive Fund FI 0
Bhilwara Energy Limited A 0
Kanoria Chemicals and Industries Ltd. B 17,219,113
Soktas India Private Limited India C 0
Waterhealth India Private Limited B 0
Zephyr Peacock India Fund II Limited FI 0
Maharashtra State Electricity Transmission Company Limited
B 50,056,278
CHOLAMANDALAM INVESTMENT AND FINANCE COMPANY LTD.
FI 0
Export-Import Bank of India FI 75,000,000
MIDDLE EAST AND NORTH AFRICA

p105
IFC Equity & Quasi-Equity
Commitments ($)
Risk Management
Commitments ($)
Trade Finance Guarantee
Commitments ($)
Non-Trade Finance Guarantee
Commitments ($)
Total Commitments for IFC’s
Own Account ($)
Syndications Commitments
($)
0 0 0 0 35,000,000 0
0 0 0 0 3,000,000 0
0 0 0 0 50,000,000 0
0 0 0 0 20,000,000 0
0 0 0 29,993,202 29,993,202 0
0 0 848,396 0 848,396 0
0 0 3,787,243 0 3,787,243 0
0 0 4,450,642 0 4,450,642 0
0 0 0 75,400,000 75,400,000 0
0 0 12,300,120 0 12,300,120 0
0 0 0 0 30,000,000 0
0 0 20,810,645 0 20,810,645 0
8,000,000 0 0 0 8,000,000 0
0 0 0 0 50,000,000 0
20,000,000 0 0 0 20,000,000 0
0 0 0 0 35,000,000 0
0 0 0 0 30,000,000 0
0 0 0 0 24,000,000 0
20,000,000 0 0 0 20,000,000 0
0 0 32,768,848 0 32,768,848 0
0 0 47,948,409 0 47,948,409 0
0 0 25,961,680 0 25,961,680 0
0 0 9,220,005 0 9,220,005 0
12,000,000 0 0 0 12,000,000 0
0 0 678,000 0 678,000 0
0 0 0 0 75,000,000 0
5,357,232 0 0 0 5,357,232 0
0 0 0 0 3,904,000 0
500,000 0 0 0 500,000 0
0 0 0 0 30,000,000 0
0 0 9,310,268 0 9,310,268 0
0 0 0 0 12,500,000 0
0 0 0 0 15,000,000 0
0 0 16,035 0 16,035 0
0 0 0 0 0 150,000,000
2,782,399 0 0 0 2,782,399 0
8,750,000 0 0 0 8,750,000 0
23,895,831 0 0 0 23,895,831 0
0 0 0 0 17,219,113 0
432,496 0 0 0 432,496 0
1 0 0 0 1 0
8,690,000 0 0 0 8,690,000 0
0 0 0 0 50,056,278 0
22,590,654 0 0 0 22,590,654 0
0 0 0 0 75,000,000 0

p106
PROJECT COMMITMENTS Fiscal Year 2010
IFC Region Country Name Company Name
Environment & Social
Category Code
IFC Loan & Quasi-Loan
Commitments ($)
EUROPE AND CENTRAL ASIA
Volkswagen India Pvt. Ltd. B 0
Auro Mira Bio Systems Kanyakumari Pvt. Ltd. B 6,198,881
Kalyani Gerdau Steels Limited B 25,000,000
Azure Power India Private Limited B 5,500,000
AU Financiers (India) Private Limited FI 0
Belstar Investment & Finance Pvt. Ltd. FI 0
Auro Mira Energy Company Private Limited B 0
Cairn Energy Hydrocarbons Limited A 250,000,000
Husk Power Systems Inc. B 0
WEG S.A. B 25,000,000
Utkarsh Micro Finance Private Limited FI 0
Vicat Sagar Cement Private Ltd. A 75,000,000
Suvidhaa Inforserve Private Limited C 0
Applied Solar Technologies Pvt. Ltd. C 9,948,823
Craftsman Automation Private Limited B 0
Aavishkaar Goodwell India Microfi nance Development Company II
FI 0
Dewan LIS New Co. C 0
Maldives Universal Enterprises Pvt. Limited B 2,500,000
Nepal Butwal Power Company (BPC) B 6,500,000
Bank of Kathmandu Limited C 0
Nepal Industrial and Commercial Bank Ltd. C 0
Himalayan Bank Limited C 0
Nirdhan Utthan Bank Ltd. FI 0
Nepal Investment Bank Ltd. C 0
Sri Lanka Commercial Bank of Ceylon C 0
Nations Trust Bank Ltd. C 0
National Development Bank Plc FI 0
Asiri Hospital Limited B 20,000,000
Southern Asia Region South Asia Clean Energy Fund, L.P. FI 0
SUB-SAHARAN AFRICA
Angola Banco de Fomento. S.A.R.L C 0
Benin Ecobank Benin C 0
Diamond Bank Benin S.A. C 0
Botswana Tsodilo Resource Limited B 0
Burkina Faso Ecobank-Burkina C 0
Gryphon Minerals C 0
Volta Resources B 0
Burundi Interbank Burundi S.A. C 0
Cameroon Ecobank Cameroun S.A. FI 3,784,090
Nosa Sarl B 1,516,154
Advans Cameroun FI 1,014,815
Dibamba Power Development Company B 31,027,500
Central African Republic Ecobank Centrafrique S. A. FI 2,838,067
Chad Ecobank Tchad S.A. FI 2,838,067
Millicom Tchad S.A. B 21,197,426
Imprimerie Aubaine Graphic S.A. B 2,854,530
Congo, Democratic Republic of
Pro Credit Bank SARL C 0
SOUTH ASIA

p107
IFC Equity & Quasi-Equity
Commitments ($)
Risk Management
Commitments ($)
Trade Finance Guarantee
Commitments ($)
Non-Trade Finance Guarantee
Commitments ($)
Total Commitments for IFC’s
Own Account ($)
Syndications Commitments
($)
0 0 0 0 0 105,922,500
0 0 0 0 6,198,881 0
0 0 0 0 25,000,000 0
4,500,000 0 0 0 10,000,000 0
7,591,368 0 0 0 7,591,368 0
1,152,436 0 0 0 1,152,436 0
7,721,202 0 0 0 7,721,202 0
0 0 0 0 250,000,000 0
350,000 0 0 0 350,000 0
0 0 0 0 25,000,000 0
301,334 0 0 0 301,334 0
0 0 0 0 75,000,000 68,260,500
5,000,000 0 0 0 5,000,000 0
5,480,360 0 0 0 15,429,183 0
9,695,142 0 0 0 9,695,142 0
2,000,000 0 0 0 2,000,000 0
4,450,626 0 0 0 4,450,626 0
0 0 0 0 2,500,000 0
0 0 0 0 6,500,000 0
0 0 4,241,239 0 4,241,239 0
0 0 1,728,125 0 1,728,125 0
0 0 1,065,515 0 1,065,515 0
255,171 0 0 0 255,171 0
0 0 26,070 0 26,070 0
0 0 27,368,750 0 27,368,750 0
0 0 614,879 0 614,879 0
0 0 7,253,400 12,637,122 19,890,522 0
0 0 0 0 20,000,000 0
10,000,000 0 0 0 10,000,000 0
0 0 23,397,531 0 23,397,531 0
0 0 11,004,584 0 11,004,584 0
0 0 19,768,302 0 19,768,302 0
4,761,225 0 0 0 4,761,225 0
0 0 5,824,638 0 5,824,638 0
1,039,723 0 0 0 1,039,723 0
6,412,196 0 0 0 6,412,196 0
0 0 25,148 0 25,148 0
0 0 2,653,454 0 6,437,544 0
0 0 0 0 1,516,154 0
0 0 0 0 1,014,815 0
0 0 0 0 31,027,500 0
0 0 0 0 2,838,067 0
0 0 0 0 2,838,067 0
0 0 0 0 21,197,426 0
0 0 0 0 2,854,530 0
810,000 0 0 0 810,000 0

p108
IFC Region Country Name Company Name
Environment & Social
Category Code
IFC Loan & Quasi-Loan
Commitments ($)
EUROPE AND CENTRAL ASIA
Rawbank Commercial Banking C 0
Advans Banque Congo C 0
Millicom DRC B 50,000,000
Cote d’Ivoire Groupe Industriel Madiou Simpara S.A. B 10,177,020
Ecobank – Cote d’Ivoire C 0
Ethiopia Nyota Minerals Limited B 0
Ghana Ecobank Ghana Limited C 0
Merchant Bank (Ghana) Limited C 0
The Trust Bank C 0
Ghana Primary Mortgage Market Initiative C 10,000,000
EB-ACCION Savings and Loans Company Limited
FI 0
Esoko C 0
Vodafone Ghana B 100,000,000
NGB Ghana Ltd. C 0
Bulk Distribution Companies B 0
Kenya Diamond Trust of Kenya Limited C 0
BARCLAYS BANK OF KENYA LIMITED C 0
I and M Bank Ltd. C 0
Prime Bank Limited C 0
Kenya Commercial Bank C 0
Ecobank Kenya Limited FI 12,500,000
Liberia Liberian Bank for Development and Investment
C 0
AccessBank Liberia C 0
Ecobank Liberia FI 3,000,000
Madagascar Bank of Africa Madagascar C 0
Malawi Stanbic Malawi FI 0
NBS Bank Limited C 0
C 0
Mali Groupe Industriel Madiou Simpara S.A. B 5,709,060
Ecobank Mali FI 0
Mauritania Generale de Banque de Mauritanie pour l’Investissement et le Commerce
C 0
Mozambique Banco Comerciale de Investimentos Fomento
FI 30,000,000
Bakhresa Grain Milling (Mozambique) Limitada
B 8,000,000
AFRICAN BANKING CORPORATION MOZAMBIQUE
C 0
Niger Ecobank Niger C 0
Nigeria Helios Towers Nigeria Limited B 50,000,000
Helios Towers Nigeria Limited C 0
Zambeef Products Plc B 3,000,000
Diamond Bank Plc C 0
Guaranty Trust Bank Plc C 0
First Bank of Nigeria Plc FI 87,500,000
Access Bank Plc C 0
Zenith Bank Plc C 0
First City Monument Bank C 0
AB Nigeria Microfi nance Bank FI 3,192,204
SUB-SAHARAN AFRICA
PROJECT COMMITMENTS Fiscal Year 2010

p109
IFC Equity & Quasi-Equity
Commitments ($)
Risk Management
Commitments ($)
Trade Finance Guarantee
Commitments ($)
Non-Trade Finance Guarantee
Commitments ($)
Total Commitments for IFC’s
Own Account ($)
Syndications Commitments
($)
0 0 3,313,707 0 3,313,707 0
1,050,500 0 0 0 1,050,500 0
0 0 0 0 50,000,000 30,000,000
0 0 0 0 10,177,020 0
0 0 5,950,453 0 5,950,453 0
5,289,746 0 0 0 5,289,746 0
0 0 26,238,335 0 26,238,335 0
0 0 7,154,208 0 7,154,208 0
0 0 8,161,173 0 8,161,173 0
0 0 0 0 10,000,000 0
31,000 0 0 0 31,000 0
1,250,000 0 0 0 1,250,000 0
0 0 0 0 100,000,000 0
2,500,000 0 0 0 2,500,000 0
0 0 0 150,000,000 150,000,000 0
0 0 1,400,349 0 1,400,349 0
0 0 10,851,701 0 10,851,701 0
0 0 9,999,095 0 9,999,095 0
0 0 1,556,240 0 1,556,240 0
0 0 23,829,304 0 23,829,304 0
0 0 0 0 12,500,000 0
0 0 300,000 0 300,000 0
450,000 0 0 0 450,000 0
0 0 0 0 3,000,000 0
0 0 21,598,276 0 21,598,276 0
0 0 0 5,836,575 5,836,575 0
0 0 11,601,731 0 11,601,731 0
0 0 14,895,879 0 14,895,879 0
0 0 0 0 5,709,060 0
0 0 5,424,664 5,905,886 5,424,664 0
0 0 1,299,745 0 1,299,745 0
0 0 0 0 30,000,000 0
0 0 0 0 8,000,000 0
0 0 3,500,000 0 3,500,000 0
0 0 4,000,000 0 4,000,000 0
0 0 0 0 50,000,000 44,000,000
0 4,000,000 0 0 4,000,000 0
0 0 0 0 3,000,000 0
0 0 41,899,504 0 41,899,504 0
0 0 53,295,560 0 53,295,560 0
0 0 0 0 87,500,000 0
0 0 221,173,333 0 221,173,333 0
0 0 94,905,271 0 94,905,271 0
0 0 42,434,869 0 42,434,869 0
0 0 0 0 3,192,204 0

p110
PROJECT COMMITMENTS Fiscal Year 2010
IFC Region Country Name Company Name
Environment & Social
Category Code
IFC Loan & Quasi-Loan
Commitments ($)
EUROPE AND CENTRAL ASIA
Ecobank Nigeria Plc C 0
Tantalizers Plc B 7,000,000
Adlevo Capital Africa LLC FI 0
Capic Hexagon Limited B 5,500,000
Skye Capic Limited B 6,600,000
Rwanda Tourism Promotion Services Rwanda Limited B 0
Bakhresa Grain Milling (Rwanda) Limited B 2,500,000
Sao Tome and Principe Banco Internacional de Sao Tome e Principe C 0
Senegal MicroCred Senegal FI 0
Ecobank Senegal C 0
Compagnie Marocco-Senegalaise d’Electricite/Saint Louis S.A.
B 0
Groupe Industriel Madiou Simpara S.A. B 1,489,320
Seychelles Universal Enterprises Pvt. Limited A 20,000,000
Sierra Leone Sierra Leone Commercial Bank C 0
Rokel Commercial Bank C 0
Guaranty Trust Bank Sierra Leone C 0
South Africa Sasfi n Bank Limited C 0
Hernic Ferrochrome Pty Limited B 2,500,000
Marico South Africa (Pty) Limited B 5,000,000
Curro Holdings PTY Limited C 9,399,444
Life Healthcare Group Pty Ltd. B 0
Tanzania, United Republic of Exim Bank of Tanzania C 0
AccessBank Tanzania Limited C 0
AFRICAN BANKING CORPORATION TANZANIA
C 0
Helio Resource Corp. B 0
CRJE Estate Limited B 10,000,000
Togo Ecobank Togo C 0
ContourGlobal Togo S.A. B 8,500,000
Uganda Orient Bank Limited C 0
Nakasero Hospital B 3,000,000
Zambia Zambeef Products Plc B 7,000,000
AFRICAN BANKING CORPORATION ZAMBIA
C 0
Kiwara plc B 0
Zambia National Commercial Bank Plc FI 25,000,000
Africa Region Emerging Africa Infrastructure Fund Ltd. FI 48,750,000
Horus Development Finance C 0
Investment Fund for Health in Africa B.V. FI 0
Africinvest II Fund, LLC C 0
Africa Infrastructure Investment Fund 2 FI 0
African Development Partners I, LLC FI 0
Regional MSME Investment Fund for Sub-Saharan Africa
FI 8,000,000
Absa Bank Limited FI 150,000,000
Baobab Investments Limited C 0
ECP Africa Fund III, PCC FI 0
Scancem International ANS A 0
GEF Africa Sustainable Forestry Fund L.P. FI 0
SUB-SAHARAN AFRICA

p111
IFC Equity & Quasi-Equity
Commitments ($)
Risk Management
Commitments ($)
Trade Finance Guarantee
Commitments ($)
Non-Trade Finance Guarantee
Commitments ($)
Total Commitments for IFC’s
Own Account ($)
Syndications Commitments
($)
0 0 58,165,898 0 58,165,898 0
1,500,000 0 0 0 8,500,000 0
10,000,000 0 0 0 10,000,000 0
0 0 0 0 5,500,000 0
0 0 0 0 6,600,000 0
950,000 0 0 0 950,000 0
0 0 0 0 2,500,000 0
0 0 67,862 0 67,862 0
1,316,761 0 0 0 1,316,761 0
0 0 2,716,884 0 2,716,884 0
750,000 0 0 0 750,000 0
0 0 0 0 1,489,320 0
0 0 0 0 20,000,000 0
0 0 604,749 0 604,749 0
0 0 96,750 0 96,750 0
0 0 350,000 0 350,000 0
0 0 9,716,984 0 9,716,984 0
0 0 0 0 2,500,000 0
0 0 0 0 5,000,000 0
0 0 0 0 9,399,444 0
100,000,000 0 0 0 100,000,000 0
0 0 4,285,164 0 4,285,164 0
259,500 0 0 0 259,500 0
0 0 595,756 0 595,756 0
7,629,220 0 0 0 7,629,220 0
0 0 0 0 10,000,000 0
0 0 6,641,653 0 6,641,653 0
5,500,000 0 0 0 14,000,000 0
0 0 3,000,000 0 3,000,000 0
0 0 0 0 3,000,000 0
0 0 0 0 7,000,000 0
0 0 50,108 0 50,108 0
9,000,000 0 0 0 9,000,000 0
0 0 0 0 25,000,000 0
0 0 0 0 48,750,000 0
7,331,750 0 0 0 7,331,750 0
6,793,250 0 0 0 6,793,250 0
5,162,870 0 0 0 5,162,870 0
100,000,000 0 0 0 100,000,000 0
24,392,775 0 0 0 24,392,775 0
0 0 0 0 8,000,000 0
0 0 0 0 150,000,000 0
3,000,000 0 0 0 3,000,000 0
25,000,000 0 0 0 25,000,000 0
110,000,000 0 0 0 110,000,000 0
20,000,000 0 0 0 20,000,000 0

p112
PROJECT COMMITMENTS Fiscal Year 2010
IFC Region Country Name Company Name
Environment & Social
Category Code
IFC Loan & Quasi-Loan
Commitments ($)
EUROPE AND CENTRAL ASIA
New Africa Mining Fund II FI 0
Helios Towers Africa Limited B 0
AKFED S.A. B 25,000,000
Central Africa Region Central Africa SME Fund C.V. FI 0
Eastern Africa Region Fanisi Venture Capital Fund S.C.A., SICAV-SIF FI 0
Export Trading Co. Ltd. B 0
Spencon International Limited B 12,000,000
Southern Africa Region Agri-Vie Fund PCC FI 0
Western Africa Region West Africa Venture Fund, LLC FI 0
GLOBAL
World Region Eurasian Minerals Inc. B 0
ProCredit Holding FI 31,027,500
Shorebank Corporation FI 0
Commerzbank A.G. C 125,000,000
Standard Chartered Bank C 0
WaterHealth International B 0
Rural Impulse Fund S.A., SICAV-FIS FI 0
JPMorgan Chase Bank, N.A. C 100,000,000
Leapfrog Financial Inclusion Fund C 0
Lydian International Ltd. C 0
Microfi nance Enhancement Facility C 0
IFC Capitalization (Equity) Fund, L.P. FI 0
IFC Capitalization (Subordinated Debt) Fund, L.P.
FI 0
CHF Development Finance International, LLC FI 0
IFC Capitalization (Equity) Fund, G.P. FI 0
IFC Capitalization (Subordinated Debt) Fund, G.P.
FI 0
Emerging Market Secondaries Fund FI 0
IFC Founder Partner – IFC African, Latin America & Caribbean Fund, L.P.
FI 0
SUB-SAHARAN AFRICA

p113
IFC Equity & Quasi-Equity
Commitments ($)
Risk Management
Commitments ($)
Trade Finance Guarantee
Commitments ($)
Non-Trade Finance Guarantee
Commitments ($)
Total Commitments for IFC’s
Own Account ($)
Syndications Commitments
($)
30,000,000 0 0 0 30,000,000 0
25,000,000 0 0 0 25,000,000 0
0 0 0 0 25,000,000 0
12,500,000 0 0 0 12,500,000 0
7,500,000 0 0 0 7,500,000 0
0 0 0 40,000,000 40,000,000 0
0 0 0 0 12,000,000 0
7,000,000 0 0 0 7,000,000 0
13,500,000 0 0 0 13,500,000 0
5,028,220 0 0 0 5,028,220 0
0 0 0 0 31,027,500 0
10,000,000 0 0 0 10,000,000 0
0 0 0 0 125,000,000 0
0 0 0 51,000,000 51,000,000 0
5,000,000 0 0 0 5,000,000 0
13,313,500 0 0 0 13,313,500 0
0 0 0 0 100,000,000 0
20,000,000 0 0 0 20,000,000 0
1,826,945 0 0 0 1,826,945 0
0 10,000,000 0 0 10,000,000 0
182,725,996 0 0 0 182,725,996 0
9,888,253 0 0 0 9,888,253 0
1,500,000 0 0 0 1,500,000 0
10,000 0 0 0 10,000 0
10,000 0 0 0 10,000 0
25,000,000 0 0 0 25,000,000 0
14,036,341 0 0 0 14,036,341 0

p114
INVESTMENT PORTFOLIO Statement of Cumulative Gross Commitments1 (At June 30, 2010) ($ Thousands)
Region CountryNumber of Enterprises IFC
Syndication & Guarantee
Participants Total
SUB–SAHARAN AFRICA
Angola 7 189,222.4 – 189,222.4
Benin 10 44,206.6 – 44,206.6
Botswana 6 33,454.1 – 33,454.1
Burkina Faso 13 50,584.4 – 50,584.4
Burundi 5 9,535.5 – 9,535.5
Cameroon 34 444,001.9 471,500.0 915,501.9
Cape Verde 6 15,901.9 – 15,901.9
Central African Republic 1 2,838.1 – 2,838.1
Chad 7 45,312.9 13,900.0 59,212.9
Congo Republic 6 115,005.4 25,000.0 140,005.4
Congo, Democratic Republic of 20 237,103.2 94,000.0 331,103.2
Côte d’Ivoire 41 273,110.4 70,963.8 344,074.2
Djibouti 1 4,000.0 – 4,000.0
Eritrea 1 949.2 – 949.2
Ethiopia 5 76,848.5 1,719.0 78,567.5
Gabon 5 145,588.0 110,000.0 255,588.0
Gambia, The 9 15,361.5 – 15,361.5
Ghana 63 1,127,572.0 379,500.0 1,507,072.0
Guinea 10 68,683.6 – 68,683.6
Guinea–Bissau 4 7,246.0 – 7,246.0
Kenya 79 708,902.6 59,294.6 768,197.2
Lesotho 2 454.0 – 454.0
Liberia 6 30,071.6 – 30,071.6
Madagascar 21 130,734.4 21,000.0 151,734.4
Malawi 19 95,841.1 9,500.0 105,341.1
Mali 21 138,897.4 40,000.0 178,897.4
Mauritania 12 99,917.3 9,502.6 109,419.9
Mauritius 15 68,619.3 96.0 68,715.3
Mozambique 27 277,084.3 – 277,084.3
Namibia 5 34,165.8 – 34,165.8
Niger 3 10,808.1 – 10,808.1
Nigeria 77 3,223,405.1 237,155.0 3,460,560.1
Rwanda 8 33,905.5 – 33,905.5
Sao Tome and Principe 1 136.0 – 136.0
Senegal 26 167,227.8 12,398.0 179,625.8
Seychelles 7 39,443.2 2,500.0 41,943.2
Sierra Leone 7 64,003.0 25,000.0 89,003.0
Somalia 2 974.6 – 974.6
South Africa 68 1,497,850.6 15,000.0 1,512,850.6
Sudan 6 27,267.8 6,488.8 33,756.6
Swaziland 9 47,779.5 – 47,779.5
Tanzania, United Republic of 49 264,829.0 13,040.5 277,869.5
Togo 10 45,855.5 – 45,855.5
Uganda 46 291,562.4 13,088.4 304,650.8
Zambia 36 208,873.2 20,285.8 229,159.0
Zimbabwe 51 284,261.9 99,000.0 383,261.9
Regional Investments: Sub-Saharan Africa 58 1,589,500.5 1,906.0 1,591,406.5

p115
Region CountryNumber of Enterprises IFC
Syndication & Guarantee
Participants Total
EAST ASIA AND PACIFIC
Cambodia 7 98,164.5 60,000.0 158,164.5
China 186 3,952,992.6 1,010,553.7 4,963,546.4
Fiji 8 47,993.2 2,500.0 50,493.2
Indonesia 107 2,609,509.5 1,459,655.4 4,069,164.9
Kiribati 1 1,798.0 – 1,798.0
Korea, Republic of 50 866,449.2 195,700.0 1,062,149.2
Lao People’s Democratic Republic 10 49,579.6 – 49,579.6
Malaysia 12 154,868.4 5,389.1 160,257.5
Mongolia 10 78,819.4 – 78,819.4
Papua New Guinea 6 222,472.3 – 222,472.3
Philippines 93 2,355,992.8 695,879.6 3,051,872.4
Samoa 7 20,096.6 – 20,096.6
Singapore 2 1,546.8 – 1,546.8
Solomon Islands 1 35,000.0 – 35,000.0
Thailand 69 1,309,859.9 1,701,374.1 3,011,234.0
Tonga 1 6,787.0 – 6,787.0
Vanuatu 2 14,416.6 – 14,416.6
Vietnam 36 1,064,380.3 243,135.0 1,307,515.3
Regional Investments: East Asia and Pacifi c 26 683,123.1 – 683,123.1
SOUTH ASIA
Bangladesh 27 558,122.0 52,745.4 610,867.4
Bhutan 3 11,402.7 – 11,402.7
India 287 7,350,622.0 1,351,639.8 8,702,261.8
Maldives 7 168,250.0 8,500.0 176,750.0
Nepal 14 103,260.9 36,000.0 139,260.9
Sri Lanka 30 394,524.9 23,615.6 418,140.5
Regional Investments: South Asia 9 213,070.0 – 213,070.0
EUROPE & CENTRAL ASIA
Albania 16 267,137.1 9,893.0 277,030.0
Armenia 8 85,175.3 – 85,175.3
Azerbaijan 23 315,842.9 72,930.0 388,772.9
Belarus 14 153,953.3 – 153,953.3
Bosnia And Herzegovina 29 281,213.4 10,577.6 291,790.9
Bulgaria 22 495,003.6 128,354.0 623,357.6
Croatia 15 527,307.3 123,283.2 650,590.5
Cyprus 7 32,181.5 645.3 32,826.7
Czech Republic 18 396,807.9 245,587.9 642,395.8
Estonia 11 137,806.1 11,855.0 149,661.1
Georgia 13 441,733.3 – 441,733.3
Greece 6 25,742.3 40,131.3 65,873.6
Hungary 34 437,985.4 70,334.8 508,320.2
Kazakhstan 29 1,046,881.6 282,916.7 1,329,798.3
Kyrgyz Republic 12 81,161.2 – 81,161.2
Latvia 7 80,966.8 35,000.0 115,966.8
Lithuania 11 95,041.0 9,309.0 104,350.0
Macedonia, Former Yugoslav Republic of 13 182,390.7 25,000.0 207,390.7
Moldova 13 124,338.3 25,000.0 149,338.3

p116
INVESTMENT PORTFOLIO Statement of Cumulative Gross Commitments1 (At June 30, 2010) ($ Thousands)
Region CountryNumber of Enterprises IFC
Syndication & Guarantee
Participants Total
EUROPE & CENTRAL ASIA
Montenegro 5 60,263.1 – 60,263.1
Poland 44 438,121.4 115,316.8 553,438.3
Republic of Kosovo 2 19,218.7 – 19,218.7
Romania 34 1,113,112.5 384,998.7 1,498,111.2
Russian Federation 163 5,566,144.0 1,495,139.1 7,061,283.1
Serbia 29 677,620.3 92,422.8 770,043.0
Slovakia 7 115,543.7 – 115,543.7
Slovenia 12 304,270.4 47,382.7 351,653.1
Tajikistan 15 62,469.1 – 62,469.1
Turkey 150 5,120,872.8 2,656,220.9 7,777,093.8
Ukraine 37 1,309,689.3 601,700.0 1,911,389.3
Uzbekistan 16 77,414.2 12,900.0 90,314.2
Regional Investments: Europe & Central Asia 49 1,852,318.2 82,592.0 1,934,910.2
LATIN AMERICA & CARIBBEAN
Antigua and Barbuda 1 30,000.0 – 30,000.0
Argentina 187 4,345,301.1 3,634,464.5 7,979,765.6
Barbados 4 8,625.1 – 8,625.1
Belize 4 22,165.7 11,000.0 33,165.7
Bolivia 28 404,545.3 140,500.0 545,045.3
Brazil 219 8,156,037.2 4,438,290.6 12,594,327.8
Chile 51 1,383,270.7 1,004,482.7 2,387,753.4
Colombia 101 2,214,696.3 727,631.0 2,942,327.4
Costa Rica 22 303,991.2 99,708.8 403,700.0
Dominica 1 700.0 – 700.0
Dominican Republic 30 522,473.5 219,850.0 742,323.5
Ecuador 23 282,147.5 39,240.1 321,387.6
El Salvador 16 276,120.6 113,500.0 389,620.6
Grenada 2 8,000.0 – 8,000.0
Guatemala 23 539,516.5 210,000.0 749,516.5
Guyana 6 13,975.0 – 13,975.0
Haiti 8 65,874.1 10,000.0 75,874.1
Honduras 16 335,015.0 79,400.8 414,415.7
Jamaica 19 307,381.6 149,694.5 457,076.0
Mexico 163 4,410,515.8 2,217,133.5 6,627,649.4
Nicaragua 18 206,631.3 12,428.6 219,059.9
Panama 24 1,196,274.3 153,300.0 1,349,574.3
Paraguay 14 242,396.1 10,000.0 252,396.1
Peru 67 1,531,106.5 528,621.2 2,059,727.7
Saint Lucia 3 40,307.0 – 40,307.0
Trinidad and Tobago 15 302,403.7 235,000.0 537,403.7
Uruguay 16 283,279.4 120,000.0 403,279.4
Venezuela 39 897,229.5 703,791.4 1,601,021.0
Regional Investments: Latin America & Caribbean 52 833,751.9 160,000.0 993,751.9

p117
Region CountryNumber of Enterprises IFC
Syndication & Guarantee
Participants Total
MIDDLE EAST AND NORTH AFRICA
Afghanistan 7 147,957.4 – 147,957.4
Algeria 14 234,339.9 5,556.9 239,896.8
Egypt 80 2,070,870.5 664,871.3 2,735,741.8
Iran, Islamic Republic of 11 63,342.9 8,199.5 71,542.4
Iraq 3 112,486.3 – 112,486.3
Israel 1 10,500.0 – 10,500.0
Jordan 40 742,929.3 290,250.0 1,033,179.3
Lebanon 32 1,118,387.9 230,430.0 1,348,817.9
Morocco 37 688,099.6 515,014.1 1,203,113.7
Oman 7 230,859.6 57,000.0 287,859.6
Pakistan 116 2,798,924.4 607,970.1 3,406,894.5
Saudi Arabia 7 183,486.3 – 183,486.3
Syrian Arab Republic 4 24,667.3 – 24,667.3
Tunisia 25 429,860.0 417,227.8 847,087.8
United Arab Emirates 2 30,000.0 – 30,000.0
Yemen, Republic of 14 202,054.6 56,104.7 258,159.2
Regional Investments: Middle East and North Africa 27 789,611.7 3,000.0 792,611.7
WORLDWIDE
Australia 2 975.0 – 975.0
Finland 4 1,233.1 1,914.5 3,147.6
Italy 1 960.0 – 960.0
Portugal 7 51,811.1 11,000.0 62,811.1
Spain 5 19,042.5 1,685.0 20,727.5
Regional Investments: Worldwide 76 2,996,527.7 308,000.0 3,304,527.7
Other2 23 205,693.7 1,400.0 207,093.7
TOTAL: 4,517 98,906,078.1 33,375,678.3 132,281,756.3
1. Commitments are composed of funds to be provided by IFC for its own account, funds to be provided by participants through the purchase of an interest in IFC’s investment, and funds to be provided by other fi nancial institutions in associations with IFC, where IFC has rendered material assistance in mobilizing these funds.
2. Of this amount, $9.8 million ($8.4 million for IFC and $1.4 million for participant’s account) represents investments made at a time when the authorities on Taiwan represented China in the International Finance Corporation. The balance represents investments in the West Bank and Gaza, Taiwan, and China, Hong Kong SAR.

p118
INVESTMENT PORTFOLIO Company Listing
Region Country UJV* Company Name Sector
Fiscal Year in which
Commitments Were Made
SUB–SAHARAN AFRICA
Angola Banco de Fomento. S.A.R.L. Finance & Insurance FY08
Angola Fábrica de Bleach Corasol Limitada Chemicals FY99
Angola Secil – Companhia de Cimentos do Lobito, S.A. Nonmetallic Mineral Product Manufacturing
FY09
Benin Diamond Bank Benin S.A. Finance & Insurance FY09
Benin Ecobank Benin Finance & Insurance FY03, 09
Botswana Letshego Holding Limited (formerly Micro Provident Botswana Limited)
Finance & Insurance FY05, 08
Botswana Tsodilo Resource Limited Oil, Gas and Mining FY10
Burkina Faso Ecobank-Burkina Finance & Insurance FY98, 09
Burkina Faso Gryphon Minerals Oil, Gas and Mining FY09, 10
Burkina Faso Marina Market Sarl (for Burkina Faso) Wholesale and Retail Trade FY08
Burkina Faso Onatel S.A. Information FY08, 09
Burkina Faso SBPH S.A. Accommodation & Tourism Services
FY05
Burkina Faso Société Voltaique De Plastique Sarl (SOVOLPLAS) Chemicals FY79
Burkina Faso Volta Resources Oil, Gas and Mining FY10
Burundi Diamond Trust Bank Burundi S.A. Finance & Insurance FY09
Burundi Verreries DU Burundi, S.A.R.L. Nonmetallic Mineral Product Manufacturing
FY81, 87
Cameroon 3T Cameroun Transportation and Warehousing
FY06
Cameroon Advans Cameroun Finance & Insurance FY08, 09
Cameroon AES Sonel S. A. Electric Power FY06
Cameroon Bata Societe Anonyme Camerounaise Textiles, Apparel & Leather FY75
Cameroon Cameroon Oil Transportation Company Oil, Gas and Mining FY01
Cameroon Dibamba Power Development Company Electric Power FY10
Cameroon EB–Accion Cameroun Finance & Insurance FY09
Cameroon Ecobank Cameroun S.A. Finance & Insurance FY10
Cameroon FME GAZ Chemicals FY02, 08
Cameroon Nosa Sarl Chemicals FY05, 10
Cameroon Notacam S.A. Textiles, Apparel & Leather FY97
Cameroon Prestige Bottling Company Food & Beverages FY88
Cameroon Société Industrielle Laitiere DU Cameroun “SILAC” Food & Beverages FY87
Cape Verde Caixa Económica de Cabo Verde, S.A. Finance & Insurance FY04
Cape Verde T+Telecomunicacoes S.A Information FY08
Central African Republic Ecobank Centrafrique S.A. Finance & Insurance FY10
Chad Ecobank Tchad S.A. Finance & Insurance FY09, 10
Chad GEYSER S.A. Utilities FY09
Chad Imprimerie Aubaine Graphic S.A. Pulp & Paper FY10

p119
Original Commitment1 Investment for IFC’s Account2
Total IFC(US$ Millions)
Total Syndications (US$ Millions)
Loan(US$ Millions)
Equity(US$ Millions)
Committed Portfolio Loan and Equity
(US$ Millions)
Total Guarantee and Risk Management
(US$ Millions)
Total IFC Committed Portfolio for Its
Own Account (US$ Millions)3
– – – – – 8.8 8.8
0.6 – 0.6 – 0.6 – 0.6
27.0 – 27.0 – 27.0 – 27.0
27.6 – 27.6 8.8 36.4
– – – – – 3.0 3.0
– – – – – 10.1 10.1
– – – 13.1 13.1
23.9 – 7.2 4.0 11.1 – 11.1
4.8 – – 4.8 4.8 – 4.8
7.2 8.7 15.9 – 15.9
0.3 – – – – 2.9 2.9
2.6 – – 2.7 2.7 – 2.7
1.2 – 1.0 – 1.0 – 1.0
20.2 – 8.1 9.3 17.4 – 17.4
2.6 – 1.8 – 1.8 – 1.8
0.5 – – 0.1 0.1 – 0.1
6.4 – – 7.0 7.0 – 7.0
10.9 19.2 30.1 2.9 32.9
0.8 – – 0.8 0.8 – 0.8
5.7 – – 1.0 1.0 – 1.0
– 1.9 1.9 – 1.9
1.3 – 0.7 – 0.7 – 0.7
1.8 – 0.9 0.9 1.8 – 1.8
89.4 – 86.0 – 86.0 – 86.0
0.4 – – 0.1 0.1 – 0.1
86.1 86.1 15.0 – 15.0 – 15.0
31.0 – 30.7 – 30.7 – 30.7
0.9 – – 0.8 0.8 – 0.8
3.8 – 3.7 – 3.7 2.2 5.9
3.0 – 2.0 – 2.0 – 2.0
2.5 – 2.4 – 2.4 – 2.4
0.9 – 0.8 – 0.8 – 0.8
3.4 – – 0.3 0.3 – 0.3
2.7 – – 0.6 0.6 – 0.6
142.2 2.7 144.9 2.2 147.1
6.1 – 0.6 – 0.6 – 0.6
5.3 – 3.8 – 3.8 – 3.8
4.4 – 4.4 – 4.4
2.8 – 2.8 – 2.8 – 2.8
2.8 – 2.8 – 2.8
2.8 – 2.8 – 2.8 – 2.8
3.3 – 3.1 – 3.1 – 3.1
2.9 – 2.8 – 2.8 – 2.8

p120
INVESTMENT PORTFOLIO Company Listing
Region Country UJV* Company Name Sector
Fiscal Year in which
Commitments Were Made
SUB–SAHARAN AFRICA
Chad Millicom Tchad S.A Information FY10
Chad Tchad Oil Transportation Company S.A. (TOTCO) Oil, Gas and Mining FY01
Congo Republic Société D’Etude De La Cellulose DU Congo Pulp & Paper FY82
Congo, Democratic Republic of Advans Banque Congo Finance & Insurance FY08, 10
Congo, Democratic Republic of Celtel Congo (RDC) s.p.r.l. Information FY07
Congo, Democratic Republic of Central Africa SME Fund C.V. Collective Investment Vehicles
FY10
Congo, Democratic Republic of First Quantum Minerals Limited Oil, Gas and Mining FY06, 09
Congo, Democratic Republic of Millicom DRC Information FY10
Congo, Democratic Republic of Pro Credit Bank SARL Finance & Insurance FY05, 10
Congo, Democratic Republic of Rawbank Commercial Banking Finance & Insurance FY08, 09
Congo, Democratic Republic of Société Financiere De Development Finance & Insurance FY70
Congo, Democratic Republic of Société Textile de Kisangani S.Z.A.R.L. Textiles, Apparel & Leather FY85
Congo, Democratic Republic of Stanbic DRC Finance & Insurance FY06
Côte d’Ivoire * Afren Côte d’Ivoire Ltd. Oil, Gas and Mining FY93, 95, 96, 98
Côte d’Ivoire Cinergy, S.A. Electric Power FY99
Côte d’Ivoire Ecobank – Côte d’Ivoire Finance & Insurance FY09
Côte d’Ivoire Industrial Promotion Services (Côte d’Ivoire) S.A. Industrial & Consumer Products
FY88
Côte d’Ivoire Ivoir-Cafe S.A. Professional, Scientifi c and Technical Services
FY93
Côte d’Ivoire Moulin Du Sud–Ouest Food & Beverages FY80
Côte d’Ivoire Multi-Produits S.A. Wholesale and Retail Trade FY94, 97
Côte d’Ivoire Société Ivoirenne D’Engrais (SIVENG) Chemicals FY80
Côte d’Ivoire Societe des Industries Alimentaires et Laitieres S.A. Food & Beverages FY88, 90
Côte d’Ivoire Société Hôtelière de la Lagune Accommodation & Tourism Services
FY00
Côte d’Ivoire Societe pour le Developpement Industriel de la Region d’Odienne
Agriculture and Forestry FY97
Côte d’Ivoire Tropical Rubber Côte d’Ivoire Agriculture and Forestry FY99
Ethiopia Derba Midroc Cement Private Limited Company Nonmetallic Mineral Product Manufacturing
FY08
Ethiopia Ethiopian Pulp and Paper, S.C. Pulp & Paper FY66
Gambia, The Coconut Company Ltd Accommodation & Tourism Services
FY09
Gambia, The Makumbaya Farms Limited Agriculture and Forestry FY91
Gambia, The Ndebaan Medi-Services Company Limited Health Care FY94
Gambia, The PELICAN SEAFOOD (GAMBIA) LIMITED Food & Beverages FY91
Ghana Advans Ghana Savings and Loans Company Limited Finance & Insurance FY08, 09
Ghana APPIAH MENKA COMPLEX LIMITED Chemicals FY91
Ghana Ashesi University College Education Services FY09
Ghana Bulk Distribution Companies Chemicals FY10
Ghana EB-ACCION Savings and Loans Company Limited Finance & Insurance FY09
Ghana Ecobank Ghana Limited Finance & Insurance FY93, 97, 08, 09
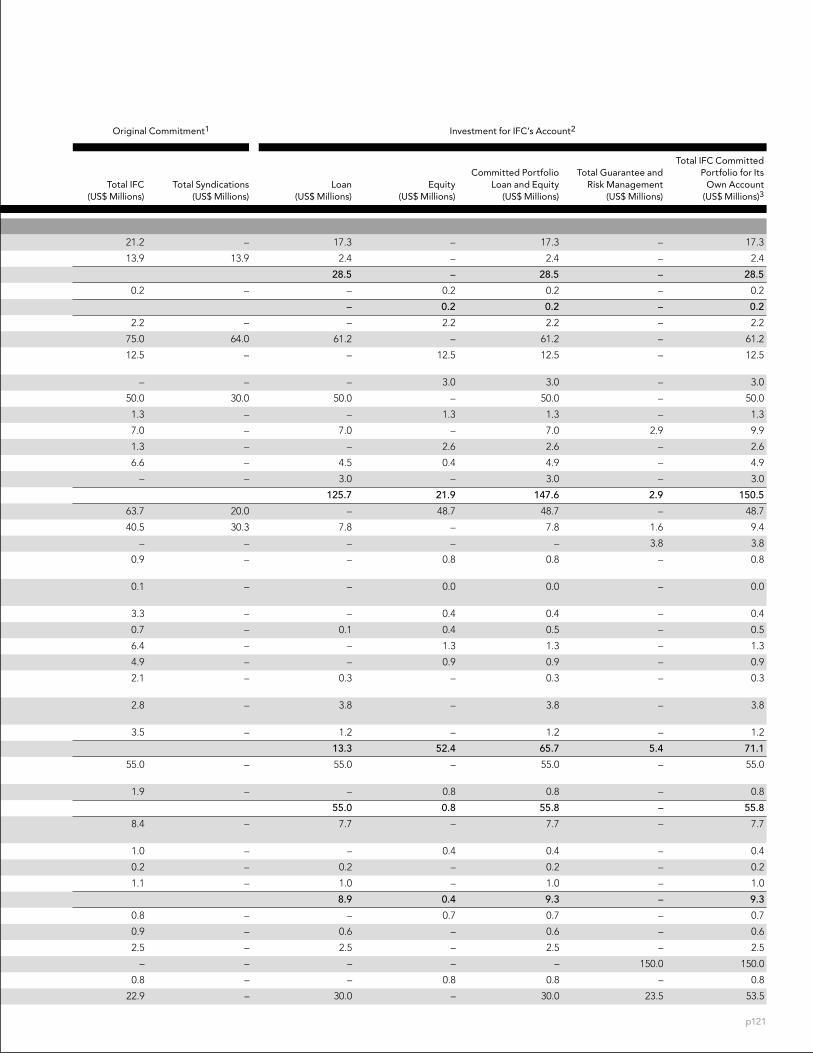
p121
Original Commitment1 Investment for IFC’s Account2
Total IFC(US$ Millions)
Total Syndications (US$ Millions)
Loan(US$ Millions)
Equity(US$ Millions)
Committed Portfolio Loan and Equity
(US$ Millions)
Total Guarantee and Risk Management
(US$ Millions)
Total IFC Committed Portfolio for Its
Own Account (US$ Millions)3
21.2 – 17.3 – 17.3 – 17.3
13.9 13.9 2.4 – 2.4 – 2.4
28.5 – 28.5 – 28.5
0.2 – – 0.2 0.2 – 0.2
– 0.2 0.2 – 0.2
2.2 – – 2.2 2.2 – 2.2
75.0 64.0 61.2 – 61.2 – 61.2
12.5 – – 12.5 12.5 – 12.5
– – – 3.0 3.0 – 3.0
50.0 30.0 50.0 – 50.0 – 50.0
1.3 – – 1.3 1.3 – 1.3
7.0 – 7.0 – 7.0 2.9 9.9
1.3 – – 2.6 2.6 – 2.6
6.6 – 4.5 0.4 4.9 – 4.9
– – 3.0 – 3.0 – 3.0
125.7 21.9 147.6 2.9 150.5
63.7 20.0 – 48.7 48.7 – 48.7
40.5 30.3 7.8 – 7.8 1.6 9.4
– – – – – 3.8 3.8
0.9 – – 0.8 0.8 – 0.8
0.1 – – 0.0 0.0 – 0.0
3.3 – – 0.4 0.4 – 0.4
0.7 – 0.1 0.4 0.5 – 0.5
6.4 – – 1.3 1.3 – 1.3
4.9 – – 0.9 0.9 – 0.9
2.1 – 0.3 – 0.3 – 0.3
2.8 – 3.8 – 3.8 – 3.8
3.5 – 1.2 – 1.2 – 1.2
13.3 52.4 65.7 5.4 71.1
55.0 – 55.0 – 55.0 – 55.0
1.9 – – 0.8 0.8 – 0.8
55.0 0.8 55.8 – 55.8
8.4 – 7.7 – 7.7 – 7.7
1.0 – – 0.4 0.4 – 0.4
0.2 – 0.2 – 0.2 – 0.2
1.1 – 1.0 – 1.0 – 1.0
8.9 0.4 9.3 – 9.3
0.8 – – 0.7 0.7 – 0.7
0.9 – 0.6 – 0.6 – 0.6
2.5 – 2.5 – 2.5 – 2.5
– – – – – 150.0 150.0
0.8 – – 0.8 0.8 – 0.8
22.9 – 30.0 – 30.0 23.5 53.5

p122
INVESTMENT PORTFOLIO Company Listing
Region Country UJV* Company Name Sector
Fiscal Year in which
Commitments Were Made
SUB–SAHARAN AFRICA
Ghana Esoko Professional, Scientifi c and Technical Services
FY10
Ghana Fidelity Bank Finance & Insurance FY08
Ghana Finatrade Holdings Limited Food & Beverages FY08
Ghana Ghana Aluminum Products Limited (Ghanal) Primary Metals FY92
Ghana Ghana Home Loans Finance & Insurance FY08, 09
Ghana Ghana Oil Palm Development Company Limited Agriculture and Forestry FY08
Ghana Ghana Primary Mortgage Market Initiative Finance & Insurance FY08
Ghana Ghana School Finance Facility Education Services FY05, 07
Ghana Kosmos Energy Finance Oil, Gas and Mining FY09
Ghana Marina Market Ghana Ltd. Wholesale and Retail Trade FY08
Ghana Merchant Bank (Ghana) Limited Finance & Insurance FY07, 08
Ghana Network Computer Systems (NCS) Information FY98
Ghana Newmont Ghana Gold Limited Oil, Gas and Mining FY07
Ghana NGB Ghana Ltd. Information FY10
Ghana SDC Finance & Leasing Co. Finance & Insurance FY91
Ghana Stanbic Bank Ghana Limited Finance & Insurance FY06, 09
Ghana StanbicGhanaLBCs Transportation and Warehousing
FY09
Ghana Tacks Farms Ghana Limited Agriculture and Forestry FY97
Ghana The Trust Bank Finance & Insurance FY07
Ghana Vodafone Ghana Information FY10
Ghana Zain Communication Ghana Limited Information FY09
Guinea SIMFER S.A. Primary Metals FY07, 08
Guinea Société Guinéenne d’Hôtellerie et d’Investissements (SGHI)
Accommodation & Tourism Services
FY95, 99
Guinea–Bissau Agribissau SARL Agriculture and Forestry FY95
Kenya Advanced Bio-Extracts Limited Chemicals FY07
Kenya Allpack Industries Limited Pulp & Paper FY87
Kenya Aureos East Africa Fund, LLC Collective Investment Vehicles
FY03
Kenya BARCLAYS BANK OF KENYA LIMITED Finance & Insurance FY06
Kenya Business Partners International Kenya SME Fund Collective Investment Vehicles
FY07
Kenya CfC Stanbic Bank Limited Finance & Insurance FY09
Kenya Diamond Trust of Kenya Limited Finance & Insurance FY82, 07, 08, 09
Kenya Ecobank Kenya Limited Finance & Insurance FY10
Kenya Fanisi Venture Capital Fund S.C.A., SICAV-SIF Collective Investment Vehicles
FY10
Kenya Faulu Kenya Limited Finance & Insurance FY09
Kenya I and M Bank Ltd. Finance & Insurance FY05, 06
Kenya Industrial Promotion Service (Kenya) Ltd. – Premiere Food Industries Ltd.
Food & Beverages FY92
Kenya Industrial Promotion Services (Kenya) Limited Collective Investment Vehicles
FY82, 04
Kenya Industrial Promotion Services (Kenya) Ltd. – Frigoken Ltd.
Transportation and Warehousing
FY92

p123
Original Commitment1 Investment for IFC’s Account2
Total IFC(US$ Millions)
Total Syndications (US$ Millions)
Loan(US$ Millions)
Equity(US$ Millions)
Committed Portfolio Loan and Equity
(US$ Millions)
Total Guarantee and Risk Management
(US$ Millions)
Total IFC Committed Portfolio for Its
Own Account (US$ Millions)3
1.3 – – 1.3 1.3 – 1.3
– – 5.0 – 5.0 – 5.0
20.0 – 20.0 – 20.0 – 20.0
0.4 – – 0.4 0.4 – 0.4
0.9 – – 0.9 0.9 – 0.9
12.5 – 12.5 – 12.5 – 12.5
35.0 – 10.0 – 10.0 – 10.0
– – – – – 1.3 1.3
100.0 – 100.0 – 100.0 – 100.0
4.7 – 4.7 – 4.7 – 4.7
– – 10.0 – 10.0 6.5 16.5
0.7 – 0.5 – 0.5 – 0.5
75.0 10.0 61.8 – 61.8 – 61.8
2.5 – – 2.5 2.5 – 2.5
0.2 – – 0.5 0.5 – 0.5
– – 13.0 – 13.0 – 13.0
– – – – – 26.3 26.3
0.4 – 0.4 – 0.4 – 0.4
– – – – – 3.2 3.2
100.0 – 100.0 – 100.0 – 100.0
90.0 57.5 90.0 – 90.0 – 90.0
461.1 7.1 468.2 210.7 678.9
35.0 – 33.7 1.3 35.0 – 35.0
4.7 – – 0.6 0.6 – 0.6
33.7 1.8 35.6 – 35.6
0.9 – – 0.1 0.1 – 0.1
– 0.1 0.1 – 0.1
7.0 – 6.0 1.0 7.0 – 7.0
0.4 – – 0.4 0.4 – 0.4
4.0 – – 2.7 2.7 – 2.7
– – – – – 2.7 2.7
5.0 – – 5.0 5.0 – 5.0
– – 10.0 – 10.0 – 10.0
29.5 – 25.0 4.5 29.5 0.6 30.1
12.5 – 12.5 – 12.5 – 12.5
7.5 – – 7.5 7.5 – 7.5
– – – – – 4.4 4.4
3.0 – 0.6 – 0.6 12.2 12.8
0.1 – – 0.1 0.1 – 0.1
5.8 – – 5.7 5.7 – 5.7
0.1 – – 0.1 0.1 – 0.1

p124
INVESTMENT PORTFOLIO Company Listing
Region Country UJV* Company Name Sector
Fiscal Year in which
Commitments Were Made
SUB–SAHARAN AFRICA
Kenya Kenya Commercial Bank Finance & Insurance FY08
Kenya Kenya School Financing Facility Education Services FY07
Kenya Kingdom Hotel Investments Accommodation & Tourism Services
FY06
Kenya Kongoni River Farm Limited Agriculture and Forestry FY05
Kenya K-Rep Bank Limited Finance & Insurance FY97, 99, 07, 09
Kenya Magadi Soda Company Ltd. Chemicals FY96, 04, 05
Kenya Oil Crop Development Limited Agriculture and Forestry FY86
Kenya Prime Bank Limited Finance & Insurance FY07
Kenya Rift Valley Textiles Limited Textiles, Apparel & Leather FY76
Kenya Safal Investments (Mauritius) Ltd. Primary Metals FY07
Kenya Strathmore University Education Services FY08
Kenya TPS Eastern Africa Limited Accommodation & Tourism Services
FY72
Kenya Tsavo Power Company Ltd. Electric Power FY00, 01, 07
Liberia AccessBank Liberia Finance & Insurance FY09, 10
Liberia Ecobank Liberia Finance & Insurance FY10
Liberia Liberian Bank for Development and Investment Finance & Insurance FY66, 77, 08
Liberia Liberian Timber and Plywood Operation Company Industrial & Consumer Products
FY88
Liberia Salala Rubber Corporation Agriculture and Forestry FY09
Madagascar AccesBanque Madagascar Finance & Insurance FY07
Madagascar Bank of Africa Madagascar Finance & Insurance FY00, 08, 09
Madagascar BFV-Societe Generale Finance & Insurance FY06
Madagascar BNI Leasing Finance & Insurance FY07
Madagascar BNI-Madagascar Finance & Insurance FY92, 05, 06, 07
Madagascar Business Partners International Madagascar Investment Fund LLC
Collective Investment Vehicles
FY06
Madagascar Celtel Madagascar Limited Information FY07
Madagascar MicroCred Madagascar S.A. Finance & Insurance FY07
Malawi Bakhresa Grain Milling (Malawi) Limited Food & Beverages FY08
Malawi Celtel Malawi Limited Information FY07
Malawi First Merchant Bank Malawi Ltd. Finance & Insurance FY08
Malawi National Insurance Company Limited (NICO) Finance & Insurance FY00
Malawi NBS Bank Limited Finance & Insurance FY08, 10
Malawi Stanbic Malawi Finance & Insurance FY10
Mali Bank of Africa Mali Finance & Insurance FY09
Mali Ecobank Mali Finance & Insurance FY09, 10
Mali Grands Moulins du Mali S.A. Food & Beverages FY09
Mali Graphique Industrie S.A. Pulp & Paper FY99, 09
Mali Société Industrielle de Karite du Mali, S.A. Agriculture and Forestry FY82
Mali Société Industrielle d’Emballage et de Conditionnement
Plastics & Rubber FY99

p125
Original Commitment1 Investment for IFC’s Account2
Total IFC(US$ Millions)
Total Syndications (US$ Millions)
Loan(US$ Millions)
Equity(US$ Millions)
Committed Portfolio Loan and Equity
(US$ Millions)
Total Guarantee and Risk Management
(US$ Millions)
Total IFC Committed Portfolio for Its
Own Account (US$ Millions)3
– – – – – 23.9 23.9
– – – – – 0.7 0.7
12.0 – 12.0 – 12.0 – 12.0
2.0 – 0.8 – 0.8 – 0.8
5.3 – – 4.6 4.6 – 4.6
35.0 – – – – 3.1 3.1
2.2 – – 0.7 0.7 – 0.7
– – – – – 2.1 2.1
9.6 1.3 – 2.5 2.5 – 2.5
40.0 – 5.0 – 5.0 – 5.0
– – – – – 1.6 1.6
1.6 0.8 – 1.8 1.8 – 1.8
17.6 23.5 3.8 0.8 4.6 0.0 4.6
75.6 37.3 113.0 51.3 164.2
1.5 – – 1.5 1.5 – 1.5
3.0 – 3.0 – 3.0 – 3.0
0.7 – – 1.4 1.4 0.3 1.7
8.5 – 7.2 – 7.2 – 7.2
10.0 – 10.0 – 10.0 – 10.0
20.2 2.9 23.2 0.3 23.5
0.5 – – 0.5 0.5 – 0.5
2.6 – – 2.5 2.5 8.0 10.4
– – – – – 0.9 0.9
– – – 0.1 0.1 – 0.1
1.9 – – 2.6 2.6 3.6 6.2
3.3 – – 3.6 3.6 – 3.6
25.0 21.0 23.4 – 23.4 – 23.4
0.6 – – 0.7 0.7 3.1 3.7
23.4 10.0 33.4 15.6 48.9
5.0 – 4.6 – 4.6 – 4.6
15.0 9.5 11.6 – 11.6 – 11.6
– – – – – 2.4 2.4
1.0 – – 3.2 3.2 – 3.2
3.0 – 2.0 – 2.0 6.8 8.8
– – – – – 5.8 5.8
18.2 3.2 21.4 15.0 36.4
– – – – – 5.2 5.2
– – – – – 6.2 6.2
11.7 – 9.8 – 9.8 – 9.8
10.6 – 9.2 – 9.2 – 9.2
2.5 – 2.2 0.5 2.6 – 2.6
0.3 – 0.3 – 0.3 – 0.3

p126
INVESTMENT PORTFOLIO Company Listing
Region Country UJV* Company Name Sector
Fiscal Year in which
Commitments Were Made
SUB–SAHARAN AFRICA
Mali Société Malienne de Promotion Hôtelière Accommodation & Tourism Services
FY94, 98, 03
Mauritania Generale de Banque de Mauritanie pour l’Investissement et le Commerce
Finance & Insurance FY98, 00, 04, 05, 06
Mauritius Africa Health Fund LLC Collective Investment Vehicles
FY09
Mauritius Baobab Investments Limited Transportation and Warehousing
FY10
Mauritius Saxon Management Limited and Saxon Properties Limited
Accommodation & Tourism Services
FY90
Mauritius Socota Textile Mills Limited Textiles, Apparel & Leather FY87
Mauritius Standard Bank Mauritius Ltd Finance & Insurance FY06
Mauritius Trident Enterprises Limited Transportation and Warehousing
FY09
Mozambique AFRICAN BANKING CORPORATION MOZAMBIQUE Finance & Insurance FY10
Mozambique Ausmoz Farm Holdings, Lda. Agriculture and Forestry FY01
Mozambique Bakhresa Grain Milling (Mozambique) Limitada Food & Beverages FY09, 10
Mozambique Banco Comerciale de Investimentos Fomento Finance & Insurance FY09, 10
Mozambique Baobab Resources Plc Oil, Gas and Mining FY09
Mozambique * Baobab Resources UJV Oil, Gas and Mining FY09
Mozambique * Empresa Nacional de Hidrocarbonetos de Mozambique
Oil, Gas and Mining FY04
Mozambique Merec Industries, Lda. Food & Beverages FY01, 04, 09
Mozambique Mozambique Aluminum S.A.R.L. (MOZAL) Primary Metals FY98, 01
Namibia Novanam Limited Agriculture and Forestry FY95, 97, 98, 03
Niger Ecobank Niger Finance & Insurance FY09
Niger Les Moulines Du Sahel, S.A. Food & Beverages FY82
Niger Marina Market Sarl (for Niger) Wholesale and Retail Trade FY08
Nigeria AB Nigeria Microfi nance Bank Finance & Insurance FY09
Nigeria Access Bank Plc Finance & Insurance FY06, 08
Nigeria Accion Nigeria Finance & Insurance FY05
Nigeria Adlevo Capital Africa LLC Collective Investment Vehicles
FY10
Nigeria African Reinsurance Corporation Finance & Insurance FY05
Nigeria Arewa Textiles, Ltd. Textiles, Apparel & Leather FY64, 67, 70, 92
Nigeria Capic Hexagon Limited Accommodation & Tourism Services
FY10
Nigeria Capital Alliance Private Equity (Mauritius), Ltd. Collective Investment Vehicles
FY00
Nigeria Capital Alliance Private Equity Fund III Limited Collective Investment Vehicles
FY09
Nigeria Capital Alliance Private Equity II, Limited Collective Investment Vehicles
FY06
Nigeria Capital Alliance Property Investment Company L.P. Collective Investment Vehicles
FY09

p127
Original Commitment1 Investment for IFC’s Account2
Total IFC(US$ Millions)
Total Syndications (US$ Millions)
Loan(US$ Millions)
Equity(US$ Millions)
Committed Portfolio Loan and Equity
(US$ Millions)
Total Guarantee and Risk Management
(US$ Millions)
Total IFC Committed Portfolio for Its
Own Account (US$ Millions)3
4.3 – 1.3 – 1.3 – 1.3
22.8 0.5 23.3 11.4 34.7
26.1 – 8.6 – 8.6 1.0 9.6
8.6 – 8.6 1.0 9.6
20.0 – – 20.0 20.0 – 20.0
3.0 – 0.8 2.3 3.0 – 3.0
3.0 – – 1.0 1.0 – 1.0
6.0 – – 1.0 1.0 – 1.0
– – 20.0 – 20.0 – 20.0
7.0 – 7.0 – 7.0 – 7.0
27.8 24.2 52.0 – 52.0
– – – – – 3.5 3.5
0.7 – 0.7 – 0.7 – 0.7
15.0 – 14.5 – 14.5 – 14.5
38.5 – 38.5 – 38.5 – 38.5
5.0 – – 1.4 1.4 – 1.4
– – – 3.6 3.6 – 3.6
18.5 – – 18.5 18.5 – 18.5
7.0 – 5.4 – 5.4 – 5.4
121.3 – 38.2 – 38.2 – 38.2
97.3 23.5 120.8 3.5 124.3
16.0 – 0.5 – 0.5 – 0.5
0.5 – 0.5 – 0.5
– – – – – 4.0 4.0
1.9 – – 0.2 0.2 – 0.2
0.6 – 0.5 – 0.5 – 0.5
0.5 0.2 0.7 4.0 4.7
4.5 – 3.2 1.1 4.3 – 4.3
15.0 – 11.3 3.8 15.0 94.8 109.8
1.9 – – 1.9 1.9 – 1.9
10.0 – – 10.0 10.0 – 10.0
10.4 – – 10.4 10.4 – 10.4
6.6 0.7 – 0.6 0.6 – 0.6
5.5 – 5.5 – 5.5 – 5.5
7.5 – – 0.4 0.4 – 0.4
30.0 – – 30.0 30.0 – 30.0
10.0 – – 7.3 7.3 – 7.3
10.0 – – 10.0 10.0 – 10.0
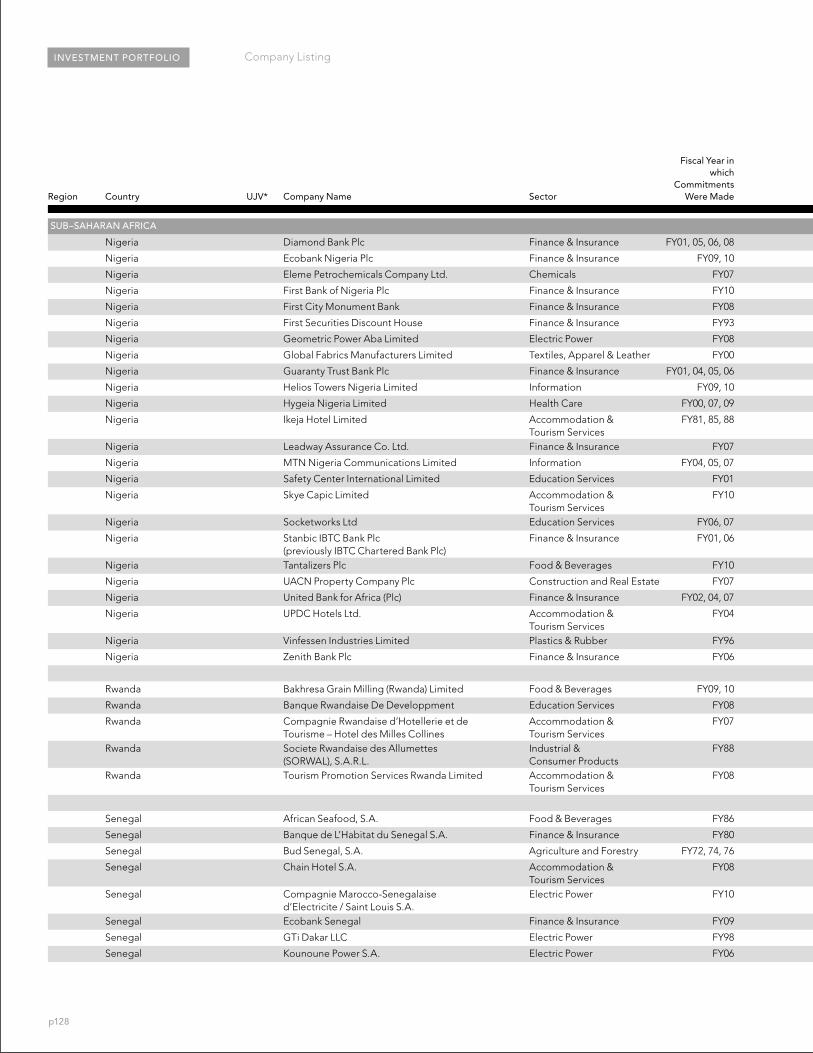
p128
INVESTMENT PORTFOLIO Company Listing
Region Country UJV* Company Name Sector
Fiscal Year in which
Commitments Were Made
SUB–SAHARAN AFRICA
Nigeria Diamond Bank Plc Finance & Insurance FY01, 05, 06, 08
Nigeria Ecobank Nigeria Plc Finance & Insurance FY09, 10
Nigeria Eleme Petrochemicals Company Ltd. Chemicals FY07
Nigeria First Bank of Nigeria Plc Finance & Insurance FY10
Nigeria First City Monument Bank Finance & Insurance FY08
Nigeria First Securities Discount House Finance & Insurance FY93
Nigeria Geometric Power Aba Limited Electric Power FY08
Nigeria Global Fabrics Manufacturers Limited Textiles, Apparel & Leather FY00
Nigeria Guaranty Trust Bank Plc Finance & Insurance FY01, 04, 05, 06
Nigeria Helios Towers Nigeria Limited Information FY09, 10
Nigeria Hygeia Nigeria Limited Health Care FY00, 07, 09
Nigeria Ikeja Hotel Limited Accommodation & Tourism Services
FY81, 85, 88
Nigeria Leadway Assurance Co. Ltd. Finance & Insurance FY07
Nigeria MTN Nigeria Communications Limited Information FY04, 05, 07
Nigeria Safety Center International Limited Education Services FY01
Nigeria Skye Capic Limited Accommodation & Tourism Services
FY10
Nigeria Socketworks Ltd Education Services FY06, 07
Nigeria Stanbic IBTC Bank Plc (previously IBTC Chartered Bank Plc)
Finance & Insurance FY01, 06
Nigeria Tantalizers Plc Food & Beverages FY10
Nigeria UACN Property Company Plc Construction and Real Estate FY07
Nigeria United Bank for Africa (Plc) Finance & Insurance FY02, 04, 07
Nigeria UPDC Hotels Ltd. Accommodation & Tourism Services
FY04
Nigeria Vinfessen Industries Limited Plastics & Rubber FY96
Nigeria Zenith Bank Plc Finance & Insurance FY06
Rwanda Bakhresa Grain Milling (Rwanda) Limited Food & Beverages FY09, 10
Rwanda Banque Rwandaise De Developpment Education Services FY08
Rwanda Compagnie Rwandaise d’Hotellerie et de Tourisme – Hotel des Milles Collines
Accommodation & Tourism Services
FY07
Rwanda Societe Rwandaise des Allumettes (SORWAL), S.A.R.L.
Industrial & Consumer Products
FY88
Rwanda Tourism Promotion Services Rwanda Limited Accommodation & Tourism Services
FY08
Senegal African Seafood, S.A. Food & Beverages FY86
Senegal Banque de L’Habitat du Senegal S.A. Finance & Insurance FY80
Senegal Bud Senegal, S.A. Agriculture and Forestry FY72, 74, 76
Senegal Chain Hotel S.A. Accommodation & Tourism Services
FY08
Senegal Compagnie Marocco-Senegalaise d’Electricite / Saint Louis S.A.
Electric Power FY10
Senegal Ecobank Senegal Finance & Insurance FY09
Senegal GTi Dakar LLC Electric Power FY98
Senegal Kounoune Power S.A. Electric Power FY06

p129
Original Commitment1 Investment for IFC’s Account2
Total IFC(US$ Millions)
Total Syndications (US$ Millions)
Loan(US$ Millions)
Equity(US$ Millions)
Committed Portfolio Loan and Equity
(US$ Millions)
Total Guarantee and Risk Management
(US$ Millions)
Total IFC Committed Portfolio for Its
Own Account (US$ Millions)3
90.0 – 36.4 – 36.4 18.0 54.4
25.0 – 22.7 – 22.7 12.7 35.4
75.0 80.0 20.7 – 20.7 – 20.7
87.5 – 87.5 – 87.5 – 87.5
– – – – – 5.3 5.3
0.9 – – 0.9 0.9 – 0.9
4.0 – – 4.0 4.0 – 4.0
0.3 – 0.3 – 0.3 – 0.3
90.0 – 52.1 – 52.1 20.9 73.0
100.0 44.0 103.5 – 103.5 9.7 113.2
7.6 – 6.0 – 6.0 – 6.0
12.6 – – 0.4 0.4 – 0.4
13.3 – – 13.3 13.3 – 13.3
86.8 – – 16.8 16.8 – 16.8
0.6 – 0.3 0.1 0.4 – 0.4
6.6 – 6.6 – 6.6 – 6.6
5.3 – 3.1 – 3.1 – 3.1
50.0 – 6.6 – 6.6 – 6.6
8.5 – 7.0 1.6 8.6 – 8.6
40.0 – 33.7 – 33.7 – 33.7
50.0 – – 50.0 50.0 – 50.0
11.0 – 4.0 – 4.0 – 4.0
1.0 – 1.0 – 1.0 – 1.0
– – – – – 25.5 25.5
411.4 162.4 573.8 186.9 760.7
10.5 – 10.5 – 10.5 – 10.5
– – – – – 4.4 4.4
2.5 – 2.5 – 2.5 – 2.5
1.2 – 1.0 0.2 1.2 – 1.2
7.0 – 3.5 3.0 6.4 – 6.4
17.5 3.1 20.6 4.4 25.0
3.0 – – 0.7 0.7 – 0.7
0.4 – – 0.5 0.5 – 0.5
0.9 – – 0.8 0.8 – 0.8
10.5 – 8.4 – 8.4 – 8.4
0.8 – – 0.8 0.8 – 0.8
– – – – – 1.8 1.8
12.3 11.6 3.3 1.7 4.9 1.2 6.1
18.3 – 13.9 – 13.9 – 13.9

p130
INVESTMENT PORTFOLIO Company Listing
Region Country UJV* Company Name Sector
Fiscal Year in which
Commitments Were Made
SUB–SAHARAN AFRICA
Senegal MicroCred Senegal Finance & Insurance FY10
Senegal Société Financiere Senegalaise Pour Le Development De L’Industrie Tourisme
Finance & Insurance FY74, 85
Senegal Sococim Industries Nonmetallic Mineral Product Manufacturing
FY07
Sierra Leone Celtel Sierra Leone Ltd. Information FY00, 07
Sierra Leone Sierra Leone Commercial Bank Finance & Insurance FY08
Somalia Somali Molasses Company Limited Transportation and Warehousing
FY81
South Africa Absa Bank Limited Finance & Insurance FY10
South Africa Africa Infrastructure Investment Fund 2 Collective Investment Vehicles
FY10
South Africa Africa Microfi nance Ltd. Collective Investment Vehicles
FY02
South Africa African Bank Limited Finance & Insurance FY02, 04, 09
South Africa Brait IV L.P. Collective Investment Vehicles
FY07
South Africa Buffalo City Municipality Finance & Insurance FY06
South Africa City of Johannesburg Utilities FY04
South Africa Columbus Stainless (Pty) Limited Primary Metals FY09
South Africa Curro Holdings Pty Limited Education Services FY10
South Africa Ethos Private Equity Fund V Collective Investment Vehicles
FY06
South Africa FirstRand Limited Finance & Insurance FY05
South Africa Hernic Ferrochrome Pty Limited Oil, Gas and Mining FY04, 06, 10
South Africa Horizon Equity Fund III Collective Investment Vehicles
FY07
South Africa Karsten Farms (Pty) Limited Agriculture and Forestry FY06
South Africa Life Healthcare Group Pty Ltd. Health Care FY10
South Africa Marico South Africa(Pty) Limited Food & Beverages FY10
South Africa Midrand Days Inn Accommodation & Tourism Services
FY98
South Africa Nedbank Group Limited Finance & Insurance FY08
South Africa New Africa Mining Fund Collective Investment Vehicles
FY03
South Africa Omnia Fertilizer Limited Chemicals FY08
South Africa Petra Diamonds Limited Oil, Gas and Mining FY03
South Africa Safal Steel (pty) Ltd. Primary Metals FY07
South Africa Sasfi n Bank Limited Finance & Insurance FY09
South Africa Sonae Novobord Ltd. Industrial & Consumer Products
FY07
South Africa South Africa Capital Growth Fund, Ltd. Collective Investment Vehicles
FY96
South Africa South Africa Private Equity Fund III, L.P. Collective Investment Vehicles
FY99
South Africa Sphere Private Equity Fund I Collective Investment Vehicles
FY06
South Africa Standard Bank of South Africa Ltd. Finance & Insurance FY09, 10

p131
Original Commitment1 Investment for IFC’s Account2
Total IFC(US$ Millions)
Total Syndications (US$ Millions)
Loan(US$ Millions)
Equity(US$ Millions)
Committed Portfolio Loan and Equity
(US$ Millions)
Total Guarantee and Risk Management
(US$ Millions)
Total IFC Committed Portfolio for Its
Own Account (US$ Millions)3
1.3 – – 1.2 1.2 – 1.2
0.3 – – 0.3 0.3 – 0.3
26.3 – 21.1 – 21.1 – 21.1
46.7 6.0 52.6 3.0 55.7
29.0 8.4 23.1 – 23.1 – 23.1
– – – – – 0.2 0.2
23.1 – 23.1 0.2 23.3
0.4 – 0.0 – 0.0 – 0.0
0.0 – 0.0 – 0.0
120.0 – 120.0 – 120.0 – 120.0
100.0 – – 100.0 100.0 – 100.0
2.0 – – 0.6 0.6 – 0.6
50.0 – 45.9 – 45.9 – 45.9
25.0 – – 24.6 24.6 – 24.6
– – – – – 5.3 5.3
– – – – – 26.2 26.2
50.0 – 52.1 – 52.1 – 52.1
9.4 – 9.5 – 9.5 – 9.5
25.0 – – 20.1 20.1 – 20.1
27.2 – 0.0 – 0.0 – 0.0
34.8 – 17.5 4.7 22.2 3.7 25.9
10.0 – – 9.1 9.1 – 9.1
7.2 – 3.9 – 3.9 – 3.9
100.0 – – 100.0 100.0 – 100.0
5.0 – 5.0 – 5.0 – 5.0
1.4 – – 0.4 0.4 – 0.4
138.9 – 131.1 – 131.1 – 131.1
5.0 – – 2.6 2.6 – 2.6
– – – – – 31.8 31.8
– – – 2.0 2.0 – 2.0
– – 25.0 – 25.0 – 25.0
20.4 – 10.8 10.0 20.8 2.8 23.6
10.1 – 7.6 – 7.6 – 7.6
20.0 – – 0.0 0.0 – 0.0
35.0 – – 1.7 1.7 – 1.7
5.2 – – 3.6 3.6 – 3.6
100.0 – 100.0 – 100.0 – 100.0

p132
INVESTMENT PORTFOLIO Company Listing
Region Country UJV* Company Name Sector
Fiscal Year in which
Commitments Were Made
SUB–SAHARAN AFRICA
South Africa The Biotech Venture Partners Fund Collective Investment Vehicles
FY02
South Africa Western Platinum Ltd. Oil, Gas and Mining FY07, 09
South Africa WIZZIT Payments (Pty) Ltd. Information FY08
Sudan Gezira Managil Textile Company Limited Textiles, Apparel & Leather FY78
Sudan River Nile Petroleum Company Limited Transportation and Warehousing
FY82
Sudan Sudan Eagle Cement Company Ltd. Nonmetallic Mineral Product Manufacturing
FY80
Swaziland Mbabane Concerte Centre (Pty) Limited Oil, Gas and Mining FY92
Swaziland Micro Provident Swaziland (Pty) Ltd. Finance & Insurance FY08
Swaziland Swazi Paper Mills Ltd. Pulp & Paper FY95, 02
Tanzania, United Republic of AccessBank Tanzania Limited Finance & Insurance FY08, 09, 10
Tanzania, United Republic of Alaf Ltd. Primary Metals FY07
Tanzania, United Republic of Bonite Bottlers Limited Food & Beverages FY05
Tanzania, United Republic of Boundary Hill Lodge Limited Accommodation & Tourism Services
FY01
Tanzania, United Republic of CRJE Estate Limited Construction and Real Estate FY10
Tanzania, United Republic of Exim Bank of Tanzania Finance & Insurance FY02, 05, 07
Tanzania, United Republic of Export Trading Co. Ltd. Wholesale and Retail Trade FY10
Tanzania, United Republic of Green Resources AS Agriculture and Forestry FY09
Tanzania, United Republic of Helio Resource Corp Oil, Gas and Mining FY10
Tanzania, United Republic of Highland Soap and Allied Products Limited Chemicals FY78
Tanzania, United Republic of National Bank of Commerce (NBC) Finance & Insurance FY01
Tanzania, United Republic of Ocean Leisure Company Ltd. Accommodation & Tourism Services
FY08
Tanzania, United Republic of Stanbic Tanzania Limited Finance & Insurance FY06
Tanzania, United Republic of Tanzania Breweries Limited Food & Beverages FY95
Tanzania, United Republic of Tanzania Railway Corporation Transportation and Warehousing
FY08
Togo ContourGlobal Togo SA Electric Power FY10
Togo Ecobank Togo Finance & Insurance FY09
Togo Société Togolaise De Products Marins (STPM) Food & Beverages FY92, 95
Togo SOCIETE TRANSAM–P SARL Chemicals FY07
Uganda Agro Management Limited Chemicals FY96
Uganda Bujagali Energy Limited Electric Power FY07
Uganda CelTel Limited (Uganda) Information FY95, 01, 07
Uganda Clovergem Fish and Foods Limited Food & Beverages FY93
Uganda DFCU BANK LTD Finance & Insurance FY05, 07
Uganda Nakasero Hospital Health Care FY10
Uganda Orient Bank Limited Finance & Insurance FY07
Uganda Pine Investements Limited Construction and Real Estate FY09
Uganda Stanbic Bank Uganda Limited Finance & Insurance FY09

p133
Original Commitment1 Investment for IFC’s Account2
Total IFC(US$ Millions)
Total Syndications (US$ Millions)
Loan(US$ Millions)
Equity(US$ Millions)
Committed Portfolio Loan and Equity
(US$ Millions)
Total Guarantee and Risk Management
(US$ Millions)
Total IFC Committed Portfolio for Its
Own Account (US$ Millions)3
1.8 – – 1.2 1.2 – 1.2
55.0 – – 32.5 32.5 – 32.5
2.0 – – 2.0 2.0 – 2.0
528.4 315.1 843.6 69.9 913.5
8.4 – 6.7 1.4 8.1 – 8.1
0.3 – – 0.3 0.3 – 0.3
0.3 – – 0.2 0.2 – 0.2
6.7 1.9 8.6 – 8.6
0.7 – – 0.3 0.3 – 0.3
– – 5.6 – 5.6 – 5.6
8.8 – 3.9 – 3.9 – 3.9
9.6 0.3 9.9 – 9.9
3.5 – 1.9 1.2 3.1 – 3.1
– – 3.9 – 3.9 – 3.9
10.0 – 4.0 – 4.0 – 4.0
0.2 – 0.2 – 0.2 – 0.2
10.0 – 10.0 – 10.0 – 10.0
8.5 – 2.6 – 2.6 1.7 4.3
– – – – – 40.0 40.0
18.0 – 18.0 – 18.0 – 18.0
7.6 – – 7.6 7.6 – 7.6
1.8 – – 0.4 0.4 – 0.4
4.0 – – 4.0 4.0 – 4.0
11.0 – 9.9 – 9.9 – 9.9
– – 3.0 – 3.0 – 3.0
6.0 – – 3.2 3.2 – 3.2
44.0 – 44.0 – 44.0 – 44.0
97.6 16.4 113.9 41.7 155.7
14.0 – 9.0 5.0 14.0 – 14.0
– – – – – 2.5 2.5
0.3 – – 0.1 0.1 – 0.1
1.6 – 1.2 – 1.2 – 1.2
10.2 5.1 15.3 2.5 17.8
1.0 – – 0.4 0.4 – 0.4
130.0 – 130.0 – 130.0 – 130.0
30.3 11.5 16.3 – 16.3 – 16.3
1.0 – 0.8 – 0.8 – 0.8
– – 10.1 – 10.1 – 10.1
3.0 – 3.0 – 3.0 – 3.0
– – – – – 3.0 3.0
5.0 – 5.0 – 5.0 – 5.0
– – – – – 1.9 1.9

p134
INVESTMENT PORTFOLIO Company Listing
Region Country UJV* Company Name Sector
Fiscal Year in which
Commitments Were Made
SUB–SAHARAN AFRICA
Uganda Umeme Ltd. Electric Power FY09
Zambia AFRICAN BANKING CORPORATION ZAMBIA Finance & Insurance FY10
Zambia Celtel Zambia Limited Information FY99, 00, 04
Zambia Development Bank of Zambia Finance & Insurance FY76
Zambia Drilltech Engineering Limited Oil, Gas and Mining FY99
Zambia Letshego Financial Services Limited Finance & Insurance FY08
Zambia Madison Financial Services Company Limited Finance & Insurance FY08
Zambia MASSTOCK (ZAMBIA) LIMITED Agriculture and Forestry FY89
Zambia Mpongwe Development Company Limited Agriculture and Forestry FY85
Zambia Protea Hotel Arcades Limited. Accommodation & Tourism Services
FY07
Zambia Stanbic Bank Zambia Limited Finance & Insurance FY07
Zambia Zambeef Products Plc Agriculture and Forestry FY10
Zambia Zambia National Commercial Bank Plc Finance & Insurance FY10
Zimbabwe Agfl ora (PVT) Limited Agriculture and Forestry FY97
Zimbabwe Deraswiss Zimbabwe (Pvt) Ltd. Textiles, Apparel & Leather FY00
Zimbabwe Hy–Veld Holdings (Pvt) Limited and Extraction Incorporated (Pvt) Limited
Food & Beverages FY99
Zimbabwe Isfar (Pvt) Limited Textiles, Apparel & Leather FY97
Zimbabwe Itachi Plastics (PVT) Limited Plastics & Rubber FY96
Zimbabwe Lowveld Leather (PVT) Limited Textiles, Apparel & Leather FY97
Zimbabwe Shagelok Chemicals (Pvt) Ltd. Chemicals FY97
Zimbabwe Stone One Holdings Limited, Zimbabwe Oil, Gas and Mining FY96
Africa Region Afren Plc Oil, Gas and Mining FY05
Africa Region Africa Banking Corp. Finance & Insurance FY90, 92, 02, 08
Africa Region Africa International Financial Holdings, LLC Collective Investment Vehicles
FY03
Africa Region African Development Partners I, LLC Collective Investment Vehicles
FY10
Africa Region Africinvest II Fund, LLC Collective Investment Vehicles
FY08, 10
Africa Region AIG African Infrastructure Management LLC Collective Investment Vehicles
FY00
Africa Region AKFED SA Finance & Insurance FY10
Africa Region Atlantic Coast Regional Fund LLC Collective Investment Vehicles
FY08
Africa Region Aureos Africa Fund LLC Collective Investment Vehicles
FY09
Africa Region Coca Cola SABCO (Pty) Ltd. Food & Beverages FY02, 06
Africa Region Ecobank Transnational Incorporated Finance & Insurance FY99, 09
Africa Region ECP Africa Fund III, PCC Collective Investment Vehicles
FY10
Africa Region Emerging Africa Infrastructure Fund Ltd. Finance & Insurance FY10
Africa Region GEF Africa Sustainable Forestry Fund L.P. Collective Investment Vehicles
FY10
Africa Region GroFin Africa Fund Collective Investment Vehicles
FY08

p135
Original Commitment1 Investment for IFC’s Account2
Total IFC(US$ Millions)
Total Syndications (US$ Millions)
Loan(US$ Millions)
Equity(US$ Millions)
Committed Portfolio Loan and Equity
(US$ Millions)
Total Guarantee and Risk Management
(US$ Millions)
Total IFC Committed Portfolio for Its
Own Account (US$ Millions)3
25.0 – 25.0 – 25.0 – 25.0
190.3 0.4 190.7 4.9 195.5
– – – – – 0.0 0.0
9.1 – – 0.2 0.2 – 0.2
0.5 – – 0.5 0.5 – 0.5
0.2 – 0.1 – 0.1 – 0.1
– – 1.5 – 1.5 – 1.5
7.0 – 2.9 2.0 4.9 – 4.9
2.2 – 2.2 – 2.2 – 2.2
1.8 – – 0.3 0.3 – 0.3
1.8 – 1.2 – 1.2 – 1.2
– – 11.0 – 11.0 – 11.0
10.0 – 10.0 – 10.0 – 10.0
25.0 – 25.0 – 25.0 – 25.0
54.0 3.0 57.0 0.0 57.0
0.2 – 0.2 – 0.2 – 0.2
1.0 – 1.2 – 1.2 – 1.2
1.3 – 0.1 – 0.1 – 0.1
0.1 – 0.1 – 0.1 – 0.1
0.4 – 0.3 0.0 0.3 – 0.3
0.5 – – 0.2 0.2 – 0.2
1.1 – 0.9 0.2 1.0 – 1.0
1.5 – 0.9 – 0.9 – 0.9
3.6 0.4 4.0 – 4.0
1.0 – – 0.8 0.8 – 0.8
23.0 – 13.5 7.5 21.0 – 21.0
1.8 – – 1.8 1.8 – 1.8
24.4 – – 20.3 20.3 – 20.3
28.5 – – 24.9 24.9 – 24.9
0.2 – – 0.1 0.1 – 0.1
25.0 – 25.0 – 25.0 – 25.0
15.0 – – 15.0 15.0 – 15.0
40.0 – – 40.0 40.0 – 40.0
80.0 – 54.2 – 54.2 – 54.2
107.5 – – 100.0 100.0 – 100.0
25.0 – – 25.0 25.0 – 25.0
48.8 – 48.8 – 48.8 – 48.8
20.0 – – 20.0 20.0 – 20.0
30.0 – – 30.0 30.0 – 30.0

p136
INVESTMENT PORTFOLIO Company Listing
Region Country UJV* Company Name Sector
Fiscal Year in which
Commitments Were Made
SUB–SAHARAN AFRICA
Africa Region Groupe Industriel Madiou Simpara S.A. Food & Beverages FY10
Africa Region Helios Towers Africa Limited Information FY10
Africa Region Horus Development Finance Finance & Insurance FY06, 10
Africa Region I&P Capital (II) Ltd. Collective Investment Vehicles
FY08
Africa Region Investment Fund for Health in Africa B.V. Collective Investment Vehicles
FY10
Africa Region New Africa Mining Fund II Collective Investment Vehicles
FY10
Africa Region Nyota Minerals Limited Oil, Gas and Mining FY10
Africa Region Pan African Investment Partners Ltd. Collective Investment Vehicles
FY04
Africa Region Pan–African Investment Partners II Limited Collective Investment Vehicles
FY08
Africa Region Regional MSME Investment Fund for Sub–Saharan Africa
Finance & Insurance FY10
Africa Region Scancem International ANS Nonmetallic Mineral Product Manufacturing
FY10
Africa Region The AIG African Infrastructure Fund L.L.C. Collective Investment Vehicles
FY00
Africa Region Tullow Oil Plc Oil, Gas and Mining FY04, 09
Africa Region Veolia Water Africa Middle East India Utilities FY06
Eastern Africa Region Intraspeed S.A.R.L. Transportation and Warehousing
FY07
Eastern Africa Region RVR Investments (Pty) Limited Transportation and Warehousing
FY07
Eastern Africa Region Spencon International Limited Construction and Real Estate FY10
Eastern Africa Region West Indian Ocean Cable Company Ltd. Information FY08
Southern Africa Region Agri–Vie Fund PCC Collective Investment Vehicles
FY10
Southern Africa Region Aureos Southern Africa Fund, LLC Collective Investment Vehicles
FY03
Southern Africa Region Evolution One Limited Partnership Collective Investment Vehicles
FY08
Western Africa Region Framlington Asset Management West Africa S.A. Collective Investment Vehicles
FY99
Western Africa Region Helios Investors II, L.P. Collective Investment Vehicles
FY09
Western Africa Region Helios Investors, L.P. Collective Investment Vehicles
FY07
Western Africa Region West Africa Venture Fund, LLC Collective Investment Vehicles
FY10
TOTAL IFC COMMITTED PORTFOLIO FOR SUB–SAHARAN AFRICA

p137
Original Commitment1 Investment for IFC’s Account2
Total IFC(US$ Millions)
Total Syndications (US$ Millions)
Loan(US$ Millions)
Equity(US$ Millions)
Committed Portfolio Loan and Equity
(US$ Millions)
Total Guarantee and Risk Management
(US$ Millions)
Total IFC Committed Portfolio for Its
Own Account (US$ Millions)3
17.4 – 17.2 – 17.2 – 17.2
25.0 – – 25.0 25.0 – 25.0
9.5 – – 8.5 8.5 – 8.5
9.9 – – 6.4 6.4 – 6.4
6.8 – – 6.2 6.2 – 6.2
30.0 – – 30.0 30.0 – 30.0
5.3 – – 5.1 5.1 – 5.1
30.5 – – 2.3 2.3 – 2.3
40.0 – – 39.9 39.9 – 39.9
8.0 – 8.0 – 8.0 – 8.0
110.0 – – 110.0 110.0 – 110.0
67.0 – – 0.7 0.7 – 0.7
115.0 – 115.0 – 115.0 – 115.0
31.3 – – 35.9 35.9 43.0 78.9
281.7 555.2 836.9 43.0 879.9
4.4 – 4.4 – 4.4 – 4.4
32.0 – 32.0 – 32.0 – 32.0
12.0 – 12.0 – 12.0 – 12.0
32.7 – 32.7 – 32.7 – 32.7
81.1 – 81.1 – 81.1
7.0 – – 7.0 7.0 – 7.0
6.0 – – 4.0 4.0 – 4.0
20.0 – – 20.0 20.0 – 20.0
– 31.0 31.0 – 31.0
0.0 – – 0.0 0.0 – 0.0
60.0 – – 60.0 60.0 – 60.0
20.0 – – 14.8 14.8 – 14.8
13.5 – – 13.5 13.5 – 13.5
– 88.3 88.3 – 88.3
2,977.9 1,407.9 4,385.8 704.5 5,090.3

p138
INVESTMENT PORTFOLIO Company Listing
Region Country UJV* Company Name Sector
Fiscal Year in which
Commitments Were Made
EAST ASIA AND PACIFIC
Cambodia ACLEDA Bank Plc Finance & Insurance FY00, 04, 06, 07, 08, 09
Cambodia Cambodia–Laos Development Fund, S.C.A. Collective Investment Vehicles
FY10
Cambodia Societe Concessionaire de l’Aeroport Transportation and Warehousing
FY04, 07
China Anhui Conch Cement Company Limited Nonmetallic Mineral Product Manufacturing
FY06
China Asia Environment Holdings Ltd. Utilities FY08
China Asia Environmental Partners, L.P. Collective Investment Vehicles
FY09
China Babei Group Co., Ltd. Textiles, Apparel & Leather FY05
China Bank of Beijing (formerly BCCB) Finance & Insurance FY05, 07
China Bank of Nanjing Finance & Insurance FY02, 07
China Bank of Shanghai Finance & Insurance FY00, 02, 10
China Bayan Rongxing Village and Township Bank Finance & Insurance FY09
China Beijing Deqingyuan Agriculture Technology Co. Ltd. Agriculture and Forestry FY06
China Beijing Shuoren Hitech Energy Technology Co., Ltd. Professional, Scientifi c and Technical Services
FY10
China Beijing United Family Hospital Health Care FY06
China BioVeda China Fund II, L.P. Collective Investment Vehicles
FY08
China BioVeda China Fund L.P. Collective Investment Vehicles
FY05
China Capital Today China Growth Fund, L.P. Collective Investment Vehicles
FY06
China CDH China Capital Growth Fund II, L.P. Collective Investment Vehicles
FY05
China CDH China Fund, L.P. Collective Investment Vehicles
FY02
China CDH Venture Partners, L.P. Collective Investment Vehicles
FY06
China Century Sunshine Group Holdings Limited Agriculture and Forestry FY07
China CFPA Microfi nance Management Co. Finance & Insurance FY10
China Changchun TBK Shili Auto Parts Co., Ltd. Industrial & Consumer Products
FY06
China Changsha Aier Eye Hospital Group Co., Ltd. Health Care FY07
China Chengdu Small Enterprise Credit Guarantee Co., Ltd. Finance & Insurance FY09, 10
China Chengdu Small Enterprise Credit Guarantee Co., Ltd. Risk Sharing Facility
Finance & Insurance FY09
China China Digital Video, Ltd. Professional, Scientifi c and Technical Services
FY08
China China Environmental Fund III, L.P. Collective Investment Vehicles
FY09
China China Flooring Holding Company Limited Agriculture and Forestry FY08
China China Glass Holdings Limited Nonmetallic Mineral Product Manufacturing
FY07, 08
China China Shanshui Cement Group Limited Nonmetallic Mineral Product Manufacturing
FY06, 08
China China WindPower Group Limited Electric Power FY10
China Chinasoft International Limited Information FY06

p139
Original Commitment1 Investment for IFC’s Account2
Total IFC(US$ Millions)
Total Syndications (US$ Millions)
Loan(US$ Millions)
Equity(US$ Millions)
Committed Portfolio Loan and Equity
(US$ Millions)
Total Guarantee and Risk Management
(US$ Millions)
Total IFC Committed Portfolio for Its
Own Account (US$ Millions)3
18.4 – 2.9 7.4 10.2 0.5 10.7
4.0 – – 4.0 4.0 – 4.0
17.5 – 12.4 – 12.4 – 12.4
15.3 11.4 26.7 0.5 27.2
77.3 – 95.8 – 95.8 – 95.8
15.0 – 15.0 – 15.0 – 15.0
25.0 – – 25.0 25.0 – 25.0
16.0 6.0 – 5.0 5.0 – 5.0
57.7 – – 59.0 59.0 – 59.0
72.8 – 54.0 – 54.0 – 54.0
88.7 – – 88.9 88.9 – 88.9
0.7 – – 0.7 0.7 – 0.7
2.8 – – 1.8 1.8 – 1.8
8.0 – 5.0 3.0 8.0 – 8.0
8.0 – 9.6 – 9.6 – 9.6
10.0 – – 10.0 10.0 – 10.0
4.7 – – 4.2 4.2 – 4.2
25.0 – – 25.0 25.0 – 25.0
18.0 – – 9.2 9.2 – 9.2
20.0 – – 1.0 1.0 – 1.0
20.0 – – 19.7 19.7 – 19.7
15.2 – 17.7 – 17.7 – 17.7
5.8 – – 5.8 5.8 – 5.8
2.0 – 1.0 – 1.0 – 1.0
8.1 – 9.4 – 9.4 – 9.4
26.3 – – 26.7 26.7 – 26.7
– – – – – 14.7 14.7
10.0 – – 10.0 10.0 – 10.0
15.0 – – 15.0 15.0 – 15.0
38.0 – 11.7 20.0 31.7 – 31.7
41.3 – 30.0 11.3 41.3 – 41.3
120.1 – 82.6 9.5 92.0 – 92.0
55.0 – 45.0 10.0 55.0 – 55.0
15.0 – – 14.8 14.8 – 14.8

p140
INVESTMENT PORTFOLIO Company Listing
Region Country UJV* Company Name Sector
Fiscal Year in which
Commitments Were Made
EAST ASIA AND PACIFIC
China Chindex International Inc. Health Care FY08
China CHUEE Bank of Beijing Finance & Insurance FY07
China CHUEE I Industrial Bank Finance & Insurance FY06
China Clean Resources Asia Growth Fund, L.P. Collective Investment Vehicles
FY10
China Crane Medical Pte Ltd. Health Care FY10
China Dazhou Koyo Chemical Industry Company, Ltd. Chemicals FY09
China Deyang City Commercial Bank Finance & Insurance FY10
China Dongyue Group Chemicals FY07
China EDC China Holding Ltd. Information FY09
China ENN Solar Energy Co., Ltd. Electric Power FY09
China Epure International Pte Ltd. Utilities FY07, 10
China Far East Energy Corporation Oil, Gas and Mining FY08
China Global Data Solutions Ltd. Information FY07, 08
China Guangxi Fenglin Wood Industrial Group Co., Ltd. Industrial & Consumer Products
FY04
China Guangzhou Development Industry Holdings Electric Power FY06
China Hangzhou Rural Cooperative Bank Finance & Insurance FY06, 08, 10
China Healthway Medical Corporation Limited Health Care FY10
China HiSoft Technology International Limited Information FY05, 06, 08
China Industrial Bank Finance & Insurance FY04, 08, 10
China Industrial Bank Finance & Insurance FY08
China Inner Mongolia Runhua Micro Credit Company Finance & Insurance FY08
China Jiangsu Financial Leasing Co.,Ltd. Finance & Insurance FY10
China Jiangxi Chenming Paper Co., Ltd. Pulp & Paper FY04
China Jilin Huazheng Agribusiness Development Co., Ltd. Food & Beverages FY03
China Launch Tech Co. Ltd. Industrial & Consumer Products
FY06
China MicroCred China Finance & Insurance FY08, 10
China Minsheng Shipping Transportation and Warehousing
FY05
China Nanjing Kumho Tire Co., Ltd. Plastics & Rubber FY96, 04
China Neophotonics, Inc. Information FY06, 08, 10
China New China Life Insurance Company Finance & Insurance FY01
China Newbridge Investment Partners, L.P. Collective Investment Vehicles
FY95
China Ningxia Darong Chemicals & Metallurgy Co. Ltd. Chemicals FY04
China Orient Fortune Asset Management Co., Ltd. Finance & Insurance FY08
China Paedia Nutrition Company Ltd. Food & Beverages FY10
China RAK Gao Yao Ceramics Limited Nonmetallic Mineral Product Manufacturing
FY05
China Renshou Village and Township Bank Finance & Insurance FY09
China RJVC Finance & Insurance FY08
China Sanchuan Energy Development Co., Ltd Electric Power FY09
China SBCVC Fund II, L.P. Collective Investment Vehicles
FY06, 08
China SEAF Sichuan SME Investment Fund LLC Collective Investment Vehicles
FY01
China Shandong Wanjie High-tech Co., Ltd. Health Care FY02

p141
Original Commitment1 Investment for IFC’s Account2
Total IFC(US$ Millions)
Total Syndications (US$ Millions)
Loan(US$ Millions)
Equity(US$ Millions)
Committed Portfolio Loan and Equity
(US$ Millions)
Total Guarantee and Risk Management
(US$ Millions)
Total IFC Committed Portfolio for Its
Own Account (US$ Millions)3
35.0 – 25.0 10.0 35.0 – 35.0
– – – – – 17.6 17.6
– – – – – 22.7 22.7
25.0 – – 25.0 25.0 – 25.0
15.0 – 15.0 – 15.0 – 15.0
30.0 – 20.0 10.0 30.0 – 30.0
31.3 – – 31.6 31.6 – 31.6
40.7 – 23.8 5.0 28.8 – 28.8
20.0 – – 20.0 20.0 – 20.0
15.0 – – 15.0 15.0 – 15.0
44.0 – 34.0 8.6 42.6 – 42.6
19.3 – – 19.3 19.3 – 19.3
6.7 – – 6.7 6.7 – 6.7
– – – 2.6 2.6 – 2.6
50.1 – 59.8 – 59.8 – 59.8
27.6 – – 27.6 27.6 0.3 27.9
10.0 – – 10.0 10.0 – 10.0
11.8 – – 11.8 11.8 – 11.8
73.5 – – 34.6 34.6 – 34.6
– – – – – 110.6 110.6
1.3 – – 1.4 1.4 – 1.4
21.3 – – 21.4 21.4 – 21.4
52.9 20.0 24.0 12.9 36.9 – 36.9
11.6 5.4 6.7 – 6.7 – 6.7
8.3 – – 5.5 5.5 – 5.5
2.3 – – 2.3 2.3 – 2.3
15.8 – 4.5 – 4.5 – 4.5
53.7 38.8 10.5 – 10.5 – 10.5
17.0 – – 17.0 17.0 – 17.0
23.3 – – 1.6 1.6 – 1.6
6.7 – – 1.7 1.7 – 1.7
8.2 5.3 6.4 1.5 7.9 – 7.9
41.4 – – 16.1 16.1 – 16.1
4.0 – 4.0 – 4.0 – 4.0
13.0 – 4.7 – 4.7 – 4.7
0.7 – – 0.7 0.7 – 0.7
5.7 – – 5.7 5.7 – 5.7
30.6 – 23.2 7.3 30.5 – 30.5
25.0 – – 25.0 25.0 – 25.0
4.5 – – 3.4 3.4 – 3.4
– – 0.1 – 0.1 – 0.1

p142
INVESTMENT PORTFOLIO Company Listing
Region Country UJV* Company Name Sector
Fiscal Year in which
Commitments Were Made
EAST ASIA AND PACIFIC
China Shandong Weigao Group Medical Polymer Company Chemicals FY07
China Shanghai Fosun Pharmaceutical Group Co. Ltd Chemicals FY07
China Shanghai International Banking & Finance Institute Education Services FY04
China Shanghai Krupp Stainless Co., Ltd. Primary Metals FY00
China Shanghai Pudong Development Bank Finance & Insurance FY08
China Shanxi HongAn Coking Technology Co., Ltd. Primary Metals FY04
China Shenzhen Tai–Yang PCCP Company, Limited Nonmetallic Mineral Product Manufacturing
FY93
China Shenzhen VTB Finance & Insurance FY10
China Sichuan Jiuda Salt Manufacturing Co., Ltd. Oil, Gas and Mining FY08
China Southern Aluminum Industry (China) Co., Ltd. Primary Metals FY04
China Stora Enso Oyj Pulp & Paper FY05, 06
China Suntech Power Holdings Co., Ltd. Industrial & Consumer Products
FY09
China Tianjin Binhai Rural Commercial Bank Corporation Finance & Insurance FY08, 10
China Tianrui Group Cement Company Limited Nonmetallic Mineral Product Manufacturing
FY07
China UBS Securities, Co, Ltd Finance & Insurance FY06
China United Commercial Bank (China) Limited Finance & Insurance FY08
China Universtar Science & Technology (Shenzhen) Co., Ltd. Industrial & Consumer Products
FY10
China VeriSilicon Holdings Co., Ltd. Professional, Scientifi c and Technical Services
FY06
China Xi’an City Commercial Bank Finance & Insurance FY03
China Xi’an Yinqiao Biological Science and Technology Company, Ltd.
Food & Beverages FY10
China Xinao Gas Holdings Limited Utilities FY04
China Xinneng Energy Company Ltd Chemicals FY07
China Xiwang Sugar Holdings Company Limited Food & Beverages FY10
China Yangtze Special Situations Fund L.P. Collective Investment Vehicles
FY04
China Yangtze Special Situations Fund, L.P. Collective Investment Vehicles
FY04
China Yantai Changyu Group Company Limited Food & Beverages FY05
China Yantai North Andre Juice Co., Ltd. Food & Beverages FY05
China Yaohua Group Nonmetallic Mineral Product Manufacturing
FY10
China Yaohua Group Construction and Real Estate FY09
China Zhong An Credit Finance & Insurance FY08
China Zhongda Yanjin Power Generation Co. Ltd. Electric Power FY06
Fiji Digicel (Fiji) Limited Information FY09
Indonesia Bank Andara Finance & Insurance FY08, 10
Indonesia Bank BTPN Finance & Insurance FY10
Indonesia P.T. Daralon Textile Manufacturing Corporation Textiles, Apparel & Leather FY72, 77, 79
Indonesia P.T. Kabel Indonesia – KABELINDO Industrial & Consumer Products
FY71
Indonesia P.T. Nusantara Tropical Fruit Agriculture and Forestry FY93
Indonesia P.T. South Pacifi c Viscose Chemicals FY93, 96, 04, 09

p143
Original Commitment1 Investment for IFC’s Account2
Total IFC(US$ Millions)
Total Syndications (US$ Millions)
Loan(US$ Millions)
Equity(US$ Millions)
Committed Portfolio Loan and Equity
(US$ Millions)
Total Guarantee and Risk Management
(US$ Millions)
Total IFC Committed Portfolio for Its
Own Account (US$ Millions)3
20.0 – 18.3 – 18.3 – 18.3
40.6 – 47.2 – 47.2 – 47.2
0.1 – – 0.1 0.1 0.2 0.2
30.0 68.8 5.3 – 5.3 – 5.3
– – – – – 73.7 73.7
40.0 30.0 20.0 – 20.0 – 20.0
5.0 – 3.8 1.0 4.7 – 4.7
2.9 – – 2.9 2.9 – 2.9
40.0 – 25.0 15.0 40.0 – 40.0
12.0 – 2.4 – 2.4 – 2.4
100.0 200.0 100.0 – 100.0 – 100.0
50.0 – 50.0 – 50.0 – 50.0
69.0 – – 71.1 71.1 – 71.1
61.7 – 44.1 11.7 55.8 – 55.8
7.3 – – 9.6 9.6 – 9.6
45.0 – 11.3 – 11.3 – 11.3
20.0 – – 20.0 20.0 – 20.0
1.0 – – 1.0 1.0 – 1.0
(0.3) – – 3.2 3.2 – 3.2
11.0 – 11.0 – 11.0 – 11.0
35.0 – – 6.4 6.4 – 6.4
50.0 128.0 38.0 10.0 48.0 – 48.0
25.0 – 20.0 5.0 25.0 – 25.0
0.4 – – 0.4 0.4 – 0.4
10.1 – – 10.1 10.1 – 10.1
17.7 – – 18.1 18.1 – 18.1
4.5 – – 1.4 1.4 – 1.4
– – 30.0 – 30.0 – 30.0
75.0 – 20.0 25.0 45.0 – 45.0
2.5 – 2.1 0.4 2.5 – 2.5
21.9 – 19.1 – 19.1 – 19.1
1,105.9 949.4 2,055.3 239.8 2,295.1
22.9 – 22.9 – 22.9 – 22.9
22.9 – 22.9 – 22.9
7.1 – – 7.2 7.2 – 7.2
70.0 – 70.0 – 70.0 – 70.0
5.5 1.7 – 1.1 1.1 – 1.1
2.2 1.0 – 0.4 0.4 – 0.4
8.6 6.7 10.5 – 10.5 – 10.5
94.5 160.0 40.0 – 40.0 – 40.0

p144
INVESTMENT PORTFOLIO Company Listing
Region Country UJV* Company Name Sector
Fiscal Year in which
Commitments Were Made
EAST ASIA AND PACIFIC
Indonesia PT Bank Danamon Indonesia Tbk Finance & Insurance FY06
Indonesia PT Bank International Indonesia Tbk Finance & Insurance FY05, 07
Indonesia PT Ecogreen Oleochemicals Chemicals FY04, 05
Indonesia PT Indonesia Infrastructure Finance Facility Finance & Insurance FY09
Indonesia PT Jakarta International Container Terminal Transportation and Warehousing
FY10
Indonesia PT Karunia Alam Segar Food & Beverages FY04, 06, 07, 08
Indonesia PT Prakarsa Alam Segar Food & Beverages FY04, 08
Indonesia PT Sriwijaya Alam Segar Food & Beverages FY08
Indonesia PT Summit Oto Finance Finance & Insurance FY09
Indonesia PT Tirta Alam Segar Food & Beverages FY06, 08
Indonesia PT Trada Maritime Tbk Transportation and Warehousing
FY10
Indonesia PT TVS Motor Indonesia Industrial & Consumer Products
FY08, 09
Indonesia PT. Bank Hana Indonesia Finance & Insurance FY08, 10
Indonesia PT. Fugui Flour & Grain Indonesia Food & Beverages FY07, 08
Indonesia Salamander Energy Plc Oil, Gas and Mining FY08, 09, 10
Indonesia Wahana Ottomitra Multiartha Finance & Insurance FY05, 07
Indonesia Yayasan Pendidikan Asian Pasifi k Education Services FY04
Korea, Republic of Asset Korea Capital Management Co. Ltd. Collective Investment Vehicles
FY99, 02
Korea, Republic of Hana Financial Holding Co. Finance & Insurance FY98
Korea, Republic of Korea Development Investment Corp. – Dae Boo Battery Company Ltd.
Industrial & Consumer Products
FY92
Korea, Republic of Korea Development Investment Corp. – Daemyung Industrial Co., Ltd.
Textiles, Apparel & Leather FY92
Korea, Republic of Korea Development Investment Corp. – Seoshin Electronics Co., Ltd.
Industrial & Consumer Products
FY92
Korea, Republic of Korea Development Investment Corp. – Seoul Cad Mold & Tool Co.
Industrial & Consumer Products
FY92
Korea, Republic of Korea Development Investment Corp. – Sewon Electro-Mechanics Co. Ltd.
Industrial & Consumer Products
FY92
Korea, Republic of Korea Development Investment Corp. – Shin Chang Precision Co., Ltd.
Industrial & Consumer Products
FY92
Korea, Republic of Korea Development Investment Corp. – Sung Kwang Lighting Co., Ltd.
Industrial & Consumer Products
FY92
Korea, Republic of Korea Growth and Restructuring Fund, L.P. Collective Investment Vehicles
FY00
Korea, Republic of Samgwang Gohachem Co., Ltd. Chemicals FY92
Lao People’s Democratic Republic
Acleda Bank Lao Ltd Finance & Insurance FY09
Lao People’s Democratic Republic
ANZ Vientiane Commercial Bank Limited Finance & Insurance FY07, 10
Lao People’s Democratic Republic
Burapha Agro-forestry Company Ltd. Industrial & Consumer Products
FY99
Lao People’s Democratic Republic
Endeavour Embroidery Co. Ltd. Textiles, Apparel & Leather FY99
Lao People’s Democratic Republic
KS Resort Luang Prabang Co., Ltd. Accommodation & Tourism Services
FY09

p145
Original Commitment1 Investment for IFC’s Account2
Total IFC(US$ Millions)
Total Syndications (US$ Millions)
Loan(US$ Millions)
Equity(US$ Millions)
Committed Portfolio Loan and Equity
(US$ Millions)
Total Guarantee and Risk Management
(US$ Millions)
Total IFC Committed Portfolio for Its
Own Account (US$ Millions)3
150.0 – 121.6 – 121.6 5.0 126.6
125.0 – 53.7 – 53.7 – 53.7
55.0 – 22.9 – 22.9 – 22.9
40.0 – – 40.0 40.0 – 40.0
30.0 40.0 30.0 – 30.0 – 30.0
39.0 3.0 33.9 – 33.9 – 33.9
48.0 20.0 17.6 – 17.6 – 17.6
4.5 3.0 4.5 – 4.5 – 4.5
45.0 – 38.1 – 38.1 – 38.1
16.0 – 13.5 – 13.5 – 13.5
35.0 – 35.0 – 35.0 – 35.0
32.0 – 32.0 – 32.0 – 32.0
27.1 – 15.0 12.1 27.1 – 27.1
44.5 11.0 39.0 – 39.0 – 39.0
87.1 – 62.5 24.1 86.6 – 86.6
39.9 – 5.0 12.6 17.6 – 17.6
1.0 – 0.6 – 0.6 – 0.6
645.4 97.5 742.8 5.0 747.8
0.9 – – 0.9 0.9 – 0.9
– – – 2.6 2.6 – 2.6
0.2 – – 0.2 0.2 – 0.2
0.2 – – 0.2 0.2 – 0.2
0.3 – – 0.3 0.3 – 0.3
0.1 – – 0.1 0.1 – 0.1
0.3 – – 0.3 0.3 – 0.3
0.2 – – 0.2 0.2 – 0.2
0.1 – – 0.1 0.1 – 0.1
35.0 – – 13.0 13.0 – 13.0
0.1 – – 0.1 0.1 – 0.1
– 18.2 18.2 – 18.2
1.8 – – 2.1 2.1 – 2.1
2.5 – – 2.5 2.5 – 2.5
0.8 – 0.8 – 0.8 – 0.8
0.2 – 0.1 – 0.1 – 0.1
4.0 – 4.0 – 4.0 – 4.0

p146
INVESTMENT PORTFOLIO Company Listing
Region Country UJV* Company Name Sector
Fiscal Year in which
Commitments Were Made
EAST ASIA AND PACIFIC
Lao People’s Democratic Republic
Lao Brewery Company Limited Food & Beverages FY07
Lao People’s Democratic Republic
* Salamander UJV Oil, Gas and Mining FY09
Lao People’s Democratic Republic
Villa Santi Accommodation & Tourism Services
FY01
Mongolia Khan Bank of Mongolia, Ulanbaatar, Mongolia Finance & Insurance FY04, 07, 08, 09, 10
Mongolia MCS Holding LLC Construction and Real Estate FY08
Mongolia XacBank Ltd. Finance & Insurance FY02, 07, 08, 10
Mongolia XacLeasing LLC Finance & Insurance FY09
Papua New Guinea Bank South Pacifi c Finance & Insurance FY10
Papua New Guinea Digicel (PNG) Limited Information FY08, 10
Papua New Guinea K.K. Kingston Holdings Limited Chemicals FY10
Papua New Guinea PNG MicroFinance Finance & Insurance FY05, 10
Philippines Asian Hospital Inc. Health Care FY01, 08
Philippines Avalon Professional Web Trade Pte. Ltd. Information FY01, 02
Philippines Avantex Mill Corporation Textiles, Apparel & Leather FY91
Philippines Bahay Financial Services, Inc. Finance & Insurance FY05
Philippines Balikatan Housing Finance, Inc. Finance & Insurance FY05
Philippines Banco de Oro Unibank Inc. Finance & Insurance FY02, 08, 10
Philippines Bank of the Philippine Islands Finance & Insurance FY10
Philippines Cagayan Electric Power & Light Co., Inc. Electric Power FY05
Philippines Eastwood Cyber One Corporation Construction and Real Estate FY02, 05
Philippines Energy Development Corporation Electric Power FY07, 09
Philippines Filinvest Land, Inc. Finance & Insurance FY05
Philippines H&Q Philippines Holdings BVI, Inc. Collective Investment Vehicles
FY99
Philippines H&Q Philippines Ventures II, Inc. Collective Investment Vehicles
FY94
Philippines H&Q Philippines Ventures, Inc. Collective Investment Vehicles
FY89
Philippines Manila Water Company, Inc. Utilities FY03, 04, 07
Philippines Mariwasa Manufacturing, Inc. Nonmetallic Mineral Product Manufacturing
FY70, 72, 00
Philippines Masinloc Power Partners Co. Ltd. Electric Power FY08
Philippines Northern Mindanao Power Corporation Electric Power FY93
Philippines Paramount Life & General Holding Corporation Finance & Insurance FY05
Philippines PDB SME Solutions, Inc. Information FY00
Philippines Philippine Export Development Facility Finance & Insurance FY02
Philippines PlantersBank Mortgage Securitization Finance & Insurance FY01
Philippines SN Aboitiz Power – Benguet, Inc. Electric Power FY09
Philippines SN Aboitiz Power, inc. Electric Power FY08
Philippines Software Ventures Int’l., Inc. Professional, Scientifi c and Technical Services
FY03
Philippines South Luzon Tollway Corporation Transportation and Warehousing
FY07

p147
Original Commitment1 Investment for IFC’s Account2
Total IFC(US$ Millions)
Total Syndications (US$ Millions)
Loan(US$ Millions)
Equity(US$ Millions)
Committed Portfolio Loan and Equity
(US$ Millions)
Total Guarantee and Risk Management
(US$ Millions)
Total IFC Committed Portfolio for Its
Own Account (US$ Millions)3
8.0 – 5.6 – 5.6 – 5.6
25.0 – – 25.0 25.0 – 25.0
1.2 – 0.5 – 0.5 – 0.5
11.1 29.6 40.6 – 40.6
17.3 – 10.0 2.3 12.3 0.2 12.5
30.0 – 30.0 – 30.0 – 30.0
15.1 – 8.5 4.7 13.3 – 13.3
1.0 – 1.0 – 1.0 – 1.0
49.5 7.0 56.6 0.2 56.7
83.9 – 30.0 52.4 82.4 – 82.4
120.0 – 80.0 – 80.0 – 80.0
3.9 – – 4.0 4.0 – 4.0
1.4 – – 1.4 1.4 – 1.4
110.0 57.8 167.8 – 167.8
36.0 – 27.4 – 27.4 – 27.4
1.6 – 0.3 1.0 1.3 – 1.3
13.2 – – 2.0 2.0 – 2.0
– – – 0.2 0.2 – 0.2
30.5 – 29.4 1.9 31.3 – 31.3
137.7 – 86.4 29.6 115.9 – 115.9
– – – – – 21.6 21.6
14.9 – 17.6 – 17.6 – 17.6
20.0 – 4.9 – 4.9 – 4.9
132.8 – 88.6 24.2 112.8 – 112.8
41.4 – 48.6 – 48.6 – 48.6
5.8 – – 4.4 4.4 – 4.4
2.4 – – 1.1 1.1 – 1.1
2.5 – – 0.6 0.6 – 0.6
75.5 – 49.9 10.4 60.3 – 60.3
15.7 0.5 7.9 – 7.9 – 7.9
275.0 – 229.0 22.1 251.1 – 251.1
16.8 21.0 – 1.2 1.2 – 1.2
1.5 – – 1.5 1.5 – 1.5
0.1 – – 0.1 0.1 – 0.1
0.2 – 0.2 – 0.2 – 0.2
23.9 – – 0.1 0.1 – 0.1
100.0 – 100.0 – 100.0 – 100.0
105.0 – 87.5 – 87.5 – 87.5
2.0 – – 2.0 2.0 – 2.0
50.2 – 54.0 – 54.0 – 54.0

p148
INVESTMENT PORTFOLIO Company Listing
Region Country UJV* Company Name Sector
Fiscal Year in which
Commitments Were Made
EAST ASIA AND PACIFIC
Philippines SunPower Philippines Manufacturing Ltd. Industrial & Consumer Products
FY10
Philippines Victorias Chemical Corporation Chemicals FY73
Philippines Walden AB Ayala Management Co. Inc. Collective Investment Vehicles
FY95
Philippines Walden AB Ayala Ventures Co. Inc. Collective Investment Vehicles
FY95
Samoa Digicel (Samoa) Ltd Information FY09
Solomon Islands Gold Ridge Mining Limited Oil, Gas and Mining FY10
Thailand ACAP Advisory Plc Finance & Insurance FY08
Thailand Bangkok Mass Transit System Public Company Limited
Transportation and Warehousing
FY97, 99
Thailand Lombard Thailand Intermediate Fund, LLC. Collective Investment Vehicles
FY02
Thailand Solar Power (Korat 1) Company Limited Electric Power FY10
Thailand Standard Bank PLC Finance & Insurance FY10
Thailand Thai Farmers Bank – Ladprao General Hospital Co. Ltd.
Health Care FY92
Thailand Total Access Communications Information FY03
Thailand True Move Company Ltd. Information FY05
Tonga Digicel (Tonga) Limited Information FY09
Vanuatu Digicel (Vanuatu) Limited Information FY09
Vietnam An Binh Commercial Joint Stock Bank Finance & Insurance FY09
Vietnam Antara Holdings (Asia) Ltd Transportation and Warehousing
FY08, 09, 10
Vietnam Asia Commercial Bank Finance & Insurance FY03, 07, 08, 10
Vietnam Dragon Capital Limited Collective Investment Vehicles
FY03
Vietnam Global CyberSoft, Inc. Information FY02
Vietnam Khai Vy Corporation and Duyen Hai Corporation Industrial & Consumer Products
FY05
Vietnam Masan Group Corporation Food & Beverages FY10
Vietnam Nghi Son Cement Corporation Nonmetallic Mineral Product Manufacturing
FY99, 09
Vietnam Saigon Thuong Tin Commercial Joint Stock Bank Finance & Insurance FY03, 04, 05, 06, 07, 08
Vietnam SP–SSA International Container Services Joint Venture Company
Transportation and Warehousing
FY09
Vietnam Theodore Alexander HCM Ltd. Industrial & Consumer Products
FY06, 10
Vietnam Vietnam Enterprise Investment Limited Collective Investment Vehicles
FY02, 03, 07
Vietnam Vietnam Export Import Commercial Joint Stock Bank Finance & Insurance FY08
Vietnam Vietnam Investments Fund I, L.P. Collective Investment Vehicles
FY08

p149
Original Commitment1 Investment for IFC’s Account2
Total IFC(US$ Millions)
Total Syndications (US$ Millions)
Loan(US$ Millions)
Equity(US$ Millions)
Committed Portfolio Loan and Equity
(US$ Millions)
Total Guarantee and Risk Management
(US$ Millions)
Total IFC Committed Portfolio for Its
Own Account (US$ Millions)3
75.0 – 75.0 – 75.0 – 75.0
2.2 – – 0.3 0.3 – 0.3
0.1 – – 0.1 0.1 – 0.1
3.8 – – 0.4 0.4 – 0.4
906.6 103.2 1,009.9 21.6 1,031.4
10.5 – 10.5 – 10.5 – 10.5
10.5 – 10.5 – 10.5
35.0 – 35.0 – 35.0 – 35.0
35.0 – 35.0 – 35.0
– – – 4.3 4.3 – 4.3
99.7 – 9.4 10.3 19.7 – 19.7
37.5 – – 21.7 21.7 – 21.7
1.7 – – 1.7 1.7 – 1.7
26.0 – 11.6 – 11.6 – 11.6
0.3 – – 0.3 0.3 – 0.3
– – – – – 5.6 5.6
33.0 – 21.4 – 21.4 – 21.4
42.3 38.3 80.7 5.6 86.3
6.8 – 6.8 – 6.8 – 6.8
6.8 – 6.8 – 6.8
9.0 – 9.0 – 9.0 – 9.0
9.0 – 9.0 – 9.0
– – – – – 5.7 5.7
8.2 7.0 7.0 1.2 8.2 – 8.2
18.4 – – – – 5.0 5.0
2.0 – – 1.8 1.8 – 1.8
1.3 – – 1.3 1.3 – 1.3
6.0 – 2.5 – 2.5 – 2.5
40.0 – 40.0 – 40.0 – 40.0
25.7 25.0 34.4 – 34.4 – 34.4
58.1 – 22.9 – 22.9 50.0 72.9
70.0 – 70.0 – 70.0 – 70.0
18.0 – 10.8 – 10.8 – 10.8
29.0 – – 16.4 16.4 – 16.4
– – – – – 13.0 13.0
7.0 – – 7.0 7.0 – 7.0

p150
INVESTMENT PORTFOLIO Company Listing
Region Country UJV* Company Name Sector
Fiscal Year in which
Commitments Were Made
EAST ASIA AND PACIFIC
Vietnam Vietnam Technological and Commercial Joint Stock Bank
Finance & Insurance FY08, 10
Vietnam Vina Payment Network Joint–stock Company Other FY09
East Asia and Pacifi c Region AIF Capital Limited Collective Investment Vehicles
FY95, 98
East Asia and Pacifi c Region Asia Opportunity Fund, L.P. Collective Investment Vehicles
FY99
East Asia and Pacifi c Region Asia Water Fund Collective Investment Vehicles
FY10
East Asia and Pacifi c Region Asian Lion Fund Limited Collective Investment Vehicles
FY06
East Asia and Pacifi c Region Avenue Asia Special Situations Fund III, L.P. Collective Investment Vehicles
FY04
East Asia and Pacifi c Region Avenue Asia Special Situations Fund IV, L.P. Collective Investment Vehicles
FY06
East Asia and Pacifi c Region DAC China Special Opportunity and Situation Fund, L.P.
Collective Investment Vehicles
FY07
East Asia and Pacifi c Region J.P. Morgan Partners Asia LDC Collective Investment Vehicles
FY99
East Asia and Pacifi c Region Kula Fund II Limited Collective Investment Vehicles
FY09
East Asia and Pacifi c Region Kula Fund Limited Collective Investment Vehicles
FY98
East Asia and Pacifi c Region Lombard Asia III, L.P. Collective Investment Vehicles
FY07
East Asia and Pacifi c Region Saratoga Asia II, L.P. Collective Investment Vehicles
FY08, 09
East Asia and Pacifi c Region Vital Solutions Pte. Ltd. Information FY01
TOTAL IFC COMMITTED PORTFOLIO FOR EAST ASIA AND PACIFIC
SOUTH ASIA
Bangladesh Agricultural Marketing Company Limited Food & Beverages FY09
Bangladesh BRAC Finance & Insurance FY08
Bangladesh BRAC Bank Finance & Insurance FY04, 07, 09
Bangladesh DeltaBRAC Housing Finance Corporation Finance & Insurance FY98
Bangladesh Eastern Bank Limited Finance & Insurance FY06
Bangladesh Export Import Bank of Bangladesh Ltd Finance & Insurance FY08
Bangladesh Frontier PE (Bermuda) L.P. Collective Investment Vehicles
FY09
Bangladesh Lafarge Surma Cement Limited Nonmetallic Mineral Product Manufacturing
FY02
Bangladesh SEAF Bangladesh Ventures Collective Investment Vehicles
FY10
Bangladesh Southeast Bank Limited Finance & Insurance FY07
Bangladesh World Communications, Inc. Information FY98
Bhutan Bhutan Resorts Private Limited Accommodation & Tourism Services
FY04

p151
Original Commitment1 Investment for IFC’s Account2
Total IFC(US$ Millions)
Total Syndications (US$ Millions)
Loan(US$ Millions)
Equity(US$ Millions)
Committed Portfolio Loan and Equity
(US$ Millions)
Total Guarantee and Risk Management
(US$ Millions)
Total IFC Committed Portfolio for Its
Own Account (US$ Millions)3
43.9 – 36.6 – 36.6 100.0 136.6
1.5 – – 1.5 1.5 – 1.5
224.2 29.2 253.4 173.6 427.0
0.1 – – 0.1 0.1 – 0.1
57.3 – – 10.0 10.0 – 10.0
20.0 – – 20.0 20.0 – 20.0
6.0 – – 6.0 6.0 – 6.0
40.0 – – 14.8 14.8 – 14.8
37.5 – – 37.5 37.5 – 37.5
30.0 – – 23.7 23.7 – 23.7
0.0 – – 0.0 0.0 – 0.0
4.0 – – 4.0 4.0 – 4.0
3.0 – – 0.3 0.3 – 0.3
20.0 – – 20.0 20.0 – 20.0
35.0 – – 34.9 34.9 – 34.9
1.0 – – 1.0 1.0 – 1.0
– 172.3 172.3 – 172.3
3,194.5 1,513.8 4,708.3 446.3 5,154.5
15.0 – 15.0 – 15.0 – 15.0
– – – – – 9.9 9.9
3.4 – – 1.9 1.9 9.4 11.3
3.0 – 0.4 0.7 1.0 – 1.0
– – – – – 24.6 24.6
– – – – – 2.4 2.4
10.0 – – 10.0 10.0 – 10.0
45.0 15.0 20.7 5.0 25.7 – 25.7
12.0 – – 12.0 12.0 – 12.0
– – – – – 17.4 17.4
0.0 – – 0.0 0.0 – 0.0
36.1 29.6 65.7 63.7 129.3
10.0 – 7.4 – 7.4 – 7.4
7.4 – 7.4 – 7.4

p152
INVESTMENT PORTFOLIO Company Listing
Region Country UJV* Company Name Sector
Fiscal Year in which
Commitments Were Made
SOUTH ASIA
India Aavishkaar Goodwell India Microfi nance Development Company II
Collective Investment Vehicles
FY10
India Aavishkaar Goodwell India Microfi nance Development Company Ltd
Collective Investment Vehicles
FY07
India AD Hydro Power Limited Electric Power FY05, 08
India Amalgamated Bean Coffee Trading Company Ltd. Accommodation & Tourism Services
FY07
India Amalgamated Plantations Private Limited Agriculture and Forestry FY09
India Andhra Pradesh Paper Mills Limited Pulp & Paper FY05
India Angel Global Capital Private Limited Finance & Insurance FY08
India APF – I Mauritius Collective Investment Vehicles
FY08
India APIDC Biotechnology Venture Fund Collective Investment Vehicles
FY05
India Apollo Hospitals Enterprise Limited Health Care FY06, 09
India Apollo Tyres Limited Plastics & Rubber FY03, 05, 10
India Applied Solar Technologies Pvt. Ltd. Electric Power FY10
India Atul Limited Chemicals FY06, 10
India AU Financiers (India) Private Limited Finance & Insurance FY10
India Auro Mira Bio Systems Kanyakumari Pvt. Ltd. Electric Power FY10
India Auro Mira Energy Company Private Limited Electric Power FY10
India Avigo PE Investments Ltd. Collective Investment Vehicles
FY09
India Avigo Venture Investments Limited Collective Investment Vehicles
FY08
India Azure Power India Private Limited Electric Power FY10
India Bajaj Hindusthan Sugar & Industries Limited Food & Beverages FY07
India Ballarpur Industries Limited Pulp & Paper FY01, 04
India Balrampur Chini Mills Ltd. Food & Beverages FY03, 07
India Belstar Investment & Finance Pvt. Ltd. Finance & Insurance FY10
India Bharat Biotech International Limited Chemicals FY05
India Bhartiya Samruddhi Finance Limited Finance & Insurance FY01
India Bhilwara Energy Limited Electric Power FY10
India Bihar Sponge Iron Limited Primary Metals FY85, 91
India Cairn Energy Hydrocarbons Limited Oil, Gas and Mining FY10
India Cairn India Limited Oil, Gas and Mining FY07
India CHOLAMANDALAM INVESTMENT AND FINANCE COMPANY LTD
Finance & Insurance FY10
India Coastal Gujarat Power Limited Electric Power FY08
India Connectiva Systems, Inc. Professional, Scientifi c and Technical Services
FY09
India Continental Carbon India Limited Chemicals FY01, 04, 06, 07, 10
India Cosmo Films Limited Plastics & Rubber FY03, 05
India Craftsman Automation Private Limited Industrial & Consumer Products
FY10
India Crompton Greaves Ltd. Industrial & Consumer Products
FY04
India DCM Shriram Consolidated Limited Chemicals FY05, 06, 09
India Deutsche Postbank Home Finance Ltd. Finance & Insurance FY04

p153
Original Commitment1 Investment for IFC’s Account2
Total IFC(US$ Millions)
Total Syndications (US$ Millions)
Loan(US$ Millions)
Equity(US$ Millions)
Committed Portfolio Loan and Equity
(US$ Millions)
Total Guarantee and Risk Management
(US$ Millions)
Total IFC Committed Portfolio for Its
Own Account (US$ Millions)3
2.0 – – 2.0 2.0 – 2.0
3.5 – – 3.5 3.5 – 3.5
84.3 – 67.8 14.8 82.6 – 82.6
15.0 – 9.1 5.0 14.1 – 14.1
6.7 – – 6.3 6.3 – 6.3
40.0 – 21.0 5.0 26.0 – 26.0
37.5 – – 38.8 38.8 – 38.8
12.0 – – 12.0 12.0 – 12.0
4.0 – – 4.0 4.0 – 4.0
55.1 – 50.0 5.1 55.1 – 55.1
48.6 15.0 31.5 – 31.5 0.4 32.0
15.4 – 9.9 5.4 15.4 – 15.4
29.5 – 29.3 – 29.3 – 29.3
7.6 – – 7.8 7.8 – 7.8
6.2 – 6.2 – 6.2 – 6.2
7.7 – – 8.0 8.0 – 8.0
20.0 – – 20.0 20.0 – 20.0
10.0 – – 9.9 9.9 – 9.9
10.0 – 5.5 4.5 10.0 – 10.0
50.0 90.0 49.7 – 49.7 – 49.7
15.0 – – 8.1 8.1 – 8.1
54.9 – 33.8 – 33.8 – 33.8
1.2 – – 1.2 1.2 – 1.2
4.5 – – 4.5 4.5 – 4.5
1.0 – – 0.8 0.8 – 0.8
23.9 – – 23.9 23.9 – 23.9
9.6 – 4.2 – 4.2 – 4.2
150.0 – 150.0 – 150.0 – 150.0
22.9 – – 22.9 22.9 – 22.9
22.6 – – 22.3 22.3 – 22.3
450.0 – 450.0 – 450.0 – 450.0
5.0 – – 5.0 5.0 – 5.0
23.1 23.9 9.4 3.2 12.6 0.9 13.5
14.1 – – 2.0 2.0 – 2.0
9.7 – – 9.7 9.7 – 9.7
8.0 – 2.5 – 2.5 – 2.5
86.6 – 75.3 – 75.3 7.0 82.3
21.2 – 20.7 – 20.7 – 20.7

p154
INVESTMENT PORTFOLIO Company Listing
Region Country UJV* Company Name Sector
Fiscal Year in which
Commitments Were Made
SOUTH ASIA
India Dewan Housing Finance Corporation Ltd. Finance & Insurance FY03
India Dewan LIS New Co. Finance & Insurance FY10
India Dishman Pharmaceuticals and Chemicals Ltd. Chemicals FY09
India DQ Entertainment Plc Information FY03
India Electrotherm India Ltd. Primary Metals FY07
India Export–Import Bank of India Finance & Insurance FY09, 10
India Financial Information Network & Operations Pvt. Ltd. Information FY07, 10
India Global Trust Bank Limited Finance & Insurance FY94, 98, 00, 01
India Granules India Limited Chemicals FY07, 09
India Green Investment Asia Sustainability Fund I Collective Investment Vehicles
FY08
India Gujarat State Petronet Ltd. Utilities FY07
India GVK Power and Infrastructure Limited Electric Power FY96
India HDFC Bank Limited Finance & Insurance FY07
India Heartland Information Services Information FY01, 03, 07, 10
India Hikal Limited Chemicals FY09
India Himadri Chemicals & Industries Limited Chemicals FY09
India HNG Float Glass Limited Nonmetallic Mineral Product Manufacturing
FY08
India Housing Development Finance Corporation Limited Finance & Insurance FY78, 87, 91, 93, 01, 03, 07
India Husk Power Systems Inc. Electric Power FY10
India ICICI Bank Limited Finance & Insurance FY07
India Idea Cellular Limited Information FY08
India IHDC – Ascent Hydro Projects Limited Electric Power FY06
India IHDC – Dodson-Lindblom Hydro Power Pvt Ltd. Electric Power FY06
India Indecomm Global Services Information FY06
India India Agribusiness Fund Limited Collective Investment Vehicles
FY09
India India Auto Ancillary Fund Collective Investment Vehicles
FY99
India India Infrastructure Fund Collective Investment Vehicles
FY08
India Infrastructure Development Finance Company Limited Finance & Insurance FY98, 05, 10
India Jain Irrigation Systems Ltd. Agriculture and Forestry FY08, 09
India JK Paper Mills Ltd. Pulp & Paper FY06, 09
India Kalyani Gerdau Steels Limited Primary Metals FY10
India Kamani Oil Industries Private Limited Food & Beverages FY08
India Kanoria Chemicals and Industries Ltd. Chemicals FY07, 10
India Kotak Mahindra Bank Limited Finance & Insurance FY05, 07, 10
India KPIT Cummins Infosystems Limited Professional, Scientifi c and Technical Services
FY05
India L G Balakrishnan & Bros. Industrial & Consumer Products
FY06
India Lanco Infratech Limited LITL Electric Power FY09
India LGB Forge Limited Industrial & Consumer Products
FY06
India Lok Capital LLC Collective Investment Vehicles
FY06, 08

p155
Original Commitment1 Investment for IFC’s Account2
Total IFC(US$ Millions)
Total Syndications (US$ Millions)
Loan(US$ Millions)
Equity(US$ Millions)
Committed Portfolio Loan and Equity
(US$ Millions)
Total Guarantee and Risk Management
(US$ Millions)
Total IFC Committed Portfolio for Its
Own Account (US$ Millions)3
12.0 – 3.5 – 3.5 – 3.5
4.5 – – 4.3 4.3 – 4.3
15.0 – 15.0 – 15.0 – 15.0
3.0 – – 6.8 6.8 – 6.8
25.0 – 24.0 – 24.0 – 24.0
105.0 – 75.0 – 75.0 – 75.0
7.8 – – 7.9 7.9 – 7.9
16.0 – – 2.9 2.9 – 2.9
16.0 – 10.0 6.0 16.0 – 16.0
17.6 – – 18.7 18.7 – 18.7
113.3 – 72.7 30.0 102.7 – 102.7
– – – 9.0 9.0 – 9.0
100.0 – 100.0 – 100.0 – 100.0
5.4 – – 5.4 5.4 – 5.4
31.8 – 15.0 16.8 31.8 – 31.8
14.0 – 14.0 – 14.0 20.9 34.9
15.0 – 7.9 6.7 14.6 – 14.6
147.8 100.0 100.0 – 100.0 – 100.0
0.4 – – 0.4 0.4 – 0.4
150.0 – 150.0 – 150.0 – 150.0
84.0 – 100.0 – 100.0 – 100.0
– – 6.6 – 6.6 – 6.6
15.0 – 6.7 – 6.7 – 6.7
2.6 – – 2.6 2.6 – 2.6
20.0 – – 20.0 20.0 – 20.0
2.3 – – 0.2 0.2 – 0.2
50.0 – – 49.8 49.8 – 49.8
140.5 100.0 106.3 3.3 109.5 – 109.5
74.2 – 60.0 9.6 69.6 – 69.6
29.3 – 17.1 11.3 28.4 – 28.4
25.0 – 25.0 – 25.0 – 25.0
6.3 – – 5.3 5.3 – 5.3
19.3 – 17.2 5.3 22.5 – 22.5
67.0 – 50.5 – 50.5 8.4 58.9
13.5 – 7.3 1.3 8.6 – 8.6
3.3 – – 3.1 3.1 – 3.1
50.0 – 50.0 – 50.0 – 50.0
– – – 1.7 1.7 – 1.7
4.0 – – 2.4 2.4 – 2.4

p156
INVESTMENT PORTFOLIO Company Listing
Region Country UJV* Company Name Sector
Fiscal Year in which
Commitments Were Made
SOUTH ASIA
India Macquarie SBI Infrastructure Management Pte. Limited
Collective Investment Vehicles
FY09
India Macquarie SBI Infrastructure Trust Collective Investment Vehicles
FY09
India Maharashtra State Electricity Transmission Company Limited
Electric Power FY10
India Mahindra Infrastructure Developers Limited Utilities FY01
India Mahindra Shubhlabh Services Limited Agriculture and Forestry FY03
India Max Healthcare Institute Limited Health Care FY04, 07
India Max India Limited Health Care FY09
India Meghmani Finechem Limited Chemicals FY08
India Midas Communications Technologies Pvt. Ltd. Industrial & Consumer Products
FY09
India Modern Dairies Limited Food & Beverages FY09
India Moser Baer India Limited Industrial & Consumer Products
FY96, 99, 00
India Moser Baer Photovolatic Ltd. Industrial & Consumer Products
FY07
India MSPL Limited Electric Power FY07
India Nagarjuna Coated Tubes Limited Primary Metals FY81
India NewPath Ventures LLC Collective Investment Vehicles
FY03, 04
India Ocean Sparkle Limited Transportation and Warehousing
FY07, 09
India Ocimum Biosolutions Ltd. Health Care FY07
India OCL India Limited Nonmetallic Mineral Product Manufacturing
FY07
India Owens Corning (India) Limited Nonmetallic Mineral Product Manufacturing
FY97, 08
India Peepul Capital Fund II LLC Collective Investment Vehicles
FY06
India Petronet LNG Limited Utilities FY07
India Polycab Wires Private Limited Industrial & Consumer Products
FY09
India Powerlinks Transmission Limited Electric Power FY04
India PSL Limited Primary Metals FY06
India Punj LLoyd Limited Construction and Real Estate FY08
India Punj Lloyd Upstream Limited Oil, Gas and Mining FY08
India Rabo Equity Management Company Limited Collective Investment Vehicles
FY09
India Rain CII Carbon (India) Limited Chemicals FY96, 05, 08
India RAK Ceramics India Pvt. Ltd. Nonmetallic Mineral Product Manufacturing
FY04
India Ramky Infrastructure Ltd. Construction and Real Estate FY05
India Rockland Hospitals Limited Health Care FY08
India Samara Capital Partners Ltd. Collective Investment Vehicles
FY08
India Samson Maritime Limited Transportation and Warehousing
FY08
India SBI Macquarie Infrastructure Management Limited Collective Investment Vehicles
FY09

p157
Original Commitment1 Investment for IFC’s Account2
Total IFC(US$ Millions)
Total Syndications (US$ Millions)
Loan(US$ Millions)
Equity(US$ Millions)
Committed Portfolio Loan and Equity
(US$ Millions)
Total Guarantee and Risk Management
(US$ Millions)
Total IFC Committed Portfolio for Its
Own Account (US$ Millions)3
0.1 – – 0.1 0.1 – 0.1
149.0 – – 149.0 149.0 – 149.0
50.1 – 52.7 – 52.7 – 52.7
0.8 – – 0.8 0.8 – 0.8
2.2 – – 2.3 2.3 – 2.3
67.3 – – 74.6 74.6 – 74.6
31.8 – – 31.5 31.5 – 31.5
33.0 – 20.0 11.9 31.9 – 31.9
12.5 – – 12.5 12.5 – 12.5
6.9 – – 6.4 6.4 – 6.4
71.3 – – 14.4 14.4 – 14.4
22.5 – 21.5 – 21.5 – 21.5
16.2 – 16.2 – 16.2 – 16.2
1.8 – – 0.2 0.2 – 0.2
13.0 – – 13.0 13.0 – 13.0
36.3 – 20.7 9.2 29.9 – 29.9
5.7 – 2.3 3.1 5.4 – 5.4
50.2 – 44.2 – 44.2 – 44.2
33.0 – 7.3 – 7.3 – 7.3
20.0 – – 20.0 20.0 – 20.0
50.0 150.0 49.5 – 49.5 – 49.5
137.2 – 36.6 80.7 117.3 – 117.3
72.3 – 53.3 – 53.3 – 53.3
4.8 – – 5.0 5.0 – 5.0
20.0 – 20.0 – 20.0 – 20.0
27.9 – 25.0 2.5 27.5 – 27.5
– – – 0.0 0.0 – 0.0
34.7 – – – – 35.5 35.5
20.0 – 7.3 – 7.3 – 7.3
1.4 – – 3.0 3.0 – 3.0
13.7 – – 13.7 13.7 – 13.7
10.0 – – 10.0 10.0 – 10.0
30.2 – 24.0 5.2 29.2 – 29.2
0.4 – – 0.9 0.9 – 0.9

p158
INVESTMENT PORTFOLIO Company Listing
Region Country UJV* Company Name Sector
Fiscal Year in which
Commitments Were Made
SOUTH ASIA
India Sealion Sparkle Port & Terminal Services (Dahej) Limited
Transportation and Warehousing
FY05
India Snowman Frozen Foods Limited Transportation and Warehousing
FY10
India Soktas India Private Limited India Textiles, Apparel & Leather FY08, 10
India South Asian Petrochem Limited Chemicals FY08, 09
India South Asian Regional Apex Fund Collective Investment Vehicles
FY96
India Standard Charter Bank Finance & Insurance FY08
India Suguna Poultry Farms Ltd. Agriculture and Forestry FY07
India Suvidhaa Inforserve Private Limited Information FY10
India TAN INDIA LIMITED Chemicals FY89
India The Federal Bank Limited Finance & Insurance FY06, 08, 10
India United Phosphorus Limited Chemicals FY04, 09
India United Riceland Limited Food & Beverages FY96, 05
India Usha Martin Limited Primary Metals FY03
India Utkarsh Micro Finance Private Limited Finance & Insurance FY10
India VenturEast Proactive Fund Collective Investment Vehicles
FY08
India Vicat Sagar Cement Private Ltd. Nonmetallic Mineral Product Manufacturing
FY10
India Volkswagen India Pvt. Ltd. Industrial & Consumer Products
FY09
India Walden Nikko India Management Co. Ltd. Collective Investment Vehicles
FY98
India Walden–Nikko India Ventures Co., L.D.C. Collective Investment Vehicles
FY98
India Waterhealth India Private Limited Utilities FY09
India West Coast Paper Mills Limited Pulp & Paper FY07
India Zephyr Peacock India Fund II Limited Collective Investment Vehicles
FY10
Maldives Addu Investments Private Limited Accommodation & Tourism Services
FY09
Maldives Housing Development Finance Corporation Plc Finance & Insurance FY09
Maldives Maldives Finance Leasing Company Limited Finance & Insurance FY02
Maldives Taj Maldives (Pvt.) Ltd. Accommodation & Tourism Services
FY04
Maldives Universal Enterprises Pvt. Limited Accommodation & Tourism Services
FY05, 10
Maldives Wataniya Telecom Maldives Pvt. Ltd. Information FY06
Nepal Bank of Kathmandu Limited Finance & Insurance FY08
Nepal Bhote Koshi Power Company Private Limited Electric Power FY98
Nepal Buddha Air Private Limited Transportation and Warehousing
FY09
Nepal Butwal Power Company (BPC) Electric Power FY10
Nepal Himal Power Limited Electric Power FY96
Nepal Nepal Investment Bank Ltd. Finance & Insurance FY10
Nepal Nirdhan Utthan Bank Ltd. Finance & Insurance FY10

p159
Original Commitment1 Investment for IFC’s Account2
Total IFC(US$ Millions)
Total Syndications (US$ Millions)
Loan(US$ Millions)
Equity(US$ Millions)
Committed Portfolio Loan and Equity
(US$ Millions)
Total Guarantee and Risk Management
(US$ Millions)
Total IFC Committed Portfolio for Its
Own Account (US$ Millions)3
4.9 – 2.3 – 2.3 – 2.3
5.4 – – 5.5 5.5 – 5.5
21.3 – 17.6 2.5 20.1 – 20.1
13.3 – – 12.9 12.9 – 12.9
7.3 – – – – – –
45.0 – 45.0 – 45.0 – 45.0
11.2 – – 11.2 11.2 – 11.2
5.0 – – 5.0 5.0 – 5.0
– – 0.0 – 0.0 – 0.0
54.5 – – 44.8 44.8 0.0 44.8
67.5 – 55.6 – 55.6 – 55.6
18.5 – 10.0 – 10.0 – 10.0
24.6 – – 0.7 0.7 – 0.7
0.3 – – 0.3 0.3 – 0.3
15.0 – – 15.0 15.0 – 15.0
75.0 68.3 75.0 – 75.0 – 75.0
84.6 105.9 73.7 – 73.7 – 73.7
0.0 – – 0.0 0.0 – 0.0
2.4 – – 1.1 1.1 – 1.1
15.2 – 16.1 0.0 16.1 – 16.1
40.0 – 40.0 – 40.0 – 40.0
8.7 – – 8.7 8.7 – 8.7
2,795.8 1,063.9 3,859.7 73.2 3,932.8
50.0 – 50.0 – 50.0 – 50.0
12.0 – 7.5 4.5 12.0 – 12.0
3.3 – 0.3 1.3 1.6 – 1.6
8.5 8.5 2.7 – 2.7 – 2.7
52.5 – 37.5 – 37.5 – 37.5
20.0 – 11.1 – 11.1 – 11.1
109.2 5.8 114.9 – 114.9
– – – – – 2.0 2.0
23.9 32.9 4.3 – 4.3 1.0 5.3
10.0 – 10.0 – 10.0 – 10.0
6.5 – 6.5 – 6.5 – 6.5
32.0 – 6.6 – 6.6 – 6.6
– – – – – 0.0 0.0
0.3 – – 0.3 0.3 – 0.3
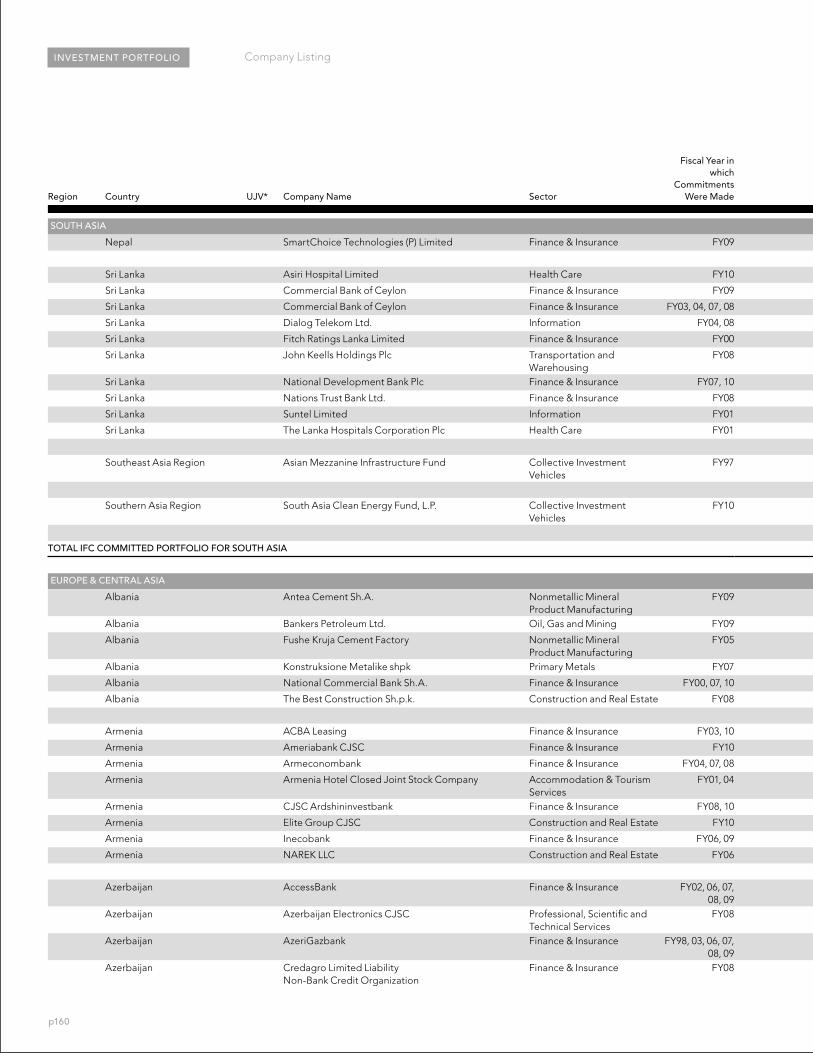
p160
INVESTMENT PORTFOLIO Company Listing
Region Country UJV* Company Name Sector
Fiscal Year in which
Commitments Were Made
SOUTH ASIA
Nepal SmartChoice Technologies (P) Limited Finance & Insurance FY09
Sri Lanka Asiri Hospital Limited Health Care FY10
Sri Lanka Commercial Bank of Ceylon Finance & Insurance FY09
Sri Lanka Commercial Bank of Ceylon Finance & Insurance FY03, 04, 07, 08
Sri Lanka Dialog Telekom Ltd. Information FY04, 08
Sri Lanka Fitch Ratings Lanka Limited Finance & Insurance FY00
Sri Lanka John Keells Holdings Plc Transportation and Warehousing
FY08
Sri Lanka National Development Bank Plc Finance & Insurance FY07, 10
Sri Lanka Nations Trust Bank Ltd. Finance & Insurance FY08
Sri Lanka Suntel Limited Information FY01
Sri Lanka The Lanka Hospitals Corporation Plc Health Care FY01
Southeast Asia Region Asian Mezzanine Infrastructure Fund Collective Investment Vehicles
FY97
Southern Asia Region South Asia Clean Energy Fund, L.P. Collective Investment Vehicles
FY10
TOTAL IFC COMMITTED PORTFOLIO FOR SOUTH ASIA
EUROPE & CENTRAL ASIA
Albania Antea Cement Sh.A. Nonmetallic Mineral Product Manufacturing
FY09
Albania Bankers Petroleum Ltd. Oil, Gas and Mining FY09
Albania Fushe Kruja Cement Factory Nonmetallic Mineral Product Manufacturing
FY05
Albania Konstruksione Metalike shpk Primary Metals FY07
Albania National Commercial Bank Sh.A. Finance & Insurance FY00, 07, 10
Albania The Best Construction Sh.p.k. Construction and Real Estate FY08
Armenia ACBA Leasing Finance & Insurance FY03, 10
Armenia Ameriabank CJSC Finance & Insurance FY10
Armenia Armeconombank Finance & Insurance FY04, 07, 08
Armenia Armenia Hotel Closed Joint Stock Company Accommodation & Tourism Services
FY01, 04
Armenia CJSC Ardshininvestbank Finance & Insurance FY08, 10
Armenia Elite Group CJSC Construction and Real Estate FY10
Armenia Inecobank Finance & Insurance FY06, 09
Armenia NAREK LLC Construction and Real Estate FY06
Azerbaijan AccessBank Finance & Insurance FY02, 06, 07, 08, 09
Azerbaijan Azerbaijan Electronics CJSC Professional, Scientifi c and Technical Services
FY08
Azerbaijan AzeriGazbank Finance & Insurance FY98, 03, 06, 07, 08, 09
Azerbaijan Credagro Limited Liability Non-Bank Credit Organization
Finance & Insurance FY08

p161
Original Commitment1 Investment for IFC’s Account2
Total IFC(US$ Millions)
Total Syndications (US$ Millions)
Loan(US$ Millions)
Equity(US$ Millions)
Committed Portfolio Loan and Equity
(US$ Millions)
Total Guarantee and Risk Management
(US$ Millions)
Total IFC Committed Portfolio for Its
Own Account (US$ Millions)3
0.4 – – 0.4 0.4 – 0.4
27.4 0.6 28.0 3.1 31.0
20.0 – 20.0 – 20.0 – 20.0
– – – – – 14.2 14.2
20.3 – – 13.5 13.5 19.0 32.4
(5.0) – – 30.0 30.0 – 30.0
0.1 – – 0.1 0.1 – 0.1
75.0 – 65.0 – 65.0 – 65.0
– – – – – 16.0 16.0
– – – – – 0.2 0.2
7.5 – – 7.5 7.5 – 7.5
1.1 – – – – 0.1 0.1
85.0 51.0 136.0 49.5 185.6
2.3 – – 0.6 0.6 – 0.6
– 0.6 0.6 – 0.6
10.0 – – 10.0 10.0 – 10.0
– 10.0 10.0 – 10.0
3,060.8 1,161.5 4,222.3 189.4 4,411.7
– – 21.3 17.7 39.0 – 39.0
40.4 – 30.0 9.0 39.0 – 39.0
30.0 – 21.4 – 21.4 – 21.4
2.6 – 2.5 – 2.5 – 2.5
3.1 – – – – 0.2 0.2
12.1 – 10.1 – 10.1 – 10.1
85.3 26.7 111.9 0.2 112.1
5.3 – 3.0 – 3.0 – 3.0
15.0 – 15.0 – 15.0 6.5 21.5
4.0 – 1.1 – 1.1 0.4 1.5
4.8 – – 0.4 0.4 – 0.4
25.0 – 12.5 10.0 22.5 – 22.5
5.4 – 5.4 – 5.4 – 5.4
7.3 – 3.8 1.3 5.1 – 5.1
2.2 – 1.8 – 1.8 – 1.8
42.6 11.7 54.3 6.9 61.2
26.3 – 18.9 4.6 23.4 – 23.4
2.7 – 2.4 – 2.4 – 2.4
17.6 – 11.0 5.2 16.2 3.0 19.2
10.0 – 8.2 – 8.2 – 8.2

p162
INVESTMENT PORTFOLIO Company Listing
Region Country UJV* Company Name Sector
Fiscal Year in which
Commitments Were Made
EUROPE & CENTRAL ASIA
Azerbaijan DEMIRBANK OJSC Finance & Insurance FY09
Azerbaijan JSC Bank Respublika Finance & Insurance FY07, 10
Azerbaijan Rabitabank Finance & Insurance FY98, 03, 07
Azerbaijan UniBank Finance & Insurance FY06, 07, 08
Belarus Belarusian Bank for Small Business Finance & Insurance FY08, 09
Belarus Belarusky Narodny Bank Finance & Insurance FY10
Belarus Detroit Belarus Brewing Company Food & Beverages FY04, 06, 08
Belarus Detroit Belarus Juice Co. Food & Beverages FY07, 10
Belarus Erilin Holdings Limited Construction and Real Estate FY08
Belarus JSC Belgazprombank Finance & Insurance FY05, 10
Belarus JSC BPS–BANK (Formerly Belpromstroibank ) Finance & Insurance FY10
Belarus Millex International Wholesale and Retail Trade FY08
Belarus MINSK TRANSIT BANK Finance & Insurance FY09
Belarus OMA LLC Wholesale and Retail Trade FY10
Belarus Priorbank Joint Stock Company Finance & Insurance FY03, 05, 09
Belarus Tigullio Holdings Wholesale and Retail Trade FY09
Bosnia and Herzegovina Bosnalijek, d.d. Sarajevo Chemicals FY99, 01, 05
Bosnia and Herzegovina Horizonte Bosnia and Herzegovina Enterprise Fund Collective Investment Vehicles
FY98
Bosnia and Herzegovina Kozara d.d. Industrial & Consumer Products
FY98
Bosnia and Herzegovina Nova Banka a.d. Banja Luka Finance & Insurance FY06
Bosnia and Herzegovina Polslovni sistem CIMOS TMD Automobilska industrija d.o.o.
Industrial & Consumer Products
FY08
Bosnia and Herzegovina Raiffeisen Bank d.d. Bosnia and Herzegovina Finance & Insurance FY03, 05, 06, 10
Bosnia and Herzegovina Sisecam Sode Lukavac Chemicals FY07
Bosnia and Herzegovina UniCredit Bank d.d. Finance & Insurance FY04
Bosnia and Herzegovina Zdravstvena ustanova Specijalizirana bolnica Center BH
Health Care FY08
Bulgaria Advance TerraFund Construction and Real Estate FY08
Bulgaria AES Geo Energy OOD Electric Power FY09
Bulgaria Drujba Glassworks A.D. Nonmetallic Mineral Product Manufacturing
FY04, 08
Bulgaria EPIQ NV Industrial & Consumer Products
FY06
Bulgaria Kronospan Bulgaria EOOD Industrial & Consumer Products
FY00, 01, 10
Bulgaria Stomana Industry A.D. Primary Metals FY04, 06
Bulgaria Trakya Glass Bulgaria EAD Nonmetallic Mineral Product Manufacturing
FY04, 09
Bulgaria UniCredit Bulbank A.D. Finance & Insurance FY01
Bulgaria Unionbank A.D. Finance & Insurance FY03, 05
Croatia Belisce d.d. Pulp & Paper FY73, 81, 98, 03
Croatia Belje d.d. Agriculture and Forestry FY06, 08
Croatia CMC Sisak d.o.o. Primary Metals FY09

p163
Original Commitment1 Investment for IFC’s Account2
Total IFC(US$ Millions)
Total Syndications (US$ Millions)
Loan(US$ Millions)
Equity(US$ Millions)
Committed Portfolio Loan and Equity
(US$ Millions)
Total Guarantee and Risk Management
(US$ Millions)
Total IFC Committed Portfolio for Its
Own Account (US$ Millions)3
5.0 – 5.0 – 5.0 3.2 8.2
25.0 – 23.1 – 23.1 0.9 24.0
3.6 – 0.8 – 0.8 – 0.8
8.0 – 3.6 – 3.6 1.5 5.1
73.0 9.7 82.7 8.6 91.3
7.4 – 5.0 2.7 7.7 – 7.7
13.3 – 5.0 8.2 13.2 0.1 13.2
11.2 – – 0.0 0.0 – 0.0
1.3 – – 3.3 3.3 – 3.3
12.5 – 9.0 – 9.0 – 9.0
5.0 – 0.7 – 0.7 15.9 16.6
– – – – – 14.4 14.4
26.0 – 26.0 – 26.0 – 26.0
– – – – – 1.3 1.3
7.0 – 7.0 – 7.0 – 7.0
14.0 – 11.4 – 11.4 0.3 11.8
6.0 – 6.0 – 6.0 – 6.0
70.1 14.2 84.3 32.0 116.3
13.9 – 2.7 1.3 4.0 – 4.0
1.9 – – 1.5 1.5 – 1.5
(0.3) – 1.7 – 1.7 – 1.7
12.7 – 5.4 3.7 9.1 – 9.1
34.5 – 27.0 – 27.0 – 27.0
32.1 – 22.4 – 22.4 1.7 24.1
31.6 – 25.0 – 25.0 – 25.0
– – 5.1 15.5 20.5 – 20.5
6.4 – 5.0 – 5.0 – 5.0
94.3 22.0 116.3 1.7 118.0
21.6 – – 22.2 22.2 – 22.2
50.0 40.0 47.6 – 47.6 – 47.6
63.5 – 13.4 – 13.4 – 13.4
14.0 – 1.6 2.2 3.8 – 3.8
44.5 12.3 30.2 – 30.2 – 30.2
44.2 – 22.3 – 22.3 – 22.3
54.7 65.1 25.3 7.5 32.8 – 32.8
17.3 – – 17.5 17.5 – 17.5
11.3 – 3.4 – 3.4 – 3.4
143.7 49.3 193.0 – 193.0
60.7 64.1 6.1 – 6.1 – 6.1
51.1 – 54.1 – 54.1 – 54.1
56.4 – 49.2 – 49.2 – 49.2

p164
INVESTMENT PORTFOLIO Company Listing
Region Country UJV* Company Name Sector
Fiscal Year in which
Commitments Were Made
EUROPE & CENTRAL ASIA
Croatia Erste & Steiermarkische Bank d.d. Finance & Insurance FY00, 03
Croatia PIK Vrbovec d.d. Food & Beverages FY06, 08
Croatia Privredna banka Zagreb d.d. Finance & Insurance FY05
Croatia The CC Partnership L.P. Collective Investment Vehicles
FY99
Czech Republic CDV–1 Holding Company, L.P. Finance & Insurance FY01, 03
Czech Republic Ceska sporitelna, a.s. Finance & Insurance FY03
Czech Republic Ceskoslovenska obchodni banka, a.s. Finance & Insurance FY03
Georgia Bank of Georgia Finance & Insurance FY00, 03, 09, 10
Georgia JSC Bank Republic Finance & Insurance FY08, 10
Georgia JSC Tbilisi Central Construction and Real Estate FY08
Georgia Rakeen Uptown Development LLC Construction and Real Estate FY09
Georgia TAV Urban Georgia LLC Transportation and Warehousing
FY06
Georgia TBC Bank Finance & Insurance FY98, 00, 02, 04, 05, 06, 07,
08, 09, 10Georgia TBC Leasing Finance & Insurance FY05
Georgia TbilComBank Finance & Insurance FY99
Hungary Erste Bank Hungary Nyrt. Finance & Insurance FY03
Hungary Honeywell ESCO Hungary Electric Power FY00
Hungary Orszagos Takarekpenztar es Kereskedelmi Bank Rt. Finance & Insurance FY02, 06
Hungary Raiffeisen Bank Zrt. Finance & Insurance FY03
Hungary UniCredit Bank Hungary Zrt. Finance & Insurance FY03
Kazakhstan ABN-AMRO Bank Kazakhstan Finance & Insurance FY94, 96, 98, 03, 07
Kazakhstan Bank CenterCredit Finance & Insurance FY05, 08, 09, 10
Kazakhstan BTA Bank Finance & Insurance FY00, 03
Kazakhstan BTA Orix Leasing Finance & Insurance FY05
Kazakhstan Home Mart LLP Construction and Real Estate FY09
Kazakhstan Jambyl Cement LLP Nonmetallic Mineral Product Manufacturing
FY09
Kazakhstan JSC ATF Bank Finance & Insurance FY10
Kazakhstan Mittal Steel SME Resource TOO Collective Investment Vehicles
FY02
Kazakhstan Ust–Kamenogorsk Poultry Farm JSC Agriculture and Forestry FY10
Kyrgyz Republic Demir Kyrgyz International Bank Finance & Insurance FY97, 03, 09
Kyrgyz Republic Kyrgyz Investment & Credit Bank Finance & Insurance FY01, 05, 07, 08, 09
Kyrgyz Republic Kyrgyz–Chinese Joint Venture Altyn-Ajydar Pulp & Paper FY00, 05, 08
Kyrgyz Republic Magic Box Pulp & Paper FY07
Kyrgyz Republic Micro credit Agency Bai Tushum Financial Fund Finance & Insurance FY06, 09
Kyrgyz Republic UniCredit Bank OJSC Finance & Insurance FY10

p165
Original Commitment1 Investment for IFC’s Account2
Total IFC(US$ Millions)
Total Syndications (US$ Millions)
Loan(US$ Millions)
Equity(US$ Millions)
Committed Portfolio Loan and Equity
(US$ Millions)
Total Guarantee and Risk Management
(US$ Millions)
Total IFC Committed Portfolio for Its
Own Account (US$ Millions)3
36.4 – 6.6 – 6.6 – 6.6
62.7 – 24.6 – 24.6 – 24.6
99.4 – 55.3 – 55.3 – 55.3
5.0 – – 0.3 0.3 – 0.3
195.8 0.3 196.1 – 196.1
15.9 – – 0.0 0.0 – 0.0
– – – – – 10.9 10.9
– – – – – 0.4 0.4
– 0.0 0.0 11.3 11.3
107.2 – 100.5 – 100.5 19.4 119.8
62.0 – 55.3 – 55.3 – 55.3
8.5 – 8.5 – 8.5 – 8.5
49.6 – 42.0 7.6 49.6 – 49.6
25.9 – 20.9 – 20.9 – 20.9
99.0 – 54.2 35.4 89.5 4.0 93.5
3.0 – 0.2 – 0.2 – 0.2
1.0 – 0.5 – 0.5 – 0.5
282.1 43.0 325.1 23.4 348.5
– – – – – 3.2 3.2
0.4 – – 0.4 0.4 – 0.4
– – – – – 107.7 107.7
– – – – – 21.7 21.7
– – – – – 0.0 0.0
– 0.4 0.4 132.6 133.0
25.8 1.0 – 15.4 15.4 – 15.4
240.0 – 133.9 100.0 233.9 43.7 277.6
15.0 – – 4.9 4.9 – 4.9
6.1 – 1.3 1.1 2.3 – 2.3
45.0 – 45.0 – 45.0 – 45.0
64.3 110.0 50.0 14.3 64.3 – 64.3
60.0 – 60.0 – 60.0 – 60.0
3.4 – 3.3 0.1 3.4 – 3.4
2.0 – 2.0 – 2.0 – 2.0
295.4 135.8 431.3 43.7 475.0
5.6 – 5.0 0.6 5.6 – 5.6
9.2 – 8.0 1.7 9.7 – 9.7
3.3 – 2.0 – 2.0 – 2.0
1.5 – 1.1 – 1.1 – 1.1
5.2 – 4.3 – 4.3 – 4.3
10.0 – 10.0 – 10.0 – 10.0
30.3 2.3 32.6 – 32.6

p166
INVESTMENT PORTFOLIO Company Listing
Region Country UJV* Company Name Sector
Fiscal Year in which
Commitments Were Made
EUROPE & CENTRAL ASIA
Latvia Baltic-American Enterprise Fund Finance & Insurance FY05
Latvia JSC Hansabanka Finance & Insurance FY03
Lithuania AB SEB Vilniaus Bankas Finance & Insurance FY03
Lithuania SEB RE Portfolio Lithuania Finance & Insurance FY09
Macedonia, Former Yugoslav Republic of
Elektrostopanstvo na Makedonija Electric Power FY08
Macedonia, Former Yugoslav Republic of
Makedonski Telekom Information FY98
Macedonia, Former Yugoslav Republic of
NLB Tutunska banka, A.D. Skopje Finance & Insurance FY10
Macedonia, Former Yugoslav Republic of
Small Enterprise Assistance Fund-Macedonia Fund L.L.C.
Collective Investment Vehicles
FY00
Macedonia, Former Yugoslav Republic of
Stopanska Banka a.d. Skopje Finance & Insurance FY98, 00, 01, 03
Moldova BC Moldova Agroindbank SA Finance & Insurance FY10
Moldova Bostavan Wineries, Ltd. Food & Beverages FY08
Moldova Orange Moldova S.A. Information FY99, 00, 01
Moldova ProCredit Bank Moldova Finance & Insurance FY09
Moldova RED UNION FENOSA S.A. Electric Power FY02, 10
Moldova Victoriabank Finance & Insurance FY02, 04
Montenegro Gintasmont Investment Construction and Trade A.D. Construction and Real Estate FY08
Montenegro Government of Montenegro Other FY80
Montenegro Institut Za Fizikalnu Medicinu I Rehabilitaciju (“Dr. Simo Milosevic”) Igalo
Other FY82, 88
Montenegro NLB Montenegrobanka, A.D., Podgorica Finance & Insurance FY09
Poland Central Poland Fund, LLC Collective Investment Vehicles
FY98
Poland FM Bank Finance & Insurance FY09
Poland Fundusz Mikro SP. Z.O.O. Finance & Insurance FY09
Poland Global Hotels Development Group Poland S.A. Accommodation & Tourism Services
FY99
Poland Peters Fleischindustrie und Handel Aktiengesellschaft
Food & Beverages FY94
Republic of Kosovo Newko Balkan LLC Industrial & Consumer Products
FY10
Romania Arabesque S.R.L. Wholesale and Retail Trade FY07
Romania ATE Bank Romania S.A. Finance & Insurance FY05, 08, 09
Romania Banat Construct S.R.L. Construction and Real Estate FY08
Romania Banca Comerciala Romana S. A. Finance & Insurance FY03, 04, 06, 09
Romania Banca Transilvania S.A. Finance & Insurance FY04, 05, 07, 09, 10
Romania C.N.F.R. NAVROM S.A. GALATI Transportation and Warehousing
FY06

p167
Original Commitment1 Investment for IFC’s Account2
Total IFC(US$ Millions)
Total Syndications (US$ Millions)
Loan(US$ Millions)
Equity(US$ Millions)
Committed Portfolio Loan and Equity
(US$ Millions)
Total Guarantee and Risk Management
(US$ Millions)
Total IFC Committed Portfolio for Its
Own Account (US$ Millions)3
7.1 – 0.6 – 0.6 – 0.6
– – – – – 0.8 0.8
0.6 – 0.6 0.8 1.4
– – – – – 0.0 0.0
13.4 – 12.3 – 12.3 – 12.3
12.3 – 12.3 0.0 12.3
55.3 – 43.0 – 43.0 – 43.0
25.0 25.0 – 11.3 11.3 – 11.3
34.0 – 30.7 – 30.7 – 30.7
1.8 – – 0.5 0.5 – 0.5
12.1 – – 10.3 10.3 – 10.3
73.7 22.1 95.8 – 95.8
15.0 – 15.0 – 15.0 – 15.0
10.0 – – 5.0 5.0 – 5.0
15.3 21.8 – 1.6 1.6 – 1.6
7.0 – 7.0 – 7.0 – 7.0
35.0 – 18.6 – 18.6 – 18.6
9.0 – 1.0 – 1.0 – 1.0
41.6 6.6 48.2 – 48.2
15.7 – 12.3 – 12.3 – 12.3
– – 1.0 – 1.0 – 1.0
22.0 – 6.9 – 6.9 – 6.9
14.1 – 12.3 – 12.3 – 12.3
32.4 – 32.4 – 32.4
1.6 – – 1.3 1.3 – 1.3
– – 12.5 5.1 17.6 – 17.6
27.0 – 1.8 – 1.8 – 1.8
4.2 – 2.0 – 2.0 – 2.0
6.5 – – 0.9 0.9 – 0.9
16.3 7.3 23.6 – 23.6
6.5 – 6.4 – 6.4 – 6.4
6.4 – 6.4 – 6.4
37.8 37.8 31.7 – 31.7 – 31.7
36.5 – 12.3 24.3 36.6 – 36.6
– – 4.6 – 4.6 – 4.6
344.5 – 131.0 – 131.0 – 131.0
199.8 105.8 142.3 20.0 162.3 – 162.3
16.8 – 10.6 – 10.6 – 10.6

p168
INVESTMENT PORTFOLIO Company Listing
Region Country UJV* Company Name Sector
Fiscal Year in which
Commitments Were Made
EUROPE & CENTRAL ASIA
Romania Credit Europe Bank (Romania) S.A. Finance & Insurance FY07
Romania Domenia Credit IFN S.A. Finance & Insurance FY04
Romania MedLife S.A. Health Care FY07, 10
Romania ProCredit Bank S.A. Finance & Insurance FY02, 03, 04, 07, 10
Romania Romania Gas Holding Utilities FY05
Romania S.C. Transport Trade Services S.A. Transportation and Warehousing
FY08
Russian Federation Absolut Bank Finance & Insurance FY06, 07, 08
Russian Federation Air Transport Systems Transportation and Warehousing
FY06
Russian Federation ALD Automotive Finance & Insurance FY05
Russian Federation Asian–Pacifi c Bank (Open joint–stock company) Finance & Insurance FY09
Russian Federation Asteros Technology Solutions Holding Ltd. Information FY09, 10
Russian Federation AVA Peter Ltd. Health Care FY08
Russian Federation Avtokran OJSC Industrial & Consumer Products
FY10
Russian Federation Banque Societe Generale Vostok Finance & Insurance FY04
Russian Federation Baring Vostok Private Equity Fund III Collective Investment Vehicles
FY05
Russian Federation Baring Vostok Private Equity Fund, L.P. 2 Collective Investment Vehicles
FY01
Russian Federation Belgorodskie Granulirovannye Korma Agriculture and Forestry FY08
Russian Federation Borets International Ltd. Industrial & Consumer Products
FY10
Russian Federation Brunswick Capital Transportation and Warehousing
FY06, 08
Russian Federation Brunswick Leasing Limited Transportation and Warehousing
FY06, 10
Russian Federation CapMan Russia Fund L.P. Collective Investment Vehicles
FY07
Russian Federation Chukotka Mining and Geological Company Oil, Gas and Mining FY06
Russian Federation Chuvash Republic Utilities FY06, 09
Russian Federation Cinema Park Wholesale and Retail Trade FY06
Russian Federation Commercial Bank DeltaCredit Finance & Insurance FY02, 03
Russian Federation Commercial Bank Rostpromstroybank (OJSC) Finance & Insurance FY09
Russian Federation Concordia Ltd. Food & Beverages FY07, 08
Russian Federation Credit Bank of Moscow Finance & Insurance FY05, 06, 10
Russian Federation Daido Metal Russia LLC Industrial & Consumer Products
FY08
Russian Federation Detroit Investments Food & Beverages FY07, 10
Russian Federation Europe Hotel, Limited Liability Company Accommodation & Tourism Services
FY05
Russian Federation Eurosib Group Transportation and Warehousing
FY05, 06
Russian Federation FactorRus Finance & Insurance FY10
Russian Federation FIRST RUSSIA-NIS FUND Collective Investment Vehicles
FY95
Russian Federation Forus Bank Finance & Insurance FY06, 10
Russian Federation Home Center Ltd. Wholesale and Retail Trade FY08

p169
Original Commitment1 Investment for IFC’s Account2
Total IFC(US$ Millions)
Total Syndications (US$ Millions)
Loan(US$ Millions)
Equity(US$ Millions)
Committed Portfolio Loan and Equity
(US$ Millions)
Total Guarantee and Risk Management
(US$ Millions)
Total IFC Committed Portfolio for Its
Own Account (US$ Millions)3
53.6 – 25.9 – 25.9 – 25.9
5.0 – 2.1 – 2.1 – 2.1
23.8 – 17.6 3.2 20.8 – 20.8
25.3 – 7.2 5.3 12.5 – 12.5
54.4 – – 48.5 48.5 – 48.5
17.0 – 11.5 – 11.5 – 11.5
396.8 101.3 498.2 – 498.2
52.4 – 9.2 31.0 40.2 – 40.2
8.0 – 3.0 – 3.0 – 3.0
– – 7.9 – 7.9 – 7.9
42.4 – 15.2 20.0 35.2 6.6 41.8
22.5 – 20.0 2.5 22.5 – 22.5
12.5 – 12.5 – 12.5 – 12.5
27.1 – 26.0 – 26.0 – 26.0
75.0 – 12.5 – 12.5 – 12.5
12.5 – – 11.2 11.2 – 11.2
15.0 – – 0.6 0.6 – 0.6
80.0 – 27.0 50.0 77.0 – 77.0
50.0 – 50.0 – 50.0 – 50.0
124.7 – 70.1 – 70.1 – 70.1
20.0 – – 27.5 27.5 – 27.5
14.0 – – 14.7 14.7 – 14.7
– – 3.3 – 3.3 – 3.3
6.0 – 6.4 – 6.4 7.4 13.8
20.0 – 15.4 – 15.4 – 15.4
74.0 – 44.2 – 44.2 – 44.2
21.5 – – 21.5 21.5 – 21.5
40.0 35.8 27.6 – 27.6 – 27.6
55.0 – 42.5 – 42.5 69.0 111.5
5.2 – 4.1 – 4.1 – 4.1
37.5 – 32.6 – 32.6 – 32.6
15.0 50.0 8.7 – 8.7 – 8.7
48.8 8.2 30.0 – 30.0 – 30.0
5.0 – – 5.0 5.0 – 5.0
15.0 – – 0.0 0.0 – 0.0
6.2 – 1.6 – 1.6 1.8 3.4
10.0 – 10.0 – 10.0 – 10.0

p170
INVESTMENT PORTFOLIO Company Listing
Region Country UJV* Company Name Sector
Fiscal Year in which
Commitments Were Made
EUROPE & CENTRAL ASIA
Russian Federation JSC SFAT Transportation and Warehousing
FY04, 05
Russian Federation Kinross Gold Corporation Oil, Gas and Mining FY09
Russian Federation Kronowood LLC Industrial & Consumer Products
FY04, 05
Russian Federation KuibyshevAzot JSC Chemicals FY05, 08, 09
Russian Federation Kulon Yugros ZAO Transportation and Warehousing
FY10
Russian Federation Logopark Ob LLC Construction and Real Estate FY09
Russian Federation Macquarie Renaissance Infrastructure Fund Collective Investment Vehicles
FY09
Russian Federation MDM Bank Finance & Insurance FY07, 08, 09
Russian Federation MDM Bank, Open Joint Stock Company Finance & Insurance FY07, 08, 09, 10
Russian Federation Medicina Joint Stock Company Health Care FY08
Russian Federation Municipal Unitarian Enterprise Ufavodokanal Utilities FY10
Russian Federation Municipal Unitary Enterprise “Upravlenie Zakazchika Zhilischno-Kommunalnogo Khozyaistva”
Other FY09
Russian Federation NBD Bank Finance & Insurance FY02, 03, 06, 08, 10
Russian Federation New Medical Center Health Care FY01
Russian Federation Nitol Solar Limited Chemicals FY09
Russian Federation OOO KALININGRADINVEST Construction and Real Estate FY10
Russian Federation OOO KRASNOYARSKINVEST Construction and Real Estate FY10
Russian Federation OOO Kronostar Industrial & Consumer Products
FY04, 05, 09
Russian Federation OOO Logopark Don Transportation and Warehousing
FY10
Russian Federation OOO Northern Capital Gateway, Ltd. Transportation and Warehousing
FY10
Russian Federation OOO Ruscam Nonmetallic Mineral Product Manufacturing
FY02, 03, 04
Russian Federation OOO SAMSTROYKOM Construction and Real Estate FY10
Russian Federation OOO YAROSLAVLOTELINVEST Construction and Real Estate FY10
Russian Federation Open Joint Stock Company Commercial Bank “Center-invest”
Finance & Insurance FY02, 05, 06, 10
Russian Federation Petropavlovsk Kamchatsky Other FY08
Russian Federation Petropavlovsk Plc Oil, Gas and Mining FY05, 06, 07
Russian Federation Pilkington Float Glass Russia Nonmetallic Mineral Product Manufacturing
FY04, 07
Russian Federation PromSvyazBank Finance & Insurance FY10
Russian Federation Quadriga Capital Russia Fund Collective Investment Vehicles
FY05
Russian Federation Republic of Maryi El Transportation and Warehousing
FY09, 10
Russian Federation ROOF Russia S.A. Finance & Insurance FY07
Russian Federation RosEvroBank Joint Stock Commercial Bank Finance & Insurance FY10
Russian Federation ruNet Holdings Limited Professional, Scientifi c and Technical Services
FY03
Russian Federation Rusfi nance Bank LLC Finance & Insurance FY05, 07
Russian Federation Russia Partners II, LP Collective Investment Vehicles
FY05

p171
Original Commitment1 Investment for IFC’s Account2
Total IFC(US$ Millions)
Total Syndications (US$ Millions)
Loan(US$ Millions)
Equity(US$ Millions)
Committed Portfolio Loan and Equity
(US$ Millions)
Total Guarantee and Risk Management
(US$ Millions)
Total IFC Committed Portfolio for Its
Own Account (US$ Millions)3
60.0 55.0 17.1 – 17.1 – 17.1
– – – 12.5 12.5 – 12.5
87.3 – 50.6 – 50.6 – 50.6
55.0 – 21.5 20.0 41.5 – 41.5
14.4 – 12.1 – 12.1 – 12.1
40.0 – 21.5 – 21.5 – 21.5
100.0 – – 100.0 100.0 – 100.0
319.0 500.0 – – – 12.0 12.0
– 246.8 154.1 80.6 234.7 – 234.7
20.1 – 10.1 – 10.1 – 10.1
17.2 – 16.0 – 16.0 – 16.0
9.7 – 9.6 – 9.6 – 9.6
29.5 – 5.0 – 5.0 0.1 5.1
2.1 – 0.5 – 0.5 – 0.5
49.9 – – 50.0 50.0 – 50.0
– – 6.1 – 6.1 – 6.1
– – 8.2 – 8.2 – 8.2
124.3 49.3 60.5 – 60.5 – 60.5
30.0 10.0 31.0 – 31.0 – 31.0
94.3 – 86.0 – 86.0 – 86.0
40.5 – 3.2 – 3.2 – 3.2
– – 7.7 – 7.7 – 7.7
– – 5.7 – 5.7 – 5.7
43.0 – 33.6 – 33.6 – 33.6
28.7 – 18.7 – 18.7 – 18.7
32.4 – – 19.9 19.9 – 19.9
47.6 – 37.9 – 37.9 – 37.9
– – – – – 1.4 1.4
20.0 – – 20.0 20.0 – 20.0
33.4 – 33.7 – 33.7 – 33.7
12.0 – 12.0 – 12.0 – 12.0
– – – – – 7.1 7.1
5.0 – – 5.0 5.0 – 5.0
– – 137.4 – 137.4 – 137.4
10.0 – – 9.8 9.8 – 9.8

p172
INVESTMENT PORTFOLIO Company Listing
Region Country UJV* Company Name Sector
Fiscal Year in which
Commitments Were Made
EUROPE & CENTRAL ASIA
Russian Federation Russian Hotel Investments BV Accommodation & Tourism Services
FY10
Russian Federation Russian Mortgage Backed Securities 2006-1 S.A. Finance & Insurance FY07
Russian Federation Sector Investment Holding Company Limited Collective Investment Vehicles
FY96
Russian Federation Sevtekhnotrans Transportation and Warehousing
FY04, 10
Russian Federation State Unitary Enterprise “CHUVASHAVTODOR” Construction and Real Estate FY07
Russian Federation The Russian Technology Fund, L.P. Collective Investment Vehicles
FY96
Russian Federation Transcapitalbank Finance & Insurance FY09, 10
Russian Federation Trio Invest LLC Transportation and Warehousing
FY06
Russian Federation United Trading A/S Agriculture and Forestry FY08
Russian Federation Volga Shipping Company Transportation and Warehousing
FY05
Russian Federation Vostok Energy Ltd Oil, Gas and Mining FY08
Russian Federation Vyksa Steel Works Primary Metals FY06, 10
Russian Federation ZAO DeltaLeasing Finance & Insurance FY04, 06
Russian Federation ZAO Europlan Finance & Insurance FY02, 07
Russian Federation ZAO Locko Bank Finance & Insurance FY06, 08, 09
Russian Federation ZAO Monocrystal Industrial & Consumer Products
FY10
Russian Federation ZAO Raiffeisenbank Austria Finance & Insurance FY03, 05
Serbia Banca Intesa AD Beograd Finance & Insurance FY04, 06, 08
Serbia Continental Banka A.D. Finance & Insurance FY04, 06
Serbia Frikom A.D. Food & Beverages FY77, 09
Serbia Kronospan SRB d.o.o. Industrial & Consumer Products
FY10
Serbia Loan to Eight Banks for Small-Scale Enterprises Finance & Insurance FY80
Serbia Nova Sloga A.D. Food & Beverages FY09
Serbia Poteza Adriatic Fund B.V. Collective Investment Vehicles
FY04
Serbia ProCredit Bank Serbia Finance & Insurance FY02, 03, 07, 10
Serbia Procredit Leasing d.o.o. Finance & Insurance FY08
Serbia PWW Deponija d.o.o. Jagodina Utilities FY08
Serbia PWW Deponija DVA d.o.o. Leskovac Utilities FY08
Serbia Raiffeisen Leasing d.o.o. Beograd. Finance & Insurance FY10
Serbia Societe Generale Banka Srbija AD Beograd Finance & Insurance FY10
Serbia Unicredit Bank Srbija A.D. Finance & Insurance FY05
Slovakia Dexia banka Slovensko, a.s. Finance & Insurance FY03
Slovenia Gorenje, d.d. Industrial & Consumer Products
FY10
Tajikistan Access Bank Tajikistan CJSC Finance & Insurance FY09
Tajikistan First Microfi nance Bank of Tajikistan Finance & Insurance FY05, 06, 08, 10
Tajikistan International Micro Loan Fund IMON Finance & Insurance FY08

p173
Original Commitment1 Investment for IFC’s Account2
Total IFC(US$ Millions)
Total Syndications (US$ Millions)
Loan(US$ Millions)
Equity(US$ Millions)
Committed Portfolio Loan and Equity
(US$ Millions)
Total Guarantee and Risk Management
(US$ Millions)
Total IFC Committed Portfolio for Its
Own Account (US$ Millions)3
33.4 – – 2.7 2.7 – 2.7
10.6 – 6.1 – 6.1 8.8 14.8
– – – 0.0 0.0 – 0.0
70.0 – 41.4 – 41.4 – 41.4
50.3 – 34.8 – 34.8 – 34.8
1.0 – – 0.4 0.4 – 0.4
30.0 – 30.0 – 30.0 16.3 46.3
20.0 – 16.7 – 16.7 – 16.7
100.0 – – 50.0 50.0 – 50.0
18.4 12.6 11.1 – 11.1 – 11.1
30.0 – – 30.0 30.0 – 30.0
130.0 – 104.3 – 104.3 – 104.3
10.2 – 1.8 – 1.8 – 1.8
30.7 – 8.7 – 8.7 – 8.7
53.7 45.0 23.3 23.8 47.1 22.2 69.3
10.0 – 10.0 – 10.0 – 10.0
20.0 – 75.0 – 75.0 – 75.0
1,642.9 608.9 2,251.9 152.7 2,404.5
146.3 – 73.7 74.3 148.0 – 148.0
25.5 – 18.4 – 18.4 – 18.4
61.4 1.0 36.9 – 36.9 – 36.9
29.8 – 29.5 – 29.5 – 29.5
26.0 5.7 0.9 – 0.9 – 0.9
0.0 – 12.3 – 12.3 – 12.3
13.7 – – 14.2 14.2 – 14.2
57.9 – 33.8 – 33.8 – 33.8
15.7 – 12.3 – 12.3 – 12.3
– – 2.5 – 2.5 – 2.5
– – 2.7 – 2.7 – 2.7
– – 15.8 – 15.8 – 15.8
49.6 – 49.2 – 49.2 – 49.2
37.6 – 30.0 – 30.0 – 30.0
317.9 88.4 406.3 – 406.3
– – – – – 1.1 1.1
– – – 1.1 1.1
92.8 – 61.4 30.7 92.1 – 92.1
61.4 30.7 92.1 – 92.1
2.0 – – 2.0 2.0 – 2.0
4.3 – 3.0 1.3 4.3 – 4.3
2.5 – 2.5 – 2.5 – 2.5

p174
INVESTMENT PORTFOLIO Company Listing
Region Country UJV* Company Name Sector
Fiscal Year in which
Commitments Were Made
EUROPE & CENTRAL ASIA
Tajikistan Open Joint Stock Company Pamir Energy Company Electric Power FY03
Tajikistan Open Joint Stock Company, Bank Eskhata Finance & Insurance FY06, 08, 09
Tajikistan SugdAgroServ Agriculture and Forestry FY02, 04
Tajikistan Tojiksodirotbonk Finance & Insurance FY02, 07, 08
Tajikistan Tourism Promotion Services Limited (Tajikistan) Accommodation & Tourism Services
FY09
Turkey Abdulkadir Ozcan Otomotiv Lastik San. Tic. A.S Industrial & Consumer Products
FY08
Turkey Akbank Finance & Insurance FY03, 10
Turkey Akenerji Elektrik Uretim A.S. Electric Power FY10
Turkey Arkas Group Transportation and Warehousing
FY08
Turkey Assan Aluminyum Sanayi ve Ticaret Anonim Sirketi Primary Metals FY02, 05, 08, 09
Turkey Avea Iletisim Hizmetleri A.S Information FY06, 07
Turkey Banvit Bandirma Vitaminli Yem Sanayi A.S. Agriculture and Forestry FY01, 07
Turkey Cimko Cimento ve Beton Sanayi Ticaret A.S. Nonmetallic Mineral Product Manufacturing
FY06
Turkey Delta Petrol Urunleri Ticaret Anonim Sirketi Chemicals FY08
Turkey Enerjisa Enerji Uretim A.S. Electric Power FY08
Turkey Eurasia CP Jersey L.P. Collective Investment Vehicles
FY10
Turkey Finans Finansal Kiralama A.S. Finance & Insurance FY97, 98, 06, 10
Turkey Finansbank A.S. Finance & Insurance FY00, 07
Turkey Izgaz Izmit Gaz Dagitim Sanayi ve Ticaret A.S. Utilities FY09
Turkey Kucukcalik Tekstil Sanayii ve Ticaret A.S. Textiles, Apparel & Leather FY07, 08
Turkey Mayagro Tohumculuk Sanayi ve Ticaret A.S. Agriculture and Forestry FY09
Turkey Medya Holding A.S. Information FY93, 96
Turkey Meteksan Sistem ve Bilgisayar Teknolojileri A.S. Professional, Scientifi c and Technical Services
FY04
Turkey Metropolitan Municipality of Istanbul Other FY09
Turkey Milli Reasurans T.A.S. Finance & Insurance FY02, 06
Turkey Modern Karton Sanayii ve Ticaret A.S. Pulp & Paper FY98, 02, 06, 09
Turkey PALGAZ Dogal Gaz Dagitim Sanayi Utilities FY05
Turkey Posuda LLC Nonmetallic Mineral Product Manufacturing
FY08
Turkey Rotor Elektrik Uretim A.S Electric Power FY09
Turkey Sarten Ambalaj Sanayi ve Ticaret A.S. Industrial & Consumer Products
FY07, 10
Turkey Sekerbank T.A.S. Finance & Insurance FY08, 09, 10
Turkey Soktas Tekstil Sanayi ve Ticaret Anonim Sirketi Textiles, Apparel & Leather FY98, 02, 08
Turkey Standard Profi l Otomotiv Ticaret ve Sanayi A.S. Industrial & Consumer Products
FY06, 07
Turkey TCE Ege Konteyner Terminal Isletmeleri A.S. Transportation and Warehousing
FY10
Turkey Trakya Cam Sanayii A.S. Nonmetallic Mineral Product Manufacturing
FY79, 83, 84, 89, 91, 96, 99, 09
Turkey Türk Ekonomi Bankasi A.S. Finance & Insurance FY95, 99, 03, 05, 08
Turkey Turkish Private Equity Fund I L.P. Collective Investment Vehicles
FY02

p175
Original Commitment1 Investment for IFC’s Account2
Total IFC(US$ Millions)
Total Syndications (US$ Millions)
Loan(US$ Millions)
Equity(US$ Millions)
Committed Portfolio Loan and Equity
(US$ Millions)
Total Guarantee and Risk Management
(US$ Millions)
Total IFC Committed Portfolio for Its
Own Account (US$ Millions)3
8.0 – 4.5 3.5 8.0 – 8.0
5.0 – 5.3 – 5.3 0.1 5.4
0.8 – 0.4 – 0.4 – 0.4
0.2 – 1.2 – 1.2 – 1.2
7.0 – 7.0 – 7.0 – 7.0
23.9 6.8 30.7 0.1 30.8
30.0 – 30.0 – 30.0 – 30.0
130.0 100.0 75.0 – 75.0 – 75.0
75.0 – 75.0 – 75.0 – 75.0
45.0 – 32.3 – 32.3 1.5 33.8
30.0 10.0 58.1 – 58.1 – 58.1
240.0 300.0 52.5 – 52.5 – 52.5
60.0 – 32.9 – 32.9 – 32.9
75.0 100.0 65.0 – 65.0 – 65.0
45.0 – 45.0 – 45.0 – 45.0
247.7 556.6 194.2 – 194.2 – 194.2
13.6 – – 12.3 12.3 – 12.3
76.5 – 52.5 – 52.5 – 52.5
259.2 – – 259.2 259.2 – 259.2
50.0 – 48.7 – 48.7 – 48.7
25.1 – 22.9 – 22.9 – 22.9
10.0 – 10.0 – 10.0 – 10.0
28.6 – 0.0 – 0.0 – 0.0
8.5 – 1.7 – 1.7 – 1.7
67.9 – 56.5 – 56.5 – 56.5
100.0 – 61.4 – 61.4 – 61.4
110.0 30.0 68.6 – 68.6 – 68.6
10.0 – 8.1 – 8.1 – 8.1
40.0 – 40.0 – 40.0 – 40.0
71.5 – 66.2 – 66.2 – 66.2
30.0 – 29.4 – 29.4 – 29.4
147.0 – 72.3 50.0 122.3 24.6 146.9
42.0 – 21.5 – 21.5 – 21.5
52.1 – 33.5 3.8 37.3 – 37.3
20.0 – 20.0 – 20.0 – 20.0
125.7 31.0 58.0 (0.0) 58.0 – 58.0
212.5 32.5 130.5 – 130.5 – 130.5
10.0 – – 4.8 4.8 – 4.8

p176
INVESTMENT PORTFOLIO Company Listing
Region Country UJV* Company Name Sector
Fiscal Year in which
Commitments Were Made
EUROPE & CENTRAL ASIA
Turkey Turkish Private Equity Fund II L.P. Collective Investment Vehicles
FY07
Turkey TURKIYE SINAI KALKINMA BANKASI, A.S. Finance & Insurance FY64, 67, 69, 72, 73, 75, 76, 80,
83, 92, 05Turkey Unitim Holdings A.S Textiles, Apparel & Leather FY07
Turkey Yapi Kredi Finansal Kiralama A.O. Finance & Insurance FY97, 98, 04, 08, 10
Turkey Yuce Ozel Egitim VE Kulturel Hizmetler A.S. Education Services FY05
Ukraine Bucha Glassworks LLC Nonmetallic Mineral Product Manufacturing
FY08
Ukraine CJSC AES Kyivoblenergo Electric Power FY05
Ukraine CJSC AES RivneEnergo Electric Power FY05
Ukraine CJSC Myronivsky Hliboproduct Agriculture and Forestry FY04, 05, 10
Ukraine Closed Joint Stock Company Rise Agriculture and Forestry FY06
Ukraine Delta–Wilmar CIS Ltd Food & Beverages FY07, 09
Ukraine Euroventures Ukraine Fund II Collective Investment Vehicles
FY05
Ukraine Evrotek Group Wholesale and Retail Trade FY09
Ukraine First Lease Finance & Insurance FY04, 05
Ukraine Globino Meat Processing Plant Food & Beverages FY10
Ukraine Industrial Union of Donbass Primary Metals FY06, 08
Ukraine LLC Savservice Center Wholesale and Retail Trade FY06, 09
Ukraine Megabank Finance & Insurance FY10
Ukraine Mriya Agro Holding Public Limited Agriculture and Forestry FY10
Ukraine Nova Linia Wholesale and Retail Trade FY04, 06
Ukraine OJSC “Platinum Bank” Finance & Insurance FY07, 08
Ukraine OJSC Concern Khlibprom Food & Beverages FY07
Ukraine OJSC New Engineering Technology Accommodation & Tourism Services
FY06
Ukraine PJSC “Concern Galnaftogaz” Chemicals FY06, 08
Ukraine PJSC OTP Bank Finance & Insurance FY05, 10
Ukraine ProCredit Bank Ukraine Finance & Insurance FY01, 04, 08
Ukraine Pt Platinum Limited Finance & Insurance FY08
Ukraine Public Joint Stock Company Swedbank Finance & Insurance FY09
Ukraine Raiffeisen Bank Aval Finance & Insurance FY05, 06, 09
Ukraine Souffl et Finances SNC Agriculture and Forestry FY09
Ukraine The State Export Import Bank of Ukraine Finance & Insurance FY10
Uzbekistan Fayz Holding Joint Stock Company of the Open Type
Industrial & Consumer Products
FY98
Uzbekistan Hamkorbank, Joint Stock Commercial Bank Finance & Insurance FY01, 07, 10
Uzbekistan Parvina Bank, Private Closed Joint Stock Commercial Bank
Finance & Insurance FY01
Uzbekistan RBS NB Uzbekistan Finance & Insurance FY96
Uzbekistan Uzbek Leasing International A.O. Finance & Insurance FY96, 01, 03, 09
Uzbekistan UZBEK-BRITISH JOINT VENTURE LIMITED LIABILITY COMPANY KATERING
Wholesale and Retail Trade FY09

p177
Original Commitment1 Investment for IFC’s Account2
Total IFC(US$ Millions)
Total Syndications (US$ Millions)
Loan(US$ Millions)
Equity(US$ Millions)
Committed Portfolio Loan and Equity
(US$ Millions)
Total Guarantee and Risk Management
(US$ Millions)
Total IFC Committed Portfolio for Its
Own Account (US$ Millions)3
32.0 – – 33.2 33.2 – 33.2
70.1 45.0 50.0 – 50.0 – 50.0
29.0 – 27.6 – 27.6 – 27.6
108.1 – 95.0 – 95.0 – 95.0
4.5 – 2.1 – 2.1 – 2.1
1,636.5 363.2 1,999.8 26.1 2,025.9
– – 17.5 – 17.5 – 17.5
30.0 – 20.8 – 20.8 – 20.8
15.0 – 10.9 – 10.9 – 10.9
160.0 – 50.0 – 50.0 11.3 61.3
10.0 – 4.2 – 4.2 – 4.2
62.5 – 54.8 – 54.8 – 54.8
7.5 – – 7.4 7.4 – 7.4
20.0 – – 20.0 20.0 – 20.0
(3.0) – 5.3 – 5.3 – 5.3
25.0 – 25.0 – 25.0 – 25.0
200.0 500.0 180.0 – 180.0 – 180.0
20.0 – 17.3 – 17.3 – 17.3
20.0 – 16.2 3.8 20.0 – 20.0
50.0 – 50.0 – 50.0 – 50.0
15.0 – 6.2 – 6.2 – 6.2
92.0 – 81.5 – 81.5 – 81.5
20.0 – 17.5 – 17.5 – 17.5
16.5 13.0 9.5 – 9.5 – 9.5
75.0 50.0 60.3 – 60.3 – 60.3
– – 7.1 – 7.1 0.1 7.2
34.7 – 20.0 – 20.0 – 20.0
– – – 10.0 10.0 – 10.0
30.0 14.0 70.0 – 70.0 – 70.0
85.0 – 70.0 – 70.0 0.2 70.2
12.5 – 12.5 – 12.5 – 12.5
– – – – – 24.9 24.9
806.5 41.2 847.7 36.4 884.1
2.4 – 0.0 – 0.0 – 0.0
9.2 – 4.3 3.2 7.5 – 7.5
0.4 – 0.1 – 0.1 – 0.1
1.0 – – 1.0 1.0 – 1.0
4.9 – 3.0 0.9 3.9 – 3.9
1.3 – 1.3 – 1.3 – 1.3
8.6 5.1 13.7 – 13.7

p178
INVESTMENT PORTFOLIO Company Listing
Region Country UJV* Company Name Sector
Fiscal Year in which
Commitments Were Made
EUROPE & CENTRAL ASIA
Central Asia Region Aureos Central Asia Fund LLC Collective Investment Vehicles
FY08
Central Asia Region Central Asia Small Enterprise Fund LLC Collective Investment Vehicles
FY03
Central Asia Region MFI Facility – Central Asia Finance & Insurance FY03
Central Europe Region Emerging Europe Convergence Fund II, L.P. Collective Investment Vehicles
FY06
Eastern Europe Region Advent Central and Eastern Europe II L.P. Collective Investment Vehicles
FY98
Eastern Europe Region Advent Central and Eastern Europe III L.P. Collective Investment Vehicles
FY04
Eastern Europe Region CJSC Zeus Ceramica Nonmetallic Mineral Product Manufacturing
FY06
Eastern Europe Region Coopest S.A. Collective Investment Vehicles
FY07
Eastern Europe Region Emerging Europe Growth Fund II, L.P. Collective Investment Vehicles
FY09
Eastern Europe Region KG EOS Holding GmbH & Co. Finance & Insurance FY10
Eastern Europe Region Marbleton Property Fund L.P. Collective Investment Vehicles
FY06
Eastern Europe Region SEAF Central and Eastern Europe Growth Fund LLC Collective Investment Vehicles
FY01, 04
Eastern Europe Region SVD22 Electric Power FY10
Eastern Europe Region Veolia Voda S.A. Utilities FY10
Southern Europe Region 7L Capital Partners Emerging Europe L.P. Collective Investment Vehicles
FY07
Southern Europe Region ADM CEECAT Recovery Fund L.P. Collective Investment Vehicles
FY10
Southern Europe Region Advent Central Europe Management L.P. Collective Investment Vehicles
FY95
Southern Europe Region AIG Emerging Europe Infrastructure Fund L.P. Collective Investment Vehicles
FY00
Southern Europe Region Allgemeine Baugesellschaft-A. Porr A.G. Construction and Real Estate FY08
Southern Europe Region Bancroft 3, L.P. Collective Investment Vehicles
FY08
Southern Europe Region Bancroft II, L.P. Collective Investment Vehicles
FY03
Southern Europe Region Black Sea Fund L.P. Collective Investment Vehicles
FY99, 02
Southern Europe Region CEE Special Situations Fund L.P. Collective Investment Vehicles
FY10
Southern Europe Region CRG Capital LLC Finance & Insurance FY10
Southern Europe Region European Fund for Southeast Europe Finance & Insurance FY06, 07, 08
Southern Europe Region GED Eastern Fund II Collective Investment Vehicles
FY07
Southern Europe Region Green for Growth Fund Collective Investment Vehicles
FY10
Southern Europe Region Poslovni Sistem Mercator, d.d. Wholesale and Retail Trade FY07
Southern Europe Region Schwarz Group Wholesale and Retail Trade FY04, 05, 10

p179
Original Commitment1 Investment for IFC’s Account2
Total IFC(US$ Millions)
Total Syndications (US$ Millions)
Loan(US$ Millions)
Equity(US$ Millions)
Committed Portfolio Loan and Equity
(US$ Millions)
Total Guarantee and Risk Management
(US$ Millions)
Total IFC Committed Portfolio for Its
Own Account (US$ Millions)3
10.0 – – 10.0 10.0 – 10.0
2.5 – – 2.3 2.3 – 2.3
45.0 – 35.5 – 35.5 – 35.5
35.5 12.3 47.8 – 47.8
25.8 – – 23.4 23.4 – 23.4
– 23.4 23.4 – 23.4
15.0 – – 1.2 1.2 – 1.2
18.2 – – 13.3 13.3 – 13.3
9.0 – 4.9 – 4.9 – 4.9
9.5 – 8.6 – 8.6 – 8.6
20.0 – – 20.0 20.0 – 20.0
48.0 – 48.0 – 48.0 – 48.0
20.0 – – 20.0 20.0 – 20.0
3.7 – – 1.3 1.3 – 1.3
122.9 – – 122.9 122.9 – 122.9
140.3 – – 122.9 122.9 – 122.9
61.5 301.5 363.0 – 363.0
9.7 – – 10.4 10.4 – 10.4
47.6 – – 43.0 43.0 – 43.0
0.0 – – 0.0 0.0 – 0.0
30.0 – – 7.9 7.9 – 7.9
54.9 – 37.8 – 37.8 – 37.8
43.5 – – 37.5 37.5 – 37.5
19.8 – – 20.4 20.4 – 20.4
14.5 – – 0.4 0.4 – 0.4
25.9 – – 20.9 20.9 – 20.9
– – – 1.0 1.0 – 1.0
122.0 – – 120.3 120.3 – 120.3
19.1 – – 19.7 19.7 – 19.7
31.3 – 31.0 – 31.0 – 31.0
51.2 – 36.9 – 36.9 – 36.9
224.6 57.6 136.7 – 136.7 – 136.7

p180
INVESTMENT PORTFOLIO Company Listing
Region Country UJV* Company Name Sector
Fiscal Year in which
Commitments Were Made
EUROPE & CENTRAL ASIA
Southern Europe Region SEAF Trans-Balkan Fund LLC Collective Investment Vehicles
FY01
Southern Europe Region Soravia Real Estate Development GmbH Construction and Real Estate FY08
TOTAL IFC COMMITTED PORTFOLIO FOR EUROPE & CENTRAL ASIA
LATIN AMERICA & CARIBBEAN
Antigua and Barbuda American University of Antigua Limited Education Services FY10
Argentina Aceitera General Deheza S.A. Food & Beverages FY95, 02, 04, 09
Argentina Aguas Argentinas S.A. Utilities FY95, 96
Argentina Aguas Provinciales de Santa Fe S.A. Utilities FY01
Argentina ALUAR ALUMINIO ARGENTINO S.A.I.C. Primary Metals FY10
Argentina ARCOR S.A.I.C. Food & Beverages FY88, 06, 08, 09
Argentina Asociación Unión Tamberos Cooperativa Limitada (AUTCL)
Food & Beverages FY99
Argentina BACS Banco de Credito y Securitizacion, S.A. Finance & Insurance FY00, 05, 06
Argentina Banco CMF S.A. Finance & Insurance FY09
Argentina Banco de Galicia y Buenos Aires, S.A. Finance & Insurance FY97, 99, 00, 04, 05, 08, 09
Argentina Banco Itau Argentina S.A. Finance & Insurance FY09
Argentina Banco Patagonia S.A. Finance & Insurance FY07, 10
Argentina Banco Supervielle S.A. Finance & Insurance FY08
Argentina Cencosud S.A. Wholesale and Retail Trade FY09
Argentina * Chevron Argentina Oil, Gas and Mining FY92, 93
Argentina * Chevron San Jorge SRL Oil, Gas and Mining FY97, 99
Argentina Companias Asociadas Petroleras S.A. Oil, Gas and Mining FY97, 06, 10
Argentina Editorial Codex Sociedad Anonima Information FY69
Argentina Exolgan S.A. Transportation and Warehousing
FY09, 10
Argentina FV S.A. Industrial & Consumer Products
FY99, 09
Argentina Grupo ASSA Worldwide S. L. Professional, Scientifi c and Technical Services
FY09, 10
Argentina Hospital Privado Centro Medico de Cordoba S.A. Health Care FY99
Argentina Jumbo Argentina S.A. Wholesale and Retail Trade FY04
Argentina Milkaut S.A. Food & Beverages FY97, 98
Argentina Noble Argentina S.A. Transportation and Warehousing
FY06, 08, 09
Argentina Nuevo Central Argentino S.A. Transportation and Warehousing
FY93
Argentina Pampa Agribusiness Fund, L.P. Collective Investment Vehicles
FY08
Argentina Pan American Energy LLC Oil, Gas and Mining FY93, 96, 06, 08, 10
Argentina Patagonia Fund, L.P. Collective Investment Vehicles
FY98
Argentina Roberts Participaciones S.A. Collective Investment Vehicles
FY86
Argentina Roch S.A. Oil, Gas and Mining FY08

p181
Original Commitment1 Investment for IFC’s Account2
Total IFC(US$ Millions)
Total Syndications (US$ Millions)
Loan(US$ Millions)
Equity(US$ Millions)
Committed Portfolio Loan and Equity
(US$ Millions)
Total Guarantee and Risk Management
(US$ Millions)
Total IFC Committed Portfolio for Its
Own Account (US$ Millions)3
4.8 – – 0.0 0.0 – 0.0
46.4 – 20.1 15.8 35.9 – 35.9
262.5 297.4 559.9 – 559.9
6,750.1 2,231.8 8,981.9 477.7 9,459.6
30.0 – 30.0 – 30.0 – 30.0
30.0 – 30.0 – 30.0
155.0 90.0 65.0 – 65.0 – 65.0
85.0 307.5 – 6.8 6.8 – 6.8
20.0 20.5 0.0 – 0.0 – 0.0
25.0 – – 25.0 25.0 – 25.0
152.0 370.0 104.8 – 104.8 – 104.8
6.0 – 5.9 – 5.9 – 5.9
77.2 – – 12.5 12.5 – 12.5
– – – – – 4.9 4.9
170.0 245.0 68.4 – 68.4 10.3 78.7
– – – – – 0.5 0.5
30.0 – 30.0 – 30.0 0.4 30.4
– – – – – 0.4 0.4
50.0 90.0 50.0 – 50.0 – 50.0
42.0 35.0 – 27.0 27.0 – 27.0
31.4 – – 31.4 31.4 – 31.4
97.0 75.0 80.0 – 80.0 – 80.0
6.6 0.4 – 1.6 1.6 – 1.6
40.0 – 40.0 – 40.0 1.6 41.6
36.0 – 20.0 – 20.0 – 20.0
10.0 – 5.0 5.0 10.0 – 10.0
9.6 – 8.1 – 8.1 – 8.1
40.0 – – 40.0 40.0 – 40.0
20.0 5.0 14.8 5.0 19.8 – 19.8
58.0 28.0 49.0 – 49.0 – 49.0
13.0 15.0 – 0.0 0.0 – 0.0
20.0 – – 20.0 20.0 – 20.0
345.0 635.0 252.4 – 252.4 10.7 263.1
13.2 – – 3.5 3.5 – 3.5
0.1 – – 0.1 0.1 – 0.1
30.0 – 20.0 10.0 30.0 – 30.0

p182
INVESTMENT PORTFOLIO Company Listing
Region Country UJV* Company Name Sector
Fiscal Year in which
Commitments Were Made
LATIN AMERICA & CARIBBEAN
Argentina S.A. San Miguel A.G.I.C.I. y F. Agriculture and Forestry FY99, 05
Argentina SanCor Cooperativas Unidas Ltda. Food & Beverages FY95
Argentina Standard Bank Argentina S.A. Finance & Insurance FY09
Argentina Terminales Rio de la Plata S.A. Transportation and Warehousing
FY07
Argentina The Tower Fund, L.P. Collective Investment Vehicles
FY95
Argentina The Tower Investment Management Company Collective Investment Vehicles
FY95
Argentina Universidad del Salvador Education Services FY01
Argentina Vicentin S.A.I.C. Food & Beverages FY97, 03, 05
Argentina Yacylec S.A. Electric Power FY94
Barbados Caribe Hospitality of Barbados Ltd. Accommodation & Tourism Services
FY07
Belize Atlantic Bank Belize Finance & Insurance FY10
Bolivia Banco Ganadero Finance & Insurance FY10
Bolivia Banco Los Andes ProCredit Finance & Insurance FY99, 01, 03, 09
Bolivia Banco Mercantil S.A. Finance & Insurance FY96, 06
Bolivia Central Aguirre Portuaria, S.A. Transportation and Warehousing
FY92, 02
Bolivia Minproc Bolivia S.A. Oil, Gas and Mining FY92
Bolivia Sinchi Wayra S.A. Oil, Gas and Mining FY90, 94, 96, 00
Bolivia Telefonica Celular de Bolivia S.A. Information FY97, 01, 08
Bolivia Transierra S.A. Transportation and Warehousing
FY05
Bolivia Transportadora de Electricidad S.A. Electric Power FY03
Bolivia Transportes Ferroviarios S.A. Transportation and Warehousing
FY99
Bolivia Trenes Continentales S.A. Transportation and Warehousing
FY99
Brazil Amaggi Exportacao e Importacao Limitada Food & Beverages FY03, 05
Brazil Andrade Gutierrez Concessoes S.A. Utilities FY02, 07, 08
Brazil Andrade Gutierrez S.A. Construction and Real Estate FY02, 03, 08
Brazil Anhanguera Educacional Participações S.A. Education Services FY10
Brazil Apolo Tubos e Equipamentos S/A Primary Metals FY02
Brazil Armco do Brasil S.A. Primary Metals FY08
Brazil Banco ABC BRASIL S.A. Finance & Insurance FY09
Brazil Banco BBM S.A. Finance & Insurance FY06, 07, 08
Brazil Banco Brascan S.A. Finance & Insurance FY08
Brazil Banco Daycoval S.A. Finance & Insurance FY07, 08, 09, 10
Brazil Banco Fibra S.A. Finance & Insurance FY07, 08, 09
Brazil Banco Industrial do Brasil S.A. Finance & Insurance FY10
Brazil Banco Industrial e Comercial S.A. Finance & Insurance FY06, 07, 10
Brazil Banco Indusval S.A. Finance & Insurance FY06, 09

p183
Original Commitment1 Investment for IFC’s Account2
Total IFC(US$ Millions)
Total Syndications (US$ Millions)
Loan(US$ Millions)
Equity(US$ Millions)
Committed Portfolio Loan and Equity
(US$ Millions)
Total Guarantee and Risk Management
(US$ Millions)
Total IFC Committed Portfolio for Its
Own Account (US$ Millions)3
32.2 10.0 15.7 – 15.7 – 15.7
40.0 30.0 26.4 – 26.4 – 26.4
– – – – – 1.9 1.9
32.5 9.3 26.9 – 26.9 – 26.9
25.0 – – 13.5 13.5 – 13.5
0.2 – – 0.0 0.0 – 0.0
8.0 – 2.3 – 2.3 – 2.3
90.0 90.0 22.2 – 22.2 – 22.2
20.0 45.0 – 2.2 2.2 – 2.2
906.8 203.7 1,110.5 30.9 1,141.4
– – 6.5 1.5 8.1 – 8.1
6.5 1.5 8.1 – 8.1
– – – – – 0.7 0.7
– – – 0.7 0.7
– – – – – 5.3 5.3
10.0 – 2.0 – 2.0 – 2.0
10.0 – – – – 3.2 3.2
4.7 – 0.5 0.1 0.6 – 0.6
1.0 – – 0.6 0.6 – 0.6
40.6 5.0 1.3 – 1.3 – 1.3
56.7 23.3 21.4 – 21.4 – 21.4
50.0 100.0 29.9 – 29.9 – 29.9
30.0 – 15.8 – 15.8 – 15.8
– – – 4.4 4.4 – 4.4
– – – 2.9 2.9 – 2.9
70.9 8.0 78.9 8.5 87.5
60.0 – 14.3 – 14.3 – 14.3
50.7 – – 50.7 50.7 – 50.7
40.0 20.0 13.2 – 13.2 – 13.2
28.7 – 27.6 – 27.6 – 27.6
5.5 – 0.8 – 0.8 – 0.8
25.0 – 25.0 – 25.0 – 25.0
– – – – – 89.7 89.7
100.0 150.0 119.1 – 119.1 – 119.1
30.0 – 27.9 – 27.9 – 27.9
98.2 224.2 109.0 0.0 109.0 50.0 159.0
100.7 230.0 71.7 30.7 102.3 39.4 141.7
– – – – – 4.1 4.1
65.0 – 72.5 – 72.5 91.8 164.2
15.0 42.3 19.8 – 19.8 26.5 46.3

p184
INVESTMENT PORTFOLIO Company Listing
Region Country UJV* Company Name Sector
Fiscal Year in which
Commitments Were Made
LATIN AMERICA & CARIBBEAN
Brazil Banco Itau Unibanco S.A. Finance & Insurance FY88, 96, 02, 03, 04, 08, 09
Brazil Banco Itau–BBA S.A. Finance & Insurance FY01, 02, 03
Brazil Banco Pecúnia S.A. Finance & Insurance FY09
Brazil Banco Pine S.A. Finance & Insurance FY08
Brazil Banco Santander (Brasil) S.A. Finance & Insurance FY05, 08
Brazil Banco Sofi sa S.A. Finance & Insurance FY08
Brazil Banco WestLB do Brasil S.A. Finance & Insurance FY10
Brazil Black Gold Drilling LLC Oil, Gas and Mining FY08
Brazil Brookfi eld Incorporacoes S.A. Construction and Real Estate FY10
Brazil Central Geradora Termeletrica de Fortaleza Electric Power FY06
Brazil Centro de Apoio aos Pequenos Empreendimentos do Estado do Maranhao
Finance & Insurance FY10
Brazil Cimetal Siderurgia, S.A. Primary Metals FY78
Brazil CIPEF Constellation Coinvestment Fund L.P. Collective Investment Vehicles
FY10
Brazil Companhia Brasileira de Securitizacao Finance & Insurance FY05
Brazil Companhia de Tecidos Norte de Minas (Coteminas) Textiles, Apparel & Leather FY93, 98, 00
Brazil Companhia de Telecomunicacoes do Brasil Central Information FY97
Brazil Companhia Energética do Maranhão-Cemar Electric Power FY08
Brazil Cosan S.A. Industria e Comercio Agriculture and Forestry FY05, 08
Brazil CPFL Energía S.A. Electric Power FY03
Brazil CRP-Caderi Capital de Risco S.A. Collective Investment Vehicles
FY95
Brazil Dixie Toga S.A. Plastics & Rubber FY98, 05
Brazil Dynamo Puma II International Collective Investment Vehicles
FY05
Brazil Eiffel Ridge Group C.V. Oil, Gas and Mining FY08
Brazil Endesa Brasil S.A. Electric Power FY06
Brazil Ensino Superior Bureau Juridico S.A Education Services FY10
Brazil Estre Ambiental S.A. Utilities FY09
Brazil Foz do Brasil S.A. Utilities FY10
Brazil Fras-le, S.A. Industrial & Consumer Products
FY99, 07
Brazil Fundo de Educacao para o Brasil Education Services FY06
Brazil GOL Transporte Aereos S.A. Transportation and Warehousing
FY07
Brazil GP Capital Partners III, L.P. Collective Investment Vehicles
FY05
Brazil GPC Quimica S.A. Chemicals FY02
Brazil Grupo Peixoto de Castro Participaçôes S.A. Chemicals FY02
Brazil Hospital Sao Luiz Health Care FY08
Brazil Icatu Equity Partners L.P. Collective Investment Vehicles
FY98
Brazil Ideal Invest S.A. Education Services FY10
Brazil Kordsa Brasil S.A. Plastics & Rubber FY10
Brazil Latapack-Ball Embalagens Ltda. Industrial & Consumer Products
FY09
Brazil LOCAL SERVIÇOS DE TELECOMUNICAÇÕES LTDA Information FY08

p185
Original Commitment1 Investment for IFC’s Account2
Total IFC(US$ Millions)
Total Syndications (US$ Millions)
Loan(US$ Millions)
Equity(US$ Millions)
Committed Portfolio Loan and Equity
(US$ Millions)
Total Guarantee and Risk Management
(US$ Millions)
Total IFC Committed Portfolio for Its
Own Account (US$ Millions)3
219.8 250.0 76.1 – 76.1 – 76.1
102.4 60.0 5.9 – 5.9 – 5.9
20.0 – 17.3 – 17.3 – 17.3
– – – – – 45.0 45.0
324.7 – 373.0 – 373.0 – 373.0
30.0 155.0 28.9 – 28.9 8.7 37.6
– – – – – 29.0 29.0
50.0 – 50.0 – 50.0 – 50.0
47.0 – 30.0 17.0 47.0 – 47.0
62.5 67.5 47.0 – 47.0 – 47.0
1.6 – 1.7 – 1.7 – 1.7
11.4 – – 3.0 3.0 – 3.0
103.0 – – 103.0 103.0 – 103.0
3.1 – – 3.3 3.3 – 3.3
25.5 20.0 – 3.7 3.7 – 3.7
43.2 – – 13.1 13.1 – 13.1
80.0 – 68.8 – 68.8 – 68.8
73.5 – – 4.4 4.4 – 4.4
40.0 – – 7.0 7.0 – 7.0
0.8 – – 0.0 0.0 – 0.0
15.4 – – 12.2 12.2 – 12.2
20.0 – – 0.0 0.0 – 0.0
50.0 – 50.0 – 50.0 – 50.0
50.0 – – 50.0 50.0 – 50.0
35.0 – 35.0 – 35.0 – 35.0
24.4 – 26.0 – 26.0 – 26.0
50.0 – 50.0 – 50.0 – 50.0
16.7 – 10.0 – 10.0 – 10.0
12.0 – 9.4 – 9.4 – 9.4
50.0 – 29.2 – 29.2 – 29.2
15.0 – – 0.0 0.0 – 0.0
18.0 – 5.1 – 5.1 – 5.1
9.0 – 9.0 – 9.0 – 9.0
17.0 17.0 16.2 – 16.2 – 16.2
14.0 – – 12.0 12.0 – 12.0
6.7 – – 7.0 7.0 – 7.0
25.0 – 25.0 – 25.0 – 25.0
25.0 110.0 25.0 – 25.0 – 25.0
3.0 – 3.0 – 3.0 – 3.0

p186
INVESTMENT PORTFOLIO Company Listing
Region Country UJV* Company Name Sector
Fiscal Year in which
Commitments Were Made
LATIN AMERICA & CARIBBEAN
Brazil Maximilano Gaidzinski S.A. – Industria de Azulejos Eliane
Nonmetallic Mineral Product Manufacturing
FY00
Brazil Microinvest S.A. Sociedade de Credito Ao Microempreendedor
Finance & Insurance FY03
Brazil MRS Logistica S.A. Transportation and Warehousing
FY06
Brazil NBC BANK BRASIL S.A. BANCO MULTIPLO Finance & Insurance FY07
Brazil New GP Capital Partner B L.P. Collective Investment Vehicles
FY94
Brazil Pandurata Alimentos Ltda. Food & Beverages FY07, 09
Brazil Queiroz Galvao Oleo e Gas S.A. Oil, Gas and Mining FY03, 04
Brazil Randon S.A. Implementos e Participacoes Industrial & Consumer Products
FY99, 07
Brazil Sabo Industria e Comercio de Autopecas Ltda. Industrial & Consumer Products
FY08
Brazil Salutia.com, Inc. Health Care FY02, 04
Brazil SLC Agricola S.A. Agriculture and Forestry FY08
Brazil TAM LINHAS AEREAS, S.A. Transportation and Warehousing
FY06
Brazil Tecon Rio Grande S.A. Transportation and Warehousing
FY99, 04
Brazil Tecon Salvador S.A. Transportation and Warehousing
FY01, 03, 08
Brazil Tecon Suape S.A. Transportation and Warehousing
FY06
Brazil TriBanco Brazil Finance & Insurance FY05, 06, 10
Brazil USJ Acucar e Alcool S.A. Agriculture and Forestry FY08
Brazil Vale do Paraná S.A. Food & Beverages FY07
Brazil WEG S.A. Industrial & Consumer Products
FY10
Chile Bco Internacional S.A. Finance & Insurance FY10
Chile Bosques y Maderas S.A. (BOMASA) Industrial & Consumer Products
FY92, 94
Chile Central Termoelectrica Andino Electric Power FY09
Chile Chilempack S.A. Pulp & Paper FY09
Chile Curauma S.A. Transportation and Warehousing
FY99
Chile DUOC UC Education Services FY07, 10
Chile Factorline S.A Finance & Insurance FY05, 08, 09
Chile Ferrocarril del Pacífi co S.A. Transportation and Warehousing
FY97
Chile Hidroeléctrica Aconcagua S.A. Electric Power FY92, 93
Chile Hidroelectrica La Confl uencia S.A. Electric Power FY08
Chile Hidroelectrica La Higuera S.A. Electric Power FY06
Chile Hidromaule S.A. Electric Power FY07, 09
Chile Lignum Forestry Fund Collective Investment Vehicles
FY06
Chile Norvind S.A. Electric Power FY09
Chile San Vicente Terminal Internacional S.A. Transportation and Warehousing
FY04

p187
Original Commitment1 Investment for IFC’s Account2
Total IFC(US$ Millions)
Total Syndications (US$ Millions)
Loan(US$ Millions)
Equity(US$ Millions)
Committed Portfolio Loan and Equity
(US$ Millions)
Total Guarantee and Risk Management
(US$ Millions)
Total IFC Committed Portfolio for Its
Own Account (US$ Millions)3
45.0 – 22.1 – 22.1 – 22.1
0.8 – – 0.8 0.8 – 0.8
50.0 50.0 40.6 – 40.6 – 40.6
– – – – – 6.5 6.5
– – – 0.3 0.3 – 0.3
55.0 – 51.3 – 51.3 – 51.3
40.0 – 16.7 – 16.7 0.6 17.3
35.0 – 25.0 3.0 28.0 – 28.0
40.0 – 40.0 – 40.0 – 40.0
2.9 – – 2.9 2.9 – 2.9
40.0 – 40.0 – 40.0 – 40.0
29.3 – 5.7 – 5.7 – 5.7
20.0 23.8 4.1 – 4.1 – 4.1
10.3 10.5 5.3 – 5.3 – 5.3
6.0 – 3.8 – 3.8 – 3.8
25.0 – 18.3 – 18.3 1.3 19.6
40.0 – 40.0 – 40.0 – 40.0
35.0 – 33.5 – 33.5 – 33.5
25.0 – 25.0 – 25.0 – 25.0
1,863.6 324.0 2,187.6 392.6 2,580.2
– – – – – 20.0 20.0
10.3 6.0 – 4.8 4.8 – 4.8
100.0 225.0 100.0 – 100.0 – 100.0
– – – – – 0.2 0.2
2.0 – 0.9 – 0.9 – 0.9
30.0 – 29.3 – 29.3 18.5 47.8
35.0 – 15.0 15.0 30.0 – 30.0
20.5 6.0 – 5.6 5.6 – 5.6
14.5 6.0 – 1.8 1.8 – 1.8
83.0 125.0 83.0 – 83.0 – 83.0
45.0 115.0 42.9 – 42.9 – 42.9
9.7 12.0 9.1 – 9.1 – 9.1
6.5 – – 4.6 4.6 – 4.6
30.8 30.8 30.8 – 30.8 – 30.8
15.0 – 5.3 – 5.3 – 5.3

p188
INVESTMENT PORTFOLIO Company Listing
Region Country UJV* Company Name Sector
Fiscal Year in which
Commitments Were Made
LATIN AMERICA & CARIBBEAN
Chile Universidad Diego Portales Education Services FY03
Colombia Abocol Chemicals FY09
Colombia Avianca Transportation and Warehousing
FY09
Colombia Bancamia S.A. Finance & Insurance FY08, 10
Colombia Banco Caja Social S.A. – BCSC Finance & Insurance FY02, 06
Colombia Banco Davivienda S.A. Finance & Insurance FY03, 06, 07
Colombia Bogota Distrito Capital Other FY09
Colombia Cartones America S.A. Pulp & Paper FY04, 07, 09
Colombia Caruquia S.A. E.S.P. Electric Power FY09, 10
Colombia Carvajal S.A. Pulp & Paper FY05, 06
Colombia Colombia Movil S.A. E.S.P. Information FY10
Colombia Colombian Home Mortgage Corp. (CHMC) Finance & Insurance FY02, 04
Colombia Compania de Gerenciamiento de Activos Ltda. Finance & Insurance FY08
Colombia Corporacion Universitaria Minuto de Dios Education Services FY10
Colombia Covinoc S.A. Finance & Insurance FY09
Colombia Energy International Corp Electric Power FY10
Colombia Financiera Andina S.A. Finance & Insurance FY08
Colombia Forjas De Colombia, S.A. Industrial & Consumer Products
FY64, 68
Colombia Fundacion Mundo Mujer Finance & Insurance FY06, 10
Colombia Fundacion Social Finance & Insurance FY06
Colombia Fundacion WWB Colombia, Cali Finance & Insurance FY06
Colombia Giros y Finanzas Compania de Financiamiento Comercial
Finance & Insurance FY09
Colombia Greystar Resources Oil, Gas and Mining FY09
Colombia Guanaquitas S.A. E.S.P. Electric Power FY09, 10
Colombia Productos Naturales de la Sabana S.A. Alqueria Food & Beverages FY10
Colombia Promotora de Cafe de Colombia S.A. Agriculture and Forestry FY07
Colombia Proteinas Del Pacifi co, S.A. Food & Beverages FY98
Colombia Reintegra S.A.S. Finance & Insurance FY10
Colombia Riesgo e Inversiones Bolivar S.A.S Finance & Insurance FY08
Colombia Santa Marta International Terminal Company, S.A. Transportation and Warehousing
FY10
Colombia Sociedad de Acueducto, Alcantarillado y Aseo de Barranquilla S.A. E.S.P.
Utilities FY03
Colombia Sodimac Colombia S.A. Wholesale and Retail Trade FY07
Colombia Tecnoquimicas S.A. Chemicals FY08
Colombia Terminal Maritimo Muelles El Bosque S.A. Transportation and Warehousing
FY08
Colombia Termofl ores S.A. E.S.P. Electric Power FY10
Costa Rica Aureos Central America Fund, L.L.C. Collective Investment Vehicles
FY03
Costa Rica Banco Improsa S.A. Finance & Insurance FY10
Costa Rica Banco Promerica de Costa Rica, S.A. Finance & Insurance FY09, 10
Costa Rica Caribe Hospitality S.A. Accommodation & Tourism Services
FY07

p189
Original Commitment1 Investment for IFC’s Account2
Total IFC(US$ Millions)
Total Syndications (US$ Millions)
Loan(US$ Millions)
Equity(US$ Millions)
Committed Portfolio Loan and Equity
(US$ Millions)
Total Guarantee and Risk Management
(US$ Millions)
Total IFC Committed Portfolio for Its
Own Account (US$ Millions)3
– – – – – 1.6 1.6
316.1 31.8 347.9 40.3 388.2
30.0 – 30.0 – 30.0 – 30.0
50.0 – 50.0 – 50.0 – 50.0
10.0 – 3.6 13.5 17.0 – 17.0
19.7 – – 25.2 25.2 – 25.2
162.0 100.0 65.0 97.0 162.0 – 162.0
45.0 – 45.0 – 45.0 – 45.0
37.6 – 25.6 – 25.6 – 25.6
7.7 – 7.7 – 7.7 0.4 8.0
120.0 – 90.7 20.0 110.7 – 110.7
40.0 – 40.0 – 40.0 – 40.0
5.8 – – 6.3 6.3 2.9 9.2
113.0 130.0 41.8 4.4 46.2 – 46.2
8.0 – 8.2 – 8.2 – 8.2
5.0 – – 5.0 5.0 – 5.0
16.5 – 16.5 – 16.5 – 16.5
15.4 – – 15.5 15.5 – 15.5
1.3 – – 1.1 1.1 – 1.1
11.6 – 8.1 – 8.1 – 8.1
50.0 – 50.1 – 50.1 – 50.1
9.2 – 1.5 – 1.5 – 1.5
6.0 – 6.0 – 6.0 – 6.0
14.5 – – 15.2 15.2 – 15.2
7.9 – 7.9 – 7.9 0.4 8.2
20.0 – 15.0 5.0 20.0 – 20.0
20.0 – – 20.0 20.0 – 20.0
0.2 – – 0.2 0.2 – 0.2
25.0 – 36.7 11.8 48.5 – 48.5
75.0 – – 44.6 44.6 – 44.6
16.8 – 16.8 – 16.8 – 16.8
– – – – – 14.6 14.6
50.0 – 51.5 – 51.5 – 51.5
45.0 – 20.0 25.0 45.0 – 45.0
15.0 – 12.2 – 12.2 – 12.2
52.5 10.0 52.5 – 52.5 – 52.5
702.3 309.7 1,012.0 18.2 1,030.2
8.3 – – 6.9 6.9 – 6.9
20.0 – 20.0 – 20.0 – 20.0
6.0 – 6.0 – 6.0 4.8 10.8
28.0 – 12.5 2.5 15.0 – 15.0

p190
INVESTMENT PORTFOLIO Company Listing
Region Country UJV* Company Name Sector
Fiscal Year in which
Commitments Were Made
LATIN AMERICA & CARIBBEAN
Costa Rica Inversiones Hoteleras CH de Escazu S.A. Accommodation & Tourism Services
FY08
Costa Rica Maricultura, S.A. Agriculture and Forestry FY79
Costa Rica Transamerica Group Transportation and Warehousing
FY08
Dominican Republic Banco ADOPEM Finance & Insurance FY06
Dominican Republic Banco BHD S.A. Finance & Insurance FY10
Dominican Republic Banco BHD, S.A. Finance & Insurance FY03
Dominican Republic Banco Multiple Leon, S.A. Finance & Insurance FY07
Dominican Republic Caribbean Industrial Park de la Republica Dominicana S.A.
Construction and Real Estate FY04
Dominican Republic Caucedo Investments Inc. Transportation and Warehousing
FY02
Dominican Republic Centro Financiero BHD, S.A. Finance & Insurance FY08
Dominican Republic Consorcio Energetico Punta Cana–Macao S.A. Electric Power FY05, 07
Dominican Republic Corporacion Aeroportuaria del Este, S.A. Transportation and Warehousing
FY10
Dominican Republic Domicem S.A. Nonmetallic Mineral Product Manufacturing
FY04, 05
Dominican Republic Grupo M, S.A. Textiles, Apparel & Leather FY04, 10
Dominican Republic Linea Clave Internacional, S.A. Utilities FY10
Dominican Republic Occidental Hoteles Mangement S.A. (OHMSA) Accommodation & Tourism Services
FY05
Dominican Republic Red Sanitaria Hospiten Health Care FY00, 03
Dominican Republic Sans Souci Ports,S.A. Transportation and Warehousing
FY07
Ecuador Corrugadora Nacional Cransa S.A. Pulp & Paper FY09
Ecuador Favorita Fruit Company, Ltd. Agriculture and Forestry FY99, 03, 08
Ecuador Moderna Alimentos S.A. Food & Beverages FY10
Ecuador Procesadora Nacional de Alimentos C.A. – PRONACA Food & Beverages FY04, 09
El Salvador Banco Agricola S.A. Finance & Insurance FY04, 09
El Salvador Banco ProCredit S.A. Finance & Insurance FY03, 04, 09
El Salvador Metrocentro, S.A. de C.V. Wholesale and Retail Trade FY04
Grenada Bel Air Plantation Limited Accommodation & Tourism Services
FY02
Guatemala Banco GyT Continental S.A. Finance & Insurance FY09
Guatemala Banco Industrial S.A. (Guatemala) Finance & Insurance FY06, 09
Guatemala Bio Etanol S.A. Agriculture and Forestry FY09
Guatemala Comunicaciones Celulares S.A. Information FY10
Guatemala Generadora de Occidente Limitada Electric Power FY03
Guatemala Orzunil I de Electricidad, Limitada Electric Power FY98, 00
Guatemala Pantaleon Sugar Holdings Company Limited Food & Beverages FY08, 09
Guatemala Pantaleon, S.A. Food & Beverages FY97, 08, 09

p191
Original Commitment1 Investment for IFC’s Account2
Total IFC(US$ Millions)
Total Syndications (US$ Millions)
Loan(US$ Millions)
Equity(US$ Millions)
Committed Portfolio Loan and Equity
(US$ Millions)
Total Guarantee and Risk Management
(US$ Millions)
Total IFC Committed Portfolio for Its
Own Account (US$ Millions)3
– – 4.0 1.0 5.0 – 5.0
1.7 – – 0.7 0.7 – 0.7
15.0 – 15.0 – 15.0 – 15.0
57.5 11.1 68.5 4.8 73.4
1.0 – – 1.0 1.0 – 1.0
20.0 – 20.0 – 20.0 – 20.0
20.0 – 13.3 – 13.3 – 13.3
– – – – – 1.3 1.3
– – 6.0 – 6.0 – 6.0
30.0 – 17.2 – 17.2 – 17.2
33.0 – – 32.9 32.9 – 32.9
30.0 – 24.8 – 24.8 7.3 32.2
20.0 – 20.0 – 20.0 – 20.0
27.8 27.8 13.0 – 13.0 – 13.0
16.0 3.0 6.4 – 6.4 – 6.4
5.0 – 5.0 – 5.0 – 5.0
20.0 – 20.0 – 20.0 – 20.0
12.0 8.0 6.2 – 6.2 – 6.2
21.0 – 19.3 – 19.3 – 19.3
171.2 33.9 205.0 8.6 213.7
– – – – – 0.0 0.0
50.2 16.8 19.7 2.5 22.2 – 22.2
8.0 – 8.0 – 8.0 – 8.0
40.0 – 22.2 – 22.2 – 22.2
49.9 2.5 52.4 0.0 52.4
50.0 – 23.5 – 23.5 5.1 28.6
12.0 – 3.1 – 3.1 – 3.1
25.0 – 15.6 – 15.6 – 15.6
42.3 – 42.3 5.1 47.4
2.0 – 1.9 – 1.9 – 1.9
1.9 – 1.9 – 1.9
72.4 – – 72.4 72.4 15.0 87.4
30.0 – 30.0 – 30.0 2.6 32.6
6.0 – 6.0 – 6.0 – 6.0
35.0 100.0 35.0 – 35.0 – 35.0
15.0 12.0 7.6 – 7.6 – 7.6
14.3 15.0 2.5 – 2.5 0.7 3.2
50.0 – – 30.0 30.0 – 30.0
25.0 – 21.3 – 21.3 – 21.3
102.4 102.4 204.8 18.2 223.0

p192
INVESTMENT PORTFOLIO Company Listing
Region Country UJV* Company Name Sector
Fiscal Year in which
Commitments Were Made
LATIN AMERICA & CARIBBEAN
Guyana Guyana Americas Merchant Bank Finance & Insurance FY00
Guyana Guyana Goldfi elds Inc. Oil, Gas and Mining FY06, 09
Guyana Small Business Development Finance Trust Inc. Finance & Insurance FY10
Haiti E-Power S.A. Electric Power FY10
Haiti Eurasian Minerals Inc Oil, Gas and Mining FY10
Haiti Societe de Construction d’Immeubles et d’Ouvrages Publics SA
Accommodation & Tourism Services
FY10
Haiti Societe Generale Haitienne de Banque S.A. Finance & Insurance FY09
Honduras Azucarera La Grecia S.A. de C.V. Agriculture and Forestry FY09
Honduras Banco Atlantida S.A. Finance & Insurance FY09
Honduras Banco Financiera Comercial Hondurena S.A. (Banco Ficohsa)
Finance & Insurance FY08, 09
Honduras Banco Popular Covelo Finance & Insurance FY08, 10
Honduras Compania Pino Celulosa De Centro America, S.A. Pulp & Paper FY69, 70
Honduras Corporacion Dinant S.A. de C.V. Food & Beverages FY09
Honduras Digicel Honduras S.A. de C.V. Information FY09
Jamaica First Global Bank Finance & Insurance FY09
Jamaica First Jamaica Investments Limited Construction and Real Estate FY08
Jamaica Jamaica Energy Partners Electric Power FY05
Jamaica Jamaica Public Service Company Electric Power FY03
Jamaica MBJ Airports Limited Transportation and Warehousing
FY02, 06, 09
Jamaica National Commercial Bank Jamaica Finance & Insurance FY06
Mexico AES Mérida III S. de R.L. de C.V. Electric Power FY98
Mexico Agrofi nanzas SA de CV Finance & Insurance FY08
Mexico Alta Growth Capital Mexico Fund L.P. Collective Investment Vehicles
FY08
Mexico Banco Amigo, S.A. Institucion de Banca Multiple Finance & Insurance FY07
Mexico Banco del Bajio, S.A. Finance & Insurance FY06, 08, 09, 10
Mexico Banco Mercantil del Norte, S. A. Institucion de Banca Multiple
Finance & Insurance FY03, 10
Mexico Banco Monex, S.A. Institucion de Banca Multiple Finance & Insurance FY07
Mexico Baring Mexico Private Equity Fund L.P. Collective Investment Vehicles
FY96, 99
Mexico Bioparques del Occidente, S.A. de C.V. Agriculture and Forestry FY08
Mexico Carlyle Mexico partners, L.P. Collective Investment Vehicles
FY06
Mexico Celsol SA de C.V. Professional, Scientifi c and Technical Services
FY10
Mexico Combustibles Ecologicos Mexicanos, S.A. de C.V. Chemicals FY02
Mexico Concesionaria Irapuato La Piedad, S.A. de C.V. Transportation and Warehousing
FY07
Mexico Controladora de Servicios Medicos S.A. de C.V. Health Care FY05, 08, 09
Mexico Desarrollada de Proyectos de Infraestructura, S.A. de C.V.
Transportation and Warehousing
FY07

p193
Original Commitment1 Investment for IFC’s Account2
Total IFC(US$ Millions)
Total Syndications (US$ Millions)
Loan(US$ Millions)
Equity(US$ Millions)
Committed Portfolio Loan and Equity
(US$ Millions)
Total Guarantee and Risk Management
(US$ Millions)
Total IFC Committed Portfolio for Its
Own Account (US$ Millions)3
0.5 – – 0.3 0.3 – 0.3
8.8 – – 9.3 9.3 – 9.3
0.3 – 0.3 – 0.3 – 0.3
0.3 9.6 9.9 – 9.9
16.0 10.0 16.0 – 16.0 – 16.0
5.9 – – 6.0 6.0 – 6.0
7.5 – 7.5 – 7.5 – 7.5
4.0 – – 4.0 4.0 – 4.0
23.5 9.9 33.4 – 33.4
4.0 – 4.0 – 4.0 – 4.0
– – – – – 4.6 4.6
20.0 – 13.5 – 13.5 11.2 24.7
3.5 – – 3.5 3.5 – 3.5
0.1 – – 0.1 0.1 – 0.1
30.0 – 30.0 – 30.0 – 30.0
70.0 – 69.8 – 69.8 – 69.8
117.3 3.5 120.9 15.8 136.7
10.0 – – 10.0 10.0 – 10.0
17.5 – 17.5 – 17.5 – 17.5
28.0 50.0 22.5 – 22.5 – 22.5
45.0 – 27.5 – 27.5 – 27.5
45.0 45.0 37.3 – 37.3 3.3 40.5
15.0 – 8.8 – 8.8 – 8.8
113.7 10.0 123.7 3.3 126.9
30.0 74.0 19.2 – 19.2 – 19.2
2.0 – – 1.7 1.7 – 1.7
20.0 – – 20.0 20.0 – 20.0
8.8 – – 7.1 7.1 – 7.1
72.1 – – 72.5 72.5 – 72.5
241.8 – – 217.7 217.7 – 217.7
– – – – – 2.8 2.8
11.8 – – 3.8 3.8 – 3.8
12.0 – 11.6 – 11.6 – 11.6
20.0 – – 5.2 5.2 – 5.2
10.0 – 10.0 0.0 10.0 – 10.0
6.5 – 1.9 1.8 3.7 – 3.7
– – – – – 9.3 9.3
44.5 – 38.3 – 38.3 1.1 39.4
50.0 – – 50.0 50.0 – 50.0

p194
INVESTMENT PORTFOLIO Company Listing
Region Country UJV* Company Name Sector
Fiscal Year in which
Commitments Were Made
LATIN AMERICA & CARIBBEAN
Mexico Eurus S.A.P.I. de C.V. Electric Power FY10
Mexico Financiamiento Progresemos, S.A. de C.V., SOFOM ENR
Finance & Insurance FY09
Mexico Financiera Educativa de Mexico S.A. de C.V. Finance & Insurance FY05, 07
Mexico Fundidora Monterrey, S.A. Primary Metals FY62, 65, 66, 68
Mexico GMAC Financiera Finance & Insurance FY05
Mexico Grupo Calidra, S.A. de C.V. Oil, Gas and Mining FY98, 04, 08, 09
Mexico Grupo Finterra, S. A. de C. V. Sociedad Financiera de Objeto Múltiple, Entidad No Regulada
Finance & Insurance FY10
Mexico Grupo Posadas, S.A. de C.V. Accommodation & Tourism Services
FY92, 93, 95, 96, 00
Mexico Hipotecaria Su Casita, S.A. de C.V. – SOFOL Finance & Insurance FY01, 04, 05, 06
Mexico Hipotecaria Vertice, S.A. de C.V. Finance & Insurance FY08, 09
Mexico Hoteles City Express, S.A.P.I. de C.V. Accommodation & Tourism Services
FY09, 10
Mexico Leasing Operations de Mexico. S. de R.L. de C.V. Finance & Insurance FY10
Mexico Mexplus Puertos S.A. de C.V. Transportation and Warehousing
FY93, 95, 96, 99
Mexico Nexxus Capital Private Equity Fund III L.P. Collective Investment Vehicles
FY07
Mexico North American Software S.A. de C.V. Information FY09
Mexico Occidental Hotels Mexico, S.A. de C.V. Accommodation & Tourism Services
FY03
Mexico OEH Inmobiliaria, S.A. de C.V. Accommodation & Tourism Services
FY08
Mexico Pan American Silver Corporation Oil, Gas and Mining FY00, 02, 08
Mexico Paralife Holdings Ltd. Finance & Insurance FY07
Mexico Petstar S.A. de C.V. Utilities FY07
Mexico Promotora de Viviendas Integrales, S.A. de C.V. Construction and Real Estate FY08
Mexico Proteison, S.A. DE C.V. Agriculture and Forestry FY85
Mexico Puertas Finas de Madera Montealbán, S.A. de C.V. Industrial & Consumer Products
FY02
Mexico Sistema Integral de Abasto Rural S.A.P.I de C.V Wholesale and Retail Trade FY10
Mexico Solida Master Trust Construction and Real Estate FY10
Mexico Terminal Maritima de Altamira, S.A. de C.V. Transportation and Warehousing
FY97
Mexico Vuela Compania de Aviacion, S.A. de C.V. Transportation and Warehousing
FY06
Mexico ZN Mexico Capital Growth Fund Ltd. Collective Investment Vehicles
FY99
Mexico ZN Mexico II, L.P. Collective Investment Vehicles
FY99
Nicaragua Banco de America Central, S.A. Finance & Insurance FY10
Nicaragua Banco de Finanzas Finance & Insurance FY08
Nicaragua Banco de la Produccion S.A. Finance & Insurance FY09
Nicaragua Banco del Exito S.A. Finance & Insurance FY07
Nicaragua Cukra Development Corporation, S.A. Agriculture and Forestry FY09
Nicaragua Hospital Metropolitano S.A. Health Care FY08
Nicaragua Monte Rosa S.A. Food & Beverages FY08, 09

p195
Original Commitment1 Investment for IFC’s Account2
Total IFC(US$ Millions)
Total Syndications (US$ Millions)
Loan(US$ Millions)
Equity(US$ Millions)
Committed Portfolio Loan and Equity
(US$ Millions)
Total Guarantee and Risk Management
(US$ Millions)
Total IFC Committed Portfolio for Its
Own Account (US$ Millions)3
71.0 27.6 71.0 – 71.0 – 71.0
4.0 – 2.9 – 2.9 – 2.9
31.2 – 22.6 0.8 23.4 – 23.4
22.9 0.5 – 1.4 1.4 – 1.4
17.6 – 1.6 – 1.6 8.9 10.5
83.0 10.0 52.7 – 52.7 3.8 56.5
1.1 – 1.2 – 1.2 – 1.2
83.7 68.5 8.0 – 8.0 1.6 9.6
211.4 – 168.0 – 168.0 – 168.0
33.6 – 22.0 6.5 28.5 – 28.5
38.0 – 18.4 20.0 38.4 – 38.4
15.6 – – 15.5 15.5 – 15.5
4.5 – – 4.5 4.5 – 4.5
20.0 – – 20.0 20.0 – 20.0
8.0 – – 8.0 8.0 – 8.0
40.0 40.0 31.6 – 31.6 – 31.6
– – 6.1 – 6.1 – 6.1
15.2 – – 2.2 2.2 – 2.2
3.0 – – 3.0 3.0 – 3.0
13.5 11.0 12.5 – 12.5 0.4 12.9
22.6 – 10.6 10.0 20.6 – 20.6
2.8 – – 0.8 0.8 – 0.8
13.0 – 4.9 – 4.9 – 4.9
2.5 – – 2.5 2.5 – 2.5
50.0 – – 50.0 50.0 – 50.0
5.1 10.4 4.5 – 4.5 – 4.5
40.0 – 40.0 – 40.0 – 40.0
15.3 – – 0.8 0.8 – 0.8
9.6 – – 0.1 0.1 – 0.1
559.4 526.0 1,085.4 27.9 1,113.3
– – – – – 0.6 0.6
8.0 – 8.0 – 8.0 – 8.0
– – – – – 1.9 1.9
5.0 – 4.0 – 4.0 – 4.0
25.0 – 25.0 – 25.0 – 25.0
11.0 – 11.0 – 11.0 – 11.0
55.0 – 45.6 – 45.6 – 45.6
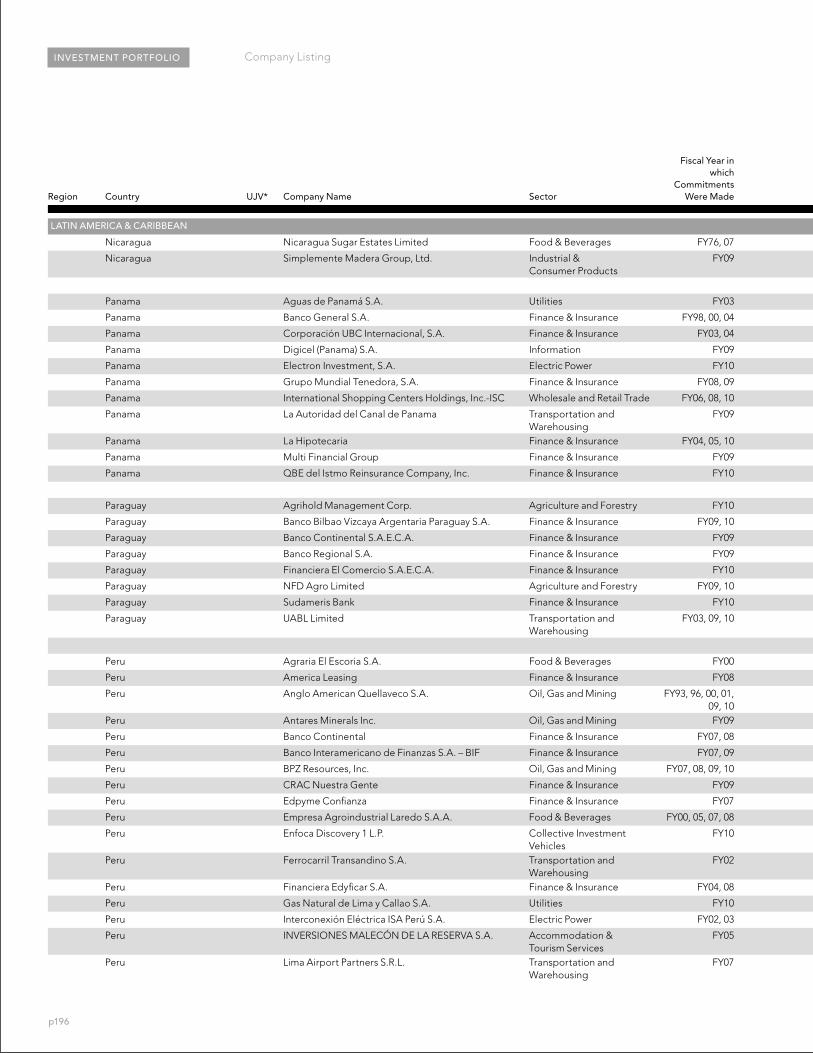
p196
INVESTMENT PORTFOLIO Company Listing
Region Country UJV* Company Name Sector
Fiscal Year in which
Commitments Were Made
LATIN AMERICA & CARIBBEAN
Nicaragua Nicaragua Sugar Estates Limited Food & Beverages FY76, 07
Nicaragua Simplemente Madera Group, Ltd. Industrial & Consumer Products
FY09
Panama Aguas de Panamá S.A. Utilities FY03
Panama Banco General S.A. Finance & Insurance FY98, 00, 04
Panama Corporación UBC Internacional, S.A. Finance & Insurance FY03, 04
Panama Digicel (Panama) S.A. Information FY09
Panama Electron Investment, S.A. Electric Power FY10
Panama Grupo Mundial Tenedora, S.A. Finance & Insurance FY08, 09
Panama International Shopping Centers Holdings, Inc.-ISC Wholesale and Retail Trade FY06, 08, 10
Panama La Autoridad del Canal de Panama Transportation and Warehousing
FY09
Panama La Hipotecaria Finance & Insurance FY04, 05, 10
Panama Multi Financial Group Finance & Insurance FY09
Panama QBE del Istmo Reinsurance Company, Inc. Finance & Insurance FY10
Paraguay Agrihold Management Corp. Agriculture and Forestry FY10
Paraguay Banco Bilbao Vizcaya Argentaria Paraguay S.A. Finance & Insurance FY09, 10
Paraguay Banco Continental S.A.E.C.A. Finance & Insurance FY09
Paraguay Banco Regional S.A. Finance & Insurance FY09
Paraguay Financiera El Comercio S.A.E.C.A. Finance & Insurance FY10
Paraguay NFD Agro Limited Agriculture and Forestry FY09, 10
Paraguay Sudameris Bank Finance & Insurance FY10
Paraguay UABL Limited Transportation and Warehousing
FY03, 09, 10
Peru Agraria El Escoria S.A. Food & Beverages FY00
Peru America Leasing Finance & Insurance FY08
Peru Anglo American Quellaveco S.A. Oil, Gas and Mining FY93, 96, 00, 01, 09, 10
Peru Antares Minerals Inc. Oil, Gas and Mining FY09
Peru Banco Continental Finance & Insurance FY07, 08
Peru Banco Interamericano de Finanzas S.A. – BIF Finance & Insurance FY07, 09
Peru BPZ Resources, Inc. Oil, Gas and Mining FY07, 08, 09, 10
Peru CRAC Nuestra Gente Finance & Insurance FY09
Peru Edpyme Confi anza Finance & Insurance FY07
Peru Empresa Agroindustrial Laredo S.A.A. Food & Beverages FY00, 05, 07, 08
Peru Enfoca Discovery 1 L.P. Collective Investment Vehicles
FY10
Peru Ferrocarril Transandino S.A. Transportation and Warehousing
FY02
Peru Financiera Edyfi car S.A. Finance & Insurance FY04, 08
Peru Gas Natural de Lima y Callao S.A. Utilities FY10
Peru Interconexión Eléctrica ISA Perú S.A. Electric Power FY02, 03
Peru INVERSIONES MALECÓN DE LA RESERVA S.A. Accommodation & Tourism Services
FY05
Peru Lima Airport Partners S.R.L. Transportation and Warehousing
FY07

p197
Original Commitment1 Investment for IFC’s Account2
Total IFC(US$ Millions)
Total Syndications (US$ Millions)
Loan(US$ Millions)
Equity(US$ Millions)
Committed Portfolio Loan and Equity
(US$ Millions)
Total Guarantee and Risk Management
(US$ Millions)
Total IFC Committed Portfolio for Its
Own Account (US$ Millions)3
25.0 11.5 18.1 – 18.1 – 18.1
10.0 – 7.0 3.0 10.0 – 10.0
118.7 3.0 121.7 2.4 124.1
6.0 10.0 1.9 – 1.9 – 1.9
40.0 – 15.0 – 15.0 – 15.0
10.3 – – 3.5 3.5 – 3.5
50.0 – 49.9 – 49.9 – 49.9
40.0 – 40.0 – 40.0 5.0 45.0
57.8 – – 42.3 42.3 – 42.3
60.0 – 48.4 – 48.4 – 48.4
300.0 – 300.0 – 300.0 – 300.0
48.5 – 45.0 3.5 48.5 – 48.5
– – – – – 25.0 25.0
19.0 – – 19.0 19.0 – 19.0
500.2 68.3 568.5 30.0 598.5
5.0 – 5.0 – 5.0 – 5.0
30.0 – 30.0 – 30.0 15.0 45.0
– – – – – 4.4 4.4
– – – – – 5.3 5.3
1.2 – – 1.2 1.2 – 1.2
13.0 – 5.3 5.0 10.3 – 10.3
– – – – – 0.1 0.1
60.0 – 60.0 – 60.0 2.9 62.9
100.3 6.2 106.5 27.7 134.2
7.0 – 7.0 – 7.0 – 7.0
10.0 – 10.0 – 10.0 – 10.0
42.9 – – 42.9 42.9 – 42.9
12.3 – – 13.7 13.7 – 13.7
88.0 190.0 75.6 – 75.6 – 75.6
18.0 – 18.0 – 18.0 – 18.0
75.9 – 24.9 51.0 75.9 – 75.9
7.1 – – 7.7 7.7 – 7.7
2.5 – 0.4 – 0.4 – 0.4
33.0 – 15.6 – 15.6 1.4 17.0
15.0 – – 15.0 15.0 – 15.0
9.0 – 3.1 – 3.1 – 3.1
4.0 – – – – 3.9 3.9
50.0 – 50.0 – 50.0 – 50.0
18.0 8.0 10.8 – 10.8 0.2 11.0
10.0 – 5.0 – 5.0 – 5.0
20.0 – – 20.0 20.0 – 20.0

p198
INVESTMENT PORTFOLIO Company Listing
Region Country UJV* Company Name Sector
Fiscal Year in which
Commitments Were Made
LATIN AMERICA & CARIBBEAN
Peru Maple Energy Plc Oil, Gas and Mining FY08
Peru Metropolitan Municipality of Lima (Municipalidad Metropolitana de Lima)
Other FY10
Peru MIBANCO, Banco de la Microempresa, S.A. Finance & Insurance FY02, 06, 07
Peru Minera Yanacocha S.A. Oil, Gas and Mining FY94, 95, 00
Peru Norvial S.A. Transportation and Warehousing
FY03
Peru Papelera del Sur S.A. Pulp & Paper FY09
Peru Peru LNG S.R.L. Oil, Gas and Mining FY08
Peru Peru Orient Express Hotel Accommodation & Tourism Services
FY01, 07
Peru Peru Rail S.A. Transportation and Warehousing
FY07
Peru Protecta Finance & Insurance FY09, 10
Peru Sociedad Agricola Drokasa S.A. Agriculture and Forestry FY00, 06
Peru Sociedad Agricola Viru S.A. Agriculture and Forestry FY08
Peru Titulizadora Peruana Sociedad Titulizadora S.A. Finance & Insurance FY07, 09, 10
Peru Universidad San Martin de Porres Education Services FY05
Saint Lucia Bank of Saint Lucia Limited Finance & Insurance FY08
Trinidad and Tobago Guardian Holdings Limited Finance & Insurance FY06
Trinidad and Tobago Republic Bank Limited Finance & Insurance FY02, 03, 06
Trinidad and Tobago SEAF Caribbean Growth Fund Collective Investment Vehicles
FY10
Trinidad and Tobago Trinidad Cement Company Nonmetallic Mineral Product Manufacturing
FY05, 06
Trinidad and Tobago U.W.I., St. Augustine – Institute of Business Education Services FY04
Trinidad and Tobago Unicell Paper Mills Caribbean Ltd. (UPMCL) Pulp & Paper FY02, 10
Uruguay Cooperativa Nacional de Productores de Leche Food & Beverages FY03, 07
Uruguay Milagro S.A.–San Miguel Uruguay S.A. Agriculture and Forestry FY09
Uruguay Nuevo Banco Comercial S.A. Finance & Insurance FY07
Uruguay UPM S.A. Pulp & Paper FY07
Venezuela Metanol de Oriente, Metor, S.A. Chemicals FY93, 07
Venezuela Minera Loma de Niquel, C.A. Oil, Gas and Mining FY98, 00
Venezuela Sistema Electrónico de Transacciones C.A. (SET) Finance & Insurance FY96, 00
Central America Region Central American Mezzanine Infrastructure Fund L.P. Collective Investment Vehicles
FY09
Central America Region Grupo Financiero CrediQ Corp. Finance & Insurance FY07
Central America Region Grupo M Holding S.A. Wholesale and Retail Trade FY08
Central America Region Grupo Solid Guatemala, S.A. Chemicals FY10
Central America Region Hospiteum Corporation Accommodation & Tourism Services
FY10
Latin America Region Advent Latin American Private Equity Fund III-E Limited Partnership
Collective Investment Vehicles
FY06

p199
Original Commitment1 Investment for IFC’s Account2
Total IFC(US$ Millions)
Total Syndications (US$ Millions)
Loan(US$ Millions)
Equity(US$ Millions)
Committed Portfolio Loan and Equity
(US$ Millions)
Total Guarantee and Risk Management
(US$ Millions)
Total IFC Committed Portfolio for Its
Own Account (US$ Millions)3
10.0 – – 4.0 4.0 – 4.0
– – – – – 31.9 31.9
46.0 40.0 38.2 7.0 45.2 – 45.2
32.7 59.0 – 0.3 0.3 – 0.3
18.0 – 14.8 – 14.8 – 14.8
– – – – – 0.7 0.7
300.0 – 300.0 – 300.0 – 300.0
19.0 – 16.9 – 16.9 – 16.9
8.0 – 8.0 – 8.0 – 8.0
1.4 – – 1.4 1.4 – 1.4
21.0 – 8.2 – 8.2 – 8.2
12.0 – 11.4 – 11.4 – 11.4
1.0 – – 1.0 1.0 0.3 1.3
– – – – – 1.5 1.5
617.9 164.0 781.9 39.8 821.6
15.0 – – – – 3.3 3.3
– – – 3.3 3.3
50.0 – 50.0 – 50.0 – 50.0
64.0 – 21.4 – 21.4 – 21.4
10.0 – – 10.0 10.0 – 10.0
35.0 – 29.4 – 29.4 6.2 35.6
5.0 – 3.3 – 3.3 – 3.3
9.0 – 9.9 – 9.9 1.5 11.4
114.0 10.0 124.0 7.7 131.7
60.0 – 20.3 – 20.3 – 20.3
10.0 – 9.6 – 9.6 – 9.6
– – – – – 0.2 0.2
70.0 100.0 62.2 – 62.2 – 62.2
92.1 – 92.1 0.2 92.3
87.9 93.3 48.6 1.4 50.0 – 50.0
75.2 50.0 – 4.4 4.4 – 4.4
0.5 – – 0.5 0.5 – 0.5
48.6 6.3 55.0 – 55.0
37.2 – 31.5 5.7 37.2 – 37.2
20.0 – 14.4 – 14.4 – 14.4
30.0 – 30.0 – 30.0 – 30.0
10.0 – 10.0 – 10.0 – 10.0
14.0 – 14.0 – 14.0 – 14.0
99.9 5.7 105.6 – 105.6
20.0 – – 18.5 18.5 – 18.5

p200
INVESTMENT PORTFOLIO Company Listing
Region Country UJV* Company Name Sector
Fiscal Year in which
Commitments Were Made
LATIN AMERICA & CARIBBEAN
Latin America Region Advent Latin American Private Equity Fund II-B Limited Partnership
Collective Investment Vehicles
FY02
Latin America Region Aureos Latin America Fund L.P. Collective Investment Vehicles
FY08
Latin America Region Convergence Communications, Inc. Information FY00, 01, 02
Latin America Region Darby Latin America Private Equity Fund, L.P. Collective Investment Vehicles
FY03
Latin America Region DineroMail Inc. Information FY09
Latin America Region DLJ South American Partners L.P. Collective Investment Vehicles
FY07
Latin America Region GeoPark Holdings Limited Oil, Gas and Mining FY06, 08, 09, 10
Latin America Region Ignia Fund I, L.P. Collective Investment Vehicles
FY10
Latin America Region Inter–American Infrastructure Finance Corporation Finance & Insurance FY08
Latin America Region Latin American Agribusiness Development Corporation S.A.
Finance & Insurance FY02, 06, 09
Latin America Region Latin Power I L.D.C. Collective Investment Vehicles
FY93
Latin America Region Latin Power II L.D.C. Collective Investment Vehicles
FY98
Latin America Region Paladin Realty Latin America Investors II, L.P. Collective Investment Vehicles
FY06
Latin America Region PriceSmart, Inc. Wholesale and Retail Trade FY01, 02
Latin America Region Proa II Fondo de Inversion Collective Investment Vehicles
FY05
Latin America Region Savoy International Investment Ltd. Primary Metals FY98
Latin America Region Solidus Finance & Insurance FY06, 08
Latin America Region The Latin America Enterprise Fund II, L.P. Collective Investment Vehicles
FY98
Latin America Region Tribeca Partners S.A. Collective Investment Vehicles
FY08
Latin America Region Yellowpepper Holding Corp Information FY10
TOTAL IFC COMMITTED PORTFOLIO FOR LATIN AMERICA & CARIBBEAN
MIDDLE EAST AND NORTH AFRICA
Afghanistan ACOMET Family Hospital Health Care FY09
Afghanistan Afghanistan International Bank CJSC Finance & Insurance FY09
Afghanistan Areeba Afghanistan Limited Information FY06, 09, 10
Afghanistan BRAC BANK Afghanistan Finance & Insurance FY07, 08
Afghanistan First Microfi nance Bank of Afghanistan Finance & Insurance FY04, 06, 08
Afghanistan Tourism Promotion Services (Afghanistan) Ltd. Accommodation & Tourism Services
FY04
Algeria Arab Banking Corporation Algeria Finance & Insurance FY98, 02
Algeria Arab Leasing Corporation Finance & Insurance FY02
Algeria ASEC Algeria Cement Company Nonmetallic Mineral Product Manufacturing
FY09
Algeria Banque Méditerranéenne d’Investissement et de Crédit S.p.A
Finance & Insurance FY08
Algeria Maghreb Leasing Algerie S.p.A. Finance & Insurance FY07, 09, 10

p201
Original Commitment1 Investment for IFC’s Account2
Total IFC(US$ Millions)
Total Syndications (US$ Millions)
Loan(US$ Millions)
Equity(US$ Millions)
Committed Portfolio Loan and Equity
(US$ Millions)
Total Guarantee and Risk Management
(US$ Millions)
Total IFC Committed Portfolio for Its
Own Account (US$ Millions)3
15.0 – – 3.8 3.8 – 3.8
20.0 – – 19.8 19.8 – 19.8
7.1 – – 7.1 7.1 – 7.1
10.0 – – 10.0 10.0 – 10.0
5.0 – – 5.0 5.0 – 5.0
20.0 – – 20.0 20.0 – 20.0
35.4 – 14.0 15.4 29.4 – 29.4
10.0 – – 10.0 10.0 – 10.0
29.9 48.5 20.0 9.9 29.9 – 29.9
69.7 – 46.5 3.2 49.7 – 49.7
25.0 – – 0.0 0.0 – 0.0
7.0 – – 0.0 0.0 – 0.0
15.0 – – 15.0 15.0 – 15.0
42.0 – – 2.3 2.3 – 2.3
5.5 – – 5.5 5.5 – 5.5
– – – 0.0 0.0 – 0.0
3.0 – – 2.4 2.4 0.3 2.7
10.7 – – 0.0 0.0 – 0.0
15.0 – – 15.0 15.0 – 15.0
3.0 – – 3.0 3.0 – 3.0
80.5 166.0 246.5 0.3 246.8
6,907.8 2,017.2 8,924.9 686.3 9,611.2
4.5 – 4.5 – 4.5 – 4.5
– – – – – 1.0 1.0
81.4 – 65.0 16.4 81.4 – 81.4
1.4 – – 1.4 1.4 – 1.4
1.0 – – 1.0 1.0 – 1.0
7.0 – 6.7 – 6.7 – 6.7
76.2 18.8 95.0 1.0 95.9
1.9 – – 1.9 1.9 – 1.9
0.7 – – 0.7 0.7 – 0.7
50.0 – 26.0 24.0 50.0 – 50.0
15.4 – – 13.4 13.4 – 13.4
4.5 – – 5.0 5.0 11.3 16.3
26.0 45.0 71.0 11.3 82.3

p202
INVESTMENT PORTFOLIO Company Listing
Region Country UJV* Company Name Sector
Fiscal Year in which
Commitments Were Made
MIDDLE EAST AND NORTH AFRICA
Egypt African Export-Import Bank Finance & Insurance FY10
Egypt Ahli United Bank (Egypt) S.A.E. Finance & Insurance FY07, 10
Egypt Al-Amir for Sanitary Ware Production, S.A.E. Nonmetallic Mineral Product Manufacturing
FY02
Egypt Alexandria Fiber Co., S.A.E. Chemicals FY04
Egypt Alexandria Portland Cement Company Nonmetallic Mineral Product Manufacturing
FY10
Egypt Bank of Alexandria Finance & Insurance FY09
Egypt Beltone Egypt Sub-Fund Collective Investment Vehicles
FY09
Egypt Commercial International Bank S.A.E. Finance & Insurance FY94, 01, 06
Egypt Credit Agricole Egypt Finance & Insurance FY09
Egypt DP World Sokhna Transportation and Warehousing
FY04
Egypt EFG Hermes Holding S.A.E. Finance & Insurance FY01, 06, 10
Egypt Egypt Factors Finance & Insurance FY05
Egypt Egyptian Mortgage Refi nance Company Finance & Insurance FY07
Egypt Egyptian Saudi Healthcare Company Health Care FY07
Egypt Gippsland Limited Oil, Gas and Mining FY06
Egypt Interstate Paper Industries S.A.E. Pulp & Paper FY07, 09
Egypt IPR Transoil Corporation Oil, Gas and Mining FY07
Egypt Ismailia Fish Farming Company, S.A.E. Agriculture and Forestry FY80, 83
Egypt Kuwait Energy Company KSCC Oil, Gas and Mining FY10
Egypt Lecico Egypt (S.A.E.) Nonmetallic Mineral Product Manufacturing
FY04
Egypt Magrabi Hospitals & Centers Egypt Health Care FY08
Egypt * Meleiha Oil Development and Exploration Project Oil, Gas and Mining FY87, 88, 93
Egypt MENA Joint Investment Fund S.C.A, SICAV-SIF Collective Investment Vehicles
FY10
Egypt New Al–Salama Hospital Co. Health Care FY08
Egypt Nile Suez Spinning and Weaving Textiles, Apparel & Leather FY08
Egypt Orient Investment Properties Limited Chemicals FY10
Egypt ORIX Leasing Finance & Insurance FY97, 02, 06
Egypt Sekem Holdings Chemicals FY03
Egypt Sphinx Turnaround Fund S.C.A. Collective Investment Vehicles
FY09
Egypt The Sixth of October Hospital for Cardio Thoracic and Vascular Surgery “Dar El Fouad”, S.A.E.
Health Care FY07
Egypt Unipak Nile Limited Pulp & Paper FY98, 01
Egypt Wadi Holdings Agriculture and Forestry FY05, 08, 10
Iran, Islamic Republic of Karafarin Bank Finance & Insurance FY05
Iran, Islamic Republic of Rak Ceramics Joint Stock Company Nonmetallic Mineral Product Manufacturing
FY04
Iraq Credit Bank of Iraq S.A. Finance & Insurance FY05, 07, 09
Jordan Airport International Group P.S.C. Transportation and Warehousing
FY08
Jordan Bank of Jordan Ltd. Finance & Insurance FY08

p203
Original Commitment1 Investment for IFC’s Account2
Total IFC(US$ Millions)
Total Syndications (US$ Millions)
Loan(US$ Millions)
Equity(US$ Millions)
Committed Portfolio Loan and Equity
(US$ Millions)
Total Guarantee and Risk Management
(US$ Millions)
Total IFC Committed Portfolio for Its
Own Account (US$ Millions)3
50.0 – 50.0 – 50.0 – 50.0
40.0 – – 48.5 48.5 2.7 51.3
5.0 – 0.9 – 0.9 – 0.9
8.0 – 4.5 – 4.5 – 4.5
120.3 – – 98.3 98.3 – 98.3
196.7 – – 196.7 196.7 – 196.7
10.0 – – 10.0 10.0 – 10.0
38.9 – – 11.8 11.8 – 11.8
– – – – – 15.6 15.6
20.0 – 10.6 – 10.6 – 10.6
55.0 – 6.0 20.0 26.0 – 26.0
3.0 – – 3.0 3.0 – 3.0
3.5 – – 3.5 3.5 – 3.5
17.0 – 17.0 – 17.0 – 17.0
4.3 – – 2.9 2.9 – 2.9
31.6 – 30.8 – 30.8 – 30.8
25.0 – 11.5 – 11.5 – 11.5
2.2 – 1.9 0.5 2.4 – 2.4
50.0 – 50.0 – 50.0 – 50.0
9.8 – 3.3 – 3.3 – 3.3
– – 15.0 – 15.0 – 15.0
28.0 – – 0.0 0.0 – 0.0
25.0 – – 25.0 25.0 – 25.0
15.0 – 15.0 – 15.0 – 15.0
20.0 – 20.0 – 20.0 – 20.0
120.0 – – 120.0 120.0 – 120.0
7.9 – 2.0 0.9 2.9 – 2.9
5.0 – 0.4 – 0.4 – 0.4
11.5 – – 11.5 11.5 – 11.5
4.0 – – 4.0 4.0 – 4.0
8.0 – 0.6 – 0.6 – 0.6
52.5 – 45.0 – 45.0 – 45.0
284.5 556.5 841.0 18.3 859.3
10.0 – 9.2 – 9.2 – 9.2
7.0 – 2.5 – 2.5 – 2.5
11.7 – 11.7 – 11.7
6.2 – – 6.2 6.2 – 6.2
– 6.2 6.2 – 6.2
120.0 160.0 120.0 – 120.0 38.3 158.3
– – – – – 4.0 4.0

p204
INVESTMENT PORTFOLIO Company Listing
Region Country UJV* Company Name Sector
Fiscal Year in which
Commitments Were Made
MIDDLE EAST AND NORTH AFRICA
Jordan Cairo Amman Bank Finance & Insurance FY00, 01, 03, 08
Jordan Capital Bank of Jordan Finance & Insurance FY07, 08
Jordan CTI Group Inc. Transportation and Warehousing
FY06, 09
Jordan Hikma Pharmaceuticals Plc Chemicals FY91, 95
Jordan International Luggage Manufacturing Company Textiles, Apparel & Leather FY01
Jordan Jordan Phosphate Mines Co. (JPMC) Chemicals FY10
Jordan Kingdom Electricity Company P.S.C. Electric Power FY09
Jordan Middle East Regional Development Enterprise Nonmetallic Mineral Product Manufacturing
FY02
Jordan Modern Agricultural Investment Company Transportation and Warehousing
FY99
Jordan Nuqul Group Pulp & Paper FY05, 10
Jordan Tamweelcom Finance & Insurance FY10
Jordan Zara Investment Holding Company Limited Accommodation & Tourism Services
FY97, 08, 10
Lebanon ADMIC, S.A.L. Wholesale and Retail Trade FY07
Lebanon Bank of Beirut Finance & Insurance FY06, 07, 10
Lebanon Banque Libano-Francaise Finance & Insurance FY06
Lebanon BLC bank S.A.L. Finance & Insurance FY10
Lebanon BLOM Bank S.A.L. Finance & Insurance FY93, 07
Lebanon Butec Holdings Construction and Real Estate FY08
Lebanon Byblos Bank S.A.L. Finance & Insurance FY93, 97, 01, 03, 10
Lebanon Credit Libanais S.A.L. Finance & Insurance FY08
Lebanon Fransabank S.A.L. (Fransabank) Finance & Insurance FY93, 94, 97, 01, 07
Lebanon Malia Invest Limited Accommodation & Tourism Services
FY10
Lebanon SABIS International School – Adma Education Services FY05
Morocco AlterMed Maghreb Collective Investment Vehicles
FY08
Morocco Association Al Amana pour la Promotion des Microentreprises
Finance & Insurance FY07
Morocco Banque Marocaine du Commerce Exterieur Finance & Insurance FY01, 08
Morocco FONDEP MicroCredit Finance & Insurance FY06
Morocco Jaida S.A. Finance & Insurance FY08
Morocco Kasbah Resources Limited Oil, Gas and Mining FY10
Morocco Maghreb Management Limited Collective Investment Vehicles
FY00
Morocco Maghreb Private Equity Fund Limited Collective Investment Vehicles
FY00
Morocco Mixta Africa, S.A. Construction and Real Estate FY08
Morocco Settat Filature S.A. Textiles, Apparel & Leather FY88, 93
Morocco Ynna Holding Nonmetallic Mineral Product Manufacturing
FY09

p205
Original Commitment1 Investment for IFC’s Account2
Total IFC(US$ Millions)
Total Syndications (US$ Millions)
Loan(US$ Millions)
Equity(US$ Millions)
Committed Portfolio Loan and Equity
(US$ Millions)
Total Guarantee and Risk Management
(US$ Millions)
Total IFC Committed Portfolio for Its
Own Account (US$ Millions)3
– – – – – 5.0 5.0
50.0 – 20.0 30.0 50.0 4.7 54.7
31.0 – 25.0 – 25.0 – 25.0
– – – 0.9 0.9 – 0.9
8.0 – 7.2 – 7.2 – 7.2
50.0 60.0 50.0 – 50.0 – 50.0
40.0 – 39.1 – 39.1 – 39.1
5.0 – – 0.6 0.6 – 0.6
1.0 – – 1.0 1.0 – 1.0
55.0 – 48.0 – 48.0 – 48.0
3.0 – 3.0 – 3.0 – 3.0
59.8 – 41.8 3.1 44.9 – 44.9
354.1 35.5 389.6 52.0 441.6
16.5 – – 6.5 6.5 – 6.5
– – – – – 32.6 32.6
– – – – – 10.6 10.6
– – – – – 0.1 0.1
33.6 1.8 21.0 – 21.0 – 21.0
15.0 – – 15.0 15.0 – 15.0
138.8 40.2 – 100.0 100.0 – 100.0
11.5 – 9.2 – 9.2 7.5 16.7
25.7 15.4 6.5 – 6.5 7.7 14.1
14.0 – 14.0 – 14.0 – 14.0
6.0 – 2.8 – 2.8 – 2.8
53.5 121.5 175.0 58.5 233.5
7.4 – – 6.3 6.3 – 6.3
5.0 – 3.5 – 3.5 13.0 16.5
105.3 – 86.0 – 86.0 – 86.0
– – – – – 2.3 2.3
– – – – – 18.9 18.9
2.2 – – 2.1 2.1 – 2.1
0.0 – – 0.0 0.0 – 0.0
5.0 – – 0.9 0.9 – 0.9
35.8 – 4.6 25.2 29.7 – 29.7
4.4 – 3.3 1.2 4.5 – 4.5
27.2 – – 25.7 25.7 – 25.7
97.4 61.4 158.8 34.3 193.1

p206
INVESTMENT PORTFOLIO Company Listing
Region Country UJV* Company Name Sector
Fiscal Year in which
Commitments Were Made
MIDDLE EAST AND NORTH AFRICA
Oman Ahli Bank S.A.O.G. Finance & Insurance FY05
Oman BANK MUSCAT (S.A.O.G.) Finance & Insurance FY06
Oman Mazoon Petrogas S.A.O.C. Oil, Gas and Mining FY05
Oman Oman Orix Leasing Company S.A.O.G. Finance & Insurance FY93, 99, 06, 07
Oman Taageer Finance Company Finance & Insurance FY05
Pakistan Allied Bank Limited Finance & Insurance FY09
Pakistan Bank Al Habib Limited Finance & Insurance FY09
Pakistan Bank Alfalah Limited Finance & Insurance FY08
Pakistan Crescent Bahuman Limited Textiles, Apparel & Leather FY94, 97, 02
Pakistan Engro Chemicals Pakistan Limited Chemicals FY10
Pakistan Engro Energy (Pvt.) Limited Electric Power FY08
Pakistan Engro Polymer & Chemicals Ltd. Chemicals FY98, 07, 10
Pakistan First MicroFinanceBank Limited Finance & Insurance FY02
Pakistan Habib Bank Limited (HBL) Finance & Insurance FY06, 08, 09
Pakistan Habib Metropolitan Bank Ltd. Finance & Insurance FY06
Pakistan International Industries Ltd. Primary Metals FY08
Pakistan Jahangir Siddiqui Private Equity Fund I Collective Investment Vehicles
FY07
Pakistan JS Investments Limited Collective Investment Vehicles
FY95
Pakistan JS Large Cap. Fund Collective Investment Vehicles
FY05
Pakistan Karachi Electric Supply Company Limited Electric Power FY07
Pakistan Kashf Microfi nance Bank Finance & Insurance FY08
Pakistan Kohinoor Energy Limited Electric Power FY95
Pakistan Laraib Energy Ltd. Electric Power FY10
Pakistan MCB Bank Limited Finance & Insurance FY93, 01, 08
Pakistan Meezan Bank Limited Finance & Insurance FY08
Pakistan ORIX Leasing Pakistan Limited Finance & Insurance FY94, 06
Pakistan Packages Limited Pulp & Paper FY65, 80, 82, 87, 88, 92, 94, 95,
05, 07, 09Pakistan Pakistan International Container Terminal Transportation and
WarehousingFY03, 08
Pakistan Qasim International Container Terminal Transportation and Warehousing
FY10
Pakistan Sarah Textiles Textiles, Apparel & Leather FY93, 96, 02
Pakistan SilkBank Limited Finance & Insurance FY08, 09, 10
Pakistan Soneri Bank Limited Finance & Insurance FY03, 07
Pakistan Tameer Microfi nance Bank Ltd. Finance & Insurance FY06, 08
Pakistan Tourism Promotion Services Ltd (Pakistan) Accommodation & Tourism Services
FY07
Pakistan TRG Pakistan II Limited Information FY04, 07
Pakistan Uch Power Limited Electric Power FY96
Pakistan United Bank Limited Finance & Insurance FY09

p207
Original Commitment1 Investment for IFC’s Account2
Total IFC(US$ Millions)
Total Syndications (US$ Millions)
Loan(US$ Millions)
Equity(US$ Millions)
Committed Portfolio Loan and Equity
(US$ Millions)
Total Guarantee and Risk Management
(US$ Millions)
Total IFC Committed Portfolio for Its
Own Account (US$ Millions)3
39.8 – – 37.5 37.5 – 37.5
100.0 – 100.0 – 100.0 – 100.0
15.0 – 6.2 – 6.2 – 6.2
13.4 – 4.8 – 4.8 – 4.8
10.0 – 4.0 – 4.0 – 4.0
115.0 37.5 152.5 – 152.5
– – – – – 6.9 6.9
– – – – – 20.2 20.2
– – – – – 5.1 5.1
23.3 11.5 1.0 5.1 6.1 – 6.1
50.0 – 50.0 – 50.0 – 50.0
59.7 – 56.9 2.8 59.7 – 59.7
60.5 30.0 28.0 22.5 50.5 – 50.5
2.7 – – 2.7 2.7 – 2.7
50.0 – 50.0 – 50.0 12.2 62.2
– – – – – 13.3 13.3
18.4 – 18.4 – 18.4 – 18.4
20.0 – – 20.0 20.0 – 20.0
0.3 – – 0.3 0.3 – 0.3
5.0 – – 5.0 5.0 – 5.0
125.0 – 125.0 – 125.0 – 125.0
2.3 – – 2.0 2.0 – 2.0
31.3 36.6 – 6.3 6.3 – 6.3
35.0 – 35.0 – 35.0 – 35.0
7.5 – – – – 11.3 11.3
– – – – – 9.0 9.0
29.5 3.3 12.8 – 12.8 – 12.8
126.6 20.1 – 51.8 51.8 – 51.8
19.3 – 21.9 – 21.9 – 21.9
30.0 – 30.0 – 30.0 – 30.0
7.8 – 1.1 – 1.1 – 1.1
75.8 – – 75.9 75.9 3.6 79.5
– – – – – 4.5 4.5
4.8 – 3.7 1.1 4.8 – 4.8
16.0 – – 16.0 16.0 – 16.0
7.5 – – 7.5 7.5 – 7.5
35.0 60.0 (0.0) – (0.0) 11.2 11.2
– – – – – 1.3 1.3
433.9 218.9 652.8 98.7 751.5

p208
INVESTMENT PORTFOLIO Company Listing
Region Country UJV* Company Name Sector
Fiscal Year in which
Commitments Were Made
MIDDLE EAST AND NORTH AFRICA
Saudi Arabia AlAhli Takaful Company Finance & Insurance FY06
Saudi Arabia Riyad Bank Finance & Insurance FY10
Saudi Arabia Saudi British Bank Finance & Insurance FY05
Saudi Arabia Saudi Home Loans Company Finance & Insurance FY07
Saudi Arabia Saudi Orix Leasing Company (S.O.L.C.) Finance & Insurance FY00, 03, 05, 07, 10
Syrian Arab Republic Bank of Syria and Overseas Finance & Insurance FY02, 04, 10
Syrian Arab Republic First Microfi nance Institution Syria Finance & Insurance FY09
Tunisia AlterMed APEF Collective Investment Vehicles
FY08
Tunisia Banque Internationale Arabe de Tunisie Finance & Insurance FY98, 00, 01, 04
Tunisia ENDA Inter-Arabe Finance & Insurance FY08
Tunisia Fuba Printed Circuits Tunisie S.A. Industrial & Consumer Products
FY08
Tunisia Société Miniere de Bougrine (SMB) Oil, Gas and Mining FY92, 94
Tunisia Société des Industries Textiles Reunis, S.A. Textiles, Apparel & Leather FY88
Tunisia Société Monastirienne Internationale Des Textiles Textiles, Apparel & Leather FY91
Tunisia TAV Tunisie S.A. Transportation and Warehousing
FY08, 09
Tunisia Topic S.A. Oil, Gas and Mining FY09
Tunisia Tuninvest International Limited Collective Investment Vehicles
FY98
United Arab Emirates Emirates National Securitization Corporation Finance & Insurance FY08
West Bank and Gaza Alrafah Microfi nance Bank Finance & Insurance FY08
West Bank and Gaza AMAL Finance & Insurance FY10
West Bank and Gaza Arab Concrete Products Company Nonmetallic Mineral Product Manufacturing
FY98
West Bank and Gaza Bank of Palestine Finance & Insurance FY08, 09
West Bank and Gaza Jericho Motels Company Ltd. Accommodation & Tourism Services
FY99
West Bank and Gaza Nabahin Industry and Trading Company Plastics & Rubber FY98
West Bank and Gaza Palestine Industrial Estates Development and Management Company
Construction and Real Estate FY98
West Bank and Gaza Palestine Mortgage and Housing Corporation Limited
Finance & Insurance FY99
West Bank and Gaza Wataniya Palestine Mobile Telecommunication Company
Information FY09
Yemen, Republic of Aden Company for Silos and Mills Food & Beverages FY99
Yemen, Republic of Al-Ahlia Mineral Water Company Food & Beverages FY03
Yemen, Republic of Al-Mawarid Company for Educational and Health Services
Health Care FY08
Yemen, Republic of Arabian Yemen Cement Company Nonmetallic Mineral Product Manufacturing
FY07
Yemen, Republic of Magrabi Hospitals & Centers Yemen Health Care FY08

p209
Original Commitment1 Investment for IFC’s Account2
Total IFC(US$ Millions)
Total Syndications (US$ Millions)
Loan(US$ Millions)
Equity(US$ Millions)
Committed Portfolio Loan and Equity
(US$ Millions)
Total Guarantee and Risk Management
(US$ Millions)
Total IFC Committed Portfolio for Its
Own Account (US$ Millions)3
3.5 – – 3.5 3.5 – 3.5
– – – – – 30.0 30.0
50.0 – 50.0 – 50.0 – 50.0
26.7 – – 26.7 26.7 – 26.7
25.3 – 29.9 – 29.9 – 29.9
79.9 30.2 110.1 30.0 140.1
6.1 – – 5.7 5.7 – 5.7
3.5 – – 3.5 3.5 – 3.5
– 9.2 9.2 – 9.2
8.8 – – 7.5 7.5 – 7.5
57.6 – 35.7 – 35.7 – 35.7
2.7 – 2.2 – 2.2 – 2.2
12.6 – – 10.1 10.1 – 10.1
17.0 – – 2.3 2.3 – 2.3
1.7 – – 2.1 2.1 – 2.1
5.6 – 3.9 1.9 5.9 – 5.9
213.3 281.2 127.8 40.4 168.2 – 168.2
17.0 – – 17.0 17.0 – 17.0
4.7 – – 0.0 0.0 – 0.0
169.6 81.3 251.0 – 251.0
20.0 – 10.4 – 10.4 – 10.4
10.4 – 10.4 – 10.4
– – – – – 1.9 1.9
– – – – – 75.4 75.4
0.8 – 0.8 – 0.8 – 0.8
12.5 – – 12.5 12.5 18.5 31.0
1.2 – 0.6 – 0.6 – 0.6
0.5 – 0.5 – 0.5 – 0.5
2.0 – 0.3 1.0 1.3 – 1.3
3.0 – – 3.0 3.0 – 3.0
30.0 – 30.0 – 30.0 – 30.0
32.2 16.5 48.7 95.8 144.5
8.0 – 1.4 – 1.4 – 1.4
1.5 – 1.4 – 1.4 – 1.4
8.0 – 8.0 – 8.0 – 8.0
70.0 55.0 68.5 – 68.5 – 68.5
10.0 – 10.0 – 10.0 – 10.0

p210
INVESTMENT PORTFOLIO Company Listing
Region Country UJV* Company Name Sector
Fiscal Year in which
Commitments Were Made
MIDDLE EAST AND NORTH AFRICA
Yemen, Republic of Marib Agriculture Company, Y.S.C. Agriculture and Forestry FY87
Yemen, Republic of National Cement Company Nonmetallic Mineral Product Manufacturing
FY06
Yemen, Republic of Saudi Yemeni Healthcare Co. Health Care FY07
Yemen, Republic of Yemen Battery Manufacturing Company, Y.S.C. Industrial & Consumer Products
FY84, 85
MENA Region Ahli United Bank BSC Finance & Insurance FY07, 08
MENA Region Arabian Andalusia Holding Company Health Care FY08
MENA Region Argan Infrastructure Fund, LLC, PCC Collective Investment Vehicles
FY10
MENA Region Bait Al Batterjee Medical Co. Health Care FY09
MENA Region Capital North Africa Venture Fund Collective Investment Vehicles
FY08
MENA Region City Group Company K.S.C. Transportation and Warehousing
FY10
MENA Region Creative Energy Resources Electric Power FY09
MENA Region FIMBank P.L.C. Finance & Insurance FY05, 07
MENA Region First Education Holding B.S.C. (c) Education Services FY09
MENA Region Foursan Capital Partners I Collective Investment Vehicles
FY08
MENA Region Gulf Agency Company Ltd. Transportation and Warehousing
FY10
MENA Region Intaj Capital II L.P. Collective Investment Vehicles
FY10
MENA Region Maghreb Private Equity Fund II Collective Investment Vehicles
FY06
MENA Region Magrabi Hospitals & Centers, Ltd. Health Care FY08
MENA Region Metito Holdings Limited Utilities FY08
MENA Region Metito Utilities Limited Utilities FY10
MENA Region Shefa CEIC Limited Collective Investment Vehicles
FY07
MENA Region Zulekha Healthcare Holding Limited Health Care FY10
TOTAL IFC COMMITTED PORTFOLIO FOR MIDDLE EAST AND NORTH AFRICA
GLOBAL
Global Projects Access Microfi nance Holding AG Finance & Insurance FY07
Global Projects ACCION Investments in Microfi nance, SPC Finance & Insurance FY03, 08
Global Projects Altima One World Agriculture Development Fund Limited
Collective Investment Vehicles
FY09
Global Projects Baku–Tiblisi–Ceyhan Pipeline Oil, Gas and Mining FY04
Global Projects Capital International Private Equity Fund IV, L.P. Collective Investment Vehicles
FY04
Global Projects CHF Development Finance International, LLC Finance & Insurance FY10
Global Projects CITIBANK, N.A. Finance & Insurance FY09
Global Projects Commerzbank A.G. Finance & Insurance FY10
Global Projects ECOM Agroindustrial Corp. Ltd. Agriculture and Forestry FY06, 08, 10
Global Projects Emerging Market Secondaries Fund Collective Investment Vehicles
FY10
Global Projects GEM VII Targeted Value Income Fund Collective Investment Vehicles
FY05

p211
Original Commitment1 Investment for IFC’s Account2
Total IFC(US$ Millions)
Total Syndications (US$ Millions)
Loan(US$ Millions)
Equity(US$ Millions)
Committed Portfolio Loan and Equity
(US$ Millions)
Total Guarantee and Risk Management
(US$ Millions)
Total IFC Committed Portfolio for Its
Own Account (US$ Millions)3
2.8 – 2.4 0.3 2.7 – 2.7
35.0 – 35.0 – 35.0 – 35.0
20.0 – 17.9 – 17.9 – 17.9
4.0 0.4 3.3 0.5 3.8 – 3.8
147.8 0.9 148.6 – 148.6
216.3 – 200.0 16.3 216.3 – 216.3
10.0 – – 10.0 10.0 – 10.0
11.7 – – 9.8 9.8 – 9.8
55.0 – 25.0 30.0 55.0 – 55.0
6.7 – – 6.9 6.9 – 6.9
30.0 – 30.0 – 30.0 – 30.0
6.0 – – 6.0 6.0 – 6.0
10.0 – 6.0 6.9 12.9 2.3 15.2
22.0 – 14.0 8.0 22.0 – 22.0
20.0 – – 20.0 20.0 – 20.0
35.0 – 35.0 – 35.0 – 35.0
20.0 – – 20.0 20.0 – 20.0
17.6 – – 20.3 20.3 – 20.3
20.0 – – 20.0 20.0 – 20.0
31.1 – 20.0 11.1 31.1 – 31.1
20.0 – – 20.0 20.0 – 20.0
15.0 – – 15.0 15.0 – 15.0
24.0 – 24.0 – 24.0 – 24.0
354.0 220.3 574.3 2.3 576.6
2,246.2 1,459.6 3,705.8 402.1 4,107.9
4.3 – – 4.9 4.9 – 4.9
5.3 – – 5.2 5.2 – 5.2
75.0 – – 75.0 75.0 – 75.0
125.0 125.0 81.8 – 81.8 – 81.8
30.0 – – 12.6 12.6 – 12.6
1.5 – – 1.5 1.5 – 1.5
100.0 – 100.0 – 100.0 – 100.0
125.0 – 125.0 – 125.0 – 125.0
104.0 – 74.3 – 74.3 – 74.3
25.0 – – 25.0 25.0 – 25.0
30.0 – – 0.0 0.0 – 0.0

p212
INVESTMENT PORTFOLIO Company Listing
Region Country UJV* Company Name Sector
Fiscal Year in which
Commitments Were Made
GLOBAL
Global Projects Global Microfi nance Facility Finance & Insurance FY04, 07
Global Projects IFC Capitalization (Equity) Fund, G.P. Collective Investment Vehicles
FY10
Global Projects IFC Capitalization (Equity) Fund, L.P. Collective Investment Vehicles
FY09
Global Projects IFC Capitalization (Subordinated Debt) Fund, G.P. Collective Investment Vehicles
FY10
Global Projects IFC Capitalization (Subordinated Debt) Fund, L.P. Collective Investment Vehicles
FY09
Global Projects IFC Founder Partner – IFC African, Latin America & Caribean Fund, L.P.
Collective Investment Vehicles
FY10
Global Projects InfraVentures Electric Power FY08, 09, 10
Global Projects Italcementi S.p.A. Nonmetallic Mineral Product Manufacturing
FY07
Global Projects JPMorgan Chase Bank, N.A. Finance & Insurance FY10
Global Projects Leapfrog Financial Inclusion Fund Collective Investment Vehicles
FY10
Global Projects Lydian International Ltd Oil, Gas and Mining FY08, 09, 10
Global Projects Marco Polo Network Finance & Insurance FY07
Global Projects Melrose Resources plc. Oil, Gas and Mining FY05, 07, 08
Global Projects MicroCred SA Finance & Insurance FY06
Global Projects Microfi nance Enhancement Facility Finance & Insurance FY09, 10
Global Projects Microvest Capital Management LLC Collective Investment Vehicles
FY09
Global Projects Novica United, Inc. Information FY03
Global Projects ProCredit Holding Finance & Insurance FY01, 02, 03, 06, 09, 10
Global Projects Rabobank Nederland Agriculture and Forestry FY09
Global Projects Rural Impulse Fund II S.A., SICAV–SIF Collective Investment Vehicles
FY10
Global Projects Rural Impulse Fund S.A., SICAV–FIS Collective Investment Vehicles
FY08, 10
Global Projects ShoreCap II Limited Collective Investment Vehicles
FY10
Global Projects ShoreCap International Collective Investment Vehicles
FY04
Global Projects Standard Chartered Bank Finance & Insurance FY09, 10
Global Projects Tecnomen Lifetree Corporation Information FY09
Global Projects Voxiva, Inc. Information FY08
Global Projects WaterHealth International Utilities FY10
TOTAL IFC COMMITTED PORTFOLIO FOR GLOBAL
TOTAL IFC COMMITTED PORTFOLIO FOR ITS OWN ACCOUNT
TOTAL FOR IFC (NET OF WRITE–OFF AND OTHER ADJUSTMENTS)
In this table, “Loan” fi eld includes loan-type quasi-equity investments; and the “Equity” fi eld includes equity-type quasi-equity investments.
1. Commitments include funds to be provided by IFC for its own account, funds to be provided by participants through the purchase of an interest in IFC’s investment, and funds to be provided by other fi nancial institutions in association with IFC, where IFC has rendered material assistance in mobilizing these funds. Original commitments are composed of disbursed and undisbursed balances. The undisbursed portion is revalued at current exchange rate, while the disbursed portion represents the cost of the commitment at the time of disbursement. Loans held for IFC are revalued at the current exchange rates. Amounts shown are for commitments outstanding at June 30, 2010, net of cancellations.
2. Investments held for IFC comprise the sum of the disbursed and outstanding balance together and the undisbursed balance of signed commitments, net of cancellations and before write-off and other adjustments.
3. The total IFC portfolio for its own account is composed of loan, equity, guarantee, and risk management products held for IFC’s own account (includes write-off and other adjustments).

p213
Original Commitment1 Investment for IFC’s Account2
Total IFC(US$ Millions)
Total Syndications (US$ Millions)
Loan(US$ Millions)
Equity(US$ Millions)
Committed Portfolio Loan and Equity
(US$ Millions)
Total Guarantee and Risk Management
(US$ Millions)
Total IFC Committed Portfolio for Its
Own Account (US$ Millions)3
4.0 – 20.0 2.5 22.5 4.8 27.3
0.0 – – 0.0 0.0 – 0.0
195.3 – – 195.3 195.3 – 195.3
0.0 – – 0.0 0.0 – 0.0
9.9 – – 9.9 9.9 – 9.9
14.0 – – 14.0 14.0 – 14.0
22.5 – 22.4 – 22.4 – 22.4
200.0 – 120.0 80.0 200.0 – 200.0
100.0 – 100.0 – 100.0 – 100.0
20.0 – – 20.0 20.0 – 20.0
4.2 – – 6.4 6.4 – 6.4
2.5 – – 2.5 2.5 – 2.5
125.0 – 93.8 – 93.8 1.2 95.0
2.8 – – 2.9 2.9 – 2.9
150.0 – 150.0 – 150.0 10.0 160.0
10.0 – – 10.0 10.0 – 10.0
1.5 – – 1.5 1.5 – 1.5
79.1 – 40.7 32.7 73.4 – 73.4
150.0 – 150.0 – 150.0 – 150.0
– – – 12.3 12.3 – 12.3
17.3 – 4.0 – 4.0 – 4.0
– – – 10.0 10.0 – 10.0
2.5 – – 2.1 2.1 – 2.1
150.0 – 150.0 – 150.0 51.0 201.0
– – – 19.8 19.8 – 19.8
5.0 – – 5.0 5.0 – 5.0
5.0 – – 5.0 5.0 – 5.0
1,232.1 556.2 1,788.3 67.0 1,855.2
1,232.1 556.2 1,788.3 67.0 1,855.2
26,369.4 10,347.9 36,717.3 2,973.2 39,690.5
35,891.1 2,973.2 38,864.2
* Projects marked with an asterisk (*): IFC’s investments in unincorporated oil and gas joint ventures (UJVs) are accounted for under the cost recovery method, as more fully described in Note A to the Corporation’s FY10 consolidated fi nancial statements. For the UJVs, investments held for IFC comprise the sum of the inception to date cash disbursements, net of cash receipts (until cost is recovered) plus the undisbursed balance of signed commitments, net of cancellations.
Notes
“0.0” means less than $50,000.
The operational investments are represented by loans and equity, as stated. In addition, in certain investments, IFC has the right to acquire shares and/or participate in the profi ts of the enterprise.
Certain investments reported as loan or equity with debt-like features have been separately reported as debt securities on IFC’s consolidated balance sheet.

p214
INVESTMENT PORTFOLIO
NOTES AND DEFINITIONS
The fi scal year at IFC runs from July 1 to June 30. Thus FY10 began on July 1, 2009, and ended on June 30, 2010. Investment amounts are given in U.S. dollars unless otherwise specifi ed. On-lending is the process of lending funds from IFC’s own sources through intermediaries, such as local banks and microfi nance institutions.
Loan participants and IFC fully share the commercial credit risks of projects but, because IFC is the lender of record, participants receive the same tax and country risk benefi ts that IFC derives from its special status as a multilateral fi nancial institution.
Quasi-equity instruments incorporate both loan and equity features, which are designed to provide varying degrees of risk/return trade-offs that lie between those of straight loan and equity investments.
Rounding of numbers may cause totals to differ from the sum of individual fi gures in some tables.
The World Bank includes the International Bank of Reconstruction and Development and the International Development Association. The World Bank Group includes IBRD, IDA, IFC, the Multilateral Investment Guarantee Agency, and the International Centre for Settlement of Investment Disputes.


Cert no. SW-COC-002370
creating opportunity where it’s needed most
2121 Pennsylvania Avenue, NWWashington, DC 20433 USA
(202) 473-3800
www.IFC.org