ifdt t a, - unt digital library
TRANSCRIPT

SOKE CHASACTE&XSTXCS OF COLLEGE IttESiiaW ACOOaDXHG TO SEX
m & SfHUIC GiOUF AMD THE EEIATI«iSHXF OF THESE
CHAE&CTERISTICS TO ACADEMIC ACHIEVEMENT
APPROVED:
G r a d u a t e Coaimt t tee : i r o l t t e e : j
ifdt ^ J / r ^-«r^eei_
M a j o r P r o f e s s o r ^ '
t a , d & t m i t t m ' Member
„ - . . . . . . . , n m ® / 0 f j t h « s c h o o l o f E d u c a t i o n
Dean © i f f e a i ' G r a d u a t e S c h o o l ":iV

SOME CHARACTERISTICS OF COLLEGE FStESHKEM ACCORDING TO SEX
AND ETHNIC CROUP AND THE RELATIONSHIP OF THESE
CHASACTERISTieS TO ACADEMIC ACHIEVEBEST
DISSERTATION
Presented to the Graduate Council of the
North Texas State University in Partial
Fulfiii»ent of the Requirements
For the Degree ©f
DOCTOR OF EDUCATION
Wy
George E« Vaughan, H, A.
Kiagsville, Texas
August, 1963

TABLE OF CONTENTS
LIST OF TABLES . . ,
Chapter
I. INTRODUCTION
Statement of Problem Hypotheses Definitions of tmms Basle Assumptions Limitation* of Study Significance of Study
IX. RELATED LITERATURE 13
Ethnic Studies Scholastic Aptitude Personality Studies falues Summary
III# PROCEDURE* . . • . 33
Subjects Instruments Used Methods of Collecting Data Organization and Treatment of Data
XV, ANALYSIS AND DISCUSSION OF RESULTS 47
Analysis of Data Discussion of Results
V. SUMMARY, CONCLUSIONS, AND RECOMMENDATIONS. . 70
Susnaxy Conclusions Recommendation s
APPENDIX 7 7
BIBLIOGRAPHY
iii

\ \
LIST Of TABLES
Tafein Page
I * Nmh and Standard Deviation fo r Grade-Point Avtra|« and Score* on th«
— — ^ S T b y S i a B J e c t s I n mm, ___ aad stfiole Subgroup 48
I I . Sun of S<tuara», Degrees o f FrMdrn. Varianaa Batiaata^ Fellatio j and Lcv t l o f S i g n l f i * c«nc« f o r Seoraa on eh* i aSd&a . SftUttK ESSE* § t « • « « « * * • i t * i # i • # # « SO
I I I . Sua ©f Squaraa, Degree* o f Fraedoa, Varianaa Estimate, F - I a t i o , a id Laval o f S i a i i f i . c ^ c a j o r Scores on H a m U M M S m m , e n
— I m s E * » • . 32 IV. Sua of Squares, degrees o f Fveadon. Variance
Ectiaate, F -R i t l o , and Laval o f S l g o l f i . eamoe for Scores on the Inventory of Be l la f * 7 * * 7 . 55
V. Correlations Between Grade-Point Average and Scores on tha American College Test. The
m K « c p Level o£ Stp i i f lcanee t o r W e t i s and Sthnie Group* . * . , . . .
V I . S ign i f icant Correlations Between Crade-Point Average and soma Seoraa on tha American Col late Toot. Tha l * - 1 ' * - - J **•*- - -Miliar,WMBi JMBiHIi* BlMfi Temperament Survev„ _ _
and Etfaale Grouti. Chi 59
•J) ana ex
*o*p. . . . * 57
IL I t l l M t J V sax and Ethnic l l roup d i i i fuara, and Laval o f Signiflaanea .
V I I * Sua of Squares, Degrees of Fraadosu Varianea E i t b a t t , F-Retio, and Laval of S i g n i f i -cance fo r Grade-Point Averages o f four Sax and Ethnic Subgroups. . . . . . . . . . . 61
i v

CHAPTER I
XKTHODUCTIOK
Higher education hat been Challenged by its critics and
by the world situation to do m increasingly better Job of
educating American youth. One approach to th« problem of
Improving higher education has emphaslzed am analysts of the
college curriculuai; another approach Is concerned with m
analysis of college students. Ultimately, these approaches
would both appear to be necessary if a comprehensive study
is to result in realistic improvements In the quality of the
product of higher education*
Beginning with a curriculum analysis night eventually
result in an attempt to mold college students to fit some
"ideal** curriculum. Since students entering c o l l e g e are
relatively difficult to ehange, the approach of studying the
students to determine their abilities, their temperaments,
end their values would appear to be more realistic. Such
studies could be followed by revision in curriculum and In
teaching methods and techniques, developing those which are
more realistic in terms of the characteristics of entering
students, or by revised techniques for the selection of
students.
I

Knowledge of the characteristics of the student popula-
tion is also basic to adequate personnel services. Student
eomMltng sad other studant personnel services have been
given increasing at t ant ion as parts of tha total educational
experience of collaga students. An understanding of tha char*
acteristies of tha studsnt population in any institution would
greatly facilitata this aspaet of tha educational program.
Numerous studies hava baan made and are in progress which at*
tempt to determine students' abilities in various dimensions.
Fewer studies have investigated other characteristics of stu-
dents, such as temperament and values (4). The present study
was an investigation of the scholastic aptitude, temperament
traits, and belief In traditional values of freshman students
at Texas College of Arts and Industries, Kiagsville, Texas.
Statsaient of Problem
The purpose of the present study was to determine if
differences exist between selected groups of male and female
Anglo -American and Latin-American students with respect to
•choU.Uc aptitude as aMsurad by the tytrtm, Call.*. I«»t.
temperament traits as measured by JJ|& GuiIford-Zimmerman
Temperament Survey. and beliefs in traditional values as
measured by the mtMMM ii Beliefs. A further purpose of
the study was to determine if a relationship exists between
any of these measures and academic achievement as measured by
grade-point averages of college freshmen in the four sex and
ethnic groups.

An i n v e s t i g a t i o n ©I several eub-problens was A«o«tMxy. theee
I n c l u d e d j
1# To detexitiae If d l f f i rm t tM l a staadard «cor«» on the
&a>erlcaa Goilege f a s t « r t re lated to ethalo gimip and sexj
2* To If differences l a m i w m « oa the tea
t r a i t s c a l e s o f The Gu i l ford-Z immerman Temperament Sa»«ar
• ro related to ethalc group and m ;
3. to detesnlae i f dlffereaeea l a raw scores «m the
Inventory gf. j f U f f t i n r«Ue»d to • t t n t e gxoop <mi »«•,
4 . To l«t«ndA« tho relat ionship between scores oa the
American C a l l — T e s t s a d a c a d e m i c a c h i e v e m e n t aft m e a s u r e d
by grade-point t v m g f t i f o r each of tho four sex aad othale
groups;
5. To detemlae tho relat ionship between each t r a i t score
o a J H , Gul l£ar4~ZlmmGmm Temoeratoent S u r v e y a a d a c a d e m i c
achievement a« measured by grade<»polat averages fo r each of
tho four a oa aad othale group* i and
6. To determiae tho rela t ion ship between aooroa oa tho
I n v e n t o r ? $£, Ballofa aad academic achievement aa measured by
grade-point averages fo r oaoh of tho four aox aad othalo groups.
Hypotheses
The following hypotheses were Investigated by s t a t l s t l e a l
aaalysls i
1 . There wi l l be ao s lga l f l caa t d i f f e r e n c e b e t w e e n the
e t h n i c groups with respect to s t a a d a r d seores ©a the A m e r l c a a

Collage Test. Differences between males and females will ®ot
very significantly from one ethnic group to .another;
2. there will he no significant difference between the
ethnic groups with respect to rew scores on the ten trait
scales of Jfe, S»£XftZ.« Biffer-
ences between sales and females will not very significantly
from one ethnic group to the other;
3. There will be no significant difference between the
ethnic groups with respect to raw scores on the fafflB&UBT tl
Beliefs*. Differences between stale® and females will not vary
significantly from one ethnic group to another;
4. There will be a positive relationship between each
score on the three instruments (American College Test. The
Qui 1 ford-Ziigaeggtaii Temperament Survey, and Inventory of
Beliefs) and academic achievement as measured by grade-point
averages for each of the four sex and ethnic groups; and
3. For those variables for which Hypothesis IV is sus-
tained^ there will be no significant difference among the
four sex and ethnic groups.
Definitions of Texas
For purposes of the present study, the following defini-
tions of terms were used;
I. Latin. "Latin" is an abbreviation for nLatin*A*eriean,n
a term commonly used to designate individuals of Mexican or
Spanish extraction residing in the United States.

2. Anglo* "Anglo" la a popular abbreviation for the
fees*, "Augio^American," cotnmon iy used to designate all other
individuals residing in the Halted States* ,
3* 4fif.« The abbrcvlttlra, ACT, was used in the present
study to refer to the BMSSt
G-2TS, the abbreviation, G-ZTS, was used to refer to
The Qui Ifo rd-^tmmerman temperament Survey.
5* |J|» The abbreviation, II, urns meed In reference to
«** impart, a£ itMMa* 6» te<l«ilf Achievement. Grade-point average for the
first semester has been need as the measure of academic
achleveMnt for the freshman students used an subjects for
this study•
7, Ethnic group, AII ethnic group 1® a group of people,
often a speech or language group, who are racially or his*
torically related, and who have a eas®Km and distinctive
culture (2, p» 413), The ethnic groups referred to la the
present study are latins and Anglos as previously defined,
Basle Assumptions
Certain basic assumptions were necessary In order to
canry out the Investigation* These Includedt
I* Grade-point average is an adequate index of academic
achievement; and

2, The use of surname and information provided on the
per tome I data theet (see Appendix) Is m Adequate eriterion
for classifying subjects as Angloa and latins.
Limitations of Stiady
the results of the present study are necessarily limited
in application tot
1. College freshmen who are similar in cultural back*
ground to those at Texas College of Arts and Industries; and
2. College freshmen majoring in the areas of Arts and
Sciences, Business Administration, and Teacher Education•
Significance of Study
the goals of higher education can he approached only by
looking at the methods and techniques needed to change the
raw material in the direction of what is desired. Hot only
is this a problem for higher education In gsneral, it is also
the problem for each institution of higher education as it
looks at the incoming students with respect to experiences
which are needed by these students te result in the desired
products. Each institution is in need of knowledge regarding
the homogeneity or heterogeneity of its students to determine
If a variety of curricula, teaching techniques, and services
is necessary to fill these students* needs.
Some schools select their students In such a way as to
Insure a greater degree of homogeneity than is present la

7
other college populations, minimising the need for variety in
tin oorrioulua* Other institutions, howeverf suoh a® the
state-supported colleges and universities, do a minimum of
screening and thereby increase the livelihood of heterogeneity
among students. ?et, these institutions tend to provide simi-
lar experiences and services for all students, despite the
possibility of eonsidsratole heterogeneity in the student popu*
' lation.
feasas College of Arts and Industries is a state-supported
college with a total enrollment of slightly sore than 5,300
students* It ia looatod in lingsvills, S n M t in the upper
edge of the Rio ®rande Talley area, 3)he freitaan student
population consists of approximately 21 per cent Latin students,
the college draw® heavily from an area in which tooth aoeul*
turation and assimilation are in process.
Although not widely substantiated by empirioai studies
of differenoes between these two particular ethnio group©,
psychologists and biologists haw long thought that differ-
enoes in ethnic background and social heritage result in
unifue characteristics of ethnic groups* Such character!®-
ties are felt by many to he closely related to factors whieh
are associated with academic achievement in the school system,
therefore* it is not unusual that popularly held stereotypes
with respect to differences in scholastic aptitude, tempera-
aent, and values between Anglos and Latins exists in this
area.

8
On the other hand, Kingsville, Texas, lies la the heart
of a unique bi-cultural area in which Anglo and Latin cultures
are mimed to the extent that acculturation and assimilation
are rapidly progressing. In view of the dally influence of
each cultural heritage upon members of both ethnic group®,
differences between the group* might not be at great a® the
stereotypes suggest,
Although the social heritage of these ethnic group® may
be unique to the degree that students from these two group®
might be expected to differ significantly in scholastic apti-
tude, temperament, and values, the cultural setting in the
South Texas area raises some question as to the existence of
such differences between Anglo and Latin college students.
Heretofore, the curricula, teaching methods, student person-
nel services, etc., have been provided for students on the
basis of Insufficient evidence regarding the homogeneity or
heterogeneity of the student population with respect to the
characteristics mentioned. While an apparent assumption of
homogeneity has served as the basis for justifying a relatively
undifferentiated program of education, common stereotypes re-
garding ethnic groups, often generalized from the general
population to college students, have prevailed, implying dif-
ferences in scholastic aptitude, temperament* and values (8).
Moras which have been established elsewhere cannot accurately
be assumed to apply to these students without studies to
support assumptions of homogeneity.
If differences do exist bttvtia then two ethnic gnmpt,
educational planning should reflect these differences. If
the dlffcvflaeei do not exist, cvldtae* of this would help to
dispel beliefs that they do.
Little value would be gained for higher education from
the study of characteristics of ethnic groups unless the
characteristics studied are in some way related to academic
success (7). The present study was planned in an effort to
investigate differences in characteristics about which stereo-
type# are held cad which are also thought to be related to
academic success.
It is soatttistes thought that Anglo students are superior
to Latin students in scholastic aptitude and achievement.
Scores of scholastic aptitude on the ACT have been shown to
be positively correlated with academic success as measured by
grade~point average (I).
Several of the temperament traits measured by the G-ZTS
are related to stereotypes held about latins* For example,
Latins are thought to be slow in novement, low in drive
level, and fond of their siestas (§>• These characteristics
are related to the trait of general activity cm the C-2TS.
Latins are also described as being easily influenced, follow*
era rather than leaders, and avoiding any conspicuous role#
in situations which involve both Latins and Anglos (8). The
trait scale for ascendance includes the measure of these
qualities. High scores on the trait scales of the 6«ZTS have
10
been shown to have a small positive relationship to freshman
grade-point av«rag«® (10),
the IB differentletoi students who are immature, rigid
la outlook, authoritarian 1b interpersonal relations, and
compulsive in action* Some Latin stereotype* are quite simi-
lar to this description* For example, Latins are sometimes
described as being backward, bound by tradition, unambitious,
loyal to their own, resistant to change, and adhering to an
authority hierarchy in social and family structure <9). Some
of the variables and dimensions included In the formal struc-
ture from which the IB was developed includes (I) adherence
to out-moded ideas| (2) fatalism; (3) despair; (4) exclusive
pride in memberships5 (5) irrational acceptance of external
authority} (6) an unwillingness to assume personal responsi-
bility} and <7) resistance to departure from tradition (4,
p, 217).
Although a significant relationship between scores on
the IB and over-all grade-point average has not been found
in other college populations, high scores have been found
to be positively related to success in social science and
the humanities (4), A significantly larger number of low
than high scorers were found to have withdrawn from school
before the end of the first year (5)*
these three instruments measure characteristics about
which stereotypes are held and which show some promise of be-
ing related to academic achievement, therefore, knowledge of

11
d i f f e r e n t * b«tw««a the four sex and ethnic groups in t h i s
study should be valuable in planning curricuLum, teaching
techniques, and counseling services at Texas College of Arts
and Industries,

CHAPTER BIBLIOGRAPHY
1. American College testing Program, Chicago, Illinois, Science Research Associates^
2. Bamhard, CUsance t.» editor, The American College Pic-t ternary. Hew York, Harper and Brothers, 1953.
3. Coleman, Willian and Collett, Dorothy, "Development and Application of Structural Tests of Personality,* Review oC Sducational Eeaeareft. XXIX (1959), 57-67.
4. Dressel, Paul L» and Mayhew, Lewis 1., General Education: g p.UtKatloas In Evaluation« Washington, TT^c., Council on Education, 195^.
5* feglFjflfy'ff Itolil fSSLfibS, liinlfg &L|ilM£» Washington,
6. Heist, Paul, "The Filtering College Student - Background and. Characteristics,n Eevletr gf, Educational Research. XXX \ 1960/1 ZQ2'»&97 #
7. Proff, Fred C., "The Use of Appraisal Data by Guidance and Personnel tlorkers," iaviei? Educational ieseareh. XXX (i960), 141-147# «• -T-T r-.»f
&• Siira»ns, Oxzie a,, "Anglo-Americans and Latia-A»eriea»s in South Texas: A Study in Doniaant-Subordiaate Group Re-lations ," unpublished doctoral dissertation, Harvard University, Cambridge, Massachusetts, 1952.
9. Tuck, Ruth, west
X With The Fisti Mexican-Americans in & ., Mew York, Hareourt, Braise,' and Company,
10. tfitherspoon, Paul and Melberg, H. B.t "Relationship Between Grade-Point Average and Sectional scores Made on The
B M f t t M f : ' < f f i f M r s B i
12

CHAPTER II
&ELATEB UTCSMCUBft
4 review of this literature has revealed £ m studies con*
cerned with differences between Anglos and Latins or with the
prediction of academic achievement through the use of the in*
strura«nts under consideration in the present study, A number
of writers have presented evidence of stereotyped beliefs
concerning such ethnic differences, and meny studies have betn
wade 1» an attempt to relate scholastic aptitude, personality
•variables, and values to academic achievement.
Ethnic Studies
the present analysis of differences between Latin# and
Anglos is based upon the fact that little evidence hits been
found concerning the existence of such differences. Little
effort hat been made to document the existence ©f differences
between Latins and Anglos with respect to scholastic ability
and achievement, temperament traits, or values*
Kosa and others (11) studied psychological characteristics
of a number of ethnic groups in a college population. They ad-
ministered a battery of seven achievement and aptitude tests,
t h c tthmiiigM tia.lilffMftli, * rating
scale for self evaluation to 549 college students, These
13
14
subjects represented "old immigrant stock," including English,
Irish, German, and Dutch, end "new immigrant stock,n including
Italian, French, Spanish, Polish, and Southeast European.
Among ienaaLes, met? immigrants were significantly higher with
respect to being reserved than old immigrants* It was also
found that Italian females were mare aggressive thai Irish fe-
males. More s i g n i f i c a n t differences wire found between male
groups. New immigrant males scored higher on aptitude and
achievement tests and higher on self characterisations of ag-
gressiveness, psychologica l tensions, sociability, and emo-
t i o n a l i s m . Italian males rated themselves higher than Irish
males on each of these variables, Germans rated themselves
higher in self confidence than other groups* Mo particular
a t t e n t i o n was give® to Spanish groups as they represented some
of the smaller segments of the sample, the authors concluded
that "at least some ethnic groups can be defined as cultural
units which retain specific behavioral traits and show char-
acteristic, meaningful differences In their performances on
psychological examinationsM (II, p. 275).
This idea Is theoretically supported by social theorists,
particularly with respect to personality characteristics. It
Is generally accepted that the early experiences of the indi-
vidual exert lasting effects upon personality, with similar
experiences tending to produce similar personality configura-
tions . In any society, techniques for the care and tending
of children are culturally patterned, tending to be similar

15
within a cultural group and differing from one society to
another (4).
Fro* these postulates, Linton ha# stated that it would
tend to follow:
1, That the members of any given society will have many elements of early experience in coimon;
2, That aa a result of this they will have many elements of personality in eoiaasoa;
3, That since the early experiences of indi-viduals differ from one society to another, the personality norms for various societies will also differ (15, pp. vii-viii).
If these propositions are valid, one night expect differ*
ances between members of ethnic groups# the importance of the
resulting heterogeneity of college populations in terms of the
aims of higher education has been stressed by Heist and Webster
(5). In coopering students within and between colleges through-
out the United States, they concluded that differences did
exist between students which made a variety of services neces-
sary* They stated:
Implied in and underlying the defense of the American way is, of course, the assumption that varieties of programs and procedure* effectively accomodate the existing differences among stu-dents. This is perhaps an unwarranted assumption, and some have suggested that inadequate diversity of programs for heterogeneity of the student popu-lation is a major problem in education (5, p. 2/9).
Despite the lack of empirical evidence af differences
between Anglos and Latins, the belief that such differences
exist is widespread« Humphreys (7), in a sociological study

16
of Mexican-American youths in Detroit, found that Anglos
accepted the stereotype of a single social type of youth
in this group. He concluded, through observation of these
young people in their activities and relationships with
others, that five social types much like these of teglos
could be found among them, based on the differing degrees
and kinds of participation in the culture around them* He
stated that the social type is voided by the forces in the
social field within which the individual operates, and often
reflects the stereotypes of those with whom the individual
cones into contact (7).
Tuck (24) studied Latin-Anglo relationships in a town in
California, She found that businessmen in the town believed
that the Latin "is of an improvident disposition; lives in
the present and worries comparatively little about the future;
• • . is wasteful in every way; it is his nature to drift
where he ought to plan and economize*1 <24, p. 39)*
She found, however, that a great deal of confusion and
contradiction existed with respect to the stereotypes held.
Individuals tended to hold a number of contradictory beliefs,
accepting at any given time the one which served their pur-
poses at that time <24, p. 51).
Simmons <20) conducted an extensive sociological study
of La tin-Anglo relationships in South Texas, using a number
of Latin and Anglo informers in several towns* He found that
many people believed in the homogeneity of Latins and in

17
the ixiitiBCft of differences between Latins and Anglos, Latins
were v i m d as being a backward group and inferior to Anglos
in iviry wtyt including in intellectual capacity. Latins vara
also viewed as baing unclean, drunkards, immoral, mysterious,
unpredictable, and slow or lasy* He, too, found much contra*
diction and confusion in tha stereotyped views held by various
individuals (20)•
Tha existence of stereotypes such as thasa is vidaly ac-
eaptad by a number of writers in tha araa ef Latin-Anglo
ralationa (18, 20, 2lf 22, 23, 24). It is suggastad by some
that thasa stereotypes are hald by Anglos in an affort to
support and justify thalr subordination of tha Latin <20, 24),
Scholastic Aptltuda
A variety of instruments for measuring scholastic aptl-
tuda ara in wide usa throughout tha United States. A survay
of professional literature reveals a larga number of studias
attasipting to validate such instruments for usa in tha pre-
diction of academic achievement. Since the ACT is a rela-
tively naif Instrument, few of tha studias have been concerned
with its usa.
These efforts to validate scholastic aptltuda teats for
use in predicting academic achievement are Illustrated by a
study by Juola (9), He studied the predictive validity of
five such instruments, using scores made by 2t064 freshman
students entering Michigan State University la tha fail of
18
1956 and the fail of 1957. He administered the Scholastic
Aptitude Teat. (SAT) to 743 freshmen entering is 1956. The
8 M & H&lft COTlffiteil.al Examination (OSF) was administered
to 411 freshmen entering In 1957. The M l f t t
Xlfe (CQT) the School ® d M M m m m % tim (SCAT), and
*h« MfPfefft ftSP-Al m gCTSlgMilSil, Bxmtaatlon
(ACE) were administered to 910 freshman students entering in
1957. Academic achievement was determined through the use o£
total grade-point average, grade-point average in the basic
courses in communication skills and natural science, grades
on a fifteen-point scale for communication skills and natural
science, and grade-point average in non-basic courses.
Correlations between total grade-point average and scores
on the instruments were reported. They includedt (1) .50 for
•ales and .62 for females on the ACE; (2) .56 for males and
.68 for females on the SCAT; (3) .59 for males and .65 for
females on the CQT; (4) .63 for males and ,68 for females on
the SAT; and (5) M for males and ,65 for females on the
0SF,
Lanier (12) studied the predictive value of a number of
instalments used with the ACT program through multiple corre-
lations. He used the ACT, the fctf A & llllfftiflM t S S M m
and the New Purdue Placement Test In English, lank in
high school and twenty-five predictor variables from the
M M W R U flmsftm, »»<« th. Sailfitt Invtntorv
al * H # f U A<Hu»tMant were al«o Subjects Included

19
116 male and 139 female freshotan students in the School of
Science, Education, and Humanities at Purdue University in
September, 1961. Academic achievement was Measured through
first semester grade-point average* He found that the ACT
was the best single predictor for females tot was not effec-
tive for males. The best single predictor for males was the
ftefit Mathematics Tralnlitijt which had m predictive
value for females.
In a preliminary study at Texas College of Arts and
Industries, through the Office of Student Personnel Services,
composite scores on the ACT were correlated with first year
grade-point average (19), Subjects Included 4$8 freshman
students who continued enrollment as full-time students
throughout both semesters of the 1961-1962 school year. Cor-
relation between composite score on the ACT and first year
total grade-point average was ,56,
The technical report published by the American College
Testing Program reports that validity studies are not pres-
ently available (I), It states that the best evidence of
such validity Is reported longitudinal studies of the tests
la the National Merit Scholarship Program, It state®i
These studies are entirely relevant la that successive editions of both the HMSQT and ACT forms are constructed from common item pools, at eoarparable difficulty levels, and are presented la similar formats* Thus, the subtests in the RMSQT forms are parallel to those in the ACT bat-tery a» surely as successive ACT forms are paral-lel to each ether (I, pp» 17-18).

2©
Five studies arc reported In which scores on fell# NMSQT
were correlated with first*semester grade-point averages for
college fresfewen. In the first study* correlations found be-
tween secret on the MMSQT and grade-point average' for 346
student* at the University of Illinois in 1959 ranged from
•33 to .45 on tha subtests, with a corralation of .49 for the
composite score (1, p . 10 )»
In tha second study, correlations between standard scores
011 tha WMSQT and grade-point average for 488 freshman students
at an unnassed Catholic university in Missouri ranged fro* ,33
to .49 for the subtests. The correlation between the composite
score and grade-point average was found to be .44 (I, pp. 18-19),
the third study reported scores and grade-point averages
made by 348 freshman students in Kansas, Correlations between
•cores on the subtests of the HMSQT and grade-point average
ranged from .13 to .481 the correlation for the composite
•core was .35 (1, p, it),
fhe fourth study reported correlations between scores on
the HMSQT and grade-point average for two quarters for 244
freshsan students in North Dakota. The correlations between
grade-point average and scores on the subtests ranged £ m m
•35 to .50* The correlation between the composite score and
grade-point average was . 5 1 (1, p. 1 9 ) .
In the fifth study reported, correlations of .31 to .48
were found between scores on the subtests of the HMSQT and
grade-point average for 124 freshman students in a teachers*

21
college i*i Illinois# The correlation found for the composite
score was #59 (I, p# 10)« these studies utilised the 1958
form of the HMSQT#
The MHSQT composite score Includes « general vocabulary
test not present In the ACT. farther, the ttae lapse between
the administration of the NKSqT and the assessment of academic
achievement has generally been approximately twrnty-tm* manthB,
Most validity studies of the ACT will require waiting only
twelve months before assessing achievement# These facts "sug-
gest that the validity coefficients for the Individual ACT
subtests will be higher than those reported for Hie corres-
ponding subtests In the HMSQT" (I, p. 18).
Personality Studies
Numerous studies report positive correlations between
personality or temperament traits and academic achievement,
using a variety of instruments* For example, Centl <3) re-
ported a study of personality factors related to college sue*
cess. He administered the fcgggftftttttr
Inventory (MfPl) and the College Inventory of Academic Adjust-
ment to 64 full-time students in the 1955-195$ school year*
He randomly selected eight high and eight low stud eats fmm
the test students with the highest and lowest grade-point
averages for the first semester from each college class. Me
found that the highest ranking students tended to be better
adjusted than the lowest ranking students, with significant

22
differences between them on five MfflPI scores, support lag the
belief that personality factors are related to the level of
achievement of college students. He concluded that "if
college and university programs are to insure the optimal
development of students, they cannot ignore the influence of
personality and motional factors upon achievement* <3, p. 188).
Holland (6) studied personality characteristics, as meas*
ured by the fiallltiall, tefcligilrt, teMfffe *» their re*
lat ion ship to academic achievement • Subjects included lt32l
exceptionally talented college freshmen attending 291 colleges
in the United States. He used freshman grade® as a measure
of academic achievement. He found high achievers to be lack-
ing in capacity for status, unsociable, lacking poise, not
flexible, conscientious and controlled. Such students were
said to create favorable impressions, to do well academically
voider direction but not when independent Judgment was demanded,
to have feminine interests, and to be interested in and re*
sponsive to others, tow achievers were poised, socially
skillful, positive in their self attitudes, flexible, and
impulsive. They created less favorable impressions, had less
activation for academic achievement, and showed extraceptive
and masculine interests <6, p. 140)«
A study by Lynn (16) attempted to show that the capacity
for sustained work is dependent on high drives, defined in
tents of neurotlelsm, and on the slow accumulation of reae~
tive inhibition with continuous work, defined in terms of
23
low extraversion* Levels of neuxoticisa and extraverslon
were measured through the use of the Mauds lev
Inventory, administered to 115 male and 96 female students.
The** students were compared with two groups of mm-university
subjects including 100 males and 67 females. College and
university students scored significantly higher on neuroti-
cis® and lower on extreversion then non«»university subjects*
The author explained this finding in terms of neuroticism
having t w different effects on attainment, "a disorganizing
one on learning and performance in stress situations hut a
facilitating one in so far as it motivates sustained work.
Further, at the educational level of the university • * *
its disorganising effects semi to he more than compensated
for by its motivating powers'* (16» p« 216),
Some few studies have reported relationships between
trait scores on the G-ZTS and academic aptitude and achieve-
went* Klugh and Bendig (10) studied the relationship between
trait scores on the G-ZTS and intelligence as measured by
total score on the ACE. They administered both instruments
to 225 male undergraduate students enrolled in introductory
psychology classes at the University of Pittsburgh* They
found no curvilinear relationships between the t m instruments,
but did find significant rectilinear correlations between in*
telligence and the objectivity, friendliness, and personal
relations scores on the G»2TS,

24
Witherspoan and Melberg (2$) studied the relationship
between grade-point average and section* 1 scores on the
G-2.TS. Subjects included 229 freshman students at Arkansas
State Teachers1 College, total grade-point average® for the
first §wester were used. They reported significant corre-
lations of .16 and ,13 between grade-point average and scores
on the restraint and personal relations scales, respectively,
for all students* These correlations were found to be sig-
nificant at the *005 and ,05 levels. Correlation between
grade-point average and the masculinity score was .15 for
vale subjects, significant at the .02 level.
Bendig and Sprague (2) studied the relationship between
scores on the G-ZTS and achievement level and fluctuation in
introductory psychology classes at the University of Pittsburgh
in 1933. Subjects included 107 sales and 48 females enrolled
in introductory psychology classes. Raw scores on the trait
scales of the G-ZTS were correlated with achievement and with
fluctuation scores. Achievement was measured by the use of
letter grades assigned to each student's mean of scores on
five objective tests of fifty items each. Fluctuation was the
range between the student1 © highest and lowest scores on the
five tests. Significant correlations included: (I) recti-
linear correlations of .20 and .21 between achievement and
the restraint and objectivity scores» respectively; (2) curvi-
linear correlations of .27 and .25 between achievement and

25
the friendliness and masculinity scores, respectively; and
(3) curvilinear correlations of ,35, *27» end ,24 between
fluctuation and the ascendance, sociability, and emotional
stability scores, respectively, fhese two studies relating
C»ZTS scores and academic achievement resulted In only one
significant correlation in common, that between the restraint
score and academic achievement,
Values
Fewer studies have been reported Whieh attempt to relate
valuta of the type measured by the 11 to academic achieve-
ment, Winter (25) studied student values in their relation-
ship to grades in general psychology. He administered the
tough §*£ Scale, which measures antl-democratic and ethno-
centric values, to forty-two non-freshman college students in
general psychology classes at San Jose State College, These
subjects included twenty-four males and eighteen females.
Each student was later presented with a list of fifteen con-
cepts and asked to rank them in terms of how valuable, good,
and worthwhile each was to M m , He was also asked to predict
the rankings given to them by his professor, A discrepancy
score between the student's own ranking and his estimate of
the professor's ranking was derived for each student. Five
students with the highest and five with the lowest XQs were
eliminated from the sample, leaving only the middle of the
IQ distribution, trades in psychology were found to be

26
significantly correlated with the degree of similarity fee-
tween the values of the student and those of the teacher, and
with the degree of democratic, noa-ethnoc«aitrie values shoim
by the student,
Leimaxm (13) studied critical thinking ability, values,
and attitudes among college students in an effort to determine
whether differences existed between students attending various
types of colleges. Subjects included 300 students from three
colleges, a Congregational liberal arts college, a large state
university, and a Presbyterian liberal arts college. The IB
was used to measure stereotypic beliefs and Rokeach's Dogmatism
Scale. Form E, was used to measure dogmatism and unreceptive*
ness to new ideas, Lehmann found significant; differences
between the students at the three colleges with respect to
critical thinking ability for both sales and females. He
also found a significant difference between sales at the three
colleges with respect to stereotypy as measured by the II,
even after controlling for critical thinking ability. Mo sig»
nificant difference was found between footsies. Ho significant
difference was found for males or for females with respect to
dogmatism or traditional values.
In another study at Michigan State University, Lohaann
(14) studied the relationship between scholastic perforoance
and critical thinking, attitudes, and values. Subjects in-
cluded 2,564 students in the freshsum class at Michigan State
University during the fall term, 1958. Subjects included

11
1,352 males and 1,212 females. Scholastic performance was
measured by grades la courses In communication skills and
natural science, and by grade-point average for the first terra.
Stereotyped views were measured through the use of the II and
dogmatism was measured through the use of ftokeaeh* s Dogmatism
Scale. It was found that "different traits are measured by
the IB and the Dogmatism Scale even though they correlate *63.
It would appear that in every instance better predictions are
obtained with the IB even though both inatrumcmts are thought
to be measures of a rigidity syndrome" (14, p. 86). Findings
of the study supported the hypothesis that non«»stereotyplc
and non-donatio students would receive significantly higher
examination grades in both communication skills and natural
science. A slight but significant relationship was reported
between these measures and scholastic performance.
The significant relationship between scores on these
instruments and scholastic performance are in contrast to the
findings reported by the manual of instructions for the IS <8).
The manual reports small positive, but not significant, cor-
relations between scores on the 11 and academic achievement.
Summary
tli* above review of the literature reveals some basis for
the expectation of differences between Latins and Anglos, and
considerable evidence that stereotyped views concerning such
differences are widespread. There appears to be agreement

n between these studies with respect to Che significant rela-
tionship between academic achievement Mid such variables at
scholastic aptitude, temperament traits or personality char-
acteristics, and beliefa and values.
Some of the stadias discussed have reported correlations
between scores on the instruments used in the present study
and grade-point average. Lanier <12) reported a significant
correlation between the ACT and achievement for females, but
did mot specify the slse of the correlation• 4 correlation
of .56 between composite score and grade-point average was
reported in a preliminary study at Texas College of Arts and
Industries (19). The American College Testing Program has
reported correlations between scores on the subtests of the
8MSQT and grade-point average ranging from ,13 to ,50* Cor*
relations between composite score on the tiMSQT and academic
achievement as measured by grade-point average ranged frost
.35 to .St.
Two studies have been reported in this review which are /
concerned with the relationship between scores on the C-ZTS
and academic achievement. Wither spoon and Melberg (26)
found significant correlations of .16 and .13 between scores
on the restraint and personal relations scales, respectively,
and grade-point average. They reported a significant corre-
lation of .15 between masculinity score and grade-point
average for stales, fiendig and Spxague ( 2 ) reported slightly
higher correlations when relating scores on the trait scales

2t
of the G-ZTS to achievement in an introductory psychology
course, Correlations of ,20 and .21 were found between
achievement and score# on the restraint and objectivity
scales, respectively, iendig and Sprague (2) aleo reported
curvilinear correlations of .27 and .25 between achievement
and scores on the friendliness and masculinity scales, re-
spectively, It was noted that th« only trait scale for which
both studies reported significant relationships with achieve-
ment was the restraint scale.
the manual of Instructions for the IB (8) has reported
positive, but not significant, correlations between scores on
the li and grade-point average. Lehraaaa <14) reported a
slight, but significant, relationship between score* on the
IB and scholastic performance, but did not specify the siae
of the correlation.
These studies appear to support the need for the present
Study. They reveal some basis for the expectation of differ-
ences between latins and Anglos in areas in which stereotypes
«&*€« They also provide some evidence that variables meas-
ured by the instruments used in the present investigation
are related to academic achievement*

CHAPTER BIBLIOGFAPHY
I* American erican College Testing frogrnt ACT technical Chicago, Illinois, Science Research AisoSafes, fill#
2* Bendig, A* tf. and Sprague, J» L*, "The G»Z»T«S. at a Pre-diction of Achievement Level and Achievement Fluctuation in Introductory Pi XXXmi (Deewber, in Introductory Psychology " g£
ir, 1954), 409-413#
3* Genti, Paul, "Personality Factors Related to College Sue-cess," Journal of Educational Research, W (December,
m i J, W-m. 4# Curtis, Jack »», Social fsych^logy, Mew York, McGraw-Hill,
toe#, I960#
5» Heist, Paul and Webster, War®Id, "Differential Character* istics of Student Bodies: Implication for Selection and Study of the Undergraduate," Journal of Educational " " " "" ~1 (l " XXXIII (February, I960); 2
6. Holland, John L„, "Prediction of College Grades from the
y* imteteiAfft!> pimmm, **» ~' • •
7. Humphreys, N. D*f "The Stereotype and the Social types of Jwths," feiaBl &£ Sililtei
XXII (August, 1945), 69-78.
s. mm&k fm | M I m s f m s , el ftf&t&b Washington, D# C», /American Council on Education, 1953*
9. Juola, Arvo I#, "Predictive Validity of Five College-Level Academic Aptitude Tests at one Institution," Personnel and Guidance Journal. XXXVIII (April, I960;, 637-641#
10, Klttgh. H. ;• ***d Sendig, A, W», » Thm M M f and I n t e l l i g e n c e , " » *•* *•«* Insvinr-slcy* 19591 96<*97 *
11* Kosa, John, Rachiele, L, D., laid Schommer, C. 0., "Psy-chological Characteristics of Ethnic Croups in a College Population," Journal ff Psychology. W l (October, 1958), 26$<»27$ *
30

51
*$ ti nittF WtlTifffll Jii 11Ifawi&JLo*1 iv# V<ii of S®i#c%#4 12* W t h ^
AOf Program," Purdue University, Dissertation «g|$BSl£# 2XIII {3,f65|* nwafcer 7» 2424*
13 • IMpum» Irria J . , f ; i ? £ i 5 y ^ l f f i S S g 1 1
14. Letaann# Xrvia J.» «**• imtUiudily « ferftwUno# and Critioal fhixOdng# Attitude©, mat ?&lu©@,«
Mfcrtoook* ptiiaai" OWffiML M l ^ S E E S E ^ bti»7l§60^ S>»ff •
15, Linton, Mlfh* foreward in Itedlaer. Afcm®},tMgjwttll*-logical Frontiers of Society, lew fork* Oolv5*^ w S S f anptMf if457
16. %s»t **•'"*** Personality Characteristics tested to &ra»i 1. , "fwo tersonaiit; Acadeiaic Aofeiercssent,* 1 fJGSffiMJttf * * » (Sovemf
17» Marden, Ofcarles f.» Minorities in American $£$&£&» **w Tork, American Book uoapany, 1952.
IS* llefilliaia®, Oar ay, Pennsylvania, ?* :
19, Belatiomsliip Between ACT Composite Scores and ^restate Tear 0rade«"Point Average %y Area • of Concentration f Fall and . Spring Semesters, 1961-1962, vmfettaM_*nUotlii» Texas College cf Arte and Industries, £in«sville, feaeas, If62#
20. Siamoas, Oassi# §•» "Anglos-Americans and Mexican-Aaericane la Somtfc fexaat 1 Study in Dominant-Subordinate Group Ee!ationsf« unpublished doctoral dissertation* Department Of Education, §£r\rard fmiversity, Cambridge, l&ssacinisetts 1952.
21* Stilwell, Bart* "Siie Y/etback Tido," Caawon ground, IX (8ian«r» 1949;» 3-7»
g. ifiw^est 22, falbert, Bobert 1., SpanlsHlgg®. ?gogie I# M and feiti fort v«rtti«' »3»s # I m lainey uosipi
23. Taylor, Mill S., An Amerieaa^lexlcan o n^ eg» Chapel Hill> lorth Carolina, fniversiiyaf HoriJa (Carolina Press, 1932.
24. Tuok, Satli, lit With ^ Sgaltorest city, sew fork, iareourt, Brace, and company,

32
25. Winter*, fillissa D*. "Student Values and Grades in General Psychology." Journal of Educational .Bejwftrefe# I»? (April, 1962), m»t@r 7»"»M83., •'
26. Witkerspoon# Paul and H. S« Melkerg, "HelationeJiip Between ©rade-foint Average and Sectional Scores lad© on th@ Guilford-2imB©i»an Tenpwfgtent fwggft11 S M Eayo&ologioal Meaaarenent, XIX (IfSf)«. 675-574.
CHAPTER III
fMCMWm
The design for th« priitnt investigation was adopted
in an of tort to accomplish the objectives of the study* The
purpose of the study was to determine whether differences
exist between Latin and Anglo students with respect to scho*
lastic aptitude as measured by the ACT, temperament traits a$
measured by the G-ZTS, and beliefs in traditional values as
measured by the II* A further purpose of the study was to
determine if a relationship exists between m y of these meas-
ures and academic achievement as measured by grade*p0int
averages of college freshman students in the four sex and
ethnic groups,
Subjects
Subjects included in the study were drawn frost entering
freshman students who were enrolled in freshman English clas-
ses during the fail semester, 1962, at Texas College of Arts
and Industries, Kingsville, Texas. Subjects for the study
included only those students who were registered for twelve
or sort semester hours of course work and who had previously
received no more than six semester hours of college credit«
Thore were approximately 675 such students, with approximately
140 of these being Latins.
33

34
Ail foreign students and Negroes were eliminated as
subjects for the study* Three foreign students were identi-
fied from a published list of foreign students on campus and
fro® the item, "place of birth," on the students* personal
date sheets (see Appendix)• Two Hegro students were identi-
fied through visual identification during the administration
of the instruments and the use of the item, "high school at-
tended," on the personal data sheet, When the school listed
was known to be composed only of Negro students.
Students enrolled as majors in the Division of Engineer-
ing and the Division of Agriculture were excluded as subjects
for the study, since the curricula for students in these two
divisions differ significantly from those in other divisions
at Texas College of Arts and Industries, Other distinct char-
acteristics of these two divisions include the lack of female
students and the small number of Latin male students enrolled
as majors. Thus, only students who were ensolled as majors
in the remaining divisions of Arts and Sclenees, Teacher
Education, and Business Administration, and who wet the above
qualifications were included as subjects for the study.
Complete data were available for 387 students meeting
these qualifications. One student was dropped from the study
because she dropped out of school under conditions which wide
it necessary to omit her, as discussed in the section concern-
ing the method of collecting data. Subjects were classified
according to sex and ethnic groups • Sex group was determined

33
from information on Ch« ptrtoaal data ihMt • Ethnic cliiii*
flatioa was made by the examiner and two administrators who
were familiar with Latin eurnames, using the following infor-
mation i (I) student's surname; (2) names of parents; <3) the
listing of Spanish under "languages spoken" on tha personal
data sheet, particularly whan listed as tha first language;
and (4) addrassas known to ha in areas in which only Latins
live, two subjects were eliminated because tha information
was not conclusive enough to allow for agreement on ethnic
classification.
fhe remaining 3S4 students constituted the subjects for
the investigation, these subjects included; <1) 51 Latin
females; <2) §0 Latin males; (3) 124 Anglo females; and (4)
149 Anglo males* Scores made by all subjects in these groups
were used for the correlational aspects of the study.
Since the aspect of the investigation concerning possible
ethnic differences with respect to the measurements under
consideration utilised the two-way analysis of variance tech-
nique, equal subgroups of subjects were selected from the
four sex and ethnic groups. 'Hie smallest group of subjects
was Latin females, with 51 students in the group. The same
number of students was randomly selected from each of the
other three sex end ethnic groups* Thus, subjects for this
aspect of the inveetigatlon included 204 students, 51 from
each of the sex and ethnic subgroups.

36
Instruments Used
file ACT was used since it is one of the tests which has
bean adopted for state-wide use as an assessment of scholastic
aptitude of entering college freshmen, The ACT, or its equtva-
lent, is required of ail entering freshman students at Texas
College of Arts and Industries, Host prospective students
take the test between late spring and fall, before entering
in the fail semester. Those who have not taken the ACT or a
similar test before entering must do so in a session scheduled
near the beginning of the fall semester*
The ACT, while it is a relatively new instrument, has
been reasonably well established as being sufficiently reli-
able and valid for predicting academic achievement for general
populations of college students* It consists of subtests in
aathenaties, English, social science, and natural science,
and a composite score, which is the arithmetic average of the
subtest scores* Such an Instrument was also selected because
of the commonly held views concerning differences between
Latins and Anglos with respect to scholastic aptitude, as dis-
cussed in the first chapter*
The C-ZTS was administered in freshman English classes
by the examiner and two qualified assistants* It was used
since it measures traits concerning which common ethnic stere-
otypes are held. The instrument measures the following tea
temperament traits: (I) general activity; (2) restraint!
<3) ascendance; (4) sociability; (5) emotional stability;

37
(6) objectivity; (7) friendliness; <8) thoughtfulness; (9)
personal relations} and (10) masculinity. These traits are
described in the Appendix,
The C-£TS is a derivation ©f the more comprehensive in-
struments, £bi. Personnel Inventories (4).
Validity and reliability are considered ade*pate for use where
only a paper and pencil assessment of temperament traits is
feasible (2).
the II was also administered in freshman English classes
early in the fall seatester. It wa« selected because it was
originally designed to measure the outcomes of a higher edu-
cation program of general education. It, too, provides an
assessment of areas in which ethnic stereotypes are held* The
inventory consists of 12o statements concerning a wide variety
of beliefs, judged to be related to the objectives of general
education* Areas included are: (1) ideas and institutions
(ideocentrism); (2) social groups (ethnocentrism); (3) indi-
viduals, interpersonal relations (sociocentrtsra); and (4)
self (egocentrism) (3, pp. 217-218),
Subjects who score high on the II are described as being
adaptive, flexible, mature, and democratic in their relations
with other people. Subjects scoring low are described as be-
ing immature, rigid in outlook, authoritarian in relationships
with others, and compulsive in many of their actions, even to
the point of falling to profit by higher education (3, p. 220).

38
Reliability coefficients in thirty studies have ranged
from .63 to .95, with a median of ,86, on test-retest studies.
Estimates of reliability, baaed on Kuder-Richardson formulae
for internal consistency, range from *89 to .94, depending
on the institution (5), While the inventory manual gives
some consideration to face validity of the instrument with
respect to its application to the objectives of general edu-
cation, emphasis is given to its validity in term# of psycho*
logical dimensions. Evidence for validity is available from
correlations with other tests and fro® analyses ©f differences
between extreme scorers. The 11 was found to have correlations
of ,23 to ,46 with the ACE; ,21 to ,44 with Critical Thinking
& £il£ Social Sclmcsi and ,13 to .SO with PRMfff & BUBSO.
Significant differences have been found favoring
high scorers in matriculation in social sciences, fiaglish,
and the humanities. Significant differences were found favor-
ing high scorers in comprehensive examinations in the social
sciences and humanities. A significantly larger number of
low than high scorers were found to have withdrawn from school
by the end of the first year (5),
The personal data sheet (see Appendix) was designed to
obtain information necessary for the selection of subjects
and for the classification of subjects Into sex and ethnic
groups. Subjects were selected on the basis of items con-
cerning major division, semester hours la progress, previous
college credits earned, and country of birth. Classification

39
of subjects was based on items concerning name, sen, parents'
names, addreas, languages spoken, etc., as discussed pre-
viously »
Methods of Collacting Data
form 3-AC of the ACT was administered t© entering fresh-
man students prior to and immediately following tha beginning
of the fall semester, 1962. These scores were obtained fron
the Office of Student Personnel Services at Texas College of
Arts and Industries, in the form of a mimeographed list.
Scores were expressed in standard score units since they were
received in this foxm from the American College Testing Pro-
gram, Standard scores were derived from the November 4, 1961,
norms listed in the ACT jfeiSM M a H i ( l ) . Each
standard score represents not more than two raw score points,
thus limiting any error which might be introduced through
using standard, rather than raw, scores in the analysis of
the data«
The C-2TS, IB, and personal data sheet were administered
to students during the class periods when they were scheduled
for freshman English classes. The Chalman of tha Department
of English was contacted early in the semester in order to
determine the number of enrolleea and to arrange for the
schedule of adxtinistering the instruments. It was found that
7 4 0 students were enrolled in 38 sections of freshman English,
the section sizes ranged from 16 to 21 students, with one to
four sections scheduled per class period.

40
The date* of October 24, 23, cad 26, 1962, were selec~
ted for the collection of data. These included the dates on
which most English faculty members wished to attend a confer*
ence of English teachers whleh was scheduled on the campus.
A letter was sent to each member of the English faculty
on October I, 1962 (see Appendix). this letter, signed by
the Chairman of the Bepartment of English and by the examiner
as study coordinator, explained the general nature of the
study, announced the dates on which the data would be ob-
tained, and requested cooperation.
A centrally located room, seating approximately seventy
students, was reserved for the designated dates* the room
was equipped with a m chairs and tables and was adequate in
other respects for the administration of the instruments•
A follow-up letter was sent to each member of the Angllsh
faculty on October 18, 1962 (see Appendix). This letter in-
cluded an announcement to be read to the students, giving
the general purpose of the study, the time, and the place to
report* It was announced that attendance rolls would be
checked to encourage attendance.
Instruments were administered to two pilot sections on
October 19, 1962, in order to check procedures and times
necessary for obtaining the information needed. Since times
and procedures were found to be adequate, the subjects in
these sections were Included with subjects reporting at the
regular times.

41
©ata were collected on October 24, 25, and 26, 1962,
Subjects were instructed according to a prepared statement
(see Appendix) by the examiner. One section remained in the
regular classroom because the scheduled roam wold not accom-
odate all classes scheduled at that hour, la that section,
instructions were read by a qualified test administrator.
Qualified proctors supervised subjects at all times»
Most subjects were able to complete the three instruments
in the time allotted* These who were unable to finish in the
allotted time were allowed to stay and finish if they did not
have another class scheduled immediately following. Those
who could sot remain were asked to return later in the day,
Students whose English classes met on Wednesday and
Friday were given the C-ZTS on Wednesday and the IE and per-
sonal data sheet on Friday, they were given two periods of
fifty minutes each in which to complete all three instruments.
Students scheduled for Thursday £feglish classes were allowed
eighty minutes to complete all three instruments. The major-
ity of the students were able to complete the instruments in
the allotted time, with the remainder staying or returning
later to do so. Approximately 700 students completed ail of
the instruments in the scheduled three days.
Although the G-ZTS was administered on the steadard IBM
machine-score answer sheets, both the G-ZT8 and the IB were
scored by hand and apot checked for accuracy. Machine scoring

42
was not attempted because more precise and time-consuming
instructions would have been necessary.
After subjects for the study were selected according to
the procedure previously described, their grade-point aver-
ages for the first semester were obtained from the Office of
the Dean. Although grade-point averages had been computed
for all students at the time grade reports were made, the
method of computation used by the college differed slightly
in some cases from the method proposed in the present study»
This difference involved only about seventy five subjects
whose grade-point averages were computed so as to be consis-
tent with the study.
Grade-point averages were computed according to the fol-
lowing schedule; A grade of was assigned 4 grade points per
sweater hour; a grade of % was assigned 3 grade points per
semester hour; a grade of g. was assigned 2 grade points per
semester hour; a grade of g, was assigned 1 grade point per
semester hour; and a grade of £ was assigned 0 grade points
per semester hour. Averages were computed by dividing the
total grade points earned by each student by the number of
hours attempted* this is the method used by the college with
the exception that only semester hours completed are used in
the computation of grade-point averages. The deviation arose
only with respect to students who dropped courses, receiving
grades of those who withdrew from college, receiving grades
of V£; and those who did not complete courses, receiving gradea

43
of J,. For purposes of this study, these grades were included
in til® computation of grade-point average, since courses not
completed appeared to be of importance*
Subjects who dropped courses or withdrew from school be*
tween uctober 6, 1962, the final date for schedule change
unreported on fine I record, and mid* semester on iovember 10,
1962, were considered to have dropped or withdrawn failing
and were given grades of g,« After mid-semester, drops and
withdrawals are treated in the following maimer by the col-
lege: (1) students who drop courses which they are passing
are assigned grades of Q.; (2) students who drop courses which
they are failing are assigned grades of £$ (3) students who
withdraw fro* school are given grades of & in courses which
they are passing and grades of £ in courses which they are
failing; and (4) students who fall to complete the require-
ments for a course but do not drop it or withdraw are assigned
grades of J,. this procedure was followed in the study. For
purposes of grade-point computation, subjects were assigned
arbitrary grades of £ for courses in which they received
grades of W, or £.« It was decided that subjects who with-
drew after mid-semester with passing grades in every course
would be dropped from the study on the assumption that they
withdrew for reasons unrelated to academic progress* Only
one subject, an Anglo female, was dropped from the study
for this reason.

44
Organization and Treatment of Data
Oat* wec« analysed for the four sex and ethnic groups;
(1) Latin fenales; <2) Latin males* (3) Anglo females; and
(4) Anglo males. Identification numbers were assigned to all
subjects in alphabetical order to expedite electronic data
processing* This identification number, ethnic group* sex,
a e@de to identify the sample subgroups for the analysis of
variance, standard scores on the ACT, and raw scores on the
G-2.TS and the IB were punched on a single IBM card for each
subject. Statistical tests were made using the IBM-1620
electronic data processer.
Date obtained from the smaller subgroups of subjects
only were used to detexmine whether significant differences
exist between the two ethnic groups with respect to mean
scores on any of the dimensions measured by the three instru-
ments* Hie two-way analysis of variance technics (6) was
used to test the first three hypotheses, concerned with these
differences.
Hypothesis IV, concerning the relationship between scores
®» the instruments and academic achievement, w»# tested for
each sex and ethnic group through the use of the Fear son
w m m % V H t t W t e <*>• obtained
from ell subjects were used to determine these relationships.
The significance of each of the obtained correlations was
determined through the use of §, (6).

45
Hypothesis V, concerning the difference between these
relationships for the four sex and ethnic group® was tested
through the use of the chi-square test of homogeneity of r (7).
This test was used only for those dimensions found to be sig-
nificantly related to academic achievement for my of the
four sen and ethnic groups»

CHAPTER BIBLIOGRAPHY
I. ffl&i. g?oklet, J C T 1*M,» Iowa City, Iowa, Amerlean College Testing Program, 1962.
2. Bttros, Oscar a * IM£k Highland Park, Sim Jersey, theGryphon frea«, 1999 •
3. 0ressel, Paul L. and Mayhew, Lewie 6.. General Education; ~ * :"®| la Evaluation. Washington, £.C., AnMean
fill 0® ' E | 195ft *
4. Guilford, J. P. and Zitnmerman, tf. S., The CMllford ZliametBian ' ~ " " " " " * :erore» lever iy Hilit, California, Sheridan Supply
>anyi 1949,
Washing* 5. tog?w|f,ftff Banal ia&JM teffiltp, fttlfMfjlit tdll| 0# C«| GtliittCiL OH 11153#
6. McM«*r, Qttinn, Psyclplogical Statistics Mm York, John Wiley and Sons, Inc.,1955,
7. Rider, Paul ft*, ttgflffflni IffMf, New York, John Wi iiy Son# | Xnc * | 1939#
46
CHAPTER IV
ANALYSIS AND DISCUSSION OF RESULTS
An analysis was made of the data Co determine whether
differences cxlit between male and female Anglo and Latin
students with respect to scholastic aptitude as measured by
the ACT, temperament traits as measured by the G-ZTS, and
beliefs In traditional values as measured by the IB, A fur-
ther analysis was made to- determine if a relationship exists
between any of these measures and academic achievement as
measured by grade-point average#
Analysis of Data
1 ffeffig**, SUmtf SroiBt
In order to determine whether differences exist between
Latins and Anglos with respect to scores on the instruments,
scores made by fifty-one subjects in each of the four sex
and ethnic subgroups were utilized. Mean scores and standard
deviations were computed for these subjects for each variable
under consideration. These data are presented in Table I.
An examination of the data in Table 1 reveals that Anglo
male subjects made the highest mean scores on mathematics,
social science, and natural science subtests and on the
47

a
3 2
5
fl&f 3
« %
m
o <a
#
A Cft
# s
©
J
sr *«**o*t*"i«i'i*4o ** 01 «0AtA4»ftt#*v4 0r* *0 * # # # # • * # • # * + * » # * •
m m
f% *
9
p* m #
o
«* r%
€4«# VB0IM v*r*dtf*r* # • * # * cooosao US 2§ 22 Vv 11 V**V f***!
S5SSSCSS5S 3 • ••*»••••• « *•4 *4 *4*4 «*4 *4*4 iSl»SlO| tf|
£s J&IljSJSlttSG Esil S5& £? 00 «0*4«0#> Oe&ifSea© f% • * • # • • » • • • « • « » • • «
o <*»*©»#'it* «*» tf^^^nnwun^r ** 00i-*4 Q&VOtn • • • • • «N*®esaae6 gggfl. *'"""* TF
*2*>«-<«4 0 •-» 0*<»«N <**#<©*#• «*» • » * • * • • • • • •
««lf«4 *4®H *4 *<4*<4*4*4 *4> 8 SaSUS SfcSSaSSSSS 8 • • • • • • • •••«»•••• « O «***©•<* s#%*fr- St
•OOWN v6K#*«f»lin»4,'Sls.*©rt ©* • #«#• #*• + #**• + • • 23233 333633:3532 S
SS33SR # * * • *
W% P|* $SS3!2i5*S;i&S8 #*% **f If7i4r n«l0WO
# • # # * I"""® •**§ tpHl *~4 ifMf tfUMlt 'iHtaiit jjWfait
w-'-m %7'| Iri ipf &
*1 P
l i t **4®m m **w m
P *4 m
• h S sls
.His «* »
sHijflill iislsi
*•£({
a a
0**00 «?> *n
m 9 to,
I ftfi XI i XJ o
14 0 *44
« Hr

49
composite score on the ACT. They had the highest mean scores
on the ascendance, emotional stability, objectivity, aad
masculinity trait tea lea on the C-2TS.
Anglo female® were found to have the highest mean score
on the English subtest of the ACT and the highest grade-point
average, They also had the highest mean score on the 11 and
on the general activity, sociability, friendliness, and per-
sonal relations scales on the 6-2TS.
Latin stale subjects were high with respect to mean score
on the restraint scale of the G-ZTS. Latin females had the
highest mean score on the thoughtfulness scale of that instru-
ment#
It was stated in Hypothesis X that there would be no sig-
nificant difference between the ethnic groups with respect to
scores on the ACT, with differences between stales and females
not varying significantly from one ethnic group to the other*
The scores made by equal subgroups of the four sex and ethnic
groups were compared through the use of a two-way analysis of
variance technique« The analysis summary for each of the sub-
tests and the composite score on the ACT is presented in Table
11, showing the sunt of squares, degrees of freedom, variance
estimate, F-ratio, and level of significance for each source.
It way be seen from the data in Table 11 that signifi-
cant differences were found to exist between Latins and Anglos
with respect to scores made on each subtest and the composite

so
TABLE II
SOK OF SQUARES, DEGREES OF FREEDOM, VARIANCE ESTIMATE. F-IATIO, AMD LEVEL OF SIGNIFICANCE FOE SCORES CM
t H i W & U l l
Source Sua of Squares df Variance
Estiaata F P
& iglish
Ethnic mmU-Ethnic x «ax Within calls
Total*
788,241 381.574
.043 4469,132 5638*990
I I I
200 203
788,241 381.574
.043 22.346
35.27 17.08
.04
<•001 <.001
Mathaaatics
Ethnic Sex Ethnic x tax Within calls Totals
357.353 336.490
•020 5860.820 6554.683
I I I
200 203
357,353 336,490
.020 29.304
12.19 ll,4fl
.02
<.00l <.001
Social Seianca
Ethnic Sex Ethnic x sax Within calls Totals
1240.244 60.397 23.339
4269*600 5593.580
I I I
200 203
1240.244 60,397 23.339 21,348
58.10 2.83 23.34
<.001
<.001
Natural Sclanca
Ethnic Sax Ethnic x sax Within calls Totals
1290.047 46.123
.005 5341.055 6677.230
I 1 I
200 203
1290.047 46.123
.005 26.705
48,31 1.73 ,01
<.001
Composite
Ethnic Sax Ethnic x sax Within calls Totals
877.103 10.828
,828 3472.191 4360.905
I I I
200 203
877.103 10.828 *820
17.361
50*52 .62 .83
<.001

51
of the ACT. 4m examination of the aeans shown in fable X
Indicates that all differences were la the direction of higher
too ret for Anglo than for Latin subjects. F-ratios range tmm
12.19 on the fuatheaaties subtest to 5$ #10 on the social science
subtest, each significant at better than the .001 level. Thai,
the first part of Hypothesis 1 received no support.
The second part of Hypothesis I received partial support
in that significant interaction was found only with regard to
the social science subtest. The F»ratlo of 23.34 la slgnifl*
cant at better than the .001 level. An exaainatlon of the
means shown in Table I indicates that greater sex differences
were found ataong Latins than among Anglos • It was noted that
males scored significantly higher than females on the suithe-
watics subtest. Females scored significantly higher than
sales on the English subtest.
It was stated in Hypothesis II that there would be no
significant difference between the ethnic groups with respect
to scores on the G~ZT8, with differences between males and
females not varying significantly from one ethnic group to
the other. The scores of equal subgroups with respect to sex
and ethnic group were compared through the use of the two-way
analysis of variance technique. The analysis summary for each
of the ten trait scales on the CS-2TS is presented in Table 111,
showing the sua of squares, degrees of freedom, variance esti-
mate, F-ratio, and level of significance.

52
TABLE III
SIM OF SQUARES, DEGREES OF FREEDOM, VAIXANCE ESTIMATE, F-i^vriO, m® LEVEL OF Sl®tFXCA»€E OF SCORES ON
m wmmmt mm Source Sum of
Square* d£ Variance Estimate F P
General Activity
Ethnic Sex Ethnic x sex Within etlU Totals
133.456 26.123
.005 5564.350 5723.934
I 1 1
200 203
133.436 26.123
•005 27*822
4.80 .94 .01
<.05
Eastrain t
Ethnic 143,338 1 143.338 6.73 <.01
Sm • 122 1 . 122 .01 Ethnic x sex 2.162 1 2.162 2.16 Within calls 4261*960 200 21.310 Totals 4407.583 203
Ascendance
Ethnic 119.294 1 119.294 4.75 <.05 Sax 131.843 1 131.843 5.24 <*05 Ethnic x sex 26.844 1 26.844 26.84 <.001 Within calls 5028.000 200 25.140
Totals 5305.981 203
Sociability
Ethnic 88.020 1 88.020 3.13 Sax 362.667 1 362.667 12.91 <.001 Ethnic x sax 20.078 1 20.078 20.08 <.001 Within calls 5609.530 200 28.098
Totals 6090.295 203
Etaotional Stability
Ethnic 43.314 1 43.314 1.49 Sax 101.647 1 101.647 3.49 Ethnic x sax 1.255 1 1.255 1.26 Within calls 5829.764 200 39.149
Totals 5975.980 203

TAIL! Ill —Continued
53
Source Sum of Squares d£ Variance
Estimate F f
Objectivity
Ethnie Sex Ethnic x sex Within cells Totals
117 *770 94 .711 3.573
5345.53© 5561*584
i i i
too 203
117*770 §4,711 3.573 16,728
4.41 3,54 3.57
<*05
Friendliness
Ethnic #490 I .490 1*98 $®X 259.313 1 259.313 10*47 <*01 Ethnic x sex 59*314 1 59*314 59*31 <*001 Within cells 4952.393 200 24*762 Totals 5271*510 203
Thoughtfulness
Ethnic 4$.044 1 48.044 2*38 Sex 23.338 1 1*56 Ethnic x sex 15*927 1 15*927 15*92 <*001 Hithin calls 4039*761 200 20*199 Totals 5127.070 203
Personal Relations
Ethnic 7.843 1 7.143 3*76 Sex 43.314 1 43,314 2*08 Ethnic x sax 11*294 1 11*294 11*29 Within cells 4167*370 200 20*837 Totals 4229*821 203
Masculinity
Ethnic 51*000 I 51.000 3*29 Sex 5591.295 1 5591.295 360.54 <.Q0l Ethnic x sex 5.020 1 5*020 5*02 <.05 Within cells 3101*605 200 15.508 Totals 8748.920 203
An Assassination of the data in Table 111 chows that sig-
nificant differences were found between the ethnie groups with
54
respect to icorti on the general activity, restraint, ascend*
aace, and objectivity scales of the G-ZTS. The greatest dif-
ference was found for the restraint scale, with the F*ratlo
of 6.73 being significant at better than the #01 level. An
examination of the means shown to fable I reveals that Latins
scored higher than Anglos on this scale. Differences between
scores on the general activity, ascendance, and objectivity
scale® were significant at better than the .03 level, with
F«ratios ranging tmm 1.41 to 4.S0, with all difference® being
la the direction of higher scores by Anglos than by Latins.
fhms, the first part of the hypothesis received only partial
support.
The second part of Hypothesis 11 received little support
in that only four scale scores, general activity, restraint,
emotional stability, and objectivity, did not result In sig.
nlfleant interaction. Significance levels of <.05 to <.001
were found for all other scales, with F*ratios ranging from
5.02 for masculinity to 59.31 for friendliness. It Is Inter*
Mtlag to note that greater sex differences were found for
Latins than for Anglos on a single score, sociability. A
greater sex difference was found among Anglos than among Latins
on ail other C-ZTS scales shown to have significant Interaction.
Significant sex differences were noted with respect to
scores on four of the trait scales. Males scored higher than
female® on ascendance and masculinity, with female# scoring
higher than males on sociability and friendliness.

55
It was stated in Hypothesis 111 that there would be 110
significant difference between the ethnic groups with respect
to scores on the IB, with differences between males and fe»
amies not vazying significantly from one ethnic group to the
other. The scores made by equal subgroups with respect to
sen and ethnic group were compared through the use of the
two«»way analysis of variance technique* The analysis summary
for scores made by subjects In these subgroups is presented
to Table IV, showing the sum of squares» degrees of freedom,
variance estimate, F-ratio, and level of significance*
TABLE IV
SUM OF SQUARES, DEGRESS OF FREEDOM, VARXAHCE ESTIMATE, F-RATIO, AMD LEVEL OF SIOflFfCAKGE FOR SCORES
01 tie mmm> m. w «
Source Sum of Squares df Variance
Estimate F P
Ethnic 2039,310 1 2039*310 8*81 <•01 Sex 902«160 1 902.160 3*90 <*05 Ethnic x sex 64*850 i 64.850 64*85 <*001 Within cells 46305*900 200 231*529
<*001
Totals 49312.220 203
It may be seen ftom the data in Table IV that the differ-
ence between ethnic groups with respect to scores on the IB
was significant at better than the *01 level; the F-ratlo was
3,31* This difference was in the direction of higher scores
by Anglos than by Latins* Interaction was found to be sig-
nificant at better than the *001 level, with an F-ratio of
64*95* An examination of the means in Table I reveals that

56
««x difference was greater among Anglos titan among Latins,
t h a t , Hypothesis H I received no support. I t was noted that
feaales scored significantly higher than stales,
i&£a
It was stated i n Hypothesis XV that their® would be a posi«
tive relationship between scores on the ACT, the 6-ZTS, and
the IB and grade-point average for each of the sex and ethnic
groups* The hypothesis was tested through the use of the
Pearson tWgfMr. f f l f t l M m M t l t f i c o e f f i c i e n t . The s i g n i f i -
cance of each correlation was determined through the use of
These correlations, *nd level of significance are presented
in Table V for each sex and ethnic group*
Significant correlations botween scores on the ACT and
grade-point average were found for ail groups* Each subtest
and the conposite score was significantly correlated at bet-
ter than the *001 level for each of the four sex and ethnic
groups, with the exception of the aathesutles subtest. The
correlation between t h i s score and grade-point average wis
s i g n i f i c a n t at the .001 level for a l l groups except the
Latin female group. In that i n s t a n c e , I t was s i g n i f i c a n t
at the .05 l eve l*
Bo s i g n i f i c a n t c o r r e l a t i o n s were found between scores cm
the general activity, ascendance, emotional stability, objec-
tivity, or personal relations scales and grade-point average

5 7
0 8
M i a 8 * 9 Sr* s i s
m
>
3
8 1 M j& i
ftf O
1 #4
1
3
r*$
5
i £ J
N
5
3
f«*f
i t
*4
fcf
5 41
3
£3
Ml
# 1
At
III
0*
1^1
•U m m h
H4i o o o o o ooooo * * # * *
o *n o o • •
i n ©
#*#*f|#««t %#€!** m*i © * n * o • # # * # * i t 0a><4h0
• • * • » « # • • • t i l *4 CM 01
#>4m aptftaa • # * • •
« ^ p<4 r% *# i#I ^ f«i O ^ H ^ o o o n o « i t i t i
flPil l o O ©* D O OOOOO • • * • •
s> © #
o *
tnm0§f*%in 1#%* * Mf* f*t 0t
# * • *J * « l © fw|
cm m m> &% *& *»* m p+ m m # • * » # * # • • « #*4f*'| w*4##4 #4 0 | #$ «*t w4
* • # # *
S^oooo o e o o • • « • •
o i n o ©
i n t e r n © m <*<# o c n o + * • * « ^« *«n *CHK
• • • # # * « * 4 0 §
m m <*«»« © m « « * # i
o « t *4tn#*4 © © f t * * '
I l i f t * t f #*t p4 «M4inI o ^ o o o o o o o o
© ©
#
#*4 **0 C * *sj» O *0 CM 01011*1
# # # • . # t f * 0 l « t n * #
e * _
M S i 25 O
m a
«K •
<0 #4 i#% ^ # i c© * 4 * n * n # r * * 0 i * # * * i © i n
# # # #»>«M»
^ C 9 0 t < u > M O b u H f t , X C9
vO *4 *
0% <fr
c
© *
01
w w © p i p i H i ^ ^ f i i p i 0 i * » • * • • * • « « * i
*# a
f*%
m
o*
- M
i r i ©
**4 © « © « * * * f 4 © t n % @ o K o « c 9 e t * 4 r « f 4 i ^
«*| *w#tf*4C*,| €H|
cn
^#c*|i#MS*>0 O©#*t#«*0f*# © « * * * • • • * * * • # * # * « • * *
I i i
«T| «
I - / 3
$Q

53
for any group. Correlation* between the raatraint aeora and
grade-point avaraga were significant at batter than tha .001
level for aach group. Other significant correlations included:
(I) negative correlations of .167 and .305, both significant
at the .05 level, were found between the sociability score
and grade-point average for Anglo males and Latin males, re-
spectively ; (2) a correlation of .245 between friendliness
and grade-point average was significant at the .01 level for
Anglo females; <3) correlations of ,243 to .458, siptifleant
at the .01 and .001 levels, were found between scores on the
thoughtfulness scale and grade-point average for all groups
except Anglo females; (4) correlations of +319 and -.206
were found between masculinity score and grade-point average
for Latin females and Anglo males, respectively, with both
correlations being significant at the #05 level; and (5)
correlations between scores on the II and grade-point average
were found to be significant at the .05 and .01 levels for
Anglo males and Anglo females, respectively. Thus, Hypothesis
IV was supported with respect to most of the variables under
consideration •
It was stated in Hypothesis V that no significant dif-
ferences would exist between the four sex and ethnic groups
with respect to any significant correlations between the meas-
ures and grade-point average, this hypothesis was tested
through the use of the chi-square test of homogeneity of r.
Significant correlations, chl square, and level of significance
are presented in Table VI.

59
TABLE VI
SIGNIFICANT COHREIATIOHS BETWEEN GRADE-POINT AVERAGE
AMD SOME SCORES C g ^ ^ l ffifaJ/Bk
llfem 1 • EC OBttJP, If S P AWL jlftBVEL or SlOlIFICAIfC*
Variable Significant Correlations *2
TS Variable LP1 IH2 AF3 AM*
V
ACT English Mathematics Social Science Haturai Science Composite
.626
.307 •668 .599 .669
.637
.581
.553
.571
.679
.612 ,651 .502 .593 .704
•414 ,452 e *#€£•» .351 .483
6.1023 9.6154 6.6080 8.5268 9.4184
<.05
<.05 <•05
M T S Restraint Sociability Thought fulness Masculinity
.467
,458 .319
.422 -.305 •381
.306 .436 -.167 ,245
##206
2.0495 ,8716
2.5109 10,5414 <.05
IB .245 .161 .5054
I Latin females; n * St Latin males; n • 60
Anglo females; n * 12
Anglo males; n * 149
It way be seen from the data in Tabla VI that the hy-
pothesis was only partially supported, Significant differ*
enees vera found between the groups with respect to correlations
between grade-point average and scores on the ACT subtests for
mathematics and natural science, as well as the composite
score* These differences were significant at better than the
,05 level, with chi*square values of 8.5268 to 9.6154. Only
one significant difference was found between the groups with

m respect to correlations between grade-point average and scores
on the G-ZTS. the chi-square value for differences between
correlations between grade-point average and masculinity score
was to.5414, significant at better than the .05 level* Ho
significant difference was found between the Mglo groups with
respect to correlations between grade-point average and scores
on the IB*
the above data reveal significant differences between
ethnic and sex group# with respect to scores on a number of
the variable# under consideration. Significant relationships
were found between several of these stores and grade-point
average for each of the four sex and ethnle groups. Xn view
of these findings, some analysis of any differences between
the groups with respect to grade-point average appeared ap»
propriate. The grade-point averages earned by subjects In
the four equal subgroups were compared through the use of the
two-way analysis of variance techni<iue, fable VII Includes
the analysis summary, shewing the sun of squares, degrees of
freedom, variance estimate, F-ratio, and level of significance
for each source.
It may be seen from the data In fable VII that no sig-
nificant difference was found between the ethnic groups with
respect to grade-point average. Females made higher mean
grade-point averages than males, the F-ratio of 6.90 being
significant at better than the .01 level. Ho significant

61
TABLE ¥11
SUM OF SQUARES, SSGRBES OF FMSEStiH, VARIANCE ESTIMATE, F-RATIu, MP LEVEL OF SIGNIFICANCE FOR GRADE-FOIHT
AVERAGES OF FOUR SIX AND ETHNIC SUBCBOUFS*
Source Sua of Squares df Variance
Estimate f P
Ethnic Sex Ethnic x sex Within cells Totals
1.245 3,478
,408 158,877 166,008
1 I I
200 203
1,245 5,478 .408 ,794
1,57 6.90 .41
<•01
n for each subgroup * 51
interaction was found, indicating no variation between the
ethnic groups with respect to sex differences. The lack of
significant differences between the ethnic groups was of
particular interest in light of ethnic differences found on
a number of variables found to be significantly related t©
academic achievement.
Discussion of Results
An examination of the above data reveals an apparent dis-
crepancy between the different aspects of the investigation.
It was found that significant differences exist between the
ethnic groups with respect to all scores on the ACT, with
Anglos scoring higher than Latins, Significant correlations
were found between each subscore ©f the ACT and grade»p©int
average for each of the four sex and ethnic groups. Signifi-
cant differences were found among these four correlations for
three scores, including subscores for aathematics and natural
u science, &n<3 composite scores, No significant difference was
found between the groups with respect to grade-point average*
It should be remeabered that correlations were determined
for ail subjects in each sex and ethnic group, tests lor
differences between ethnic groups were made utilising only
scores made by the subjects in smaller subgroups of 51 stu-
dents each. Thus, correlations were determined for larger
numbers of subjects in each sex and ethnic group except latin
females. Any attempt to explain these results should take
this fact into consideration.
This apparent discrepancy wight also be explained by
underachievement by Anglos, overachievemeat by Latins, or by
some inequality or bias in grading. So evidence is available
with respect to any differential advantage for either group
in tens of grading procedures.
With respect to the possibility of underachievtmcat by
Anglo subjects, it will be noted that mean scores made by
Anglo male subjects on the ACT were consistently higher than
those made by other subjects. The only exception is a higher
English score made by Anglo females. Anglo wales did not
have the highest mean grade-point average.
It was noted that correlations between scores on the ACT
and grade-point average were lower for Anglo males than for
any other subjects, except for a lower aatheaatics correlation
for Latin females. This lower correlation, and the fact that
significant correlations were found between grade-point

63
average and in©re personality and value variables for these
than for other subjects, might indicate a stronger influence
on grades by factors other than scholastic aptitude for these
subjects. It may be seen Iron a further analysis of the data
that Anglo sales had the lowest mean scores on the restraint
and thought fulness scales of the 6-ZTS, two variables for
which significant correlation® with grade-point average were
found. They also had high masculinity scores, with this
variable being negatively correlated with grade-point average
for them*
Anglo females had the second highest mean scores on the
ACT, except for the English subtest, on which they had the
highest mean score. These subjects had the highest mean
grade-point average, and higher scores on all variables ex-
cept restraint which were found to be significantly related
to grade-point average. The mean score on the restraint
seal* urns higher for Anglo females than for Anglo males *
While no test was made of the significance of the differ*
ence between Anglo males and Anglo females with respect to
scores on the instruments, these findings appear to indicate
a considerable advantage for Anglo females. Anglo females
scored high on the friendliness scale, that score being
significantly related to grade-point average for these sub-
jects only. Females scored significantly higher than males
on the friendliness scale, with significant interaction in
the direction of greater sex differences among Anglos than

64
among Latins* Greater sex differences were also found among
Anglos than among Latins with respect to scores on the scale
for thoughtfulness.
It would appear from the above findings that the female
is nore characterised by temperament traits which contribute
to the making of high grades than is the sale, with this sex
difference being greater among Anglos than among Latin#.
This would tend to support the belief that the expected sex
role of the female, that of being friendly, accepting domi-
nation, exerting persistent effort, and being highly controlled,
is also the accepted role of the "good student•" On the other
hand, the store masculine role of being aggressive, impulsive,
resistant to domination, and store interested in overt activ-
ity would not appear to contribute to academic achievement
as measured by grade-point average* Perhaps these charac-
teristics of the Anglo male, and the responses of others to
them, would help to explain the lower correlations found
between score® on the ACT and grade-point average for these
subject®.
With respect to possible overaehievemeat by Latin aub-
jects, Latin £emales had the lowest mean score® m the
subtests of the ACT except on the English score, on which
Latin males were lower. Despite these low scores, Latin fe-
males were found to have the second highest grade-point
average, higher than either male group. It is interesting
to note that Latin females had the highest mean score on the

65
thoughtfuiness scat® of the G~/'TS sad the second highest mean
score on the restraint scale, both of which were found to fee
significantly related to grade-point average,
Latin male subjects were found to have the highest mean
score on the restraint scale and the second highest mean score
on the thoughtfulness scale of the G-4TS. Further, the mean
score for Latin wales on the scale for sociability was con-
siderably lower than that for any other subjects, with a
significant negative correlation being found between this
variable and grade-point average for Latin males.
these data would appear to lend some support to the pos-
sibility o£ underachievement by Anglo subjects, particularly
males, and of overachievenent by Latin subjects, particularly
females, the significantly higher restraint scores made by
Latins, evidencing more seriousness of purpose by these sub-
jects than by Anglo subjects, would tend to support the pos-
sibility of overachievement by these subjects. Too, education
is considered to be virtually the only route to social mo-
bility for Latins in the South Texas area, and one which is
highly prized by many Latins, often to the extent that they
attend college over the objection of parents and other
Latins (4), The fact that a resulting high level of moti-
vation could influence the achievement level of such students
is supported in the literature (I). Studies concerning the
family and social life of Latins have revealed a difference
in attitudes between Latins and Anglos with respect to dating

66
practice* (2, 3, 4). A lack of acceptance of the norma of
frequent dating, mad factors inherent in the situation at
Tews College of Arts and Industries, such as a larger per-
centage of Latin than Anglo students living off campus and
less participation in campus activities by these Latin stu-
dents, night also contribute to more study and to sotae degree
of overachievoaent on the part of these students •
The najor snphasis of the investigation has been the
study of possible ethnic differences with respect to those
measures found to be significantly related to academic achieve*
merit. In addition to those differences and significant re*
1st ions found with respect to scons on the ACT, the only
such aeasure for all subjects was the restraint scale of the
G-ZTS. Latin subjects scored significantly higher than Anglos
on this scale, indicating greater seriousness of purpose,
deliberation, persistent effort, and self control. Signifi-
cant correlations were found between this score and academic
achievement for ail groups, with no significant difference
among the correlations. These data would indicate that
scores on this trait scale night be effectively used in the
prediction of academic achievement, and be etguaily effective
for each of the sex and ethnic groups, despite differences
between the ethnic groups.
Significant ethnic differences were found for three trait
scales of the G-ZTS which were suit significantly related to
grade-point average, Anglos scored significantly higher than

67
Latins on the general activity scale, indicating more ef-
ficiency and a faster pace on the part of Anglos. Anglos
also scored significantiy higher on the objectivity scale,
indicating that Anglos were found to be store "thickskimed"
than Latins, with Latins being more characterized by hyper-
sensitiveness, suspiciousness, and getting into trouble than
Anglos. Anglos also scored significantly higher than Latins
on the asc«idanee scale, indicating greater eonspicuousness,
persuasiveness, and leadership habits on the part of Anglos*
A significant sex difference was found with respect to this
variable, with males scoring higher than females* Signifi-
cant interaction was found, with greater sex differences
among Anglo subjects than among Latin subjects.
Significant ethnic differences were alee found with
respect to scores on the IB, Anglos scored higher than
Latins, indicating that Anglos were more characterised by
independence, flexibility, and maturity, latins were more
characterised by a greater adherence to outHooded ideasf
irrational acceptance of external authority, and resistance
to departure fwm tradition. Significant sex differences
were found in the direction of higher scores for females,
and Interaction was significant* Greater sex differences
were found among Anglos than among Latins. Significant
correlations were found between scores on this instrument
and grade-point average for Anglo subjects only, with no alg*
nlfleant difference between the correlations for Anglo males
is
and Anglo females. These data would Indicate that the 11 has
predictive value for Anglos only, with no sex differential
within this ethnic group.
It may be seen from this discussion that differences
found between these ethnic groups suggest characteristics in
the direction of popular stereotypes* The only exception to
this is the greater seriousness of purpose and self control
by Latins as indicated by scores on the restraint score of
the G-ZTS« However, any conclusions regarding behavior char*
acteristias and stereotypes should take into account the
unanswered question of which reflects the other.

m n B i B M o e s A m
1. H i l j i a rd , Ernest H . , J t l iey- iea g£ g » E g i M * S a w * 0 1 * - A^p le t& i ^en tm^GrQz tB , AGO*, 1948*
2 , Jones. Bolwrt 0 * t "StJwic fami ly Patterns* fit® Mexican I f t a lb r l a the t ta i ted S t t t f i , * Jtoarioan f w m m i $£ Sociology. SIX (May, 1948), 450-412.
S imons, ©twi@'§.» "Anglo-American® and MexicanOjaericana i n Soutb $#3Ea&t A Study i s Doainant^UtKM^dinftt# Ha-l a t i ons f» unpublished doctora l d i s se r t a t i on , S®parta@nt ©f atuoft t ion* Harvard TJniveraity, Cambridge, Massachusetts, 195&.
4# $uck, lu t fc , got With, tfce J ig te * Mexioanaiaerioana i s a Southwest 0f t r7^0w^forM", i i g e w i f e ' i raee, and Company,
69

CHAPTER V
SUMMAKK, CCHCLUSIOHS, A«D RECut^iENDATIOMi
The present study was m investigation of differences
between Latin and Anglo college freshman with respect to scores
on the ACT, the C«ZTS, and the IB. It was also a study of the
relationships between scores on these instilments and academic
achievement as measured by grade-point average for each of the
four sex and ethnic groups*
Summary
Subjects for the investigation included 384 freshman stu-
dents at Texas College of Arts and Industries, registered for
twelve or wore semester hours of course work and majoring in
the divisions of Arts and Sciences, Teacher Education, and
Business Administration. These included 51 Latin females, 60
Latin males, 124 Anglo females, and 149 Anglo males*
The G-ZTS, the IB, and a personal date sheet were admin-
istered to these subjects during scheduled freshman English
classes daring the fall semester, 1962. Scores made on the
ACT were acquired from the Office of Student Personnel Services,
and grade-point averages were computed fro® grades filed in
the Office of the Dean.
70

11
Appropriate statistical tests were made utilizing th«
18K-1620 electronic data processer. The complex analysis of
variance technique was used to determine difference® between
Latins and Anglos with respect to scores on each of the in-
etruaents. Since this test was used, smaller subgroups of 51
subjects in each sex and ethnic group were randomly selected
for this aspect of the investigation.
Correlations between scores on the instruments and aca-
demic achievement as measured by grade-point average were
computed through the use of the Pearson product suameaat corre-
lation coefficient, utilizing scores made by the total sample
In each sex and ethnic group. Differences between correla-
tions found to be significant for tm or more groups were
determined through the use of the chl-square test for homo*
genelty of r. Results of these statistical tests included:
1* It was stated in Hypothesis 1 that there would be no
significant difference between the ethnic groups with respect
to scores on the ACT, with differences between males and fe-
males not varying from one ethnic group to the other. Anglos
scored significantly higher than Latins on each subtest and
the composite score of the ACT. Significant interaction was
found only with respect to the social science score, with
greater sex difference being found among Latins than among
Anglos;
2. Xt was stated in Hypothesis II that there would be no
significant differences between the ethnic groups with respect

72
to scores on the G-ZTS, vlth differences between males and fe-
nales not varying significantly from one ethnic group to the
other, Latins scored significantly higher then Anglos on
the scale for restraint, with Anglos scoring higher than Latins
on the scales for general activity, ascendance, and objectivity.
Significant Interaction war found for six variables on the
G-ZTS, These were the ascendance, sociability, friendliness*
thoughtfulness, personal relations, and masculinity scores.
Greater sex differences were found among Anglos than among
Latins on all but the sociability score;
3. It was stated In Hypothesis III that there would be no
significant difference between the ethnic groups with respect
to scores on the IB, with differences between males and fe-
males not varying significantly froa one ethnic group to the
other. This hypothesis received no support« Scores made by
Anglos were significantly higher than those made by Latins.
Interaction was significant, with greater sex difference
occurring among Anglos than anong Latins;
4, It was stated In Hypothesis IV that there would be a
positive relationship between each score on the ACT, the
G-ZTS( and the IB and academic achievement as measured by
grade-point average for each sex and ethnic group. Signifi-
cant correlations were found between grade-point average and
all scores on the ACT and between grade-point average and
scores on the restraint scale on the G-ZTS for subjects in
each sex and ethnic group. Other correlations were significant

73
only for tome sen and ethnic groups. These Included: C D
significant correlations between so©lability and grade-point
average for both male groups; <2) significant correlations be-
tween friendliness and grade-point average for Anglo females;
(3) significant correlations between thoughtfulness scores
m i grade-point average for ail groups except Anglo females;
(4) significant positive and negative correlations between
masculinity and grade-point average for latin fenales and
Anglo males, respectively; and <5) significant correlations
between scores on the IS and grade-point average for both
Anglo groups; and
5, It was stated in Hypothesis V that no significant dif-
ferences would exist between the four sex and ethnic groups
with respect to any significant correlations between the
variables and academic achievement as measured by grade-point
average. Significant differences were found among the groups
with respect to correlations between grade-point average and
the mathematics, natural science, and composite scores on
the ACT* A significant difference was also found between
the correlations between masculinity and grade-point average
for Latin females and Anglo males.
Conclusions
The results of the present investigation would appear to
support the following conclusions t
I. Anglo subjects were found to have a significant advan-
tage with respect to scores on the ACT, indicating that the

74
subject* In the study do not: constitute a single popttUtion
in this respect;
2. The ACT is significantly related to academic achieve-
ment for all sex and ethnic groups. However, consideration
should be given to the fact that significant differences exist
between the groups with respect to correlations between mathe-
matics, natural science, and composite scores on the ACT and
grade-point average, indicating the tack of a single popula-
tion with respect to the use of the ACT for predictive purposes;
3. Latin subjects were more characterized by seriousness
of purpose, deliberation, persistent effort, and self control,
as measured by the restraint scale on the C-ZTS, than Anglo
subjects. This score was found to be significantly related
to academic achievement for all groups, with **«» significant
difference among the correlations, indicating a single popula-
tion with respect to its predictive value;
4. Anglo subjects were nor© characterized by a rapid pace
of activities, energy, quickness of action, and enthusiasm,
as measured by the general activity score on the G-ZTS. They
were also more characterised by leadership habits, being con-
spicuous, persuasiveness, and self defense, as measured by
the ascendance scale, and by being "thickskinned® as measured
by the objectivity scale. However, these variables were not
significantly related to grade-point average for any of the
groups;
5. Some trait scores on the G-ZTS for which no significant
ethnic differences were found were significantly related to

15
to academic achieveoient, Friendliness was found to be an
effective predictor for Anglo females only; thoughtfulness
was significantly related to achievement for alt subjects ex-
cept Anglo females. A negative correlation between the
sociability score and grade-point average was found for male
subjects. For these variables, the sex and ethnic groups for
which significant relationships were found nay be considered
as single populations with respect to the predictive value
of the scores. Masculinity scores were positively related
to academic achievement for Latin females and were negatively
related to achievement for Anglo males;
6. G-ZTS variables not related to academic achievement,
and for which no significant ethnic differences were found,
included emotional stability and personal relations; and
7. Anglo subjects were store adaptive, flexible, mature,
and democratic in their relations with other people, as
measured by scores on the IB, than Latin subjects* Scores
on the IB were significantly related to academic achievement
for Anglo subjects, with no difference between the relation*
ships for males and fenales*
Recommendations
In light of the results of the present investigation
and the lack of empirical evidence concerning ethnic differ*
ences with respect to variables related to academic success,
the following recommendations are presented}
76
1. Studies similar to the present investigation should be
wade in other college populations composed of Anglo and Latin
students;
2. Efforts should be made to detenatine whether differ-
ences exist between these ethnic group* with respect to
variables other than those included in the present study;
3* Follow-up studies should be nade of these or similar
subjects through the remainder of their college careers with
regard to ethnic differences and academic achievement j
4. Studies should be made regarding the relationships
between the variables under consideration in the present
study and success in separate majors and specific course
areas for these four sex and ethnic groups; and
5. The ethnic differences found in the present study
should be considered in counseling, curriculum planning, and
efforts to predict academic success fro© the Instruments used*
For example* differential norms should be used in counseling
and educational pro grans Modified to take into account group
differences. Cut-off scores wight be established on the
measures for each group in accord with the probabilities of
success»

APPENDIX
m INTEKPKETATIGW OF THE TRAITS OF TOE GUTUWQl TEMPtHAMBiT IHfilP"
Positive Qualities Negative Qualities
0 — General Activity
&apid pace of activities Energy; vitality Keeping in notion Production; efficiency
Liking for speed Hurrying Quickness of action Enthusiasm; liveliness
E -- Restraint
Serious -mindedness ©©liberate
Persistent effort Self-control
A — Ascendance
Self defease Leadership habits Speaking with indi-viduals
Speaking in public Persuading others feeing conspicuous Bluffing
S — Sociability
Having ®any friends and acquaintances
Slow and deliberate pace Fatigability Pausing for rest Low production; inefficlsn* cy
Liking for slow pace Taking time Slowness of action
Happy-go-lucky; carefree Impulsive tixcltsaent-loving
Submissiveness Habit® of following Hesitation to speaking
Hesitation to speaking
Avoiding conspicuousness
Having few friends and acquaintances
77

78
AM INTERPRETATION OP fill TRAITS OF TEMPERAMENT StfRffCT —
•ZlMMBMfti
mmm
Positive Qualities Negative Qualities
Entering into conversa-tions
Liking social activities Seeking social contact#
Seeking lisellght
1 — Emotional Stability
Evenness of moods, inter-ests, energy, etc.
Optimism; cheerfulness
Composure Feeling in good health
0 — Objectivity
Being "thickskinned"
f Friendliness
Toleration of hostile action
Acceptance of domination Respect for others
Thoughtfulness
Reflectiveness; medi* tativeness
Observing of behavior in others
Restraining iwm conversa-tions
Disliking social activities Avoiding social contacts Shyness Avoiding limelight
Fluctuation of taoods, interests, energy, etc.
Pessimism; gloominess Perseveration of Ideas and moods
Daydreaming Excitability Feeling in ill health Feelings of guilt, lone*
llness, or worry
Hypersensitivenees Egoism; self*centeredness Suspiciousness; fancying of hostility
Having ideas of reference Getting into trouble
Belligerence; readiness for fighting
Hostility! resentment Desire to dominate Resistance to domination Contempt for others
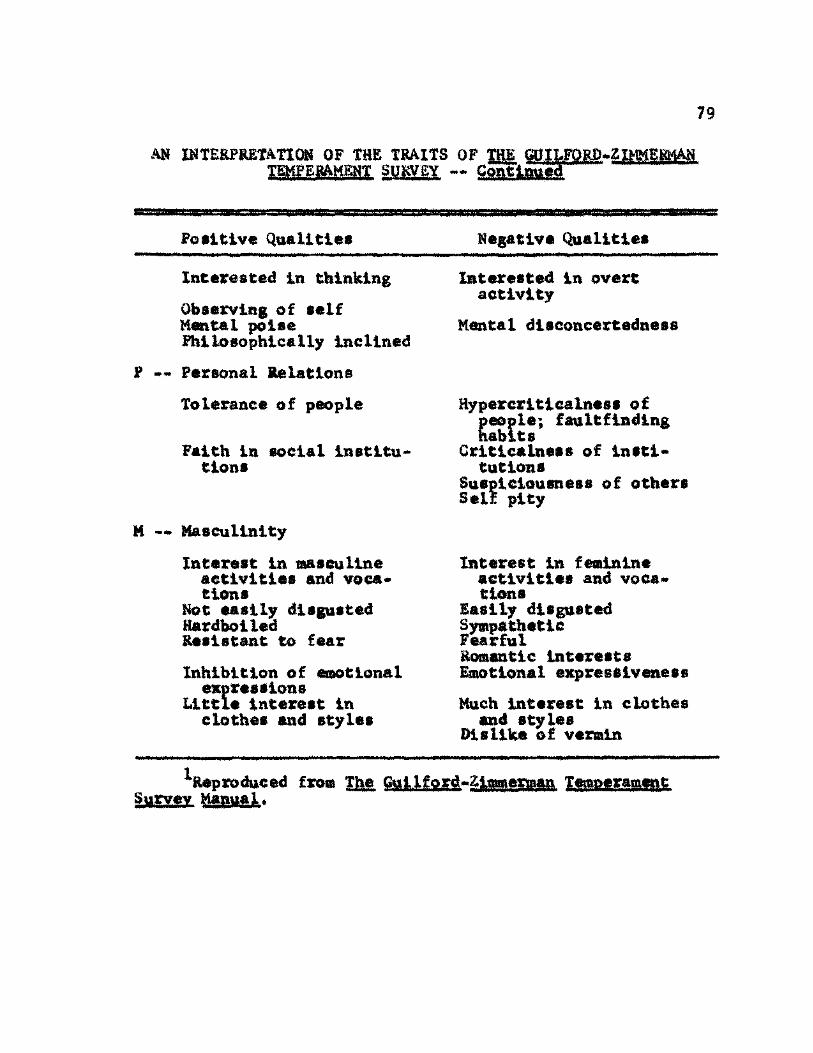
n m XHTEKPRETATXOM OF THE TRAITS OF THE GUILFORD-2
mzmmi mm. ~ smmW
Positive Qualities Negative Qualities
Interested la thinking
Observing of self Mental pals® Philosophically Inclined
F -- Personal Relations
Tolerance of people
Faith Ixi social Institu-tions
M *.» Masculinity
Interest In masculine activities and voca-tions
Hot easily disgusted Hardbolled Resistant to fear
Inhibition of emotional expressions
Little interest In clothes and styles
Interested In overt activity
Mental disconcertedness
Rypercrltlcalness of
Seople; faultfinding abits Crltlcalness of Instl* tutlons
Susplelousness of others »usp Self pity
Interest In feminine activities and voca-tions
Easily disgusted Sympathetic Fearful ioaantle Interests Imotlonal expressiveness
Much Interest In clothes and styles
Dislike of vermin
^Reproduced from Jhe Temperament
immLmmk*

80
LETTER TO ENGLISH. FACULTY
October 1, 1962
Dear English Faculty Member,
A study is being planned to explore some of the charac-teristics of our entering freshmen, The value of knowing store about our students is obvious. Preliminary plans have been discussed and approved by Dean Rhode and other faculty members concerned.
Approximately two hour® of each entering freshman* s time must be utilized in the collection of the data for this study. Since most of these students are enrolled in English 101, we are asking your cooperation in allowing tMse data to be col-lected during the times when these students normally attend English 101 classes on October 24, 23, and 26. These dates have been selected because some members of the English faculty have expressed a desire to attend parts of the Teatas Joint Coaalttee for High School and College English to be held on the campus on October 26*
Although you will not be asked to help collect the data, you will be asked to announce to your students where they are to report at their regular class periods on these days. This infottaation will be sent to you prior to October 24. This advance notice is being given in hopes that you can adjust your course plans so that this study will cause a minimum of interruption of your classes.
Thank you for your cooperation.
Sincerely,
G. £. Vaugban Study Coordinator
&. J. Callaway Chairman, English Department

81
FOLLOW-UP LETTER TO ENGLISH FACULTY
October 18, 1962
Dtar English Faculty Meaber,
Flans are continuing for the study of entering f resbaen described in the letter sent to you on October I, The date will be collected at the students* regular English 101 class tines on October 24, 25, and 26, Would you ©lease «ake the following announcsaent to your English 101 classes on Monday and Tuesday, October 22 and 23t
•In cooperation with the Office of Student Personnel Services, a study is being made of some of the characteris-tics of A & X students* This study will provide information which will help the college to provide better educational services to the students* Students enrolled in English 10I during the fall seoeater, 1962, have been selected to begin this study, tour cooperation in this study will help to iro-prove your college,.
All student® enrolled in Saglish 101 classes should re-port to Room A-116 (main academic building) at their regular class periods m ffedaeaday, Thursday, and Friday, October 24. 25, and 26* Fleese be as prompt as possible, since the entire period wilt be needed to secure the needed informa-tion . flease bring a pencil with you**'
It is suggested that an announcement be made that room cheek will be taken each day in order to encourage full attendance* Thank you again for your cooperation*
Sincerely,
G, .£• Vaughan Study Coordinator
R, <J. Gallaway Chairman, English Department

82
PERSONAL DATA SHEET
English 101 Section. Hi
'Last'" &eit
0a te
First
Marital s tatus} I S T O T
A&e M or
College address flow® address
Giri
Father*s f u l l name Mother's maiden. name. Father1® occupation.,. Place of b i r th
re te one .Telephone, JCe lephone.
. jffotherU occupation.
.High school Off ices held l a high school Act iv i t ies
Athle t ics , Band,'Choir,' etc#
S k i l l s : Musical Xnstruaent Typing Shorthand wpm wpm
Other
Languages spoken: 1.. 'Work experience: Years f u l l time f ea r s par t time. Type of work KeLtgious a f f i l i a t i o n . Expected major
preference., Minor
High school average A A- y j L i t J t c i r c l e one
C C- IN* D
Rank in graduating c lass : Quarter 1st 2nd c i r c l e one
Do you have access to a car a t college? Hake Model
I r l M*>,
K«sb«r of semester hours - current reg is t ra t ion . Total number of semester hours completed Bate of f i r s t enrollment a t A & I .

83
INSTRUCTIONS FOE EXAKIHEfiS
Wednesd&y
Distribute answer sheets as students eater, Try to seat nil stttdaati where they will have a relatively sseoth surface on which to write. As soon as students are seated, write the following announcement:
"You have been selected to contribute Information to a study of A & I students. You will he asked to answer some questions about yourself and to Indicate your answers on the answer sheet which has been given to you*
4s you finish, you may turn in your questions and answer sheet end leave quietly. If you do not finish and do not have a class following this one, you may stay and finish* If you do have another class, you should come bach to this room later today to complete your answers . Check to be sure you have answered all questions before turning in your papers•
Fill in the blanks on your answer sheet, Where it says, •your group.1 write your major* If undecided, write 1 liberal arts.1 Following this, write in your section of English 101.
Your answers will be kept confidential and no individual student*s answers will be studied separately, so please fee as truthful as possible in answering the questions.n
Announce to the Wednesday groups that they should report again promptly to the same room at the same time on Friday*
Pass out test booklets. Eead instructions, Including •You should indicate your answer by blackening the space between the dotted lines above your answer* lo not write on the question sheet. "
Friday
Distribute answer sheets and seat as before. Then read this announcements
"You will be given some more questions to answer, simi-lar to the ones you answered Wednesday. Today, you are to indicate your answers by circling the number ©a the answer sheet which corresponds to your choice of answer, according to the key at the top of the information sheet.
Fill in the information at the top of the answer sheet.' Be sure to include your section of English 101.

84
torn can answer all the questions tiuth fully sine* TO student's answers will be studied individually and your answer® will be kept strictly confidential, when you have finished, cheek to see that you have answered every question. When you turn in your papers, you will be given a brief per-sonal data sheet• Please fill in all blanks and return It to the desk. When you have finished the data sheet, you may leave quietly
Remind students that they should remain or return to the ram later if they fail to finish before the end of the period. fats out the inventory. Head the instructions, k»k students to raise their hands if they have any questions.
Thursday
©istribute both answer sheets as students enter the room. Try to seat ail students where they will have a relatively smooth surface on which to write* 4s soon as students are seated, sake the following announcement i
"You have been selected to contribute info neation to a study of A & I students. You will be asked to answer some questions about yourself and to indicate your answers on the answer sheets which have been given to you.
When you finish, check to see that you have answered every question. When you turn in your papers. you will be
fiven a brief personal data sheet. Please fill in all the lanks and return it to the desk. When you have finished the data sheet you may leave quietly.
If you do not finish and do not have a class following this one, you may stay and finish. If you do have another class, you should come back to this room later today to complete your answers*
Fill in the blanks at the top of your first answer sheet. Where it says, •your group* write your major. Xf undecided, write 'liberal arts.* Following this, write in your section of English 101. Fill in the infotmation at the top of your second answer sheet. le sure to include your section of English 101.
Your answers will be kept confidential and no individual student*s answers will be studied separately, so please be as truthful as possible in answering the questions."
Pass out both test booklets. Read the instructions for the 6-ZTS, including "You should indicate your answer

85
by blackening the space between the dotted lines abov© your answer. Do not write on the question sheet." Read the instructions for the inventory, including "tou will indicate your answers by circling the mmber on the answer sheet which corresponds to your choice of answer, according to the key at the top of the question sheet."
Suggest that students do the G-ZTS first, as it is more time consuming than the IS, Ask students to raise their hands if they have any questions.

BIBLIOGRAPHY
Books
Barnhard, Clarence L., e d i t o r t a f f U f E MliSt M w York, Harper and Brothers, 1953.
Buros. Oscar K., the Fifth Mental Measurements Yearbook. High-land Park, Maw Jersey, TEeerypmrreis/ 1959.
Ctertle, Jsck K., Social Psychology. New York, McGraw-Hill, Inc., I960,
Pawl L, and Mayhew. Lewis |,f Several Educations m U m & M Washington, i>. c., Aaeriean S*Jiu 1>- OJll #
Hilgavd, Ernest E»# Theories of Learning. Hew York, Applaton-Century-Gsofts, Inc., Iwb.
Gardiner, Abrm, gsy^lygicf^ F^n|lg?s qg M m York, ColsusblaJniverslty Press, 1945.
Mar4««» 2*ajrl«® F>> tttortityrto. Iiffliiit »•* tork, American Book Company, If517
Mdtasiar. JlilllllSi# New York, John Wiley and Sons, Inc., 1953.
McWiiliaas, Carey, Worth f ro . Mexico. Fhlladeiphia, Pennsylvania, J. B, Lippincott Company, W 9 ,
Elder, Paul , Jfeitoffl, York, John Wiley and Sons, Inc., 1939.
falbert, Robert: H., Spanish-Magus People in j|y| Southwest and West. Fort Worth, XexasT^e J ^ e y ^ b S ^ y ^ K S S .
Taylor, Paul s Aat American-Mexican frontier. Chapel mil, North Cai^tlna,^£v^t^of%r^TOoii»a frees, 1932.
Itotik, fetth* With Xht. Fists t Measlcan<»a»ar.lcana in £ SffiT ?J«w York, Harcourt, Brace, andTfompany,
86

Articles ^
Bendig, A. W, and Spragu#, J, L», "IM. s Prediction of Achievement Level and Achievement Fluc-tuation in Introductory Psychology," JffplLtil iltllm Psvehology. JOCmXX (December, I W ) , 409-413.
Centi, Paul. "Personality Factors Belated to College Success," Icmmal *£ Educational Research. I* (aecesiber, 1961), 187-188.
Coleman, William and Collett, Dorothy, wBevelojM»«ajit and Application of Structural Tests of Personatity» IfylfiM
3CEIX ( #
lei at, Paul, "The Entering College Student - Background tod Characteristics#" Review &£, Educational jfffftttfl.* *** (I960), 285-297.
Holland, John L.t "Prediction of College Grades f*»n the • 8lSSSiil fepWff, and the |sMl&s£l£
Humphreys, N. D.. "The Stereotype and the Social Types of mltcrn iteteriean Youths ,« J m m k ®t M i l m i (August, 1943), 69-78.
Jones, Robert C., "Ethnic Family Patternst The Mexican Family in the United States." American faUMk S& Sociology* LXXX (May, 1948), 49IM32*
Juola, Arvo E., "Predictive Validity of five College-Level Academic Aptitude Tests at one Institution." Pfrjwnnel and Guidance Journal. X X m i X (April, W m } $ §37*6*1.
and
Kosa, John, iachiele, L. D., and Schommer, C. 0., "Psycho-logical Characteristics of Ethnic Croups in a College Fojouttm,- iaimsl ai Emiialaxt. *«•»* <oct»b«, ftss), 26S47S*
Lanier, William J., "Predictive Value of Selected Personality and Collage Adjustment Instruments Used With the ACT Program.w Sfcrdue University, DUssertat^ Abstract?, XXXIX (1963), number 7, 2424,
Lehmann. Itvin J#, "Critical Thinking Ability, Attitudes, and Values Among College Students," Journal of Teacher Education. XXIX (December, 1962), 376-3837

88
M M (Iov©mher, 19S&)»
Erotf _ _ iyr
Ci966} » 141-147 •"* ^ ~~ ""
Stillwell. Hart#. *Sh« fetbacfe Tide," Canncm Ground* IX (Sinner, 1949}, 2Mf« .
Winter. William 1*. "Student Taiuas and Grades in ®%mml journal s£ Muoational Magagoh,
1962}» 351-531. VltbmmooB* m i and M. IS. Melfcerg, "Helatioaship Between
Grade«2oint Average and Sectional Scores lad® on the Gullford-Zisaaenaan Temperament g^ey," Muoational and lESHSESi*. ® (1959;* W-&Y4.
Unpublished Material#
Relationship Between ACT Composite Score© and freshman Tear Grade foist Average by Area of Concentration, Fall and Spring Semester®, 1961-1162. aiia ographed bulletin, Texas College of Art® and Industries, Xingsville, Texas, 19$2 t
Simons, ©Mie §•, "Anglo-Americans and lexican^teericans in South fexasi A Study in Soainant-Subordiiiate Group Eolations," unpublished doctoral dissertation, Department
Education, larvard University, Cambridge, Massachusetts, of 1952.
,Hanmls and Booklets
ACf loimf Booklet, form |O0f Iowa City, Iowat Merioan College — '5 0 jjgg Jjp@|||2* *. 31 $*#$82 •
American College Testing Program* AOf $®ohniff1 Bftporfc. Chicago, Illinois, Science Research Associate®,
Guilford, jr., f* and W. 8# Zimaewaan
nar y if 49*
xieS@rI; r U S ; i l l i S , iiL&n^iu^ly
if Beliefs* Washington, "" • '

89
Publications ©f Learned Organizations
Wtaaaam, Ixvin J., *Tha Relationship Between Scholastic Par* foraance and Critical Thinking, Attitudes, and Values»« Mational Council on. Measurement Used in Education. M S t a ^ g ^ ^ e k . ^ a E i n ^ n 7 l 7 IlSo! 83^2.