ifgl refractories ltd
TRANSCRIPT
IFGL Refractories Limited(Formerly IFGL Exports Limited)
Investor PresentationFebruary 2019
This presentation and the accompanying slides (the “Presentation”), has been prepared by IFGL Refractories Limited, solely forinformation purposes and do not constitute any offer, recommendation or invitation to purchase or subscribe for any securities,and shall not form the basis or be relied on in connection with any contract or binding commitment whatsoever.
This Presentation has been prepared by the Company based on information and data which the Company considers reliable, butthe Company makes no representation or warranty, express or implied, whatsoever, and no reliance shall be placed on, thetruth, accuracy, completeness, fairness and reasonableness of the contents of this Presentation. This Presentation may not beall inclusive and may not contain all of the information that you may consider material. Any liability in respect of the contentsof, or any omission from, this Presentation is expressly excluded.
Certain matters discussed in this Presentation may contain statements regarding the Company’s market opportunity andbusiness prospects that are individually and collectively forward-looking statements. Such forward-looking statements are notguarantees of future performance and are subject to known and unknown risks, uncertainties and assumptions that are difficultto predict. These risks and uncertainties include, but are not limited to, the performance of the Indian economy and of theeconomies of various international markets, the performance of the refractories industry in India and world-wide, competition,the company’s ability to successfully implement its strategy, the Company’s future levels of growth and expansion,technological implementation, changes and advancements, changes in revenue, income or cash flows, the Company’s marketpreferences and its exposure to market risks, as well as other risks. The Company’s actual results, levels of activity, performanceor achievements could differ materially and adversely from results expressed in or implied by this Presentation. The Companyassumes no obligation to update any forward-looking information contained in this Presentation.
Safe Harbor
2

Industry Overview
4
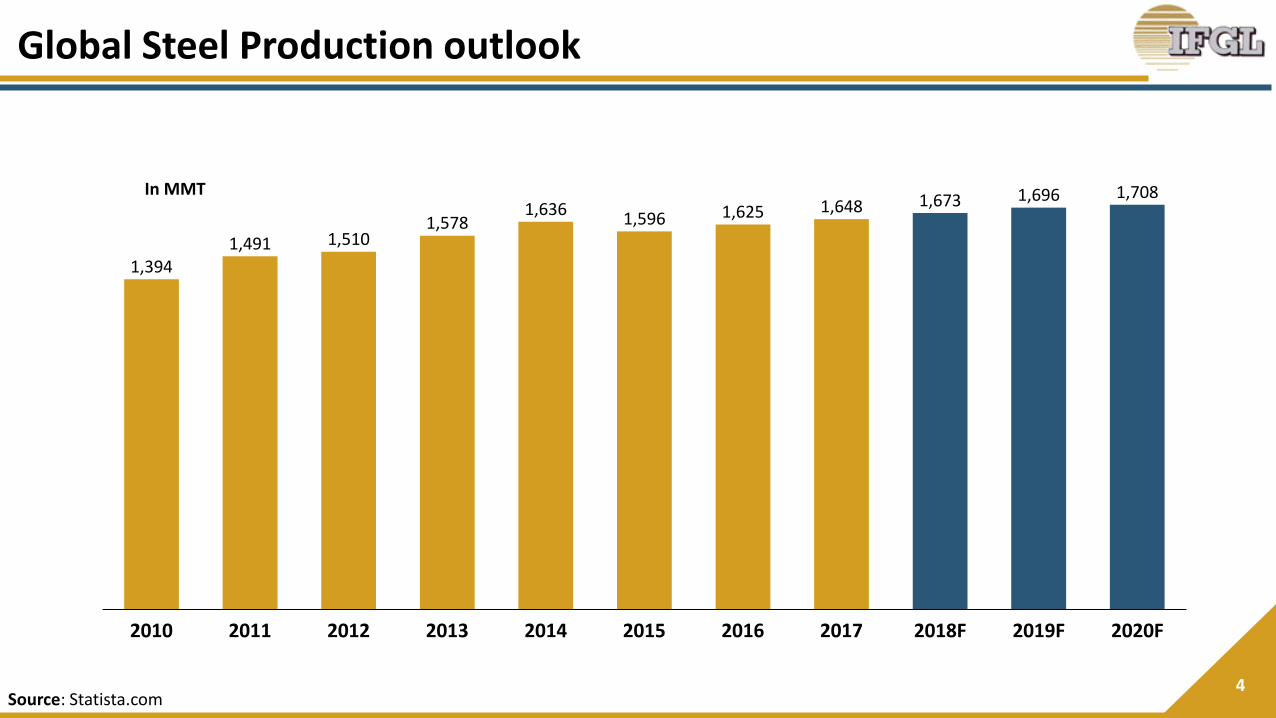
Global Steel Production outlook
1,3941,491 1,510
1,5781,636
1,596 1,625 1,648 1,673 1,696 1,708
2016 20172010 2011 20152012 2013 2019F2018F2014 2020F
In MMT
Source: Statista.com
5
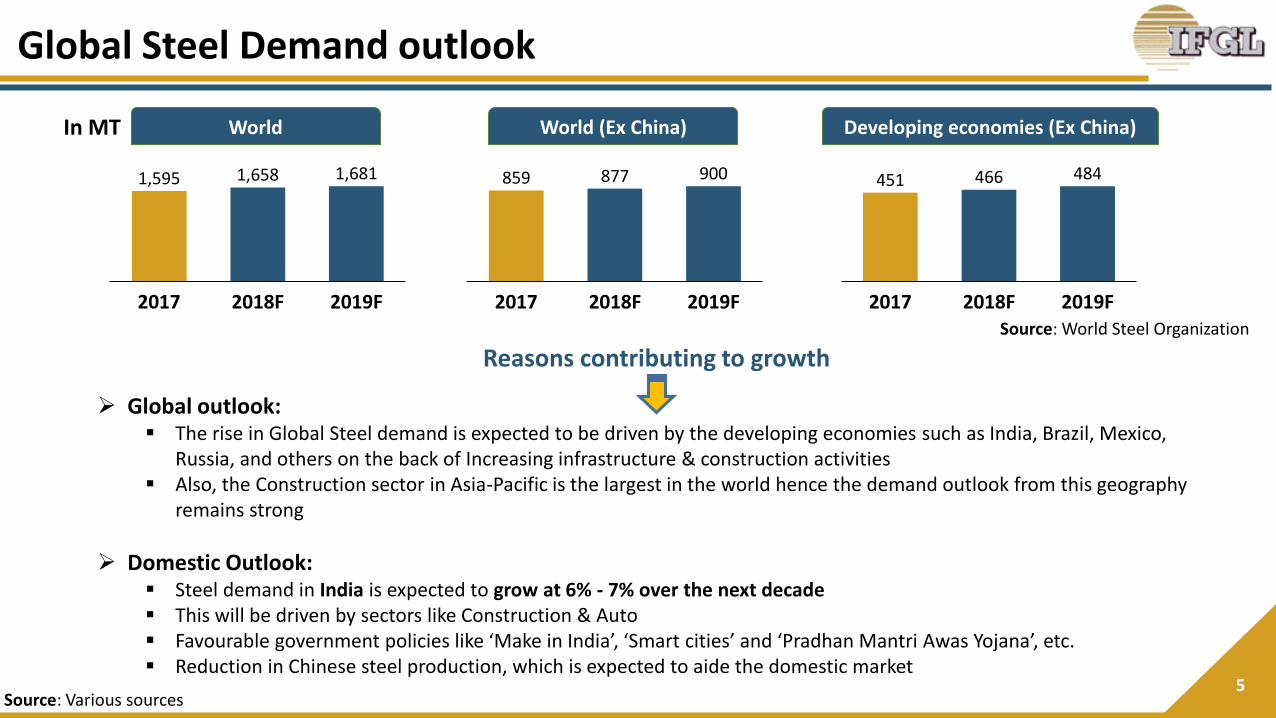
1,595 1,658 1,681
2017 2018F 2019F
➢ Global outlook:▪ The rise in Global Steel demand is expected to be driven by the developing economies such as India, Brazil, Mexico,
Russia, and others on the back of Increasing infrastructure & construction activities▪ Also, the Construction sector in Asia-Pacific is the largest in the world hence the demand outlook from this geography
remains strong
➢ Domestic Outlook:▪ Steel demand in India is expected to grow at 6% - 7% over the next decade▪ This will be driven by sectors like Construction & Auto▪ Favourable government policies like ‘Make in India’, ‘Smart cities’ and ‘Pradhan Mantri Awas Yojana’, etc.▪ Reduction in Chinese steel production, which is expected to aide the domestic market
Reasons contributing to growth
Source: Various sources
859 877 900
2017 2019F2018F
451 466 484
2017 2018F 2019F
World World (Ex China) Developing economies (Ex China)
Source: World Steel Organization
In MT
Global Steel Demand outlook
6
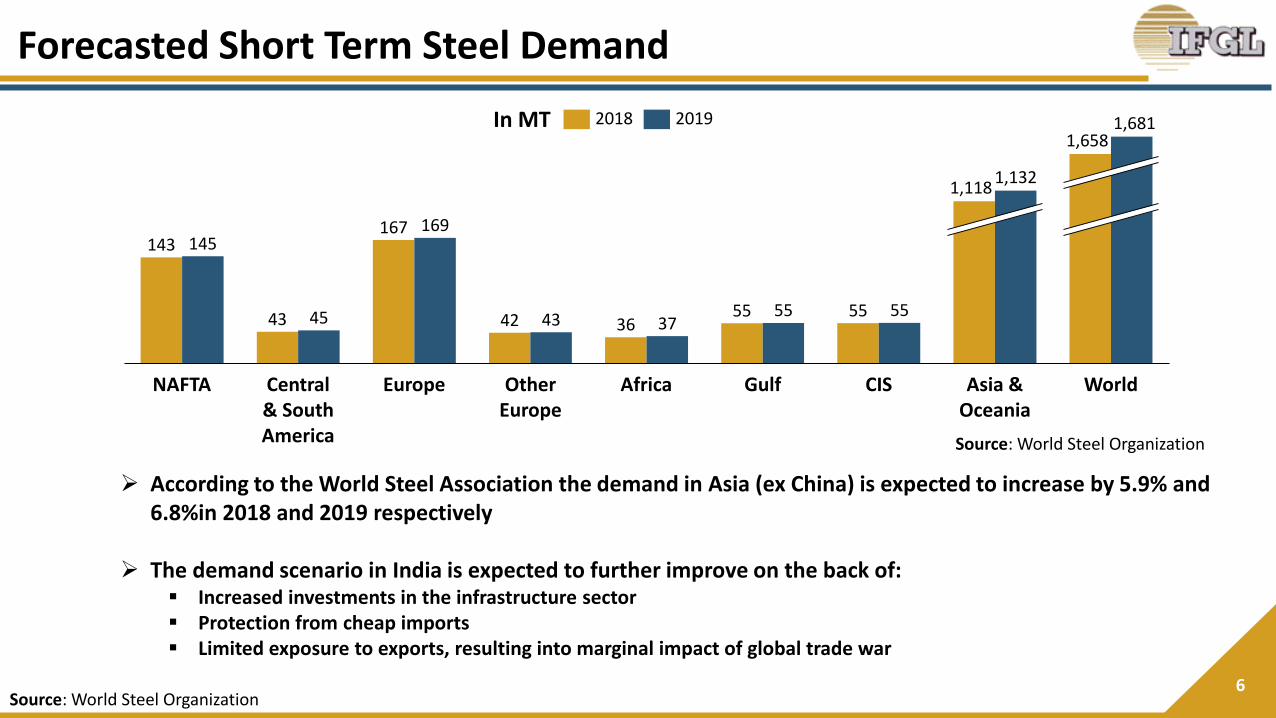
143
43
167
42 3655 55
145
45
169
43 3755 55
GulfAfricaNAFTA Central & South America
Europe Other Europe
CIS Asia & Oceania
World
1,1181,132
1,6581,6812018 2019
Source: World Steel Organization
➢ According to the World Steel Association the demand in Asia (ex China) is expected to increase by 5.9% and6.8%in 2018 and 2019 respectively
➢ The demand scenario in India is expected to further improve on the back of:▪ Increased investments in the infrastructure sector▪ Protection from cheap imports▪ Limited exposure to exports, resulting into marginal impact of global trade war
Source: World Steel Organization
In MT
Forecasted Short Term Steel Demand
7
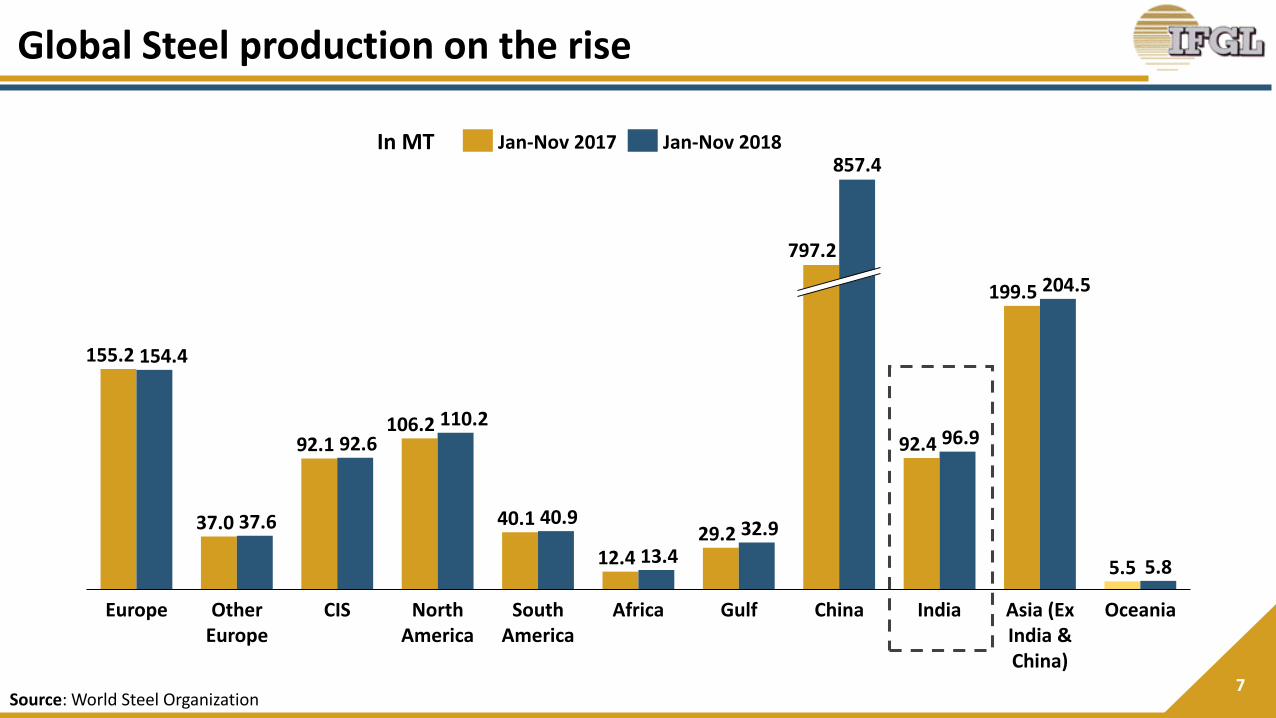
155.2
37.0
92.1106.2
40.1
12.429.2
92.4
199.5
5.5
154.4
37.6
92.6110.2
40.9
13.4
32.9
96.9
204.5
5.8
Other Europe
IndiaEurope South America
North America
CIS Africa OceaniaGulf
797.2
China
857.4
Asia (Ex India & China)
Jan-Nov 2017 Jan-Nov 2018
Source: World Steel Organization
In MT
Global Steel production on the rise
8
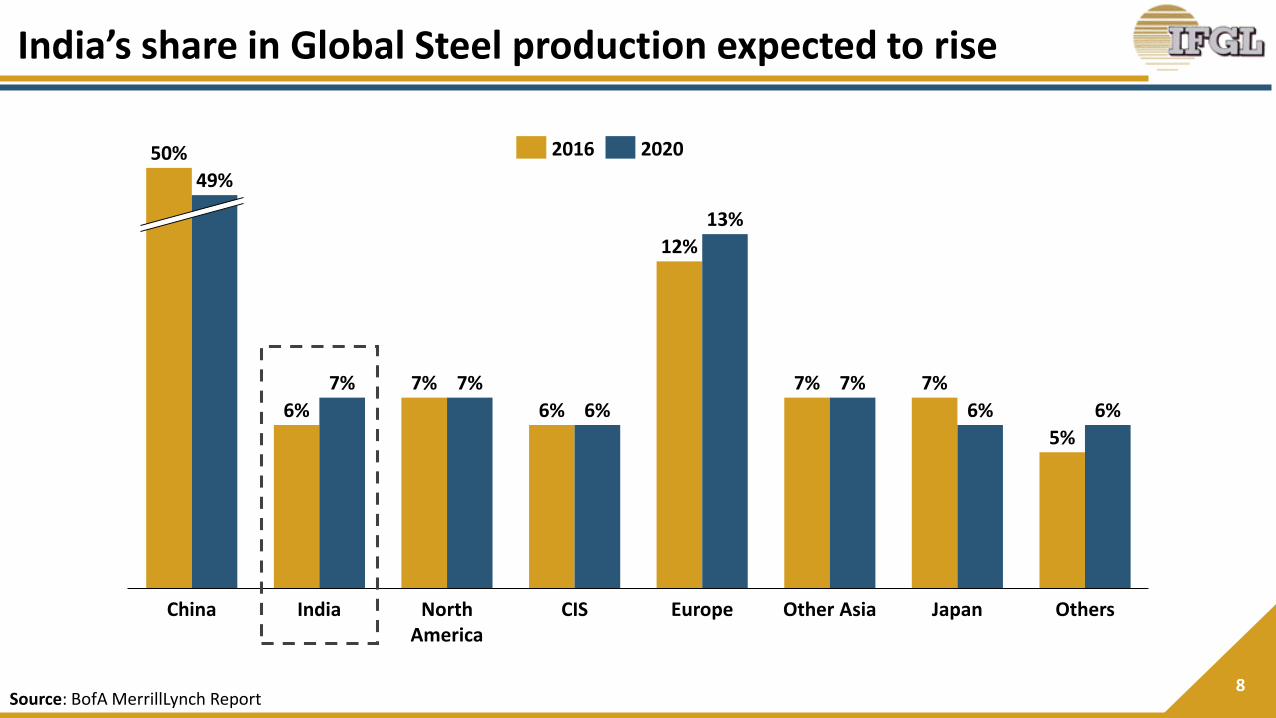
7%
North America
IndiaChina CIS Europe
6%
Other Asia
7%
Japan Others
50%
49%
6%
7% 7%
13%
6%
5%
6%
12%
7% 7%
6%
20202016
Source: BofA MerrillLynch Report
India’s share in Global Steel production expected to rise
9Source: Indian Brand Equity Foundation, Business Standard
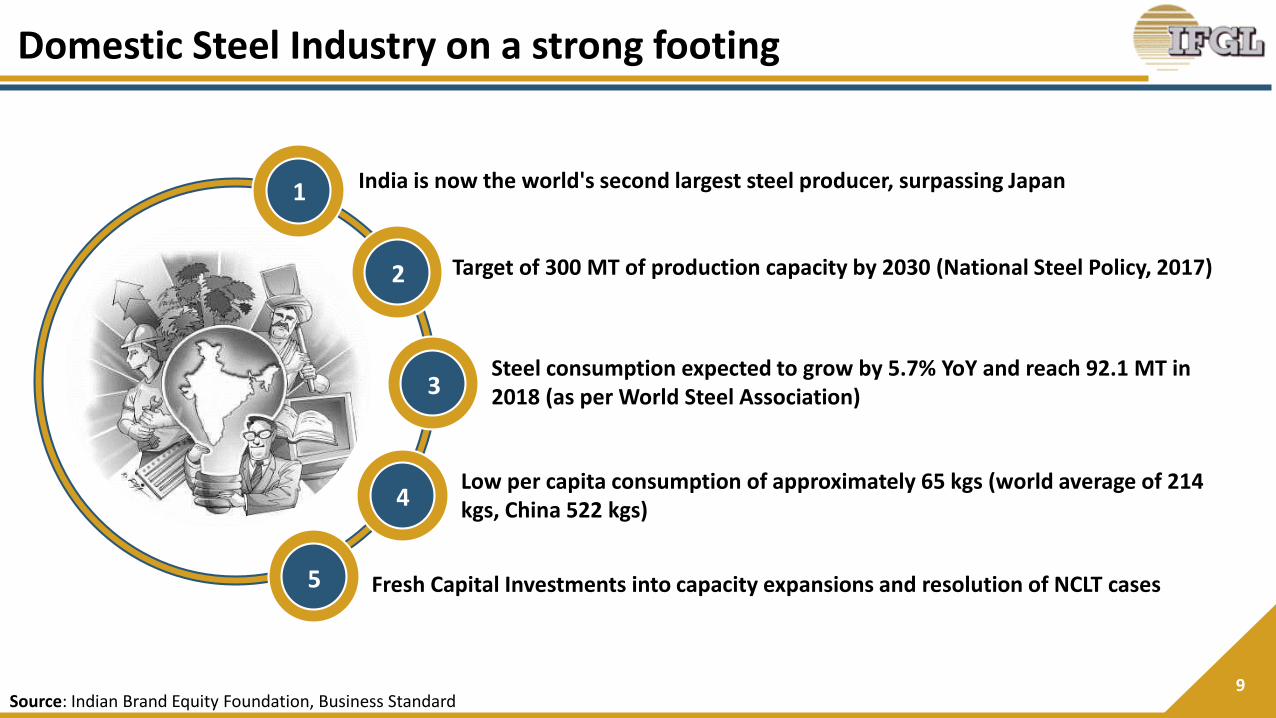
India is now the world's second largest steel producer, surpassing Japan
Target of 300 MT of production capacity by 2030 (National Steel Policy, 2017)
Steel consumption expected to grow by 5.7% YoY and reach 92.1 MT in 2018 (as per World Steel Association)
Low per capita consumption of approximately 65 kgs (world average of 214 kgs, China 522 kgs)
Fresh Capital Investments into capacity expansions and resolution of NCLT cases
1
2
3
4
5
Domestic Steel Industry on a strong footing
10
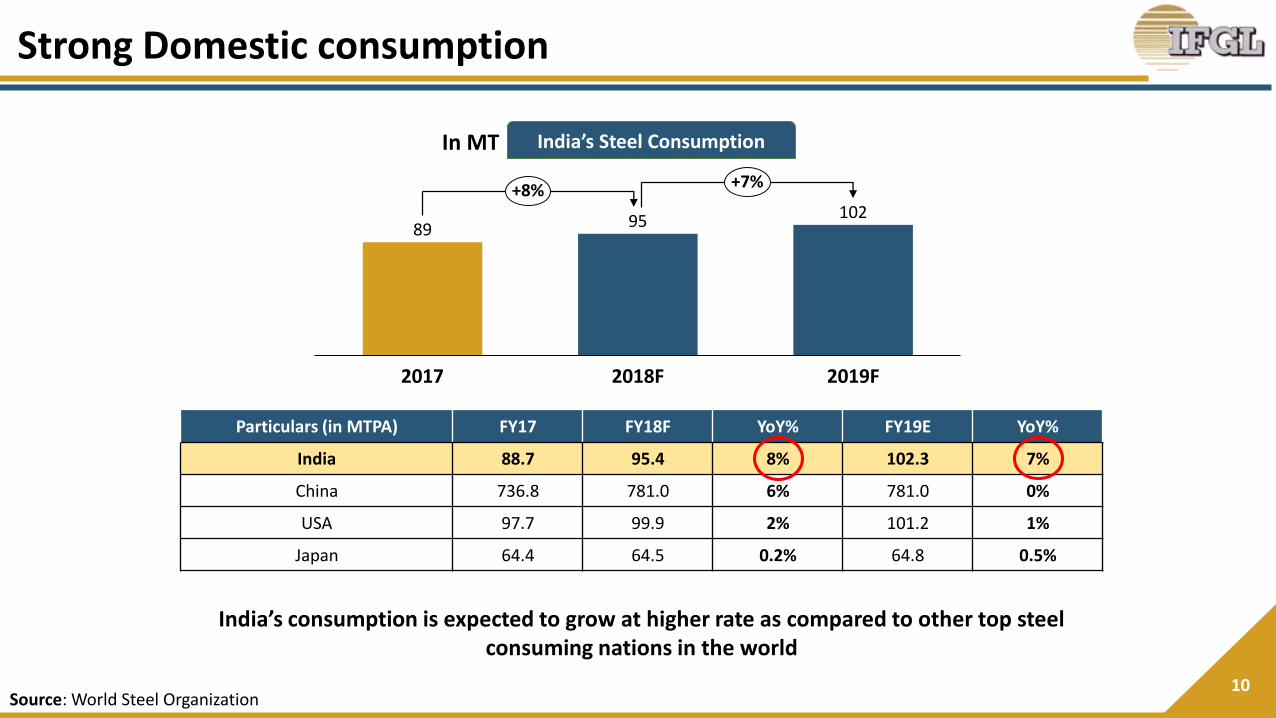
89 95 102
2017 2018F 2019F
+8% +7%
In MT
Particulars (in MTPA) FY17 FY18F YoY% FY19E YoY%
India 88.7 95.4 8% 102.3 7%
China 736.8 781.0 6% 781.0 0%
USA 97.7 99.9 2% 101.2 1%
Japan 64.4 64.5 0.2% 64.8 0.5%
Source: World Steel Organization
India’s Steel Consumption
India’s consumption is expected to grow at higher rate as compared to other top steel consuming nations in the world
Strong Domestic consumption
11
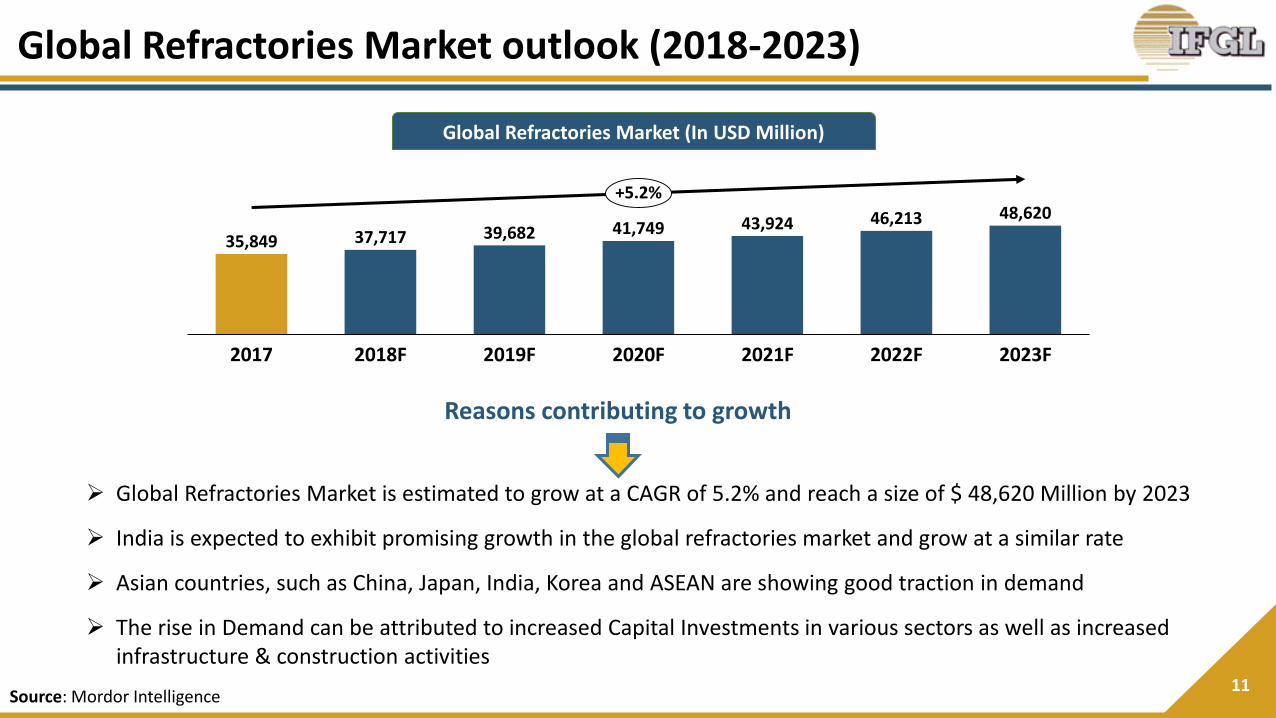
35,849 37,717 39,682 41,749 43,924 46,213 48,620
2017 2023F2021F2018F 2019F 2020F 2022F
+5.2%
Global Refractories Market (In USD Million)
Source: Mordor Intelligence
➢ Global Refractories Market is estimated to grow at a CAGR of 5.2% and reach a size of $ 48,620 Million by 2023
➢ India is expected to exhibit promising growth in the global refractories market and grow at a similar rate
➢ Asian countries, such as China, Japan, India, Korea and ASEAN are showing good traction in demand
➢ The rise in Demand can be attributed to increased Capital Investments in various sectors as well as increasedinfrastructure & construction activities
Reasons contributing to growth
Global Refractories Market outlook (2018-2023)

Our Performance
13
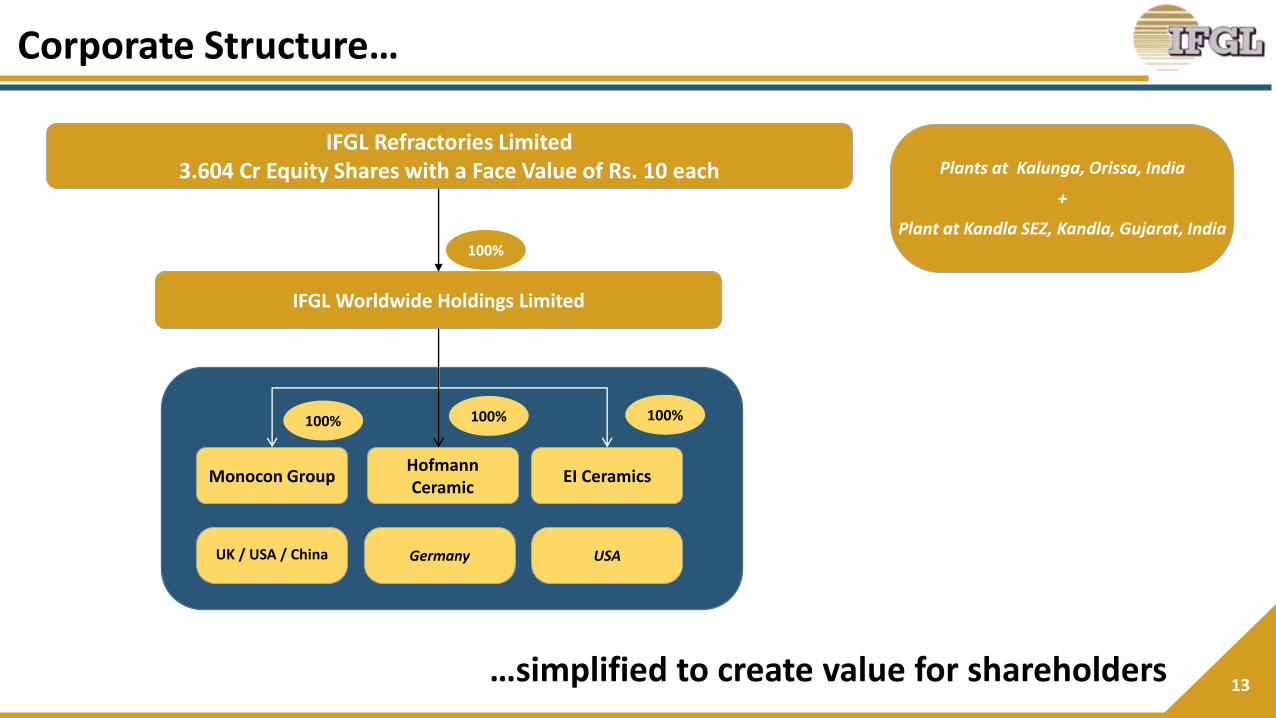
Plants at Kalunga, Orissa, India
+
Plant at Kandla SEZ, Kandla, Gujarat, India
…simplified to create value for shareholders
IFGL Refractories Limited3.604 Cr Equity Shares with a Face Value of Rs. 10 each
Monocon GroupHofmannCeramic
EI Ceramics
IFGL Worldwide Holdings Limited
100%
USAGermanyUK / USA / China
100% 100% 100%
Corporate Structure…
14
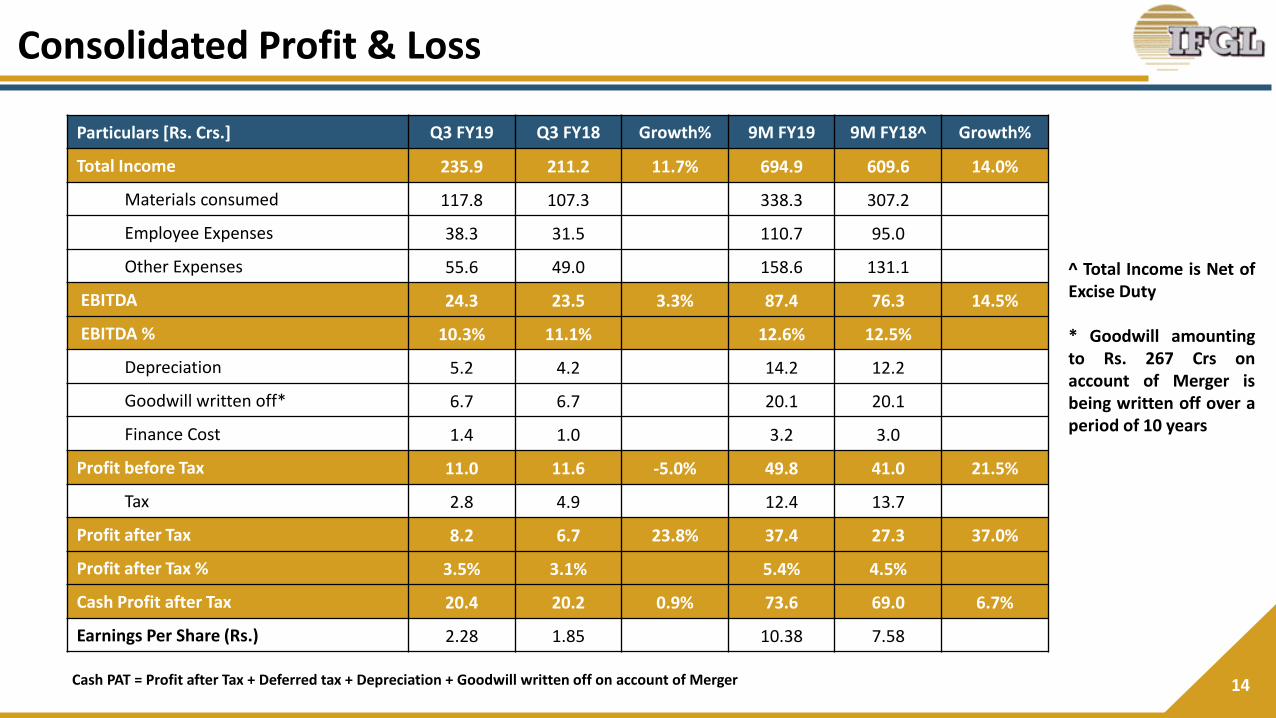
Particulars [Rs. Crs.] Q3 FY19 Q3 FY18 Growth% 9M FY19 9M FY18^ Growth%
Total Income 235.9 211.2 11.7% 694.9 609.6 14.0%
Materials consumed 117.8 107.3 338.3 307.2
Employee Expenses 38.3 31.5 110.7 95.0
Other Expenses 55.6 49.0 158.6 131.1
EBITDA 24.3 23.5 3.3% 87.4 76.3 14.5%
EBITDA % 10.3% 11.1% 12.6% 12.5%
Depreciation 5.2 4.2 14.2 12.2
Goodwill written off* 6.7 6.7 20.1 20.1
Finance Cost 1.4 1.0 3.2 3.0
Profit before Tax 11.0 11.6 -5.0% 49.8 41.0 21.5%
Tax 2.8 4.9 12.4 13.7
Profit after Tax 8.2 6.7 23.8% 37.4 27.3 37.0%
Profit after Tax % 3.5% 3.1% 5.4% 4.5%
Cash Profit after Tax 20.4 20.2 0.9% 73.6 69.0 6.7%
Earnings Per Share (Rs.) 2.28 1.85 10.38 7.58
^ Total Income is Net ofExcise Duty
* Goodwill amountingto Rs. 267 Crs onaccount of Merger isbeing written off over aperiod of 10 years
Consolidated Profit & Loss
Cash PAT = Profit after Tax + Deferred tax + Depreciation + Goodwill written off on account of Merger

15
Particulars in Rs. Crs. Sep-18 Mar-18
Assets
Non current Assets 497 493
Fixed Assets
Property Plant & Equipment 125 122
Capital WIP 11 8
Goodwill 120 122
Other Intangible assets 217 217
Financial Assets
Investments 1 1
Others 2 2
Tax Assets (Net) 13 10
Other Non current Assets 9 11
Current Assets 543 506
Inventories 155 108
Financial Assets
Investments 32 13
Trade Receivables 253 285
Cash & cash equivalents 78 74
Bank Balances 9 7
Other Financial Assets 2 2
Other Current Assets 15 17
Total Assets 1,040 999
Particulars in Rs. Crs Sep-18 Mar-18
Equity & Liabilities
Equity 790 752
Share Capital 36 36
Other Equity 754 716
Non Current Liabilities 29 24
Financial Liabilities – Borrowings 19 21
Provisions 0 0
Deferred Tax Liabilities (Net) 10 3
Current Liabilities 220 223
Financial Liabilities
Borrowings 79 86
Trade Payables 130 125
Other Financial Labilities 10 10
Other Current Liabilities 1 1
Provisions 0 1
Total Equity & Liabilities 1,040 999
Consolidated Balance Sheet
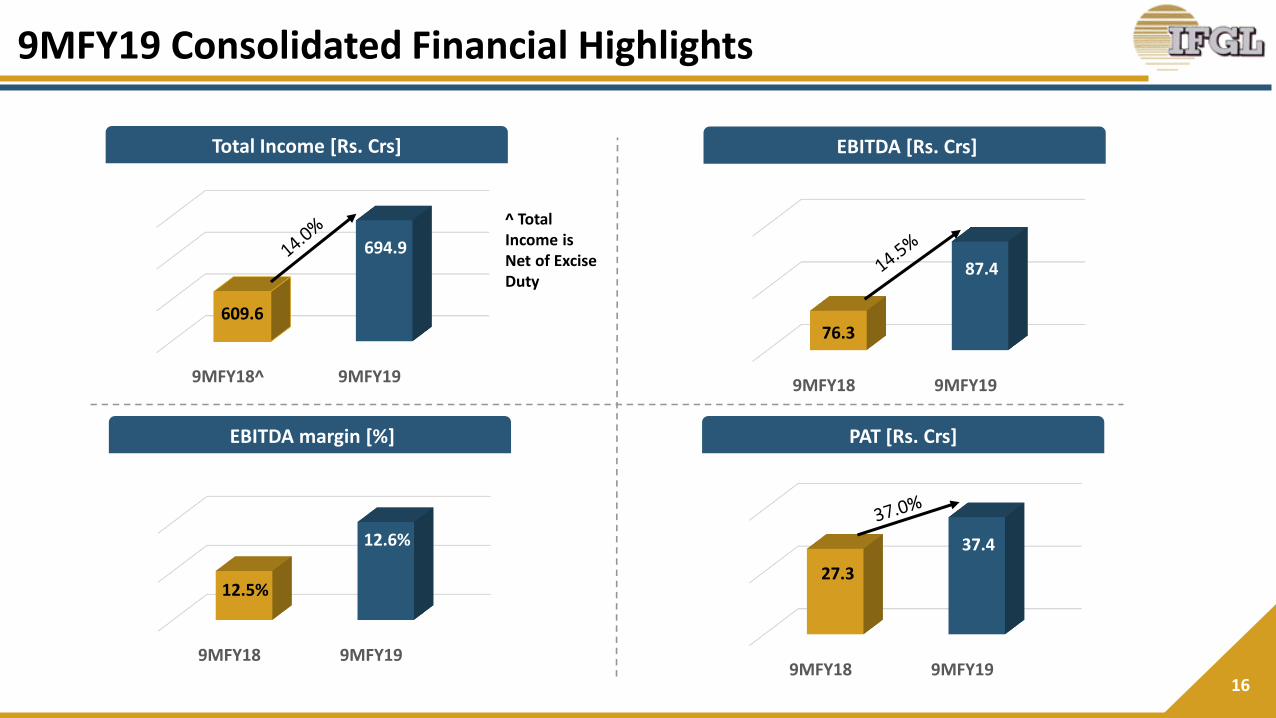
9MFY18^ 9MFY19
609.6
694.9
9MFY18 9MFY19
27.3
37.4
9MFY18 9MFY19
76.3
87.4
16
Total Income [Rs. Crs] EBITDA [Rs. Crs]
EBITDA margin [%] PAT [Rs. Crs]
^ Total Income is Net of Excise Duty
9MFY18 9MFY19
12.5%
12.6%
9MFY19 Consolidated Financial Highlights

9MFY18^ 9MFY19
321.7
352.1
9MFY18 9MFY19
12.9
18.4
9MFY18 9MFY19
52.2
57.0
17
Total Income [Rs. Crs] EBITDA [Rs. Crs]
EBITDA margin [%] PAT [Rs. Crs]
^ Total Income is Net of Excise Duty
9MFY18 9MFY19
16.2% 16.2%
9MFY19 Standalone Financial Highlights

18
EI Ceramics [$ mn]
Hofmann Ceramic [Euro mn]
Monocon Group [GBP mn]
1.5 1.71.0 1.2
9MFY18 9MFY19
18.9
21.6
Revenue
EBITDA
PAT
0.0
0.0-0.2
-0.3
9MFY18 9MFY19
7.3
7.7
1.92.3
1.11.7
9MFY199MFY18
12.5
14.9
Subsidiaries Performance
19
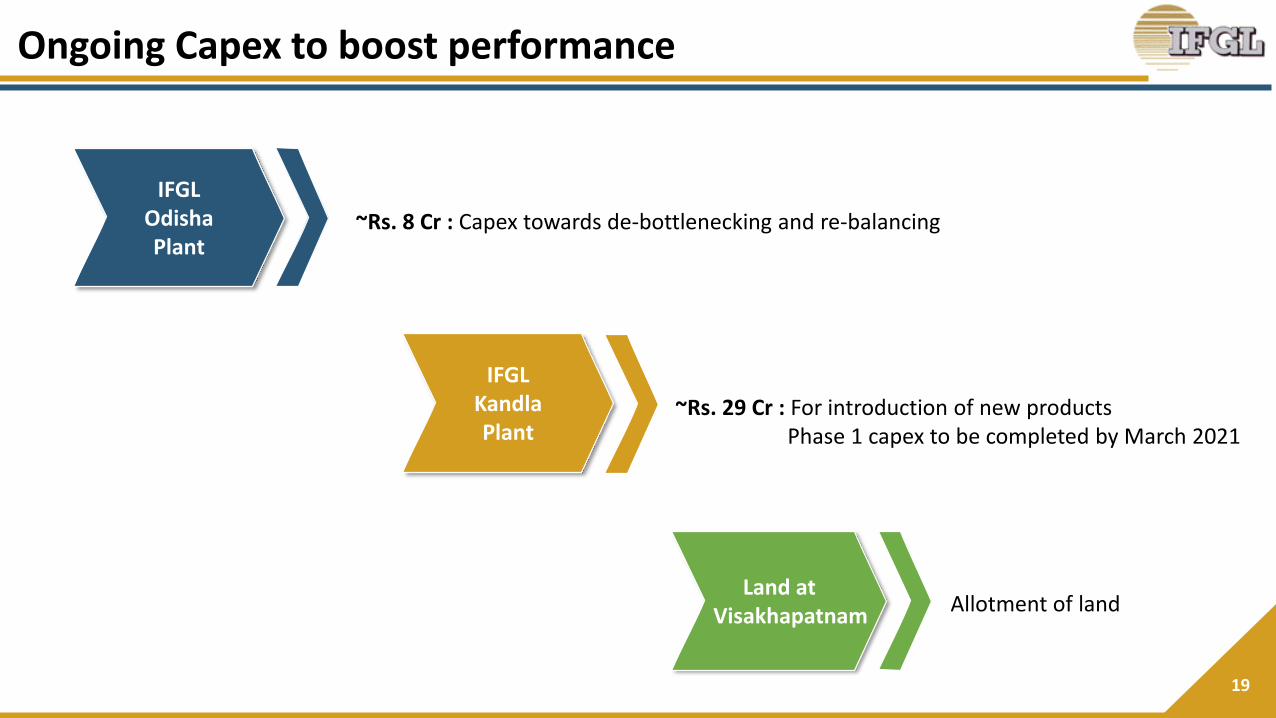
Land atVisakhapatnam
IFGLOdisha Plant
IFGLKandlaPlant
Allotment of land
~Rs. 8 Cr : Capex towards de-bottlenecking and re-balancing
~Rs. 29 Cr : For introduction of new productsPhase 1 capex to be completed by March 2021
Ongoing Capex to boost performance
20
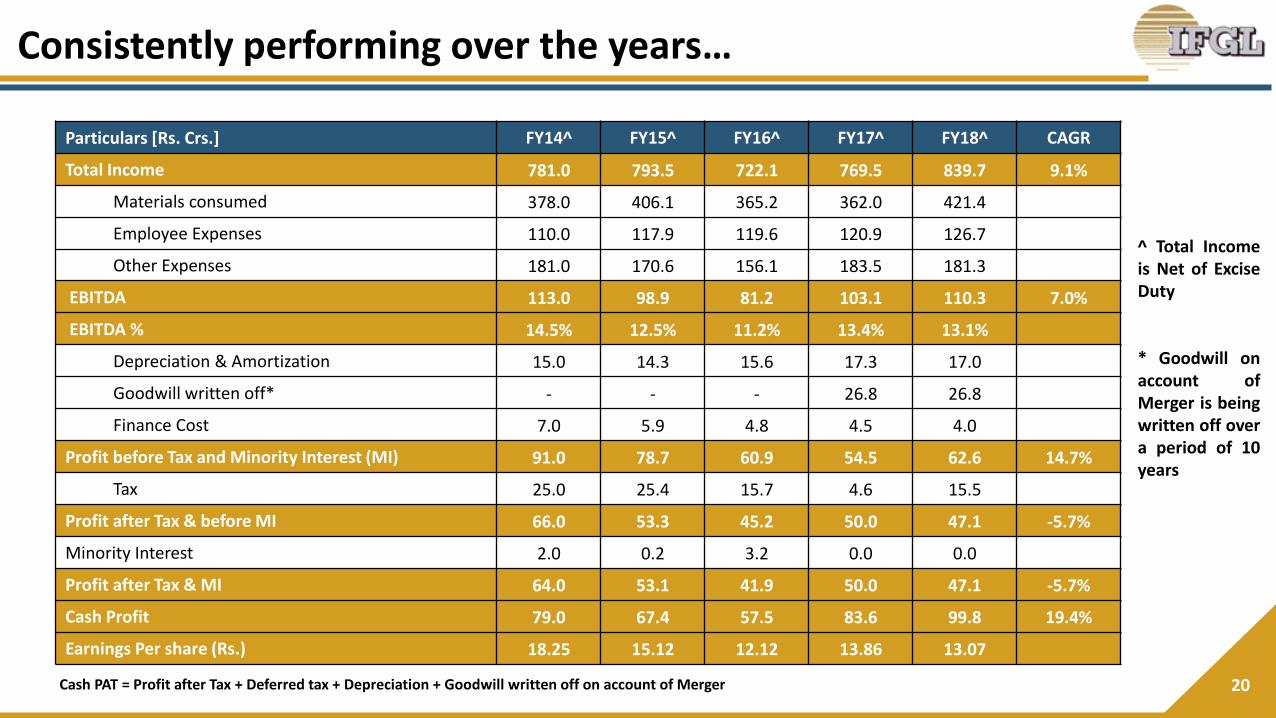
Particulars [Rs. Crs.] FY14^ FY15^ FY16^ FY17^ FY18^ CAGR
Total Income 781.0 793.5 722.1 769.5 839.7 9.1%
Materials consumed 378.0 406.1 365.2 362.0 421.4
Employee Expenses 110.0 117.9 119.6 120.9 126.7
Other Expenses 181.0 170.6 156.1 183.5 181.3
EBITDA 113.0 98.9 81.2 103.1 110.3 7.0%
EBITDA % 14.5% 12.5% 11.2% 13.4% 13.1%
Depreciation & Amortization 15.0 14.3 15.6 17.3 17.0
Goodwill written off* - - - 26.8 26.8
Finance Cost 7.0 5.9 4.8 4.5 4.0
Profit before Tax and Minority Interest (MI) 91.0 78.7 60.9 54.5 62.6 14.7%
Tax 25.0 25.4 15.7 4.6 15.5
Profit after Tax & before MI 66.0 53.3 45.2 50.0 47.1 -5.7%
Minority Interest 2.0 0.2 3.2 0.0 0.0
Profit after Tax & MI 64.0 53.1 41.9 50.0 47.1 -5.7%
Cash Profit 79.0 67.4 57.5 83.6 99.8 19.4%
Earnings Per share (Rs.) 18.25 15.12 12.12 13.86 13.07
^ Total Incomeis Net of ExciseDuty
* Goodwill onaccount ofMerger is beingwritten off overa period of 10years
Consistently performing over the years…
Cash PAT = Profit after Tax + Deferred tax + Depreciation + Goodwill written off on account of Merger
21
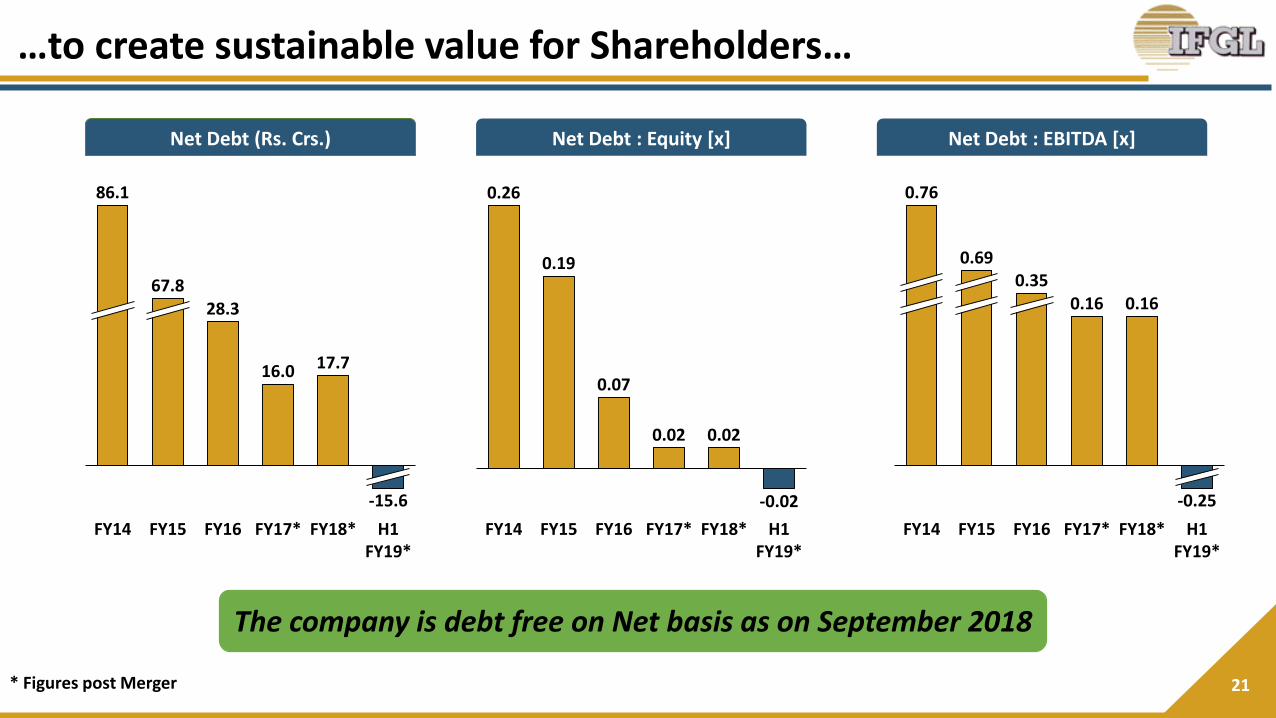
Net Debt (Rs. Crs.) Net Debt : Equity [x] Net Debt : EBITDA [x]
0.16 0.16
0.69
H1FY19*
FY14 FY15 FY16 FY17* FY18*
0.76
0.35
-0.25
28.3
16.0 17.7
FY14 FY15 FY16 FY17* FY18* H1 FY19*
86.1
67.8
-15.6
* Figures post Merger
0.26
0.19
0.07
0.02 0.02
-0.02
FY14 FY15 FY16 FY17* FY18* H1 FY19*
The company is debt free on Net basis as on September 2018
…to create sustainable value for Shareholders…

22
Particulars (Rs.) FY13 FY14 FY15 FY16 FY17 FY18
Consolidated Book Value Per Share 70.9 95.1 99.6 111.7 189.9 208.7
Consolidated Earning Per Share 7.9 18.3 15.1 12.1 13.9 13.1
Dividend Per Share 1.5 1.75 2.00 2.00 2.00 2.00
FY13 FY14 FY15 FY16 FY17 FY18
17.5%
15.0%
20.0% 20.0% 20.0% 20.0%
…with consistent Payout

About Us
24
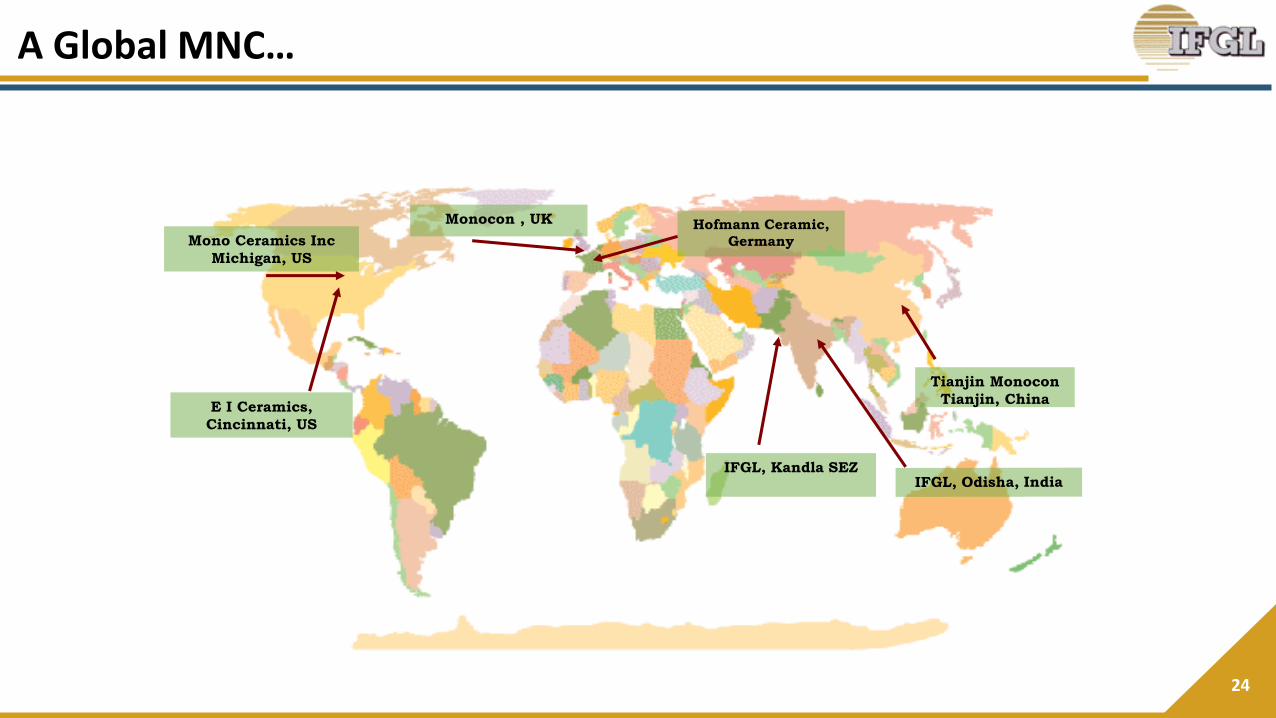
Mono Ceramics Inc
Michigan, US
E I Ceramics,
Cincinnati, US
Monocon , UK
Tianjin Monocon
Tianjin, China
Hofmann Ceramic,
Germany
IFGL, Kandla SEZ
A Global MNC…
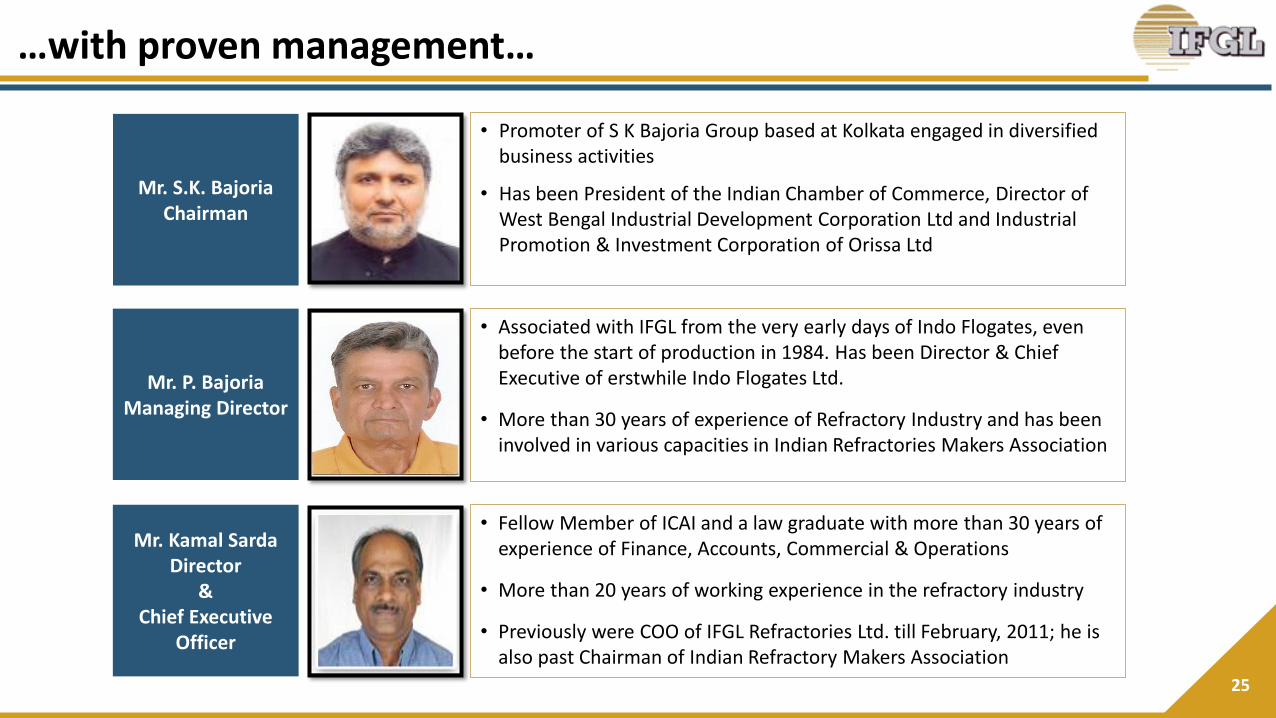
25
Mr. S.K. Bajoria Chairman
• Promoter of S K Bajoria Group based at Kolkata engaged in diversifiedbusiness activities
• Has been President of the Indian Chamber of Commerce, Director ofWest Bengal Industrial Development Corporation Ltd and IndustrialPromotion & Investment Corporation of Orissa Ltd
• Associated with IFGL from the very early days of Indo Flogates, evenbefore the start of production in 1984. Has been Director & ChiefExecutive of erstwhile Indo Flogates Ltd.
• More than 30 years of experience of Refractory Industry and has beeninvolved in various capacities in Indian Refractories Makers Association
Mr. P. Bajoria Managing Director
…with proven management…
• Fellow Member of ICAI and a law graduate with more than 30 years ofexperience of Finance, Accounts, Commercial & Operations
• More than 20 years of working experience in the refractory industry
• Previously were COO of IFGL Refractories Ltd. till February, 2011; he isalso past Chairman of Indian Refractory Makers Association
Mr. Kamal SardaDirector
&Chief Executive
Officer

26
Isostatic Refractories Slide Gate Refractories & Systems
Tube Changer Refractories & System Purging System & Refractories
Cast Products & Zirconia Nozzles Foundry Ceramics
…serving the specialized refractory segment…
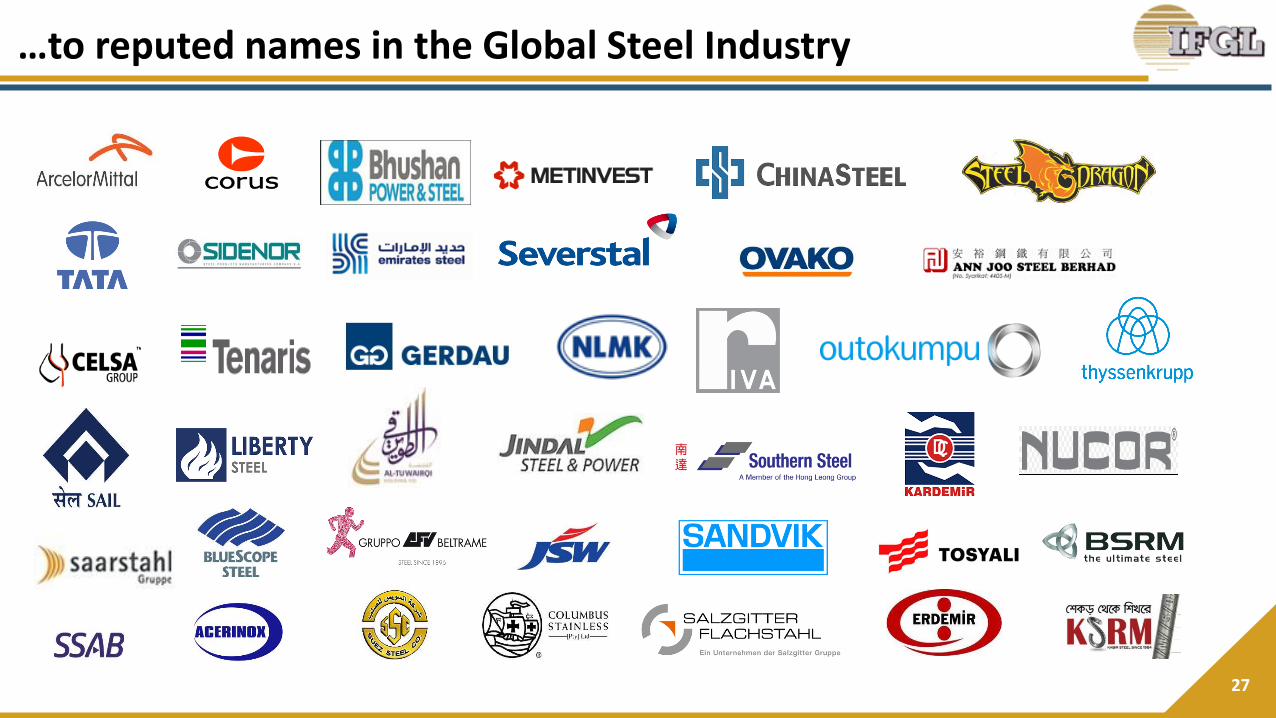
27
…to reputed names in the Global Steel Industry
For further information, please contact:
Company : Investor Relations Advisors :
IFGL Refractories Ltd.CIN - L51909OR2007PLC027954Mr. Rajesh [email protected]
www.ifglref.com
Strategic Growth Advisors Pvt. Ltd.CIN - U74140MH2010PTC204285Mr. Shogun Jain / Mr. Pratik R. [email protected] /[email protected]+91 77383 77756 / +91 97692 60769www.sgapl.net