ifrs adoption and management earnings forecasts of ... annual meetings... · ifrs adoption and...
TRANSCRIPT
1
IFRS adoption and Management Earnings Forecasts of Australian
IPOs
Michael Firth1, Dimitrios Gounopoulos, Jannis Pulm
Abstract
This study contributes to the growing literature on the financial reporting and economic consequences
of the introduction of International Financial Reporting Standards (IFRS). Our particular focus is to
examine whether IFRS has an impact on the accuracy of profit forecasts made in Australian IPO
prospectuses and whether there is an impact on underpricing. As the process of going public is characterised by high levels of information asymmetry this setting allows us to investigate if IFRS
contribute effectively to an improvement in the financial information environment. Our findings show
that IFRS adoption has not improved IPO earnings forecast accuracy. Furthermore, there is no evidence that the IFRS regime has any impact on initial stock returns.
Keywords Earnings management, Mandatory and Voluntary disclosure environments,
Forecast accuracy, IPOs
JEL classification G24 G30 M41
M.Firth Lingnan University - Department of Accounting and Finance Castle Peak Road, Tuen Mun, New Territories Hong Kong, China Email:[email protected] D. Gounopoulos School of Management, University of Surrey, Guildford, Surrey, GU2 7XH, United Kingdom e-mail: [email protected] J. Pulm School of Management, University of Surrey, Guildford, Surrey, GU2 7XH, United Kingdom e-mail: [email protected]
2
1. Introduction
The regulatory switch from domestic accounting standards (local GAAP) to IFRS has significantly
affected financial reporting practices worldwide. By 2012, almost 120 countries require or permit
financial statements to be prepared in accordance with IFRS (Deloitte, 2011; IASB, 2011). In addition,
the U.S. Securities and Exchange Commission (SEC) has proposed a roadmap to potentially allow
U.S. issuers to use IFRS for fiscal years beginning in 2014 (SEC, 2008). Issued by the International
Accounting Standards Board (IASB), IFRS are a set of high quality and globally applicable financial
reporting standards that are based on accounting-principles instead of accounting-rules (IASB, 2011;
Carmona and Trombetta, 2008). Policy setters and financial regulators expect that IFRS, as a common
set of high quality financial reporting standards, will enhance the transparency and comparability of
financial statements across different jurisdictions and thereby contribute effectively to an efficient
functioning as well as the global integration of capital markets (European Union (EU), 2002).
However, the empirical literature to date has failed to find consistent evidence of neither
positive accounting effects nor positive economic effects from the introduction of IFRS, thus raising
doubts about their practical application. On the one hand, proponents argue that IFRS are of higher
quality than local standards and restrict accounting discretion. In turn, this improves market
transparency and reduces financial reporting uncertainty. As a result, firms experience a reduction in
their cost of capital and an increase in market liquidity, e.g. by lower bid-ask spreads (e.g. Daske et al.,
2008; Li, 2010). On the other hand, opponents of IFRS believe that the effects of changes in
accounting regulations are negligibly small or may even reduce financial reporting quality (e.g.
Jeanjean and Stolowy, 2008). Instead, these studies often point to other factors that shape the quality
of accounting reports, such as the legal, institutional and cultural background of a country.
Motivated by the global accounting debate on the mandatory application of International
Financial Reporting Standards (IFRS)2, this study investigates the economic effects that result from a
change in financial reporting regulations around the time of Initial Public Offerings (IPOs). To do so,
we use data from the Australian capital market where firms seeking a listing can voluntarily provide
2Prior to 2001, IFRS were named International Accounting Standards (IAS). For reasons of simplicity however, we use the
term IFRS throughout the text.

3
an earnings forecast in their IPO prospectuses. As the process of going public is characterised by a
high degree of information asymmetry between company insiders and outside investors, this setting
allows us to examine the ability of IFRS to contribute effectively to an improvement in the financial
information environment in a previously unexplored field.
We test whether the application of IFRS increases the quality and reliability of accounting
information and consequently reduces the amount of information heterogeneity. Specifically, we
examine the accuracy of profit forecasts disclosed in IPO prospectuses under different accounting
regulations, namely the former Australian Generally Accepted Accounting Principles (AGAAP) and
IFRS. Additionally, we investigate whether managers are able to anticipate the direction of the
forecast bias and adjust stock prices accordingly on the first day of trading. To the best of our
knowledge, this is the first study to provide evidence on the accounting and capital market effects of
IFRS in the context of IPOs.
Our study focuses on Australian IPOs for several reasons. First, in line with the mandatory
adoption of IFRS in the European Union (EU), the Financial Reporting Council (FRC), the governing
body presiding over Australian accounting regulations, announced in July 2002 that Australia will
follow the EU resolution. Thus, consolidated financial statements of listed companies in Australia
have to comply with IFRS for fiscal years beginning on January 1, 2005 (FRC, 2002)3. Second, unlike
in a number of other countries (e.g. Germany) early adoption prior to 2005 was not permitted in
Australia. This institutional setting allows us to distinguish clearly between the pre- and post-IFRS
adoption periods.
Third, IPOs in Australia can voluntarily provide an earnings forecast figure in their prospectus
to signal future profitability to investors. Earnings forecasts are expected to reduce the level of
information asymmetry between company insiders and outside investors and to reduce problems of
adverse selection in the IPO market. Fourth, as erroneous forecasts may mislead investors, the
credibility of earnings forecast information largely depends on its accuracy. Previous evidences on
3 However, as opposed to the directive in the EU, other reporting entities such as private as well as not-for-profit companies were required to
comply with IFRS as well, making the consequences of the IFRS application much broader in Australia than for instance in the EU (AASB,
2004). Furthermore, the Australian Accounting Standards Board (AASB) made some additional amendments in the Australian version of
IFRS (A-IFRS) that take into account special characteristics of the Australian legislative and economic environment. For a full comparison
between A-IFRS and IFRS see Deloitte (2005).

4
IPOs in Australia has documented high inaccuracy of the profit forecasts included in IPO
prospectuses4. For example, findings by Lee et al. (1993) critically question the credibility of forecast
information as a means to reduce the prevailing information asymmetry among the parties involved in
the IPO process as investors cannot rely on the forecasts provided by management when considering
investments in the Australian IPO market. We wish to examine whether the accuracy of earnings
forecasts have improved overtime and especially since the introduction of IFRS.
Using a sample of 221 profit forecasts of Australian IPOs between 2001 and 2009, we find
that managers‟ behaviour has changed from optimistic forecasts during the AGAAP period to
pessimistic forecasts during the IFRS period. Overall, however, the adoption of IFRS does not reduce
absolute forecast error. Thus, financial forecasts prepared in accordance with the new set of high
quality accounting standards are not easier to make. We also document that under IFRS investors are
unable to fully anticipate errors in the forecast profits and therefore do not sufficiently adjust stock
prices for the forecast bias on the first day of IPO trading. Our results indicate that the change in
accounting regulations has not affected the quality of financial reporting outcomes and has not yielded
positive capital market effects in the IPO setting. Furthermore, our results show that Australian IPO
profit forecast accuracy has improved markedly over time. Compared to the results reported in Lee et
al. (1993), the absolute forecast errors are less than one half the errors in the 1980s. We attribute this
improvement to market pressures and to the threat of penalties from the Australian Regulatory
Authorities for making inaccurate estimates.
To isolate the effect of IFRS adoption we control for industry year effects to mitigate any
industry and year changes in forecast accuracy. We also control for industry-year effects to mitigate
any industry and year changes in forecast accuracy. The results are robust to the choice of alternative
dependent variables and forecast horizon choices. We further attempt to improve the fit of our basic
model making use of logarithmic transformations of AFE. Our results are consistent across these
different research designs.
4 Lee et al. (1993) report an absolute forecast error of 1138% for Australia (period 1987-1989), Hartnett and Romcke (2000)
for the period 1991-1996 indicate an AFE of 88.29% and Hartnet (2010) for the period 1998-2002 reveal an AFE of 73.3%.

5
We contribute to the literature that deals with the financial reporting consequences in several
ways. First, we document management earnings forecast under two different regulatory regimes
(AGAAP and IFRS). Uniquely, we make a direct comparison of management earnings forecast
accuracy on a sample of IPOs that were listed under the accounting requirements of the traditional
Australian GAAP with a sample of IPOs that are obliged to follow the accounting rules of IFRS. Our
findings shed light on a number of issues that have not been addressed previously. These findings
relate to changes in the accuracy of earnings forecast after the adoption of IFRS, the trend of the
forecast (i.e. optimistic – pessimistic) after the regulatory change.
Second, we complement studies that investigate the ability of IFRS to reduce informational
asymmetries in capital markets and to contribute effectively to an improvement in the financial
information environment. Our study therefore adds to Leuz (2003) who investigates information
asymmetry as measured by the level of bid-ask spreads and share turnover for firms either applying
U.S. GAAP or IFRS. Third, unlike previous studies that focus on analyst forecast accuracy under
IFRS regulations (e.g. Ashbaugh and Pincus, 2001; Byard et al. 2011; Horton et al., 2012), we focus
on the accuracy of forecasts made by management. Further, by examining investors‟ abilities to adjust
stock prices for the bias in the forecast on the first day of trading, we also contribute to the literature
on capital market effects following the introduction of IFRS (e.g. Daske et al., 2008).
Finally, this study examines the determinants and consequences of forecast disclosures
published at the time of IPOs and whether there are differences across AGAAP and IFRS periods.
Overall, the incremental contribution of this study is the examination of the informational content of
earnings forecasts as an outcome of the financial reporting standard regime.
Our study is related to the work of Firth and Smith (1992), Jaggi (1997), Jelic et al. (1998),
Hartnett and Romcke (2000), Karamanou and Vafeas (2005), Cormier and Martinez (2006), Cazavan-
Jeny and Jeanjean (2007), Keasey and McGuiness (2008), and Gounopoulos and Skinner (2010) who
all empirically examine the relations between management earnings forecasts and IPO outcomes. We
update their work using a comprehensive sample of AGAAP and IFRS listed firms, as well as by
considering earnings forecast on the associated relationships. In contrast to previous empirical
6
evidence, all the regression models in our study are characterised by high explanatory power of the
variation in AFE.
The remainder of this paper is organised as follows. Section 2 discusses the relevant literature.
Section 3 develops our testable hypotheses. Section 4 describes our sample selection and study design.
Section 5 provides the results of univariate and multivariate analyses. Finally, section 6 concludes our
findings and offers suggestions for further research.
2. Literature review
2.1 Literature on the application of IFRS
Proponents of IFRS claim that IFRS are superior accounting standards for several reasons.
First, IFRS can reduce the choice of accounting methods, thus constraining managerial discretion
(IASC, 1989; Ashbaugh and Pincus, 2001; Barth et. al., 2008). Second, IFRS require accounting
measurements and recognition that reflect better a firm‟s underlying economic position, hence
providing more relevant information for investment decisions (IASC, 1989; Barth et al., 2008). Third,
IFRS increases required disclosures, thereby mitigating information asymmetries between firms and
their shareholders (Ashbaugh and Pincus, 2001; Leuz and Verrecchia, 2000).
Besides the higher financial reporting quality argument, it is also claimed that IFRS increases
comparability of firms across markets and countries. Evidences have shown that accounting
comparability reduces home bias (Bradshaw et al., 2004; Covrig et al., 2007), and improves the
efficiency of information intermediaries (Bae et al., 2008; Bradshaw et al., 2010). Covrig et al. (2007)
show that voluntary IFRS adoption facilitates cross-border equity investments. Yu (2010) shows that
mandatory IFRS adoption also increases cross-border equity holdings. Horton et al. (2012) find that
analyst forecast errors decrease for firms that mandatorily adopt IFRS relative to forecast errors of
other firms.
Empirical studies on the economic effects of the IFRS adoption can broadly be classified into
three categories: those that investigate financial reporting quality, those that explore capital market
effects following the introduction of IFRS, and those that challenge the assumptions that a mandated
7
change in accounting standards enhances financial reporting practices. These studies highlight a
number of factors influencing the quality of corporate accounting.
In the financial reporting quality arena, Ewert and Wagenhofer (2005) derive analytically that
tighter accounting standards such as IFRS are positively related to earnings quality by limiting
managers‟ discretionary accounting behaviour and earnings management practices. In this vein, Barth
et al. (2008) show that accounting numbers reported under IFRS exhibit higher reporting quality
relative to those reported in accordance with domestic standards. Their results are robust to various
metrics of accounting quality. Similarly, Landsman et al. (2011) report a greater increase in the
information content of earnings announcements in countries that adopted IFRS as compared to their
domestic standards benchmarks. Further, Gebhardt and Novotny-Farkas (2011) find a positive
association between the forced change to IFRS and bank accounting in the case of loan loss
provisioning.
Other studies, however, failed to confirm these findings. Ahmed et al. (2010), for instance,
find that the introduction of IFRS results in lower financial reporting quality. They attribute this to a
lack of implementation guidance when applying principles-based standards. In addition, Jeanjean and
Stolowy (2008) document that IFRS have not decreased the level of earnings management in Australia
and the United Kingdom (UK). In fact, the pervasiveness of earnings management even increased in
France. Thus they are sceptical on whether simply changing accounting standards per se will change
the quality of financial reporting amounts.
On the capital market field effects, studies primarily focus on the association between the
disclosure of accounting information and predicted capital market effects such as the cost of capital
(e.g. Barry and Brown, 1985; Lambert et al., 2007) and market liquidity (e.g. Diamond and Verrechia,
1991; Verrechia, 2001). The application of IFRS requires increased disclosure and offers higher
transparency by reducing accounting discretion. This is expected to better reflect the economic
situation of the firm relative to the application of domestic standards. In turn, this reduces information
asymmetries among the different capital market participants and reduces the problems of adverse

8
selection (Welker, 1995; Healy et al., 1999; Lambert et al., 2007). As a result, it should ultimately lead
to an improvement in the financial information environment.
Numerous studies argue that focusing exclusively on exogenously-imposed accounting
standards to determine the quality and usefulness of financial reporting is insufficient. Other studies,
which challenge the assumptions that a mandated change in accounting standards enhances financial
reporting practices, identify other factors that influence the quality of accounting numbers. For
example, Ball (2006) notes that “international differences in financial reporting occur as an
endogenous function of local political and economic institutions”. Ball et al. (2000) and Ball et al.
(2003) show that political and economic forces strongly affect the incentives of account preparers.
Likewise, Ball and Shivakumar (2005) and Burgstahler et al. (2006) point out that capital market
forces also determine reporting incentives.
In addition, Leuz et al. (2003), Holthausen (2009), and Christensen et al. (2011) stress the
importance of the country‟s enforcement regime in the application of accounting standards. In sum,
the existing evidence indicates that the implementation of a single set of high quality accounting
standards is only one of many factors that shape the financial information environment. This argument
is largely based on the assumption that the application of any set of accounting standards requires the
use of managerial discretion as well as the use of private information. However, it is the institutional
framework that determines to what extent and how managers use this discretion in the preparation of
financial reporting information.
2.2 Literature on IPO earnings forecasts
A high level of information asymmetry and problems of adverse selection are distinct features of the
IPO process making it a classic „lemon problem‟ as described by Akerlof (1970). To address this
issue, some jurisdictions (e.g. Australia, Canada, Hong Kong, among others) allow IPO firms to
voluntarily disclose an earnings forecast figure in their prospectuses in order to signal future
9
profitability5. Potential investors use this information for IPO valuation (e.g. Firth, 1998; Kim and
Ritter, 1999). However, the credibility and usefulness of earnings forecasts is heavily dependent on
their accuracy.
Previous evidence from Australia has documented high forecast errors. For example, Lee et al.
(1993) report mean forecast errors (FE) as high as 994.3% as well as mean absolute forecast errors
(AFE) of 1,138.3%. These results indicate that managers systematically overestimate their firms‟
future profitability and act as an impediment for potential investors in making IPO valuations. In
contrast to Australian IPOs, Chan et al. (1996), Jaggi (1997), and Cheng and Firth (2000) report
relatively low mean AFE of 18%, 12.86%, and 9.89%, respectively for firms seeking a listing in Hong
Kong. In addition, Gounopoulos and Skinner (2010) for Greece report earnings forecasts under two
different capital market regimes (Mandatory vs Voluntary). Managers tended to be pessimistic under
the mandatory regime as they, on average, underestimated earnings (FE = 8.65%). However, earnings
forecasts became rather optimistic under the voluntary regime (FE = -9.58). Overall the absolute
forecast error in Greece has been 36.83%.
A well-documented phenomenon in the post-listing period is that IPOs tend to be underpriced
i.e. they have a positive first-day return (e.g. Ibbotson, 1975; Ritter, 1984; Loughran and Ritter, 1994;
Thomadakis et al., 2012). It is important to notice that if investors are able to anticipate the direction
of the bias in IPO profit forecasts, they can adjust stock prices accordingly on the first day of trading.
The underlying premise is that the issue price is a function of the earnings forecast and if investors
believe the forecasts are biased they will drive the post-listing price up or down from the issue price.
Thus, underpricing is expected to be a positive function of FE as Firth (1997, 1998), Keasey and
McGuiness (1991) and Chen et al. (2001) support with their empirical evidence.
3. Hypotheses Development
As IFRS are generally expected to be of superior quality relative to domestic standards, we predict a
positive relation between the change in accounting regulations and IPO earnings forecast accuracy.
5 In contrast, IPO earnings forecasts are mandatory in Malaysia, New Zealand, Singapore, Taiwan and Thailand (e.g. Firth and Smith, 1992; Firth, 1998; Lonkani and Firth, 2005). Forecasts in prospectuses of U.S. IPOs are rather uncommon due to
the litigious environment.
10
IFRS reduces accounting choice and thus limits the use of earnings management. Thus, our first
hypothesis, stated in alternative form, is:
Hypothesis 1 (H1): The mandatory application of IFRS reduces information
asymmetries about an IPO’s valuation by improving the accuracy of IPO earnings
forecasts.
Our second hypothesis investigates the effects of forecast errors on IPO initial returns
following the introduction of IFRS. We predict that prior to the application of IFRS investors are less
able to anticipate deviations from the forecast profits. This is largely due to the unrestricted judgement
managers could exercise in financial reporting practices to deliberately distort accounting figures.
Therefore, we hypothesize that forecast errors under local GAAP are not related to first day-returns as
investors fail to anticipate actions taken by managers in the preparation of financial accounts.
However, the application of IFRS demands restricted accounting choices and measurement methods
that constrain managers‟ opportunistic behaviours and will improve accounting transparency.
Consequently, this will reduce investors‟ uncertainty about reporting practices as financial information
becomes more predictable. Accordingly, investors are better able to predict future earnings and
thereby adjust stock prices on the first day of trading. Thus, our second hypothesis, stated in
alternative form, is twofold:
Hypothesis 2a (H2a): Under AGAAP, initial returns on the first day of IPO trading
are not associated with forecast errors as investors are unable to infer deviations from
actual profits.
Hypothesis 2b (H2b): Following the mandatory application of IFRS, initial returns on
the first day of IPO trading are a positive function of the forecast errors as investors
are able to distinguish between optimistic and pessimistic forecasts.
11
4. Sample selection and study design
4.1 Sample selection criteria
To examine the influence of IFRS on IPO earnings forecast accuracy and first day-returns, our study
focuses on all Australian IPOs during the period January 1, 2001 – December 31, 2009. In the first
step, we retrieve a list of IPO companies from Bloomberg Professional. The initial sample contained
1,098 companies going public during our sample time period. Consistent with previous Australian
studies (e.g. Brown et al., 2000; Hartnett, 2010) mining companies were excluded as these firms rarely
provide an earnings forecast. This led us to drop 494 companies and resulted in an overall sample of
604 firms. IPO prospectuses for these firms were hand-collected using Bloomberg Professional and
Thomson One Banker. All prospectuses were screened for the inclusion of forward-looking financial
information. Therefore, to be included in our sample, companies had to disclose future earnings
information. This resulted in a sample of 282 IPOs.
Post-listing financial information was derived from Bloomberg Professional, Thomson One
Banker, and the companies‟ annual reports. We focus primarily on accounting profit numbers (“the
bottom line”). Special care was taken to properly match earnings figures. We faced difficulties as the
type of profit figures differed across firms. Pre-tax profit numbers were selected to avoid problems
with the applicable future tax rate, consistent with Lee et al. (2006). These include earnings before
interest, tax, depreciation and amortization (EBITDA), earnings before interest and tax (EBIT), and
net profit before tax. Thus, forecast figures had to be carefully hand-matched with their corresponding
actual counterparts. This process reduced the sample to 232 IPOs that announce a profit forecast and
had a corresponding actual profit number. To mitigate the effects of large outliers on our statistical
inferences the overall sample is winsorised at the 5% level. This further reduced the final sample to
221 profit forecasts. In total, 124 IPOs released profit forecasts in the era of AGAAP whereas 97 IPOs
released forecasts under the accounting regulations of IFRS. The sample size exceeds the sample sizes
in previous Australian studies6. Information on the companies‟ age, the auditor, number of shares
6 The sample size is 98 in Lee et al. (1993), 134 in Hartnett and Römcke (2000) and 179 in Lee et al. (2006), respectively.

12
retained by insiders, the name of the underwriter, the offer price and the closing date were also
extracted from the prospectuses.
The third step includes calculating initial stock price as well as stock index data collection (All
Ordinaries Accumulation Index) from Compustat and Thomson One Banker. We are unable to assign
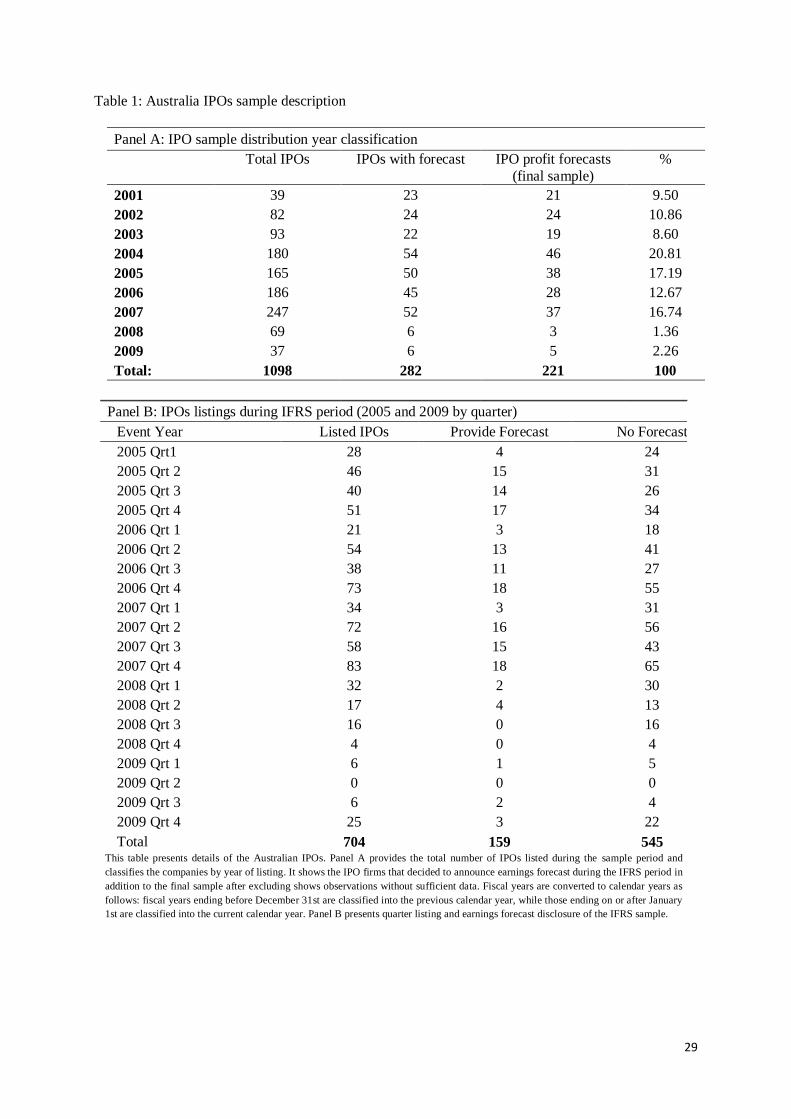
initial returns to all firms in our sample. Table 1 provides summary statistics of the sample indicating
that among the 704 listed IPOs during IFRS period, 159 announced a forecast about their expected
future earnings. Panel B provides quarter analysis highlighting in more detail the distribution of
listings with the associated earnings forecasts.
< insert table 1 about here>
4.2 Methodology
4.2.1 Error metrics
We employ two commonly used error measures in this study, namely the forecast error (FE) and the
absolute forecast error (AFE). The forecast error is calculated as the difference between the actual
profit and the forecast profit divided by the absolute value of the forecast profit:
FEi = (APi – FPi)/│FPi│ (1)
where:
APi = actual profit of company i, FPi = forecast profit of company i
The forecast error measures the bias in the forecast (e.g. Keasey and McGuinness, 1991;
Cheng and Firth, 2000; Gounopoulos, 2011). A positive forecast error (FE > 0) indicates that
managers have underestimated the profits disclosed in the IPO prospectus (pessimistic forecast) while
a negative forecast error (FE < 0) signals an optimistic forecast with actual profits below forecasted
profits. Previous evidence by Lee et al. (1993) as well as Hartnett and Römcke (2000) show that, on
average, Australian IPOs have negative profit forecast errors indicating overly optimistic forecasts.
13
The absolute forecast error is applied to measure the overall accuracy of the forecast. It is
calculated as:
AFEi = │(APi – FPi)│/│FPi│ (2)
The definition of the terms used in the equation is as defined above. Nevertheless, it is worth
noting that prior studies have used alternative measures of the denominator to determine these error
metrics. For example, Keasey and McGuinness (1991), Chen et al. (2001), Lonkani and Firth (2005),
and Gounopoulos (2011) use the absolute value of the forecast profits as the denominator, whereas
Jaggi (1997) and Cheng and Firth (2000) use the absolute value of the actual profits. Although the
results tend not to differ substantially, this alternative denominator will further be considered in
supplementary analyses to ensure robustness of the findings.
4.2.2 Determinants of forecast bias and accuracy
Past research has identified a number of factors that may be potential determinants of the accuracy of
earnings forecasts provided in IPO prospectuses. However, no study has ever taken different
accounting regulations as a factor into consideration. Based on the year of the earnings forecast
announcement, this study classifies firms into two groups: (i) forecasts for financial years prior to the
application of IFRS (the pre-adoption period) and (ii) forecasts for financial years following the
application of IFRS (the post-adoption period).7 Hence, our key variable IFRS is dichotomous. It takes
the value of 0 for forecasts up to the financial year end June 30, 2005, and the value of 1 for all
forecasts thereafter.8
To control for other factors that may influence forecast accuracy, seven additional variables
were identified, namely company age (AGE), length of the forecast horizon (HORIZON), proportion of
shares retained by insiders (RETAIN), company size (SIZE), auditor reputation (AUDITOR), and the
7 Generally, the first financial year end for Australian companies to publish their annual reports under IFRS regulations is
June 30, 2006. 8 In this case companies that list in the first half of 2005 and provide a forecast for the financial year end at June 30, 2005 are assigned a value of 0 as forecasts are prepared according to former Australian GAAP. However, companies that list in the same time period but forecast beyond this year end date (e.g. to June 30, 2006) are assigned a value of 1 to account for reported figures being prepared according to IFRS. This strict classification allows us to thoroughly distinguish between the different financial reporting standards that were applied in the preparation of the forecast financial information. Thus, to the extent that IFRS reduce absolute forecast errors, the dichotomous variable is expected to exhibit a negative coefficient, consistent with the hypotheses as defined previously. Almost all companies included in the sample had financial year ends at
June 30.

14
presence of an underwriter (UNW).9 Lastly, the two vector dummies INDUSTRY and YEAR are
included in the model to control for industry and year effects, respectively. The cross-sectional model
used to identify the effect of accounting regulations on forecast bias and accuracy is as follows:
AFEi = β0 + β1 IFRSi + β2 AGEi + β3 HORIZONi + β4 RETAINi + β5 SIZEi +
β6 AUDITORi + β7 UNWi + β8 INDUSTRYi+ β9 YEARi + εi (3)
Determinants of initial returns
To explore the effects of accounting standards changes on investors‟ ability to anticipate the deviations
of actual profits from forecast profits, cross-sectional regression models that use the „raw‟ (RIR) as
well as the „market-adjusted‟ initial return (MAIR) as dependent variables are investigated. Generally,
if investors are able to identify the direction of the forecast bias, then initial returns are a positive
function of FE. While positive initial returns (underpricing) are likely to be associated with pessimistic
forecasts (FE > 0), optimistic forecasts (FE < 0) are expected to result in negative initial returns. To
investigate this proposition under different accounting regulations, an interaction term (IFRS*FE) is
introduced in the cross-sectional regression model. In conjunction with the variables IFRS and FE as
described above, we can therefore test for differences in investors‟ prediction ability depending on the
financial reporting rules applied.
The variables AGE and SIZE are used as proxies of firm level ex-ante uncertainty (e.g. Lee et
al., 1996; Chambers and Dimson, 2009). The variable RETAIN is used to identify the relation between
equity ownership by company insiders and first day returns. We employ the variables AUDIT and
UNW to capture the certification of the IPO by independent advisers. These may be used as a means to
reduce some of the prevailing ex-ante uncertainty and results in lower positive initial returns, that is,
less underpricing and „less money left on the table‟ (e.g. Carter and Manaster, 1990; Michaely and
Shaw, 1995). Further, we control for year- and industry specific effects.
Overall, the combination of all the variables results in the following cross-sectional regressions:
9 Appendix A provides an explanation of all independent variables.
15
MAIRi or (RIRi) = β0 + β1 IFRSi + β2 FEi + β3 IFRS*FEi + β4 AGEi + β5 SIZEi + β6 RETAINi +
β7 AUDITORi + β8 UNWi + β9 INDUSTRYi + β10 YEARi + εi (4)
5. Results
5.1 Descriptive statistics and univariate analyses
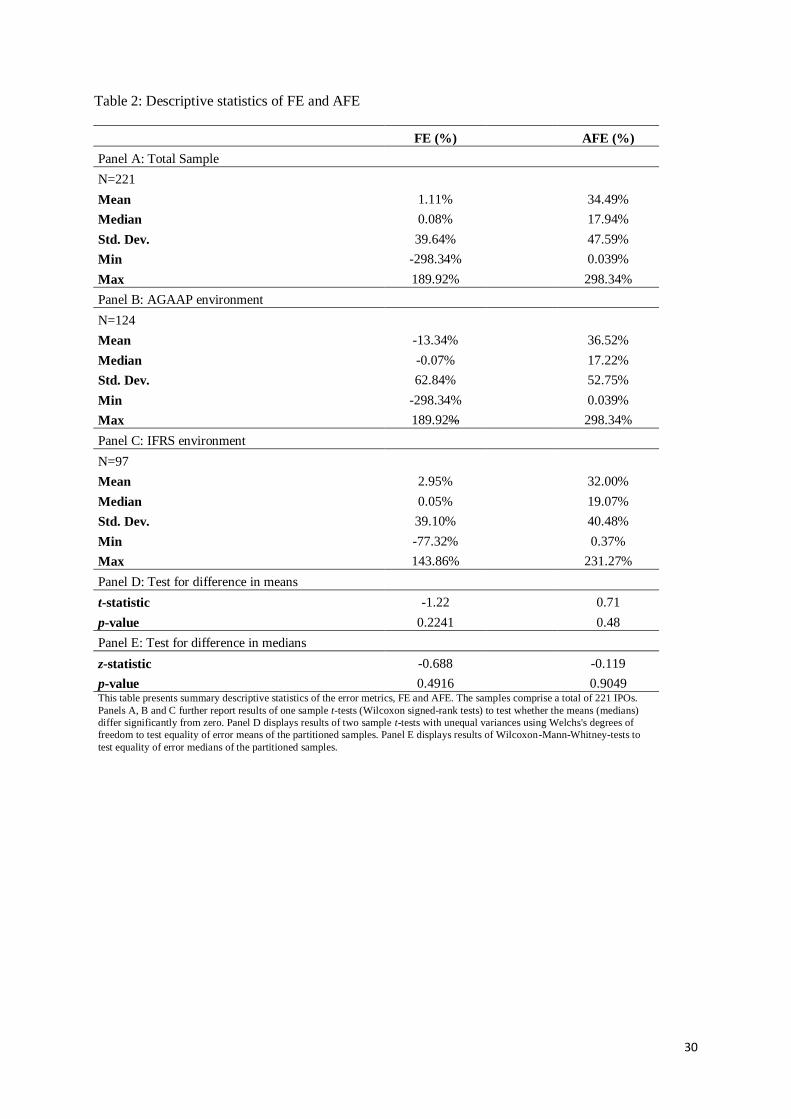
The summary statistics of forecast errors and absolute forecast error measures are shown in
Table 2. The means, medians and standard deviations of errors are broken down by the Australian
GAAP and IFRS disclosure environments. Panel A shows that the mean FE of the overall sample is
positive for earnings forecasts (1.11%). Positive signs (FE > 0) indicate that, on average, managers
underestimate actual earnings. The mean earnings forecast error is substantially lower than the figure
reported by Hartnett and Römcke (2000) and Lee et al. (1993), which indicates a general reduction in
the forecast bias of Australian IPOs over time.
Panels B and C present interesting findings on the forecast bias under the two accounting
regimes. Breaking down the forecast error by Australian GAAP and IFRS environment, the results
reveal a negative mean error of -13.34% for IPOs providing an earnings forecast in their prospectuses
during the AGAAP period and a positive mean error of 2.95% for IPOs providing an earnings forecast
during the IFRS period. This indicates that Australian newly-listed companies provide liberal forecasts
during the less restricted AGAAP regulation as earnings forecast are typically higher than the actual
figures. Once the regime moves to IFRS, Australian IPOs behave more conservative and the forecast
error sign indicates more pessimistic forecasts than the actual earnings announcement.
<Insert table 2 about here>
Results on the accuracy of earnings forecasts as indicated by AFE show a mean (median) AFE
of 34.49% (17.94%). The mean AFE is lower than has been previously reported by Lee et al. (1993).
However, the forecast errors are relatively high compared to other countries, e.g. Hong Kong where
mean AFEs are below 20% (Chan et al., 1996; Jaggi, 1997; Cheng and Firth, 2000) and considerably
low compared to New Zealand (Firth and Smith, 1992) and Canada (Pedwell, Warsame and Neu,

16
1994). Furthermore, the absolute forecast error is lower under IFRS than under AGAAP. However, the
difference in means is not significant (p-value = 0.48).
Of particular importance are rules regarding the option of fair value accounting and, as a
result, increased earnings volatility (e.g. Ball, 2006; Fiechter, 2011) as well as the recognition of loan
losses (e.g. Gebhardt and Novotny- Farkas, 2011) as set out by IAS 39 Financial Instruments:
Recognition and Measurement. Both aspects may impede managers‟ ability to predict the future
performance and particularly to provide financial forecasts. As a result of this pervasive uncertainty
and difficulty, it seems natural that IPOs in the financial industry apply rather conservative forecasting
techniques thus underestimating future profits.
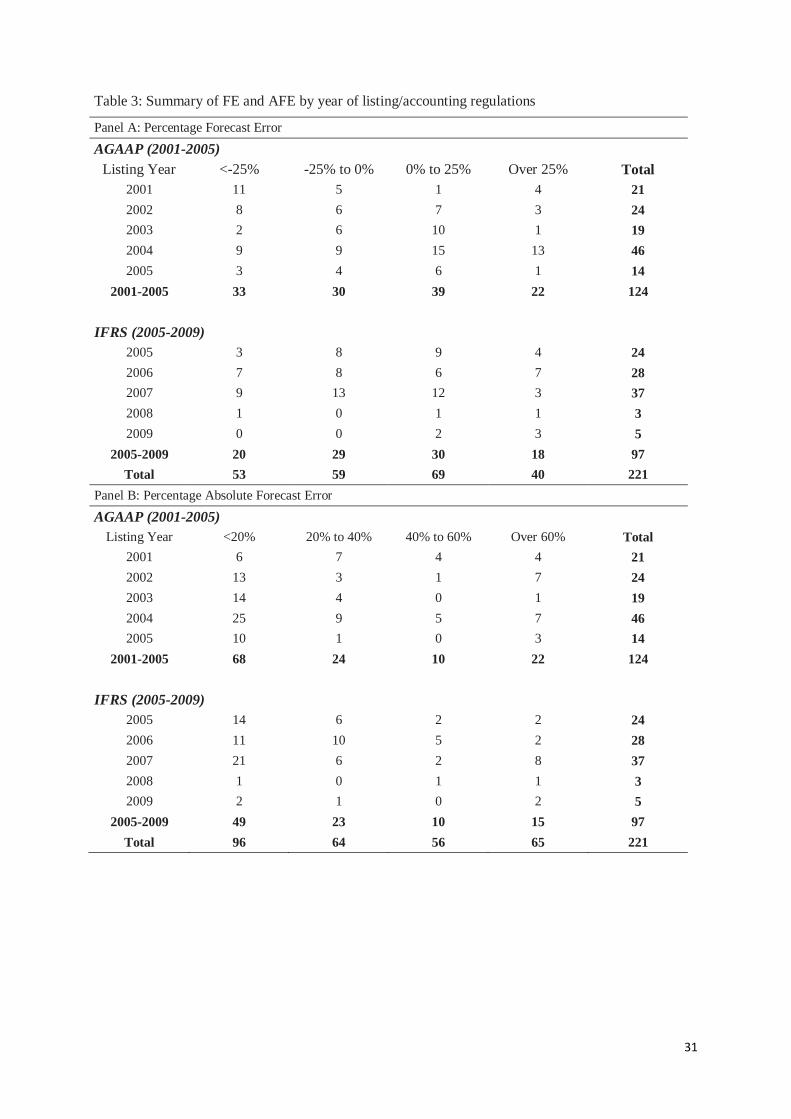
Panel A of Table 3 summarizes the forecast errors for the IPOs across years. The results show
similar numbers of IPOs with positive and negative forecast errors (63 vs 61 during AGAAP and 49 vs
48 during IFRS). Panel B shows the absolute forecast error during each year in the sample period.
Sixty-eight IPOs during the AGAAP sample period and 49 listed during the IFRS sample period have
AFEs of less than 20%.
<Insert table 3 about here>
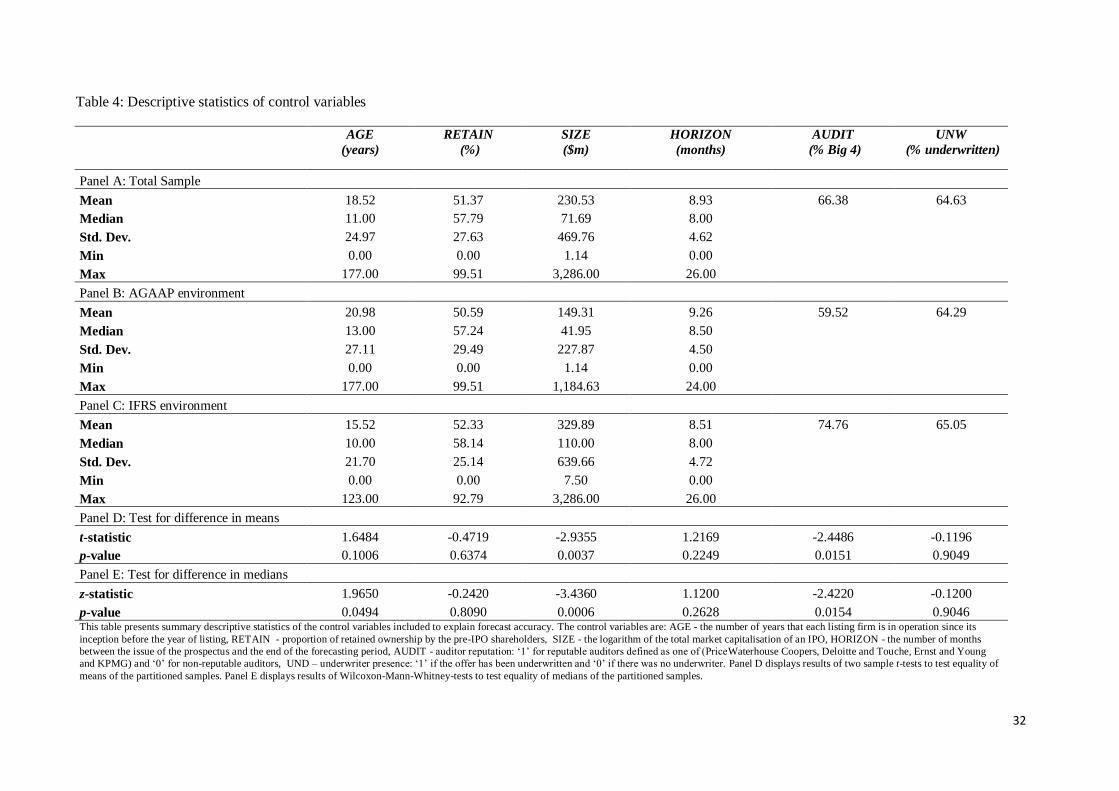
Table 4 provides descriptive statistics of the control variables that are used to explain forecast
accuracy. The mean age (AGE) of listing companies that issue an earnings forecast is 18.52 years. The
proportion of shares retained (RETAIN) and offered to the public is 51.37% (mean) and 57.79%
(median). Panels B and C partition the total sample in the pre- and post-IFRS adoption periods. IPOs
that provide an earnings forecast during the IFRS period are younger than the IPOs going public
during the AGAAP period. Moreover, larger IPOs list following the mandatory introduction of IFRS.
Further, there are many more IPOs in the post-IFRS-adoption period that use the services of a Big 4
member to audit their financial accounts. As these large audit firms operate in an internationally
recognised and well-reputed network, they may adapt more quickly and effectively to a change in
accounting regulations. Thus, IPOs may place greater reliance on these high quality auditors to ensure
that their financial statements present a true and fair view of the underlying economic situation.
17
<insert table 4 about here>
In addition to descriptive statistics on the bias and accuracy of earnings forecasts, summary
statistics on „raw‟ and „market-adjusted‟ IPO initial returns are presented in table 5. Panel A reports
that „raw‟ and „market adjusted‟ mean (median) initial returns were 19.92% (10%) and 19.89%
(9.13%). Compared to previous Australian evidence, the mean results are higher than those reported
by Lee et al. (1996) (11.86%), but lower than those reported by Dimovski and Brooks (2004) (25.6%).
Comparative results on the level of underpricing between the different financial reporting
environments (Panels B and C) show that IPOs reporting under IFRS exhibited less underpricing
(16.93% and 16.59%) than IPOs preparing their accounts according to AGAAP (21.29% and 20.97%).
However, additional tests reveal that the differences between the two periods are not significant.
<insert table 5 about here>
5.2 Regression Analyses
Table 6 presents the regression results of the overall sample that includes 221 IPOs that released a
profit forecast between 2001 and 2009 as well as for the sample partitioned into IPOs in the pre- IFRS
and post-IFRS adoption period. The regression specifications of equation (5) differ in the application
of vector dummy variables which control for industry- and year-effects. As was shown in table 3 the
level of forecast errors differs substantially across industry groups. Therefore, these approaches
examine the influence of IFRS on forecast accuracy with (specification 1) as well as without
(specification 2) controlling for industry- and year specific effects.
Coefficient estimates and t-statistics are based on White‟s (1980) heteroskedasticity-consistent
standard errors (in parentheses) for our model specifications. There is a positive intercept term
(Constant) that is significant at the 1% significance-level. In contrast to previous evidence on IPO
forecast accuracy (e.g. Jaggi, 1997; Chen and Firth, 1999) all regression models are characterised by
relatively high explanatory powers of the variation in AFE as indicated by high R2s.
To test our first hypothesis (H1), we examine the coefficients on the IFRS variable. If the
application of IFRS reduces AFE and in turn, improves forecast accuracy, the IFRS coefficient should
18
be reliably negative. The results on the total sample reveal that the IFRS coefficient estimates differ in
magnitude and sign across the regression models. When controlling for industry- and year-effects
(specification 1) the IFRS-coefficient has the predicted negative sign (-0.0898) but lacks statistical
significance (t-stat. = -0.81). Without controlling for industry- and year-effects yields a positive
coefficient estimate for IFRS (0.0371). However, the results are insignificant (t-stat. = 0.64).
Nevertheless these findings indicate that the effect of the IFRS introduction seems to be mixed and
inconclusive and could have even decreased forecast accuracy. On the whole, these results from
multivariate analyses corroborate the previous findings from the univariate analyses. Together they
show that there appears to be no unambiguous and statistically significant association between the
mandatory introduction of IFRS and higher IPO earnings forecast accuracy. To conclude, the
application of IFRS in Australia does not improve the credibility of forecast financial information as a
signalling device in the IPO setting. Thus, we are unable to find empirical evidence to support our first
hypothesis (H1) that is stated in alternative form.
Among the control variables included in models 1 and 2 of the full sample, only the coefficient
estimates for HORIZON and SIZE show the predicted sign and are also statistically significant.
Although several previous studies (e.g. Chan et al., 1996; Jaggi, 1997; Chen et al., 2001;
Gounopoulos, 2011) identified a positive association between HORIZON and AFE, their findings did
not prove to be statistically significant. As a result, this study is among the first to attribute a
statistically significant positive impact to the length of the forecast horizon on AFE. Yet, this is the
case only under the IFRS regime.
Similarly, previous findings between SIZE and AFE have revealed inconsistent results. While
Chan et al. (1996) and Chen and Firth (1999) identified a negative relation between the size of the
company and AFE, which is in line with our predictions, others found contrary results. Lonkani and
Firth (2005), for example, find a positive and significant relation between SIZE and AFE, which
indicates that larger firms provide less accurate forecasts. Nevertheless, it must be noted that the
proxies for firm size are not consistent across studies. This likely hampers universal interpretations
and comparisons.
<insert table 6 about here>

19
Similar to the overall sample findings, the results for the partitioned sample (AGAAP and
IFRS subsamples) on SIZE are significant with the predicted negative sign. Therefore, during both the
pre- and post-IFRS periods forecasts provided by larger companies have higher accuracy. Substantial
differences are also reported on the effect of employing a high quality auditor (AUDITOR). Focusing
on the AGAAP period earnings forecasts indicates that management of companies audited by a Big 4
auditor tend to achieve a significantly higher level of accuracy. In contrast, both specifications show a
positive relation between the use of a reputable auditor and AFE for forecasts prepared under IFRS,
although none is significant. This finding is rather surprising as one might have expected that
reputable auditors adapt more quickly and effectively to the new set of internationally recognised
accounting regulations due to their global network and internal knowledge base.
Results of initial returns tests
We examine the association between initial returns and the regulatory change to IFRS as
stated in the second set of hypotheses (H2a and H2b). If investors are able to infer the direction of the
bias in IPO earnings forecasts we expect initial returns to be a positive function of FE. Table 7
presents our results for equation (6).
To investigate investors‟ anticipations of forecast bias on the first day of trading under
different accounting regulations, we are particularly interested in the coefficient estimates on FE and
IFRS*FE. The coefficients on FE reflect the association between forecast bias and initial returns in the
AGAAP period. The analyses reveal a non-significant relation between returns and FE, which is in
line with the expectation that investors are unable to anticipate deviations of actual profits from
forecast profits prior to the introduction of IFRS (H2a). The findings concur with the conclusions of
Firth and Smith (1992) and Jelic et al. (2001), which were unable to find evidence that the stock
market anticipates the bias in IPO prospectus forecasts.10
<insert table 7 about here>
10 In contrast, Chen et al. (2001) as well as Lonkani and Firth (2005) report that investors in Hong Kong and Thai IPOs are
able to infer the direction of the forecast bias.

20
Coefficient estimates on IFRS*FE show differential investor reactions to FE under IFRS
regulations, i.e. when IFRS = 1. In line with our prediction (H2b), the coefficients have positive signs11
in both the RIR and MAIR regressions indicating that investors can differentiate between optimistic
and pessimistic forecasts. However, the difference is not statistically significant. Accordingly, we
cannot provide empirical evidence that IFRS allow investors to better distinguish between optimistic
and pessimistic forecasts relative to AGAAP. As a result, we fail to reject the null form of H2a. The
adoption of high quality and globally applicable IFRS do not affect the level of underpricing in the
immediate aftermarket.
6. Additional robustness checks
To further explore the effect of IFRS on IPO earnings forecasts and to investigate the sensitivity of our
findings, several supplementary analyses and robustness checks have been conducted. In particular, we
test the effect of modifications of the dependent variable (AFE) used in the regression analyses,
examine the findings when large AFE (outliers) are included, and investigate the role of the auditor to
signal forecast financial information. All findings are presented in table 8.
A. Modifications of the dependent variable
As the distributions of AFE are positively skewed, our first modification (1) in column 1 of Table 8
involves the use of logarithmic transformations of AFE12
. The regression model is highly significant as
the p-values of the F-statistics approaches zero. Regarding the key variable IFRS, the findings confirm
results of our previous cross-sectional analyses that the introduction of IFRS has not improved
earnings forecast accuracy. The coefficient estimate on IFRS is positive (0.288) but remains
insignificant.
11 The appropriate coefficient estimates of FE under the new set of accounting standards are (-9.5947+12.4921) = 2.8974 for
RIR and (-9.5671+12.2820) = 2.7149 for MAIR. 12 Weisberg (1985) proposes the use of various variance stabilizing transformations if there are signs that the error variance is
non-constant and thus contradicts the basic assumptions made in OLS regressions. In line with his suggestions, Hartnett and
Römcke (2000) use a log-transformation of the independent variable (AFE).

21
In addition, we also test the accuracy of earnings per share (EPS) forecasts in IPO
prospectuses (modification 2). The result shows low overall significance while the coefficient estimate
of IFRS is negative but insignificant. This confirms our previous findings that the introduction of IFRS
does not improve profit forecast accuracy.
Finally, we also follow the approach used by Jaggi (1997) and Cheng and Firth (2000). These
studies use the absolute value of the actual profit as a deflator in the calculation of FE and AFE.
However, cross-sectional regression results of the IFRS coefficient (not reported here) are not
significant. Thus, this further evidence corroborates previous findings.
B. Consideration of outliers
To control for the effects of the few outliers that may distort our results and interpretations, our
samples had previously been winsorised at the 5% level so that eleven profit forecasts were dropped
from the sample. Modification 3 presents findings of cross-sectional regressions on the sample
including large outliers. This increases the sample size to 232 observations for IPO profit forecasts. As
expected, we report a general deterioration in the fit of the model and also low overall significance of
the regression. The coefficient of IFRS is negative but insignificant (-0.8279; t-stat. = -1.49). Similar
findings are reported when EPS forecast accuracy is used as the dependent variable (not reported
here). Further, we find that a long time horizon forecast is associated with an inaccurate forecast. In
addition, small firms provide a more accurate earnings forecasts.
C. The role of the auditor
Previous cross-sectional results have reported mixed and inconsistent results on the role of the auditor,
particularly following the introduction of IFRS. Theoretical models (Titman and Trueman, 1986;
Datar et al., 1991) consider the choice of the auditor as an additional device to signal the superior
quality of shares to the market. Consequently, we examine differential effects of forecast accuracy
between Big 4 and non-Big 4 audit firms when applying IFRS (modification 4). The interaction term
IFRS*AUDIT is therefore added to equation (5) in order to capture any potential association:

22
AFEi = β0 + β1 IFRSi + β2 IFRS*AUDIT + β3 AGEi + β4 HORIZONi + β5 RETAINi +
β6 SIZEi + β7 AUDITORi + β8 UNWi + β9 INDUSTRY i+ β10 YEARi + εi (7)
<Insert table 8 here>
The coefficient estimate on IFRS is negative and significant at the 10% level for earnings
forecasts. Moreover, the coefficient estimate of IFRS*AUDIT is positive and significant at the 5%-
level indicating that the effect of IFRS on forecast accuracy is lower when financial information is
audited by a member of the Big 4. These results also contradict general theory (DeAngelo, 1981) as
well as earlier Australian evidence (Lee et al., 2006) on the role of high-quality auditors. We show that
the effect of IFRS on accounting quality as measured by AFE is higher if the auditor is not a member
of the Big 4 audit firms. To conclude, the choice of a reputable auditor does not serve as a credible
means to signal superior quality in the IFRS-environment.
7. Conclusion
Motivated by the current debate about the merits and consequences of a regulatory accounting change
to IFRS, this study contributes to the literature by providing first-time evidence on its financial
reporting consequences in the context of Australian IPO earnings forecasts. We find that in line with
self-selection theory the study shows that a manager‟s behaviour changes as they tend towards
optimism by overestimating earnings during the AGAAP period (2001-2004) and convert to
pessimism in the IFRS period (2005-2009). This behavioural change implies that the more restricted
IFRS regulatory environment associated with increased level of comparability brought greater
concerns to management and turned their optimistic forecasts into pessimistic forecasts. Adoption of
IFRS has not improved IPO forecast accuracy as univariate and multivariate analyses consistently fail
to identify a link between the application of IFRS and forecast accuracy. These findings are robust to a
number of modifications of our research design.
Cross-sectional regressions are used to model earnings forecast accuracy and reveal some
differences between the AGAAP and IFRS regulatory periods. Specifically, small firms that go public
during the AGAAP environment experience high absolute forecast errors. A similar level of
23
inaccuracy applies to IPOs that employ a non reputable auditor to review their financial statements
paying low fees. On this basis the size and the audit variables signal that small companies with low
budget have difficulties in providing accurate earnings. A switch to the IFRS regime indicates that the
type of auditor is no longer a significant variable. In contrast, the period between the issue of the
prospectus and the end of the forecasting period has an effect on forecast accuracy as the longer the
period the higher the forecast error.
Findings of supplementary analyses question the use of a reputable auditor to credibly signal
the high quality of shares. We show that the effect of IFRS on accounting quality as measured by AFE
is higher if the auditor is not a member of the Big 4 audit firms. Thus, reputable auditors have inferior
expertise in applying IFRS in the context of IPO profit forecasts. Overall, we conclude that simply
applying IFRS neither reduces the level of information asymmetry nor diminishes problems of adverse
selection in the IPO context. Accordingly, the IPO process in Australia is still subject to a relatively
high amount of ex-ante uncertainty.
Our study confirms previous evidence that the quality of financial reporting outcomes is not
solely determined by the application of exogenously-imposed accounting standards (e.g. Ball et al.,
2000; Ball, 2006; Burgstahler et al., 2006). In fact, they strongly underline the dominant role of
endogenous factors that shape the accounting environment such as the country‟s institutional
framework and managers‟ reporting incentives. Further, relative to other jurisdictions, in particular the
U.S., companies in Australia operate in a rather low-litigation environment. Neither managers nor
auditors have to fear severe legal suits if financial forecasts turn out to be wrong or misleading.
Apart from subsequent negative stock price reactions to adjust for the forecast error, managers
lack additional (ex-ante) incentives to provide accurate and trustworthy profit forecasts. Accordingly,
this study confirms that the quality of forecast financial information is independent of the set of
accounting standards. It is rather an endogenous function determined by the interaction between the
legal environment, capital market forces and financial reporting incentives. Therefore, in order to
improve the credibility of financial forecasts as part of the listing process these factors have to receive
particular attention.
24
In response to the concerns raised in the introduction, the findings of this paper have three
major implications: i) the change to the IFRS regulatory regime brought uncertainty that did not help
improve the accuracy of earnings forecasts and consequently did not improve the financial information
environment; ii) issuers are concerned with the increased pressure associated with the introduction of
IFRS and turned their forecasts from optimistic to pessimistic and iii) adopting IFRS and allowing
adequate time for market adaptation is expected to help on achieving forecast accuracy. Overall, this
paper shed lights in the long-standing puzzle of accuracy in management earnings forecasts – an
important financial reporting issue.

25
References
Ahmed, A.S., M. Neel, and D. Wang, 2010, Does mandatory adoption of ifrs improve accounting quality? Preliminary evidence, Working Paper, Texas A&M University.
Akerlof, G., 1970, The market for lemons: Qualitative uncertainty and the market mechanism, Quarterly Journal of Economics 84, 488-500.
Ashbaugh, H. , and M. Pincus, 2001, Domestic accounting standards, international accounting standards, and the predictability of earnings, Journal of Accounting Research 39, 417-434.
Bae, K-H. , H. Tan, and M. Welker, 2008, International gaap differences: The impact on foreign analysts, Accounting Review 83, 593.
Ball, R. , 2006, International financial reporting standards (ifrs): Pros and cons for investors, Accounting and Business Research 5-27.
Ball, R. , and L. Shivakumar, 2006, The role of accruals in asymmetrically timely gain and loss recognition, Journal of Accounting Research 44, 207–242.
Ball, R., S. Kothari, and A. Robin, 2000, The effect of international institutional factors on properties of accounting earnings, Journal of Accounting and Economics 29, 1-51.
Ball, R., A. Robin, and J.S Wu, 2003, Incentives versus standards: Properties of accounting income in four east asian countries, Journal of Accounting and Economics 36, 235-270.
Ball, R., and L. Shivakumar, 2005, Earnings quality in uk private firms: Comparative loss recognition timeliness, Journal of Accounting and Economics.
Barry, C.B. , and S.T. Brown, 1985, Differential information and security market equilibrium, Journal of Financial and Quantitative Analysis 20, 407-422.
Barth, M.E. , W.R. Landsman, and M.H. Lang, 2008, International accounting standards and accounting quality, Journal of Accounting Research 46.
Bradshaw, M. , G. Miller, and G. Serafeim, 2010, Accounting method heterogeneity and analysts’forecasts, Working Paper, Harvard University.
Bradshaw, M., B. Bushee, and G. Miller, 2004, Accounting choice, home bias, and u.S. Investment in non-u.S. Firms, Journal of Accounting Research 42, 795–841.
Brown, P., A. Clarke, J. How, and K. Lim, 2000, The accuracy of management dividend forecasts in Australia, Pacific-Basin Finance Journal 8, 309-331.
Burgstahler, D.C., L. Hail, and C. Leuz, 2006, The importance of reporting incentives: Earnings management in European private and public firms, Accounting Review 81, 983-1016.
Byard, D., Y. Li, and Y. Yu, 2011, The effect of mandatory IFRS adoption on financial analysts’ information environment, Journal of Accounting Research 49, 69-96.
Carmona, S. , and M. Trombetta, 2008, On the global acceptance of IAS/IFRS accounting standards: The logic and implications of the principles-based system, Journal of Accounting and Public Policy 27, 455-461.
Carter, B., and S. Manaster, 1990, Initial public offerings and the underwriter reputation, Journal of Finance 45, 1045-1067. Cazavan-Jeny, A., and T. Jeanjean, 2007, Levels of voluntary disclosure in IPO prospectuses: An empirical analysis, Review of
Accounting and Finance 6, 131-149. Chambers, D., and E. Dimson, 2009, IPO underpricing over the very long run, Journal of Finance 64, 1407-1443. Chan, A, S. Cora, T. M., Wong D., and Chan R., 1996, Possible factors of the accuracy of prospectus earnings forecasts in
Hong Kong, International Journal of Accounting 31, 381-398. Chen, G., and M. Firth, 1999, The accuracy of profit forecasts and their roles and associations with IPO firm valuations,
Journal of International Financial Management and Accounting 10, 202-226. Chen, G., M. Firth, and G. Krishnan, 2001, Earnings forecast errors in IPO prospectuses and their associations with initial
stock returns, Journal of Multinational Financial Management 11, 225-240. Cheng, T., and M. Firth, 2000, An empirical analysis of the bias and rationality of profit forecasts published in new issue
prospectuses, Journal of Business Finance & Accounting 27, 423-446. Christensen, H.B.N. , L. Hail, and C. Leuz, 2011, Capital-market effects of securities regulation: The role of implementation
and enforcement, NBER Working Paper Series. Cormier, D., and I. Martinez, 2006, The association between management earnings forecasts, earnings management, and
stock market valuation: Evidence from French IPOs, International Journal of Accounting 41, 209-236. Covrig, V.M, M.L. Defond, and M. Hung, 2007, Home bias, foreign mutual fund holdings, and the voluntary adoption of
international accounting standards, Journal of Accounting Research 45, 41-70. Daske, H., and G. Gebhardt, 2006, International financial reporting standards and experts’ perceptions of disclosure quality,
Abacus 42, 461-498. Daske, H., L. Hail, C. Leuz, and R. Verdi, 2008, Mandatory IFRS reporting around the world: Early evidence on the economic
consequences, Journal of Accounting Research 46, 1085- 1142. Datar, S., G. Feltham, and T. Hughes, 1991, The role of audits and audit quality in valuing new issues, Journal of Accounting
and Economics 14, 3-50. DeAngelo, L., 1981, Audit size and quality, Journal of Accounting and Economics 182-199. Diamond, D.W. , and R.E. Verrechia, 1991, Disclosure, liquidity, and the cost of capital, Journal of Finance 46, 1325-1359. Dimovski, W., and R. Brooks, 2004, Initial public offerings in Australia 1994 to 1999: Recent evidence of underpricing and
underperformance, Review of Quantitative Finance & Accounting 22, 179–198.
26
European Union (EU), 2002, Regulation (ec) no 1606/2002 of the European Parliament and of the council of 19 July 2002 on the application of international accounting standards, in September 11 Official Journal of the European Communities, 2002.
Ewert, R. , and A Wagenhofer, 2005, Economic effects of tightening accounting standards to restrict earnings management, Accounting Review 80, 1101-1124.
Fiechter, P. , 2011, The effects of the fair value option under IAS 39 on the volatility of bank earnings, Journal of International Accounting Research 10, 85-108.
Firth, M., 1997, An analysis of the stock market performance of new issues in New Zealand, Pacific-Basin Finance Journal 5, 63-85.
Firth, M., 1998, IPO profits forecasts and their role in signalling firm value and explaining post-listing returns, Applied Financial Economics 8, 29-39.
Firth, M., and A. Smith, 1992, The accuracy of profits forecasts in initial public offerings prospectuses, Accounting and Business Research 22, 239-247.
Gebhardt, G. , and Z. Novotny-Farkas, 2011, Mandatory IFRS adoption and accounting quality of European banks, Journal of Business Finance and Accounting 38, 289-333.
Gounopoulos, D, 2011, Associations between management forecast accuracy and pricing of IPOs in Athens stock exchange, Multinational Finance Journal 15, 235-272.
Gounopoulos, D, and F. Skinner, 2010, Voluntary vs. mandatory earnings management in IPOs American Accounting Association (30 July - 2 August, San Francisco).
Hartnett, N., 2010, The value relevance of earnings forecast disclosure: An investigation of forecast attributes and signalling in the Australian IPO context, Applied Financial Economics 20, 1819-1828.
Hartnett, N., and J. Romcke, 2000, The predictability of management forecast error: A study of Australian IPO disclosure, Multinational Finance Journal 4, 101-132.
Healy, P. M., A. P. Hutton, and K. G. Palepu, 1999, Stock performance and intermediation changes surrounding sustained increases in disclosure, Contemporary Accounting Research 16, 485–520.
Holthausen, R.W. , 2009, Accounting standards, financial reporting outcomes, and enforcement, Journal of Accounting Research 47, 447-458.
Horton, J., G. Serafeim, and I. Serafeim, 2012, Does mandatory IFRS adoption improve the information environment, Working Paper, Harvard University.
Ibbotson, R.. 1975, Price performance of common stock new issues, Journal of Financial Economics 2, 235-272. Jaggi, B., 1997, Accuracy of forecast information disclosed in the IPO prospectuses of Hong Kong companies, International
Journal of Accounting 32, 301-319. Jeanjean, T., and H. Stolowy, 2008, Do accounting standards matter? An exploratory analysis of earnings management
before and after IFRS adoption, Journal of Accounting and Public Policy 27, 480-494. Jelic, R., B. Saadouni, and R. Briston, 1998, The accuracy of earnings forecast in IPO prospectuses on the Kuala Lumpur stock
exchange 1984-1995, Accounting and Business Research 29, 57-72. Jelic, R., B. Saadouni, and R. Briston, 2001, Performance of malaysian IPOs: Underwriters reputation and earnings forecasts,
Pacific-Basin Finance Journal 9, 457-486. Karamanou, I., and N. Vafeas, 2005, The association between corporate boards, audit committees, and management
earnings forecasts: An empirical analysis, Journal of Accounting Research 43, 453-486. Keasey, K., and P. McGuiness, 1991, Prospectus earning forecasts and the pricing of new issue on the unlisted securities
market, Accounting and Business Research 21, 133-145. Keasey, K., and P. McGuiness, 2008, Firm value and its relation to equity retention levels, forecast earnings disclosures and
underpricing initial public offerings in Hong Kong, International Business Review 17, 642-662. Kim, M., and J. Ritter, 1999, Valuing IPOs, Journal of Financial Economics 53, 409-437. Lambert, R., C. Leuz, and R.E. Verrechia, 2007, Accounting information, disclosure and the cost of capital, Journal of
Accounting Research 45, 385-420. Landsman, W.R., E.L. Maydew, and J.R. Thornock, 2011, The information content of annual earnings announcements and
mandatory adoption of IFRS, Journal of Accounting and Economics, forthcoming. Lee, I., N. Taylor, C. Yee, and M. Yee, 1993, Prospectus forecast earning: Evidence and explanations in Australia, Australian
Accounting Review 3, 21-32. Lee, P., S. Taylor, and S. Taylor, 2006, Auditor conservatism and audit quality: Evidence from IPO earnings forecasts,
International Journal of Auditing 10, 183-199. Lee, P., S. Taylor, C. Yee, and M. Yee, 1993, Prospectus earnings forecasts: Evidence and explanations, Australian
Accounting Review 3, 21-32. Lee, P.., S.L. Taylor, and T.S. Walter, 1996, Australian IPO pricing in the short and long-run, Journal of Banking & Finance 20,
1189-1210. Leuz, C. , 2003, IAS versus U.S. GAAP: Information asymmetry-based evidence from Germany’s new market, Journal of
Accounting Research 41, 445-472. Leuz, C. , and R.E. Verrecchia, 2000, The economic consequences of increased disclosure, Journal of Accounting Research
38, 91-124. Li, S. , 2010, Does mandatory adoption of international financial reporting standards in the European Union reduce the cost
of equity capital, Accounting Review 85, 607-636.

27
Lonkani, R. , and M. Firth, 2005, The accuracy of IPO earnings forecasts in Thailand and their relationships with stock market valuation, Accounting and Business Research 35, 269-286.
Loughran, T., J. Ritter, and K. Rydqvist, 1994, Initial public offerings: International insights, Pacific-Basin Finance Journal (An update is available on Jay Ritter’s web site) 2, 165-199.
Michaely, R. , and W. Shaw, 1995, Does the choice of auditor convey quality in an initial public offering?, Financial Management 24, 15-30.
Ritter, J., 1984, The hot issue market of 1980, Journal of Business 57, 215-240. Schrodl, N., and N. Klein, 2012, IFRS and the complexity hurdle, Working paper. Stein, J., 1988, Takeover threats and managerial myopia, Journal of Political Economy 96, 61–80. Thomadakis, S., D. Gounopoulos, and C. Nounis, 2012, The long term performance of initial public offerings in the Athens
stock exchange. European Financial Management 18, 119-141. Titman, S., and B. Trueman, 1986, Information quality and the valuation of the new issues, Journal of Accounting and
Economics 8, 159-172. Verrecchia, R., 2001, Essays on disclosure, Journal of Accounting and Economics 32. Weisberg, S. 1985, Applied linear regressions, Wiley and Sons, New York. Welker, M., 1995, “Disclosure policy, information asymmetry, and liquidity in equity markets, Contemporary Accounting
Research 11, 801–827. White, H., 1980, Heteroskedasticity-consistent covariance matrix estimator and a direct test of heteroskedasticity,
Econometrica 48, 817-838. You, H., and X-J. Zhang, 2009, Financial reporting complexity and investor underreaction to 10-k information., Review of
Accounting Studies 14, 559-586. Yu, G., 2010, Accounting standards and international portfolio holdings: Analysis of cross-border holdings following
mandatory adoption of IFRS., (University of Michigan).

28
Appendix A: Independent variables definition and measurement
Variable name Predicted sign Variable measurement
Panel A: Accounting regulations variable
IFRS
-
Dummy variable: 1 if forecasts have been prepared in accordance with IFRS; 0 if forecasts have been prepared
in accordance with AGAAP.
Panel B: Control variables
AGE
-
The number of years that each listing firm has been in
operation before the year of listing.
HORIZON
+
The number of months between the issue of the
prospectus and the end of the forecasting period.
RETAIN
-
The proportion of retained shares by the pre-IPO
shareholders.
SIZE
-
The logarithm of the total market capitalisation of the
IPO.
AUDITOR
-
Dummy variable: 1 for reputable auditors defined as one
of (PriceWaterhouseCoopers, Deloitte and Touche, Ernst and Young, and KPMG); 0 for non-reputable auditors (all
other audit firms).
UNW
-
Dummy variable: 1 if the offer has been underwritten; 0
otherwise.
29
Table 1: Australia IPOs sample description
Panel A: IPO sample distribution year classification
Total IPOs IPOs with forecast IPO profit forecasts
(final sample)
%
2001 39 23 21 9.50
2002 82 24 24 10.86
2003 93 22 19 8.60
2004 180 54 46 20.81
2005 165 50 38 17.19
2006 186 45 28 12.67
2007 247 52 37 16.74
2008 69 6 3 1.36
2009 37 6 5 2.26
Total: 1098 282 221 100
This table presents details of the Australian IPOs. Panel A provides the total number of IPOs listed during the sample period and
classifies the companies by year of listing. It shows the IPO firms that decided to announce earnings forecast during the IFRS period in
addition to the final sample after excluding shows observations without sufficient data. Fiscal years are converted to calendar years as
follows: fiscal years ending before December 31st are classified into the previous calendar year, while those ending on or after January
1st are classified into the current calendar year. Panel B presents quarter listing and earnings forecast disclosure of the IFRS sample.
Panel B: IPOs listings during IFRS period (2005 and 2009 by quarter)
Event Year Listed IPOs Provide Forecast No Forecast
2005 Qrt1 28 4 24
2005 Qrt 2 46 15 31
2005 Qrt 3 40 14 26
2005 Qrt 4 51 17 34
2006 Qrt 1 21 3 18
2006 Qrt 2 54 13 41
2006 Qrt 3 38 11 27
2006 Qrt 4 73 18 55
2007 Qrt 1 34 3 31
2007 Qrt 2 72 16 56
2007 Qrt 3 58 15 43
2007 Qrt 4 83 18 65
2008 Qrt 1 32 2 30
2008 Qrt 2 17 4 13
2008 Qrt 3 16 0 16
2008 Qrt 4 4 0 4
2009 Qrt 1 6 1 5
2009 Qrt 2 0 0 0
2009 Qrt 3 6 2 4
2009 Qrt 4 25 3 22
Total 704 159 545
30
Table 2: Descriptive statistics of FE and AFE
FE (%) AFE (%)
Panel A: Total Sample
N=221
Mean 1.11%
34.49%
Median 0.08%
17.94%
Std. Dev. 39.64%
47.59%
Min -298.34%
0.039%
Max 189.92%
298.34%
Panel B: AGAAP environment
N=124
Mean -13.34%
36.52%
Median -0.07%
17.22%
Std. Dev. 62.84%
52.75%
Min -298.34%
0.039%
Max 189.92%
298.34%
Panel C: IFRS environment
N=97
Mean 2.95%
32.00%
Median 0.05%
19.07%
Std. Dev. 39.10%
40.48%
Min -77.32%
0.37%
Max 143.86%
231.27%
Panel D: Test for difference in means
t-statistic -1.22
0.71
p-value 0.2241 0.48
Panel E: Test for difference in medians
z-statistic -0.688
-0.119
p-value 0.4916 0.9049 This table presents summary descriptive statistics of the error metrics, FE and AFE. The samples comprise a total of 221 IPOs.
Panels A, B and C further report results of one sample t-tests (Wilcoxon signed-rank tests) to test whether the means (medians)
differ significantly from zero. Panel D displays results of two sample t-tests with unequal variances using Welchs's degrees of
freedom to test equality of error means of the partitioned samples. Panel E displays results of Wilcoxon-Mann-Whitney-tests to
test equality of error medians of the partitioned samples.
31
Table 3: Summary of FE and AFE by year of listing/accounting regulations
Panel A: Percentage Forecast Error
AGAAP (2001-2005)
Listing Year <-25% -25% to 0% 0% to 25% Over 25% Total
2001 11 5 1 4 21
2002 8 6 7 3 24
2003 2 6 10 1 19
2004 9 9 15 13 46
2005 3 4 6 1 14
2001-2005 33 30 39 22 124
IFRS (2005-2009)
2005 3 8 9 4 24
2006 7 8 6 7 28
2007 9 13 12 3 37
2008 1 0 1 1 3
2009 0 0 2 3 5
2005-2009 20 29 30 18 97
Total 53 59 69 40 221
Panel B: Percentage Absolute Forecast Error
AGAAP (2001-2005)
Listing Year <20% 20% to 40% 40% to 60% Over 60% Total
2001 6 7 4 4 21
2002 13 3 1 7 24
2003 14 4 0 1 19
2004 25 9 5 7 46
2005 10 1 0 3 14
2001-2005 68 24 10 22 124
IFRS (2005-2009)
2005 14 6 2 2 24
2006 11 10 5 2 28
2007 21 6 2 8 37
2008 1 0 1 1 3
2009 2 1 0 2 5
2005-2009 49 23 10 15 97
Total 96 64 56 65 221
32
Table 4: Descriptive statistics of control variables
AGE
(years)
RETAIN
(%)
SIZE
($m)
HORIZON
(months)
AUDIT
(% Big 4)
UNW
(% underwritten)
Panel A: Total Sample
Mean 18.52 51.37 230.53 8.93 66.38 64.63
Median 11.00 57.79 71.69 8.00
Std. Dev. 24.97 27.63 469.76 4.62
Min 0.00 0.00 1.14 0.00
Max 177.00 99.51 3,286.00 26.00
Panel B: AGAAP environment
Mean 20.98 50.59 149.31 9.26 59.52 64.29
Median 13.00 57.24 41.95 8.50
Std. Dev. 27.11 29.49 227.87 4.50
Min 0.00 0.00 1.14 0.00
Max 177.00 99.51 1,184.63 24.00
Panel C: IFRS environment
Mean 15.52 52.33 329.89 8.51 74.76 65.05
Median 10.00 58.14 110.00 8.00
Std. Dev. 21.70 25.14 639.66 4.72
Min 0.00 0.00 7.50 0.00
Max 123.00 92.79 3,286.00 26.00
Panel D: Test for difference in means
t-statistic 1.6484 -0.4719 -2.9355 1.2169 -2.4486 -0.1196
p-value 0.1006 0.6374 0.0037 0.2249 0.0151 0.9049
Panel E: Test for difference in medians
z-statistic 1.9650 -0.2420 -3.4360 1.1200 -2.4220 -0.1200
p-value 0.0494 0.8090 0.0006 0.2628 0.0154 0.9046 This table presents summary descriptive statistics of the control variables included to explain forecast accuracy. The control variables are: AGE - the number of years that each listing firm is in operation since its
inception before the year of listing, RETAIN - proportion of retained ownership by the pre-IPO shareholders, SIZE - the logarithm of the total market capitalisation of an IPO, HORIZON - the number of months
between the issue of the prospectus and the end of the forecasting period, AUDIT - auditor reputation: „1‟ for reputable auditors defined as one of (PriceWaterhouse Coopers, Deloitte and Touche, Ernst and Young
and KPMG) and „0‟ for non-reputable auditors, UND – underwriter presence: „1‟ if the offer has been underwritten and „0‟ if there was no underwriter. Panel D displays results of two sample t-tests to test equality of
means of the partitioned samples. Panel E displays results of Wilcoxon-Mann-Whitney-tests to test equality of medians of the partitioned samples.

33
Table 5: Descriptive statistics on „raw‟ and „market adjusted‟ initial returns
Panel A: IPO mean and median underpricing
Raw' initial returns Market-adjusted' initial returns
Year No of IPOs Mean Median
Year No of IPOs Mean Median
2001 17 2.81% -0.02%
2001 17 3.12% 0.05%
2002 19 30.41% 4%
2002 19 31.61% 8.32%
2003 17 27.32% 14.99%
2003 17 26.55% 13.97%
2004 44 26.33% 10.42%
2004 44 25.47% 10.66%
2005 36 6.63% 4.50%
2005 36 5.86% 3.45%
2006 29 16.82% 15%
2006 29 16.15% 12.55%
2007 37 22.63% 17.25%
2007 37 22.77% 16.97%
2008 3 18.66% 15.99%
2008 3 23.65% 21.12%
2009 5 27.69% 12.52%
2009 5 23.79% 10.15%
Total 207 19.92% 10% Total 207 19.89% 9.13%
Panel B: Underpricing in the AGAAP environment
Mean 21.29
Mean 20.97
Median 10.00
Median 8.62
Std. Dev. 45.05
Std. Dev. 44.99
Min -39.00
Min -40.49
Max 290.00 Max 291.25
Panel C: Underpricing in the IFRS environment
Mean 16.93
Mean 16.59
Median 11.21
Median 10.07
Std. Dev. 25.13
Std. Dev. 25.54
Min -33.89
Min -34.26
Max 140.00 Max 140.00
Panel D: Test for difference in means
t-statistic 0.8590
t-statistic 0.8647
p-value 0.3913
p-value 0.3882
Panel E: Test for difference in medians
z-statistic -0.7590
z-statistic -0.7100
p-value 0.4477 p-value 0.4780 This table presents summary descriptive statistics on 'raw' and 'market-adjusted' initial returns on the first day of trading. Panel D displays
results of two sample t-tests to test equality of error means of the partitioned samples. Panel E displays results of Wilcoxon-Mann-Whitney-
tests to test equality of error medians of the partitioned samples.

34
Table 6: Regression results for earnings forecast accuracy
Predicted sign
Total sample AGAAP sample IFRS sample
1 2 1 2 1 2
Constant +/- 2.6788*** 1.8486***
2.6207*** 1.6551**
2.8403*** 2.0282***
(4.49) (3.73)
(3.19) (2.42)
(3.38) (2.71)
AGE - -0.0009 -0.0015
0.0002 -0.0012
-0.0012 -0.0010
(-0.76) (-1.52)
(0.13) (-0.82)
(-0.60) (-0.96)
HORIZON + 0.0164* 0.0173**
0.0024 0.0149
0.0298* 0.0216*
(1.78) (2.34)
(0.19) (1.55)
(1.96) (1.96)
RETAIN - -0.0000 0.0006
0.0002 0.0012
-0.0005 -0.0001
(-0.01) (0.51)
(0.14) (0.79)
(-0.20) (-0.03)
SIZE - -0.1083*** -0.0864***
-0.0853** -0.0729**
-0.1484*** -0.1007***
(-3.84) (-3.51)
(-2.28) (-2.05)
(-3.59) (-2.77)
AUDITOR - -0.0968 -0.1144
-0.2419** -0.2297**
0.0783 0.0462
(-1.33) (-1.60)
(-2.24) (-2.14)
(0.86) (0.49)
UNW - -0.0484 -0.0523
0.0054 -0.0411
-0.1124 -0.0574
(-0.66) (-0.79)
(0.04) (-0.40)
(-1.28) (-0.66)
IFRS - -0.0898 0.0371
(-0.81) (0.64)
Industry
effects
Yes No
Yes No
Yes No
Year effects
Yes No
Yes No
Yes No
No of IPOs
221 221
124 124
97 97
R2
0.220 0.139
0.254 0.165
0.302 0.135
Adj. R2
0.131 0.111
0.126 0.122
0.139 0.0793
F-statistic 2.436 5.046 3.854 4.075 2.471 2.413 This table presents results from OLS regressions with AFE as the dependent variable for the overall (2001-2009), pre-IFRS (2001-2004), and post-IFRS (2005-2009) periods. The pre-IFRS and post-IFRS sample sizes consist of
121 and 97 profit forecasts, respectively. The independent variables are: AGE - the number of years that each listing firm has been in operation before the year of listing, HORIZON - the number of months between the issue of
the prospectus and the end of the forecasting period, RETAIN - proportion of retained ownership by the pre-IPO shareholders, SIZE - the logarithm of the total market capitalisation of an IPO, AUDIT - auditor reputation: „1‟
for reputable auditors defined as one of (PriceWaterhouseCoopers, Deloitte and Touche, Ernst and Young and KPMG) or „0‟ for non-reputable auditors, UND - underwriters reputation: „1‟ for underwriter presence: „1‟ if the
offer has been underwritten and „0‟ if there was no underwriter; and IFRS – If the IPO has gone public using traditional Australian GAAP for its profit numbers it receives the value of „0‟ otherwise if the IPOs has gone public
using IFRS accounts it gets the value of „1‟. *** Significant at the one per cent level. **Significant at the five per cent level *Significant at the ten per cent level, t -statistics are robust for heteroskedasticity using the White
(1980) method.The t-statistics (in parentheses) are based on White's (1980) heteroscedasticity-consistent standard errors. The model specifications differ in their application of industry and year effects. *, ** and *** denote
statistical significance at the 10%, 5% and 1% significance-level (two-tailed), respectively.
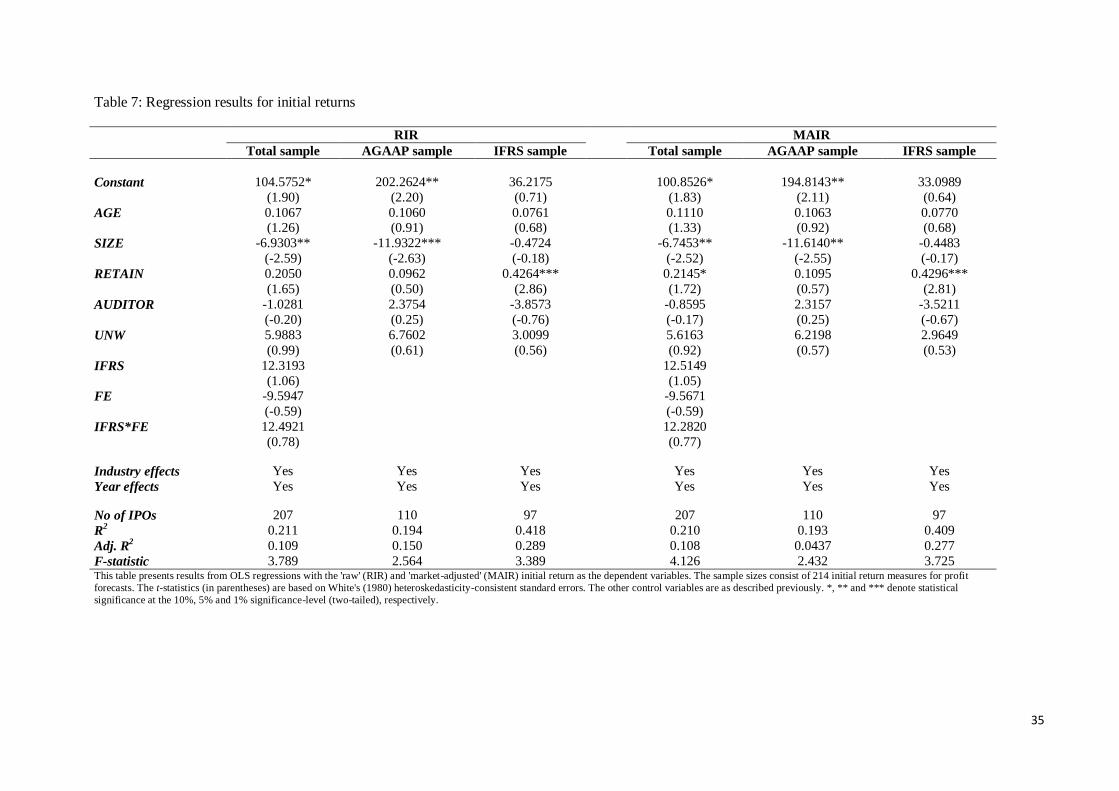
35
Table 7: Regression results for initial returns
RIR MAIR
Total sample AGAAP sample IFRS sample
Total sample AGAAP sample IFRS sample
Constant 104.5752* 202.2624** 36.2175
100.8526* 194.8143** 33.0989
(1.90) (2.20) (0.71)
(1.83) (2.11) (0.64)
AGE 0.1067 0.1060 0.0761
0.1110 0.1063 0.0770
(1.26) (0.91) (0.68)
(1.33) (0.92) (0.68)
SIZE -6.9303** -11.9322*** -0.4724
-6.7453** -11.6140** -0.4483
(-2.59) (-2.63) (-0.18)
(-2.52) (-2.55) (-0.17)
RETAIN 0.2050 0.0962 0.4264***
0.2145* 0.1095 0.4296***
(1.65) (0.50) (2.86)
(1.72) (0.57) (2.81)
AUDITOR -1.0281 2.3754 -3.8573
-0.8595 2.3157 -3.5211
(-0.20) (0.25) (-0.76)
(-0.17) (0.25) (-0.67)
UNW 5.9883 6.7602 3.0099
5.6163 6.2198 2.9649
(0.99) (0.61) (0.56)
(0.92) (0.57) (0.53)
IFRS 12.3193
12.5149
(1.06)
(1.05) FE -9.5947
-9.5671
(-0.59)
(-0.59)
IFRS*FE 12.4921
12.2820
(0.78)
(0.77)
Industry effects Yes Yes Yes
Yes Yes Yes
Year effects Yes Yes Yes
Yes Yes Yes
No of IPOs 207 110 97
207 110 97
R2 0.211 0.194 0.418
0.210 0.193 0.409
Adj. R2 0.109 0.150 0.289
0.108 0.0437 0.277
F-statistic 3.789 2.564 3.389 4.126 2.432 3.725 This table presents results from OLS regressions with the 'raw' (RIR) and 'market-adjusted' (MAIR) initial return as the dependent variables. The sample sizes consist of 214 initial return measures for profit
forecasts. The t-statistics (in parentheses) are based on White's (1980) heteroskedasticity-consistent standard errors. The other control variables are as described previously. *, ** and *** denote statistical
significance at the 10%, 5% and 1% significance-level (two-tailed), respectively.
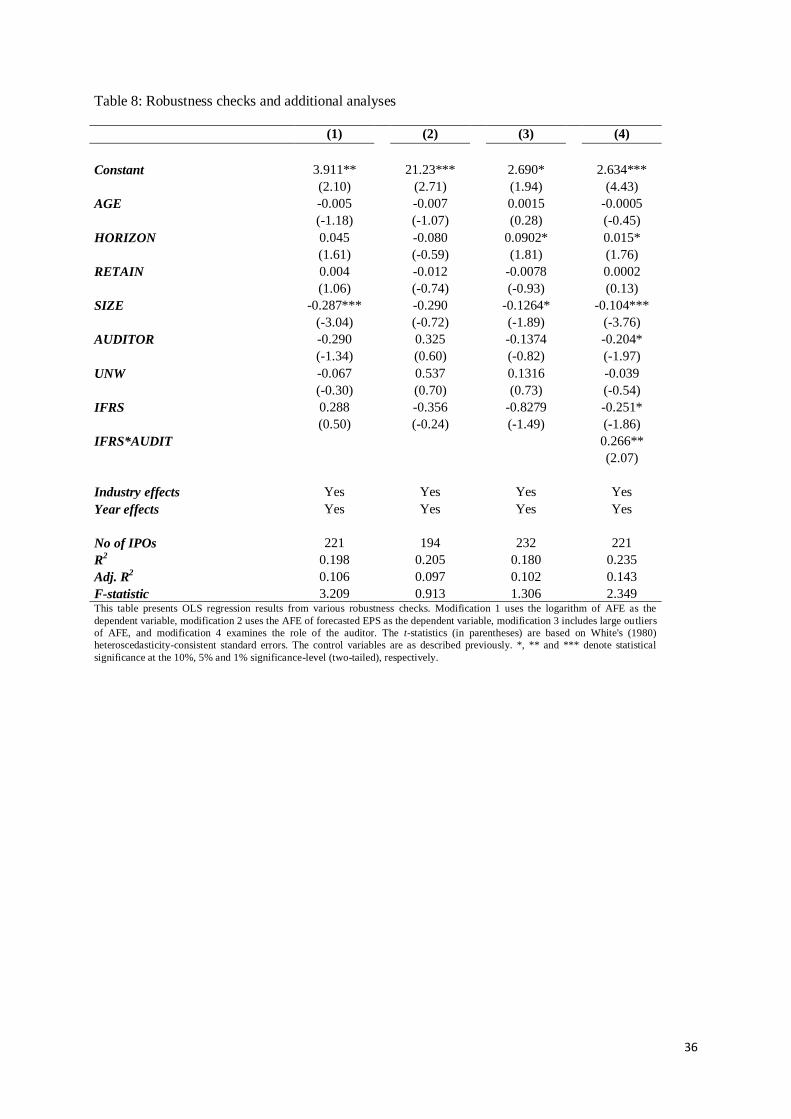
36
Table 8: Robustness checks and additional analyses
(1) (2) (3) (4)
Constant 3.911**
21.23***
2.690*
2.634***
(2.10)
(2.71)
(1.94)
(4.43)
AGE -0.005
-0.007
0.0015
-0.0005
(-1.18)
(-1.07)
(0.28)
(-0.45)
HORIZON 0.045
-0.080
0.0902*
0.015*
(1.61)
(-0.59)
(1.81)
(1.76)
RETAIN 0.004
-0.012
-0.0078
0.0002
(1.06)
(-0.74)
(-0.93)
(0.13)
SIZE -0.287***
-0.290
-0.1264*
-0.104***
(-3.04)
(-0.72)
(-1.89)
(-3.76)
AUDITOR -0.290
0.325
-0.1374
-0.204*
(-1.34)
(0.60)
(-0.82)
(-1.97)
UNW -0.067
0.537
0.1316
-0.039
(-0.30)
(0.70)
(0.73)
(-0.54)
IFRS 0.288
-0.356
-0.8279
-0.251*
(0.50)
(-0.24)
(-1.49)
(-1.86)
IFRS*AUDIT
0.266**
(2.07)
Industry effects Yes
Yes
Yes
Yes
Year effects Yes
Yes
Yes
Yes
No of IPOs 221
194
232
221
R2 0.198
0.205
0.180
0.235
Adj. R2 0.106
0.097
0.102
0.143
F-statistic 3.209 0.913 1.306 2.349 This table presents OLS regression results from various robustness checks. Modification 1 uses the logarithm of AFE as the
dependent variable, modification 2 uses the AFE of forecasted EPS as the dependent variable, modification 3 includes large outliers
of AFE, and modification 4 examines the role of the auditor. The t-statistics (in parentheses) are based on White's (1980)
heteroscedasticity-consistent standard errors. The control variables are as described previously. *, ** and *** denote statistical
significance at the 10%, 5% and 1% significance-level (two-tailed), respectively.