ifrs and pro forma earnings disclosures: determinants … · 3 ifrs and pro forma earnings...
TRANSCRIPT
1
IFRS and Pro Forma Earnings Disclosures: Determinants and Consequences
Lance Malone,a Ann Tarcab and Marvin Weeb*
4 October 2012
a Employee, Commonwealth Bank of Australia. The opinions expressed in this article are those of the authors only. They do not reflect the opinions of the Commonwealth Bank of Australia.
b Business School, University of Western Australia, Stirling Highway, Crawley, Western Australia 6009. * Corresponding author: Marvin Wee, UWA Business School, M250, 35 Stirling Highway, Crawley, Western Australia 6009. Email: [email protected] Tel: +61 8 6488 5860. We acknowledge the financial support of the BT Financial Group Victor Raeburn Honours Scholarship, the Hackett Foundation Alumni Honours Scholarship and the UWA Business School. We thank seminar participants at the University of Western Australia and the Australian National University 2011 College of Business and Economics Honours Colloquium for their helpful comments.
2
IFRS and Pro Forma Earnings Disclosures: Determinants and Consequences
Abstract
We investigate the relationship of release of pro forma earnings (PFE) by Australian firms
and the incidence and amount of IFRS remeasurements (related to financial instruments,
impairment and amortisation, and revaluation of tangible assets, investment property and
agricultural assets) and non-recurring items. Our sample includes 613 firm-years over the
period 2008-2010. PFE disclosure is more likely for firms with a higher incidence of
remeasured and non-recurring items although it is not associated with the amount of
individual remeasurement items (financial instruments, impairment and asset revaluations)
recognised in the financial statements. We find (a) larger PFE/GAAP earnings differences
and (b) several remeasured and non-recurring items adjusted by analysts to be value relevant.
PFE disclosures appear to be useful in highlighting remeasured and non-recurring amounts to
analysts. Our results suggest analysts’ adjustments to GAAP profit for items relating of asset
remeasurements under IFRS are associated with firm value.
Key words: IFRS, Pro forma earnings, voluntary disclosure, analyst forecast accuracy and dispersion, value relevance. JEL Codes: M40, M41
3
IFRS and Pro Forma Earnings Disclosures: Determinants and Consequences
1. Introduction
This study investigates the relationship of IFRS remeasurement items and the release of pro
forma earnings (hereafter PFE) disclosures by Australian firms. We consider the extent to
which PFE remeasurement items (specifically gains and losses on financial instruments,
amortisation and impairment adjustments, and revaluation of tangible assets, investment
property and agricultural assets) are relevant for information users, based on tests of their
association with properties of analyst forecasts and share prices. Pro forma financial
information is any financial information, financial figure, measure or ratio that (a) is not
specifically required to be disclosed in a financial report by the requirements of Chapter 2M
of the Corporations Act (including accounting standards); and/or (b) is not prepared in
accordance with all relevant accounting standards (ASIC 2005).
The reporting of PFE (also referred to as underlying, maintainable or non-GAAP earnings)
has become a pervasive phenomenon in Australia. In 2009 and 2010, 83 per cent of ASX100
companies reported some form of non-statutory profit (KPMG 2010). Firms claim that
statutory measures of performance fail to provide an accurate reflection of the underlying
reality of their business and thus non-statutory measures are used to provide a more relevant
and understandable view of firm performance (KPMG 2010). Prior research provides some
support for the view that PFE are useful for market participants. Studies show various
measures of PFE (e.g., operating earnings, GAAP less non-recurring items or analyst-
adjusted earnings) are more strongly associated with share prices and returns than GAAP
earnings (Bradshaw and Sloan, 2002; Brown and Sivakumar, 2003; Bhattacharya, Black,
4
Christensen and Larson, 2004). In addition, PFE are useful for forecasting future earnings
(Landsman, Miller and Yeh, 2007).
The introduction of International Financial Reporting Standards (IFRS) in Australia from 1
January 2005 may have changed the incentives and consequences of reporting PFE. IFRS
introduce new recognition and measurement requirements, notably more fair value
remeasurements (particularly in relation to financial instruments and recognition of assets
acquired in a business combination) and a stronger impairment testing regime. FINSIA and
AICD (2008)1 consider that some requirements of IFRS (for example, relating to fair value
measurement and non-cash items) may not provide the information needed to predict future
cash flows and earnings and to accurately value a business.
In contrast, the Australian Securities Investment Commission (ASIC) is concerned that PFE
do not always present the actual historical financial performance or position of the entity
(ASIC 2005) and therefore have the potential to mislead users of financial information. In
ASIC’s view, information prepared in accordance with accounting standards “will give a true
and fair view [of firm performance]...in all but rare circumstances” (ASIC, 2011). The
regulator’s view is unsurprising from two perspectives. First, ASIC’s role is to promote
compliance with the requirements of legally enforceable accounting standards (i.e., AASB,
based word-for-word on IASB-IFRS) so the regulator is unlikely to endorse PFE. Second,
research suggests PFE release can be opportunistic and reflect management self-interest. For
example, prior studies show PFE are used to generate higher firm valuations and to meet and
manage analyst earnings forecasts through higher earnings figures (Matsumoto, 2002;
Burgstahler and Eames, 2003).
1 Financial Services Institute of Australasia, a body representing financial analysts and other information users; Australian Institute of Company Directors.
5
The objective of IFRS is to provide useful information for decision making for a diverse
range of users (IASB, 1989). Analysts are included among the primary users of IFRS-based
financial information. We are interested in the tension between providing high quality, useful
information based on IFRS and the perceived necessity to adjust IFRS to remove the non-
recurring (and non-useful for forecasting) information. On the one hand, IFRS
remeasurements are required by accounting standards to improve the relevance of amounts
recognised in the financial statements. However, to the extent that the PFE adjustments are
not indicative of future cash flows we may expect analysts to exclude these items from
prediction models. We are interested in whether release of PFE benefits firms by increasing
earnings or benefits analysts by highlighting remeasured, unrealised items. In an efficient
market, an opportunistic adjustment or a non-relevant item should be ignored by market
participants. Further, a PFE adjustment or item that contains no additional information
(because it is a presentation of pre-existing GAAP information) should not be value relevant.
On the other hand, the PFE release could be beneficial if it brings analysts to focus on
information they may have otherwise passed over or if it provides additional information
(incremental to GAAP) about the items of interest.
Prior research provides mixed results about these questions. Studies suggest some confusion
among market participants about the relevance of PFE components. Burgstahler, Jiambalvo
and Shevlin (2002) conclude prices do not fully reflect the impact of excluded items on future
earnings. Similarly, Doyle, Lundholm and Soliman (2003) consider the relevance of excluded
items for forecasting and conclude investors underreact to the excluded components.
Landsman, Miller and Yeh (2007) investigate excluded items (total items, special items and
6
other exclusions) and find the items are relevant for forecasting but conclude they are
mispriced.
We extend this line of literature by exploring specific components of PFE relating to IFRS
remeasurements. We consider the extent to which some IFRS remeasurement items, included
to improve the relevance of reporting, are removed to make numbers more useful for
forecasting. We look specifically at gains and losses on financial instruments and impairment
adjustments, items that reflect fair value remeasurement requirements in IFRS. We consider
the extent these IFRS remeasurements, when highlighted via PFE, are useful for market
participants by considering their association with share prices and properties of analyst
forecasts (error and dispersion). Our research questions are as follows: To what extent are
PFE releases associated with IFRS remeasurement amounts? Are PFE (and IFRS
remeasurements) associated with properties of analyst forecasts and share prices?
We study 613 firm-years for large listed Australian companies (from the ASX200 market
index) over the period 2008-2010 and compare their year-end reported statutory profit with
any PFE release in a firm’s earnings announcement, statutory accounts or investor
presentation. We measure the amount of PFE/GAAP earnings differences and the occurrence
of remeasured and non-recurring items that have been identified as associated with release of
PFE. In our study there are six categories of items of interest, being four IFRS-related
remeasurement items and two sets of items classified as non-recurring items. The
remeasurement items are: gains/losses on financial instruments through profit and loss
(FININST); impairment expenses and reversals (IMPAIR); amortisation expense (AMORT);
and revaluation of tangible assets, investment property and agricultural assets (REVAL).
Other items are commonly described as ‘non-recurring’ and excluded from PFE (Bradshaw

7
and Sloan, 2002; KPMG, 2010). We include an item for gains/losses on mergers,
integrations, divestment of business operations, redundancies and restructuring (MERGER)
and then classify the remainder of non-recurring items as OTHER.
We collect data for the six items from two sources: first, the incidence and magnitude of
these items in firms’ statutory accounts and, second, a measure based on analyst adjustments.
The second source, based on analyst adjustments (under the heading non-recurring items in
the Aspect Huntley FinAnalysis database, provides a measure of the amount of the item
likely to be removed by analysts (hereafter analyst-PFE). The first measure captures the items
that may lead to firms providing PFE, thus it represents an accounting-based measure of the
likelihood that firms will provide PFE. The second measure reflects analysts’ adjustments to
GAAP earnings. It provides an analyst-based measure of items that are likely to be removed
by analysts when predicting future earnings.2
We expect and find firms with higher incidence (COUNT) of all six items (FININST,
IMPAIR, AMORT, REVAL, MERGER and OTHER) in their financial statements are more
likely to provide PFE disclosures. The total dollar amount of the items (MAGNIT) is not
associated with PFE release, however, firms with more amortisation reversals (AMORT) and
greater loss on restructuring (MERGER) are more likely to disclose PFE. In relation to the
analyst-adjusted amounts, we find the incidence of adjustments (COUNT) is positively
associated with firms’ PFE release. Considering the six items, firms releasing PFE are more
likely to have analyst adjustments to GAAP earnings for losses on financial instruments
(FININST) and impairment reversals (IMPAIR).
2 As explained in more detail in the method section, we classify all the items flagged as ‘non-recurring’ in the Aspect Huntley database into two categories: remeasurement (four items) and non-recurring (two items) as listed in the preceding paragraph.

8
In relation to the usefulness of PFE, we do not find a relationship between analyst forecast
accuracy and dispersion and the release of PFE. We conclude that, consistent with Lougee
and Marquardt’s (2004) results for firms’ with low GAAP informativeness, the usefulness of
release of PFE varies between firms. We find evidence of the value relevance of PFE for the
non-financial firms, as the amount of the PFE/GAAP difference is positively associated with
share price.
Considering the financial statement measures of the six items commonly included in PFE, we
find that individual items are associated with share price in some years but the relationship is
not constant between years. In contrast, the amounts of the six items as adjusted by analysts
exhibit a clearer pattern. The non-recurring items (MERGER and OTHER) are negatively and
significantly associated with share price in the pooled model (all firms over three years). In
addition, one or both of the items are significant for non-financial firms in each of the sub-
periods considered, relating to before (PRE_GFC) during (GFC) and after (post-GFC) the
financial crisis. The remeasurement item IMPAIR is negative and significant in the pooled
model and FININST and IMPAIR are negative and significant in the pre-GFC and GFC
periods while IMPAIR is negative and significant in the post-GFC period.
We interpret these results as follows. The observed increase in release of pro forma earnings
(KPMG, 2010) does not appear to be associated with the IFRS remeasurement standards
(specifically, standards relating to financial instrument remeasurement through profit and
loss, impairment and revaluation). Not surprisingly, PFE release is associated with non-
recurring items relating to mergers and restructuring. We conclude PFE are value relevant,
because they highlight to analysts information relevant to predicting earnings. Analysts’
adjustment to GAAP earnings are associated with share prices because PFE releases
9
supplement GAAP financial statement information and thus are an important part of the
information used in capital markets. Importantly, we show analysts’ revisions to profit,
relating to their view of the validity of the amounts recognised in under IFRS for
remeasurements of financial, tangible and intangible assets are associated with share price
and thus firm valuation.
Our study adds to the PFE literature as it considers the usefulness of specific PFE items. By
considering individual items, specifically the IFRS remeasurement items, we extend earlier
studies that have focused mainly on aggregate measures of PFE and its components and have
not used IFRS data. We show that PFE has a role in communicating information that is used
by analysts. We also contribute to the evaluation of the usefulness of IFRS and the role of
PFE disclosures in a setting where GAAP requires recognition of unrealised gains and losses
in relation to accounting financial instruments and some tangible and intangible assets, areas
of controversy under IFRS. Thus our evidence will be of interest to the ongoing debate about
the costs and benefits of IFRS (AFR, 2011). While we study only Australian firms, the
questions we address are equally relevant in other developed capital markets and jurisdictions
that have adopted IFRS. Accordingly, our findings may be relevant to studies of other
countries where firms and analysts use pro forma earnings measures.
2. Background and Research Predictions
2.1. Voluntary Information Disclosures and IFRS
The voluntary disclosure of private information by firms is a common equilibrium strategy in
many theoretical models of disclosure (see for example, Milgrom 1981; Milgrom and Roberts
1986; Jovanovic 1982). Models incorporating costs can generally be interpreted as showing a
10
trade-off between the benefits obtained and the associated costs (Dye 1985, 1986; Verrecchia
1983, 1990) and that the equilibrium of the trade-off is achieved when the marginal benefits
of additional disclosure are equal to the marginal costs (Diamond and Verrecchia 1991).
As it relates to PFE, a partial equilibrium of disclosure would be expected to occur when the
benefits of ostensibly reflecting the ‘real’ underlying earnings exceeds the costs of
preparation and dissemination of this information. Moreover, the benefits of releasing this
information would likely be greatest when PFE are more favourable relative to the statutory
profit figure. Thus, partial disclosure of PFE would be expected to occur when the PFE
exceed statutory profit. This appears to be reflected in practice, as some 72 per cent (2009: 76
per cent) of ASX100 firms showed a non-statutory profit figure that was higher than the
reported statutory profit in 2010 (KPMG 2010). In this sense, PFE, like all discretionary
disclosures, could exhibit an attempt to manage perception of earnings (elsewhere called
passive earnings management, or earnings management by omission).3
However, firms maintain that the adjustments are necessary to modify the effects of
accounting entries (required by accounting standards) that do not relate to business operations
or accurately reflect the underlying business reality, and are therefore less relevant to
investors. The contentious items relate to remeasurements (gains/losses on financial
instruments through profit and loss; and impairment expense) and non-recurring items
(gains/losses on mergers, integrations and divestment of business operations; and
redundancies and restructuring expense). To the extent that these transactions in GAAP are
uninformative or misleading for the purposes of predicting future returns, we posit that their
exclusion can generate benefits for users of financial information (particularly analysts), and
3 We use the term earnings management consistently with prior literature to refer to the strategic exercise of managerial discretion in influencing the earnings figure reported to external audiences (Degeorge et al., 1999)
11
hence a firm’s exposure to these items provides an incentive for the disclosure of PFE. Thus
we expect firms with a higher amount of (a) IFRS remeasurements or (b) non-recurring items
are more likely to release PFE.4
2.2. Usefulness of Accounting Information
The importance of providing financial information for security market analysts is well
established. In the US, Lang and Lundholm (1996) show that better quality disclosure
reduces divergence in analyst forecasts through increased precision of information. Basu et
al. (1998) examine whether the use of a variety of accounting measurement approaches
affects the ex-ante predictability of earnings for a sample of firms from ten developed
countries. They find analyst forecast accuracy is higher in countries with greater accounting
disclosure quality. Hope (2003a) extends these studies by examining the relationship between
the accuracy of analysts' earnings forecasts, the level of annual report disclosure and the
degree of enforcement for a sample of 890 firms for 22 countries. He shows firm-level
disclosures are positively related to forecast accuracy, suggesting that higher levels of
disclosure in annual reports provide useful information to analysts.
A goal of adoption of IFRS is to improve the quality of financial information, that is, its
transparency, comparability and understandability (see for example, EU 1608/2002). There is
some evidence that IAS/IFRS have improved analysts’ information environments, however
results must be interpreted with care as they vary with study design (e.g., countries, years and
firms included; mandatory or voluntary adopters; domestic or foreign analysts; extent of
difference to prior national GAAP). Ashbaugh and Pincus (2001) find a decrease in the
analyst forecast errors following the voluntary adoption of international standards. Post-2005,
4 We do not distinguish between gains or losses on these items as both should be informative.
12
Horton, Serafeim and Serafeim (2010) finds forecast accuracy improves after mandatory
IFRS adoption for both mandatory and voluntary adopters. However, while Byard, Li and Yu
(2011) report improvements post-IFRS adoption in the EU, they are only for firms where
enforcement is stronger and national GAAP/IFRS differences are greater.
Goodwin, Ahmed and Heaney (2008) find that the values of earnings and equity under IFRS
are not more value relevant than GAAP earnings and equity for Australian firms, raising
questions about whether IFRS actually improves the information environment for Australian
analysts. Chalmers, Clinch and Godfrey (2010) find an increase in the value relevance of
earnings post-2005 for Australian firms, explained by an increase in earnings persistence
under IFRS. Like Goodwin et al. (2008), however, the value relevance of the book value of
equity is unaffected. Cotter, Tarca and Wee (2011) examine the impact of adoption on the
properties of analyst forecasts and suggest that analysts following Australian firms did benefit
from the adoption of IFRS as there is reduced error and dispersion in the post-adoption
period.
If IFRS does represent an improvement in information quality for Australian firms relative to
previous national standards, their use does not necessarily preclude the usefulness of other or
additional disclosures.
A number of US studies indicate that investors find PFE are more strongly associated with
returns, share price and future earnings than GAAP earnings. In seminal work, Bradshaw and
Sloan (2002) investigate the relationship between US GAAP earnings and so-called ‘street’
earnings and find street earnings are more strongly associated with returns. Similarly, Brown
and Sivakumar (2003) find operating earnings are more strongly associated with share price
13
than GAAP net income. They suggest GAAP net income contains many non-operating items
that reduce its value relevance compared to operating earnings. Lougee and Marquardt (2004)
suggest the higher value relevance of PFE derives from their incremental information content
relative to GAAP and thus pro forma earnings are useful only for firms with low-GAAP
informativeness. Thus, it appears that pro forma information is potentially an important
source of information about firm performance.
However, studies suggest that PFE may also be released opportunistically by management to
shape investors’ perceptions, particularly in relation to less sophisticated retail investors
(Bhattacharya et al. 2007). While the exclusion of non-recurring losses may be argued to be
justifiable, some firms also exclude standard recurring items, such as depreciation and
common operating expenses (Black et al., 2010). If this is the case, PFE may be ‘noisy’
information and difficult for market participants to interpret. Current research provides mixed
results about these questions. Indeed, studies suggest some confusion among market
participants about the relevance of the components of PFE. Studying US listed firms,
Burgstahler, Jiambalvo and Shevlin (2002) conclude prices do not fully relfect the
implications of excluded items (Compustat’s special items) for future earnings. Doyle,
Lundholm and Soliman (2003) also consider the relevance of excluded items for forecasting
and conclude investors underreact to the excluded components. Landsman, Miller and Yeh
(2007) consider both forecasting and value relevance implications of excluded items
(Compustat’s total items, special items and other exclusions). They find the items are relevant
for forecasting but significant coefficients but of the reverse sign of the excluded items lead
the authors to conclude the items are mispriced.
14
The opportunistic (or ‘aggressive’) use of PFE has been measured mainly though the
exclusion of recurring items and the use of PFE to meet benchmarks (e.g., Black and
Christensen 2009; Brown et al. 2010). Firms with stronger corporate governance have been
found to have less aggressive exclusions (Frankel, Mcvay, and Soliman 2010; Jennings and
Marques 2010). Black et al. (2010) show that mangers are less likely to disclose aggressive
PFE after the enactment of the Sarbanes-Oxley Act (post-SOX) and the implementation of
Regulation G in the US. However, Black et al. (2010b) still find use of aggressive PFE
disclosures post-regulation. Interestingly, Black et al. (2010), replicating Bhattacharya et al.
(2003) in a post-SOX environment (i.e. one subject to greater regulatory constraints and
oversight), find that while investors still pay more attention to PFE than to GAAP operating
earnings, investors also appear to discount PFE when they perceive that earnings exclusions
are overly aggressive.
Our study brings together the two areas of investigation discussed above. Some
commentators contend that IFRS are flawed, particularly in relation to fair value
remeasurement requirements (KPMG, 2010). If these views are correct and remeasurements
and non-recurring transactions distort firms’ underlying economic reality, additional
disclosures that reveal the impact of these items may be an important supplementary source
of information for forecasting. Therefore we expect that, after controlling for other factors
known to affect properties of analyst forecasts, forecasts will be more accurate and have less
disagreement for firms releasing PFE and having larger PFE/GAAP adjustments. In addition,
based on the evidence that the information contained in PFE is useful for market participants
(Bradshaw and Sloan, 2002; Brown and Sivakumar, 2003), we also expect PFE will be value
relevant. In relation to components of PFE, we expect remeasurement amounts to be
associated with price, although the prior research on other specific components of PFE is
15
mixed on this point (Burgstahler et al., 2002; Doyle et al., 2003; Landsman et al., 2007). Our
hypotheses can be stated formally as:
H1: PFE firms are more likely to have more IFRS remeasurements;
H2: PFE firms are more likely to have lower analyst (a) forecast error and (b)
dispersion; and
H3: PFE are positively associated with share price.
3. Data and Method
3.1. Sample Selection and Data Collection
We study firms from the ASX 200 (based on the largest 200 Australian firms by market
capitalisation) because they are the most economically important and are more likely to have
diverse shareholders, substantial financing needs and to be followed by security analysts.5 We
hand-collected disclosure of PFE from firms’ annual reports and earnings announcements
(i.e., preliminary financial statements and investor presentations) lodged with the ASX
(accessed through the Securities Industry Research Centre of Asia-Pacific (SIRCA)
Australian Company Announcement database). We searched for PFE using Abode Acrobat
Pro text search software and terms such as ‘underlying earnings’ and ‘normalised profit’.6 We
use the term ‘headline’ to record when the PFE is presented before GAAP earnings. The total
5 The ASX 200 represents approximately 80% of the market capitalisation of the Australian Securities Exchange. 6 We determined the search terms from a review of the literature about pro forma earnings and a pilot study of the largest 20 firms, which confirmed the most commonly used terms. KPMG (2010) gave a list of key words commonly used in reporting pro forma information, specifically: “underlying earnings”, “normalised profit” and “cash earnings”. Using these words, we examined the Annual Report, Preliminary Final Report and Investor Relations slide show presentation of the selected firms. The pilot study confirmed the use of these words and revealed use of the terms: “before significant items” and “core earnings” which were then added to our word search list.
16
sample comprises 613 firm-years from 2008 to 2010, of which 388 firm-years (63.3%)
released pro forma profit information (Table 1).
We identified the items expected to be associated with the release of pro forma earnings
based on practitioner studies (Ernst & Young, 2007; KPMG, 2010) and observed that they
related to both remeasured and non-recurring items. We classified the relevant financial
statement items in firms’ statutory accounts (extracted from the Aspect Huntley database) and
all of the items recorded by Aspect Huntley as ‘non-recurring’ analysts adjustments into two
groups: (a) IFRS remeasurement items and (b) non-recurring items.
Thus our first source of data is the amount for remeasured and non-recurring items in the
annual firm accounts, extracted from the Aspect FinAnalysis database of Profit and Loss
items. Our second source of data is the list of non-recurring items, that is, the analyst
adjustments for each firm-year, by the Aspect Huntley analysts following the firm. The
analyst adjustments are defined as “items which are part of the organisation’s operations but
are considered abnormal as they are of a non-recurring nature” (Aspect Huntley 2011) and
reflect analysts’ views of the items not part of maintainable or underlying earnings to be used
to predict future earnings. In this study, we refer to these items as analyst adjusted amounts.
Our coding identifies six groups of items from within (1) the firms’ statutory profit and loss
accounts and (2) the ‘non-recurring items’ file. There are four groups of IFRS remeasurement
items namely (i) gains or losses on the remeasurement of financial instruments to fair value
through profit and loss under AASB 139 Financial Instruments and (ii) impairment expenses
under AASB 136 Impairment of Assets, (iii) amortisation expense under AASB 138
17
Intangible assets,7 and (iv) Revaluation of tangible assets under AASB 116 Property, Plant
and Equipment, investment property under AASB 140 Investment Property and agricultural
assets under AASB 141 Agriculture. There are two groups of non-recurring items. The first
includes gains or losses associated with mergers, integrations, divestment of business
operations, redundancies and restructuring costs. The second is a catch-all category for any
remaining items, called other. This group contains the items that have not been classified as
belong to any of the previous five categories.
To determine the association of potential PFE information (in firm accounts) and analyst
adjustments with properties of analyst forecasts, we extracted a sub-sample of firms with two
or more analysts. Data to calculate analyst forecast error and dispersion at three, six and nine
months prior to firm financial year end are obtained from the I/B/E/S database. Share prices
are obtained from the SPPR database provided by SIRCA and other financial data are
obtained from the Aspect Huntly database.
3.2. Data Analysis
Prior to running the models to test our hypothesis, we run binary logistic regression models to
explore whether release of PFE is associated with exposure to IFRS remeasurements and
non-recurring items. The models are as follows:
7 To be strictly correct, amortisation is not a ‘remeasurement’ as used in AASB 139 or 116. However, we include amortisation expense because it is an item that has been commonly adjusted in the past (e.g. analysts add back amortisation of goodwill, see Cotter et al. 2012).
18
10 11
, 0 1 , 2 , 3 , 4 , 5 ,
6 , 7 , 8 , 9 ,
, , 12 , 13 ,
14 , ,
_
i t i t i t i t i t i t
i t i t i t i t
i t i t i t i t
i t i t
PROFORMA FININST IMPAIR AMORT REVAL MERGER
OTHER FIN MINING LOSS
ACHEARN SIZE FOLLOW VARCFO
PRE GFC
15 , , , _ i t i t i tPOST GFC (1)
, 0 1 , , i t i t i tPROFORMA COUNT controls (2)
, 0 1 , , i t i t i tPROFORMA MAGNIT controls (3)
Where:
, Dummy variable equal to 1 for firms that have released pro forma
financial information, zero otherwise.
, Current year’s net gain or loss taken to profit and loss for the fair value
remeasurement of financial instruments for firm i, scaled by the firm’s
absolute value of cash flow from operations for the year.
, Current year’s impairment expense or reversal for firm i, scaled by the
firm’s absolute value of cash flow from operations for the year.
, Current year’s amortisation expense or reversal for firm i, scaled by
the firm’s absolute value of cash flow from operations for the year.
, Current year’s net gain or loss on revaluation of tangible assets,
investment property and agricultural assets for firm i, scaled by the
firm’s absolute value of cash flow from operations for the year.
, Current year’s gains or losses associated with mergers, integrations,
divestments of business operations, redundancies and restructuring for
firm i, scaled by the firm’s absolute value of cash flow from operations
for the year.
, Current year’s items in the Aspect Huntley ‘non-recurring items’ file
that are not included in any of the five variables above for firm i, scaled
by the firm’s absolute value of cash flow from operations for the year.
, Count of the current year’s total number of non-zero items for pro forma
information variables (FININST, IMPAIR, AMORT, REVAL, MERGER
and OTHER) from 0 to 6 for firm i.
, Net sum of the current year’s total value (in dollars) of non-zero values

19
for pro forma information variables (FININST, IMPAIR, AMORT,
REVAL, MERGER and OTHER) for firm i, scaled by the firm’s absolute
value of cash flow from operations for the year
Control variables:
, Dummy variable equal to 1 for firms in the GICS Financials Industry
Group, zero otherwise.
, Dummy variable equal to 1 for firms in the GICS Metals and Mining
industry, zero otherwise.
, Dummy variable equal to 1 if the current year’s earnings per share is
negative, zero otherwise.
, The absolute value of the difference between the current year’s actual
earnings per share and last year’s actual earnings per share, deflated by
the share price at the end of the current year.
, The natural log of the firm’s market capitalisation at the beginning of
the year.
, The number of analysts following the firm.
, Standard deviation of cash flows from operations over the previous 10
years at financial year end.
_ , Dummy variable equal to one for observations with financial year end
prior to 1 July 2008.
_ , Dummy variable equal to one for observations with financial year end
post 30 June 2009.
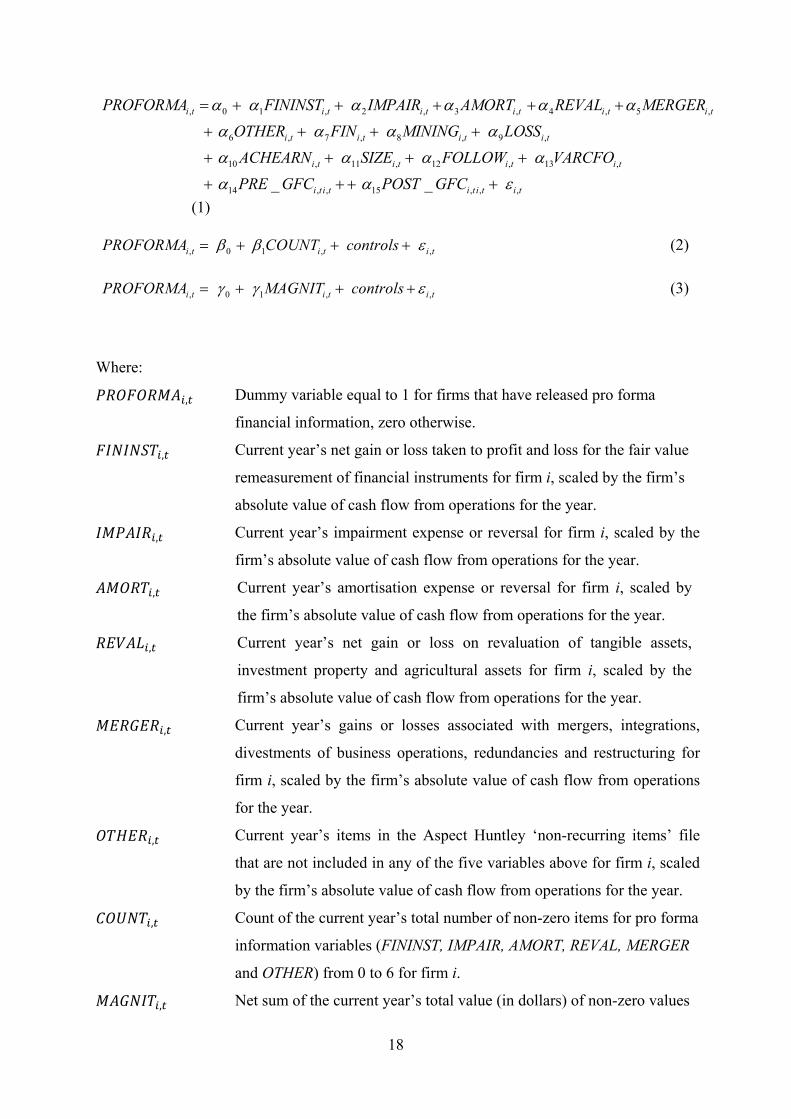
In Model 1 we include COUNT, calculated as 0 (none of the six items) to 6 (the firm has a
non-zero value for all six items). In Model 2 we replace COUNT with MAGNIT, which is the
sum of the dollar value of all six items, to test the impact of the net value of the items. In
Model 3 we include the six items (FININST, IMPAIR, AMORT, REVAL, MERGER and
OTHER) as individual amounts. Control variables include industry dummy variables (FIN
and MINING) as we expect firms in the financial sector and mining sector to be more likely
to have remeasured amounts included in the six items. We include SIZE and NOFOLLOW to
20
control for differences between firms in analyst following, which may relate to the PFE
release. PFE may be more likely when firms experience losses or have variability in earnings
(Loguee and Marquardt, 2004) so we include variables for incurring a loss (LOSS), change in
earnings from last year (ACHEARN) and variability of earnings over time (VARCFO).8 PFE
release may change over time (Bradshaw and Sloan, 2002) so we include dummy variables
(PRE_GFC and POST_GFC) to capture the effects of the uncertainty associated with the
global financial crisis period (1 July 2008 - 30 June 2009).
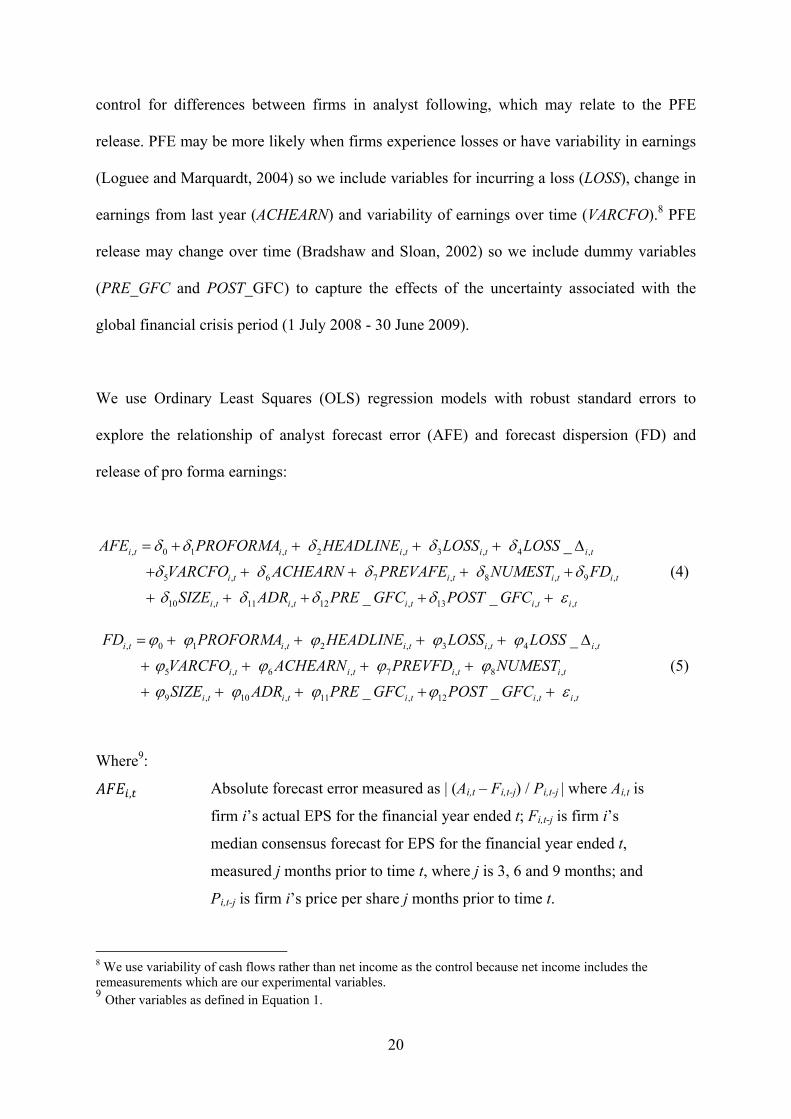
We use Ordinary Least Squares (OLS) regression models with robust standard errors to
explore the relationship of analyst forecast error (AFE) and forecast dispersion (FD) and
release of pro forma earnings:
2 , 3 , 4 ,
5 , 6 , , ,
, 11 , 12 , 13 ,
, 0 1 ,
7 8 9
10 ,
_
_ _
i i t i tt i i t
i t i t i t i t
i t i t i t i t i t
t HEADLINE LOSS LOSS
VARCFO ACHEARN PREVAFE NUMEST FD
SIZE ADR PRE GFC POST GFC
AFE PROFORMA
(4)
5 6 7 8
9
, 0 1 , 2 , 3 , 4 ,
, , , ,
, 10 , 11 , 12 , ,
_
_ _
i t i t i t i t i t
i t i t i t i t
i t i t i t i t i t
FD PROFORMA HEADLINE LOSS LOSS
VARCFO ACHEARN PREVFD NUMEST
SIZE ADR PRE GFC POST GFC
(5)
Where9:
, Absolute forecast error measured as | (Ai,t – Fi,t-j) / Pi,t-j | where Ai,t is
firm i’s actual EPS for the financial year ended t; Fi,t-j is firm i’s
median consensus forecast for EPS for the financial year ended t,
measured j months prior to time t, where j is 3, 6 and 9 months; and
Pi,t-j is firm i’s price per share j months prior to time t.
8 We use variability of cash flows rather than net income as the control because net income includes the remeasurements which are our experimental variables. 9 Other variables as defined in Equation 1.
21
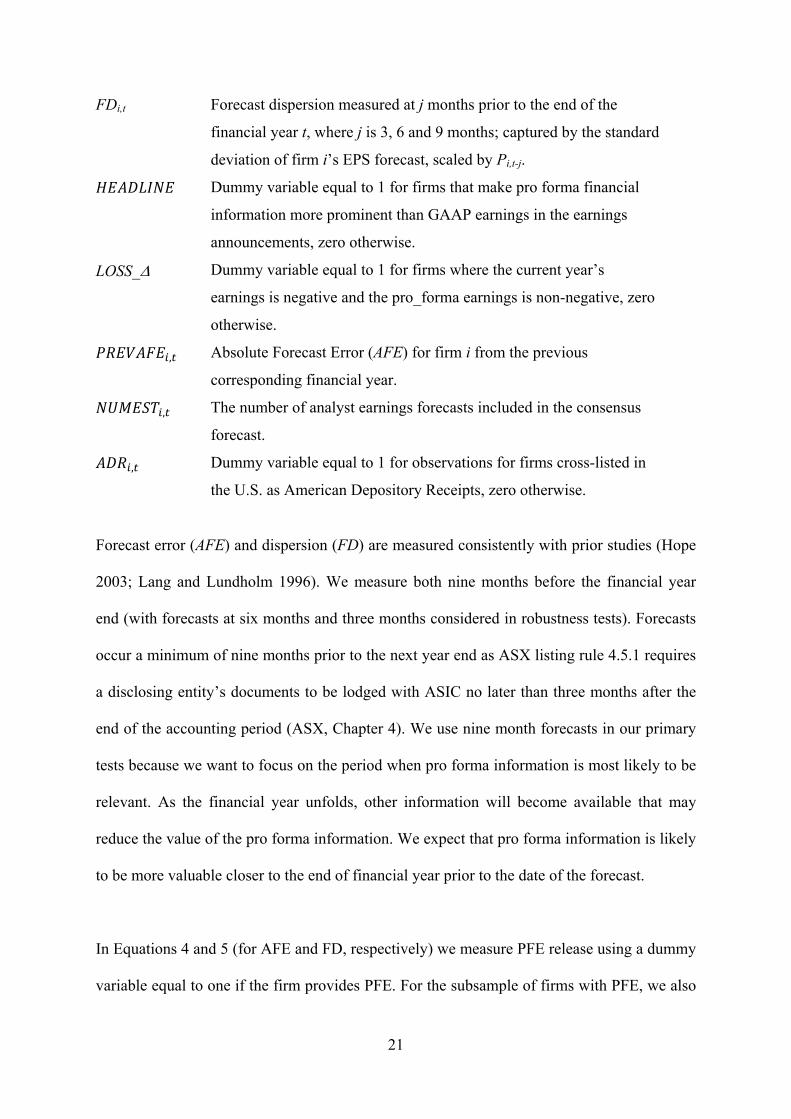
FDi,t Forecast dispersion measured at j months prior to the end of the
financial year t, where j is 3, 6 and 9 months; captured by the standard
deviation of firm i’s EPS forecast, scaled by Pi,t-j.
Dummy variable equal to 1 for firms that make pro forma financial
information more prominent than GAAP earnings in the earnings
announcements, zero otherwise.
LOSS_ Dummy variable equal to 1 for firms where the current year’s
earnings is negative and the pro_forma earnings is non-negative, zero
otherwise.
, Absolute Forecast Error (AFE) for firm i from the previous
corresponding financial year.
, The number of analyst earnings forecasts included in the consensus
forecast.
, Dummy variable equal to 1 for observations for firms cross-listed in
the U.S. as American Depository Receipts, zero otherwise.
Forecast error (AFE) and dispersion (FD) are measured consistently with prior studies (Hope
2003; Lang and Lundholm 1996). We measure both nine months before the financial year
end (with forecasts at six months and three months considered in robustness tests). Forecasts
occur a minimum of nine months prior to the next year end as ASX listing rule 4.5.1 requires
a disclosing entity’s documents to be lodged with ASIC no later than three months after the
end of the accounting period (ASX, Chapter 4). We use nine month forecasts in our primary
tests because we want to focus on the period when pro forma information is most likely to be
relevant. As the financial year unfolds, other information will become available that may
reduce the value of the pro forma information. We expect that pro forma information is likely
to be more valuable closer to the end of financial year prior to the date of the forecast.
In Equations 4 and 5 (for AFE and FD, respectively) we measure PFE release using a dummy
variable equal to one if the firm provides PFE. For the subsample of firms with PFE, we also
22
run these models including a measure of size of PFE measured as PFE relative to GAAP
earnings ( _∆ , ). We expect that firms providing PFE and those that have larger
PFE/GAAP earnings differences are more likely to have lower error and less dispersion in
forecasts.
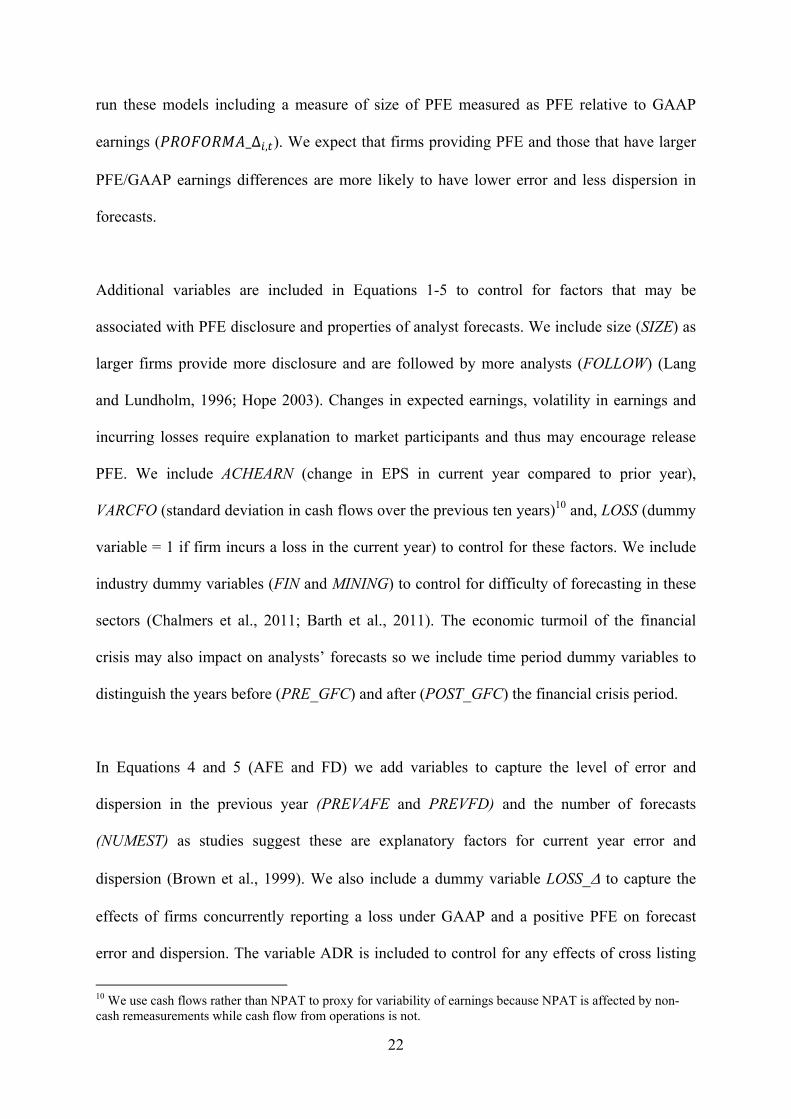
Additional variables are included in Equations 1-5 to control for factors that may be
associated with PFE disclosure and properties of analyst forecasts. We include size (SIZE) as
larger firms provide more disclosure and are followed by more analysts (FOLLOW) (Lang
and Lundholm, 1996; Hope 2003). Changes in expected earnings, volatility in earnings and
incurring losses require explanation to market participants and thus may encourage release
PFE. We include ACHEARN (change in EPS in current year compared to prior year),
VARCFO (standard deviation in cash flows over the previous ten years)10 and, LOSS (dummy
variable = 1 if firm incurs a loss in the current year) to control for these factors. We include
industry dummy variables (FIN and MINING) to control for difficulty of forecasting in these
sectors (Chalmers et al., 2011; Barth et al., 2011). The economic turmoil of the financial
crisis may also impact on analysts’ forecasts so we include time period dummy variables to
distinguish the years before (PRE_GFC) and after (POST_GFC) the financial crisis period.
In Equations 4 and 5 (AFE and FD) we add variables to capture the level of error and
dispersion in the previous year (PREVAFE and PREVFD) and the number of forecasts
(NUMEST) as studies suggest these are explanatory factors for current year error and
dispersion (Brown et al., 1999). We also include a dummy variable LOSS_ to capture the
effects of firms concurrently reporting a loss under GAAP and a positive PFE on forecast
error and dispersion. The variable ADR is included to control for any effects of cross listing
10 We use cash flows rather than NPAT to proxy for variability of earnings because NPAT is affected by non-cash remeasurements while cash flow from operations is not.
23
in the US since the US environment may encourage provision of more information for
analysts or, alternatively, discourage provision of PFE.
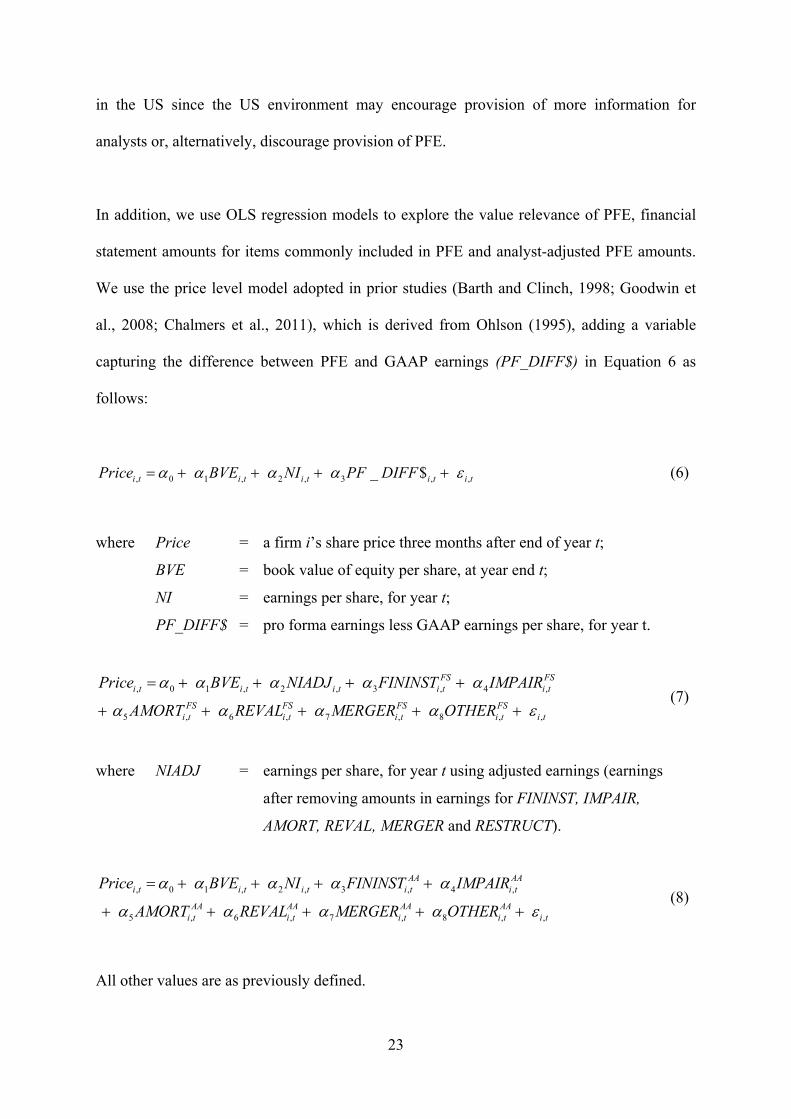
In addition, we use OLS regression models to explore the value relevance of PFE, financial
statement amounts for items commonly included in PFE and analyst-adjusted PFE amounts.
We use the price level model adopted in prior studies (Barth and Clinch, 1998; Goodwin et
al., 2008; Chalmers et al., 2011), which is derived from Ohlson (1995), adding a variable
capturing the difference between PFE and GAAP earnings (PF_DIFF$) in Equation 6 as
follows:
, 0 1 , 2 , 3 , , _ $ i t i t i t i t i tPrice BVE NI PF DIFF (6)
where Price = a firm i’s share price three months after end of year t;
BVE = book value of equity per share, at year end t;
NI = earnings per share, for year t;
PF_DIFF$ = pro forma earnings less GAAP earnings per share, for year t.
, 0 1 , 2 , 3 , 4 ,
5 , 6 , 7 , 8 , ,
FS FSi t i t i t i t i t
FS FS FS FSi t i t i t i t i t
Price BVE NIADJ FININST IMPAIR
AMORT REVAL MERGER OTHER
(7)
where NIADJ = earnings per share, for year t using adjusted earnings (earnings
after removing amounts in earnings for FININST, IMPAIR,
AMORT, REVAL, MERGER and RESTRUCT).
, 0 1 , 2 , 3 , 4 ,
5 , 6 , 7 , 8 , ,
AA AAi t i t i t i t i t
AA AA AA AAi t i t i t i t i t
Price BVE NI FININST IMPAIR
AMORT REVAL MERGER OTHER
(8)
All other values are as previously defined.
24
Based on prior research, we predict book value of equity and earnings to be relevant to share
price, and expect positive coefficients on BVE and NI. Consistent with the approach of
Goodwin et al. (2008) and Barth et al. (2011), where additional items are included in the
value relevance model, we add PF_DIFF$ in Equation 6. If PFE are informative, we expect
PF_DIFF$ to be associated with price. In Equation 7 we add the amounts for financial
statement items commonly included in PFE (FININSTFS, IMPAIRFS, AMORTFS, REVALFS,
MERGERFS and OTHERFS).11 The variable NIADJ excludes the amounts of the six items
from the GAAP net income. We expect that the six items will be related to price as they are
considered relevant for predicting future earnings. Finally, in a variation of Equation 7, we
include the analyst-adjusted amounts for the six items (FININSTAA, IMPAIRAA, AMORTAA,
REVALAA, MERGERAA and OTHERAA). We expect these adjustments to be associated with
share price, as they are the adjustments made by analysts to arrive at predictions of future
earnings. Because Goodwin et al. (2008) finds financial services firms are affected by fewer,
more complex standards than most other industries, we expect the value relevance to be more
evident in the non-financial firms. As such, we run our models over the pooled sample and a
sample without the financial firms.
4. Results
4.1. Descriptive Statistics
A total of 385 out of 613 firm-years (63%) released pro forma earnings information (Table 1,
Panel A). For these firms, the mean (median) statutory Net Profit after Tax (NPAT) was
$403.85 (73.8) million, compared with the mean (median) PROFORMA figures of $635.27
11 The IFRS remeasurement and the non-recurring items, i.e. FININST, IMPAIR, AMORT, REVAL, MERGER and OTHER are on a per share basis.
25
(136.1) million (Table 1, Panel B). On average, PROFORMA is higher than NPAT. This
result is not surprising, as the most frequent adjustments are to add back expenses and losses
thus increasing profit.
<Insert Table 1 about here>
On average, NPAT and PROFORMA are highest in the later period, i.e., POST_GFC, at
$526.26 million and $666.10 million, respectively. The difference between PROFORMA and
GAAP earnings is largest during the GFC year ($402.80 million). Median NPAT varies
significantly over the period (Z = 14.97, p < 0.01) while PROFORMA does not, indicating
that PFE provides a more stable, and thus potentially more useful, measure for analysts.
<Insert Table 2 about here>
Table 2 presents descriptive statistics for data about the six items likely to be included in PFE
from two sources: profit and loss data from the firm’s statutory financial statements (Panel
A); and non-recurring items as measured by analysts (Panel B). For profit and loss items
(Panel A), firms have an average of 2.68 items (with a median of 3 and a maximum of 6).
The mean (median) of the total of the six items (MAGNIT) is -$228 million (-$25 million).
For analyst adjustments (Panel B), the average number of adjusting items is 1.39 (with a
median of 1 and a maximum 6). The mean (median) of the total of the six items (MAGNIT) is
-$122 million and the median is zero, indicating analysts adjust only some of the remeasured
and non-recurring items included in profit and loss and for some firms they make no
adjustments.
26
The largest average value of the financial statement items is IMPAIR (mean -$95 million,
median -$0.18 million) followed by OTHER (mean -$43, million, median 0) and AMORT
(mean -$32 million, median -$4.9 million). The largest average item in analyst adjustments is
IMPAIR (mean -$80 million, median 0) followed by REVAL (mean -$26.8 million, median 0)
and FININST (mean -$10 million, median 0).
On average, firms experience net losses on all six items (FININST, IMPAIR, AMORT,
REVAL, MERGER and OTHER) in the financial statements. Considering the analyst
adjustments, Panel B shows the remeasurement items (FININST, IMPAIR, AMORT and
REVAL), are, on average, negative while the non-recurring items MERGER and OTHER are
positive. A negative item (i.e., an expense or loss) increases profit when it is ‘added back’ by
analysts while a positive item (i.e., a revenue or gain) decreases profit when it is removed by
analysts. Thus, on average, the analysts’ adjustments for remeasurement items increase profit
while their adjustments for non-recurring items decrease profit. Stated another way, for this
sample of firms during the study period, analysts considered the downward remeasurement
items in the accounts were too large and some portion of them were added back, increasing
profit. On the other hand, the non-recurring items were understated and analyst adjustments
added additional expenses thus decreasing profit.
<Insert Table 3 about here>
Table 3 shows the mean value for the six items for pro forma issuing firms (PF) and those
that do not issue a pro forma (NPF), based on financial statement items (Panel A) and analyst
adjustments (Panel B). Panel A shows that for all items except FININST, pro forma firms are
significantly more likely to have the item in their financial statements. Panel B shows that pro
27
forma firms are significantly more likely to have analyst adjusted amounts for all six items.
The data provide preliminary evidence of a positive relationship between PFE release and
larger amounts in the financial statements and analyst adjustments. However, the data do not
indicate causality. We do not know whether analysts make more adjustments because firms
provide PFE (thus highlighting the adjustments that could be made) or because analyst needs
for PFE information prompt firms to release PFE. One interpretation is that PFE bring
analysts to focus on the remeasured amounts. For example, in both the PF group and NPF
group 79 per cent of firms have an amount for FININST. In the PF group analyst adjustments
relate to 33 per cent of firms but in non-pro forma group the analyst adjustments relate to
only 17 per cent of firms. A similar pattern (i.e., lower number of firms with an analyst
adjustment in the non-pro forma group) is observed for the other five items (IMPAIR,
AMORT, REVAL, MERGER and OTHER).
<Insert Table 4 about here >
Table 4 reports descriptive statistics for the other explanatory and control variables used in
the regression models. There are significant differences between the pro forma and non-pro
forma firms in the control variables.12 Mean and median values show that pro forma firms are
larger (SIZE), have higher analyst following (FOLLOW) and greater variability in cash flows
from operations (VARCFO). They are more profitable (NI) on average, but include a higher
proportion of LOSS firms. The pro forma group includes a higher proportion of financial
industry firms and a lower portion of mining sector firms. Surprisingly, non-pro forma firms
have higher mean change in earnings (ACHEARN).
12 Tests of significance are not tabulated.
28
<Insert Table 5 about here >
Table 5 reports descriptive statistics for AFE and FD. As expected, mean (median) AFE of
0.031 (0.011) is higher at nine months compared to three months and the amounts are
significantly different between the periods (F = 3.34, p < 0.05; Z = 24.97, p < 0.01) for the
pooled sample. Mean FD of 0.01 at nine months is lower than at three month and again
amounts are significantly different between the periods (F = 4.38, p < 0.05). At nine months,
mean AFE (FD) is 0.017 (0.006) in the pre-GFC period, 0.049 (0.014) in the GFC year and
0.024 (0.011) in the post-GFC period suggesting it was more difficult to forecast earnings in
the year following the October 2008 financial crisis.
<Insert Table 6>
4.2. Factors associated with Pro Forma Release
Table 6 presents results for Equation 1, which tests the relationship of PFE release and profit
and loss items relating to remeasurement and non-recurring items. Recall that there are four
items classified as remeasurement (FININST, IMPAIR, AMORT and REVAL) and two as non-
recurring (MERGER and OTHER). We predicted larger amounts of these six items would be
associated with the release of PFE.
Panel A presents results when the items are measured based on amounts in firms’ financial
statements. Model 1 shows firms with a great incidence of the items (COUNT) are more
likely to release PFE, suggesting possible support for H1. However Model 2 suggests greater
total amount (MAGNIT) is not associated with PFE release and the four remeasurement items
are not all associated with the release of PFE. Notably, coefficients for FININST, IMPAIR
29
and REVAL are not significant. AMORT is positive and significant (0.354, p < 0.05) and
MERGER is negative and significant (-2.408, p < 0.01), meaning firms with more
amortisation expense and less merger expenses are more likely to issue PFE.
Considering the control variables, loss firms and those in the mining sector are less likely to
issue PFE (coefficients on LOSS and MINING are significant and negative in all models).
Financial sector firms (in Models 2 and 3) and those with more variation in cash flows (in
Models 1 and 2) are more likely to issue PFE. However, PFE is not more likely for firms with
higher analyst forecast error or dispersion (coefficients on PREVAFE and PREVFD are not
significant in any model). There is some sensitivity to time period. Models 2 and 3 suggest
firms were less likely to issue PFE in the six month period preceding the GFC year (1 July
2008 - 30 June 2009).
Panel B presents results when the items correspond to analysts’ adjustments to statutory
NPAT. As in Panel A, Model 1 shows firms with a great incidence of the adjustments
(COUNT) are more likely to release PFE. In Model 2 the coefficient on MAGNIT is not
significant. However, in Model 3 two remeasurement items are associated with PFE release.
FININST is negative and significant (-0.475, p < 0.10) and AMORT is positive and significant
(0.051, p < 0.01). Nevertheless, given our interest in four remeasurement items, the evidence
in support of H1 is weak. Results for control variables are similar to those observed for Panel
A. Coefficients on MINING, FIN and LOSS are significant in some models. Pre-GFC is
significant and negative in Model 2.
<Insert Table 7 about here >
30
4.3. Usefulness of Pro Forma Information
We consider the usefulness of PFE in models that explore the relationship of release of PFE,
possible components of PFE, analyst adjusted PFE and properties of analyst forecasts and
share prices. Results for models based on Equations 4 and 5, which explore the relationship
of PFE and analyst forecast properties, are shown in Table 7. Contrary to our predictions in
H2 we do not find that PFE release is associated with lower error and dispersion. The
coefficient for PROFORMA is not significant in either Model (i) or (iii). However, when we
replace PROFORMA with PROFORMA_Δ (PROFORMA less GAAP earnings divided by
GAAP earnings) in Models (ii) and (iv) the variable is negative with significant coefficients
(-0.017, p < 0.01 and -0.004, p < 0.01). Thus we observe that when the PFE/GAAP earnings
difference is greater, AFE and FD are lower.13
We included a variable HEADLINE for the location of the pro forma (as the ‘headline’
number, given prominence before NPAT) but it is not an explanatory factor. Most of the
control variables exhibit the expected relationships. Error (AFE) and dispersion (FD) are
higher for loss firms (LOSS) (Models i, ii and iv), firms followed by fewer analysts
(FOLLOW) (Models i, ii and iv), those with a greater change in earnings (ACHEARN)
(Models i, ii, iii and iv) and when previous forecast dispersion was high (PREVFD) (Models
iii and iv).14 The LOSS_ dummy variable is not an explanatory factor. We control for
differences between years as univariate tests show higher error and disagreement in the GFC
year. In Models i – iv the dummy variables PRE_GFC and POST_GFC are negatively
associated with error and dispersion, suggesting AFE and FD are lower in the pre- and post-
financial crisis periods.
13 The analysis is based on tests of the association of AFE and FD nine months before FYE with release of PFE at FYE. We will also test the association of AFE and FD subsequent to the release of PFE. 14 The findings for the models reported in Table 6 are robust to changing the forecast horizon from nine months to either three or six months prior to financial year end (not tabulated).
31
<Insert Table 8 about here >
To further explore the extent to which PFE is useful to market participants, we investigate the
association of PFE and its components with share prices using the models in Equations 6 – 8.
In H3 we predict that if PFE are useful for predicting future earnings, they should be
positively associated with share price. Because Goodwin et al. (2008) finds financial services
firms are affected by fewer, more complex standards than most other industries, we run the
model on both a pooled sample and a sample without the financial firms.
The pooled models (Table 8, Panel A) show PF_DIFF$ (the difference between
PROFORMA and NPAT) is not associated with share price in Model (i). However, some
individual items are value relevant. In Model (ii) IMPAIRFS and AMORTFS are negatively
associated, and OTHERFS is positively associated, with price. In Model (iii) IMPAIRAA,
REVALAA, MERGERAA and OTHERAA are negatively associated with price. Similar results are
reported in Panel C (Pre-GFC), Panel D (GFC) and Panel E (Post-GFC) for non-financial
firms.
Returning to Panel B (pooled sample, non-financial firms) we see that the amounts in
financial statement for the four remeasurements items are not associated with share price
except for amortisation AMORTFS (-18,868, p < 0.05). In the three versions of Model (ii)
based on time period (Panels C, D and E) IMPAIRFS is the only significant remeasurement
item (Panel C and E). The non-recurring items (MERGERFS and OTHERFS) are not
significant in Model (ii). However, our interest is primarily in the remeasaurement items thus
32
we conclude, for financial statement items expected to be associated with PFE, we observe
only weak associations with share price.
Turning to the analyst adjustments, Panel B Model (iii) shows two remeasurement items are
associated with price REVALAA (-8.662, p < 0.01) and IMPAIRAA (-2.149, p < 0.10). Both
non-recurring items are negative associated with price: MERGERAA and OTHERAA (-8.889, p
< 0.01 and -6.355, p < 0.01). In the three versions of Model (iii) based on time period (Panels
C, D and E), coefficients for FININSTAA and IMPAIRAA are negative and significant in Panels
C and D and IMPAIRAA is significant in Panel E. The results suggest analyst adjustments in
relation to three key remeasurement amounts (linked to IAS 16, IAS 36 and IAS 39) are
associated with share price. Although not a focus of our hypotheses, we also observe the non-
recurring amounts (MERGERAA and OTHERAA) are negative and significant in Model (iii) in
all panels except Panel E. The adjustments made by analysts to restate GAAP profits are
relevant to explaining firms’ share prices.
5. Conclusion
The aim of this study is to investigate factors associated with the voluntary disclosure of PFE
and the extent to which PFE provide useful information to market participants. The reporting
of PFE is a pervasive phenomenon in Australia but considerable debate surrounds its use. The
usefulness of alternative earnings metrics for forecasting (in this case, PFE compared with
GAAP earnings) and of analysts’ revisions to firms’ asset valuations (reflecting
remeasurements required by IFRS) is therefore an interesting and relevant question.
Our study shows that firms providing PFE disclosure are more likely to have greater
incidence and larger amounts recognised in profit and loss for four remeasurement items

33
(relating to remeasurement of financial instruments, impairment, amortisation and revaluation
of tangible assets, investment property and agricultural assets) and two non-recurring items
(mergers and restructuring; and other). In addition, analysts are more likely to make
adjustments to GAAP profit for these six items when firms release PFE.
After controlling for other factors affecting firm disclosure, we find that firms with more of
the six items in their financial statements are more likely to release PFE. However, PFE
release is linked to only some of the individual financial statement items and is not strongly
linked to the IFRS remeasurement items (financial instruments, impairment and asset
revaluations) as we had proposed. Nevertheless, considering the amounts adjusted by analysts
(i.e. adjustments to GAAP net profit), we find items for financial instruments and impairment
are associated with PFE release. While we observe a relationship, we are thus far unable to
shed light on whether PFE are released in respond to analysts’ demand for information or
whether the PFE release brings the analysts to make the adjustments.
In addition, we find that the financial statement amounts in relation to remeasurement items
that commonly appear in PFE are not consistently incrementally value relevant beyond net
income and book value of equity in Ohlson style valuation models. However, the analyst
adjustments related to impairment, amortisation and revaluation are related to share price in
our models. The result is interesting as it suggests that the adjustments analysts make to
firms’ statutory financial statements, in relation to both non-recurring items and to IFRS
remeasurement items, have an impact of share price. Prior studies suggest PFE are more
closely associated with share price than GAAP earnings. We add to this literature by showing
a relationship between analyst valuations of firms’ assets and share prices. The findings

34
suggest analysts do revise the impact on profit of asset valuations determined by firms under
IFRS standards and that these revisions are associated with changes in share price.

35
References ASHBAUGH, H. & PINCUS, M. 2001. Domestic Accounting Standards, International Accounting Standards, and the Predictability of Earnings. Journal of Accounting Research, 39, 417-434.
AUSTRALIAN SECURITIES AND INVESTMENT COMMISSION (ASIC). 2005. Disclosing Pro Forma Financial Information. Available at http://asic.gov.au/publications.
AUSTRALIAN FINANCIAL REVIEW (AFR). 2012. Unwieldy Rules “Useless” for Investors, pp. 48, 6 February.
BALL, R. & BROWN, P. 1968. An Empirical Evaluation of Accounting Income Numbers. Journal of Accounting Research, 6, 159-178.
BARTH, M., LANDSMAN, W. YOUNG, D. & ZHUANG, Z. 2011. Relevance Of Differences Between Net Income Based on IFRS and Domestic Standards for European Firms. SSRN eLibrary.
BASU, S., HWANG, L. & JAN, C. 1998. International Variation in Accounting Measurement Rules and Analysts' Earnings Forecast Errors. Journal of Business Finance & Accounting, 25, 1207-1247.
BHATTACHARYA, N., BLACK, E., CHRISTENSEN, T. & LARSON, C. 2003. Assessing the Relative Informativeness and Permanence of Pro Forma Earnings and GAAP Operating Earnings. Journal of Accounting and Economics, 36, 285-319.
BHATTACHARYA, N., BLACK, E., CHRISTENSEN, T. & MERGENTHALER, R. 2007. WhoTrades on Pro Forma Earnings Information? The Accounting Review, 82, 581-619.
BLACK, D., BLACK, E., CHRISTENSEN, T. & HENINGER, W. 2010a. Has the Regulation of Pro Forma Reporting in the U.S. Changed Investors’ Perceptions of Adjusted Earnings Disclosures? : Marriott School of Management, Brigham Young University.
BLACK, D. & CHRISTENSEN, T. 2009. Managers’ Use of Pro Forma Adjustments to meet Strategic Earnings Benchmarks Journal of Business Finance and Accounting, 36, 297-326.
BLACK, E., CHRISTENSEN, T., KIOSSE, P. & STEFFEN, T. 2010b. Trends in Aggressive Pro Forma reporting. Brigham Young University, Duke University, Lancaster University.
BRADSHAW, M. & SLOAN, R. 2002. GAAP versus The Street: An Empirical Assessment of Two Alternative Definitions of Earnings. Journal of Accounting Research, 40, 41-66.
BROWN, L. & SIVAKUMAR, K. 2003. Comparing the Value Relevance of Two Operating Income Measures. Review of Accounting Studies, 8, 561-572.
BROWN, N., CHRISTENSEN, T., ELLIOTT, W. & MERGENTHALER, R. 2010. Do Managers Use Pro Forma Earnings Disclosures to Cater to Investor Sentiment? : University of Southern California, Brigham Young University, University of Illinois, and University of Iowa.
36
BROWN, P., S. TAYLOR AND T. WALTER. 1999. The Impact of Statutory Sanctions on the Level and Information Content of Voluntary Corporate Disclosure. Abacus 35(2), 138-162.
BURGSTAHLER, D. & EAMES, M. 2003. Earnings management to avoid losses and earnings decreases: are analysts fooled? Contemporary Accounting Research, 20, 253-294.
BYARD, D., LI, Y. & YU, Y. 2011. The Effect of Mandatory IFRS Adoption on Financial Analysts’ Information Environment. Journal of Accounting Research, 49, 69-96.
CHALMERS, K., CLINCH, G. & GODFREY, J. 2010. Changes in Value Relevance of Financial Information Upon IFRS Adoption: Evidence from Australia. Australian Journal of Management, 36, 151-173.
COTTER, J., TARCA, A. & WEE, M. 2012. IFRS adoption and analysts’ earnings forecasts: Australian evidence. Accounting and Finance, 52(2), 395-419.DASKE, H. & GEBHARDT, G. 2006. International Financial Reporting Standards And Experts' Perceptions Of Disclosure Quality. Abacus, 42, 461-498.
DIAMOND, D. & VERRECCHIA, R. 1991. Disclosure, Liquidity and the Cost of Equity Capital,. Journal of Finance, 46, 1325-1360.
DJATEJ, A., GAO, G., SARIKAS, R. & SENTENEY, D. 2008. An investigation of the impact of degree of IFRS implementation on the comparative accuracy and bias of equity securities analysts East and West european firms earnings forecasts. Journal of Applied Business Research, 24, 65-81.
DYE, R. 1985. Disclosure of Non-Propriety Information. Journal of Accounting Research, 23, 123-145.
DYE, R. 1986. An Evaluation of Essays on Disclosure and the Disclosure Literature in Accounting. Journal of Accounting and Economics, 32, 181-235.
ERNST & YOUNG (E&Y). 2007. Reported Earnings - Trends, Analysis and Predictions. Ernst & Young, Melbourne, Australia.
FINSIA & AICD. 2008. Underlying Profit – A Discussion Paper on the Reporting of Non-Statutory Financial Information. FINSIA, Melbourne, Australia.
FRANKEL, R., MCVAY, S. & SOLIMAN, M. 2010. Non-GAAP Earnings and Board Independence. Review of Accounting Studies, Forthcoming.
GOODWIN, J., AHMED, K. & HEANEY, R. 2008. The Effects of International Financial Reporting Standards on the Accounts and Accounting Quality of Australian Firms: A Retrospective Study. Journal of Contemporary Accounting & Economics, 4.
HOPE, O-K. 2003a. Disclosure Practices, Enforement of Accounting Standards, and Analysts' Forecast Accuracy: An International Study. Journal of Accounting Research, 41, 235-272.

37
HORTON, J. & SERAFEIM, G. 2009. Market Reaction To and Valuation of IFRS Reconciliations Adjustments: First Evidence from the UK. Review of Accounting Studies, 15, 725-751 .
HORTON, J., SERAFEIM, G. & SERAFEIM, I. 2010. Does Mandatory IFRS Adoption Improve the Information Environment? : Harvard Business School.
HUNTLEY, A. 2011. Huntley's Glossary of Terms. Morning Star, Sydney, Australia.
THE INTENATIONAL ACCOUNTING STANDARDS BOARD (IASB). 2006. Preliminary Views – Conceptual Framework for Financial Reporting: Objective of Financial Reporting and Qualitative Characteristics of Decision-Useful Financial Reporting Information. Financial Accounting Standards Board and International Accounting Standards Board. IASC Foundation Publications, London.
THE INTENATIONAL ACCOUNTING STANDARDS COMMITTEE (IASC) 2010. IASC Foundation Constitution. In: FOUNDATION, I. (ed.) Effective 1 March 2010. London EC4M 6XH, United Kingdom.: IASC Foundation Publications, London.
JENNINGS, R. & MARQUES, A. 2010. The Joint Effects of Corporate Governance and Regulation on the Disclosure of Manager-Adjusted Non-GAAP Earnings. Journal of Business Finance & Accounting, Forthcoming.
JOVANOVIC, B. 1982. Truthful Disclosures of Information. Bell Journal of Economics, 13, 863-894.
KPMG. 2010. Underlying Profits Report. Available at http://www.kpmg.com.au/publications.
LANDSMAN, W., B. L. MILLER, S. YEH. 2007. Implications of Components of Income Excluded from Pro Forma Earnings for Future Profitability and Equity Valuation. Journal of Business Finance & Accounting, 34, 650–675.
LANG, M. & LUNDHOLM, R. 1996. Corporate Disclosure Policy and Analyst Behaviour. The Accounting Review, 71, 467-492.
LOUGEE, B. & MARQUARDT, C. 2004. Earnings Informativeness and Strategic Disclosure: An Empirical Examination of "Pro Forma" Earnings. The Accounting Review, 79, 769-795.
MATSUMOTO, D. 2002. Management's Incentives to Avoid Negative Earnings Surprises. The Accounting Review, 77, 483-514.
MILGROM, P. 1981. Good News and Bad News: Representation Theorems and Applications. Journal of Economics, 12, 380-391.
MILGROM, P. & ROBERTS, J. 1986. Relying on the Information of Interested Parties. Rand Journal of Economics, 17, 18-32.
SECURITIES AND EXCHANGE COMMISSION (SEC). 2003. Summary by the Division of Corporation Finance of Significant Issues Addressed in the Review of the Periodic Reports

38
of the Fortune 500 Companies. Available at http://www.sec.gov/divisions/corpfin/fortune500rep.htm. Accessed January 2012.
VERRECCHIA, R. 1983. Discretionary Disclosure. Journal of Accounting and Economics, 5, 179-194.
VERRECCHIA, R. 1990. Endogenous Proprietary Costs through Firm Interdependence. Journal of Accounting and Economics, 23, 245-250.
39
Table 1 Sample selection and descriptive statistics for the pro forma sample Panel A Total
Initial Sample 655 Less: Delistments -42
613 Releasing Pro Forma 385
Proportion 62.81% Panel B
PROFORMA NPAT PF_DIFF$
($m) ($m) ($m) All Years (n=385)
Mean 635.27 403.85 231.41 Median 136.10 73.80 25.96 Maximum 24282.00 15390.00 8892.00 Minimum -87.00 -3544.00 -5979.00 Std Deviation 2017.70 1704.50 932.37
PRE_GFC (n=77)
Mean 625.08 498.66 126.42 Median 150.20 100.40 15.02
GFC (n=138) Mean 602.97 200.16 402.80 Median 136.88 43.15 39.50
POST_GFC (n=170) Mean 666.10 526.26 139.84 Median 132.50 84.15 22.45
Equality (across years) F-stat 0.045 3.061** 3.847**
KW 1.114 14.974*** 7.912**
Panel A shows sample selection and number and proportion of firms releasing pro forma financial information in the sample period 1 Jan 2008 to 31 Dec 2010. Panel B shows descriptive statistics for the sub-sample of pro forma releasing firms. PROFORMA = the pro forma earnings figure, as reported by the company. NPAT = reported Net Profit after Tax prepared in accordance with accounting standards. PF_DIFF$ = PROFORMA less NPAT. ANOVA F-Statistics (Kruskal-Wallis) test the equality of the means (medians) across the three periods (i.e., PRE_GFC, GFC and POST_GFC). GFC period is defined as 1 July 2008 to 30 June 2009. ** and *** indicate significance at the 5 and 1 per cent level, respectively.
40
Table 2 Summary statistics: Profit and loss items (firm financial statements and analyst adjustments) Mean Max Min Median Stdev
Panel A: Financial statements FININST ($m) -4.30 1,307.00 -5,189.00 0.00 288.59IMPAIR ($m) -95.08 1,220.23 -11,333.72 -0.18 564.07AMORT ($m) -32.19 0.00 -717.64 -4.75 87.83REVAL ($m) -12.00 14,914.00 -5,653.00 0.00 718.18OTHER ($m) -43.38 219.00 -8,266.15 0.00 427.59MERGER ($m) -9.26 770.20 -1,067.30 0.00 64.39MAGNIT ($m) -228.23 14,252.00 -13,353.06 -25.20 1,126.99COUNT 2.68 6.00 0.00 3.00 1.22
Panel B: Analysts adjustments FININST ($m) -10.32 827.00 -1,392.00 0.00 107.49IMPAIR ($m) -80.31 236.00 -12,764.51 0.00 552.96AMORT ($m) -0.71 3.30 -36.30 0.00 3.56REVAL ($m) -26.86 1,135.20 -3,905.09 0.00 214.96OTHER ($m) 5.59 7,537.00 -7,084.05 0.00 459.15MERGER ($m) 2.01 5,088.15 -1,084.40 0.00 269.98MAGNIT ($m) -122.09 6,900.00 -10,990.55 0.00 802.09COUNT 1.39 6.00 0.00 1.00 1.40 Panel A shows financial statement amounts and Panel B shows amounts of analyst adjustments ($ million). FININST = net gain or loss taken to profit and loss for the fair value remeasurement of financial instruments for firm i. IMPAIR = impairment loss for firm i. AMORT = amortisation expense for firm i. REVAL = net gain or loss of revaluation of tangible assets, investment properties and agricultural assets. MERGER = gains or losses associated with mergers, integrations, divestments, redundancies and restructuring of business operations for firm i. OTHER = all other non-recurring remeasurements not included in the previous five items for firm i. All variables are presented for the pooled sample (2008-2010). COUNT is the incidence of one or more non-zero items for any of FININST, IMPAIR, AMORT, REVAL, MERGER and OTHER, scored as 0 to 6 for firm i. MAGNIT is the sum of the current year’s total value (in dollars) of non-zero values for any of FININST, IMPAIR, AMORT, REVAL, MERGER and OTHER for firm i,
41
Table 3 Test of differences in magnitude and occurrence of and loss items (firm financial statements and analyst adjustments) between pro-forma and non-pro-forma
Panel A: Financial statements Panel B: Analysts adjustments N Mean N(≠0) % N Mean N(≠0) %
FININST ($m)
PF 385 -16.761 306 79% 385 -19.221 127 33% NPF 228 16.747 179 79% 228 4.704 38 17% t-stat/2 1.390 0.082 2.677*** 19.389***
IMPAIR ($m) PF 385 -123.378 257 67% 385 -105.839 146 38% NPF 228 -47.288 98 43% 228 -37.208 37 16% t-stat/2 1.616 33.197*** 1.487 32.182***
AMORT ($m) PF 385 -33.964 286 74% 385 -0.994 33 9% NPF 228 -29.195 143 63% 228 -0.223 4 2% t-stat/2 0.649 9.120*** 2.605*** 11.733***
REVAL ($m) PF 385 -15.035 87 23% 385 -37.913 64 17% NPF 228 -6.882 19 8% 228 -8.194 10 4% t-stat/2 0.136 20.372*** 1.657* 20.203***
OTHER ($m) PF 385 -58.699 102 26% 385 5.588 208 54% NPF 228 -17.515 30 13% 228 5.607 39 17% t-stat/2 1.153 15.072*** 0.000 81.137***
MERGER ($m) PF 385 -13.806 111 29% 385 4.229 126 33% NPF 228 -1.593 26 11% 228 -1.742 23 10% t-stat/2 2.277** 25.061*** -0.264 39.892***
This table presents descriptive statistics for four items predicted to be related to release of pro forma earnings. FININST = net gain or loss taken to profit and loss for the fair value remeasurement of financial instruments for firm i. IMPAIR = impairment loss for firm i. MERGER = gains or losses associated with mergers, integrations and divestments of business operations for firm i. RESTRUCT = costs associated with redundancies and restructuring for firm i. All variables are presented for the pooled sample (2008-2010). Panel A shows financial statement amounts and Panel B shows amounts of analyst adjustments ($ million). PF = firm releases pro forma earnings. NPF = firm does not release pro forma earnings. Equal = tests of difference. N (≠0) shows number of non-zero items. t-stat is the test of equality for the means between PF and NPF firms. Chi-square statistics test the equality of the proportion of non-zero values across the two groups of pro-forma issues and non-pro-forma issuers. *, ** and *** indicate significance at the 10, 5 and 1 per cent level, respectively.
42
Table 4 Descriptive statistics: Other explanatory and control variables n Mean Median Max Min Stdev Panel A: Firms without pro-forma earnings ACHEARN 225 0.096 0.025 1.563 0.000 0.231 NUMEST 222 15.083 15.000 33.460 2.000 7.420 VARCFO 227 203 50 5,894 2 617 SIZE ($m) 227 4,549 1,214 77,309 10 9,766 BVE ($m) 227 2,293 645 30,768 -1,640 4,832 NI ($m) 227 178 53 5,596 -2,316 801 NIADJ ($m) 227 212 58 5,596 -3,301 849 PF_DIFF$ 228 0 0 0 0 0 PREVAFE 209 0.032 0.008 0.427 0.000 0.063 PREVFD 207 0.012 0.005 0.147 0.000 0.020 LOSS 228 68 FIN 228 24 MINING 228 57 Panel B: Firms with pro-forma earnings ACHEARN 385 0.066 0.017 1.563 0.000 0.173 NUMEST 382 17.168 17.000 33.460 2.000 6.735 VARCFO 383 447 96 6,777 2 1,233 SIZE ($m) 384 7,981 1,709 244,260 26 24,450 BVE ($m) 384 3,849 1,293 46,905 -199 7,931 NI ($m) 384 344 77 6,186 -2,316 1,259 NIADJ ($m) 384 393 98 7,569 -2,315 1,325 PF_DIFF$ 375 0.021 0.006 0.427 0.000 0.051 PREVAFE 375 0.012 0.006 0.147 0.000 0.021 PREVFD 385 101 LOSS 385 88 FIN 385 92 MINING 385 40 This table reports the descriptive statistics for the control variables pooled across all years. ACHEARN = absolute change in earnings equal to the difference between the current year’s EPS and last year’s EPS, deflated by price. NUMEST = number of analysts following the firm during the year. VARCFO = the standard deviation of cash flow from operations over ten years. SIZE = the firm’s market capitalisation at the beginning of the year expressed in millions. BVE = book value of equity. NI = net income. NIADJ = adjusted earnings by adding back or deducting amounts in earnings for FININST, IMPAIR, AMORT, REVAL, MERGER and OTHER. PF_DIFF$ = proforma earnings less NI. PREVAFE = Absolute Forecast Error (AFE) for firm i from the previous corresponding financial year. AFE = Analyst forecast error measured as AFEi,t = | (Ai,t – Fi,t-j) / Pi,t-j | where Ai,t is firm i’s actual EPS for the financial year ended t; Fi,t-j is firm i’s median consensus forecast for EPS for the financial year ended t, measured j months prior to time t, where j is 3 months; and Pi,t-j is firm i’s price per share j months prior to time t, where j is 3 months. PREVFD = Forecast dispersion (FD) for firm i from the previous corresponding financial year. FD = Forecast dispersion measured at j months prior to the end of the financial year t, where j is 3 months; captured by the standard deviation of firm i’s EPS forecast, scaled by Pi,t-j, where j is 3 months. LOSS = 1 if the current year’s earnings per share is negative, zero otherwise. LOSS_ = 1 if the current year’s earnings is negative and the pro_forma earnings is non-negative, zero otherwise. FIN = 1 for firms in the GICS Financials Industry group, zero otherwise. MINING = 1 for firms in the GICS Metals and Mining industry, zero otherwise.
43
Table 5 Descriptive statistics: Analyst forecast error (AFE) and forecast dispersion (FD) AFE FD
3 months
6 months
9 months Equality
3 months
6 months
9 months Equality
Panel A: All years (N=578) Mean 0.025 0.036 0.031 3.34** 0.014 0.014 0.011 5.72*** Median 0.006 0.010 0.011 24.97*** 0.006 0.007 0.006 2.56 Panel B: PRE_GFC (N=137) Mean 0.019 0.021 0.017 0.26 0.009 0.008 0.006 2.71* Median 0.004 0.006 0.005 0.86 0.004 0.004 0.004 1.98 Panel C: GFC (N=199) Mean 0.043 0.067 0.049 2.49* 0.023 0.023 0.014 8.13*** Median 0.015 0.020 0.021 6.75** 0.008 0.010 0.007 2.40 Panel D: POST_GFC (N=242) Mean 0.014 0.019 0.024 4.73*** 0.009 0.010 0.011 1.23 Median 0.004 0.008 0.011 26.81*** 0.005 0.006 0.007 11.38***
This table reports descriptive statistics. AFE = Analyst forecast error measured as AFEi,t = | (Ai,t – Fi,t-j) / Pi,t-j | where Ai,t is firm i’s actual EPS for the financial year ended t; Fi,t-j is firm i’s median consensus forecast for EPS for the financial year ended t, measured j months prior to time t, where j is 3, 6 and 9 months; and Pi,t-j is firm i’s price per share j months prior to time t, where j is 3, 6 and 9 months. FD = Forecast dispersion measured at j months prior to the end of the financial year t, where j is 3, 6 and 9 months; captured by the standard deviation of firm i’s EPS forecast, scaled by Pi,t-j, where j is 3, 6 and 9 months. The results are presented pooled across all years and on an individual year-by-year basis. The ANOVA F-Statistic (Kruskall-Wallis) statistics test the equality of means (medians) across horizons (3, 6 and 9 months) and across the three periods (i.e., PRE_GFC, GFC and POST_GFC) is reported. *, ** and *** indicate significance at the 10, 5 and 1 per cent level, respectively.
44
Table 6 Regression models: Pro forma release and profit and loss items Panel A: Financial statements
(1) (2) (3) Coeff. z stat Coeff. z stat Coeff. z stat Intercept 1.042 0.534 1.262 0.664 0.934 0.482 COUNTFS 0.541 6.125*** MAGNITFS 0.005 0.830 FININSTFS -0.042 -0.936 IMPAIRFS 0.000 -0.028 AMORTFS 0.354 2.373** REVALFS 0.018 0.796 OTHERFS -0.198 -1.177 MERGERFS -2.408 -2.690*** MINING -0.764 -2.826*** -0.836 -3.200*** -0.759 -2.846*** FIN 0.308 1.091 0.566 2.097** 0.588 2.134** LOSS -1.129 -3.388*** -1.143 -3.621*** -1.077 -3.324*** ACHEARN 0.191 0.303 0.335 0.520 0.433 0.568 SIZE -0.089 -0.931 -0.036 -0.388 -0.022 -0.238 NUMEST 0.009 0.573 0.014 0.916 0.014 0.882 VARCFO (×102) 0.030 1.871* 0.032 1.940* 0.030 1.851* Pre-GFC -0.388 -1.507 -0.495 -1.996** -0.524 -2.075** Post-GFC 0.181 0.785 0.083 0.375 0.072 0.318 PREVAFE_3 -2.823 -1.294 -1.739 -0.847 -2.386 -1.119 PREVFD_3 6.216 1.043 4.999 0.869 7.084 1.179 McFadden R-squared 0.143 0.089 0.110
LR statistic 107.81
1 67.307 82.999 Prob(LR statistic) 0.000 0.000 0.000 Obs with Dep=0 206 206 206 Obs with Dep=1 373 372 372 N 579 578 578
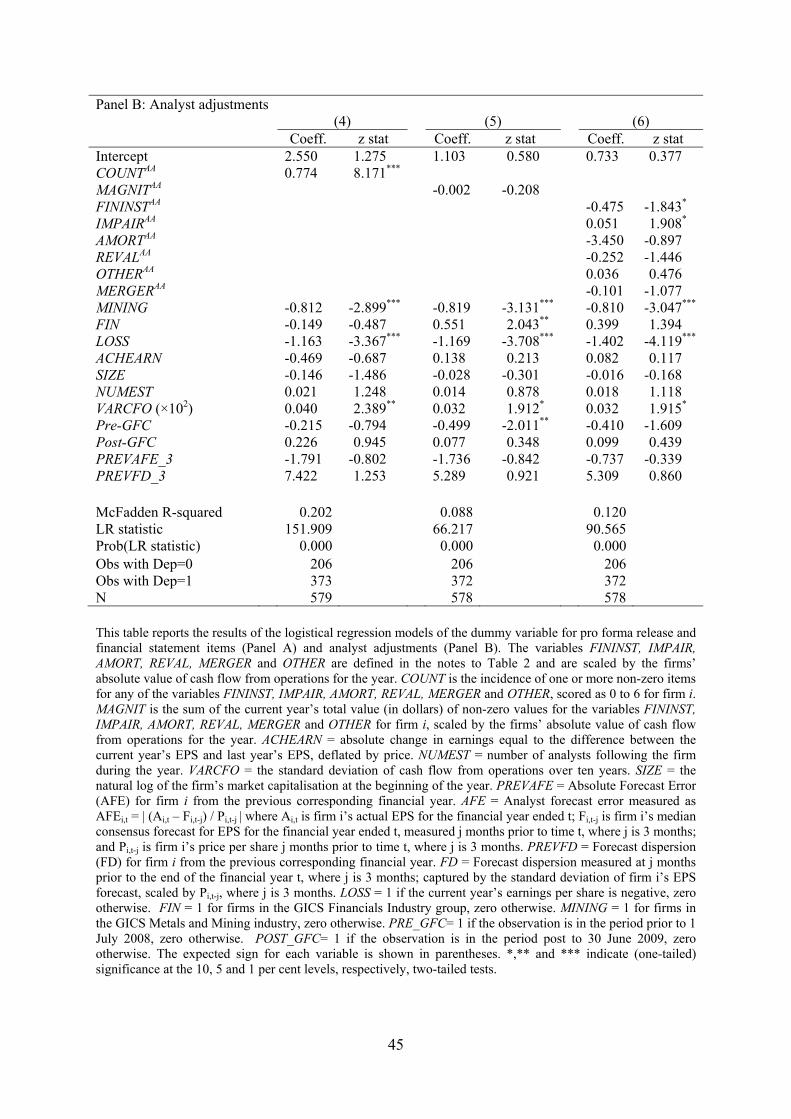
45
Panel B: Analyst adjustments (4) (5) (6)
Coeff. z stat Coeff. z stat Coeff. z stat Intercept 2.550 1.275 1.103 0.580 0.733 0.377 COUNTAA 0.774 8.171***
MAGNITAA -0.002 -0.208 FININSTAA -0.475 -1.843* IMPAIRAA 0.051 1.908* AMORTAA -3.450 -0.897 REVALAA -0.252 -1.446 OTHERAA 0.036 0.476 MERGERAA -0.101 -1.077 MINING -0.812 -2.899*** -0.819 -3.131*** -0.810 -3.047***
FIN -0.149 -0.487 0.551 2.043** 0.399 1.394 LOSS -1.163 -3.367*** -1.169 -3.708*** -1.402 -4.119***
ACHEARN -0.469 -0.687 0.138 0.213 0.082 0.117 SIZE -0.146 -1.486 -0.028 -0.301 -0.016 -0.168 NUMEST 0.021 1.248 0.014 0.878 0.018 1.118 VARCFO (×102) 0.040 2.389** 0.032 1.912* 0.032 1.915* Pre-GFC -0.215 -0.794 -0.499 -2.011** -0.410 -1.609 Post-GFC 0.226 0.945 0.077 0.348 0.099 0.439 PREVAFE_3 -1.791 -0.802 -1.736 -0.842 -0.737 -0.339 PREVFD_3 7.422 1.253 5.289 0.921 5.309 0.860 McFadden R-squared 0.202 0.088 0.120 LR statistic 151.909 66.217 90.565 Prob(LR statistic) 0.000 0.000 0.000 Obs with Dep=0 206 206 206 Obs with Dep=1 373 372 372 N 579 578 578 This table reports the results of the logistical regression models of the dummy variable for pro forma release and financial statement items (Panel A) and analyst adjustments (Panel B). The variables FININST, IMPAIR, AMORT, REVAL, MERGER and OTHER are defined in the notes to Table 2 and are scaled by the firms’ absolute value of cash flow from operations for the year. COUNT is the incidence of one or more non-zero items for any of the variables FININST, IMPAIR, AMORT, REVAL, MERGER and OTHER, scored as 0 to 6 for firm i. MAGNIT is the sum of the current year’s total value (in dollars) of non-zero values for the variables FININST, IMPAIR, AMORT, REVAL, MERGER and OTHER for firm i, scaled by the firms’ absolute value of cash flow from operations for the year. ACHEARN = absolute change in earnings equal to the difference between the current year’s EPS and last year’s EPS, deflated by price. NUMEST = number of analysts following the firm during the year. VARCFO = the standard deviation of cash flow from operations over ten years. SIZE = the natural log of the firm’s market capitalisation at the beginning of the year. PREVAFE = Absolute Forecast Error (AFE) for firm i from the previous corresponding financial year. AFE = Analyst forecast error measured as AFEi,t = | (Ai,t – Fi,t-j) / Pi,t-j | where Ai,t is firm i’s actual EPS for the financial year ended t; Fi,t-j is firm i’s median consensus forecast for EPS for the financial year ended t, measured j months prior to time t, where j is 3 months; and Pi,t-j is firm i’s price per share j months prior to time t, where j is 3 months. PREVFD = Forecast dispersion (FD) for firm i from the previous corresponding financial year. FD = Forecast dispersion measured at j months prior to the end of the financial year t, where j is 3 months; captured by the standard deviation of firm i’s EPS forecast, scaled by Pi,t-j, where j is 3 months. LOSS = 1 if the current year’s earnings per share is negative, zero otherwise. FIN = 1 for firms in the GICS Financials Industry group, zero otherwise. MINING = 1 for firms in the GICS Metals and Mining industry, zero otherwise. PRE_GFC= 1 if the observation is in the period prior to 1 July 2008, zero otherwise. POST_GFC= 1 if the observation is in the period post to 30 June 2009, zero otherwise. The expected sign for each variable is shown in parentheses. *,** and *** indicate (one-tailed) significance at the 10, 5 and 1 per cent levels, respectively, two-tailed tests.
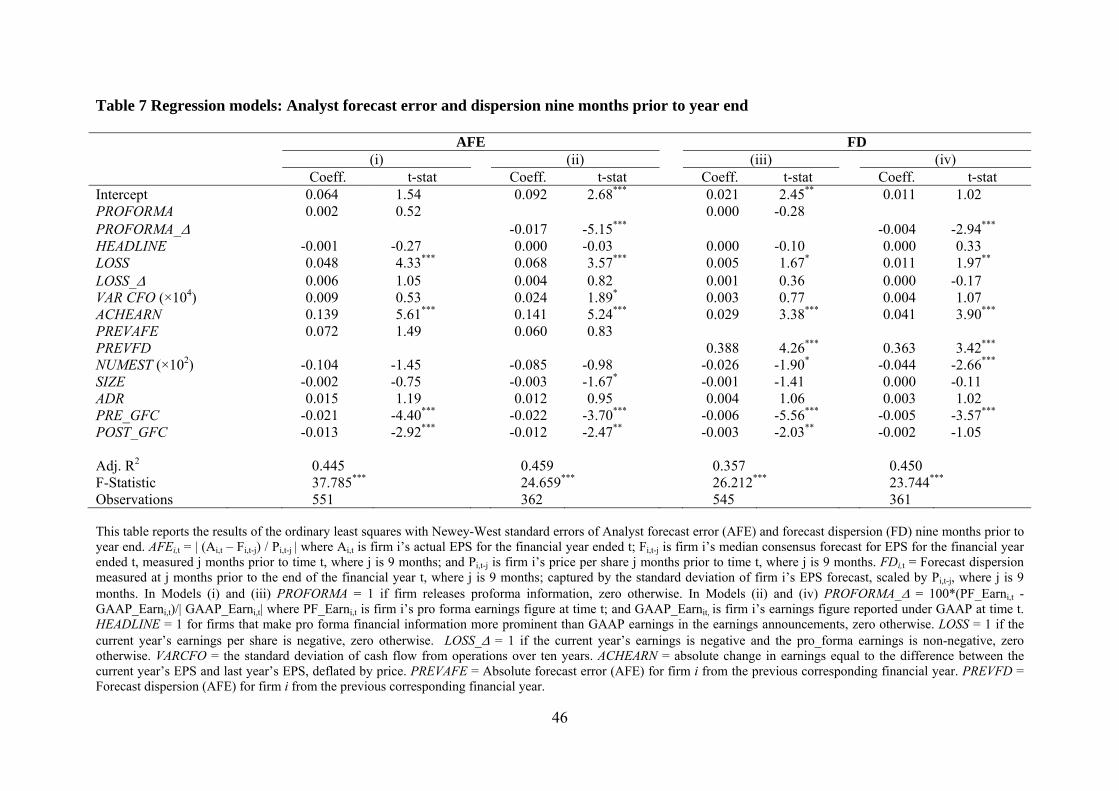
46
Table 7 Regression models: Analyst forecast error and dispersion nine months prior to year end AFE FD
(i) (ii) (iii) (iv) Coeff. t-stat Coeff. t-stat Coeff. t-stat Coeff. t-stat Intercept 0.064 1.54 0.092 2.68*** 0.021 2.45** 0.011 1.02 PROFORMA 0.002 0.52 0.000 -0.28 PROFORMA_ -0.017 -5.15*** -0.004 -2.94*** HEADLINE -0.001 -0.27 0.000 -0.03 0.000 -0.10 0.000 0.33 LOSS 0.048 4.33*** 0.068 3.57*** 0.005 1.67* 0.011 1.97** LOSS_ 0.006 1.05 0.004 0.82 0.001 0.36 0.000 -0.17 VAR CFO (×104) 0.009 0.53 0.024 1.89* 0.003 0.77 0.004 1.07 ACHEARN 0.139 5.61*** 0.141 5.24*** 0.029 3.38*** 0.041 3.90*** PREVAFE 0.072 1.49 0.060 0.83 PREVFD 0.388 4.26*** 0.363 3.42*** NUMEST (×102) -0.104 -1.45 -0.085 -0.98 -0.026 -1.90* -0.044 -2.66*** SIZE -0.002 -0.75 -0.003 -1.67* -0.001 -1.41 0.000 -0.11 ADR 0.015 1.19 0.012 0.95 0.004 1.06 0.003 1.02 PRE_GFC -0.021 -4.40*** -0.022 -3.70*** -0.006 -5.56*** -0.005 -3.57*** POST_GFC -0.013 -2.92*** -0.012 -2.47** -0.003 -2.03** -0.002 -1.05 Adj. R2 0.445 0.459 0.357 0.450 F-Statistic 37.785*** 24.659*** 26.212*** 23.744*** Observations 551 362 545 361 This table reports the results of the ordinary least squares with Newey-West standard errors of Analyst forecast error (AFE) and forecast dispersion (FD) nine months prior to year end. AFEi,t = | (Ai,t – Fi,t-j) / Pi,t-j | where Ai,t is firm i’s actual EPS for the financial year ended t; Fi,t-j is firm i’s median consensus forecast for EPS for the financial year ended t, measured j months prior to time t, where j is 9 months; and Pi,t-j is firm i’s price per share j months prior to time t, where j is 9 months. FDi,t = Forecast dispersion measured at j months prior to the end of the financial year t, where j is 9 months; captured by the standard deviation of firm i’s EPS forecast, scaled by Pi,t-j, where j is 9 months. In Models (i) and (iii) PROFORMA = 1 if firm releases proforma information, zero otherwise. In Models (ii) and (iv) PROFORMA_ = 100*(PF_Earni,t - GAAP_Earni,t)/| GAAP_Earni,t| where PF_Earni,t is firm i’s pro forma earnings figure at time t; and GAAP_Earnit, is firm i’s earnings figure reported under GAAP at time t. HEADLINE = 1 for firms that make pro forma financial information more prominent than GAAP earnings in the earnings announcements, zero otherwise. LOSS = 1 if the current year’s earnings per share is negative, zero otherwise. LOSS_ = 1 if the current year’s earnings is negative and the pro_forma earnings is non-negative, zero otherwise. VARCFO = the standard deviation of cash flow from operations over ten years. ACHEARN = absolute change in earnings equal to the difference between the current year’s EPS and last year’s EPS, deflated by price. PREVAFE = Absolute forecast error (AFE) for firm i from the previous corresponding financial year. PREVFD = Forecast dispersion (AFE) for firm i from the previous corresponding financial year.
47
NUMEST = number of analyst earnings forecasts included in the consensus forecast. ADR = 1 for observations for firms cross-listed in the US as American Depository Receipts, zero otherwise. SIZE = the natural log of the firm’s market capitalisation at the beginning of the year. The expected sign for each variable is reported in parentheses. *, ** and *** indicate significance at the 10, 5 and 1 per cent levels, respectively, one-tailed tests.
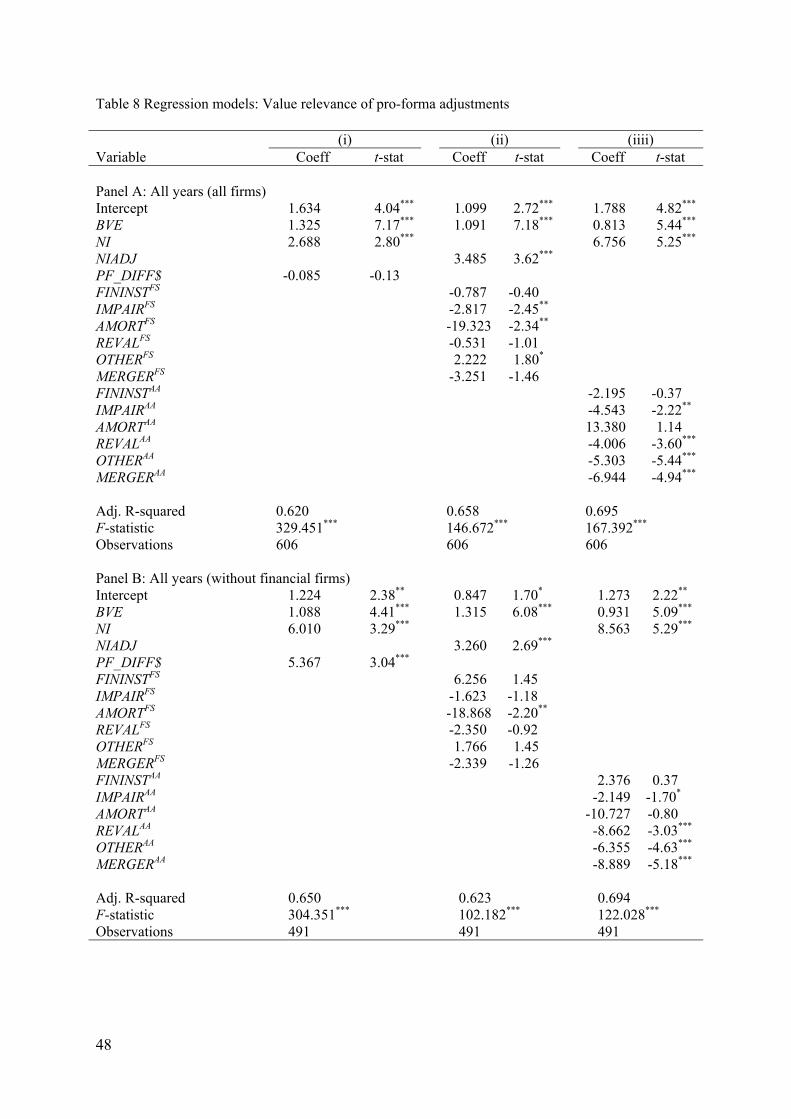
48
Table 8 Regression models: Value relevance of pro-forma adjustments (i) (ii) (iiii) Variable Coeff t-stat Coeff t-stat Coeff t-stat Panel A: All years (all firms) Intercept 1.634 4.04*** 1.099 2.72*** 1.788 4.82***
BVE 1.325 7.17*** 1.091 7.18*** 0.813 5.44***
NI 2.688 2.80*** 6.756 5.25***
NIADJ 3.485 3.62***
PF_DIFF$ -0.085 -0.13 FININSTFS -0.787 -0.40 IMPAIRFS -2.817 -2.45** AMORTFS -19.323 -2.34** REVALFS -0.531 -1.01 OTHERFS 2.222 1.80* MERGERFS -3.251 -1.46 FININSTAA -2.195 -0.37 IMPAIRAA -4.543 -2.22** AMORTAA 13.380 1.14 REVALAA -4.006 -3.60***
OTHERAA -5.303 -5.44*** MERGERAA -6.944 -4.94***
Adj. R-squared 0.620 0.658 0.695 F-statistic 329.451*** 146.672*** 167.392*** Observations 606 606 606 Panel B: All years (without financial firms) Intercept 1.224 2.38** 0.847 1.70* 1.273 2.22** BVE 1.088 4.41*** 1.315 6.08*** 0.931 5.09*** NI 6.010 3.29*** 8.563 5.29*** NIADJ 3.260 2.69*** PF_DIFF$ 5.367 3.04*** FININSTFS 6.256 1.45 IMPAIRFS -1.623 -1.18 AMORTFS -18.868 -2.20** REVALFS -2.350 -0.92 OTHERFS 1.766 1.45 MERGERFS -2.339 -1.26 FININSTAA 2.376 0.37 IMPAIRAA -2.149 -1.70* AMORTAA -10.727 -0.80 REVALAA -8.662 -3.03*** OTHERAA -6.355 -4.63*** MERGERAA -8.889 -5.18*** Adj. R-squared 0.650 0.623 0.694 F-statistic 304.351*** 102.182*** 122.028*** Observations 491 491 491
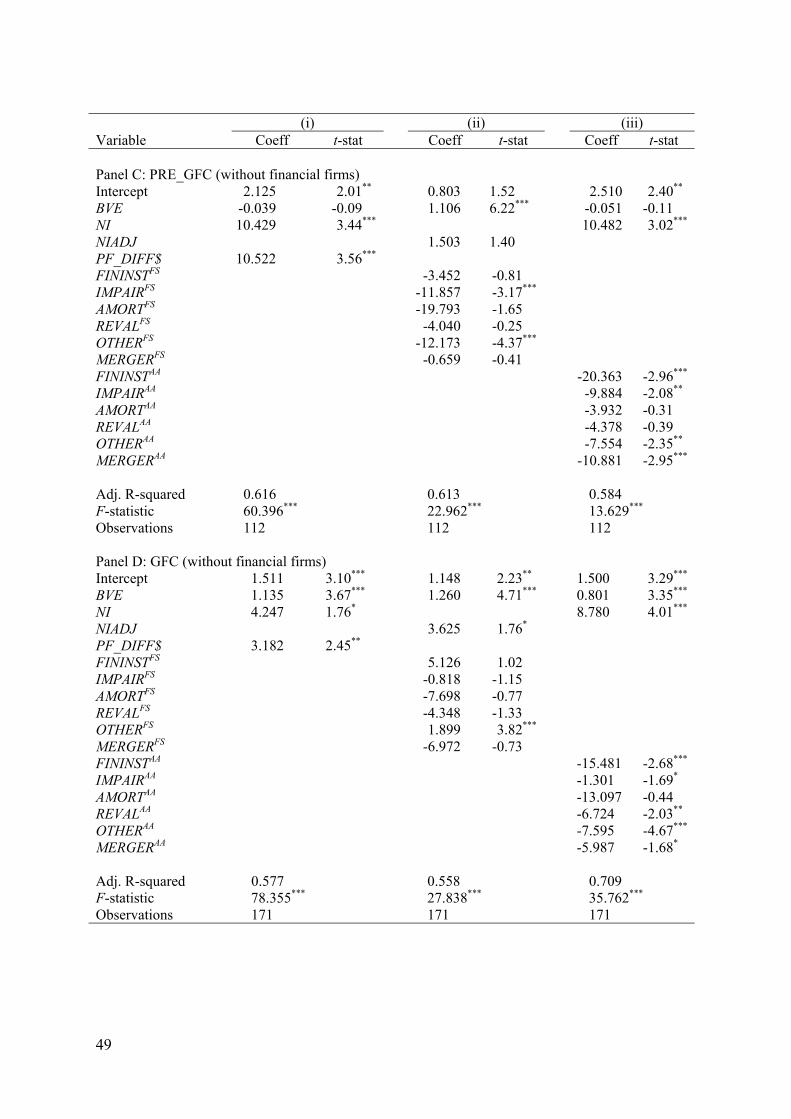
49
(i) (ii) (iii) Variable Coeff t-stat Coeff t-stat Coeff t-stat Panel C: PRE_GFC (without financial firms) Intercept 2.125 2.01** 0.803 1.52 2.510 2.40** BVE -0.039 -0.09 1.106 6.22*** -0.051 -0.11 NI 10.429 3.44*** 10.482 3.02*** NIADJ 1.503 1.40 PF_DIFF$ 10.522 3.56*** FININSTFS -3.452 -0.81 IMPAIRFS -11.857 -3.17*** AMORTFS -19.793 -1.65 REVALFS -4.040 -0.25 OTHERFS -12.173 -4.37*** MERGERFS -0.659 -0.41 FININSTAA -20.363 -2.96*** IMPAIRAA -9.884 -2.08** AMORTAA -3.932 -0.31 REVALAA -4.378 -0.39 OTHERAA -7.554 -2.35** MERGERAA -10.881 -2.95*** Adj. R-squared 0.616 0.613 0.584 F-statistic 60.396*** 22.962*** 13.629*** Observations 112 112 112 Panel D: GFC (without financial firms) Intercept 1.511 3.10*** 1.148 2.23** 1.500 3.29*** BVE 1.135 3.67*** 1.260 4.71*** 0.801 3.35*** NI 4.247 1.76* 8.780 4.01*** NIADJ 3.625 1.76* PF_DIFF$ 3.182 2.45** FININSTFS 5.126 1.02 IMPAIRFS -0.818 -1.15 AMORTFS -7.698 -0.77 REVALFS -4.348 -1.33 OTHERFS 1.899 3.82*** MERGERFS -6.972 -0.73 FININSTAA -15.481 -2.68*** IMPAIRAA -1.301 -1.69* AMORTAA -13.097 -0.44 REVALAA -6.724 -2.03** OTHERAA -7.595 -4.67*** MERGERAA -5.987 -1.68* Adj. R-squared 0.577 0.558 0.709 F-statistic 78.355*** 27.838*** 35.762*** Observations 171 171 171
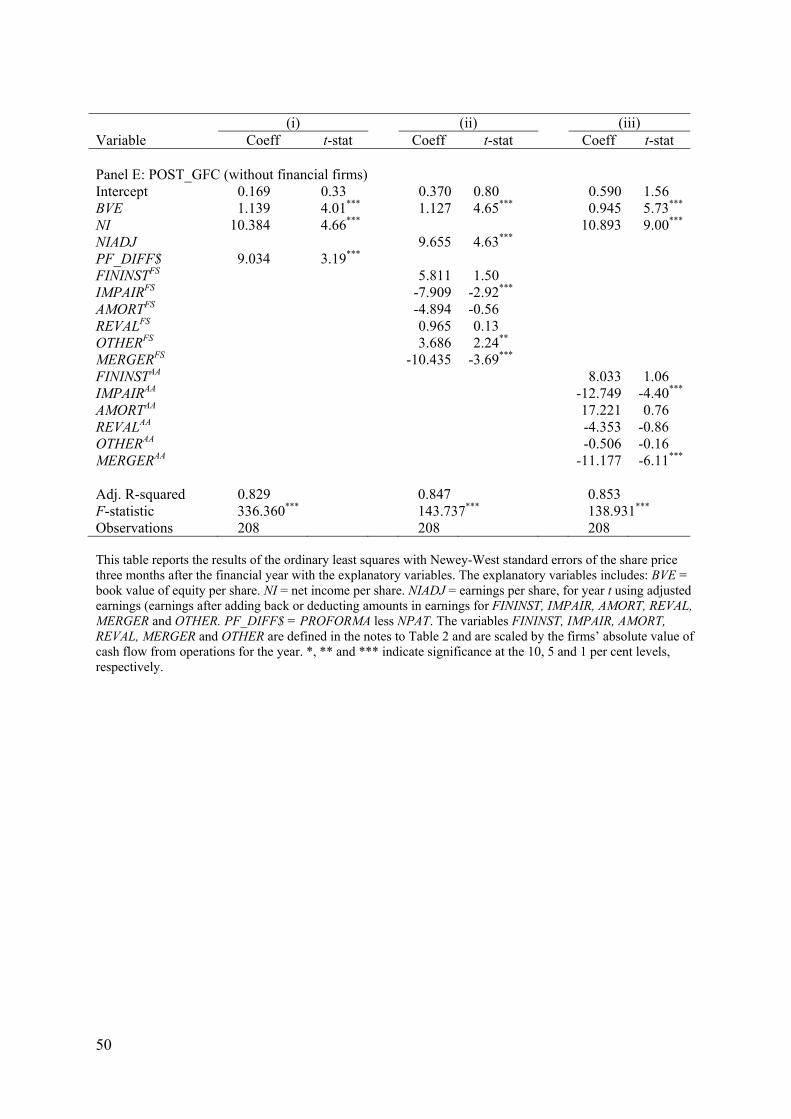
50
(i) (ii) (iii) Variable Coeff t-stat Coeff t-stat Coeff t-stat Panel E: POST_GFC (without financial firms) Intercept 0.169 0.33 0.370 0.80 0.590 1.56 BVE 1.139 4.01*** 1.127 4.65*** 0.945 5.73*** NI 10.384 4.66*** 10.893 9.00*** NIADJ 9.655 4.63*** PF_DIFF$ 9.034 3.19*** FININSTFS 5.811 1.50 IMPAIRFS -7.909 -2.92*** AMORTFS -4.894 -0.56 REVALFS 0.965 0.13 OTHERFS 3.686 2.24** MERGERFS -10.435 -3.69*** FININSTAA 8.033 1.06 IMPAIRAA -12.749 -4.40*** AMORTAA 17.221 0.76 REVALAA -4.353 -0.86 OTHERAA -0.506 -0.16 MERGERAA -11.177 -6.11*** Adj. R-squared 0.829 0.847 0.853 F-statistic 336.360*** 143.737*** 138.931*** Observations 208 208 208 This table reports the results of the ordinary least squares with Newey-West standard errors of the share price three months after the financial year with the explanatory variables. The explanatory variables includes: BVE = book value of equity per share. NI = net income per share. NIADJ = earnings per share, for year t using adjusted earnings (earnings after adding back or deducting amounts in earnings for FININST, IMPAIR, AMORT, REVAL, MERGER and OTHER. PF_DIFF$ = PROFORMA less NPAT. The variables FININST, IMPAIR, AMORT, REVAL, MERGER and OTHER are defined in the notes to Table 2 and are scaled by the firms’ absolute value of cash flow from operations for the year. *, ** and *** indicate significance at the 10, 5 and 1 per cent levels, respectively.