ii a signal processing of deep drilling process
TRANSCRIPT
ii
A SIGNAL PROCESSING OF DEEP DRILLING PROCESS
MUHAMAD AFIQ NAQIUDDIN BIN KAMARIZAN
Report submitted in partial fulfillment of the requirements
for the award of B. Eng (Hons) Mechatronics Engineering.
Faculty of Manufacturing Engineering
UNIVERSITY MALAYSIA PAHANG
JUNE 2015

viii
ABSTRACT
Drilling process is a material removal process to produce a hole. Any hole 10 times to its
diameter is considered a deep hole. There are a lot of applications in industry that demand
on the depth of hole to be drilled such as die, engines and aerospace industries. The depth
of hole can minimize the operation and save money. Since the drilling process are move to
the automated manufacturing environment nowadays. One of the primary issues in deep
drilling technique is tool wear and failure which can affect the sustainability of the process.
Therefore, based on collective data, classifying the tool wear mechanism and failure of
deep drilling, the tool life stage can be identified and tool major fracture can be avoided. In
this experiment, signal processing method was chosen to monitor the tool condition. By
using the two sensors which is dynamometer and accelerometer, the signal data obtained
was then being analyzed using three different signal processing techniques which are Fast
Fourier Transform (FFT), Short Time Fourier Transform (STFT) and Hilbert-Huang
Transform (HHT). The SKD61 material and the High Speed Steel (HSS) drill bit was used
to carry out the experiment. There are 25 sets of experiments with different parameter used
for each set. The parameter used was determined using Design of Experiment (DOE)
method. Every sets of experiment were repeated three times to increase the accuracy of the
signal data obtained. Based on classification data, the feedrate and cutting speed above
298.8 mm/min and 1592 rpm will lead to tool failure; blunt or fracture. Time domain graph
shows the force produced at z axis is the highest. Using FFT, there is no dominant
frequency for the good tool condition. However there are some dominant frequencies for
blunt and fracture tool. To differentiate between blunt and fracture, the amplitude of FFT
gives the higher value when the tool is fracture. This is due to the tool bending and chip
clogging. STFT was used to illustrate when is the high frequency region was occur. Then,
the signal data was analyzed using HHT which decompose the time series into a set of
components called intrinsic mode functions (IMF). IMF was used to detect tool failure by
means of the energies of the characteristics IMF associated with characteristics frequencies
of the drilling process. When the tool failure occurs, the energies of associated
characteristics IMF change in opposite directions. Based on signal data and the tool
condition, the type of tool failure was classified whether the tool is good, blunt or fracture.
The optimization usage of machining parameter also influences the tool condition during
the drilling process was perform. Since the time domain just can capture the time and force
produced during the process, the FFT in needed to measure the frequency along the
experiment. The FFT amplitude may control the tool life and failure. However, the STFT
is used to capture the right time when the high frequency region was occur. Other than that,
the time when tool failure occurs can be traced through the associated IMF characteristics
generated using HHT methods. Consequently, the signal data processing is not only used to
detect the tool failure, but it can be used to develop a system for online tool failure
detection which can detect the failure and control the machine parameter to be optimized
with the tool conditions.
ix
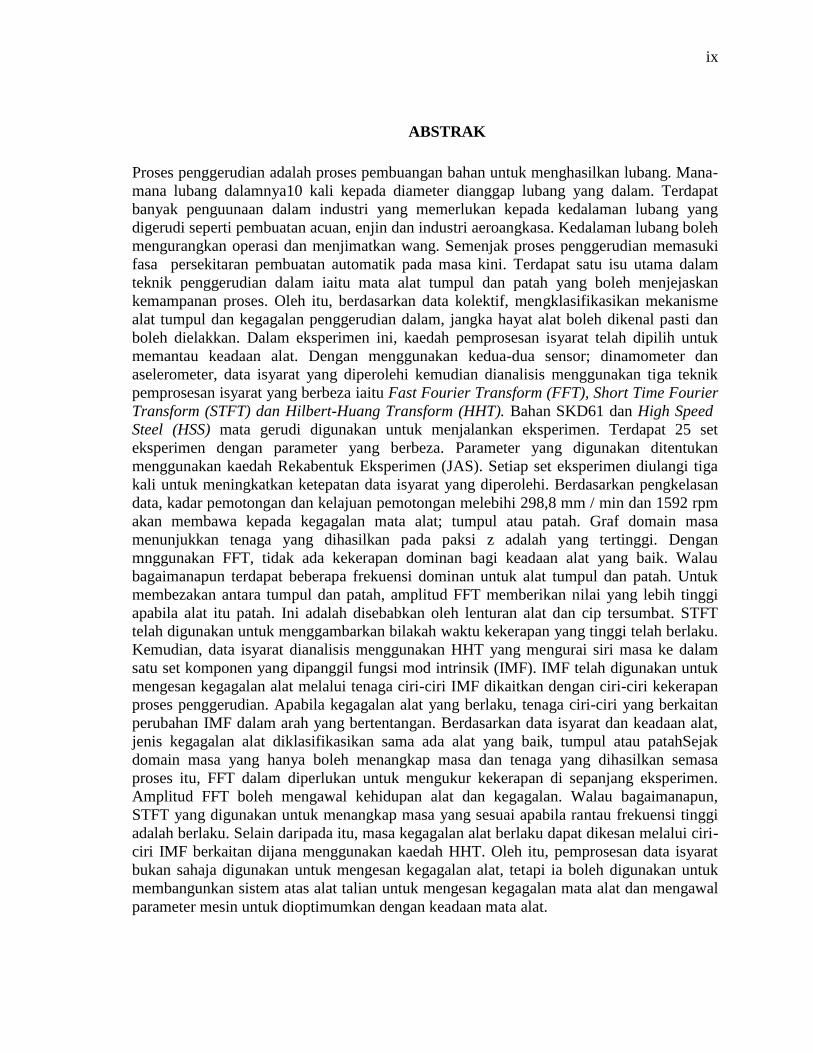
ABSTRAK
Proses penggerudian adalah proses pembuangan bahan untuk menghasilkan lubang. Mana-
mana lubang dalamnya10 kali kepada diameter dianggap lubang yang dalam. Terdapat
banyak penguunaan dalam industri yang memerlukan kepada kedalaman lubang yang
digerudi seperti pembuatan acuan, enjin dan industri aeroangkasa. Kedalaman lubang boleh
mengurangkan operasi dan menjimatkan wang. Semenjak proses penggerudian memasuki
fasa persekitaran pembuatan automatik pada masa kini. Terdapat satu isu utama dalam
teknik penggerudian dalam iaitu mata alat tumpul dan patah yang boleh menjejaskan
kemampanan proses. Oleh itu, berdasarkan data kolektif, mengklasifikasikan mekanisme
alat tumpul dan kegagalan penggerudian dalam, jangka hayat alat boleh dikenal pasti dan
boleh dielakkan. Dalam eksperimen ini, kaedah pemprosesan isyarat telah dipilih untuk
memantau keadaan alat. Dengan menggunakan kedua-dua sensor; dinamometer dan
aselerometer, data isyarat yang diperolehi kemudian dianalisis menggunakan tiga teknik
pemprosesan isyarat yang berbeza iaitu Fast Fourier Transform (FFT), Short Time Fourier
Transform (STFT) dan Hilbert-Huang Transform (HHT). Bahan SKD61 dan High Speed
Steel (HSS) mata gerudi digunakan untuk menjalankan eksperimen. Terdapat 25 set
eksperimen dengan parameter yang berbeza. Parameter yang digunakan ditentukan
menggunakan kaedah Rekabentuk Eksperimen (JAS). Setiap set eksperimen diulangi tiga
kali untuk meningkatkan ketepatan data isyarat yang diperolehi. Berdasarkan pengkelasan
data, kadar pemotongan dan kelajuan pemotongan melebihi 298,8 mm / min dan 1592 rpm
akan membawa kepada kegagalan mata alat; tumpul atau patah. Graf domain masa
menunjukkan tenaga yang dihasilkan pada paksi z adalah yang tertinggi. Dengan
mnggunakan FFT, tidak ada kekerapan dominan bagi keadaan alat yang baik. Walau
bagaimanapun terdapat beberapa frekuensi dominan untuk alat tumpul dan patah. Untuk
membezakan antara tumpul dan patah, amplitud FFT memberikan nilai yang lebih tinggi
apabila alat itu patah. Ini adalah disebabkan oleh lenturan alat dan cip tersumbat. STFT
telah digunakan untuk menggambarkan bilakah waktu kekerapan yang tinggi telah berlaku.
Kemudian, data isyarat dianalisis menggunakan HHT yang mengurai siri masa ke dalam
satu set komponen yang dipanggil fungsi mod intrinsik (IMF). IMF telah digunakan untuk
mengesan kegagalan alat melalui tenaga ciri-ciri IMF dikaitkan dengan ciri-ciri kekerapan
proses penggerudian. Apabila kegagalan alat yang berlaku, tenaga ciri-ciri yang berkaitan
perubahan IMF dalam arah yang bertentangan. Berdasarkan data isyarat dan keadaan alat,
jenis kegagalan alat diklasifikasikan sama ada alat yang baik, tumpul atau patahSejak
domain masa yang hanya boleh menangkap masa dan tenaga yang dihasilkan semasa
proses itu, FFT dalam diperlukan untuk mengukur kekerapan di sepanjang eksperimen.
Amplitud FFT boleh mengawal kehidupan alat dan kegagalan. Walau bagaimanapun,
STFT yang digunakan untuk menangkap masa yang sesuai apabila rantau frekuensi tinggi
adalah berlaku. Selain daripada itu, masa kegagalan alat berlaku dapat dikesan melalui ciri-
ciri IMF berkaitan dijana menggunakan kaedah HHT. Oleh itu, pemprosesan data isyarat
bukan sahaja digunakan untuk mengesan kegagalan alat, tetapi ia boleh digunakan untuk
membangunkan sistem atas alat talian untuk mengesan kegagalan mata alat dan mengawal
parameter mesin untuk dioptimumkan dengan keadaan mata alat.
x
TABLE OF CONTENTS
Page
SUPERVISOR’S DECLARATION iv
STUDENTS DECLARATION v
ACKNOWLEDGEMENTS vii
ABSTRACT viii
ABSTRAK ix
TABLE OF CONTENTS x
LIST OF TABLE xii
LIST OF FIGURES xiii
LIST OF ABBREVIATIONS xv
CHAPTER 1 INTRODUCTION 1
1.1 Project Background 1
1.2 Problem Statement 3
1.3 Project Objective 3
1.4 Project Scope 3
1.5 Summary
4
CHAPTER 2 LITERATURE REVIEW 6
2.1 Introduction 6
2.2 Techniques of Drilling Process 7
2.2.1 Gun Drilling
2.2.2 BTA Drilling
2.2.3 Twist Drilling
2.2.4 Comparison and Selection
7
8
8
10
2.3 Tool Condition Monitoring (TCM) 10
2.3.1 Direct Method (Online)
2.3.2 Indirect Method (Offline)
11
12
2.4 Drilling Parameter 14

xi
2.4.1 Cutting Speed
2.4.2 Feedrate
14
14
2.5 Signal Processing Techniques 16
2.5.1 Fast Fourier Transform (FFT)
2.5.2 Short Time Fourier Transform (STFT)
2.5.3 Hilbert-Huang Transform (HHT)
16
20
23
2.6 Summary 25
CHAPTER 3 METHODOLOGY 28
3.1 Introduction 28
3.2 Experiment Setup 28
3.3 Signal Data Collecting 33
3.4 Signal Data Analyzing 36
3.5 Summary 36
CHAPTER 4 RESULTS AND ANALYSIS
4.1 Introduction 37
4.2 Classification of Tool Condition 37
4.3 Signal Data Analysis Using FFT and STFT 40
4.4 Signal Data Analysis Using HHT 44
4.5
4.6
Comparisons of Signal Data Processing Techniques
Summary
47
48
CHAPTER 5 CONCLUSION AND RECOMMENDATIONS 49
5.1 Conclusions 49
5.2 Recommendation 50
REFFERENCES 51
APPENDICES 55
A Gantt Chart 55
B Sensor Datasheet 57
C Matlab Code for FFT, STFT and HHT 62
D Haas VF6 CNC Milling Machine Specifications 66

xii
LIST OF TABLES
Table No. Page
2.1 Lips angle for various work materials 10
2.2 Technical comparison of these three type of drilling process 11
2.3 Cutting speeds for drilling using tungsten carbide tip drills. 15
2.4 The recommended average feedrate for 2 Flute HSS Drills 15
2.5 Comparison on other researcher study in using signal processing
techniques
25
3.1 Chemical composition of SKD 61 30
3.2 The parameter used in this experiment 31
3.3 Specification of tri-axial accelerometer PCB 356B21 33
3.4 Specification of Dynamometer Kistler 9257B 34
4.1 The experiment results of the tool condition after undergo the drilling
process.
44

xiii
LIST OF FIGURES
Figure No. Page
1.1 Project Flow Chart 5
2.1 Gun drill with solid carbide tip 7
2.2 Cutting oil flow for BTA drilling. 8
2.3 The geometry of twist drill 9
2.4 Abundance of sensor for direct tool condition monitoring 12
2.5 Example of direct and indirect method of tool condition
monitoring.
13
2.6 Signal processing logical scheme. 16
2.7 The STFT overlap parameter. 20
3.1 Flow chart on study of signal processing of deep drilling process. 28
3.2(a) Schematic diagram of signal processing experiment 29
3.2(b) Experiment setup of signal processing experiment. 29
3.3(a) The workpiece on the dynamometer during the drilling process. 31
3.3(b) The design of holes orientation on SKD 61 block 32
3.4 Tri-axial accelerometer PCB 356B21 33
3.5 Dynamometer Kistler 9257B 34
4.1 Time Domain, frequency Domain and STFT for force signal in x, y
and z axis at Experiment 1, Test no. 2, Feedrate = 179.1, Cutting
Speed = 1194 ,Tool Condition: Good
37
4.2 Time Domain, frequency Domain and STFT for force signal in x, y
and z axis at Experiment 9, Test no. 3, Feedrate = 398.0, Cutting
Speed = 1592, Tool Condition: Blunt
38
4.3 Time Domain, frequency Domain and STFT for force signal in x, y
and z axis at Experiment 10, Test no. 2, Feedrate = 477.6, Cutting
Speed = 1592, Tool Condition: Fracture
39
4.4 IMFs of cutting force of good tool condition 41
4.5 IMFs of cutting force of blunt tool condition 42

xiv
4.6 IMFs of cutting force of fracture tool condition 43

xv
LIST OF ABBREVIATIONS
CNC Computer Numerical Control
FFT Fast Fourier Transform
STFT Short Time Fourier Transform
HHT Hilbert-Huang Transform
HSS High Speed Steel
TCM Tool Condition Monitoring
BTA Boring Trepanning Association
DFT Discrete Fourier Transform
IMF Intrinsic Mode Function
DWT Discrete Wavelet Transform
AE Acoustic Emission
ANN Artificial Neural Network

CHAPTER 1
INTRODUCTION
1.1 PROJECT BACKGROUND
In recent decades, one of the important processes that have been used in
manufacturing sectors is the machining operation. The machining operation is a material
removal processes that convert a raw material into a final desired shape throughout any of
various processes such as drilling, turning, milling, and grinding. Among these operations,
drilling is one of the most familiar machine tool operations in manufacturing technology
over the time. By the surveyed that have been done in United States, it is estimated
approximately 250 million twist drills are used annually (Pletting, 1999). Imagine how
many twist drills are used nowadays. The consequences of that issue, industry has to
allocate a plentiful amount of money on drilling tools every year. Since the development of
manufacturing technology has moved to the stage of automated manufacturing
environment, there are still two unsolved problem in drilling process which is tool wear
and tool failure (breakage).
There are still not completely understood on how the tool wear can occur during
machining operation. Catastrophic failure that comes from tool wear may cause the damage
of workpiece and also to the machine tool setup when it reaches to its limit. Even though
the price of drill tool is not too expensive, but the failure of tool can cause production cost

2
overrunning. The tool wear and tool failure can affect the downtime of production
(production loss during tool replacement) and gives a bad result to the economics of a
factory.
Therefore, it is necessary to design a system to locate the progress of tool failure
during cutting operations is conducted, so that the tool damage can be identified and tools
replaced on time. Because of this, sensor based tool condition monitoring (TCM) system
has become the topic of considerable research of machining process. TCM methods can be
classified into two categories; direct methods and indirect methods. Using direct method, it
is possible to measure the actual tool wear directly during cutting operation is conducted
(on-line monitoring), while using indirect methods is to measure the parameter that
correlated to the tool wear after the cutting operation is conducted (off-line monitoring).
In the drilling operation, by measuring the tool directly such as the brokenness on
the tool edge can be obtained after a number of holes are drilled on the workpiece by either
removing the tool out of the machine or installing a sensor to measure tool wear at the
machine. As an example, by analyze the image of tool condition, the condition of tool can
be assessed and the tool wear can be characterized. Even though this method seems
accurate, basically both implementations are not convenient in an automated drilling
operation. This is because machine interruption might affect the quality of finish part and
the sensor to measure the tool condition. Besides that, it must be placed approximately to
the tool wear and failures generally occur. The consequences of the drill tool is engaged to
the workpiece during operations, it is not suitable to monitor the operations using vision
systems (visually and optically). Furthermore, signal processing techniques is an indirect
method to determine the the tool wear and failure by understanding its pattern.
Nowadays, many techniques have been developed and different approaches to tool
wear condition monitoring have been tried over the years such as neural networks, model-
based techniques, statistical approach and control system design. Because of there are
many techniques to analyze the tool wear and failure, a study will be conducted to
determine the tool wear mechanism and failure of drilling process based on signal

3
processing by using three different signal processing techniques which is Four Fourier
Transform (FFT), Short Time Fourier Transform (STFT), and Hilbert-Huang Transform
(HHT).
1.2 PROBLEM STATEMENT
Since the drilling process are move to the automated manufacturing environment
nowadays. One of the primary issues in deep drilling technique is tool wear and failure
which can affect the sustainability of the process. Therefore there is a need to propose
technique which is based on collective data, classified the tool wear mechanism and failure
of deep drilling, which can identify the tool life stage and help to avoid tool major fracture.
1.3 PROJECT OBJECTIVE
The main objectives for signal processing of deep drilling process are:
i) To conduct the experiment of deep drilling process with feed rate, cutting speed
and depth of cut parameters.
ii) To analyze the tool wear mechanism and failure of deep drilling process based
on force signal data processing.
iii) To compare different signal processing techniques such as Fast Fourier
Transform (FFT), Short Time Fourier Transform (STFT), and Hilbert-Huang
Transform (HHT).
1.4 PROJECT SCOPE
This project is focusing on a signal processing of deep drilling process which conducted
based on this scope:
I. Conduct experiment and analyze the tool wear mechanism and tool failure of deep
drilling process based on signal processing data.
II. The parameter involve; cutting speed, feed rate, and depth of cut.
III. The raw material used is SKD61 and the tool material is High Speed Steel (HSS).

4
IV. The diameter and length of tool; 8mm and 165mm.
V. The sensor used is dynamometer to measure cutting force and the accelerometer to
measure vibration during cutting process is conducted.
VI. Analyze and compare the signal processing data by using three different signal
processing techniques which is Fast Fourier Transform (FFT), Short Time Fourier
Transform (STFT), and Hilbert-Huang Transform (HHT).
1.5 SUMMARY
This chapter discussed briefly about project background, problem statements,
project objectives and scope of the project on signal processing of deep drilling process.
Figure 1.1 shows the flow chart of the project that related with the project scopes on how
the project flow can be done at the right time. The duration of this project takes about 14
week to complete. This chapter acts as a guideline for the project completion. Gantt chart
for this project as attached in Appendix A.

5
Figure 1.1: Project Flow Chart
Yes
No
Yes
No
Start
Preliminary Study
Background of study, problem statement, identify objectives and scope, significance
of study, literature review
Conduct experiment on analysis of deep drill
process parameters drilling.
Classifications of tool wear mechanism and failure of
deep drilling.
Thesis Writing
End
Analyze data by using three different signal
processing techniques (FFT), (STFT) and (HHT).
Valid?
Valid?
CHAPTER 2
LITERATURE REVIEW
2.1 INTRODUCTION
Drilling is a type of machining process for making a hole in solid material. It has
been widely used from time to time. A survey in 1999 said that approximately 250 million
twist drills are used annually by US industry alone (Ertunc, 2001). From the economical
aspect, according to US Department of Commerce, approximately $1.62 billion was spent
in the production of drills bit in the US in 1991 (Pletting, 1991). It is about 15 to 25 years
ago; imagine how many drills bit are used and the money spent nowadays since the world
is become more advance in technology. Furthermore, in recent years most of the industries
are demand in deep drilling process. Which means a hole deeper can be drilled using single
process of a drilling process. This application of deep drilling will gives the industries a big
impact in term of economics because it can save the production time and also the
production cost. But, there are still the limitation of implementation in this process due to
the tool wear and tool breakage. The demand on the best technique and tool material to
undergo deep drilling process to produce the best final product has force the researchers
around the world to overcome this problem. There are so many researches on how to
monitor the condition of tool in the deep drilling process is performed.

7
2.2 TECHNIQUES OF DRILLING PROCESS
2.2.1 Gun Drilling
Normally gun drill used for deep-hole drilling of a small diameter. As shown in
Figure 2.1, gun drill has about 2/3 of the circle of its cross section. The function of hole is
to canalize the coolant when it is pumped through it in the tool body and flows over the
cutting edge. The chips are carried together with it, as it returns along the V-section
between the tool and the bore wall.
Figure 2.1: Gun drill with solid carbide tip.
Source: Griffiths B. J. (1975)
A gun drill comprises of a tip or head, a boring tube called a shank and a driver.
The tip may be made of solid carbide for small diameters or have carbide insert for larger
diameter. The shank is a tube crimped into a kidney shaped section which fits into the
driver. The driver maybe tapered or cylindrical depending upon whether the work or the
drill rotates.

8
2.2.2 Boring Trepanning Association (BTA) Drilling
The BTA process was originally developed by Beisner and patented in Germany in
1943, and the process came about chiefly as a spin-off from German World War II
technology (Wilson F. W. et al., 1964). There are two classes of tools, those that were
originally manufactured by the Heller Company of West Germany, and those manufactured
by Sandvik Coromant, Sweden.
The BTA process reverse the direction of cutting fluid and using a tubular boring
bar whilst retaining the single cutting edge and two bearing pads in order to overcome the
problems of undesirable chips trapped between the tool and the hole. Figure 2.2 shows the
oil circulations system. This method normally uses a single edge cutting tool.
Figure 2.2: Cutting oil flow for BTA drilling.
Source: Griffiths B. J. (1975)
The BTA Heller (BTAH) tool usually has a single piece of carbide for the cutting edge.
Sandvik Coromant have produced a variation on the BTAH head called the single tube
system (STS). The BTA (STS) Sandvik heads (previously known as BTAS) have three
cemented carbide tips positioned so that overlap is obtained. The tips are located so that the
cutting forces are balanced, thereby reducing the pressure on the guide pads (Sandvik,
1984).
2.2.3 Twist Drilling

9
Twist drill commonly used for making holes in solid material. It consists of two
parts which is the body and the shank. The body part consists of cutting edge while the
shank is used for holding purpose. Basically, twist drill have two cutting edges with two
opposite spiral flutes cut into is surface as shown in Figure 2.3. These flutes serve to
provide clearance to the chips produced at the cutting edges. They also allow the cutting
fluid to reach the cutting edges.
Figure 2.3: The geometry of twist drill.
Source: www.michigandrill.com
There are two type of shank: taper shanks and straight shanks. Straight shank drills
are held in the machine spindles in a drill chuck. The taper shank drills are directly held in
the spindle with the help of the self- holding taper. The tang at the end of the taper shank
fits into a slot in the spindle. The tang helps to drive the drill and prevents it from slipping
during drilling operation. The shape of the drill point is the most important. The lip angle
should be corrected for the given application. Larger value is used for hard brittle materials,
while smaller values are used for soft materials. Some representatives’ values are given in
Table 2.1.

10
The two cutting edges of the drilling should be equal in length as well as the same
angle with the drill axis. Otherwise, there will be unequal cutting forces along the cutting
edges causing a torsional load. This will cause the drill to wear out quickly. Also, the holes
produced with such a drill tend to be oversized.
Table 2.1: Lips angle for various work materials
Source: Rao P. N. (2013)
Work Material Lip angle, degrees
Deep hole drilling 128
Hard material 136
Soft nonferrous materials 90
Hardened steel 125
Wood and nonmetals 60
2.2.4 Comparison and Selection
In this study, the experiment will be conducted using twist drill method because it is
commonly used in industry to perform drilling operations. Based on the review from the
other researcher’s work, there is an advantage to precede this project using twist drill. The
technical comparisons are as in Table 2.2. As it can perform well in a wide variety of
material, equipment and job conditions, the problem also usually comes from this type of
drilling. This study will find the technique to overcome this problem.
2.3 TOOL CONDITION MONITORING (TCM)
TCM is a technique to monitor the condition of drill bit during the drill process is
performed. The function of TCM is to avoid catastrophic tool failure by early detection of
disturbances such as wear, chatter, and tool breakage in the machining process. This
technique utilise information from sources like forces, chatter and temperature signal to

11
facilitate the detection of instabilities in the machining process. Basically it can be
classified into two methods which are direct method and indirect method.
Table 2.2: Technical comparison of these three types of drilling process
2.3.1 Direct Method (Online)
Direct method is tool monitoring method that measures the actual tool condition
continuously. The measurement of the actual dimensions of the worn area on the tool can
be facile after drilling a number of holes whether the drill are removed or a measuring
device are installed on the machine. This method will gives the high degree of accuracy but
Drilling techniques Gun drill BTA Twist drill
Drilling tool
diameter
Small diameter
drilling, typically 2 -
50mm diameter
holes
Larger diameter drilling,
typically 40 – 250mm
diameter from
0.5 - 150 mm
Coolant High-pressure
coolant
High-pressure coolant Low-pressure
Chips discharge
Chips are discharged
on the outside of the
tool
Chips are discharged
through the tool center and
machine spindle
Chips are
discharged on
the outside of
the tool
Cutting edge Single cutting edge Single cutting edge Solid
Feed rate (mm/rev)
0.02 to 0.03 (sterling
gun drills catalog)
Less than
180mm/min
(L.N.Lopez et. al,
2011)
0.25 to 0.45 (mollart.com) 0.20 to 0.30
(Kalpakjian and
Steven, 2010)
Up to 600
mm/min
Others
Special forms can be
ground in tool tip
High penetration rates and
power requirements
compared to gundrill
tooling
Required high
cooling
performance to
induce high
thermal load

12
very difficult to implement. Usually, most sensors are used in direct sensing techniques
such as proximity sensor, radioactive sensor, vision sensor and etc. as shown in Figure 2.4
and 2.5.
2.3.2 Indirect Method (Offline)
Indirect method measure the parameter that correlated with tool condition.
Although this parameter can be measured, they are often influenced by non-wear
phenomena leading to an erroneous prediction of tool life (Kurada, 1997). Commonly, the
most parameter used in indirect sensing techniques is cutting force, vibration, acoustic
emission, ultrasonic vibration and etc. as shown in Figure 2.5.
Based on the other researcher, indirect method are more suitable to be implemented
because this method is less complex and suitable for practical application (Lauro et al.,
2014). Besides that, most of the TCM researchers are using TCM indirect method in their
works (Rizal et al., 2014). This experiment will use indirect method as most of the
researchers suggest this is the best practical method to be implemented in industrial world.
Figure 2.4: Abundance of sensor for direct tool condition monitoring.
Source: Byrne G. et al. (1995)

13
Figure 2.5: Example of direct and indirect method of tool condition monitoring.
Direct Method
Shape of the cutting edge
and the tool area.
= Measurement with optical method or integration of thin film sensor into the cuationg
of a cutting tool.
Volumetric overall loss of the tool.
= Measurement the size and of wear particles in the
coolant or measurement of radioactivity.
Changes of electrical resistance at the junction of
tool and workpiece.
= Voltage measurement at the specific, conductive tool
coating.
Change of distance between toolholder and workpiece.
= Distance measurement by means of micrometer,
pneumatic gauges, displacement tranduser and
ultrasonic sensor.
Indirect Method
Cutting force
= Force measurement using strain gauge, piezoelectric
sensor at the tool and torque measurement at
the main spindle.
Vibration of tool or toolholder
= Vibration measurement using accelerometer.
Electrical current, poweror energy.
= Measurement of power consumption of spindle or
feed motor using dynamometer of ampere
meter
Cutting Temperature
= Measurement eith the mchanical stylus or optical
method.
Tool Condition Monitoring

14
2.4 DRILLING PARAMETER
2.4.1 Cutting Speed
The cutting speed in drilling is the surface speed of twist drill. Thus,
(2.1)
Where, V = Cutting speed (surface), m/min
D = Diameter of the twist drill, mm
N = Rotational speed of the drill, rev/min
The cutting speed is varying according to the work and the tool material. Table 2.3 shows
the optimal cutting speed, N for drilling using tungsten carbide tip drills.
2.4.2 Feed Rate
The feed rate in drilling is the distance travels into the workpiece per revolution
(Kalpakjian, 2006). Thus,
f = N fr
(3.2)
Where, f = Feedrate, mm/min
N = Spindle speed, rev/min
fr = Feed per revolution, mm/rev
It is usually better to start the drill operation with a slower speed and build up until
the maximum. But, the overloading of the drill bit by feeding in Z-axis will result in

15
excessive chip load on each drill lip causing the cutting edges to wear or fracture. The
inappropriate feedrate also will cause the burr after the drilling operation finish. Correlation
between feed rate and thrust force with varying drill diameters can be approximated by
applying the shear plane model to the drilling process (Jinsoo Kim, 2000). Table 2.4 shows
the recommended feedrate for 2 Flute High Speed Steel (HSS) Drills.
Table 2.3: Cutting speeds for drilling using tungsten carbide tip drills.
Source: Rao P. N. (2013)
Work material Cutting speed
(mm/min)
Aluminium 50 to150
Brass 50 to 100
Bronze 50 to 100
Cast iron soft 30 to 55
Cast iron chilled 10 to 15
Cast iron hard 30 to 45
Steel over 450 BHN 25 to 35
Table 2.4: The recommended average feedrate for 2 Flute HSS Drills
Source: Machinery Handbook (Erick Oberg, 2011)
Drill Diameter, mm Recommended Feed, f
Under 3.175 Up to 0.05
3.175 to 6.350 0.05 to 0.1
6.350 to 12.700 0.1 to 0.2
12.700 to 25.400 0.2 to 0.3
25.400 and over 0.3 and over