ii. operations strategy and process choice
DESCRIPTION
II. Operations Strategy and Process Choice. Operations Management and Competitive Advantages “An Efficiency Drive” “Case Study: Burger Time” Process Types and The Product-Process Matrix Case Discussion: Kristen’s Cookies Process Flow Diagram and Gantt Chart. An Efficiency Drive. - PowerPoint PPT PresentationTRANSCRIPT

1
II. Operations Strategy and Process Choice
1. Operations Management and Competitive Advantages– “An Efficiency Drive”– “Case Study: Burger Time”
2. Process Types and The Product-Process Matrix
3. Case Discussion: Kristen’s Cookies
4. Process Flow Diagram and Gantt Chart

2
An Efficiency Drive
• How critical is time for drive-through?
• Is drive-through a good deal for the restaurants?
• What are the efforts to save time?
• Implications

3
Case Discussion: Burger Time
• What are the major operational differences between McDonald’s and Burger King?
• How do these differences relate to each company’s competitive strategies?
• What implications do these differences have for the management of operations?

4

5
Competitive Advantages and Operations Management
Competitive Advantages
• Price – Cost
• Quality– Customer service– Consistent quality
• Time– Rapid, reliable delivery
• Variety
Operations Management • Match supply with demand• Quantitative methods and
qualitative strategies to• ensure efficient use of
resources
• find the right balance between competing objectives
• improve performance along multiple dimensions simultaneously

6
Performance Dimensions in Retail Banking
• Quality: courteous services, consistency (reliability), accurate information (credibility), empathy, timely information (customer responsiveness), conformance, employee skill and knowledge
• Time: delivery speed (waiting time), convenient services (access), on time delivery (account statements), handling customer complaints
• Flexibility: a broad line of financial products, system responsiveness, new product introduction speed, rapid staff changes, customizations
• Cost: cost effective back and front-office labor productivity, cost effective back-office technology innovations, transaction processing costs

7
The changing sources of competitive advantage
• Low Cost & Scale Economies (< 1960s)
• Focused Factories (mid 1960s)
• Flexible Factories and Product variety (1970s)
• Quality (1980s)
• Time (late 1980s-1990s--> )
8
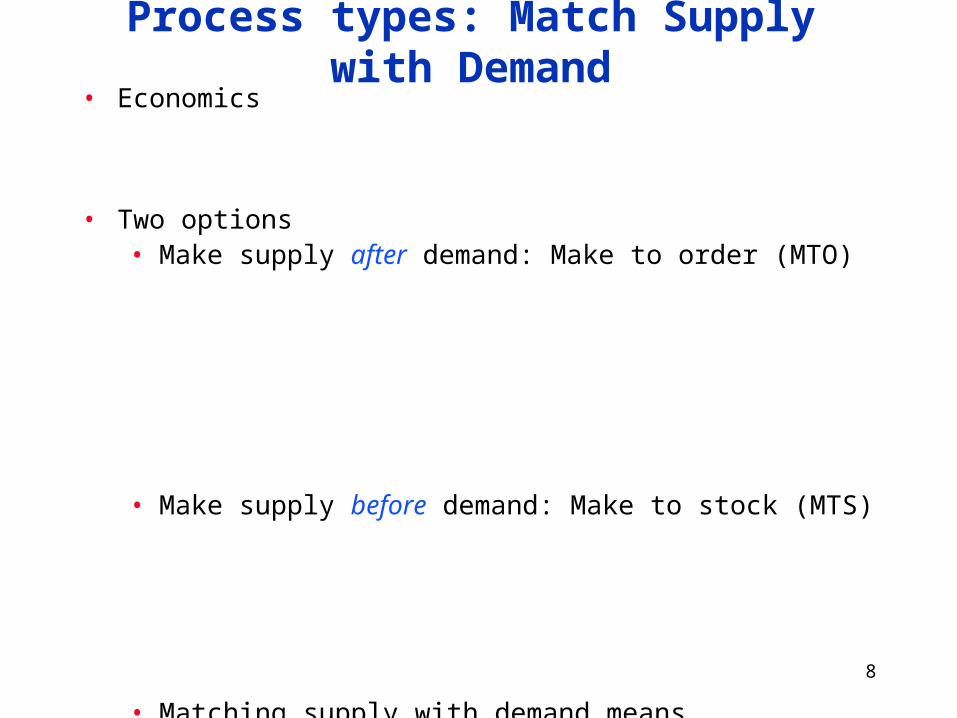
Process types: Match Supply with Demand• Economics
• Two options• Make supply after demand: Make to order (MTO)
• Make supply before demand: Make to stock (MTS)
• Matching supply with demand means

9
Process Types: Resource Types and Layout• Job Shop process
– General purposed/flexible resources– Process focused layout: Jobs have flexible routing, go from one resource
to another as needed– Wide variety of products, customized products
• Batch process– Similar to JS, but with larger lot sizes, some EOS, more commonality in
the resources required, still not cost effective to build a dedicated assembly line.
• Discrete flow process– Product focused layout: Fixed (possibly automated) flow of products,
tightly connected stages (WIP is automatically managed), specialized tasks
– Heavily capitalized – High volume
• Continuous flow process– Product focused layout– heavily capitalized – Product is a commodity – no discrete units, minimal variety, high volume

10
Matching Products and ProcessesProduct
Process
Jumbled Flow.Process segmentsloosely linked.
Disconnected LineFlow/Jumbled Flowbut a dominant flowexists.
JOB SHOP
(Commercial Printer,Ph.D program)
BATCH
(Heavy Equipment,MBA program)
DISCRETE FLOWS
(Auto Assembly)
CONTINUOUS FLOW
(Oil Refinery)
Low volumeLow Standardization
One of a kind
Low volume
Many Products
Higher volume
Few Major Products
High volumeHigh StandardizationCommodity Products
Connected LineFlow (assembly line)
Continuous, automated,rigid line flow.Process segments tightlylinked.
Bidding, delivery,product design flexibility
Quality & Product Differentiation,output volume flexibility
Price
Scheduling,Materials Handling,Shifting Bottlenecks
Worker Motivation,Balance,Maintaining Flexibility
ManagerialChallenges
Opportunity
Costs
Out-of-pocket
CostsCapital Investment for bigchunk capacity,Technological Change,Vertical Integration

11
12
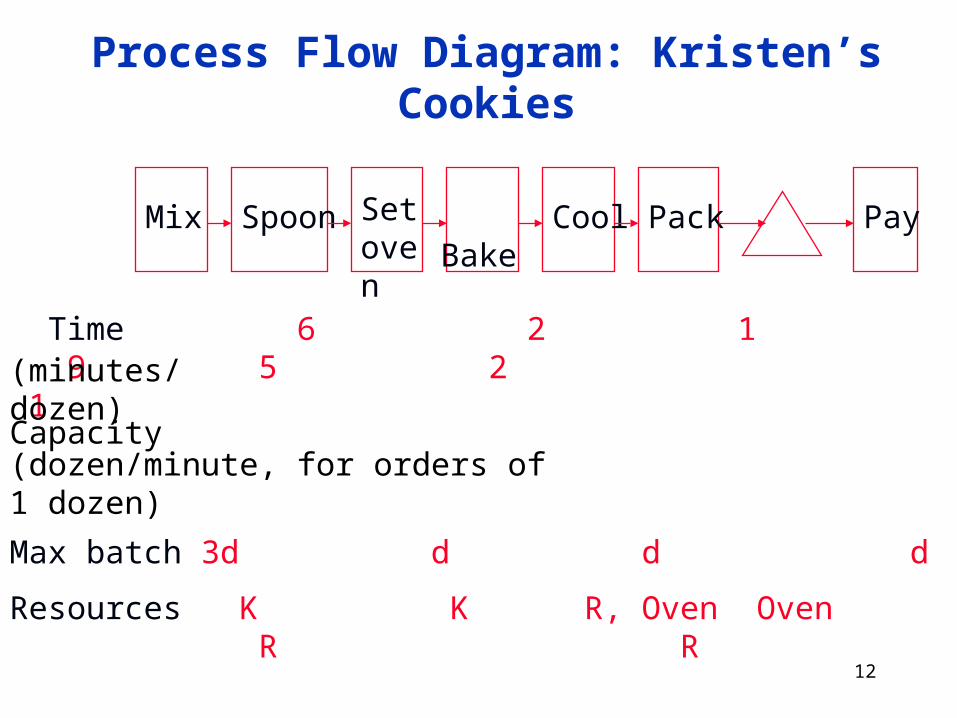
Process Flow Diagram: Kristen’s Cookies
Mix Spoon Set oven
Bake Cool Pack Pay
Time 6 2 1 9 5 2 1
Max batch 3d d d d
Resources K K R, Oven Oven R R
Capacity
(minutes/dozen)
(dozen/minute, for orders of 1 dozen)

13
14
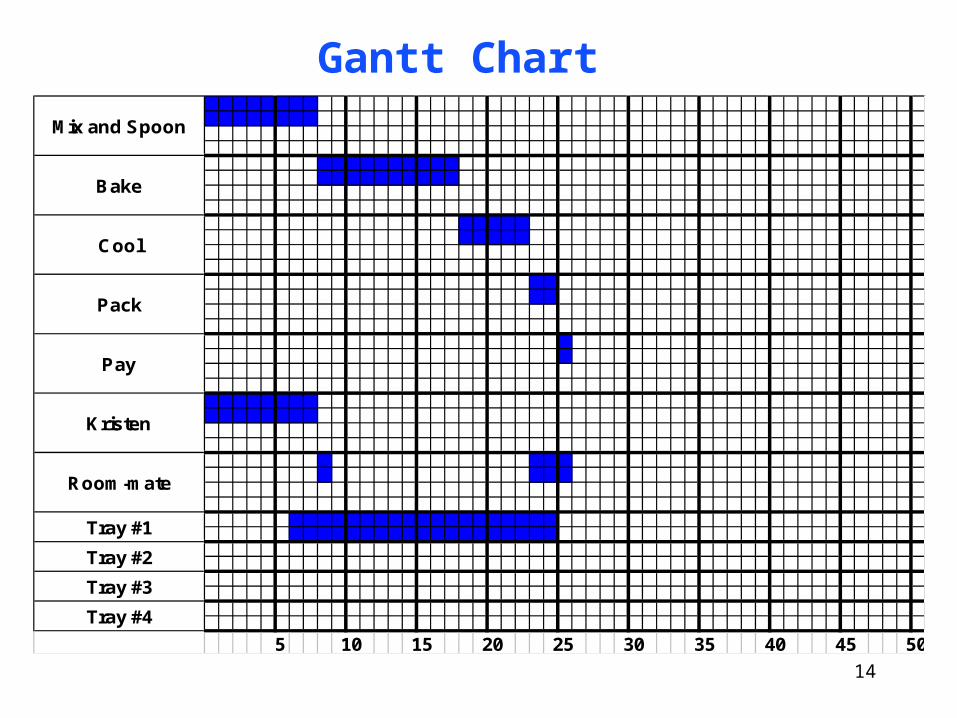
5 10 15 20 25 30 35 40 45 50
Mix and Spoon
Bake
Cool
Pack
Tray #2
Tray #3
Tray #4
Pay
Kristen
Room-mate
Tray #1
Gantt Chart

15
16
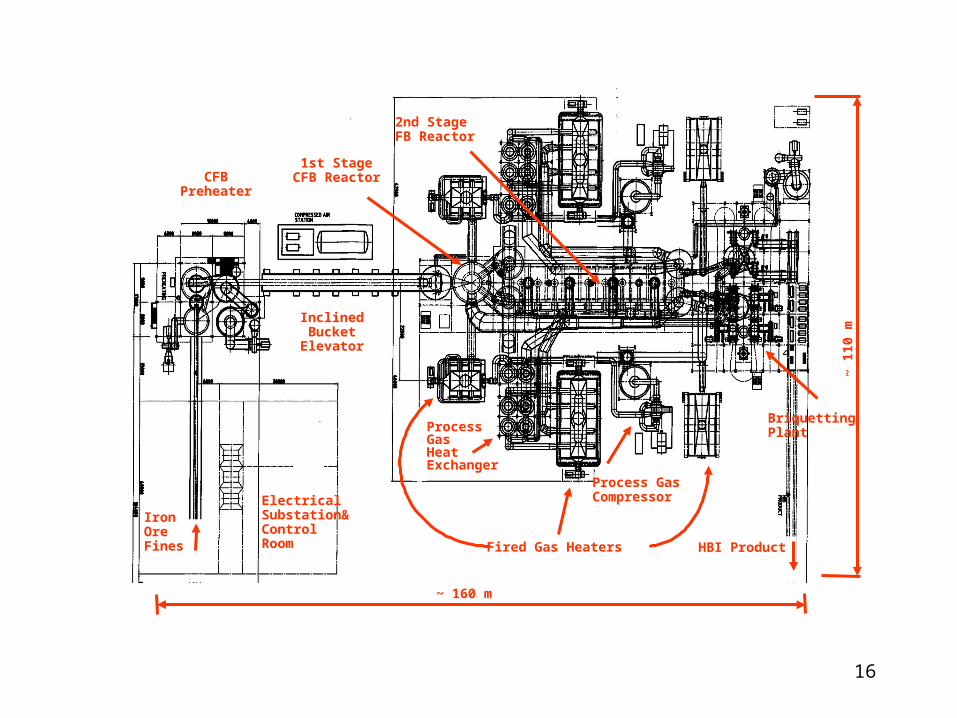
~ 160 m
Iron OreFines
CFBPreheater
InclinedBucket
Elevator
1st StageCFB Reactor
2nd StageFB Reactor
BriquettingPlant
HBI Product
ProcessGasHeatExchanger
Process GasCompressor
Fired Gas Heaters
~ 1
10
m
ElectricalSubstation&ControlRoom
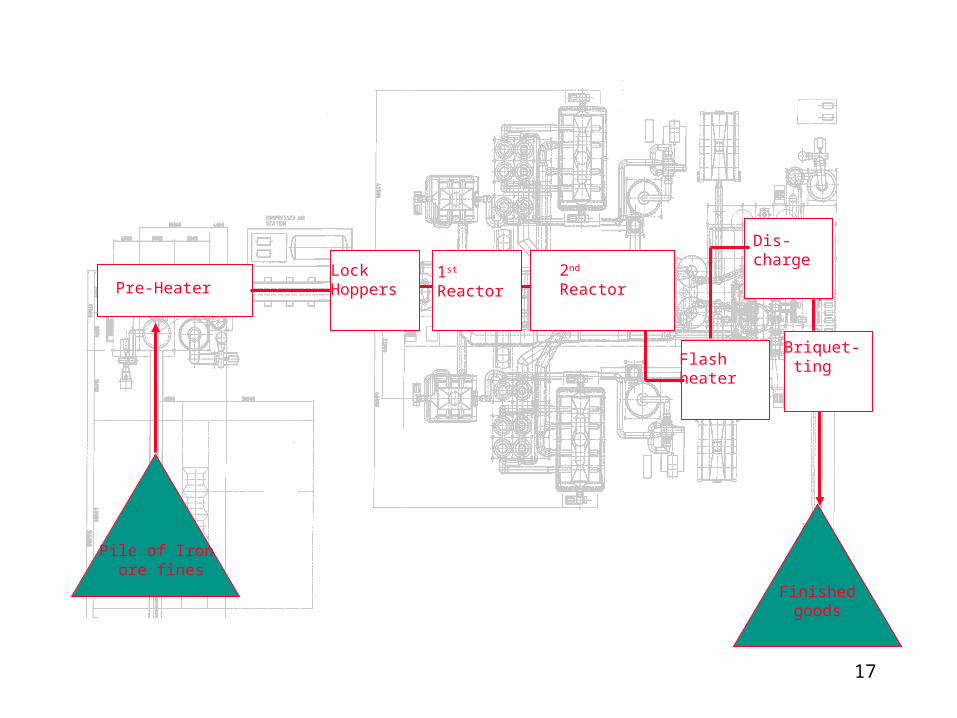
17
Pile of Iron ore fines
Pre-Heater
Briquet- tingFlash
heater
Dis-charge
Finishedgoods
Lock Hoppers
1st Reactor
2nd Reactor

18
Process Flow Diagram and Gantt Chart• Process Flow Diagram: Illustrates the flow of product or service from input to
final output (stages).
– Software (Visio et al.)
• Gantt Chart: Illustrates the interplay between resources at all time
– Important for scheduling and coordinating production– Software (Microsoft Project)

19
Today’s Takeaways 1. Operations management and competitive advantages
2. Process Types and The Product-Process Matrix– Process Types
• Matching supply with demand: MTO vs. MTS • Resource types and layout: job shop, batch, discrete flow,
continuous flow
– The Product-Process Matrix: Diagonal
3. Case discussion: Kristen’s Cookies
4. Process Flow Diagram and Gantt Chart– Flow Diagram: stages products flow through– Gantt Chart: interplay of resources Operational Measures