ii. sonar system technology - ieee uffcieee-uffc.org/wp-content/uploads/2017/02/t7550291.pdf ·...
TRANSCRIPT
291 IEEE TRANSAIXIONS ON SONICS AND ULTRASONICS VOL su-22 NO 5 SEPTEMBER 1975
II Sonar System Technology
A INTRODUCTION
THEOBJECTIVE of thispaper is to present the fundamentals of sonarsystem technology Specific
sonar applications require many space-time processing procedures and associated tradeoffs To optimize acoustic performancesystem analysis and design should reflect the dynamics of the medium sonar and target
The organization and emphasis of thematerial was influenced by the fact that in the past twenty-five years the most significant advancements made in sonar tech-nology have been in
1) improving understanding of shallow and deep water propagationmodes andevaluatingtheirconstraints on system design
2) establishing the correlation between signal design andsonarparametersand assessing the impactrsquo on the receiver structure
3) adapting the receiver beam pattern to the changing structure of the masking background and
4) utilizing dynamic range compression and normaliza- tiontechniques to best ldquomatchrdquo the received signal to the display andor decision device
Particular attention is given here to a system model for active and passive sonar operatmion the signal waveforms transmission and reception modes commonly used in echo ranging the propagation effects and reverberation mech- anisms of the acoustic channel the multidimensional as- pects of conventional beamforming and the feasibility of adaptive control in an operational environment the effec- tiveness of gain control receivers and hard clipping for dynamic range compression and normalization of acoustic data the techniques presently employed for signal detec- tion and parameter estimation-for video and aural pre- sentationandthedynamicalsystem measures required for system performance evaluation
The material is presented in a somewhat ldquohit-and-runrdquo fashion since itrsquo is meant to be tutorial However it is hoped that there is enough continuity to provide the conceptual link between the operational constraints and engineering design criteria of a sonar system for any given application
BWHATIS SONARACOUSTICVERSUS ELECTROMAGNETIC WAVES
The word LLsonarrdquo wascoined during World War I1 fromSOoundNAvigationandRangingTodaysonar is defined as ldquothe method or equipment for determining
Manuscript received May 25 1975 The author is with MSB Systems Inc Westport Conn 06880
by underwater sound the presence location or nature of objects in the seardquo [l] This includes all applications of underwater sound except communication Systems which employunderwater acoustic energy for observation or communication are called sonar systems Sonar is there-fore a branch of applied acoustics which uses wat8er as a propagating medium
It maybeasked why not use electromagnetic energy rather than acoustic energy for underwater propagation The reason for not doing this is that sea water is an excel- lent conductor of electricity which implies a rapid dis-sipation of electrical energy into heat Therefore the electromagnetic wave is considerably more attenuated than the acoustic wave at the same frequency resulting in shorter ranges of propagation Greater rangescan be obtained with either longer electromagnetic waves at the expense of poor resolution or withhugeenergystorage atthe expense of cost and size Both approaches are impractical for most applications of interest
Acoustic and electromagnetic energy transmission differ in other important aspects Acoustic waves areirrota-tional or longitudinal while electromagnetic waves are generally transverse This implies that the compression andrarefaction(negativecompression) of the fluid me-dium which characterizes acoustic wave transmission is in the direction of propagation whereas the electric and magnetic fields are perpendicular to each otherand to the direction of propagation Electromagnetic waves may therefore be polarized while acoustic waves cannot
Also the two types of waves travel a t markedly dif- ferent speeds In water the velocity of sound is about 1500 meters per second 45 times faster than in air An electromagnetic wave inairtravels a t about 3 X lo meters per second almost a million times faster than sound (although it does travel much slower in water) In addition sound travels increasingly faster insubstances of decreasing compressibility such as rock This greatly influences the character of acoustic wavesimpinging a multilayered sea bottom
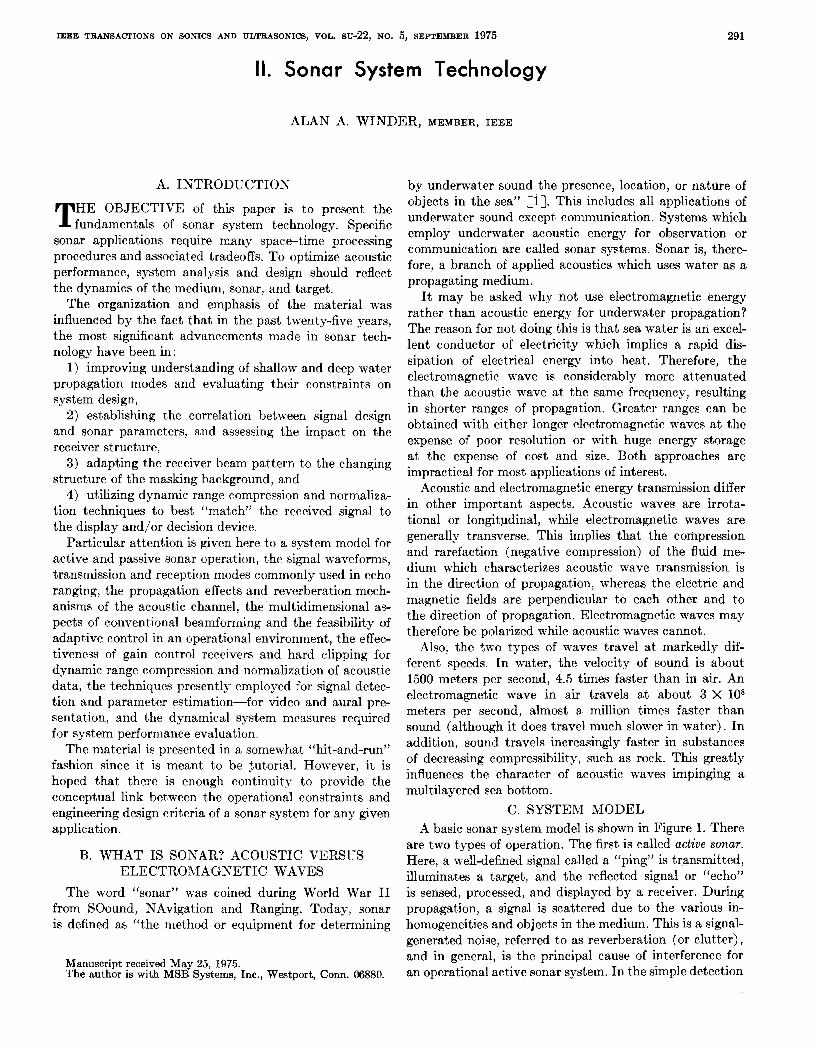
CSYSTEM MODEL A basic sonar system model is shown in Figure 1 There
are two types of operation The first is called active sonar Here a well-defined signal called a ldquopingrdquo is transmitted illuminates a target and the reflected signal or ldquoechordquo is sensed processed and displayed by a receiver During propagation a signal is scattered due to the various in- homogeneities and objects in the medium This is a signal- generated noise referred to as reverberation (or clutter) and in general is the principal cause of interference for an operational active sonar systemIn the simple detection
IEEE TRANSACTIONS ON SONICS AND ULTRASONICS SEPTEMBER 1975
A I AMBIENT NOISE
RADIATED NOISE
(PASSIVE T m fT
Fig 1 A basic sonar system model
problem where the received signal is completely specified the receiver will process a waveformwhich consists of ambient noise if no signal is present or of ambient noise plus echo and scatteredreturns if a signal is present Detection is made considerably more difficult due to relativetargetandscatterermotionthetargetbeing extended rather than a point source andthespatial distribution of the scatterers
The second type of operation is called passive sonar where a target is detected by the noise it radiates The detectionproblem is to distinguish the desired target radiated noise or ldquosignaturerdquo from the undesired ambient noise whose energy spectrum is quite similar In either operation the frequency components of the ldquodesiredrdquo signal are coherently related while those of the back- ground noise are not Active sonar is further complicated in that the scattered returns arecoherently related to the transmitted signal
The sonar system model reflects the interrelationships between the medium sonar and target and the dynamics of sonar operation When specific signal and array designs are considered the sonar parameters such as source and receiver locations frequency pulselength modulation bandwidthandtransmittingand receiving beam pat- terns together with the space-time geophysical properties of the medium such as velocity (wind or current) tem- peratuie pressure salinity depth biological species and bottom porosity establish the sound properties of the acoustic field The significant sound propertiesarethe meanvalueandvariability of the sound pressure the particular sound ray path and propagationmode and the maskingreverberation levels Operational measures of system capability are the figure-of-merit and the search rate Medium and sonar characteristics define the target localiiation accuracy of the sonar in range bearing and rangerate The medium sonsr and target establish the reliable data rate and the averageecho excess and its variabilityThisinformationcanthenbe utilized to compute the probability of detection in terms of the fire control variables Clearly analysis on an entiresystem basis is needed to determine the effectiveness and the confidence levels of sonar operation
The following sections will give the reader an apprecia- tion as to how signal design and transmission and reception modes can be judiciously selected to best ldquomatchrdquo a particularstrsquoructure of the acoustic channel for efficient signal transmission and echo reception
D SIGNAL WAVEFORMS Thetransmitted signal referred toinFigure 1 is an
essential element in active sonar system design It impacts strongly on the sound properties of the acoustic field and upon the receiver structure for signal enhancement All signals used in echo-rangingcan be classified into two classes depending on the value of their average power 1) signals with finite energy having zero average power and 2) signals with finite power having infinite energy Class I containstherectangular pulse explosive echo-ranging (EER)-type impulses and sums of sample values (impulsemodulation) Class I1 containsall periodic functions andthestep function Therefore the signal class determines trsquohe dimensions of the sonar range equa- tions for specific applications whether they are defined on the basis of energy or power Clearly at-sea measure- ments to evaluate system performance must support this dimensionality
The signals most commonly used in echo-ranging sys-tems are continuous wave (CW) linear frequency modu-lation (LFM) pseudorandom noise (PRN) continuous transmission frequency modulation (CTFRI)and acoustic impulse The signal(s) selected would depend upon the particular application and the operational and hardware constraints
The simplest signal is rectangular pulse C W charac-terized by its structural attributesof peak amplitude and pulselength CW signals may havehigh resolution in range or in doppler but not in both simultaneously The range resolution AR is determined by the pulselength Tand is givenby AR = c T j 2 where c is the velocity of sound and the doppler resolution is inversely propor- tional to the pulselength 1T Clearly short CW will provide better range resolution than long CW resulting ingreater processing gain against reverberation For a given transmit pattern beamwidth shortrsquo CW will give a
293 WINDER UNDERWATER SOUND
FREOUEWCVWlFT FREOUENCY SHIFT (VELOCITY) w n r c w LFM (VELOCITY1
LONG cw TIME DELAY 0 (RANGE1
(AI LOW-DOPPLER TARGET (B1 HIGH-DOPPLERTARGET
Fig 2 Ambiguity functioncomparingeffectiveneas of short CWlong CW and linear FM signamp
higher search rate and a shorter blind zone and will be moredetectionresistant On the otherhand longCW will have better doppler resolution which is more effective in detecting high doppler targets (both in the video and audio modes) The longer pulse will also reduce the false alarm rate under noise-limited conditions in beam scan- ning for a givenspatial coverage a shorter pulse will resultina higher data rateThedataand false alarm ratesare measures of system performance andtactical effectiveness In practice the sonar operator will have several pulselengths to choose from for optimizing target detection track and classification Experiments indicate that amplitude pulse shaping such as Gaussian or cosine-squared will significantly suppress the reverberationas compared to that generatedwith the rectangular pulse
Linear F M is characterized bytheuniqueproperty thatthe instantaneousfrequencyvarieslinearlywith time [a] Operational results in recent years have shown that modulated signals such aslinearFMare more effective than CW for detecting low doppler targets under reverberation-limited conditions This canbe seen by examining the ambiguity functionwhich is the squared magnitude of the autocorrelation function of a signal with respect to displacements in both time delay and doppler shift The ambiguity functions of short CW long CW and linear FM signals are shown in Figure 2 to illustrate their relative effectiveness in detecting low and high doppler targets The linear FM signal is assumed to have a pulse- lengthand modulation bandwidth equal to that of the long and short CW pulses respectively For a low doppler target(T) linear FM is seen to have theleast signal ambiguity area within the reverberation band (as defined by the dashed lines) This partially explains why linear FM has greater target detection sensitivity of low doppler targets When the target has sufficient doppler to remove it from the reverberation band only the long CW pulse is completely outside the band portions of the short CW andlinearFMcontoursarestill reverberation-limited Therefore the long CW pulse is most effective for detect- ing high-doppler targets At present both pulse CW and linear FM are used in sequential transmission to cover both noise-limited and reverberation-limited conditions for the full target doppler spread
Thelinear FM signal possemes range and doppler resolution ambiguities located along an inclined axis A single LFM echo represents a linear combination of these ambiguities and does not provide an unambiguous deter-mination of either A uniquedopplerdetermination can be made by processing several LFh4 echoes or by trans-mitting a trapezoidal-type sweep
Modulated signals of bandwidth W can resolve targets within AR = c 2 W The effective range resolution of the system is themajor lobe width of the autocorrelation function after coherent processing Since the pulselength- modulation bandwidth product is usually much greater than unity for equal range resolution linear FM has an inherentbetter doppler resolution than pulse CW and reduces the peak power constraint on transmitter design relative to CW (assumingconstantenergy) For equal doppler resolution (equalpulselength)thelinear F range resolution is superior thereby providinggreater processing gain against reverberation
In practice the LFM pulselength is usually longer than that for CW For equal search rates defined as the ratio of transmitting beamwidth to pulselength the modulated signal will have a wider beamwidth transmission resulting in a lower source level However this will not affect target detectionunder reverberation-limited conditions The CW transmission will be chara(Acrized by a shorter pulse- lengthnarrowerbeamwidth and higher source level which will enhance target detgtection when noise-limited For the same processing threshold with noise masking the longer FM pulse will reduce the false alarm rate
A pseudorandom noise ( P R N ) signal provides simul- taneous resolution in range and doppler which permits one to resolve multipaths and discriminate against rever- beration [S] A PRN pulse is generated by a shift-register encoder (SRE) comprised of a digital shift register with a feedback loop containing a modulo-l adder The adder performs the logical function AR + AB where A is the state of the (n- i )th stage and R is the state of the nth stage and the summed output is used to determine the state of the reset stage For certain values of n and i the maximum PRN code formed by an n-stage SRE consists of 2 - 1 bits before repeating The Fourier spectmm of the output sequence is discrete of sin r formwith spectral lines separated in freyuencyby F J ( 2 - l ) where F is the clock frequency of the shift register If theSREoutput is bandlimited to one-half the clock frequency the output PRK signal will appear asband-limited white noise
For resolutions proportional to l W in time delay and 1T in frequency shift a maximumlength PRN code will have an ambiguity function comprised of acentral peak of magnitude unity and subsidiary peaks of magni- tude R m 2 In R2TW above the mean value 12TW of the skirts In particular a 1000-bitmaximal length code will have an average self-noise of --30 dBand a peak self-noise of -17 dB experiment^ with a clipped-cross-correlation sonar indicate that due t o clipping and Ham-
294
Fig 3 Review of CTFM principles
pling the peak signal is at -4 dB insteadof 0 dB predicted theoretically This gives a dynamic range of only 13 dB Losses in multiple channels attributedto OR-gating nonstationarity etc can further reduce the peak signal to -10 dB resulting in a dynamic range of only 7 dB A sufficient dynamic range is required to process against multiplepaths Therefore an effective PRN code for sonarapplicationscanonlybeohiained for trsquoime-band- widthproducts of 500 or more In addition platform motion associated with the source or receiver can seriously degrade the effectiveness of PRN signals
In a CTFM sonar the received and transmitted signals are heterodyned and the lower sideband preserved desig- natedthe difference frequency Aunique property of CTFM is that there is a distinct difference frequency for each target range These principles are depicted in Figure 3 A primary advantage of a CTFM sonar is that it pro- vides continuous range information where a range analysis corresponds to a frequency analysis Additional advan-tages of audio echo quality low peak power and reduced target strength and background fluctuations are discussed below Theseoperationalcharacteristicsmake CTFM particularly well suited for deep submergence search and surveillance as compared to conventional pulse CW
CTFM provides audio informationas to the detailed envelope of the echo structure ie is the echo extremely well defined (as from a thick-walled steel structure) or is it diffuse (as from a jagged rock or heavy reverberation area) This is referred to as audio echo quality which will enhance detection andclassification In most deep scanning applications for a short pulse CW sonar to achieve the same range resolution as a CTFM sonar its pulselength mustbe extremely short andthus will usually be in-audibleTheCTFMsonar will have bothaudioand a video display while the CW sonar will have a video display only The video display is a poor source of echo quality as compared to audio due to limited dynamic range and minimum ldquohighlightrdquo recognition capability
Also a continuous transmission can provide low peak powerwhile retaining or increasing the average power
IEEE TRANSACPIONS ON SONICS AND ULTRASONICS SEPTEMBER 1975
This will simplify transmitter design avoid cavitation and possible increase range A short pulse CW sonar is usually cavitation-prone
The diffraction pattern of a cylindrical metal object is comprised of specular reflectrsquoion from cardinal aspects and nonspecular reflection from discontinuities at intermediate aspects The latter generate a peak target strengthvarying level as much as 5-15 dB differential A single-frequencya pulse sonar supports the fine lobe structure of the pattern while a wide-modulation bandwidth transmission such as CTFMtends to give more of an average yalue (phase interference) thereby improving detection at random aspect In general wide-modulation bandwidth trans-missions (LFM PRNandCTFM)tendtoreducethe variance of background fluctuations This provides excel- lent video target detection sensitivity when reverberation-limited
Thelast signal-type tobe discussed is the acoustic impulse Theproperties which characterize the acoustic impulse are short pulselengbh as compared to the interval between occurences of the event and high peak pressure obtained within microseconds of the epoch [4] These two propertiesenhance the nonlinear and dispersive prop- erties of the medium result in complex echo formation and impose constraints as to dynamic range and time of analysis on the measuring instrumentation One important medium effect is the anomaly produced by finite ampli- tude iea steepening of the leading edge of the pulse (ldquosawtoothrdquo effect) which implies a redistribution of low-frequencyenergy to the high-frequency region Be- cause the interaction of acoustic impulses with the me-dium target and instrumentation is more complex than for most other types of signals it is possible to derive greater information from them
An acoustic impulse waveform is defined by its pulse- length peak pressure rise time rate of decay and nega- tive pressure (relative to hydrostatic pressure) It is desirable that the latter be as small as possible to reduce the cavitation constraint For practical applications the signal must be controllable including reproducible in its space-timepropertiessuchas the energy distxibution sidelobe structure beamwidth and on-axis pulse history [5]-[7] Controllability permits changing thesignal wave- shape to enhance echo classification to suppress reverbera- tionandto increase the security of the transmissions Reproducibility is required for processing multiple pings for signal-to-noise enhancement Since the time-band- widthproduct of acoustic impulses is generally unity (l)no enhancementcanbeobtained by processing a single pulse
The properties of controlled acoustic impulses clearly establish the advantages of such signals for echo-ranging applications relative to pulse CW These include utilizing the impulse signals radiated by shock-excited plate modes and the rapid variation in target strengthversus frequency due to structural resonances [S] The short positive pres- sure pulse results in increased security reduced reverbera- tion masking and minimal cavitation constraint Thehigh
- - 295 WINDER UNDERWATERBOUND
SIONALW BEAMFORMER TRANSMITTING O fNE RATOR MATRIX ARRAY
PROeRAMMER __c
I Fig 4
1 Block diagram of sonar transmitter
l
RECElVlNB BEAMFORMER ARRAY MATRIX
I I I I
DECISIONPROQRAYMER - ~ DEVICE 7 lsquo
I I I I I
DY NAY IC I
M E l + COMPRESSION -C +b+ DISPLAY 4
AND NORMMIZATION
I d
6 Fig 5 Black diagram of sonar receiver
peak pressure level results in low absorption loss of the wavefront due tothe nonlinear ldquosawtoothrdquo effect The repeatablebroadbandspectrum plus short rise time results in small signal fluctuations and facilitates signal-to- noise enhancement byrepetitive pulsing detection of metal structures near theocean bottom and the classifica- tion of large targets by highlights from small flat surfaces The favorable effects of a short rise time are attributed to the transmission of high-frequencyenergy andthe associated high directivity The operational benefits of a controlled acoustic impulse sonar would be emphasized in shallow water operation
E TRANShlISSION AND RECEPTION MODES As was probably suspected the trsquoransmitter andreceiver
blocks indicated inFigure 1 areeach comprised of a number of primarybutelementary operations What generally distinguishes one mode fromanother is how these elementary operations are interconnected Each mode is a compromise between such factorsas hardware complexity data rate maximum range of detection and target bearing resolution This will become quite clear later on Right now the major consideration is to describe the elementary operations pertaining to each block
Atypicalblockdiagram of asonar (or radar) trans-mitter is shown inFigure 4 The output of the ldquosignal generatorrdquo can be in many forms (analogor digital pulse CW or linear FM or several signals-time shared) de- pending upon the particular system under consideration The output of the signal generator is sent toa ldquobeamformer matrixrdquo Its purpose is to adequately weightrsquo and delay the signal so that the ldquotransmitting arrayrdquo (or projector) will generate the desired beam pattern inthe acoustic channel A beam pattern determineshow the transmitted
acoustic energy is concentratedand oriented in space relative to the transmitter The weighting and delaying of the signal is usually referred to as ldquophasingrdquoor ldquobeam-formingrdquo The array geometry (eg circular parabolic spherical or cylindrical) will depend upon the particular application In addition the trsquoransmitting array is com-prised of manyindividualradiatingelements whose composition depends upon trsquohe propagating medium For exampleinsonar the radiating material is generally a piezoelectric ceramic and t o someextent a magneto-strictivemetal which converts electrical energy into acoustical energy and vice versa A ldquoprogrammerrdquois also shown mainly for the sake of completeness Its pur- pose is to synchronize multrsquoiple or sequential transmissions
A typical block diagram of a sonar (radar) receiver is shown in Figure 5 The first impression one has is that it is more complicated than a transmitter This should come as no surprise since in transmission the signal-to-noise ratio is infinite (or close to it) while in reception it is less than unity for most cases of interest Clearly some addi- tional work has to be done before a meaningful decision can be made The ldquoreceiving arrayrdquo (or hydrophone) and ldquobeamformer matrixrdquo are quitesimilar to their transmitter counterparts In fact both arrays are generally one and the same The only difference is that in transmission the beamformer matrix has a minimum amount of amplitude weighting for maximum energy transmission This con- sideration is certainly not relevant in reception so that amplitude weighting canbe used here The resultis greater sidelobe suppression and directivity in reception than in transmission
The next two blocks in the receiver ldquodynamic range compression and normalizationrdquo (DRCN) and theldquosignal processorrdquo have the joint task of preparing the received
296 IEEE TRANSACTIONS ON SONICS AND ULTRASONICS SEPTEMBER 1975
3DB
OMNIDIRECTIONAL TRANSMISSION
I ARRAY
ROTATIONALOIRECTIONAL rsquo TRANSMISSION
SEARCHLIGHT
lsquo
( a I SEARCHLIGHT (b 1 SCANNING SONAR SONAR
Fig 6 Comparison of trensmitting and receiving modes
information for adequate presentation on a visual or aural ldquodisplayrdquo or to a ldquodecision devicerdquo such as a digital com- puter The DRCN block is required to remove some of the spatial andtemporalcharacteristics of the acoustic channel that are impressed upon the propagating signal in order to optimize performancein the processor and display blocks The signal processor is generally a physical realization of the ldquomaximum likelihoodrdquo criterion and involvesmatchedfiltering or correlationtechniques In practice the signal processor displaydecision device and human operator are intimately related and jointly repre-sent the true signal processor Most losses in processing gain occur a t their interfaces The ldquoprogrammerrdquo shown is for synchronization and self-adaptive purposes
The sonar transmitter and receiver models shown in Figures 4 and 5 are adequate for understanding present operationalsonarsystems The systems in use may be classified as either the searchlight scanning or rotational directionaltransmission (RDT) type A comparison of the transmitting and receiving modes for thesesystems is shown in Figure 6
DuringWorldWar IT an active sonarsystemoften used was one having narrowtransmitting and receiving beam patterns and whose transducer array was mechani- cally rotated in azimuth to provideahorizontalsearch
capability Due to the mode of operation and the sharp- ness of the beams these system3 were called ldquosearchlight SOZUTSrdquo (seeFigure6 (a)) A searchlightsonaremploys a directional array to concentrate the acoustic energy of thetransmitted pulse into a narrow beam providing a maximum range of detection Upon contact target bearing is determined by training the array for maximum target echo response This is the simplest method for detecting targets and determining their direction
However there are many disadvantages to this typeof operationdue to the fact that the array must be me-chanically trained resulting in a low data rate A low data rate does not provide a ship with a multiple target detection and tracking capability required for ship secur- ity Mechanical training also limits the array size For this reason searchlight sonars usually employ frequencies higher than 15 kHz thus increasing the attrsquoenuation loss due to heat absorption This partially negates the gains obtainedwith high directivity Finallyitis difficult to maintainsoundcontact when the target is conducting evasive tactics
The data rate limitation of searchlight sonar was elimi-nated with the development of the ldquoscanning sonurrdquo (see Figure 6(b)) at the end of World War 11This provides range and bearing information of all targets in a 360rdquo
WINDER SOUND
azimuthal sector continuously and simultaneously Speci- fically an omnidirectional short-duration pulse is trans- mitted In reception the target returns are scanned by rapidly rotating a narrow receiving beam The receiving beam outputis then presented to a panoramic display The latter is onewhich gives a visual representation of the entire (360rsquo) acoustic field A panoramic display used extensively in radar and sonar is a plan position indicator or PPI The PPI maps the targetrsquos position in azimuth and range in polar coordinates on a cathoderaytube (CRT) where target amplitude is used to modulate the electron beam intensity (orz axis) Therefore a PPI is an example of an intensity modulated CRT polar display and generally uses a P7 (long persistance) phosphor for integration
A scanning-type sonar provides the ship witha multiple targetdetectionandtrackingcapability for maximum security The high data rate of a scanning sonar greatly reduces the percentage of loss-of-target contactrsquo due to time-varying multipaths andamplitudephase fluctua-tions of the ocean In addition since there is no need to mechanically train the array lower operating frequencies may be used With lower frequencies the losses due to absorption are decreased thereby tending to increase the detection range There are however several limitations Omnidirectional transmission implies that the transmitting beam has no directivity A comparisonof searchlight and scanning sonar becomes a question of high transmitting directivityandhigh absorption losses versus notrans-mitting directivity and low absorption losses respectively However in general for a fixed amount of acoustic energy a searchlight sonar will give a greater range of detection than a scanning sonar The scan speed of the receiving beam must be a compromise between the desired target resolution andthe maximum receiver bandwidth(or minimum input signal-to-noise ratio) allowable Also the ambient noise background presented to the display is averagedover 360rsquo which may be considerably higher than the actual ambient level at the true target bearing
The above limitationswere eliminated with the develop- ment of an ldquoRDTrdquo SOWT in the 1950rsquos An RDT type sonar is comprised of rotational directional transmission (RDT) with a preformedbeam (PFB) receiver It pro-vides high transmitting directivity and a high data rate togetherwitha low operating frequency Clearly it combines the best features of searchlight and scanning sonars
Specifically during transmission a sector of the array is properly phasedtoconcentratemaximum acoustic energy into a narrow beam similar to searchlight trans- mission By exciting different usually overlapping sectors the narrow beammaybesequentiallyrotatedthrough 360rdquo Thetransmitted beamremains at eachdiscrete bearingonly long enough to transmit the entire signal ie a timeequaltothe pulse length The number of discrete bearings is equal to 360rsquo divided by the 3-dB beamwidth It is important to note that RDT requires a
UNDERWATER 297
longer time to complete the trsquootal echo ranging cycle This presents a ldquoblind-zonerdquo to the searching vessel
In reception the beams shown in Figure 6(c) are fixed in space relative to the receiving array They aregenerally designed to overlap at the - 3 db points and continuously and simultaneously monitor the entire acoustic field The outputs of the preformed bedm matrix are in parallel form andare applied to individual DRCNsignal processors whose outputs arethen electronically scanned and dis- played on a PPI Each preformed beam output represents acoustic information obtainedwith respect to a finite space sector The preformed beam system has quantized the acoustic field in azimuth and may be considered as an azimuthal normalization The latterattemptstoobtain a constantldquospatialvariancerdquo or a uniformbackground (at a given range) on a PPI display System performance is considerably improved overaconventionalscanning receiver which averages the background over 3i30rdquo How-ever there may be a loss in targetrsquo detectability due to beam-to-beam unbalance (The latter may be eliminated by employing time-division multiplexing j In addition the finite interpolation of a preformed beam system leads to a serious detection degradatrsquoion known as the ldquobrick silordquo or ldquospokingrdquo effect This effect is not present with a conventionalscanner which has an infinite interpolation (theoretically)
Finally animportant difference between ascanning and PFB receiver is that the latter can be corrected for doppler due to own ships motion and the former cannot This means that a PFB receiver can have a smaller band- width thus improving the signal-to-the-noise ratio The method for accomplishing this is referred toas ldquoown doppler nullifyingrdquo (ODN)Each preformedbeam is mixed with an ODN oscillator The ODN oscillator is a voltage-controlled oscillator (VCO) in which the control signal is proportional to the product of the shiprsquos speed and the cosine of the relative bearing of the beam This technique is not possible with ascannerbecauseahigh speed video scan switch cannot be synchronized with the very small changes in the VC0 output
This is a good point to leave the discussion of the various transmission and reception modes and discuss the charac- terization of the acoustic channel block in Figure 1 The acoustic channel is generally trsquohe weakestlink in sonar system design
F ACOUSTICCHANNEL
It is customary when studying the detection and estima- tion problem to initially consider an ideal communication channel A communication channel is the vehicle by which information or data is transferred from one point (source) to another (destination) When assumed tto be ideal it is considered to be homogeneous lossless physically un-boundedand to provide distortionless transmission although the channel may be subject to various types of noise disturbance whichmayproducedistortion at the destination Clearly this simple model is not appropriate
298
for physical reality but is useful in the sense that it facili- tates understanding and visualization of the problem Generally the complexity of the problem is increased to include the effects of random amplitudeand phase scatteringand fading In practice thereareadditional effects to consider For example since a channel is usually not homogeneous or isotropic the received signals are strongly dependent upon the direction from whichthey are received Also the scatterersmay be distributed nonuniformly which leads toa nonstationary process
The acoustic channel in Figure 1 is represented by the ldquolinesrdquo connecting the transmitter and receiver a scatter-ing volume and ambient noise The ldquolinesrdquo may represent hundreds of nautical miles bounded by the air-water interface and on the bottom by mud sand gravel and rock The sea surface is both a reflector and scatterer of sound The sea bottom is similar but its effects are more complicated because of its multilayered composition The sea bottom has a densityandsound velocity that may change gradually or abruptly with depth which implies that its reflection loss is less easily predicted than that of the sea surface In addition ambient noise shown as an additive medium generated signal is a complex boundary and propagation effect a sourcemain of it is due to motion at the air-water interface Therefore it appears that propagation and boundary effects are closely interrelated Too some effects are actually influenced more by bound-aries than the internal acoustic properties of the ocean and vice versa
Propagation Effects Formally the propagation of acoustic waves of rela-
tively small amplitude inan isotropic perfectly elastic homogeneousunbounded and lossless medium can be described bythe linear acoustic waveequation Two approaches to a solution of the wave equation are ldquonor-mal-mode theoryrdquo and ldquoray theoryrdquo [g] [lo]
Normal-mode theory is valid when the wavelength of sound is the same order of magnitude as the water depth It is particularly useful in describing sound propagabion in shallow water or at very low frequencies in deep water This is analogous to the propagation of electromagnetic waves through waveguides Specifically normal-mode theorytreatsthe ocean asa whole and characterizes sound propagation in terms of the natural or eigenmodes of vibration of the ocean body analogous to string vibra- tion The computations involved areeasily carried out on a digital computer However this theory does not facilitate visualization or understanding of the propagation proc- ess-but ray theory does
Acoustic ray trsquoheory is analogous to that employedin geometric optics Similarly it postulates the existence of wavefronts along which the phase or time function of the solution to thewave equation is constant It also postulates that for a given set of conditions the sound patrsquoh between any two points in the ocean is fixed independent of trsquohe direction of propagation This pathis called a ldquosound rayrdquo or ldquoray pathrdquo anda description of the entire propagatrsquoion
IEEE TRANSACTIONS ON SONICS AND ULTRASONICS SEPTEMBER 1975
process is called a ldquoray diagramrdquo This has considerable intuitive appeal However there are several limitations It does not provide a good solution when the ray curvature or pressure amplitude changes appreciably over a distance of one wavelength Therefore ray theory is restricted to high frequencies or short wavelengths
The direction of a ray path is governed by Snellrsquos law The velocity of sound is an increasing function of water temperature pressure and salinityVariations in these variables produce velocity changes which in turn cause a sound wave to refract or change its direction as it propa- gates Therefore a propagation mode is specified by the velocity profile or velocity gradient of the medium A velocity gradient depicts thechange in velocity with depth If the velocity increases with deptrsquoh the gradient is said to be positive producing a ray curvature which is concave upward If the velocity decreases with depth the gradient is said to be negative producing a ray curvature which is concave downward
The deep ocean profile is comprised of two main layers ie 1) a seasonally dependent part consisting of an isothermal or surface layer and seasonal thermocline that extends from the surface down to a few hundred feet and 2) a permanent nonseasonally dependent part consisting of the main thermocline and deep isothermal layer that extends down trsquoo the bottom During the winter and spring and in the Arctic the seasonal thermocline tends to merge with the isothermal layer During thesummer and fall the isothermal layer is only about 50 feet deep and the sea- sonal t(hermoc1ine iswell defined The main thernlocline is a negative gradient due to the decreasing temperature and thus decreasing velocity In the deep isothermal layer thetemperature is nearly constant a t about 39degF and the velocity of sound increases with depth due to increase in pressure The positive gradient is about 0016 feet per secondperfoot A velocity minimum is thus formed at about 1000 meterswhich is the axis of the deep sound channel or so-called SOFAR channel
Velocity profiles and ray theory completely characterize deep water propagation This is a form of ducted propaga-tion where the sound is prevented from spreading in all directions and is bounded within a duct or sound channel These boundaries may be the sea surface and sea bottom multilayerswithin the medium or combinations of the two Deep water (gt1000 fathoms) propagation may be separated into two depending upon the depthof thedasses source
For a near surface source (upper 1500 feet of the ocean) therearethreedistinct modes-the surfaceduct mode [ll] the bottom-bounce mode [K] and the convergence zone mode [13] [14] These are shown in the ray dia-grams in Figure 7 and represent all present applications of sonar for surface vessel submarine and airborne plat-forms
The surface duct or mixed-layer sound channel is the acoustic analog of the ground based duct in radar Vir- tuallyall of the ship sonar systemsdeveloped prior to 1960used thesepaths exclusively The velocity profile
299 WINDERUNDERWATERSOUND
SURFACE DUCT
SINGLE-SURFACE
LEAKAGE BY DIFFRACTION SCATTERING AND
V
Fig 7 Ray diagrams for deep water propagation near surface source
Fig 8 Ray diagrams for deep water propagation deep source
requiredfor this mode has initiallyapositivegradient and then a the propaga- negative gradient At short ranges tion pathis nearly a straight line At longer ranges propa-gation is characterized by repeated surface reflections A ldquoshadow zonerdquo is thus created beneath the layer having little insonification except forsoundleakagefrom the surface duct The leakage has been found to increase with the ratio of wave height to layer depth The importance of a shadow zone is indicated by the fact that it canreduce a surface sonar with a 20 kiloyard range capability to one having less than a 5 kiloyard capability
In recentyearssonarsystemshave employed the bottom-bounce and convergence zone modes for greater ranges of detection than those obtainable in the surface duct The bottom-bounce path requires a strong negative gradient and becomes important in the range region from about 10 to 30 kiloyards At shorter ranges the high angle of incidence causes a largeportion of the sound energy hitting the bottom to be absorbed and thus wasted Be- yond 30 kiloyardsbottom-bounceinvolvesmultiple
reflections where the loss per ldquobouncerdquo at the bottom and surface strongly reduce the received energy In addition bottom-bounce produces a degradation in range resolution due to time dispersion and a bearing error due to a sloping bottom The convergence zone mode requiresinitiallya negativegradientand thena positivegradient which results in a ldquofocussingrdquo of the sound rays Multiple con-vergences can occur similarto multiple bottom reflections The zones are at intervals of 30 to 35 nautical miles having a width of the order of 5 to 10 percent of the range For these modes to be effective it is necessary that the trans- mitted acousticbeambeproperlytiltedin thevertical plane(ie inelevation)for themost efficient ray path transmission
For a deep ocean source thereare two distinct modes- the SOFAR channel and the refractedsurface reflected (RSR) mode Their ray diagrams are shown in Figure 8
The SOFAR channel [15] [l61 is formed by placing the source approximately atrsquo the depthof minimum veloc- ity Sound waves aboveand below this depth will be
300 IEEE TRANSACTIONS ON SONICS AND ULTRASONICS SEPTEMBER 1975
refracteddownwardandupward respectively SOFAR propagation is actually an oscillatory mode where sound can travel thousands of nautical miles with little loss of energy since there are no boundary reflections
The RSR mode [l71 is quiteinterestingbecause it includes the so-called reliable acoustic path (RAP) The latter rays travel from the deep source to a shallow re-ceiver--without surface reflection RAP raysare ldquore-liablerdquo because tgthey are insensitive to near-surface effects and losses due to reflections This bypasses the difficult problem of detecting a shallow depth target a t moderate ranges from a shallow depth source
The selection of o n e propagationmodeoveranother depends upon the propagation loss associated with each mode Propagation loss is defined as the total decrease in sound intensity associated with any given length of ray path a t some specified frequency [lS] The loss of sound energy may be attributed to geometric spreading absorp- tion reflection andor scatteringandmultipathsThe last two loss mechanisms are rather complicated and are generally treated as boundary effects
The spreading loss is independent of frequency and is primarily due trsquoothe increasing area over which energy is distributed during propagation If the ocean can be con- sidered as infinite in extent and homogeneous in composi- tionthenradiatedsoundspreads spherically in trsquohree dimensions and the intensity decreases at the rateof 6 dB per doubled path length Spherical spreading is approached in deep water modes (excluding SOFAR) and for short ranges in the surface duct and shallow water If the radi-ated sound is confined within a duct and can only spread in two dimensions then the intensity decreases at the rate of 3 dB per doubled path length This is known as cylin- drical spreading and is valid for the SOFAR channel and long ranges in thesurfaceductand shallow water At intermediate ranges there is a transitionfrom spherical to cylindrical spreading which is determined eitherby extrapolation between the two regions or by computing the spreading loss using ray theory The latter may appear considerably more accurate but remember it is only as good as the velocity profiles assumed
Theabsorption mechanism [l9]--[28] is extremely interestingFormally it is the conversion of acoustic energy into heat due to repeated compressions and expan- sions of the ocean associated with the propagation of a soundwave and is highly dependent uponrangeand frequency Below 100 kHzabsorption is primarily due to the ionic relaxation of magnesium sulfate ions in sea water This is where the MgS04 ions dissociate and then reassociate under the pressure of the sound wave involving a finite time interval called the relaxation time At about 100 kHz there is additional absorption due to shear and volume viscosity Above 1 h4Hz the dissociation loss disappears and ahsorption is due entirely to viscosity At frequencies below about 5 kHztheabsorption lossis much higher than that caused by ionic relaxation of MgS04Soundabsorption is discussed more thoroughly
in a companion paper by Marsh Caustics developedwithinachannel will result in
absorption losses much lower than that computed A caustic is the envelope formed by the intersection of ad- jacent rays (focussing) producing high sound intensities When a caustic intersects the sea surface the region a t or near the surface is known as a convergence zone as discussed before Propagation loss to the first convergence zone is generally 10 to 15 dB lower than that computed with spherical spreading and absorption This is a big plus for convergence zone operation
When a complex signal is transmitted the received waveform will have thesame amplitude-phasecharac-teristicsasthe original signal only if all of its Fourier components are attenuated equally and if they all propa-gate at trsquohe same phase velocity Therefore distortionless transmission requires that the attenuation coefficient be independent of frequency and that the phase coefficient be linearly proportional to frequency Howeverthese conditions arenot satisfied As indicatedabove the attenuation coefficient (the coefficient of that part of the propagation loss which is proportional to range) is a function of temperature pressure and salinity as well as frequency In practice the total attenuation is due to thesurfacebottomand volume scattering losses as well as to conversion of the sound to heat by absorption The phase coefficient is the retardation per unit length from the phase shift corresponding to zero frequency The effects of phase distortion have thus far not been experi- mentallyconfumedThese effects will depend uponthe fine time structure of the signal waveform Thismay result in appreciable distortion in wideband signals
Other propagation effects which cause signal distortion are multiple propagation paths doppler finite amplitude medium coherency and time dispersion
The existence of multiple propagation paths [24] each having a different travel time may result in a lengthening of the duration of pulsed signals particularly if the signal is initially of short duration eg transients In experi-ments involving explosives impulses whichlasted a few milliseconds near the source have produced distant signals which persisted for several seconds It was estimated that nearly 200 separate arrivals contributed to the received waveformoverarange of about 500 nautical miles Multipaths are essentially boundary effects
The doppler effects [25] C261 or frequency shifts are attributed to path lengths changing with time which may be caused by reflection and scattering by objects inmotion relative to the source andor receiver Experiments have shown that doppler spreading in the surface duct (depth 55 meters wind speed 6 meterssecond) can exceed 5 Hz
An interesting propagation effectis the anomaly pro- duced by a sound wave traveling with a finite amplitude [27] [as] Finite amplitude waves are those whose peak pressures are comparable in magnitude to the st8atic pres- sure Propagation is characterized by a steepening of the wavefrontwhichenhances the high frequency content
WINDER SOUND
with respect to the low frequencies and is opposed by the broadening due to high frequency absorption Finite amplitude therefore represents a departure from the linear acoustic wave equation ie superposition is no longer valid The velocity of a finite amplitude wave is frequency dependent resulting in waveformdistortion-even for transmission through an ideal medium
Recent studies of medium coherency most notably the MIMI tests have established that the ocean has a remark- able phase stability andthatitis not the random in- homogeneous medium often described [as] The large fluctuations which characterize acoustic propagation are primarily duetothe interference of close multipaths generated by reflections from the air-water interface and sea bottomThe observed temporal fluctuations are therefore due to doppler spreading If themultipaths have a discrete distribution in range (or doppler) they may be resolved and trsquoheir interference is thus removed In fact the notion of signal coherence only has meaning after this multipath interference has been removed [30]
Time dispersion is a constraint on the range accuracy in an echo-ranging sonar [31) It isdue mainly to the dispersion in the vertical angle of arrival which is highly pronounced for shallow water propagation At short ranges there will be a series of discrete arrivals each with little frequency dispersion For longer ranges there will be discretearrivals with appreciable frequency dispersion within each arrivalandthey will generally overlap Dispersion not only depends on range but also on the number of sound rays (or normal modes) received and effective bandwidth for each ray (or mode) Vertical dispersion in arrival angle will also limit the azimuthal angular accuracy [ 3 2 ]
Reverberation Effects
Long-range sonar performance is stronglydependent upon surface biological and bottomscattering in the backward directrsquoion In practice tmhe transmitting and receiving arrays are usually in very close proximity to one another (if not one andthesame) Therefore a scattering of prime importance is that of back scattering- where the scattered energy returns along the path of incidence Analogous toarchitectural acoustics this interference is generallytermed ldquoreverberationrdquo which also refers to all sound refleckd and scattered back to the receiver regardless of the path In radar applications this is called clutter
If the scatterers aredistributed uniformly in range then reverberation returnstendto a stationary process A nonuniform distribution in rmge tends toa nonstationary process which is further enhanced by the finite bandwidth of thetransmitted signal [33] Nonstationarity implies a time-varying mean and variance which is primarily responsible for poor signal processing and for a background having a nonuniform contrast on a display For a very narrow beamwidth and short pulselength the reverbera- tion is impulsive or discrete in time (there are finite holes
UNDERWATER 301
in the reverberation waveform) As the density of the scatterers increases the reverberation tends to a Gaussian process and thus may be characterized by second mo-ments(eg auto-and-crosscorrelatioru) Experiments show that for a wide range of ocean conditions the in- stantaneous reverberation amplitudeis Rayleigh dis-tributed (ie at a given range from one ping to the next) [34] In addition the reverberation envelope for bottom scattering usually has a higher degree of coherence than for surface and volume returns If thescatterersarein motion relative to the transmitting and receiving arrays thescatteredreturnsare doppler distrsquoorted In general different scattering regions have different) velocity dis- tributions causing the reverberation bandwidth to vary as a function of time C351 Clearly reverheration is a stochastic process of both space and time
A fundamental parameter which characterizes revcrbera- tion is called scattering strength It is the ratio in dB of theintensity of the sound scattered by a unitarea or volume referred to a distance of 1 yard t o the incident plane-wave intenshy Since the direction o f scatkcring is normally back toward the source thc parameter of in- terest is the back scattering cross section of a unitrsquo area or volume
The surface back-scattering strength is a function of wind velocity grazing angle and frequency [ R G ] A t low grazing angles it tendsto become independent8 of trsquohe grazing angle This is attJributed to a subsurface layer of isotropic scattrsquoerers probably of biological origin which masks the reverberation due to scattrsquoering from srlrface roughness For larger grazing angles thc volrlnle scatterers will act as a precursor but surface scatteringwill dominate A portion of the precursor may be attrihutgtedto scattering from a layer of air bubbles tmpped just below the sea surface [37] The suspended air content of seawater has a marked effect upon underwater sound due to air having a highly different densitrsquoy and compressibility than seawatcr and because of the resonant characteristics of air bubbles At high grazing angles back-scattering is primarily a coherent scattering or reflection from wave facets inclined a t right angles to t8he direction of the incident sound It is important to note that wind velocity rather than wave height (or sea-state) is used to cleternline the sea surface back-scattering strength This is hrcause it is trsquohe small scale roughness that is important Wind velocity may be considered to ldquomodulaterdquo the wave (the period of ocean waves average from 3 to 8 seconds) and is trsquoherefore a more accurate description of thc snrface roughness than sea-state
Bottomreverberation is somewhat nmre subtleAt present there are two theories concerning its origin The first and most popular is that it is due to hottorn rough-ness similar to sea surface scattering The srcond is that it is due to thesize of the particles or grains i n the bottom similar to volume scattering The dependence o f tlhe bot-tom reverberation level on the type of sedinlent tcnds to justify botgth theories As wind velocity is a mmsurr c j f sea
302 IEEE TRANSACTIOXS ON SONICS AND GLTRASOXICS SEPTEMBER 1975
surface roughness so is bottom type (eg mud silt sand rock) a measure of bottom roughness Measurements have shown that a theory based upon particle size or bottom composition gives only an approximate indication of the
u I I
Fig 9 Comparison of directivityatterns of (A) discretelinear arrayhavingelementsspaced a t Ralf-wavelengths and (B) con-tinuous uniform line transducer
back-scattering strength at a given grazing angle Thus there must be another contribution to bottom reverbera- tion Experiments indicate that rock bottoms havea back-scattering strength with little or no frequency dependence while sand and silt bottoms haveone which increases with frequency at a rate of 3 dBoctave(variesasthe first power of frequency) [38][39] This has been attributed to the difference in the scale of bottom roughness and agrees with basic scattering theory It therefore appears that bottom roughness is a major and possibly a dominantcontribution to bottom reverberation
At present the models for bottom back-scattering are either too simpleor rather involved for computation Data indicates that a good description of the back-scattering of sound by very rough bottoms is to consider the spatial distribution of scattered energy to satisfy an omnidirec- tional law or Lambertrsquos law that is a sine or sine-squared processor (including displays) for frequency and temporal dependence of the grazing angle respectively [ M ] There discrimination Thus the beamformer may be considered is no theory to justify either behavior Lambertrsquoslaw to beaspatial filter and can employanalog or digital has been previously used as a measure of the radiation of components for forming the beams light by radiant absorptive materials In this model there Analog beamforming operatrsquoes in a linear manner is no frequency dependence A more ambitious theory is Therefore there is no performancedegradation dueto one which treats the rough bottom as a diffraction gratingnonlinear effects However the size and weight of the where the scattering is primarily generated by the wave- length component of thebottom roughness for which phase reinforcement occurs [41] This involves the notion of a ldquoroughness power spectrumrdquo which is the amplitude squared of the irregularity in the bottomcontourasa function of wave number Presently there is little data on the roughness power spectrsquorum of the sea bottom
Volume reverberation is produced by a three-dimen-sional distribution of biological scattererswhichare located in large part in a diffuse layer generally referred to as thedeepscatteringlayer(DSL) [42] [43] The DSL is rather complex in composition and distribution and exhibits a diurnal migration in depth The model for biological back-scattering is still incomplete andthe greatestunknown in long-range echo-ranging This is most significant in convergence zone operation Diurnal dependencemaycausevolumereverberation levels to increase 10 dB at sundown and decrease 10 dB at sunrise These changes are the cause for surface ship sonar to have its poorest performance in the afternoon However there are areas which show no diurnal effect but strong seasonal dependence
G CONVENTIONALBEAMFORMING Beamforming is the process by which an array of spatial
elements of arbitrary geometry and dimensionality spatially discriminates against noise and reverberation fields This is accomplished in the beamformer through a series of operations involving the weighting delay and summation of the signals received by the spatsialelements The summed output is then sent to the electronic signal
beamformer becomesexcessive if many simultaneous beams are formed Adigitalbeamformer is compatible withmultibeamformatmion of large acoustic arrays and computerbeamforming algorithms It utilizes an AD converter m-hith is a nonlinear device This may introduce a slight degradation inperformancebut will generally reduce hardware size weight and complexity and simplify data handling
In this section many space-time aspects of conventional beamforming are discussed These include linear super- position space-frequency equivalence the significance of thedirectivityfactorand space-time sampling the im- portance of the array gain and space-time correlation function as operational measures the effects of wideband operation in reception on a single-frequency design super gain concepts and the status of digital beamforming
Linear Superposition
A spatial element is said to be linear if it obeys the law of linear superposition The practical result is that the directive properties of a spatial element such as an acous- tic line transducer may be determined by examining the behavior of a number of discrete receiving points spaced along the line [44] Figure 9 shows a comparison of the directivitypatterns of adiscrete linear arrayhaving elementsspaced at intervals of X2 anda continuous uniform linear transducer [45] Each have a total length of 5k and the relative acoustic pressure is specified by the ratio of the voltage developed by the acoustic energy of given intensity at a given bearing to that developed by the acoustic energy of the same intensity arriving along
303 WINDERUNDERWATERSOUND
ZRIOUS SPACECOMPLEXITILS OPERA- h 2-ELEMENTCORRELATION ARRAY OPFRA ING ING AGAINST ASINGLEFREOUENCY GAINST A SOURCE HAVINGVARIOUS
E Q L J F N C YC O M P L U L T I E S B E A MP A T T E R N
SPATIAL FREOUENCY SPATIAL FREOUENCY CONFIGURATIONCONFIGURATION
FULLDIRECTIONAL RADIATOR
DISCRETE RADIATORS SPACED X12 APART
0 0 0 0 W
i+ RADIATORSSPACED gtgtAf2 APART
0 o w
CONFIGURATION CONFIGURATION
CONTINUOUS BANI OF FREOUENCIES
DISCRETEFREC CLOSELY SPACED
D I S C R E T E F R E O ~ IWIDELYSPACFD
Fig 10 Equivalence between complexity of receiving array and complexity of frequency configIratian of source
-the axis normal to the arrayA line transducer is equiva- lent to a discrete array having an infinite number of ele-ments It is seen that there is little improvement in direc- tionality to warrant providing a discrete array with more elements than are sufficient to give a half-wave spacing The height of the secondary lobes may be slightly in- creased but the width of the major lobe is practically unchanged
When the response of discrete receiving elements are known the response of an arbitrary configuration can be derived by using the principle of pattern multiplication The radiation pattern of an array of spatial elements each of which has the same pattern with the same orientation in space may be found by 1)replacing each of the elements by an omnidirectional element at the same point and with the same amplitude and phase excitation 2 ) determining the array pattern of the resulting array of omnidirectional elements and 3 ) multiplying the arraypatternbythe radiation pattern of the individual elements of the original array
The analogy to the impulse response in the time domain is the response of a spatialelement to a distant point source A point source is one whose dimensions are small in comparison with the wavelength emitted so as to radiate a spherical wave Such a source radiates uniformly in all directions and is the building block needed for linear superposition Hence analogous to a temporal system the output of a spatial element is the convolution of its point source response and source distribution This is the spatial convolution theorem Although spatial convolution can be readily formulated it cannot always be evaluated in closed form and either numerical analysis or transfer function descriptions may be required
The plane wave response pattern of a receiving array is obtained when the radiator is a point source at a suffi-
cient distance such that a n inc-rmsp in thr distance will produce no detectahle changei n thr pattern If the source subtends an apprecia1)lr angle thr rcsponw pattern will be modified [46] The direct8ional discrimination of the array depends on the responsc to sourccs out8side the major lobe Boundaries inlpos4 on spatial extent produce sidelobes in the response and affect the interpretrsquoation of the various spatial descriptions
Methods for describing basic propcrties of spatial elements may use space or ldquosl)ttiaI-frcqllencyrdquo as vari- ables The freedom o f selection corrcywnds to the choice of time or frequency in circuit) prohlt~ns The space trnnsjer function completely charactcrizes n spatial element It is primarily a steady-state or far-field dcscription and is often more convenient to work with than the point source response From the properties of Frsquoouricr transforms the spatial-frequency spectrum of an aperture distribution modified by any numhrr of suc(~twiwlinear operations is the product of the spatial-frcclucncy spectrum of the original distribution and the spatitl spcctm of the several linear operations Therefore an analysis performed in the spatial-frequency domain replnrrs s~~cccssive intcgrations by successive multiplirations
Space-Frequency Bquivalmce A relationship of considerable importtanre in represent-
ing spatial structuraldet8ailand analyzing spataid problems is one which establishes that the relocity amplitude dis- tribution across the array and its tlirectgtivity pattern in the far-field (Fraunhofer region) are Fourier transforms of each other [47] [48] Therefore Fourier analysis can be used t30 compute the directivity pattern if the aperture distribution is known or may hn used to detrsquoermine the aperture distribution required to prorluce a desired direc- tivity pattern (synthesis problem)
304
When a Fourier relationship exists between pattern and excitation there is reciprocal spreading between aperture and pattern widths For example if the aperture width is increased by a factor m the pressure level increases m times at broadside and the beamwidth is reduced by lm
The reciprocal relationship between aperture and pat-tern widths is displayed by similarity of the directivity patterns for isofrequency receivers of large spatial extent and wideband receivers of small spatial extent [49] The equivalence existing in a receiving array between its spatial configuration and the frequency configuration of the source is illustrated in Figure 10 As the spatial con- figuration is varied to improve the directionality against a single frequency source in the frequency case this corre-sponds to using a 2-element correlation array operating against a source transmitting wideband signals If the continuous uniform array is replaced by point elements spaced at half-wavelength intervals then the continuous frequency distributionof the sources will be replaced by a set of discrete frequencies When the element spacing or discrete frequency spacing is made large multiple major lobes result These relationships can be utilized to improve spatial processing gain and in formulating new systems
Directivity Factor Directivity I n d e x
The concept Of directivity expresses the Of a spatial element or an array of such elements to 1) concen-trate signal energy in the desired transmitting directions or 2) to descriminate against interference arriving from bearings other than those desired Directivity both in transmitting and receiving is dependent upon the ratio of the sound wavelength to the dimensions of the elements and their spacing For a single element if the wavelength is large compared to the dimensions the sound is emitted uniformly in all directions and the elements response will be independent of the direction of sound incidence If the dimensions are large comparedto a wavelength the sound energy-transmitted or received-will be directional Use- ful measures o f the directive properties of spatial elements are the directivity factor and directivityindex [io] [ill
The directivity factor(DIT) is defined as the ratioof the intensity or mean square pressure of the radiated sound in a free field a t a remote point on the maximum response axis (MRA) totheintensity or meansquare pressure averaged over all directions The distance must he sufi-ciently great SO that the sound appears to diverge spheri- cally from tht effective acoustic center of the source The averageintensity of the sound passing through a large sphere of radius ( r ) is found byintegratingthenormal component of the intensity (I) over the surface ( S ) of the sphere and dividing by the area 4 d The directivity factor may then be expressed as
IIn C~S
where Iois the intensity at the remote point on the RIR-4
IEEE TRANSACTIONS ON SONICS AND ULTRASONICS SEPTEMBER 1975
Fig 11 Rectangular plots of typical (a) difference pattern and (b) sum pattern
In the far-field the intensity of the radiated sound is the square of the absolute value of the pressure divided by the specific acoustic impedance
The directivity index (DI) is the expression of the direc- tivity factor in decibels thus
D1 = 10 log DF (2)
For linear array of point spacedelements at integral half-wavelengths the maximum directivity index (RIDI) is obtained with uniform constant phase excita- tion The maximum directivity factor is then numerically equal to the number of eleTnents (even or in the
array
DF = V dX = n2 ( n = 12 ) (3)
For other values of element spacing the MD1 is not obtained with uniform excitation Thereis little difference between the 1IDIand the directivity index due to uniform excitation for element spacings greater than half-wave-length However for d X lt l 2 tgthere may he asignificant improvement in the directivity index in going from uni- form excitation to MD1 excitation The beam patterns due to the latter are referred to as superdirective and are obtained at the expense of requiring out-of-phase excita- tionanda relatively large range of amplitudes These amplitudesmust be controllcd with extremeaccuracy to achieve the predicted spatial gain and in addition the element spacings and operating frequency must be ac-curately controlled to the same degree
Certain applications may require special types of direc- tivity patterns such as a difference pattern Whereas the sum pattern exhibits even symmetry about a line drawn perpendicular to the aperture at its midpoint the differ-ence pattern exhibits oddsymmetryaboutthesame axis A conlparison is shown in Figure l 1 for a line source A sumpattern usually will have onemajor lobe in the direction of the principal axis while a difference pattern has two equal lobes with a null in the direction of the principal axis
WINDER UNDERWATER SOUND 305
Combinations of sum and difference patterns are used insonar (andradar) systems to improve the accuracy of bearing measurements Theerror signal obtained is primarily determined by the slope of the difference pat- tern in the vicinity of the origin To enhance the sensitivity to small changes in angle it is necessary that the slope be as steep as possible For sum patterns the influencing propertiesaredirectivity index beamwidth and side-lobes For difference patterns slope and sidelobe level are significant for determiningangularsensitivity If the sidelobes are too large false indications of target direction may result in the presence of multiple targets Theory C521 shows that a constant phase (except for a 180phase reversal) linear excitation function gives rise to a maxi-mum slope pattern The maximum slope pattern may not be the most desirable pattern to use in that the sidelobe level is quite high Thus a compromise must be made be- tween slope and sidelobe level for angular error sensitivity
If the elements of a linear array are uniformly spaced then the sidelobe level and beamwidth may be controlled byvaryingthe element excitation A general result of uniformly spaced arrays is that the sidelobe level may be reduced by decreasing the aperture excitation toward the extremes of the array This reduction is obtained at the expense of the array beamwidth
If the elements are nonuniformly spaced thearray will be characterized by spatial frequencies which are not related by integers An unequally spaced array has many interesting properties [53] [54] C-551For example there is an equivalence betweenamplitudetapering of a uni-formlyspaced arrayandthe spacevariation in a non- uniformlyspaced array Hencenonuniformelement spacingmaybe used to reduce sidelobes increasing the spatial processing gain Use of perturbation methods can reduce the sidelobe level to about 2AV timesthemain lobe where N is the number of array elements To achieve this reduction implies retaining uniform excitation
A perturbation analysis may be performed to indicate small nonlinear changes in element spacing However the more useful properties of nonuniformlyspaced arrays depend upon large nonlinearities in the element spacings An approximate method for making an analysis of such arrays may be achieved by representing it with an equiva- lent uniformlyspaced arraythroughspatial sampling techniques
Space-Time Sampling The use of samplingtechniques [56]-[59] in array
design is a natural extension of sampling theory in signal representationA linear array of N equally spaced ele- mentshas hr degrees of freedom since it is possible to establish N coefficients of the Fourier series for the far- field radiation pattern When the elements are arbitrarily distributed each element will have an added degree of freedom namely its position along the axis of the array This is analogous to nonuniform temporal sampling of a signal
If the analysis time and signal bandwidth at the array outputare limited to ( T ) and ( W ) respectively the
received pressure distribution at any point on the aperture can be represented by 2WT sampled values Similarly if ( e ) is the half-power beamwidth and ( L ) the length of theaperture parallel to some axis the onedimensional distribution at any instgtantof time can be represented by OLX sampled values across the apertureThe factor of two(in 2WT) is unnecessary here because knowledge about phase a t sample pointsspaced AI0 apart on the aperture is obtained fromthe 2WT samplepoints in time The total number of sampled values may be taken as theproduct of thespatialand temporal degrees of freedom Thus the received pressure distribution across the aperture ( L ) during time ( 5 ) may be represented by X = 2WTBLA sampled values
If ( H ) possible amplitudes of the pressure can be meas-ured at each sample point then for the one-dimensional aperture the total number of different signals which can be described by (Vg)sampled values is N ( 2 w T e L I X ) Any one of these signals can give the history across the length ( L ) and for t8he time (T) butt8here is only onewhich gives the actual history of the spare-time domain Sam-pling theory can be easily rxtended t80multidimensional arrays It is important to recognize that various problems require proper tradeoff betjiveen spatial andtemporal samples basedupon the desired accuracyhardware complexity and display fornxtt The best sampling dis- tance in space will depend upon the spatial strurture of the masking background In general the detection process 11411 require less degrres o f freedom than that for rlassifica- tion which often includes an assessment of size and shape Multidimensionalsampling of thc aroustir ficld employs multibeamforming techniques
The angular resolution of a sonar system is intimately associated with the r0nstraints of space-time sampling I t is dependent on the signal-to-noisc ratio of the received signal the size and shape of the source (or target) the beam pattern of the receiving array andthe dynamic range of the receiver and display subsystems
Array Gain The array gain is a measure of rereiver spatial processing
which has greater operatgtional significanre than the direc- tivity index [W] This is berause i t is expressed in terms of the space-time correlation structure of the signal and noisefields [Sl] thereby representing the dynamics of the medium and sonar platform and the effects of hydro- phone directivity The array gain is fornlulated as
where
pi j ( s ) signal correlation between (ij)th elements p i j(n ) noise correlation between (ij)th elements N total number of array e1ements
306 IEEE TRANSACTIONS ON SONICS AND ULTRZSONICS SEPTEMBER 1975
Clearly the signal class js very important for evaluating the array gain since it establishes whether the formulation and measurement of the signal and noise inberelement correlations should be made on the basis of energy or power It is interesting that at sea the minimum detect-able signal level is measured by injecting a simulated echo into the receiver for a specific condition of interest and determining the weakest signal level detectable by the sonar operator Therefore in practice the computed figure-of-the merit for the sonar system reflects the array gain established by the existing signal and noise fields and not the directivity index For a homogeneous com-pletely correlated signal field and an uncorrelated uniform noise field the array gain reduces to the directivity index value
Space--Tinje Correlation Funrtion
The ahilit8y of ~ J Iarray to discriminate against plane waves is determined hy the coherence of tjhe waves at various points on the array Thisimplies that a correlation function description would he a meaningful measure of how far apart the hydrophone elenrents may he and still preserve the phase coherence o f the signal and also of the coherence introclucrd in the noisefield bythe element spacing If the ampate of Irnou-ledge is the value o f the pres- sureat two arhitrary points ( X ) and ( X ) andtime instants ( t l ) and ( h ) then the coherence may be described by averaging the product of the pressures either tem- porally statistically or spatially
Inthe case of time averaging the representation is called the space-time correlation function +(XltX2tzgt and is expressed as [C21
4 ( X l h j S P t ) = )( p Xtl) p (X) ( 5 )
where the angular bracket refers to a time average Statis- tical averaging corresponds tothe different possible states of the rrledium If the pressure waveis ergodic time averaging and statistica1 averaging yield identica1 results depending only on the time difference T = tz - t l For a spatially homogeneous process the spacetime correlahn functiondepcnds only on the coordinate difference T = X - X y = Yz - Ylz = Zz- 2 Thus for a station-ary and spatially homogrnwus random process
$(XltlXztz)= + ( X - X 1 T j = ( p ( X l t ) p ( X s t+ 7 ) )
(6)
and wouldyield equivalent results if averaged spatially 4s the distance between points and the difference hetn-een time instantsincreases the correlation function decreases
Vor anisotropicnoise field whitened and band- limited to one octavegt the zero-lag space-time correlation function for a lirlmr arra parallel to the I axis is [SS]
S(395)- Si(27rS)$( r O) = - (7)
2TC
Pz
0 8
o 06 U v)Ing 04 U
p 0 2
Ic---t--t-------- xg 4
OZwg I O li2=-l6 18 20W N
-02-r SPACiNG (IN WAVELENGTHS)
Fig 12 Crosscorrelation of octave hand noise
where (x) is the spacing in wavelengths and S ( r ) de-notes the sine-integral Figure 12 shows a plot of p(rO) as a function of the separationin wavelengths at the lower cutoff frequency Numerical cvaluat~ion indivwtes that the correlation is essentially zero hen ( S ) is greater than 0348 It may be generalized that the effcctive dirw- tivityfactor for uniform noise for a sct of receiving elements arranged arhitmrilp ill space is X providrcl tlrat the spacing betwen adjacent elemcnts is oqunl to or greater than a half-vavcleagt4h ~ t t he gromctric r r l rnn frequency of the band [04] This v a ~given earlicr for the specific case of a linear array
Wideband Reception
When the directivity index of an array has Iwcn mnxi-mized a t a single frequency nttcrnpting to oprraic the array in trankmission with signals of finite bantlnitlth or in reception 7vith background noise of finite bandwidth may seriously reduce the DT
The amplitude shding rcquircd to rnaxilnixr thr dirrct-tivity index in reception for any spectrur~may h r drtcr-mined by considering the space-correlation funampon of the noise field Shxinrizing the receiving response of an arrcly depends almost entirely upon these noise corrrlations and requires selecting that shading which will cancel the coherent parts o f the noise rccamped 113-the various c l a n c ~ ~ t s as much as possible As was stated previonsly if the spacing is sufficientlywide so that thrrr islittle 11oisc coherence little can be done to maximize tbe directivity index by using nonuniform shading
By applying the method of Lagrangian nlultiplicrs Faran and 1lillq [C] have used the space noisc correlation function t0 maximize the directivitv index They s h o ~ e d that theD1 of a broadside linear array nlaximized for operation a t a finite bandnidth is less tlrnn the XfLgtIfor operation at a single frcquency hut i s much grmtrr t 8 h n n the D1 realized by using tshc sinamp frequrncy dcsign it t h e finite bandwidth
The presence of self-noise in the individual elenrents of an arrav or their preamplifiws may srriously rrduce thn effective gain of the array designcd for maximunL dirrc-tivit8pindex This degradation of perfonnancct is parf8icu-lady enhancrd if theamplitude rhatlirrg of m y o f thr
SOUND WINDER
elements is considerably larger than the overall value required for uniform shading Thissituationmaybe considerably improved by designing the array for maxi- mum effective gain in the presence of self-noise
A problem of particular interest is the abilityto charac- terize the information in a modulated signal For a linear array of discrete point elements if the element spacing is less than the modulation wavelength then the directional properties of the array will not be appreciably reduced An order of magnitude for the modulation wavelength (h) is the product of the velocity of sound ( c ) in the medium and the period of the modulation (lmodulation bandwidth = F ) X W 2cF If thisconstraint on the element spacing is met then the level of the normalized mean-square response for amodulated signal will be nearly that for a signal of a single frequency within the band [SS]
When the modulation wavelength is much less than the element spacing it is convenient to determine the response as a function of time and of angle For a linear array at broadside the response as a function of time will consist of a single signal having the sameshapebutgreater amplitude thanthat received by each element As the bearing off the MRA is increased the beamwidth will increase and cause the response to be spread over alonger period of time Due to interference between the signals from the separate elements the amplitude response will be reduced relative to that atbroadside A further increase inbearing willminimize the interference resulting in a time response comprised of a series of signals correspond- ing t0 each element When this occurs increasing the bearing will increase the distance between individual signals and consequentlyspread the response over a longer period of time Furthermore all amplitude levels of the response will remain fixed
Superdirectivity
A maximum or super gain array [67] [SS] is one whose mainbeam is narrower than that from an array of the samelengthandoperatingfrequencyhavinguniform excitation This increases the effective directivity index of the array which may be considered as an increase in thetotaldetection threshold of the system Therefore a super gain array is particularly attractive in applications requiring detecbing signals in the threshold condition [SS] The use of super gain arrays in transmission and reception results in large losses inarray efficiency and involves maintaining close tolerances of the amplitude and phase characteristics of thearray elements The severity of these tolerances tends to increase with in- creasing improvement in directivity In addition receiver self-noise is a major consideration in realizing super gain In underwater acoustics sea and own-ship noise levels at low frequencies may be much greater than the thermal noiselevels of the transducer elements and their pre-amplifiers Although directivitypatternshavinganar-rower beam than may be obtained from uniformexcitation
UNDERWATER 307
of an aperture of the same dimensions are theoretically possible the realization of such patterns is characterized by severe restrictions of bandwidth element spacing op- erating frequency and a susceptibility to inhomogeneities in the medium in the vicinity of the array
Digital Beamforming The advantages of a digital beamformer with respect to
an analog beamformer are
simplifies data handling less size and weight formation of many simultaneous beams with minimal
increase in hardware complexity deleterious effects of noisy sensors are minimized amplitudeandphaseweightingsareindependent of
frequency beamforming algorithms can be implemented as soft-
ware in special purpose mini-computers
A typical beamformer model is one where each hydro-phone output is sent to an AGC amplifier followed by an ADconverter whose output is time sampled and de- layedamplitude weighted and summedwith other similarly processed hydrophone outputsto form the beam The AGC amplifier is required for dynamic range compression and normalization reducing the operational constraints on the ADconverterTheADconverter or quantizertransformsanaloginformation to digital informationor binarynumbersThe effectiveness of quantization depends on the number of quantizing levels the step size and the input signal-to-noise ratio as well asthe dynamic range backgroundfluctuationsand conversionaccuracy Thetimedelay corresponds to delaying the entirebinarynumberthetimedelay ele-ments are usually obtained with digital shiftregisters The amplitudeweightingfactorprovidesadditional degrees of freedom prior to summing When carried out digitally the weighting corresponds to shifting the symbols or bits representing the binary number resulting in weightings of multiples of one-half
When the beamformer employs a one-bit quantizer or hard-limiter it is referred to as DIMUS (DIgital MUlti- beamSteering) [70]C71-j The reduction in signal-to- noise ratio (SNR) by extreme clipping at the beamformer output without post-filtering is a function of the input SNR and the number of staves used to form the beam Measurements indicate that the clipping loss against noise is about 24 dB minimum and against reverberation it is about 30 dB minimum
Thedirectivitypattern of a l-bitdigitalbeamformer has a distorted slightly narrower major lobe and higher sidelobes than a linear beamformer [72] In practice the sidelobes for a DIMUS-typesystemareabout -14 dB to -16 dB This may result in poorer spatial discrimina- tion against reverberation dependingupon thetrans-mittingdirectivitypatternthan a linearbeamformer Filtering the output of the beamformer may reduce some of the deleterious effects However it is quite doubtful
308
that performance can ever be achieved comparable to the linear beamformer over the full range of input signal-to- noise ratio multiple targets and reverberant fields
Analysis of multibit quantization [73]-C781 has shown that for an uncorrelateduniform noise field the on-target array gain increases monotonically with the number of bits of quantization with the array gain at 4bi ts per channelapproximately equal to that of an ideal linear beamformer From the point of view of achieving maxi-mum array gain a 4b i t optimum quantizer is therefore adequate for the conversion of analog signals in each channel to digital numbers prior to delay compensation and summing The optimum quantizer step size normal- ized with respect to the variance of the input noise for a given number of output levels (or bits) varies with the input SNR I t appears that an optimum step size exists for the small input SNR which is of primary interest for long range detection-active or passive
H ADAPTIVE ARRAY BEAMFORMING Adaptive array beamforming refers to the technique of
placing points of insensitivity or lowered response of a receiving beam pattern in the direction of large far-field coherent noise sources This will reduce the total back-ground noise power received by thearraythereby in-creasing the signal-to-noise ratio of the system Coherent directional noise sources may beattributedto multiple targetsbackscatteringmultipaths self-noise mutual systems interference and jamming countermeasures This technology is presently being applied in the fields of sonar radar and seismology
Three types of spatial filters commonly used for remov-ing coherent noise depending on the performance cri- terion are
I) the maximum signal-to-noise ratio or Matched filter 2) the minimum signal distortion or Wiener filter and 3) the minimum total probability of error or Bayes
filter For an array of N elements the spatial filtering properties of these filters are the when detecting monochromaticsame signals and all require the measurement of N Z correlation coefficients and a 2N X 2 N matrix inversion However their temporal filtering properties are generally different as well as their areas of application The three filters can be designed to operate in an adaptive mode which permits the system to operate efficiently in a changing environ- mentThedirectapproach to adaptivityappears to be quiteimpractical since it requires a large number of correlators for determining the correlation coefficients and a large capacity computer to perform the operation of matrix inversion This process would have to be repeated periodically since the input noise background statistics are usually changing Also an infinite statistical sample would be required to obtain the exact correlation coeffi- cients-whichisimpossible Thiscomplexitymay be avoided by applying a gradient-search method One such algorithm is the method of steepest descent The per- formance criteria given above are approached systemati-
IEEE TRANSACTIONS ON SONICS AND ULTRASONICS SEPTEMBER 1975
cally by changing the weight vector along the direction of the estimated negative gradient vector of the error surface
DICANNE
A straight-forward approach to null steering is called DICANNE(DigitalInterference Cancelling Adapthe Null Network Equipment) the block diagram is shown in Figure 13(a) It is assumed that there is a priori in-formation of the directions of arrival of the interfering ( T z )and target (TI)signals and that I T2 I gtgt 1 TI1 ie the small signal case The essence of the techniqueis to generate an estimate of the interfering waveform For a plane wave interfering noise source in an isotropic noise background the p2-estimate is the output of aconven-tional with element weighting beamformer uniform divided by the total number of elen~ents used for estima- tion ( N ) Thisrepresents an ensemble average of all element interfering waveforms which are in-phase amph one anotherpzis then subtracted from each elementwave-form(phased in the T2-direction) generating a residual signal which contains information of the target and iso-tropic noise field and a minimal of interfering waveform The set of residual signals are then restored to their original phase relationship An estimate of the target may then be obtained by conventional beamformingin the T1-direc- tion followed by adetectorand display for temporal processing The null steering processor causes each omni- directional receiving element tocentera null on the interfering source asillustratedin Figures 13(b) and 13(c) The depth of the null will depend on the precision of the subtraction process
The processing gain ( G ) for this method defined as the ratio of the output SNR to the input SNR is given by
where S N i l and h are the powers of the desired target incoherent isotropic noise and coherent directional noise respectively The term U is a function of N andthe amplitude and phase errors in the subtractionprocess For very large coherent noise sources (Vcgtgt N i gtgt S ) the processing gain is primarily dependent on the amplitude and phase tolerances of the hardware In the absence of coherent interference (hT= 0 N gtgt S) there will be a reduction in the processing gain depending on the number of elements used for the spatial estimate Theeffectiveness of null steering is also limited by the phase errors intro- duced by near-field sources and the asymmetry of the element-to-element amplitudephase response The errors may be greatly reduced by applying feedbackerror-control to each element (after phasing in the T2-direction) In sea testsagainst ship-generated interferences the DI-CANNE processor consistently formed nulls 10-15 dB deep
309 WINDERUNDERWATERSOUND
CONVENTIONAL BEAMFORMER
FOR TI
DETECTOR
( 0 1 BLOCKDIAGRAM OF NULL STEERING PROCESSOR
900
I600
( b) OMNIDIRECTIONAL PATTERN OF ELEMENT ( c 1 ELEMENT PATTERN WITH NULL STEERING
Fig 13 Principle of nullsteering forplane wave interfering noise source in isotropic noise field
Bayes Filter The null steering technique described above is the
degenerate form of a Bayes spatial filter used for optimally processing against a plane wave coherent noise background [Sl] The desired likelihood ratio (LR) to be compared to a threshold value for detection is defined as
(fn(x - Pgt)LR = (9)f n (x)
where x is the observation vector fn(x) is the probability density of x when the signal vector y is absent and the brackets implies averaging over the signal ensemble ( S
The Bayes optimumspatial filter for detecting plane wave Gaussian signals in additive Gaussian nonisotropic noise fields requires a frequencydependent amplitude and phaseweightingnetwork to be applied to each array element In t3he small signal case f n (x - y) can be ex-
panded in a Taylor series about x and the magnitude of x is essentially determined by the background noise field The likelihood ratio criterion reduces the problem to one where the element weighting network subtracts the best linear estimate of the coherent noise component from the received waveform and delays the residual signal on a common plane perpendicular to the direction of the desired signal Assuming hr-array elements the Bayes filter is comprised of NZlinear filters followed by conventional beamforming for each possible signal direction It also requires the measurement and inversion of a 2X X 2N noise correlation matrix a t each Fourier frequency com- ponent in the band
The Bayes filter uses thespectral correlation of the noise field to reduce the noise power through a subtraction process The estimator beam and signal beam are opti- mum-in the Bayes sense and the residual voltages used to form a beam in the direction of the signal will contain
310
a smaller component of the interfering point source than thosein DICANNE The Bayes spatial filter produces deeper nulls and greater processing gain thanDICANNE and in additiontends to cancel all quasi-stationary received noise field componentswhichhavespatial co-herency
Matched Filter Figure 14 shows an example of an adaptive technique
to discriminate against coherent noise in a narrow-band system using the signal-to-noise ratio as aperformance criterion CS2] [83] This is accomplished by changing the gains ai and bi of the ith element according to the method of steepest descent The resulting algorithms are
ai+ = a(z + -2p [ - s i ( t ) s ( t )dt T S
and
where S and N are the signal and total noise power respec- tively T is the period of the center frequency of the band T4 is a time delay which makes the delayedsignal orthog- onal tothe undelayed signal for maximum parameter sensitivity andp is a fixed step change for the lth iteration
(c) Fig 14 Example of adative technique to discriminate against
coherent noise in narrow and system (a) System to be optimized (b) Beam patterns optimized against omnidirectional random noise (c) Beam patterns optimized against omnidirectional ran-dom noise plus a strong interfering signalat -15 The interfering signal is equivalent to coherent noise The adaptive process gen- erated a null about 50 dB deep in the direction of the interfering signal
The method requires 41V correlations for each iteration in the direction defined by the gradient The signal pro- posed for measurement of the signal correlations is a test signal that is injected into the system andproperly phased so as to retain the direction of the desired target For best results recorded target echoes should be employed The noise background required for measurement of the noise correlations may be obtained by transmitting a ping in the expected direction of the targetand receiving the noise and reverberation(orclutter)fromtheexpected range of the target with no target present For the small signal case the signal correlations may not significantly effect the gradient-search procedure and may be omitted A computersimulatedexperiment shown in Figures 14(b) and 14(c) illustrates how the method effectively suppresses a strong coherent interfering signal generating nulls 50 dB deep However the degree of suppression is very sensitive to small changes in the bearing of the interfering signal to the tolerance of gain control of ai and bi and to the statistical fluctuations of the measured correlations due to the finite integration time ( T )
Wiener Filter The application of the methodof steepest descent to the
otherperformancecriteriaie the Wiener and Bayes
IEEE TRANSACTIONS ON SONICS AND ULTRASONICS SEPTEMBER 1975
filters [84] tends to provide simpler implementation of thearray processor The system now requires a priori information of the direction of arrival andspectrum of the target signal only-but not of the noise field It does not directly require the computation of any correlation coefficients but only needs to store thevalues of amplitude weightings
311
1cor vidd)and signals the array processing filteris conlprised of a tapped-dclay line with linear multipliers The processor output signal y ( t ) is formed from the summation o f all delayed and weighted input signals x ( 1 )
NL
y ( t ) = c r i ( t ) W i = W X ( 1 ) (12) i=1
Lvhert WT is the transpose o f the weight vector x ( t ) is the receivcd-input vector I is the number of tap points of tho filter having I - l time delays of A seconds each and is tho nurrher of array ckments For narrow-bandAlsquo
signals the processor for each element reduces to a complex gain bveighting and a single time delay of A equal to 74 seconds as tlescrihed for the matched filter ahove
If thetargct signal and allinterfering noise sources arc assumed statrsquoionary zero-mean random processes and that the signal and noise processes are uncorrelated then the optirnunl veight vector W of a Wiener filter is one whichnliuirllizes the mean-square-error between the desired target Lvaveform q ( t ) and the array processor output y ( t ) This is achievd by the weight vector W given hy the Wiener-Hopf equation
W ==R-rsquoP (13)
wllero R is the syrnnletric correlation matrix ofrsquo the received signals and P is the cross-correlation vector hetween the received vector x ( t ) and the target waveform ( ~ ( t ) Approaching the weight vector Wby the method of steepest descent the algorithm is
W ( k + 1 ) = WCkj + p [ P - R W(k)] (14)
where h is the step size at each iteration Modifications of this algorithnl are
J$rsquotiiLYI I Llsquo
w(k +-1) = W ( k j + r r [ y ( k )- y j k ) ] x j k ) (15)
Crirsquoith S
wjx f 1) = W( )-t - y(k)x(k j ] (16j
Widrovs tcchnique [S51 is to itcrxtr t hc wight vcctor ill the dirwtiorl of the instantaneous squared error This rcquirw the us( o f a pilot-signalwhich generally leads to a biased solution GriKiths technique [S61 is a combina- tion of the steepwt descentalgorithm and Widrowrsquos algoritlltrl---it requires anestimate of the target signal cross-correlatiorl vector P (inlieu of a pilot-signal) and a nwasurelnent of y ( t ) and ~ ( t ) Both algorithms converge to the optimunl processor ( W)in the limit as the number of adaptations l m o ~ n e slarge also the step biee in each is houndcd from above by the reciprocal of the total input power lsquorhcse techniques are analogous to those proposed for adaptive equalization o f digitalconmnmication sys-terns to rnillinliee the intersymbol interference caused by rnediuln sprtading
In a preformed beam sonar adaptive arraJ- bcamform- ing climinltcts the fluctuation and bias effects of the
THRESHOLD
A gt - A C C E P T A AltO-REJECTA
Fig Logical sidelobe eliminatioi very simple kut
effective algorithm for eliminatingdirectional interference
coherent interference on the bcu~nslsquol71~efluctuation refers to the random component of the spatial power distribution and bias is the uncertainty ahtrut the mean component which represents the actualdistrsquoribution Clearly detec- tion would then be limited by the fluctuation and bias effects of the remaining isotropic colnponent of the inter-ference Finally it appears that adaptivearray beam-forming lends itself more readily to tracking rather than detectionapplications since it requires an ttstimate of target bearing and cmss-correl~tion vecf or between the received vector wavefornl and thc target ~vaveform In fact the initial operation for inlproving detection may be first estimate thetarget wavefornl twforc applying the detection decision
Logicul Switching Algorithms
Logical switching Side1obc Elirninatim (SIZ) [S7] [S81 is a very simple but effectivc algorithm for elirninat-ing interference in sonar receivers When a strong signal is received on any sidelobe of thc receiving directivity patternappropriate threshold gstingutilizinglogical switching algoritrsquohnls cuts off the receiver for the duration of the signal only This vonld eliminatedisplay and operator overload
A logical switching SLE syxtrrn fornls two directivity patterns ldquoArdquo andldquoBrdquoPatternldquoArdquo rcpresents the conventional narrotv-beam receiving directivity pattwn Pattern ldquoBrdquo representsanauxiliary or cwntrol pattern which is considerably broader than ldquohrdquo A I I I ( rsquo ~ S U I rsquo Co f the amplitude modulation of the interfcrence field is made with ldquoBJrdquo a weighted estinlatc is formed and threshold compared with the acoustic f i d t l of ldquolrdquo aftw col~ventional beamformlng Therefore the SLK technique utilizes t8he relative difference in levcls o f ldquoAJrsquo andldquoRrdquo tvhich dcpctnds upon the direction of the irltrrferencc and trsquohrrtshold logical switching If a s h n g signal isin tile side1ol)e of ldquoArdquo the output from ldquoArdquo is smaller than that from ldquoUrdquo and a logic gate prevents the signal fro111 reaching the processor and display If the signal is in the intersection of ldquoArdquo and ldquoRrdquo the output from ldquoArdquo is largctr than that from ldquoBrdquo and the signal reaches thc processor and dis-play Thus the spatial pattern presented to thc display is that portion of the conventional pattern highrrthan
312
the control pattern The SIX algorithm is depicted in Figure 15
An SLE system would enhance the performance of active sonar track receivers It has the advantages of conceptual and hardware realization simplicity with corresponding low cost A consideration that may reduce the effectiveness of an SLE systemis multipletarget interaction Although simultaneous multiple targetsare not too likely to occur in actual operation range and velocity gating would greatly minimize such interaction
The techniques discussed earlier for adaptive array beamforming utilize coherent subtraction matrix inver-sion and gradient searchTheyhave theadvantage of never hlinding the receiver ie it is always on-line Although they are optimum in the processing sense what they also have in common is hardware complexity con- siderable cost and extreme sensitivity to channel-to-channelunbalance caused by hydrophone failure toler- ances and background nonstationarity The suboptimum SLEsystem with its simpler and lower cost structure may prove to be the most operationally effective approach for eliminating coherentdirectional masking backgrounds I t is recommended thatthe sonaroperatorhave the option to switch the SLE inor out of the receiver
An example of simple logical switching nonadaptive receiving arrays is the use ofon-off switching of the elementsin a logical sequence to gmerate a directivity pattern with reduced sidelobes (re the static pattern) The measured time-modulated patterns shown in Figure 16 illustrakthat logical scqucntial svitching can produce N-dR sidelobe level Chehyshev distrihutions (re dB theoretical) [SS] The advanOages of this technique are that it reduces the effects of system tolerances and pro-vides the flexibility of matching the sidelobe pattern to the operational environmentie it is adaptableThe effectiveness of the algorithm would depend upon the tradeoff of sidelobe level and array gain reductions and sideband pattern effects
Spatial Threshold Xormalization Spatial threshold normalization (STN) is an example
of incoherentsubtraction n-hich may be applied to a preformed beam sonar system I t is effective in reducing coherent noise and large transient spokes due to machinery noise and those induced electrically It also tends to normalize the rms fluctuationdue to distributed back- ground noise sources
A plane wave representing the target will essentially be contained in a singlc preformed beam while adjacent beams will have considerahly more noise than signal STN is accomplished by subtracting the average of the background noise present in adjacent beams from the beam containing the target Thus the noise threshold in each beam is estgtahlished by a spatial estimate of~both the coherent and incoherent noise in a space sector containing the beam For example consider five adjacent detected beams designated iz B C DE where the target is as-sumed to be in the centerbeam Then a signal output
IEEE TRANSACTIONS ON SONICS AND ULTRASONICS SEPTEMBER 1975
STATIC 1MbSlDELOBE LEVEL ~ SWITCHED 50dbSlDELOBE LEVEL UNIFORM OlSTRlBWTlON CHEBYSHEV DISTRIBUTION
FIRST SIDEBAND PATTERN lOdb STATIC WbSWlTCHED
Fig 16 Measured time-modulated pattern for sidelobe suppression
of the STN matrix is given by
1STN output = C - - ( A + B + D + E ) (17)
4
This may be considered an approximation to a derivative operation Therefore the STN output will tend to follow the rate of change of the detected or correlation envelope reducing dynamic range The dynamic range will be compressed by a factor of a t least 2 1 This method also tends to suppress any beam-to-beam unbalance although it will probably be insufficient for an operational sonar There are many variations to the above algorithm It is important to note that this general technique does not require any a priori information of the acoustic field
I DYNA41ilIC RANGE COMPRESSION ANDNORMALIZATION
The sonar receiver must have sufficient dynamic range so that it can detectthe weakest signal and yetnot saturate upon receiving the largest expected echo re-verberation andambient noise If theoutput of the receiver is fed directly to some form of data processor1 decision device such as a digital computerthenit is necessary to prevent relatively large interference from overloading the capacity of thecomputer A display console operator is affected by distinctive changes in the displaypresentation and thus requires the best display contrast in the vicinity of the returning echo The opti- mum display background for target recognition is one which has a constant temporal variartce at a given bearing and a constantspatialvariance at a given range This presents a backgroundwith uniform fluctuations as a function of range and azimuth resulting in maximum target detection sensitivity These properties arenot inherent since sonar systems operate in the presence of a
RECEIVED LEVEL(db1 DRCNOUTPUT LEVEL
SURCACESURCACE -SURFACE-SURFACEBOTTOMBOTTOM REVERBERATION REFLECTIONSREFLECTIONSREVETRATION
REVERBERATION
RANGE RANGEIDYNAMICDYNAMIC COMPRESSIONCOMPRESSION
l I I 1 1 1 I 1 l I I I 1 i AND 00 11 22 33 44 55 66 77 00 99 NORMALIZATION
BLOCKTIMETIME (SECONDS)(SECONDS)
U FigFig1717IdealIdealperformanceperformance ofof DRCNDRCN blockblock inin activeactive sonarsonar
313WINDERUNDERWATERSOUND
directive time-varying noise and reverberant field and objectives Therefore since reverberation is a signal-in a randomly varying transmission medium generated noise which depends on the acoustic properties
In order to properly evaluate the received information of the medium (eg attenuation coefficient phase veloc-it is therefore necessary to have a referencz or threshold ityandboundaryscatteringstrcngths) dynamicrange level which is independent of the direction and propaga- and normalization constraintsmay be controlled to a tion of the receivedwaveform and the limiteddynamic considerable degree in the transnlitter Thesc constraints range of the receiver The techniques used t80adapt the are further-ontrolled in the receiver by using a preformed high dynamic range of the received signal to the limited beam systenl and thm applyingeachbeam output to a dynamicrange of the display and to obtain a constant narrowband gain control rrceiver nith possible provision spatial and temporal variance background on the display for doppler normalization are referred to as dynamicrange compression and nor- The limiting interference in passive sonar is ambient malization (DRCN) The methods employed are denoted noise since there isobviously no reverheration In practice by the DRCNblock shown in Ipigurc 5 and arerequired to there are large variationsin noise power from hydrophone optimize performance in the processor and display These to hydrophoneresultingfrom the directivityand non-aspects are clearly understood when viewed with respect stationarity of background noise Thissituation isen-to the two types of sonar operation-active and passive hanced by the machinery and flow noise of the receiving sonar platfornl Dynamicrange is generally not a stringent
The limitinginterference in activesonaris sound re- design parameter so thatspatial normalization only is flected or scattered hack to the receiver Since the ocean theprimary consideration In passive sonar these con-is multilayered and anisotropic the scattered returns or straints are controlled in a n-ideband receiver employing reverberation forhigh energy transmissions establish the a preformed beamsystemand hard clipping Hard clip-primary requirement for dynamic range compression and ping simplifies such problems as automatic level control normalization rather than ambient noise Ambient noise and normalization before applyingthresholdingtech-becomes significant only a t long ranges after thereverbera- niques andmayhe incorporatedineither the signal tion has sufficiently decayed These aspects are shown in processor or the beamformer Figure 17 The purpose of the DRCN block is to produce A complete spatial normalization can only be obtained a uniform output for the input shown The reverberation if coherent noise sources arc climinated Thismaybe waveform was recorded on a shallow water omnidirectional accomplished by employing thcadaptivt beamforming sensor following an explosive charge in deep water The techniques discussed in the previous section initial return issurface revcrherationwhich decays rapidly The concept of dynamicrange compression and nor-into volume reverberation originating primarily inthe malization is generally omitted when studying detection DSL The remainder of thereturn is due to multiple andestimation theory Its importance however cannot reflection and scatteringa t the surface and bottom bound- he overstressed---itwill usually inlake or breaksystem aries These slowly decay into the ambient noise back- design since it sperifies the integratgtionof a theoretically ground designed optimum processor to it8sinterfacesie the
Withactivesonar the designer is free to choose the operational environment and the humanobserver acoustic properties (amplitude frequencypulselength)
Gain Control Receiversof the signal the transmission mode (RDT and scanning sonar) and the propagation mode (surface duct bottom A constant temporal variancr combinedamph a fixed bounce convergence zone) required to meetgt mission thresholdgives a constant falsc alarm probability (CFAP)
314 IEEE TRANSACTIONS ON SONICS AND ULTRASONICS SEPTEMBER 1975
T R A N S M I T T E R E C O V E R YP U L S E W I D T H TIMET V G _I
Fig 18 TVG control waveform
to t8he displa reducing the minimum detectable level For a constant output bardwidth this implies a constant false alarm rate (CI1l) A constant temporal variance requires the hackground to have statistical stationarity Since reverberation isnonstationary CFAP canonlybe achieved by employing a tinle-varying threshold or by transforming the reverberation to a stationary process prior to fixed thresholding At present sonar technology employs gain control rwtwers
The optimization o f receiver design requires a con-sideration of the dependence of reverberation on the transmitted signal the ratc o f change of reverberation amplitude with t h e and thestatisticalnonstationarity of reverheration I n addition optimization is dependent upon the rate of change of reverberation configuration between difftrcnt transmissions or pings
In all cases to he discussed the gain of the receiver varies as a furlction of tirne and thus range after the emission o f thc sonar pulse What distinguishes one re-ceiver from the other isits gain control characteristic and how well it is mat~ched to the highly variable ocean en-vironment
U ) Time-Furzetl (hin
Time-varicd gain (TV() controls the receiver gain so thatitfollow a prescribed variation withtime inde-pendent of the prevailing hackground conditions [go] [Sl] TVG is accomplished hy generating a voltage waveform of a prescribed waveshape and applying it as a bias to a recviver amplifier The question arises as to what is the appropriate-aveshapc that must he generated For the simplification of instruInentation and for ease of adjustment T V ( action is obtained by charging a capaci- tor with a negative voltage during the transmispion cycle and after this cycle discharging the capacitor through a shuntresistorThe overbias voltage then decays ex-ponentially to the r~ormalhias level Thus the amplifier is designed to h~vt a gain i n dB that is approximately linear with the I)iasvoltage
TheTVG waveform is sholvn in Figure 18 It is a function o f tz-o paran~eters iethe voltage t o which the capacitor is charged and the rate of capacitor dis- charge (recover time constant)Initial reverberation returns h a v c t ~ W I I measur(din e x e s of +35 dBIn practice the iriitial reduction in gain is about f40 dB
which usually satisfies most visual and audio require- ments The recovery time should be as rapid as possible and still be consistent with the desired rcduction in re- verberation and to prevent saturation by strong echoes fromnearbytargets The recovery time constant is in general from 05 to 10 second
Adisadvantage of TVG is that the variation of gain with time does not follow any of the basic laws of reverberation theory For long range sonars in deep water the intensity for surface and bottom reverberation varies inversely as the cube of time (range) and for volume reverberation it varies inversely as the squareof time (range)In addition TVG is only sufficient if the reverberation is uniform in azimuthand monotonically decreasing in range Since this is not the case (particularly in shallow watcr) what is desired is a controlled form of TVG coupled amph a preformed beam system for azimuthal normalization each beam having its own gain control receiver Two common methods of supplementing TVG control are AGC and RCG which greatly reduce the necessity for the sonar operator t o makemanual gain adjustrnents during a search phase
b ) Automatic ampin Control
Automatic gain control (AGC) continuously monitors the receiver gain according to the prevailing reverberation [91]-[96] This technique is considerably more compli- catedthan TVG sincereverberation is a function of space time and doppler
An automatic gain control system refers to the closed- loop error-actuated gain control of a linear 11 amplifier where the error signal is proportional to the mean value of the background envelope A typical diagram of an AGC receiver is shown in Figure 19 The forward path contains a variable gain amplifier Tvhich nlay he con-sidered to be comprised of a control stage folloned by a fixed gain amplifier The feedback path contains a de-tector-averager It rectifies and integrates the receiver output and applies Ohe detected envelope t o the control stage varying the forward path gain
An AGC receiver is a type-0 servomechanism This implies that a constant error-actuating signal produces a constantvalue for the controlled variable ie a step input produces a finitesteady-state trackingerror In practice the detected envelope is compared with a fixed
315 WINDERUNDERWATER SOUND
I I FILTER DETECTOR- I h I I BANK AVERAGERlsquoS I
I I lsquo I --c BANDPASS I + 4 FILTER I I TO P P I
+ t I IBEAM - - I DISPLAY INPUT
CONTROL STAGE AMPLIFIERrsquo rsquo b
NOTCH A-D FILTER
I I - DETECTOR-I AVERAGERI I I AGC RECEIVERL _ - - _ _ - - - _ _ _ --J
I I --) CIRCUITRY
I a
I I
I CW DOPPLERNORMALIZATIONI L --------------------I
I TO P P I DETECTOR-I AVERAGER DISPLAY
I I I I I
J
Fig 19 Blockdiagram of typical sonar receiveremployingautomaticgain control CW dopplernormalization and notch filtering
voltage and the difference is used as the error signal This is called ldquodelayedrdquo AGC Its purpose is to keep the varia-tions in the desired signal level below a given value When the detected envelope is equal to or less than the reference voltage the error signal is zero and the receiver behaves like a fixed (maximum) gain amplifier Error signals greater than zero produce an 4GC action which reduces the gain
There are fourfactors which spetify the performance of an AGC receiver 1 ) dynamic range 2) flatness factor 3) linearity and 4) pulselength optimization
Dynamicrangerequirements are determined by the signal variation with range by variation in target strength with aspect and by variability of the medium and target A dynamic range of 70-80 dB is adequate for most sonar applications The problem now is to match this dynamic range to the limited dynamic range of an intensity modu- lated CRT display The displayrsquos dynamic range is usually less than 12 dB in an operational environment
The receiver output fluctuations are inversely propor- tional to the receiver bandwidth-integration trsquoime product andare enhanced by thenonstationarity of the back- ground They are also increased by nonlinearities in the gain control characteristicparticularlynear the ampli- fierrsquoscutoff bias Amplitude fluctuations will give poor contrast on the PPI and generate false alarms
A measure of the degree of fluctuation that is acceptable in the receiver output is the ldquoflatness factorrdquo The flatness factor is the ratio of the required receiver dynamic range (in dB) to the fluctuation (in dB) about the output level If it is desired to maintain an output level of 1 volt =cldB for an input level change of 80 dB then the flatness factor is 40 The selection of a suitable flatness factor is de-pendent on the form of processing that follows the i lGC receiver
Linearity refers to the input echo dynamic range that is supported by the receiver without output distortmion An echo dynamic range of at least + l 5 dB is generally re- quired and is specifiedfor the entire background change in the receiver input An AGC receiver should be provided
with a manual gain control to allow the operator to reduce the receiver gain and prevent strong echoes from saturat- ing the PPI
The basis of present AGC design is that the rate of change of the reverberation amplitude is small compared to thatof the echo The time constant is sufficiently short to permit the control stage to respond to reverberation and long enough so that the loop does not respond to the target echo A short time constant gives a fast receiver recovery time This provides good trsquoracking capability but at the expense of generating false alarms due to short- time power fluctuations As the response to reverberation is increased by shortening the timeconstantthe echo envelope becomes more distorted it will have a greater negative slope or ldquodrooprdquo which reduces the signal power However a long time constant suppresses false alarm generation and reduces echo distortion but it also reduces the receiver tracking capability To decrease the receiver recovery time when a high-level short echo pulse is applied it is necessary to shunt theresistive element of trsquohe integra-tor with a fast discharge diode A rapid discharge circuit preventsinteraction between close but nonoverlapping multitarget echoes and multipaths but it increases false alarms In general the closed loop trsquoime constant is in-versely proportional to the instantaneous output voltage saturation will then result in a long recovery time There- fore it is apparent that the ldquooptimumrdquo time constant isa compromise between several factors suchastracking capability false alarm generation echo distortion and output variance
The integrator time constant should be larger than the pulselength although the ldquooptimumrdquovaluedepends more on the rateof change of the reverberation amplitude and configuration with time It is important to remember that AGC senses the mean of the detected envelope and changes the gain accordingly For shortrsquo pulselengths of less than 15 msecs the reverberation is discrete or impul-sive in time with ldquoholesrdquo in trsquohe waveform The detected envelopeis notrsquo very well defined-itis highly discon- tinuous which tends to increase false alarm generation The
316 IEEE TRANSACTIONS ON SONICS AND ULTRASONICS SEPTEMBER 1975
time constant can he sufficiently increased to prevent this hut it is not desirable for reasons already statamp For long pulselengths of more than 500 msecs the required time constant is slightly greater than the pulselength due in part to thesmoothing effect of the medium The ability of the receiver to discriminate between reverberation and echo is somewhat poor It appearsthat for very short pulselengths thedetected envelope is too sensitive a paranletrsquoer for gain control and for very long pulselengths i t is not sensitive enough Therefore for these two cases parameters other than the detected envelope eg LLholerdquo
Fig 20 Photographs showing effectiveness of AGC operation(RDTmode-pulse length 15 msecs) (a) Preamplifier output vertical scale 02 voltsjdiv horizontal scale 02 secsdiv (b)Preformed-beam output vertical scale 001 voltsdiv horizontal scale 020 secsdiv (c) AGC receiver output vertical scale 05 voltsdivhorizontal scale 05 secsdiv(d) DC controlbiasvertical scale 20 voltsjdiv horizontal scale 10 secsdiv
time or phase should be investigated to control the re- ceiver gain For intermediate values of pulselength the timeconstant is ldquooptimizedrdquo at approximately 3 to 4 times the transmitted pulselength Forimproved per-formance when different pulselengths are transmitted the receiver should have a variable time constant circuitrsquo in the feedback patrsquoh
The effectiveness of 4GC is shown in Figure 20 for an RDT sonar system and a pulselength of 15 msecs Figure (h) depicts the effect of summing the reverberation outputs of several receiving array elements toform a beamThe reverheration attheAGCinput contains a large numher of spikes or ldquoblobsrdquo due to discrete scattering patches each ldquoblobrdquo is approximately the same width as the emitted pulse If examined closely the long pulse shown in Figures 2O(a) (b) preceding the received re-verberation decay is seen to be comprised of the original twelve pings that were transmitted sequentially (RDT mode) The reverberation in the receiver output (Figure 20 (c) ) has hem strongly suppressed but it ampill has a spikey irrftgular character including self-generated false alarms The ACC output may be considered to have a constant mean hut not a constant variance However this is a good approximation to ideal DRCN operation shown in Figure 17 The dc-bias for controlling the receiver gain is shown in Pigure 20(d)
c ) Votrlz FzrsquolteT
To optimize receiver design the background should be ldquoprewhitenedrdquo before processing u-itrsquoh AGC anda matched filter This CUI he considered as a normalization in the frequency domain For a background of reverheration and noiscl vith ponw spcctra R ( f ) and Ar(f) respectively tho tralrsfcr function H ( j ) of t8he prewhitening filter is
Thc power spcctrunl of the received reverberation is essentially the sanle as that for the transmitted signal Its frequency components are incoherent while those for the discrete echo arc cohcrently related
I n practice if the receiver is reverberation-limited the filter charactoristic given above is approximated bp the response o f a high Q resonant circuitThis is generally referred to as a ldquonotch filterrdquo The notch filter may be comhiued with t8he bandpass filter at theinput to the
AGC receiver (refer to Figure 19) to suppress reverbera- trsquoion thus enhancing the detectability of high doppler targets However this is at the expense of rejecting low doppler targets which if imbedded in a noise-limited region (ie a t long ranges) would otherwise have been discernible The notch filter may he switched in or out of the system at the optgtion of the console operator (de- pending upon target and background conditions)
A typical combined frequency response of a reverbera- tion notch filter and bandpass filter is shown in Figure 21
317 WINDERUNDERWATERSOUND
I l
-48 - J -32 -24 -16 -8 o e 16 24 32 40 48
TARGET DOPPLER (KNOTS)
Fig21 Combined response for typical notch filter and bandpassfilter
Fig 22 Effectiveness of notch filtering low dopplerreverberation
The attenuation for a zero doppler target is 40 dB and the -3 dB points are for a target doppler of about =t5 knots The required specification depends upon the charac- teriatics of the transmitted signal the target doppler and and the degree of frequency spreading of the reverberation spectrum which may be attributed to scatterer motion the finite widths of the transmitting and receiving beams and the finite accuracies of the ODN circuitry For these reasons notch filtering is not practical forlong pulse-lengths ( gtZOO msecs) with the corresponding narrow bandwidths It is importantrsquo that the amplitude response
be the same with the notch filter in or out so that hoth high and low doppler targets produce the same brightness (or deflection) on the display
The effectiveness of notch filtering is shown for a pre- formedbeamsystemwithAGC by the photgtographs of the PPI display in Figure 22 (these were taken within a short time of each obher so that water conditions may be assumed relatively constant) Withthebandpass filter only (notch out) the reverberatjon returns preventrsquo the recognition of the targetat a bearing of 280rsquo (refer to Figure 22(a)) The multiple target indication is the range ambiguitydueto a sequentialping within the echo- ranging cycle ie the trsquootal transmission is RDT followed by an OMNI pulse In addition thereis a spoking or ldquobrick silordquo effect due to the finite beam interpolation of the system This causes the reverberatrsquoion to have the same characteristic pattern as the target thus degrading target detectability With the notch filter in the circuit it is seen that the reverberation and ldquobrick silordquo effects are eliminated (refer to Figure 22 (h)) The targetrsquo shown is now a t bearing 225rdquo
For optimumperformance thedepthandbandwidth of the notch filter should be continuously controlled by the prevailing reverberation and noise This is referred to as an adaptivenotch filter Several such filters have been developed and sea tested in the past five years Bow-ever none are operational in current sonar systems Ex-perimentshave shown that anadaptive n o t c h filter in the CW receiver can greatly enhancr the detection o f low doppler targets when reverberation-limited and insure the detectmionof IOW doppler targets --hen noise-limited
d ) Post-Detection A GC An AGC receiver tends to maintain a ronstant power
outputThe AGC output is then processed by a post-detector-averager (with or without predetection filtering see Figure 19) which is matched to the transrtlitted pulse- length for maximum processing gain This permits most of the narrowband reverheration power to pass while greatly limiting the wideband noisepower Therefore during an echo-ranging cycle as the reverhcration rrturns from short and intermediate ranges slowly decay into the ambient noise (corresponding to longer rangrs) a constant power AGC output tendsto produce n timc-varying variance at the output of the detector-averagrr If t8his varianceis not normalized since t h PPI has R lirnitcd dynamic range there can he x loss of rithrr c101erange or long range targets depending on the manual gain control setting of the AGC receiver Normalizing tjhe variance will permit the sonar operator to lower the t8hrcshold and enhance the detection of noise-limitrd targets A constant temporalvarianceinput tothe display is rcquircd and may be obtained by applying the detector-avcrager output to a second AGC receiver This techniqur is callrd post-detection AGC An analysis of it is shown in krsquoigure 23
It is often stated that the reason AGC sonar rcceivcrs sometimes do not perform very well ist)r(aauw of thtt difference in statistics of reverberation and r~oiscThis i s
318 IEEE TRANSACTIONS ON SONICS AND ULTRASONICS SEPTEMBER 1975
( a ) Preformed-beam output t
REVERBERATION
I REGIONREGION
( b ) 1st AGC receiveroutput t
( c ) Post detector-averageroutput
( d l 2nd AGC receiveroutput
l THRESHOLD t =o LEVEL
Fig 23 Illustration of posedetection AGC to provide constant variance
true but the majorreason for the statistics being different appears to be primarily due tothe difference in band-widths
e ) Reverberation Controlled Gain A reverberation controlled gain (RCG) restores the
receiver gain through a capacitor discharge circuit as for TVG but at a rate controlled by the prevailing level of reverberation similar to AGC [91] RCG act8ion within an echo-ranging cycle is irreversible As the reverberation decays a sudden increase in background level will clamp the gain at its existing value When the receiver output finally falls below the previous level or somepredeter-mined threshold the gain will continue to increase accord- ing to the recovery time constant Therefore increases in background level do not reduce the receiver gain as in AGC but only delay further increases in receiver sensi- tivity RCG doesnot distinguish between slow rises in the input level caused by increased reverberation or sudden rises due to echoes An RCG system may be considered as a unidirectional AGC receiver controlling the rate of discharge (or recovery time) of a TVG circuit
RCGandAGCare equally effective in deepwater where the reverberation has a somewhat continuous decay thoughRCGmay bemore desirable since it does not distort the echo envelope Shallow water propagation is characterized by multiple surface and bottom reflections This causes reverberation to increase during reception and have a considerable number of blobs 4GC counter- acts this by increasing the control bias thus reducing the hackground level-while RCGcannotadjust t o an in-creased reverberation level and produces an increase in receiver output Comparative shallowwaterbehavior is shown in Figure 24 for an AGC time constant of about 500 msecs AGC is seen to be superior to RCG in com- pressing reverberation in shallow water
The use of several time constants in an RCG circuit improvessystemperformance For a low reverberation amplitude a short time constant of about 05 seconds is required for fast recovery For a high reverberation ampli-tude a long time constant of several seconds is required For in-betweenreverberation levels the two limiting time constants may be shared proportionatelyalthough an intermediate time constant is preferred Multiple time
- -
WINDER UNDERWATER SOUND 319
Fig 24 Comparison of RCG and AGC action in shallow water (frequency 15 kHz) (a) Receiver uncontrolled (b) RCG (c) Bias acrosscontrolline during (b) (d) AVC diode shunted by 5 meg-ohm (e) Bias acrms control line during (d)
constant RC(- TVG is an interpolative AGC Thresholds for sclectillg the time constants may be established with respect t o tgthe reverberationamplitudeabovea preset level of uniform ambient noise background on the PPI
The design of an ItCG -TVG circuit is similar to AGC It may be conlprised of an attenuator which uses field- effect transistors or diodes as control elements a detector-averager R I I ~t rorr~paratc~r circuitfor selecting the proper timeconstant (when more than one timeconstant is available) Typical values for amplitude and phase simi- larity between channels arc hO5dB andampS0 respectively
f) Logarithmic IleceWer
A technique which under certain conditions results in CEAP operathrt and provides a largedynamic range is a logarithmic receiver A block diagram of the receiver is shown in Figure 25
Tho idealiztrti logarithmic detector is characterized by r97l
y ( t ) = a l n h R ( t ) ab gt 0 (19)
where R ( t ) is the envelope of the receiver input and y(t) is the output of the linear envelope detectorThe con-stants (U) and ( b ) are the slope and gain of the logarithmic cbaracteristic respectively If the envelope is nonstation- ary it is assumed that its probability distribution depends onlyon a single time-varying paaameter m ( t ) For y ( t ) to have a constant variance it is necessary and sufficient that either C981
R-)--R(1)
- a (constant)
or
where the bar Pignifies ensemble avcraging These tests -areindependent of U ( t ) R2(t ) and R(ti are sufficient statistics ie they contain all the information necessary to make a decision The dimension of t8he decision space has thus been reduced to that of the sufficient statistic namelytwo-dimensional If ampher of thesetestsare satisfied then the output of the linear detector contains a constantvarianceand a time-varyingmeanThe time-varyingmeanmustberemovedtoobtain a stationary background A fasttimeconstant (FTlt) differentiator or high pass filter is generally used to subtgtract out the mean Another technique for removing the slowly-varying dc is with a pulselength discriminator C99-J
It was noted in Section F that as the density of the scatterers increases the reverberation tends to approach a nonstationary Gaussian process The envelope R(t ) of the process has a Rayleigh distribution expressed as
Rp(Rt) = -exp [-R22u2(t)] R E [0+m] (22)
Yt)
and satisfies the tests given above For the Rayleigh distribution the variance at t8he ontput of the FTC filter is calculated to be
Note that theoutput variance is independent of ~ ( t ) and depends upon the slope of the logarithmic lalhn- only Thusa fixed output threshold provides CFAP tmothe display
A realizable logarithmic amplifier characteristic is of the form
y ( t ) = a l n [l + b R ( t ) ] (24)
gt
B E W ENVELOPE LOGARITHMIC F TC BAND-PASS CONSTANT-
INPUT FILTER AMPLIFIER DETECTOR FILTER OUTPUT
1 l
Fig 25 Block diagram of logarithmicreceiver
-
320
Performance degradation using this characteristic in lieu of the ideal can be greatlyminimized if bR( t ) gt 1 a large gain ( b ) is desirable Also the amplifier must be logarithmic to -20 dB below the rms noiselevel This lower bound on the logarithmic behavior is quite sufficient since the probability of any fluctuation of aRayleigh distribution reaching a value less than 20 dB below the rms level is only about 1 For aninput background dynamic range of 80 dB the variance of y(t) will change byabout 025 dBTheoutputvariancedepends upon the slope for it to be independent of the input signal the slope tolerance shouldbe ampZO which is compatible with the limited PPI dynamic range
There are several factors which determine the effective- ness of a logarithmic receiver These are1) differentiation 2) probability of detection and3) display signal contrast
The purpose of the differentiator is to remove the time- varyingmean level of the reverberation Asimple RC differentiatingnetwork is generally used where the for- ward time constant (RC) is a compromisebetween the value required to eliminate the varying meanand the value required to pass the echo energy spectra Excellent results have beenobtained when the timeconstant is about 15 times the transmitted pulse length Atime constant of this order gives rise to shadows on the PPI immediately after each echo and provides a poor tracking capability These effects may be eliminated by shunting the resistive element of the differentiator withafast discharge diode to obtain a short backward time constant (about 02 times the pulselength) or fast recovery How- everthere is then areduction in signal-tenoise ratio of at least 3 dB This loss does not occur when the same differentiatingcircuit follows a linear receiver (eg AGC) It may be attributed to the increase in the nega- tive-going noise peaks at theoutput of the logarithmic receiver Therefore the optimum backward time constant is a compromise between several factors such as tracking capability shadows on display and signal-to-noise ratio
The ROC curves for the logarithmic detector (without differentiation)have been computed over the following range of parameters 001 5 P D 5 099 10-l-O 5 PPI5
1 5 n 5 100 where PB is the probability of detec- tion PFa is the probability of false alarm and n is the number of pulses integrated or summed after detection to improve the signal-to-noise ratio [lOO] It is concluded that there is a slight reduction in the probabilityof detec-tion for a fixed probability of false alarm when using a logarithmic detectorThis loss in sensitivitymaybe expressed in terms of the reduction in power of a square-law detector which produces the same loss of sensitivity The loss (in dB) is approximately proportional tothe logarithm of the number of pulses integrated Therefore for one (1) pulse (no integration)there isno loss For ten (10) pulses integrated theloss is about 05 dB while for one hundred (100) pulses integrated the loss is about 1 dB The advantages of a logarithmic detector far out- weigh the loss in sensitivity
Due to logarithmic compression and differentiation there is a lack of signal contrast on a PPI display-al-
XEEE TRANSACITONS ON SONICS AND ULTRASONICS SEPTEMBER 1975
though the background is rather uniform spatially It is especially important tohave sufficient signal contrast when operating in a high reverberant field (with a short range scale) and when there is a crowding of targets on the display (with a long range scale) By applying either base clipping or an antilogarithmic transformation to the receiver output the original signal contrast or signal-to- noise ratio may be restored without a loss in detectability
In practice a preformed beam time-multiplexed sysbem is used in conjunction with a logarithmic receiver This isrequired for background normalization without beam-to- beam unbalance An important consideration is where to perform the ODN correction (refer to end of Section E) Bandpass filtering a waveformtime-multiplexed will produceinterchannel crosstalk Also abandpass filter at theoutput of the logarithmic amplifier degrades the desired CFAP property of the receiver Therefore ODN must be performed prior to multiplexing and logarithmic actionAnotherpractical consideration is that a loga-rithmic law may not suppress high close range reverbera- tionreturns which enter throughthe sidelobes of the receiving beam To minimize these returns TVG must be used prior to the logarithmic receiver
Hard Clipping Hard clippers have three very attractive properties-
they provide 1) a large dynamic range of operation 2) instantaneous amplitude normalization and 3) high compatibility with present digital processing techniques As a result they have found extensive use in sonar system design for detection and tracking purposes as well as in other fields such as satellite communications [loll (in a satelliterepeater a bandpass clipper precedes a TWT amplifier in order to assure maximum RI+power efficiency without saturation) The input to a hard clipper is gen-erally a multiple signal input due to multitargets multi-patharrivalsand background noise Multiple signals may also be attributed to pulse overlap and echo-splitting associated with long pulse transmissions as in high resolu- tion FM sonars Recognizing that ahard clipper is a nonlinear device it is a natural question to ask what is the interaction between signals due to this particular design and how does it affect system performance
The transfer characteristic g ( ) for a hard clipper with input z ( t ) and normalized output y ( t ) is given by
I+l IO Y ( t ) = qCs(t)l= if z ( t ) = 0 ( 2 5 )I-
Thereare several properties that may be predicted for the clipper output due to the odd symmetry of the clip- pers amplitudecharacteristic [102] In general the output of any full-wave (odd) 7th-law device contains only odd harmonics of the input frequencies The hard clipper ( v = 0) output is approximately a rectangular waveformwith the samephase structureastheinput Therefore the total power in the kth-odd harmonic band
321 WINDER UNDERWATER BOUND
is equal to the power of the kth harmonicin a Fourier series expansion of arectangularwaveformThekth-harmonic power is 8 ( ~ k ) ~which is constant regardless of how the power is distributed within the band
If the signal plus noise complex is assumed to have Gaussian statistics the effect of extreme clipping without post-filtering is to transformthe correlation function T ( T ) before clipping to a new correlation function R ( T )
given by C1031
2R(7) = -sin-rsquo r ( 7 ) (26) A
where the correlation functions are normalized ie R ( 0 ) = r ( 0 ) = 1 Expanding the arcsine in a Taylorrsquos series R (7)may be written as
-1 (27)
where O ( T ) representsthe nonlinear effect of clipping Thus as indicated above high input SNRrsquos enhance the nonlinear characteristic of the clipper This produces significant power fluctuations in the output In the case of small input SNRrsquos 0(T ) is negligible and
2 R(T) 2 - r(7) (28)
n-
The reduction in SNR by extreme clipping is 2 ~or - 2 dB For small SNRrsquos a hard clipper behaves linearlywith respect to power This indicates the effectiveness of a clipper together with a power detector to detect a single signal embedded in noise-a change in signal power at the clipper input results in a proportionate change in power at thedetectoroutput Using a zonal (firstharmonic) post-filter results in a gainin the output SNRof 7r28The loss due to clipping after filtering becomes (ZA) X (w2S) or ( ~ 4 ) a loss of about l-dB results are similar for a sinusoid in Gaussian noise [104] C1051 This is true even for an arbitrary non-Gaussian signal if it is sufficiently small relative to noise
Consider aninput comprised of twounmodulated sinusoids andnarrowbandstationary Gaussian noise where the signals have random phase angles statistically independent and uniformly distributed from 0 to 2r The spectrum of the filtered output contains both discrete and continuous components [lOS]
When the noise dominates both signals the SNRrsquos decrease by the factor (aj4) as for the one signal case regardless of relative signal strength An interesting case occurs when the two signals close in frequency are of equal amplitude The ratio of output to input SNR tends to zero for both signals as the input noise decreases The explanation in part is that asthe signals are beating destructively together (the envelope crosses the time axis at the difference frequency) the noise has the opportunity
to ldquoslip throughrdquo the limiter a t each zero crossing There- forehighinputSNRrsquoscan resultrsquo in very low output SNRrsquos for signals of equal strength
When the two signals are embedded in noise where the larger of the input SNRs is -10 dB or less their relative strengths are preserved and there is virtuallyno signal suppression For large input SNRrsquos the maximum degree of suppression of a weak signal by a strong signal is +6 dB ie the weak signal is reduced by a power facbor of 14relative to the larger signal and occurs for large input SNRrsquos This signal suppression is thesameresult one would obtain for clipping a weak sinusoidal signal (or echo) plus strong sinusoidal ldquonoiserdquo (or reverberation) Working backwards (14) (8r2) = 2 r 2 which suggests thatthe relationship between the normalized autocor-relation function at the output of a hard clipper to that at the inputis approximately C107 J
2R(7) = - r ( 7 ) (29)
8 2
for a signal-to-noise ratio much less than unity The loss without post-filtering is 2r2 ( - 7 dB) Comparing the last two equations we see that a sinusoidal noise input is about 5 d B poorer than Gaussian noise
It is seen that the effect of raw data clipping on target detectability will depend not only on the input signal-to- noise ratio and noise statistics but also upon the signal phase structure which characterizes the crossproducts and associated distortionRecentexperimentshaveshown that for small signal-to-noise ratios the loss due to clip- pinglinear FM pulses is less than that for a Gaussian signal approximately l-dB If the signal plus noise com-plex is non-Gaussian as for strong impulsive type noise the loss will generally be greater than 2-dB
A consequence of signal suppression in an operational sonar is reflected in the ability of strong signals or rever-berations off the maximum response axis (MRA) to mask weak signals on the MRA Ina clipped active sonar that is reverberation-limited the effect of intermodulation betweenecho andreverberation is that as the level of one decreases the spectrum level of the other will increase If the reverberation is dominant as is usually the case this results in an increased loss of detectability If there is just signal and background noise and the signal level is nearly constant then in a clipped sonar as the noise increases the displayed signal level (ie on a A-scan) will decrease This can seriously affect the problem of classification where absolute echo levels are often required (eg to determine target strength)
J SIGNALPROCESSING
Signal processing refers to the operations performed in the time-frequency domain for detecting or extracting a desired signal from some maskingbackground The problem of greatest consideration is that of separating a given signal from random noise whose spectrum overlaps that of the signal In this case the statistics of the signals play an important role in the determination of the pro-
322 IEEE TRANSACTIONS ON SONIC~AND ULTRASONICS SEPTEMBER 1975
awREwt W ALL ASPECTS LFY AM M P a 7
ONLY
Imx)mRE)(TW L N liLL ASPECTS co(EREwI LFY 101
ONLY
20 40 I 2 4 6 8 I O 6 0 0 0 ~ ~ )zoo MLWDII)T)I-TIYPROOW1
Fig 26 Comparison of incoherent and coherent processing of pulse CW and linear FM
cessor It is necessary to select a suitable criterion and to determine how much noise may be accepted andhow much signal energy may be rejected to achieve the desired result
Basic detection theory states that a sufficient statistic for detection is the likelihood ratio [lOS] [l09] defined as the ratio of the conditional probability density of the received data vector when the signal is present to that when the signal is absent The optimum processor struc- ture is onewhich maximizes the likelihood ratio for Gaussian statistics the optimum processor is well defined
In active sonar the signal processors are broadly classi- fied as eitherincoherent or coherent An incoherent processor is one which is sensitive only to the amplitude modulation of the received waveform regardless of the doppler band signal coherence is not utilized For a given timeband- widthproductthe processing gain of an incoherent processor is generally inferior to that obtainedwith a coherent processor ie one which utilizes both the ampli- tudeand phasemodulation of the signal To maximize the detection and classification capability of a receiver it is required to process coherently For a stationary white Gaussian noise background the processor which maxi- mizes the output signal-to-noise ratio is the matched jiZter [110]-[112]whose transferfunction is the complex conjugate of the Fourier spectrum of the input signal to be detected The matched filter criterion is equivalent to the impulse response being the time reverse of the signal Since the output of the matched filter is the crosscorrela- tion function of the transmitted signal and the received signal plus noise complex the optimum processor is equivalent to a crosscorrelator
In passive sonar the problem is one of detecting a noise-like signal in a noise masking background The signal contains both coherent and incoherent components If the signal and noise are Gaussian random processes with known spectra the signal is completely characterized by its second moment so that the optimum (incoherent) processor is some form of energy detector
Active Sonar Detection The signal processing techniques employedin active
sonar receivers must be matched to the signal class and targetdynamics [113]C114-J Acomparison of signal
processing gain for incoherent and coherent processing of pulse CW and linear FM isshown in Figure 26 as a function of the bandwidth-time product and the depend- ence on target aspect It assumes Gaussian noise masking and completely incoherent scattering with the scattered energy conserved From an initialdetectionpoint of view there is often little to be gained in processing co- herently when the bandwidth-time product is less than 100 This is supportedby the fact that in practicea coherent processor has greater hardware complexity and morenormalizationproblems which produce losses in processing gain for a multichannel (gt10 channels) system it can be as much as 4-10 dB Incoherent process- inghas the desirable feature that it is independent of target aspect thereby providing reliable processing gain undermostoperational conditions However it is not doppler sensitive and thus does not provide information on target range-rate The efficiency of coherent processing with respect to target aspect depends upon the type of signal transmitted the latter also determines the range and doppler resolution ambiguities of the system
Since the signals most successfully utilized in an opera- tionalenvironmentare pulse CW and linear FM only their processors will be discussed here The CW processors are shown in Figure 19 designated post detector-averager and CW doppler normalization both preceded by a notch filter and AGC receiver The linear FM processors con- sidered are the post detector-averager clipped and linear DELTICcorrelatorsandpostdetection pulse com-pression
a ) CW Processors The post detector-averager is anincoherent processor
comprised of an envelope detector followed by an integra- tor or low-pass filter matched to the pulselength of the transmitted signal The detector is a nonlinear device which has a square-lawbehavior for weak input signal levels and is realized with a full-wave or half-wave recti- fier For a receiver bandwidth ( W ) and signal pulse- length (T)the processing gain against noise is approxi-mately 5 log WT CW envelope detection will not provide any processing gain against reverberation since the signal and reverberation bandwidths are almost equal
323 WINDER BOUND UNDERWATER
cw LINEAR FM - ~
Fig 27 Effectiveness of incoherentprocessing of ~
linear FM
Coherent processing is achieved by predetection or doppler Jiltering prior to envelopedetectionDoppler filtering is obtained with a bankof contiguous narrowband (comb) filters in cascade with the output of the beam- former (plus ODN and AGC) The filter bank subdivides thetotal received bandwidth rsquo into small bandwidths inversely proportional tothe pulselength The received signal will pass through one or a t most two of the in- dividual filters depending upon thetarget doppler and the degree of time and frequency spreading due to target structureand motion The signal-to-noise ratio is im- proved by an amount proportional to the ratio of receiver inputbandwidth ( W ) to filter bandwidth ( B ) If the postintegrationbandwidth is ( l T ) thenthetotal processing gain against noise is approximately equal to 10 log W T - -5 log BT The second term is the effect of a mismatched input filter maximum gain is obtained when the comb filter is matched to the signal spectrum There is no improvement in performance when the system is reverberation-limited since the power spectrum of the received reverberation is essentially the same as that for thc trsquoransmitted signal
Doppler filtering applies the information contained in one acoustic beam to many channels thereby increasing thedatarate of the receiver If all of the information channels are displayed simultaneously on a CRTand examinedbya single sonar operatorexperimentshave shown there can be a considerable reduction in processing gain (for small signal-to-noise ratios visual scanning can reduce the processing gain in dB by about3 of that which can beobtained using matched filtering)This loss is attributed to the limited data-handling capacity of the operatorandtothe increase in the number of ldquofalse targetsrdquoThedataratecan bereduced to that of one channel by employing ldquoORrdquo-circuitry at the outputs of the filter bank
By ORrsquoing the envelope detected outputs of a bank of doppler filters the data rate of the system is the same as if the channels were monitored individually the size of the display canthenbegreatly reduced However combining the channels bymaxima (an OR-circuit re-spondsinstantaneouslytothemaximumamplitude) produces a loss in signal-to-noise ratio which is a function of 1) the signal-to-noise ratio 2) the probability of false alarmineach channel 3) the number of channelsand 4) the channel-to-channel output balance Channel un-balance is further pronounced by reverberation returns which candominatetheoutputs of several of the low doppler filters (althoughthe sidelobe structure of the product of certain transmitter-receiver beam patterns and ship speed can produce reverberation in intermediate doppler filters as well) These outputs can subsequently capturethe OR-circuit and tthus suppress high doppler signals in other channels
The OR-circuit loss is primarily due to the increase in the probability of false alarm by a factor nearly equal tothe number of data channels (assumingthesame probability of false alarm in each) In order to maintain thesame false alarm rateas for a single channel only higher amplitude signals which can exceed the threshold will be detected Inpracticetherearetimes when the CW signal is captured entirelyby the noise indicating an infinite loss in signal-to-noise ratio To reduce the OR-circuit loss it is required that the peak-to-mean ratio at theoutput of eachenvelopedetectorbe constant prior to ORrsquoing One approach for accomplishing this is to incorporateanAGC amplifier after each envelope detector ie post-detection AGC (refer to Section I) In addition a not8ch filter can be employed before t8he filter bank to notch out thelow doppler reverberation spectrum and enhance the detection of highdoppler targetsas shown inFigure 2 2 Utilizing current normalization
324
technology at-sea measurements indicatethat multi-channel input OR-circuit losses average 2 4 dB
h ) Linear F M Processors Although an incoherent processor operates on the ampli-
tude modulation only of the received signal it does provide processing gain against reverberation for a linear F M pulse This is to fact that theattributed the reverbera-tion spectrum is spread over the modulation bandwidth ( F ) andthen bandlimited by thepostdetection filter to the bandwidth of the pulse envelope (1T) the process- ing gain is 5 log FTWhen noise-limited the processing gain will he the same as for a CW input for the same pulselength-receiver bandwidthproduct Therefore in-coherent processing of a linear F M pulse provides process- inggainagainst both noise and reverberation masking backgrounds
A comparison of incoherent reverberation processing of CW and linear FRI is shown in the PPI photographs in Figure 27 The improvement) in target recognition seen with linear FM is attrihuted primarily to reverberation spectrum spreading The incidence of an LFM sweep on a scatterer structure generates a series of discrete reverbera- tion echoes each with a different frequency producing an interference pattern which significantly reduces the standard deviation of the background fluctuations
A crosscorrelator is the optimum signal processor in white Gaussian noise Processing gain is obtained against reverberation by enhancing the range resolution of the system To process the outputs of many receiving beams with high range resolution could result in considerable electronic cbircuitry for conventional real-time correlation utilizing a single replica If more than one reference is required to compensate for spectrum compression or expansion due to target doppler then the hardware com- plexity is further increased A technique which greatly reduces correlator requirements while providing high range resolution in real-time is the DELTIC Correlator C11i)-[117]
TheIIElay Line TIme Compressor (DELTIC) is a time-compression system for clipped and sampled signals employing a closed-loop digitsal delay line with input and recirculation logic to control the flow of stored samples The sequence of instantaneous samples are squeezed together to form a high-speed replica of the incoming signal having a total duration equal to the interval between samples The ratio of the transmitted pulselength to the sampling pcriod is the time-compression factor which is the number of correlations that may be carried out within the d~rat~ionof the original signal The major lobe width of the correlation function is the effective pulselength or range resolution of the system The time-compressed signal is stored in a high-speed recirculationstorage channel In practice a high-speed replica of the trans- mitted signal and the received signal are stored in two such DELTICS a reference DELTIC anda received DELTIC The outputs of these DELTICS are thencrosscorrelated---
IEEE T R A N S A ~ I O N SON SONICS AND IJLTRASONICS SEPTEMBER 1975
LFM REFERENCE
PREFORMED
CORRELATOR
SNR-ODE SNR - +l0DE
Fig 28 Effectivenessof coherentprocessing of linear FM
a binary multiplier for multiplication followed by comb filtering for time averaging (only a single recirculation of the DELTIC) This is called an AC-correlator since integration is accomplished with a bandpass filter instead of a lowpass filter (DC--correla tor)
The effectiveness of coherent processing of linear FM utilizing a clipped DELTIC correlator is shown in Figure 28 The time-bandwidth product of the signal is 65 rcsult-ing in a theoretical processing gain of about 182 dB However the processing gain measured was 16 dB the difference is attributed to losses in clipping and sampling
For a narrowband linear F31 signal [118]-[120] where the modulation bandwidth is much smaller than the carrier frequency and a targct with constant range-rate the frequency-time slopes of tjhe received and reference signalswill be parallel The doppler frequency shift will he equivalent to a time shift of the FRT slide plus a phase shift so thatthe correlator output will he doppler-in- variant involving only a translation in time This implies that a single (zero) rloppler reference DELTIC correlator may be employed to give almost optimum results There is no absolute range error or loss in correlationgain
For a widehand linear F M signal [11S]-[120] the effect of a moving target (constant range-ratgte) will producetranslational doppler and a changein the slope of the F31 signal The frequency-time slopes will be linear but not parallel Target acceleration [121]C1221 would introduce waveform curvature with additional echo dispersion from target rotation This will result in both an absolute range error and a loss in correlation When the doppler shift-pulselength (dispersion)product exceeds unity the peak signal amplitude at the correlator will be significantly reduced and the compressedpulse widened
The effect o f clipping reverheration is rather com-plicated If a linear FYI pulse is transmitted clipping the echo return will produce artificial LFRI sweeps which will generate falsc reverheration peaks as a function of time (range) in the correlator output tgthereby increasing the false alarm rate [117] This will degrade target track-ing and classifiration
A liueur or multileoel DE7TTIC correlutor is superior t o the clipped DELTIC for detecting multitargets particu-larly in an environmentcharacterized by multipaths andor high signal-to-noise ratios For a linear FM pulse a linear system will not suffer the incrcase in false alarm rate as occurs i n (slipped system However a multilevel
WINDER UNDERWATER SOUND 325
Fig 29 Bearing versus time recording of clipper correlator output
correlator requires a greater data handling capacity and more DELTICS than the clipped correlator
A linear DELTIC correlator is obtained by employing an AD converter after the receiver beamforming opera- tion and prior to t$ime-cornpression This quantization may also be applied to the reference signal although polarity information only ie a clipped DELTIC would suffice RIeasurements indicate that a amphit AD mnverter would be sufficient for quantizing trsquohe received echoes and masking hackgroundsunder most operatingconditions
An effective processing technique of linear FRI signals is post detection pulse compression (PDPC) Similar to theDELTIC correlator it compresses a received echo pulse to obtain the resolution of a short pulse without the necessity of transmitting a high peak power pulse Where it differs is that it operates in the frequencydomain through a combination of both coherent and incoherent processing
Thetransmitted signal is a stepped frequency pulse which approximates a linear F111 slide Aftrsquoer heamforming the received echo is sent to a comb filter hank Each filter passes the appropriate step frequency to which it is matched Each comb filter output is delayed by an amount
equal to its position in the sweep such that all outputs arein ldquophaserdquowitheach otherThe filtered-delayed frequency step is then incoherently detected or coherently detected by correlation and all outputs summed and sent to the display For small signal-to-noise ratios the processing gain of the system is approximately 8 log W T ThePDPC processoris suboptimum with respect to a linear crosscorrelator and has a poorer resolution capability for the same IYT-product however it is superior to an envelope detector-averager for the same total pulselength For the PDPC processor to operate properly the outputs of the comb filter bank must be normalized with respect to a fixed threshold
Passive Sonar Detection and Bearirlg Estimution The signal processing techniques generally employed
in passive sonar for broadbanddetectionarethe split-beam clipper correlator and the DIMTIS receiver The clipper correlator is also the basis of a split-beam tgtracker or bearingdeviationindicator (BDI) whose dc output can be used as an error signal to drive an automatic target follower (ATF) servo or as an input tjoa right-left indica- tor (RIA) meter to indicate bearing deviatrsquoion
326 IEEE TRANSACTIONS ON SONICS AND ULTRASONICS SEPTEMBER 1975
In a split-beamclipper correlator theoutputs corre-sponding to the two halves of the array are clipped cor- related and displayed on a bearing-time recorder which provides tracking information in addition to detection There is approximately a 3-dB loss due to beam splitting in general detection performance is slightly inferior to fullbeamenergydetectionPerformance is degraded if there is appreciable noise correlation between the two split beams Full spatial coverage is obtained by scanning the two half-beams through 360 -4scanning beam does not suffer from beam-to-beamunbalance and provides infinite bearing interpolation
The effect of clipping on arraydirectivitymay be significant and must be taken into account to effectively evaluate system performance [123] A clipper correlator is a function of the correlation coefficient between input signals The signals in turnandthusthecorrelation coefficient are functions of the arrays beam pattern For an input SNR ltlt 1 the structure and spatial properties of the beam pattern are preserved Houever for an input SNR gtgt 1 there is a distinct change in directivity due to clipping The output of a clipper correlator varies between +l and -1 independent of the amplitude sidelobe structure of the pattern This spatial normalization effect is enhanced for wideband inputs
A significant advantage of hard clipping in operational sonar is that ittendstoimprovesystem performance when there are large variations in noise power from hydro-phone-to-hydrophone resulting from the directionality andnonstationarity of background noise [124][125] This situation enhanced by machinery and flow noise is quite realistic An example of the normalization property of hard clipping is shown on the bearing-time recording in Figure 29 Approximately six targets areindicated whose SNR at the output of the beamformer range from about -4 to -13 dB The ambient noise background is seen to mark uniformly at all bearings which is necessary for maximum targetdetectionsensitivity The uniform correlated patterns in the lower and upper right of the recording are attributed to the arrays backlobe response to the strong targets indicated on the left Similar pat- terns are obtainedfor sinusoidal sources such as machinery and power line components
A DIMUS receiver is a one-bit digitalbeamformer whose multibeam outputsare energydetectedand dis-played on a bearing-time recorder The theoretical im-provement in the spatial average of the display with respect to a split-beam correlator is about 5 log (number of preformed beams) However at-sea results indicate that the operational threshold for a DIMUS receiver or a split-beam correlator is about the same with the DIMUS receiver having amuchpoorerbearingaccuracyAddi-tionalinformation on DIMUS can be found in Section G in the discussion on digital beamforming
For a Gaussian noise background the optimum likeli- hood-ratio processor for detection is a square-law (energy) detector followed by an integrator(smoothing j l t e r ) A
full-wave or half-wave linear rectifier can be used but its detectionperformance is somewhat poorer than that of the square-law detectorThe energydetector is incor- porated in both the split-beam correlator and the DIMUS receiver Inthe split-beam correlator the integration time is determined by the 3 d B beamwidth andscan speed In theDIMUS receiver the integrationtime is about 1-3 seconds to remove short-term noise fluctuations If the number of scansintegrated incoherently on the bearing-time recorder is ( n ) then the detection threshold (in dB) will be reduced by 5 log n In practice a t least a 14inch of line-to-line correlation or track history on the display is required before the operator can just discern the target (minimum detectable level)
If the split-beam outputs arephaseshifted 90 with respect to each other the system is referred to as a split-beamtracker or BDI The polarity and amplitude of the output correlation represents the direction and magnitude respectively of the error angle between the target bearing and the MRA of the array The split-beam tracker is very nearly optimal (in a maximum likelihood sense) for target bearingestimation when operating in aspatially inco-herent noise field [l26] If the noise field contains a strong plane-wave interference there will be an increase in fluctuation error and a bias introduced into the estimate This will seriously degrade performance If the inter- ference is spatially separated from the target by at least one-beamwidth then the interference can be removed by applying any oneof the appropriate adaptivebeamforming (ABF) techniques discussed in Section H If ABF is not effective then the bias will be amajorconstraint on performanceNearoptimal estimation can be obtained with a simple split-beam tracker with bias compensation [127]
Audio Receiver
The audio receiver is used for listening to target echoes and signatures and for receiving sonar telegraphy signals The operational function of audio in active sonar is ex- tremely desirable Sonar operators are often reluctant to identifyobvioustargets on thevideo display without audio confirmation the operators have an understandable desire to want to hear the echo thereby increasing their confidence level Operational results indicate that simul- taneous utilization of both the audio and video modes assumingeachhascomparable recognition differential can increase the effective system recognition differential by as much as 6 dB
The functional system diagram of a conventional audio receiver is shown in Figure 30 For apreformedbeam system the scan switch is replaced by a selector switch withallother operations remaining tmhesame The pre- amplifier-bandpass filtered outputs are fed to the stators of the audio scanswitch A delayline is mounted in- ternally on the rotors of the switch and the rotor signals are then properly shaded delayed and summedto provide a single beam output The position of the audio beam
327 WINDERUNDERWATER M U N D
RECEIVE OWN TARGET snw BEARING HEADSET
A
LOUD WEAKER
WITCH
Fig 30 Block diagram of conventional sonar audioreceiver
2P k 2 U 0S a
10 loo 1 m
ECHO LENGTH (mil l imnd1 FREQUENCY DIFFERENCE BETWEEN ECHO amp REVERBERATION (Hz1
echo midpoint 10amp 70 m - Britishdata 0 800 Hz pinpl nvrbaltion level m Cho loo0 Hzlisteningvel 80 db
mid-point 0 l M I O - H z p i n p m ~ M t h a t o f 3 6 amp 1 1 4 m - U C D W R 6 t a
PJrr in nbohmd of signal 800 Hz l i n i n g IndW db
PRESENT NO WPPLERDOPPLER
Fig 31 Aural recognition differential of echoes in reverberation
can be smoothly trained to any bearing by the respective position of the console target cursor Theaudiobeam is then corrected for own ship doppler as a function of relative target bearing and own ship speed on reception The bandpass filtered own doppler nullifier (ODN) output isfed to an autornatic gain control (AGC) receiver for signal processing and acoustic normalization Provision is usually made to disable the AGC and provide manual gain control for the audio receiver when the system is in the passive listen mode of operation A mixer translates the center frequency of the 4GC output to 800 Hz The audio amplifier provides the power capability for driving a loudspeaker and headset the amplifier is muted during transmission
The measured recognition differential is in approximate agreementwith that predicted according to theaural critical band model of the ear The critical band concept states that the masking behavior of the ear can be simu-lated by a predetection filter of bandwidth equal to that of the ldquocriticalbandrdquo at the frequency of the tone an energy detector of some sort and a low pass smoothing filter with a certain integration time At a frequency of 800 Hz studies of noise masking indicate that the critical
bandwidth of the ear is about 50 Hz and the integration time is of the order of one ( 1 ) second
For the case of zero target doppler trhe data in Figure31 shows that when ideal pulses or recorded beam echoes are injected in recordedreverberationbackgrounds the recognition differential improveswith increasing echo length The measured recognition differential of pings in reverberation backgrounds is also presented for different pinglengths and doppler shifts It is seen that when the sonar is reverberation-limited theaural recognition dif- ferential is a sensitive function of the frequency difference between echo and reverberation especially when trsquohey lie in different critical bands of the ear It is important to recognize that the plot is asymmetric with respect to opening and closing doppler targets and that the point of inflection occurs a t a frequency difference of about 50 Hz The corresponding value of targetrange-rate will dependupon thetransmitting frequency andtarget aspect
The simple audio receiver can thus provide on a single beam basis a recognition differential comparable to a relatively complex and expensive videosearch receiver for the initial detection of moving targets The advantage
328
of auraldetectionwith respect to conventional visual presentation is that thelatter provides no frequency discrimination against the backgroundfor initial detection (except possibly through color)Thecriticalbands of the ear correspond to a weighted spectrum analysis of the signal and background spectra This is particularly impor-tant when reverberation-limited since there is a very large improvement in recognition differential for a slight frequency difference between echo and reverberation The primary advantage of video search receivers is that they are multidimensional processors which includes multi- parameter estimation and target classification and inter-face with computer controlsystems Clearly the combined use of both video and audio would significantly enhance the initial detection capability of the sonar system over the entire range of target doppler
Systemperformancecanbe further improved by in-creasing the rate of change of aural recognition differential with frequency difference between echo and reverberation This may be accomplished by normalizing the reverbera- tion mean and variance in the critical band
K SYSTEMPERFORMANCEEVALUATION In echo-ranging applications performance is predicted
by computing the average echo excess for a specific prob-abi1ity of detection usually 50 percent The echo excess is defined as the sum of the figure-of-merit and target strength minus the two-way propagation loss and repre- sents the excess of echo over that required for detection The figure-of-merit is the source level of the sonar minus the minimum detectable signal level the latter depending upon the noise level prevalent at the array-water inter-face the directivity index of the receiving array and the detection threshold for the signal processor and display The echo excess formulation should include the effects of dome loss and system directivity the latteris expressed in terms of transmitting and receiving deviation losses
Unfortunatelythe sonar range equations presently used for system analysis areinadequate for predicting performance in an operational environment Some of the major inadequacies are the following
1) Thecomputed echo excess is merely an average value over large numbers of pings of sonar equipments of the particular type under consideration of sonar opera- tors and of targets There is thus a short-term and long-term variability associated with echo excess
2) Thetargetstrength is usually characterized by a single value independent of the sonaroperating mode andthe effects of target induced time and frequency spreading(commonly referred to as energy splitting)
3) Thedirectivity index is also usually characterized
XEEE TRANSACTIONS ON SONICS AND ULTRASONICS SEPTEMBER 1975
considerably for a moving platform as well as the sound velocity profile (requiring different time delays for beam-forming)
4) There is no provision for representing the effective- ness of gain control receivers and normalization circuitry
5) The effects of medium-target-sonarvariability on echo excess is not related to the performance of the search- track modas and corresponding displays
The above considerations are also appropriate in the evaluation of passive sonars if target strength variability is replaced with radiated signature variability Thepassive sonar equation(s) have been reformulated to include the beam-to-beam standard deviation of sidelobe levels and they relate the resulting bias effects to spoking on the bearing-time display
To summarize thesonarequations used to evaluate system performance should reflect the dynamics of sonar operation This requires that dynamical system measures be incorporated in the equations which include the con- cepts of echo formation array gain data normalization space-timevariabilityandprobability of detection contours
Echo formation is a function of the fine structural detail of the target the extended length of the target the target aspect the vertical incidence angle the pulselength the acoustic frequency andthesystem resolution These interrelationships have been investigated to some degree [l281 but have never been unified into a general target strength model This is required since the target strength is generally different when the sonar is operating in the detection track or classification mode
The significance of array gain and the importance of obtaining DRCK havebeen extensively discussed Both concepts are intimatelyrelated to at-sea measurements and hardware design
The space-time variability in system performance may be attributed to thefluctuations in the figure-of-merit the target strength and propagation loss The figure-of-merit variability is caused by differences in system equipments and sonar operators and by fluctuationswithin the detec- tion process attributed to factorssuchasthe direction of the cursor with respect to the direction of the echo and the (closing or opening)speed of the target The target strengthvariability is causedby differences in target structure highlights and aspect angles The propagation loss variability is caused by ping-to-ping fluctuations and the imperfect formulation relating propagation loss to the actualenvironmentThecumulative effect is often re-ferred to as the long-term variability in echo excess In the case of sequential pings the target sonar system and operatorremainunchanged so thatthe only source of
by a single value depending only upon the array geometryvariability is the fluctuation in propagation loss This is and dimensionality acoustic wavelength and a particular sound velocity assumed for determining the time-delays inbeamformingHowever in practice the spatial dis-criminating properties of the sonar are influenced by the character of the signal and noise fields which can change
referred to as the short-term variability anddepends upon the character of the masking background
All of the above parameters must be evaluated in order to obtain areasonable accuracy in predicting performance The target strength array gain and DRCK factor deter-
329 WINDERUNDERWATERSOUND
mine the instantaneous echo excess This together with the error distribution of echo excess due to variability define the probability of detection contoursThese con-toursexistinrangeazimuth and doppler and maybe related to corresponding displays inthesystemThey will establish in a dynamical sense the relative effective- ness of the sonars search and track modes This may be illustrated by the following scenario of on-board operation
The target is initially detected on the search display eithera PPI or B-scan The operatorputs the display cursor on the target which will bring the acoustic field about the cursor to the track displays on the next ping The objective is to obtain accurate target azimuth and doppler information for mission-control However on the next ping the target is lost on either the doppler display andor the azimuth display (sector scan indicator) The fact that a target may be easily detectable on one display and not on another may be demonstrated by the prob- ability of detection contours a target may be on the peak of one contour while being in the null or valley of another
The probability of detectioncontoursrepresenta significantimprovement in computing and measuring system operational performance Although the probability ofdetectionversusrangecontourhasbeenutilized in systemanalyseswith some degree of success extending this concept to otherinformationalvariablesnamely azimuth and doppler will complete the picture for open+ tional assessment Optimum system design would then be concerned with finding the global maxima on the multi- dimensional surface defined by the contours
L CONCLUDINGREMARKS In this review we have describedvariousfunctional
operations employed in sonarsystems andhavealso indicated some areas for further investmigation The most significantdevelopmentssince 1960 havebeenin the area of spatial processing In particular space and signal diversitydigitaltechnologyadaptivecontroland non-linear acoustics have been applied successfully to beam- formingThis work is continuing and it includes the utilization of logical switching algorithms andthe en-hancement of fine detail information via maximum entropy criteria
In recent years considerable attention has focussed on multichannelsignal processors utilizinghigherorder statistics for signal detection parameter estimation and waveform estimation It should be noted that very often the most excitingaspects of temporal signal processing is the theory and what one designs for rather than whatis achieved in the field The problem is usually not in the theory but in the integration of system disciplineswith the constraints of the physical medium In practice most losses occur at interfaces characterized bya change in the form of energy namely at the array-water processor- display and display-operator interfaces
A recurring theme of this paper has been the require-ment for and the operational design of dynamicrange
compression and normalization in sonar receivers These techniquesshouldbeextended to include higherorder gaincontrolcharacteristics andadaptive doppler nor-malization in both the video and audio mode
One important trend in sonar design is the requirement forgreaterreliabilityandmaintainabilitytherebyin-creasing system availability Thisis defined quantitatively by the mean-time-between-failures and the mean-time-to- repair A related area is the availability of the sonar plat-form itself which specifies the need for anautomated system for performancemonitoringdirectcontrol and maintainance planning of the marine power plant Simi- larlyampIitude and phase tolerances of the electronic components and array elementsestablish the feasibility in approachingtheoreticalacousticperformance The primarylimitations on achieving the designed accuracy in range bearing and range rate are the errors introduced by the propagating medium and sonar operator
The growing interplay between manandcomputer points to the development of a computer-aided display A software controlled display system would facilitate signal detectionmultitargettrackingmonitoring processed video data and control of data formats and would also beamenable tofuture systemgrowthThis is the first step in realizing receiver-transmitterfeedback an in-formation link from the receiver to the transmitter which would automatically control subsequent signal parameters and transmission and propagation modes Another obvious direction is the utilization of the fast Fourier transform (FFT) for beamforming in the frequency domain and for narrowband processing of acousticradiatedsignatures
It is hoped that this review will facilitate understanding of the significance and limitations of the present state of the art in sonar technology and provide a basis for which further progress might take place The references given were not intended to be conclusive but to recognize out- standing contributions and unique approaches The treat-ment of the acoustic channel was highly influenced by the work of Marsh The discussions on conventional beam- forming and d-ynamic range compression and normalization were summarized from C1291 and [130] respectively
ABBREVIATIONS ABF Adaptive beamforming A D Analog to digital AGC Automatic gain control ATF Automatic target follower BD1 Bearing deviation indicator CFAP Constant false alarm probability CFAR Constant false alarm rate CRT Cathode ray tube CTFM Continuoustransmissionfrequency modu-
lation cw Continuous wave (pulsed) DELTIC Delay line time compressor DF Directivity factor D1 Directivity index
330
DICANNE Digital interference cancelling adaptive null network
DIMUS Digital multibeam steering DRCN Dynamicrange compression and normali-
zation DSL Deep scattering layer FTC Fast time constant differentiator LFM Linear frequency modulation LR IJikelihood ratio MD1 Maximum directivity index MRA Maximum response axis ODN Own doppler nullifying PDPC Post detection pulse compression PFB Preformed beam PPI Plan position indicator PRN Pseudorandom noise RAP Reliable acoustic patjh RCG Reverheration controlled gain RDI Rotational directional transmission RL1 Right-left indicator RSR Refracted surface reflected SLE Sidelobe elimination SNR Signal to noise ratio SOFAR Sound fixing and ranging(deepsound
channel) SRE Shift-register encoder STN Spatial threshold normalization TVG Tinle-varied gain VC0 Voltage-controlled oscillator WT Bandwidth-time product
REFERENCES [l] American Standard Acoustical Terminology Sl1-1960 New
York American Standards Association May 25 1960 121 J Klauder A Price S Darlingtonand W Albersheim
ldquoThe Theory and Design of Chirp Radarsrdquo BSTJ Vol 39745-808 July 1960
[3] J L Stewart W H Allen R M Zarnowitz and M K Brandon ldquoPseudorandom Signal-Correlation Methods of Underwater Acoustic Research I Principlesrdquo JASA Vol 37 1079-1090 June 1965
141 RH Cole ldquoUnderwater Explosionsrdquo Princeton UniversityPress 1948
[51 C Polk ldquoTransient Behavior of Aperture Antennasrdquo IRE P T O C Vol 48 1281-1288 July 1960
[6] J PachnerldquoInstantaneousDirectivityPatternsrdquo JASAVol 28 1956
[7] M C Junger ldquoEnergy Exchange Between Incompressible Nearand Acoustic Far-Fieldrdquo JASA Vol 40 10251030 1966
[8] R Hickling ldquoAnalysis of Echoes froma Hollow Metallic S here in Waterrdquo JASA Vol 36 1124-1137 June 1964
[9] 8 B Officer ldquoIntroduction to theTheory of SoundTrans-mission with Application to the Oceanrdquo McGraw-Hill New York 1958
[l01 I M -
I3rekhovskikh ldquoWaves inLayered Mediarsquorsquo Academic Press Inc New York 1960
1111 R J Urick ldquoPrinciples of Underwater Sound for EngineersrdquoMcGraw-Hill New York 1967 Chauters 5 and 6
[l21 B F Cole ldquoMari)re Sediment AttenGation and Ocean-Bottom- Reflected Sound Proc 68th Meeting of the Acoustical So-ciety of AmyiFa October 1964
(131 F E Hale Long-Range Sound Propagation in the Deep Oceanrdquo JASA Vol 33 456464 1961
(141 R J Tirick rdquoCaustics and Convergence Zones in Deepwater Sound Transmissionrdquo JASA Vol 38 348-358 1965
[l51 MEwingand J L Worzel ldquoLong-range Sound Transmis-sionrdquo in ldquoPropagation of Sound in the Oceanrdquo Geological Society of America Mem 27 1948
IEEE TRANSACTIONS ON SONICS AND TTLTHASONICS S E P T E M B E R 1975
[l61 P Hirsch and A H CarterldquoMathematical Models for the Prediction of SOFAR Propagation effect^ JASA Vol 3790-941965
[l71 D A MurphyldquoStudy of Arrival Angles for ldquoRSR-typerdquoEnergy Received on a Model Sloping Ocean Bottomrsquorsquo JASAVol 35 1879 1963
[l81 J W Horton ldquoFundamentals of Sonarrdquo 1J S Naval Insti-tute Annapolis 1957 Chapter 3
[l91 N L Liebermann ldquoThe Origin of Sound Absorption in Water and in Sea Waterrdquo JASA Vol 20 868 -873 1948
1201 M Schulkin and- H W Marsh ldquoSound Absorption in Sea Waterrdquo JASA Vol 34 864-865 1962
[21] R J Urick ldquoLow Frequency Sound Attenuation in the DeepOceanrsquorsquo JASA Vol 351413--14221963
[22] W H ThorpldquoDeep Ocean Sound Attenuation in the Sub- and Low-Kilocycle-per-second Regionrdquo JASA Vol 38648 1965
[23] M J Sheehy and R Halley ldquoMemurement o f the Attenua-tion of Low-Frequency Underwater Soundrdquo JASA Vol 29464 1957
[24] H W Marsh and S R Elarn ldquorsquoIrsquohe Illfornlation Content of SignalsrdquoPresented a t the NATO Advanced Study Institute on StochasticProblems in Tinderwater Sound Propagation Lerici (Italy) September 18 23 1967
[25] R SThomas ldquoLimitations Imposed on Signal Processing in Near-Surface EchoRanging Systems by a Time Varying Medium and Target and by Reverberationrdquo Presented at the KAT0 Advanced Study Institute on Stochatic Problems in UnderwaterPropagation Im-ici (Italy) Sttptember 18-231967
[26] R-H Mellen ldquoDo pler Shift of Sonar Backscatterfrom the Sea Surfacerdquo JASf Vol 36 1395 19fX
[27] H W Marsh R H Mellen and W 1 Kor~ratlldquoAnomalous AbsorDtion of Pressure Waves from Exnlosions in Sea Waterrdquo JASArsquo Vol 38326-3381965
[28] D T BlackstockldquoApproximate Eqr~ations Governing Finite Amplitude Sound in Thermoviscolw Ersquolrlidsrdquo AFOSR-5223 Sup 1 Tech Report May 1963
[29] J 8 Stersquolnberg and T G Hirdsd ldquoTTnderwater Sound Propagation in the Straitv of Floritlardquo J B S A Vol 39 301- 315 1966
[30] J LStewartandMK Brandon ldquoRandom Medium Correlation Lossrdquo Presented at the NAlsquoIrsquoO Advanced Study Institute on StochasticProblems in Tnderwater Sound Propagation Lerici (Italy) Septemljcr 18 -23 1967
[31] D E WestonldquoPropagation of Sound i n Shallow Waterrdquo ProcSymposium on Sonar Systems 13irmirlgham (England) 9-11 July 196
[32] D E Weston Horizontal Refraction in L Three-lknensional Medium of VariableStratificationrdquo P m r Phys hrsquooc London Vol 78 46G52 July 1961 D Micfleton ldquoStatistical Models o f Iteverberationand Clutter Tech Rept TR65-2-RF 15 April 1965 Titton Systems Inc ldquoPrinciples of Underwater S o u I d rdquo Nail Ucfense Res Comm Div 6 Sum Tech ReDt Vol 7 10--98 1947 P Faure ldquoTheoreticalrsquo Motlei of deverberation NoiserdquoJASA Vol 36 259-266 1964 R P ChapmanandJH Harris ldquoSllrfwc Backscattering Strengths Measured With Explosive Sound Sourcesrdquo Vol 34 1592-15971962 C S Clay and H Meclwin ldquoHigh-Frequency Acoustical Re-verberation from a Rough-Sea Surfacerdquo JASA Vol 36 2131-21341964 R J Urick ldquoBackscattering of Sou11~11~rsquororna Harbor Bot-tomrdquo JASA Vol 26 231 1954 CM McKinneyand C D Antlerbon ldquoMeasurements of Backscattering of SoundFrom the Ocean Ihttomrdquo JASAVol 3615amp1631964 K V Mackenzie ldquoBottom1tevcrlxrttlon for 530 and 1030 cps Sound in Deep Waterrdquo JASA Vol 3 3 1498--15041961 H W Marsh ldquoReflection and Scattering of Sound by the Sea Bottomrdquo Proc 68th Meeting o f thc Acoustiral Societyof America October 1964 CF Eyring R J Christensen and R W h i t t ldquoReverbera-tion in the Seardquo JASA Vol 20 162 1918 J R Marshall and R P Chapman ldquoKcverheration From a DeepScattering 1ayer Measured W i t h Explosive Sound Sourcesrdquo JASA Vol 36 164-167 1964 S A Schelkunoff ldquoA Mathematicl Theory o f Iinear Arraysrdquo BSTJ Vol 22 80-107 January 1443 J W Horton ldquoFundamentals of Sonarrdquo IJnitJetl States Naval Institute 17amp1761957 S Matt and J D Kraus lsquo T h e Effwt o f tlkc Source Distribu- tion on Antenna Patternsrdquo I RE Irsquoroc 821-825 July 1955
331
1
WINDER UNDERWATER SOUND
[47] J F RamseyldquoFourier Transforms in Aerial TheoryrdquoMarconi Rariew No 83139 No 8417 No 8 5 41 No 8 6 81 No 87 157 No 8945 1946-1948
[48] P M Woodward ldquoA Method of Calculating the Field Over a Plane Required to Producea Given Polar Diagramrdquo JZEE Vol 93 Part I11 A 1554-1561 September 1959 W E Kock and J L Stone lsquo Space-Frequency Equiva- lencerdquo ZRE PTOCVol 46 499-500 F b r u a r y 1958 J W Horton ldquoFundamentals of Sonar United States Naval Institute 180-205217-221228-2361957 R L PritchardldquoDirectivity of Acoustic Linear Point Ar- raysrdquo Tech Memo 21 Acoustics Research LaboratoryHarvard University Chapter IV January 15 1951 E J Powers Jr ldquoAnalysis and Synthesis of a General Class of Difference Patternsrdquo Tech Rept No 8 Research Laborac tory of Electronics MIT July 30 1959 S S Sandler ldquoSome Eq$valence Between Equally and Un- equally Spaced Arrays ZRETrans m Antennasand Propagation 496-500 September 1960 R F Harrington ldquoSidelobe Reduction by Non-Uniform Element hacinerdquo IRE Trans Vol AP-9 187-192 MarchL1961
I
D D King R F Packard and R K Thomas ldquoUnequally Spaced Broadband AntennaArrays ZRETrans Vol AP-8 380-385 July 1960 D L Jagerman and L F Fogel ldquoSome General Aspects of the Sampling Theoremrdquo ZRETrans Vol IT-2 139-145 December 1956 J L Y ldquoOn Non-Uniform Sampling of Bandwidth-Limited Signals IRE Trans Vol CT-3 251-257 December 1956 J L Yen ldquo9n the Synthesis of Line-Sources and Infinite Strip-Sources ZRETrans on AntennasandPropagatimJanuary 1957 P L Storklin Lecture on Space-Time Sam ling Delivered a t TheNATO Advanced StudvInstituteerenoble France 14-26 September 1964 B Cron and G Becker ldquoGain of a Three-Dimensional Array in a Directional Noise Fieldrdquo USNUSL USL Rept No 71013 A ril 1966 B 8 o n and C Sherman ldquoS atial-Correlation Functions for Various Noise Modelsrdquo JASK) Vol 34 1732-1736 November 1962 C EckartldquoTheTheorv of Noise in Continuous Mediardquo J A S A Vol 25195-199-March1953 H W Marsh ldquoCorrelation inWaveFieldsrdquoUSL QuarterlyReport Part 11 63-68 l October 1949-31 March 1950 B F Cron B C Hassell and F J Keltonic ldquoComparison of Theoretical and Experimental Values of Spatial Correlationrdquo J A S A Vol 37 No 3 523-529 March 1965 J J Faran and R Hills ldquoWide-band Directivity of ReceivingArraysrdquo Acoustic Research Laboratory Harvard UniversityTech Memo 31 May 1953 R LPritchard Directivity of Acoustic Linear Point Ar- raysrdquoTech Memo 21 Acoustics Research LaboratoryHarvard University Chapter V January 15 1951 N Yaru ldquoA Note on Su er Gain Antenna Arraysrdquo ZRE Proc Vol 39 10l-1085 8eGember 1951 G T DiFrancia Directivity SuperGain and InformationrdquoElectromagnetic Wave Symposium 463 July 1956 D G Tucker ldquoThe SignalNoise Performance of Super-Directive Arraysrdquo Awustica Vol 8112-1h61958 V CAnderson ldquoDigitalArray Phasing J A S A Vol 32867-8701960 P Rudnick ldquoSmall Signal Detection in the DIMUS Arrayrdquo J A S A Vol 32 871-877 1960 B Picinbono ldquoAlteration of Directivity by Clipping in Passive Detectionrsquorsquo Proc NATO Advanced Study Institute on Signal Processing with Emphasis on Underwater Acoustics Grenoble France 14-26 September 1964 J Max rdquoQuantizing for Minimum Distortionrsquorsquo ZEEE Trans PGIT-6 7-12 March 1960 R Widrow Analysis of Amplitude-QuantizedldquoStatisticSampled-Data Systems Tech Rept 2103-1 Stanford Elec- tronics Lab 10-39 10 May 1960 A I Velickin ldquoOptimum Characteristics of QuantizersrdquoRadio Eng 1-7 February 1963 A M Vural ldquoEffects of Signal Quantizing on Beamformer PerformanceTechInform Ser Rep R67EMH33 General Electric Co Heavy Electronics Dep Syracuse N Y9-11 November 1967 A H Nuttall ldquoSpectrum Reproduction Capability of a Beam-former withMultibit Quantization and Samplingrsquorsquo Tech Rep MS2381 Litton Systems Inc Van Nuys Calif 1-37September 1967 A M Vural ldquoEffects of Signal Quantization on the
Performance of Multichannel Processing Systemsrdquo J A S A Vol 46 293-313 1969
[79] V C Anderson ldquoDICANNE A Realizable Adaptive Processrdquo J A S A Vol 45 398-405 1969
[SO] V C Anderson and P RudnickldquoRejection of a Coherent Arrival at an Arrayrdquo J A S A Vol 45 406-410 1969
[81] F Bryn ldquoOptimum Signal Processing of Three-Dimensional Arrays Operating onGaussian Signals and Noiserdquo J A S A Vol 34 289-297 1962
[82] H Mermoz ldquoMatched Filter and Optimum Use of an Arrayrdquo Proc NATO Advanced Study Institute on Signal Processing withEmphasis on Underwater Acoustics Grenoble France 14-26 September 1964
[83] S W W Shor ldquoAdaptive Technique to Discriminate AgainstCoherent Noise in a Narrow-Band Systemrdquo J A S A Vol 3974-781966_~ ~
[ 8 4 ] J P -
rsquoBurg ldquoThree-Dimensional Filtering with anArray of Seismometersrdquo Geophysics Vol 29 693-713 1964
[Ss] B Widrow P E Mantey L J Griffiths and B B Goode ldquoAdaptiveAntenna Systemsrdquo ProcZEEE Vol 552143-21591967
[86] L Jrsquo Griffiths ldquoA Simple Adagtive Algorithm for Real-Time Processing in Antenna Arrays ProcZEEE Vol 57 1696- 1704 October 1969
[87] A Ksienski G G Comisar and 0 R Price ldquoLogical Pattern Synthesisrdquo Microwave Laboratory Hughes Aircraft Com-y y Culver City California IRE Wescon Conv Record
art I 1959 32-39 [88] B Y Mills and A G Little ldquoA High Resolution Aerial
System of a New Typerdquo Australian J Phys Vol 6 272 1953 [89] W H Kummer A T Villeneuve T S Fong and F G
Terrio ldquoUltra-Low Sidelobes from Time-Modulated ArraysrsquorsquoZEEE Trans on Antennas and Propagation 633439 Novem-ber 1963
[90] J L Lawson and G E Uhlenbeck ldquoThreshold SignalsrdquoDover Pub Inc Chapter 11
I911 ldquoUnderwaterSound Equipment 11Echo-RangingSystemsrdquoVol 15 Summary Technical Report of Division 6 NDRC1946
1921 B-M Oliver ldquoAutomatic Volume Control as a Feedback Problemrdquo ZRE Proc Vol 36 466473 April 1948
1931 W F Chow and A P SternldquoAutomatic Gain Control of Transistor Amplifiersrdquo ZREProc Vol 431119-1127 September 1955
[94] R H Delano and I Pfeffer ldquoThe Effect of AGC on Radar Tracking Noiserdquo ZRE Proc 801-810 June 1956
[95] J C G Field ldquoThe Design of AutomaticGainControl Systems for Auto-Tracking Radar Receiversrdquo The Institution of Electrical Engineers Monograph No 258 R 93-108 October 1957
[Ss] J H Dunn and D D Howard ldquoThe Effects of Automatic Gain Control Performance on the Tracking Accuracy of Mono- pulse Radar Systemsrdquo ZREProc 43amp435 March 1959
[97] J Croney ldquoClutter on Radar Displays Reduction by Use of Logarithmic Receiversrdquo WirelessEngineer Vol 33 83-96 1956
[98] R H Pragerand F L Reese ldquoApplications of Logarithmic Receivers to Signal Detection in Nonstationary Backgroundsrdquo NEL Report 1098 18 January 1962
1991 V GHannsen lsquolsquoStudies of LoearithmicRadar Receiver Using Pulse-Length Discriminationrdquordquo IEEE Trans Aero and E k d Syst Vol AES1 246-253 1965
[l001 B A Green Jr ldquoRadar Detection Probability with Logarith- mic Detectorsrdquo I R E Trans Znjo Theory Vol IT4 5amp52 1958
[loll I Jacobs ldquoThe Effects of Video Clipping on the Performance of an Active Satellite PSK CommunicationSystemrdquo IEEE Trans Commun Tech Vol COM-13 1965
[l021 W B DavenportJr ldquoAn Introduction totheTheory of Random Signals and Noiserdquo McGraw-Hill June 1958 Chapter 13 J H Van Vleck ldquoThe Spectrum of Clipped Noiserdquo Radio Res Lab Harvard Univ Rept 51 21 July 1943 W B Davenport Jr ldquoSignal-To-Noise Ratio in Band-Pass Limitersrdquo J Appl Phys Vol 24 720-727 1953 J L Sevy ldquoThe Effect of Hard Limiting an Angle-Modulated Signal Plus Noiserdquo IEEE Trans Aero and Elect Syst Vol AES-4 24-30 1968 J J JonesldquoHard-Limiting of Two Siqnals in Random Noiserdquo ZEEE Trans on Info TheoryVol IT-93442 1963 W R Remley ldquoSome Effects of Clipping on Array Proc- essingrdquo J A S A Vol 39 702-707 1966 W W Peterson T G Birdsall and W C Fox ldquoThe Theoryof Signal Detectabilityrdquo ZRETrans on Info Theory Vol 4 171-212 September 1954
E L Lehman ldquoTesting Statistical Hypothesesrdquo Wiley New York 1959 D 0 North ldquoAnalysis of the Facto which Determine SignalNoiseDiscrimination inRadarReportPTRGCRCA Laboratories 1943 I A Zadeh and J R Ragaseini ldquo0 timumFilters for the Detection of Signals in Noiserdquo I r R 8 eurolsquoroc Vol 40 1223- 12311952 G L Turin ldquoAn Introduction to Matched Filtersrdquo ZRE Trans Vol IT-6 311-330 June 1960 J I Stewartand E C Westerfield ldquoA Theory of Active Sonar Detectionrdquo ZRE Proc Vol 47 872-881 1959 E C Westerfield R H Prager and JL Stewart ldquoProcessing Gains Against (Clutter) MatchedReverberation UsingFiltersrdquo IRETrans on InfoTheory Vol 6 342-348 Tllnp- --- 1MO- -
[l151 V I
C Anderson ldquoDELTIC Correlatorrdquo Harvard Acoust 1ab Tech Memo No 37 5 Januar 1956
[l161 W B Allen and E C Westerfield ldquofligital Compressed-Time Correlators and Matched Filters for Active Sonarrsquorsquo JASA 1lsquo01 36121-139 JerlU 1964
11171 C van Schooneveld drrelator Technologyrdquo Presented at theNATO Advanced Study Institute on Signal Processing withEmphasis on Underwater Acoustics Enschede (TheNetherlands) 12-23 August 1968
[l181 S A Kramer ldquoDo pler and Acceleration Tolerances of High-Gain WidebandLinear FM Correlation Sonarsrdquo I E E E Proc Vol 55 627-636 May 1967
[l191 B Harris and S A Kramer ldquoAsym totic Evaluation of the Ambiguity Functions of High-Gain Fh Matched Filter Sonar Systemsrdquo ZEEE Proc Vol 56 2149-2157 December 1968
[l201 T Glisson C Black and A Sage ldquoOn Sonar Signal Analysisrdquo
IEEE TRANSACXTONS ON SONICS AND ULTRASONICS SEPTEMBER 1975
IEEETrans Aero and Elect Syst Vol AESG 37-50
[l211 i ic tnd RP Wishner ldquoMatched Filter Theory for High-Velocity Accelerating Targetsrdquo IEEETrans Mil Eleet Vol MILS 56-69 January 1965
[l221 D E WestonldquoCorrelation Loss in Echo Rangingrdquo JASAVol 37 119-124 January 1965
[l231 B Picinboo ldquoAlteration of Directivity by Clipping in Passive Detection Proc NATO Advanced Study Institute on Signal Processing with Emphasis on Underwater Acoustics Grenoble (France) September 14-26 1964
[l241 J B Thomas and T R Williams ldquoOn the Detection of Sig-nals in Nonstationary Noise by Product Arraysrdquo JASA Vol 31 453462 1959
[l251 T Usher Jr ldquoSignal Detection by Arrays in Noise Fields with Local Variationsrdquo JASA Vol 36 1444-1449 1964
[l261 V H MacDonald and P M Schultheiss ldquoOptimum Passive Bearing Estimation in a Spatially Incoherent Noise Environ- mentrdquo JASA Vol 46 July 1969
[l271 V HMacDonald ldquoOptimum Bearing Estimationwith PassiveSonarSystemsrdquoPhDDissertationYale Univer-sity 1971
[l281 A Freedman ldquoThe High Frequency Echo Structure of Some SimleBodyShapesrdquo A c o u s l i ~ ~ ~ o l 1261-701962
[l291 A xWinder and C J Loda Introductionto Acoustical Space-Time InformationProcessingrdquo Office of Naval Re-search ONR t ACR63 January 1963
[l301 A A Winder bynamic Range Compression and Normaliea- tion in Sonar Receiversrdquo Presented at the NATO Advanced Study Institute on Signal Processing with Emphasison Under-water Acoustics Enschede (The Netherlauds) 12-23 August1968
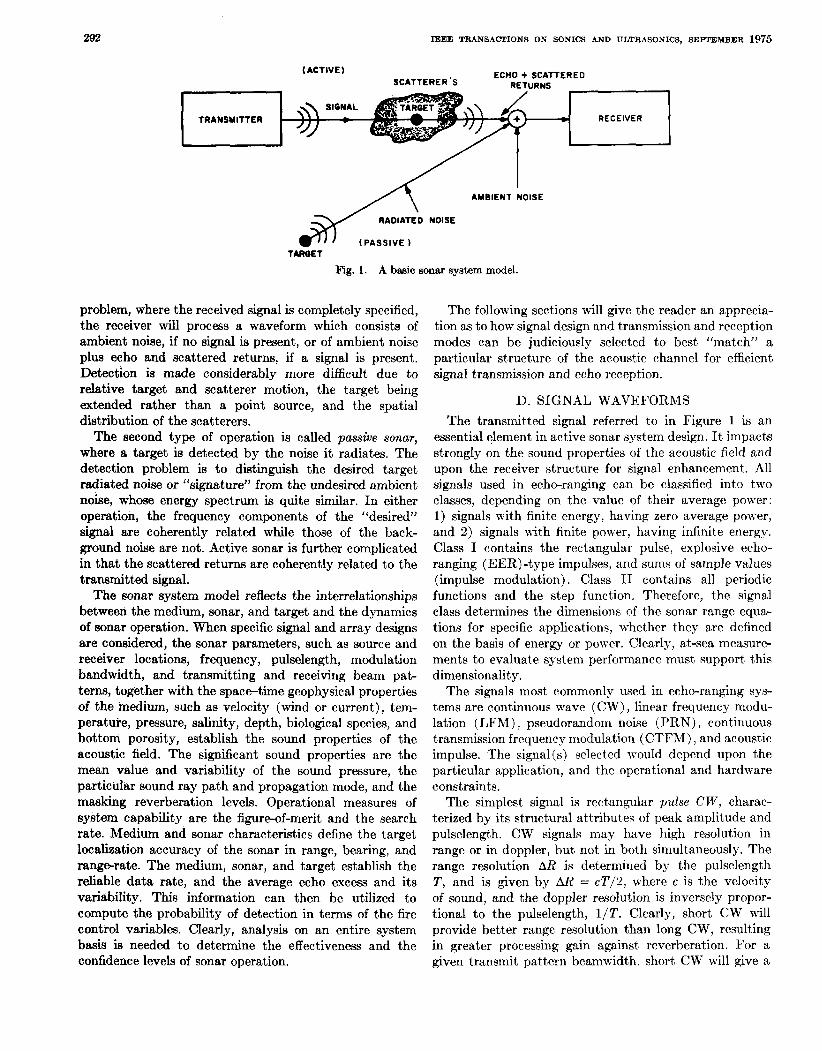
IEEE TRANSACTIONS ON SONICS AND ULTRASONICS SEPTEMBER 1975
A I AMBIENT NOISE
RADIATED NOISE
(PASSIVE T m fT
Fig 1 A basic sonar system model
problem where the received signal is completely specified the receiver will process a waveformwhich consists of ambient noise if no signal is present or of ambient noise plus echo and scatteredreturns if a signal is present Detection is made considerably more difficult due to relativetargetandscatterermotionthetargetbeing extended rather than a point source andthespatial distribution of the scatterers
The second type of operation is called passive sonar where a target is detected by the noise it radiates The detectionproblem is to distinguish the desired target radiated noise or ldquosignaturerdquo from the undesired ambient noise whose energy spectrum is quite similar In either operation the frequency components of the ldquodesiredrdquo signal are coherently related while those of the back- ground noise are not Active sonar is further complicated in that the scattered returns arecoherently related to the transmitted signal
The sonar system model reflects the interrelationships between the medium sonar and target and the dynamics of sonar operation When specific signal and array designs are considered the sonar parameters such as source and receiver locations frequency pulselength modulation bandwidthandtransmittingand receiving beam pat- terns together with the space-time geophysical properties of the medium such as velocity (wind or current) tem- peratuie pressure salinity depth biological species and bottom porosity establish the sound properties of the acoustic field The significant sound propertiesarethe meanvalueandvariability of the sound pressure the particular sound ray path and propagationmode and the maskingreverberation levels Operational measures of system capability are the figure-of-merit and the search rate Medium and sonar characteristics define the target localiiation accuracy of the sonar in range bearing and rangerate The medium sonsr and target establish the reliable data rate and the averageecho excess and its variabilityThisinformationcanthenbe utilized to compute the probability of detection in terms of the fire control variables Clearly analysis on an entiresystem basis is needed to determine the effectiveness and the confidence levels of sonar operation
The following sections will give the reader an apprecia- tion as to how signal design and transmission and reception modes can be judiciously selected to best ldquomatchrdquo a particularstrsquoructure of the acoustic channel for efficient signal transmission and echo reception
D SIGNAL WAVEFORMS Thetransmitted signal referred toinFigure 1 is an
essential element in active sonar system design It impacts strongly on the sound properties of the acoustic field and upon the receiver structure for signal enhancement All signals used in echo-rangingcan be classified into two classes depending on the value of their average power 1) signals with finite energy having zero average power and 2) signals with finite power having infinite energy Class I containstherectangular pulse explosive echo-ranging (EER)-type impulses and sums of sample values (impulsemodulation) Class I1 containsall periodic functions andthestep function Therefore the signal class determines trsquohe dimensions of the sonar range equa- tions for specific applications whether they are defined on the basis of energy or power Clearly at-sea measure- ments to evaluate system performance must support this dimensionality
The signals most commonly used in echo-ranging sys-tems are continuous wave (CW) linear frequency modu-lation (LFM) pseudorandom noise (PRN) continuous transmission frequency modulation (CTFRI)and acoustic impulse The signal(s) selected would depend upon the particular application and the operational and hardware constraints
The simplest signal is rectangular pulse C W charac-terized by its structural attributesof peak amplitude and pulselength CW signals may havehigh resolution in range or in doppler but not in both simultaneously The range resolution AR is determined by the pulselength Tand is givenby AR = c T j 2 where c is the velocity of sound and the doppler resolution is inversely propor- tional to the pulselength 1T Clearly short CW will provide better range resolution than long CW resulting ingreater processing gain against reverberation For a given transmit pattern beamwidth shortrsquo CW will give a
293 WINDER UNDERWATER SOUND
FREOUEWCVWlFT FREOUENCY SHIFT (VELOCITY) w n r c w LFM (VELOCITY1
LONG cw TIME DELAY 0 (RANGE1
(AI LOW-DOPPLER TARGET (B1 HIGH-DOPPLERTARGET
Fig 2 Ambiguity functioncomparingeffectiveneas of short CWlong CW and linear FM signamp
higher search rate and a shorter blind zone and will be moredetectionresistant On the otherhand longCW will have better doppler resolution which is more effective in detecting high doppler targets (both in the video and audio modes) The longer pulse will also reduce the false alarm rate under noise-limited conditions in beam scan- ning for a givenspatial coverage a shorter pulse will resultina higher data rateThedataand false alarm ratesare measures of system performance andtactical effectiveness In practice the sonar operator will have several pulselengths to choose from for optimizing target detection track and classification Experiments indicate that amplitude pulse shaping such as Gaussian or cosine-squared will significantly suppress the reverberationas compared to that generatedwith the rectangular pulse
Linear F M is characterized bytheuniqueproperty thatthe instantaneousfrequencyvarieslinearlywith time [a] Operational results in recent years have shown that modulated signals such aslinearFMare more effective than CW for detecting low doppler targets under reverberation-limited conditions This canbe seen by examining the ambiguity functionwhich is the squared magnitude of the autocorrelation function of a signal with respect to displacements in both time delay and doppler shift The ambiguity functions of short CW long CW and linear FM signals are shown in Figure 2 to illustrate their relative effectiveness in detecting low and high doppler targets The linear FM signal is assumed to have a pulse- lengthand modulation bandwidth equal to that of the long and short CW pulses respectively For a low doppler target(T) linear FM is seen to have theleast signal ambiguity area within the reverberation band (as defined by the dashed lines) This partially explains why linear FM has greater target detection sensitivity of low doppler targets When the target has sufficient doppler to remove it from the reverberation band only the long CW pulse is completely outside the band portions of the short CW andlinearFMcontoursarestill reverberation-limited Therefore the long CW pulse is most effective for detect- ing high-doppler targets At present both pulse CW and linear FM are used in sequential transmission to cover both noise-limited and reverberation-limited conditions for the full target doppler spread
Thelinear FM signal possemes range and doppler resolution ambiguities located along an inclined axis A single LFM echo represents a linear combination of these ambiguities and does not provide an unambiguous deter-mination of either A uniquedopplerdetermination can be made by processing several LFh4 echoes or by trans-mitting a trapezoidal-type sweep
Modulated signals of bandwidth W can resolve targets within AR = c 2 W The effective range resolution of the system is themajor lobe width of the autocorrelation function after coherent processing Since the pulselength- modulation bandwidth product is usually much greater than unity for equal range resolution linear FM has an inherentbetter doppler resolution than pulse CW and reduces the peak power constraint on transmitter design relative to CW (assumingconstantenergy) For equal doppler resolution (equalpulselength)thelinear F range resolution is superior thereby providinggreater processing gain against reverberation
In practice the LFM pulselength is usually longer than that for CW For equal search rates defined as the ratio of transmitting beamwidth to pulselength the modulated signal will have a wider beamwidth transmission resulting in a lower source level However this will not affect target detectionunder reverberation-limited conditions The CW transmission will be chara(Acrized by a shorter pulse- lengthnarrowerbeamwidth and higher source level which will enhance target detgtection when noise-limited For the same processing threshold with noise masking the longer FM pulse will reduce the false alarm rate
A pseudorandom noise ( P R N ) signal provides simul- taneous resolution in range and doppler which permits one to resolve multipaths and discriminate against rever- beration [S] A PRN pulse is generated by a shift-register encoder (SRE) comprised of a digital shift register with a feedback loop containing a modulo-l adder The adder performs the logical function AR + AB where A is the state of the (n- i )th stage and R is the state of the nth stage and the summed output is used to determine the state of the reset stage For certain values of n and i the maximum PRN code formed by an n-stage SRE consists of 2 - 1 bits before repeating The Fourier spectmm of the output sequence is discrete of sin r formwith spectral lines separated in freyuencyby F J ( 2 - l ) where F is the clock frequency of the shift register If theSREoutput is bandlimited to one-half the clock frequency the output PRK signal will appear asband-limited white noise
For resolutions proportional to l W in time delay and 1T in frequency shift a maximumlength PRN code will have an ambiguity function comprised of acentral peak of magnitude unity and subsidiary peaks of magni- tude R m 2 In R2TW above the mean value 12TW of the skirts In particular a 1000-bitmaximal length code will have an average self-noise of --30 dBand a peak self-noise of -17 dB experiment^ with a clipped-cross-correlation sonar indicate that due t o clipping and Ham-
294
Fig 3 Review of CTFM principles
pling the peak signal is at -4 dB insteadof 0 dB predicted theoretically This gives a dynamic range of only 13 dB Losses in multiple channels attributedto OR-gating nonstationarity etc can further reduce the peak signal to -10 dB resulting in a dynamic range of only 7 dB A sufficient dynamic range is required to process against multiplepaths Therefore an effective PRN code for sonarapplicationscanonlybeohiained for trsquoime-band- widthproducts of 500 or more In addition platform motion associated with the source or receiver can seriously degrade the effectiveness of PRN signals
In a CTFM sonar the received and transmitted signals are heterodyned and the lower sideband preserved desig- natedthe difference frequency Aunique property of CTFM is that there is a distinct difference frequency for each target range These principles are depicted in Figure 3 A primary advantage of a CTFM sonar is that it pro- vides continuous range information where a range analysis corresponds to a frequency analysis Additional advan-tages of audio echo quality low peak power and reduced target strength and background fluctuations are discussed below Theseoperationalcharacteristicsmake CTFM particularly well suited for deep submergence search and surveillance as compared to conventional pulse CW
CTFM provides audio informationas to the detailed envelope of the echo structure ie is the echo extremely well defined (as from a thick-walled steel structure) or is it diffuse (as from a jagged rock or heavy reverberation area) This is referred to as audio echo quality which will enhance detection andclassification In most deep scanning applications for a short pulse CW sonar to achieve the same range resolution as a CTFM sonar its pulselength mustbe extremely short andthus will usually be in-audibleTheCTFMsonar will have bothaudioand a video display while the CW sonar will have a video display only The video display is a poor source of echo quality as compared to audio due to limited dynamic range and minimum ldquohighlightrdquo recognition capability
Also a continuous transmission can provide low peak powerwhile retaining or increasing the average power
IEEE TRANSACPIONS ON SONICS AND ULTRASONICS SEPTEMBER 1975
This will simplify transmitter design avoid cavitation and possible increase range A short pulse CW sonar is usually cavitation-prone
The diffraction pattern of a cylindrical metal object is comprised of specular reflectrsquoion from cardinal aspects and nonspecular reflection from discontinuities at intermediate aspects The latter generate a peak target strengthvarying level as much as 5-15 dB differential A single-frequencya pulse sonar supports the fine lobe structure of the pattern while a wide-modulation bandwidth transmission such as CTFMtends to give more of an average yalue (phase interference) thereby improving detection at random aspect In general wide-modulation bandwidth trans-missions (LFM PRNandCTFM)tendtoreducethe variance of background fluctuations This provides excel- lent video target detection sensitivity when reverberation-limited
Thelast signal-type tobe discussed is the acoustic impulse Theproperties which characterize the acoustic impulse are short pulselengbh as compared to the interval between occurences of the event and high peak pressure obtained within microseconds of the epoch [4] These two propertiesenhance the nonlinear and dispersive prop- erties of the medium result in complex echo formation and impose constraints as to dynamic range and time of analysis on the measuring instrumentation One important medium effect is the anomaly produced by finite ampli- tude iea steepening of the leading edge of the pulse (ldquosawtoothrdquo effect) which implies a redistribution of low-frequencyenergy to the high-frequency region Be- cause the interaction of acoustic impulses with the me-dium target and instrumentation is more complex than for most other types of signals it is possible to derive greater information from them
An acoustic impulse waveform is defined by its pulse- length peak pressure rise time rate of decay and nega- tive pressure (relative to hydrostatic pressure) It is desirable that the latter be as small as possible to reduce the cavitation constraint For practical applications the signal must be controllable including reproducible in its space-timepropertiessuchas the energy distxibution sidelobe structure beamwidth and on-axis pulse history [5]-[7] Controllability permits changing thesignal wave- shape to enhance echo classification to suppress reverbera- tionandto increase the security of the transmissions Reproducibility is required for processing multiple pings for signal-to-noise enhancement Since the time-band- widthproduct of acoustic impulses is generally unity (l)no enhancementcanbeobtained by processing a single pulse
The properties of controlled acoustic impulses clearly establish the advantages of such signals for echo-ranging applications relative to pulse CW These include utilizing the impulse signals radiated by shock-excited plate modes and the rapid variation in target strengthversus frequency due to structural resonances [S] The short positive pres- sure pulse results in increased security reduced reverbera- tion masking and minimal cavitation constraint Thehigh
- - 295 WINDER UNDERWATERBOUND
SIONALW BEAMFORMER TRANSMITTING O fNE RATOR MATRIX ARRAY
PROeRAMMER __c
I Fig 4
1 Block diagram of sonar transmitter
l
RECElVlNB BEAMFORMER ARRAY MATRIX
I I I I
DECISIONPROQRAYMER - ~ DEVICE 7 lsquo
I I I I I
DY NAY IC I
M E l + COMPRESSION -C +b+ DISPLAY 4
AND NORMMIZATION
I d
6 Fig 5 Black diagram of sonar receiver
peak pressure level results in low absorption loss of the wavefront due tothe nonlinear ldquosawtoothrdquo effect The repeatablebroadbandspectrum plus short rise time results in small signal fluctuations and facilitates signal-to- noise enhancement byrepetitive pulsing detection of metal structures near theocean bottom and the classifica- tion of large targets by highlights from small flat surfaces The favorable effects of a short rise time are attributed to the transmission of high-frequencyenergy andthe associated high directivity The operational benefits of a controlled acoustic impulse sonar would be emphasized in shallow water operation
E TRANShlISSION AND RECEPTION MODES As was probably suspected the trsquoransmitter andreceiver
blocks indicated inFigure 1 areeach comprised of a number of primarybutelementary operations What generally distinguishes one mode fromanother is how these elementary operations are interconnected Each mode is a compromise between such factorsas hardware complexity data rate maximum range of detection and target bearing resolution This will become quite clear later on Right now the major consideration is to describe the elementary operations pertaining to each block
Atypicalblockdiagram of asonar (or radar) trans-mitter is shown inFigure 4 The output of the ldquosignal generatorrdquo can be in many forms (analogor digital pulse CW or linear FM or several signals-time shared) de- pending upon the particular system under consideration The output of the signal generator is sent toa ldquobeamformer matrixrdquo Its purpose is to adequately weightrsquo and delay the signal so that the ldquotransmitting arrayrdquo (or projector) will generate the desired beam pattern inthe acoustic channel A beam pattern determineshow the transmitted
acoustic energy is concentratedand oriented in space relative to the transmitter The weighting and delaying of the signal is usually referred to as ldquophasingrdquoor ldquobeam-formingrdquo The array geometry (eg circular parabolic spherical or cylindrical) will depend upon the particular application In addition the trsquoransmitting array is com-prised of manyindividualradiatingelements whose composition depends upon trsquohe propagating medium For exampleinsonar the radiating material is generally a piezoelectric ceramic and t o someextent a magneto-strictivemetal which converts electrical energy into acoustical energy and vice versa A ldquoprogrammerrdquois also shown mainly for the sake of completeness Its pur- pose is to synchronize multrsquoiple or sequential transmissions
A typical block diagram of a sonar (radar) receiver is shown in Figure 5 The first impression one has is that it is more complicated than a transmitter This should come as no surprise since in transmission the signal-to-noise ratio is infinite (or close to it) while in reception it is less than unity for most cases of interest Clearly some addi- tional work has to be done before a meaningful decision can be made The ldquoreceiving arrayrdquo (or hydrophone) and ldquobeamformer matrixrdquo are quitesimilar to their transmitter counterparts In fact both arrays are generally one and the same The only difference is that in transmission the beamformer matrix has a minimum amount of amplitude weighting for maximum energy transmission This con- sideration is certainly not relevant in reception so that amplitude weighting canbe used here The resultis greater sidelobe suppression and directivity in reception than in transmission
The next two blocks in the receiver ldquodynamic range compression and normalizationrdquo (DRCN) and theldquosignal processorrdquo have the joint task of preparing the received
296 IEEE TRANSACTIONS ON SONICS AND ULTRASONICS SEPTEMBER 1975
3DB
OMNIDIRECTIONAL TRANSMISSION
I ARRAY
ROTATIONALOIRECTIONAL rsquo TRANSMISSION
SEARCHLIGHT
lsquo
( a I SEARCHLIGHT (b 1 SCANNING SONAR SONAR
Fig 6 Comparison of trensmitting and receiving modes
information for adequate presentation on a visual or aural ldquodisplayrdquo or to a ldquodecision devicerdquo such as a digital com- puter The DRCN block is required to remove some of the spatial andtemporalcharacteristics of the acoustic channel that are impressed upon the propagating signal in order to optimize performancein the processor and display blocks The signal processor is generally a physical realization of the ldquomaximum likelihoodrdquo criterion and involvesmatchedfiltering or correlationtechniques In practice the signal processor displaydecision device and human operator are intimately related and jointly repre-sent the true signal processor Most losses in processing gain occur a t their interfaces The ldquoprogrammerrdquo shown is for synchronization and self-adaptive purposes
The sonar transmitter and receiver models shown in Figures 4 and 5 are adequate for understanding present operationalsonarsystems The systems in use may be classified as either the searchlight scanning or rotational directionaltransmission (RDT) type A comparison of the transmitting and receiving modes for thesesystems is shown in Figure 6
DuringWorldWar IT an active sonarsystemoften used was one having narrowtransmitting and receiving beam patterns and whose transducer array was mechani- cally rotated in azimuth to provideahorizontalsearch
capability Due to the mode of operation and the sharp- ness of the beams these system3 were called ldquosearchlight SOZUTSrdquo (seeFigure6 (a)) A searchlightsonaremploys a directional array to concentrate the acoustic energy of thetransmitted pulse into a narrow beam providing a maximum range of detection Upon contact target bearing is determined by training the array for maximum target echo response This is the simplest method for detecting targets and determining their direction
However there are many disadvantages to this typeof operationdue to the fact that the array must be me-chanically trained resulting in a low data rate A low data rate does not provide a ship with a multiple target detection and tracking capability required for ship secur- ity Mechanical training also limits the array size For this reason searchlight sonars usually employ frequencies higher than 15 kHz thus increasing the attrsquoenuation loss due to heat absorption This partially negates the gains obtainedwith high directivity Finallyitis difficult to maintainsoundcontact when the target is conducting evasive tactics
The data rate limitation of searchlight sonar was elimi-nated with the development of the ldquoscanning sonurrdquo (see Figure 6(b)) at the end of World War 11This provides range and bearing information of all targets in a 360rdquo
WINDER SOUND
azimuthal sector continuously and simultaneously Speci- fically an omnidirectional short-duration pulse is trans- mitted In reception the target returns are scanned by rapidly rotating a narrow receiving beam The receiving beam outputis then presented to a panoramic display The latter is onewhich gives a visual representation of the entire (360rsquo) acoustic field A panoramic display used extensively in radar and sonar is a plan position indicator or PPI The PPI maps the targetrsquos position in azimuth and range in polar coordinates on a cathoderaytube (CRT) where target amplitude is used to modulate the electron beam intensity (orz axis) Therefore a PPI is an example of an intensity modulated CRT polar display and generally uses a P7 (long persistance) phosphor for integration
A scanning-type sonar provides the ship witha multiple targetdetectionandtrackingcapability for maximum security The high data rate of a scanning sonar greatly reduces the percentage of loss-of-target contactrsquo due to time-varying multipaths andamplitudephase fluctua-tions of the ocean In addition since there is no need to mechanically train the array lower operating frequencies may be used With lower frequencies the losses due to absorption are decreased thereby tending to increase the detection range There are however several limitations Omnidirectional transmission implies that the transmitting beam has no directivity A comparisonof searchlight and scanning sonar becomes a question of high transmitting directivityandhigh absorption losses versus notrans-mitting directivity and low absorption losses respectively However in general for a fixed amount of acoustic energy a searchlight sonar will give a greater range of detection than a scanning sonar The scan speed of the receiving beam must be a compromise between the desired target resolution andthe maximum receiver bandwidth(or minimum input signal-to-noise ratio) allowable Also the ambient noise background presented to the display is averagedover 360rsquo which may be considerably higher than the actual ambient level at the true target bearing
The above limitationswere eliminated with the develop- ment of an ldquoRDTrdquo SOWT in the 1950rsquos An RDT type sonar is comprised of rotational directional transmission (RDT) with a preformedbeam (PFB) receiver It pro-vides high transmitting directivity and a high data rate togetherwitha low operating frequency Clearly it combines the best features of searchlight and scanning sonars
Specifically during transmission a sector of the array is properly phasedtoconcentratemaximum acoustic energy into a narrow beam similar to searchlight trans- mission By exciting different usually overlapping sectors the narrow beammaybesequentiallyrotatedthrough 360rdquo Thetransmitted beamremains at eachdiscrete bearingonly long enough to transmit the entire signal ie a timeequaltothe pulse length The number of discrete bearings is equal to 360rsquo divided by the 3-dB beamwidth It is important to note that RDT requires a
UNDERWATER 297
longer time to complete the trsquootal echo ranging cycle This presents a ldquoblind-zonerdquo to the searching vessel
In reception the beams shown in Figure 6(c) are fixed in space relative to the receiving array They aregenerally designed to overlap at the - 3 db points and continuously and simultaneously monitor the entire acoustic field The outputs of the preformed bedm matrix are in parallel form andare applied to individual DRCNsignal processors whose outputs arethen electronically scanned and dis- played on a PPI Each preformed beam output represents acoustic information obtainedwith respect to a finite space sector The preformed beam system has quantized the acoustic field in azimuth and may be considered as an azimuthal normalization The latterattemptstoobtain a constantldquospatialvariancerdquo or a uniformbackground (at a given range) on a PPI display System performance is considerably improved overaconventionalscanning receiver which averages the background over 3i30rdquo How-ever there may be a loss in targetrsquo detectability due to beam-to-beam unbalance (The latter may be eliminated by employing time-division multiplexing j In addition the finite interpolation of a preformed beam system leads to a serious detection degradatrsquoion known as the ldquobrick silordquo or ldquospokingrdquo effect This effect is not present with a conventionalscanner which has an infinite interpolation (theoretically)
Finally animportant difference between ascanning and PFB receiver is that the latter can be corrected for doppler due to own ships motion and the former cannot This means that a PFB receiver can have a smaller band- width thus improving the signal-to-the-noise ratio The method for accomplishing this is referred toas ldquoown doppler nullifyingrdquo (ODN)Each preformedbeam is mixed with an ODN oscillator The ODN oscillator is a voltage-controlled oscillator (VCO) in which the control signal is proportional to the product of the shiprsquos speed and the cosine of the relative bearing of the beam This technique is not possible with ascannerbecauseahigh speed video scan switch cannot be synchronized with the very small changes in the VC0 output
This is a good point to leave the discussion of the various transmission and reception modes and discuss the charac- terization of the acoustic channel block in Figure 1 The acoustic channel is generally trsquohe weakestlink in sonar system design
F ACOUSTICCHANNEL
It is customary when studying the detection and estima- tion problem to initially consider an ideal communication channel A communication channel is the vehicle by which information or data is transferred from one point (source) to another (destination) When assumed tto be ideal it is considered to be homogeneous lossless physically un-boundedand to provide distortionless transmission although the channel may be subject to various types of noise disturbance whichmayproducedistortion at the destination Clearly this simple model is not appropriate
298
for physical reality but is useful in the sense that it facili- tates understanding and visualization of the problem Generally the complexity of the problem is increased to include the effects of random amplitudeand phase scatteringand fading In practice thereareadditional effects to consider For example since a channel is usually not homogeneous or isotropic the received signals are strongly dependent upon the direction from whichthey are received Also the scatterersmay be distributed nonuniformly which leads toa nonstationary process
The acoustic channel in Figure 1 is represented by the ldquolinesrdquo connecting the transmitter and receiver a scatter-ing volume and ambient noise The ldquolinesrdquo may represent hundreds of nautical miles bounded by the air-water interface and on the bottom by mud sand gravel and rock The sea surface is both a reflector and scatterer of sound The sea bottom is similar but its effects are more complicated because of its multilayered composition The sea bottom has a densityandsound velocity that may change gradually or abruptly with depth which implies that its reflection loss is less easily predicted than that of the sea surface In addition ambient noise shown as an additive medium generated signal is a complex boundary and propagation effect a sourcemain of it is due to motion at the air-water interface Therefore it appears that propagation and boundary effects are closely interrelated Too some effects are actually influenced more by bound-aries than the internal acoustic properties of the ocean and vice versa
Propagation Effects Formally the propagation of acoustic waves of rela-
tively small amplitude inan isotropic perfectly elastic homogeneousunbounded and lossless medium can be described bythe linear acoustic waveequation Two approaches to a solution of the wave equation are ldquonor-mal-mode theoryrdquo and ldquoray theoryrdquo [g] [lo]
Normal-mode theory is valid when the wavelength of sound is the same order of magnitude as the water depth It is particularly useful in describing sound propagabion in shallow water or at very low frequencies in deep water This is analogous to the propagation of electromagnetic waves through waveguides Specifically normal-mode theorytreatsthe ocean asa whole and characterizes sound propagation in terms of the natural or eigenmodes of vibration of the ocean body analogous to string vibra- tion The computations involved areeasily carried out on a digital computer However this theory does not facilitate visualization or understanding of the propagation proc- ess-but ray theory does
Acoustic ray trsquoheory is analogous to that employedin geometric optics Similarly it postulates the existence of wavefronts along which the phase or time function of the solution to thewave equation is constant It also postulates that for a given set of conditions the sound patrsquoh between any two points in the ocean is fixed independent of trsquohe direction of propagation This pathis called a ldquosound rayrdquo or ldquoray pathrdquo anda description of the entire propagatrsquoion
IEEE TRANSACTIONS ON SONICS AND ULTRASONICS SEPTEMBER 1975
process is called a ldquoray diagramrdquo This has considerable intuitive appeal However there are several limitations It does not provide a good solution when the ray curvature or pressure amplitude changes appreciably over a distance of one wavelength Therefore ray theory is restricted to high frequencies or short wavelengths
The direction of a ray path is governed by Snellrsquos law The velocity of sound is an increasing function of water temperature pressure and salinityVariations in these variables produce velocity changes which in turn cause a sound wave to refract or change its direction as it propa- gates Therefore a propagation mode is specified by the velocity profile or velocity gradient of the medium A velocity gradient depicts thechange in velocity with depth If the velocity increases with deptrsquoh the gradient is said to be positive producing a ray curvature which is concave upward If the velocity decreases with depth the gradient is said to be negative producing a ray curvature which is concave downward
The deep ocean profile is comprised of two main layers ie 1) a seasonally dependent part consisting of an isothermal or surface layer and seasonal thermocline that extends from the surface down to a few hundred feet and 2) a permanent nonseasonally dependent part consisting of the main thermocline and deep isothermal layer that extends down trsquoo the bottom During the winter and spring and in the Arctic the seasonal thermocline tends to merge with the isothermal layer During thesummer and fall the isothermal layer is only about 50 feet deep and the sea- sonal t(hermoc1ine iswell defined The main thernlocline is a negative gradient due to the decreasing temperature and thus decreasing velocity In the deep isothermal layer thetemperature is nearly constant a t about 39degF and the velocity of sound increases with depth due to increase in pressure The positive gradient is about 0016 feet per secondperfoot A velocity minimum is thus formed at about 1000 meterswhich is the axis of the deep sound channel or so-called SOFAR channel
Velocity profiles and ray theory completely characterize deep water propagation This is a form of ducted propaga-tion where the sound is prevented from spreading in all directions and is bounded within a duct or sound channel These boundaries may be the sea surface and sea bottom multilayerswithin the medium or combinations of the two Deep water (gt1000 fathoms) propagation may be separated into two depending upon the depthof thedasses source
For a near surface source (upper 1500 feet of the ocean) therearethreedistinct modes-the surfaceduct mode [ll] the bottom-bounce mode [K] and the convergence zone mode [13] [14] These are shown in the ray dia-grams in Figure 7 and represent all present applications of sonar for surface vessel submarine and airborne plat-forms
The surface duct or mixed-layer sound channel is the acoustic analog of the ground based duct in radar Vir- tuallyall of the ship sonar systemsdeveloped prior to 1960used thesepaths exclusively The velocity profile
299 WINDERUNDERWATERSOUND
SURFACE DUCT
SINGLE-SURFACE
LEAKAGE BY DIFFRACTION SCATTERING AND
V
Fig 7 Ray diagrams for deep water propagation near surface source
Fig 8 Ray diagrams for deep water propagation deep source
requiredfor this mode has initiallyapositivegradient and then a the propaga- negative gradient At short ranges tion pathis nearly a straight line At longer ranges propa-gation is characterized by repeated surface reflections A ldquoshadow zonerdquo is thus created beneath the layer having little insonification except forsoundleakagefrom the surface duct The leakage has been found to increase with the ratio of wave height to layer depth The importance of a shadow zone is indicated by the fact that it canreduce a surface sonar with a 20 kiloyard range capability to one having less than a 5 kiloyard capability
In recentyearssonarsystemshave employed the bottom-bounce and convergence zone modes for greater ranges of detection than those obtainable in the surface duct The bottom-bounce path requires a strong negative gradient and becomes important in the range region from about 10 to 30 kiloyards At shorter ranges the high angle of incidence causes a largeportion of the sound energy hitting the bottom to be absorbed and thus wasted Be- yond 30 kiloyardsbottom-bounceinvolvesmultiple
reflections where the loss per ldquobouncerdquo at the bottom and surface strongly reduce the received energy In addition bottom-bounce produces a degradation in range resolution due to time dispersion and a bearing error due to a sloping bottom The convergence zone mode requiresinitiallya negativegradientand thena positivegradient which results in a ldquofocussingrdquo of the sound rays Multiple con-vergences can occur similarto multiple bottom reflections The zones are at intervals of 30 to 35 nautical miles having a width of the order of 5 to 10 percent of the range For these modes to be effective it is necessary that the trans- mitted acousticbeambeproperlytiltedin thevertical plane(ie inelevation)for themost efficient ray path transmission
For a deep ocean source thereare two distinct modes- the SOFAR channel and the refractedsurface reflected (RSR) mode Their ray diagrams are shown in Figure 8
The SOFAR channel [15] [l61 is formed by placing the source approximately atrsquo the depthof minimum veloc- ity Sound waves aboveand below this depth will be
300 IEEE TRANSACTIONS ON SONICS AND ULTRASONICS SEPTEMBER 1975
refracteddownwardandupward respectively SOFAR propagation is actually an oscillatory mode where sound can travel thousands of nautical miles with little loss of energy since there are no boundary reflections
The RSR mode [l71 is quiteinterestingbecause it includes the so-called reliable acoustic path (RAP) The latter rays travel from the deep source to a shallow re-ceiver--without surface reflection RAP raysare ldquore-liablerdquo because tgthey are insensitive to near-surface effects and losses due to reflections This bypasses the difficult problem of detecting a shallow depth target a t moderate ranges from a shallow depth source
The selection of o n e propagationmodeoveranother depends upon the propagation loss associated with each mode Propagation loss is defined as the total decrease in sound intensity associated with any given length of ray path a t some specified frequency [lS] The loss of sound energy may be attributed to geometric spreading absorp- tion reflection andor scatteringandmultipathsThe last two loss mechanisms are rather complicated and are generally treated as boundary effects
The spreading loss is independent of frequency and is primarily due trsquoothe increasing area over which energy is distributed during propagation If the ocean can be con- sidered as infinite in extent and homogeneous in composi- tionthenradiatedsoundspreads spherically in trsquohree dimensions and the intensity decreases at the rateof 6 dB per doubled path length Spherical spreading is approached in deep water modes (excluding SOFAR) and for short ranges in the surface duct and shallow water If the radi-ated sound is confined within a duct and can only spread in two dimensions then the intensity decreases at the rate of 3 dB per doubled path length This is known as cylin- drical spreading and is valid for the SOFAR channel and long ranges in thesurfaceductand shallow water At intermediate ranges there is a transitionfrom spherical to cylindrical spreading which is determined eitherby extrapolation between the two regions or by computing the spreading loss using ray theory The latter may appear considerably more accurate but remember it is only as good as the velocity profiles assumed
Theabsorption mechanism [l9]--[28] is extremely interestingFormally it is the conversion of acoustic energy into heat due to repeated compressions and expan- sions of the ocean associated with the propagation of a soundwave and is highly dependent uponrangeand frequency Below 100 kHzabsorption is primarily due to the ionic relaxation of magnesium sulfate ions in sea water This is where the MgS04 ions dissociate and then reassociate under the pressure of the sound wave involving a finite time interval called the relaxation time At about 100 kHz there is additional absorption due to shear and volume viscosity Above 1 h4Hz the dissociation loss disappears and ahsorption is due entirely to viscosity At frequencies below about 5 kHztheabsorption lossis much higher than that caused by ionic relaxation of MgS04Soundabsorption is discussed more thoroughly
in a companion paper by Marsh Caustics developedwithinachannel will result in
absorption losses much lower than that computed A caustic is the envelope formed by the intersection of ad- jacent rays (focussing) producing high sound intensities When a caustic intersects the sea surface the region a t or near the surface is known as a convergence zone as discussed before Propagation loss to the first convergence zone is generally 10 to 15 dB lower than that computed with spherical spreading and absorption This is a big plus for convergence zone operation
When a complex signal is transmitted the received waveform will have thesame amplitude-phasecharac-teristicsasthe original signal only if all of its Fourier components are attenuated equally and if they all propa-gate at trsquohe same phase velocity Therefore distortionless transmission requires that the attenuation coefficient be independent of frequency and that the phase coefficient be linearly proportional to frequency Howeverthese conditions arenot satisfied As indicatedabove the attenuation coefficient (the coefficient of that part of the propagation loss which is proportional to range) is a function of temperature pressure and salinity as well as frequency In practice the total attenuation is due to thesurfacebottomand volume scattering losses as well as to conversion of the sound to heat by absorption The phase coefficient is the retardation per unit length from the phase shift corresponding to zero frequency The effects of phase distortion have thus far not been experi- mentallyconfumedThese effects will depend uponthe fine time structure of the signal waveform Thismay result in appreciable distortion in wideband signals
Other propagation effects which cause signal distortion are multiple propagation paths doppler finite amplitude medium coherency and time dispersion
The existence of multiple propagation paths [24] each having a different travel time may result in a lengthening of the duration of pulsed signals particularly if the signal is initially of short duration eg transients In experi-ments involving explosives impulses whichlasted a few milliseconds near the source have produced distant signals which persisted for several seconds It was estimated that nearly 200 separate arrivals contributed to the received waveformoverarange of about 500 nautical miles Multipaths are essentially boundary effects
The doppler effects [25] C261 or frequency shifts are attributed to path lengths changing with time which may be caused by reflection and scattering by objects inmotion relative to the source andor receiver Experiments have shown that doppler spreading in the surface duct (depth 55 meters wind speed 6 meterssecond) can exceed 5 Hz
An interesting propagation effectis the anomaly pro- duced by a sound wave traveling with a finite amplitude [27] [as] Finite amplitude waves are those whose peak pressures are comparable in magnitude to the st8atic pres- sure Propagation is characterized by a steepening of the wavefrontwhichenhances the high frequency content
WINDER SOUND
with respect to the low frequencies and is opposed by the broadening due to high frequency absorption Finite amplitude therefore represents a departure from the linear acoustic wave equation ie superposition is no longer valid The velocity of a finite amplitude wave is frequency dependent resulting in waveformdistortion-even for transmission through an ideal medium
Recent studies of medium coherency most notably the MIMI tests have established that the ocean has a remark- able phase stability andthatitis not the random in- homogeneous medium often described [as] The large fluctuations which characterize acoustic propagation are primarily duetothe interference of close multipaths generated by reflections from the air-water interface and sea bottomThe observed temporal fluctuations are therefore due to doppler spreading If themultipaths have a discrete distribution in range (or doppler) they may be resolved and trsquoheir interference is thus removed In fact the notion of signal coherence only has meaning after this multipath interference has been removed [30]
Time dispersion is a constraint on the range accuracy in an echo-ranging sonar [31) It isdue mainly to the dispersion in the vertical angle of arrival which is highly pronounced for shallow water propagation At short ranges there will be a series of discrete arrivals each with little frequency dispersion For longer ranges there will be discretearrivals with appreciable frequency dispersion within each arrivalandthey will generally overlap Dispersion not only depends on range but also on the number of sound rays (or normal modes) received and effective bandwidth for each ray (or mode) Vertical dispersion in arrival angle will also limit the azimuthal angular accuracy [ 3 2 ]
Reverberation Effects
Long-range sonar performance is stronglydependent upon surface biological and bottomscattering in the backward directrsquoion In practice tmhe transmitting and receiving arrays are usually in very close proximity to one another (if not one andthesame) Therefore a scattering of prime importance is that of back scattering- where the scattered energy returns along the path of incidence Analogous toarchitectural acoustics this interference is generallytermed ldquoreverberationrdquo which also refers to all sound refleckd and scattered back to the receiver regardless of the path In radar applications this is called clutter
If the scatterers aredistributed uniformly in range then reverberation returnstendto a stationary process A nonuniform distribution in rmge tends toa nonstationary process which is further enhanced by the finite bandwidth of thetransmitted signal [33] Nonstationarity implies a time-varying mean and variance which is primarily responsible for poor signal processing and for a background having a nonuniform contrast on a display For a very narrow beamwidth and short pulselength the reverbera- tion is impulsive or discrete in time (there are finite holes
UNDERWATER 301
in the reverberation waveform) As the density of the scatterers increases the reverberation tends to a Gaussian process and thus may be characterized by second mo-ments(eg auto-and-crosscorrelatioru) Experiments show that for a wide range of ocean conditions the in- stantaneous reverberation amplitudeis Rayleigh dis-tributed (ie at a given range from one ping to the next) [34] In addition the reverberation envelope for bottom scattering usually has a higher degree of coherence than for surface and volume returns If thescatterersarein motion relative to the transmitting and receiving arrays thescatteredreturnsare doppler distrsquoorted In general different scattering regions have different) velocity dis- tributions causing the reverberation bandwidth to vary as a function of time C351 Clearly reverheration is a stochastic process of both space and time
A fundamental parameter which characterizes revcrbera- tion is called scattering strength It is the ratio in dB of theintensity of the sound scattered by a unitarea or volume referred to a distance of 1 yard t o the incident plane-wave intenshy Since the direction o f scatkcring is normally back toward the source thc parameter of in- terest is the back scattering cross section of a unitrsquo area or volume
The surface back-scattering strength is a function of wind velocity grazing angle and frequency [ R G ] A t low grazing angles it tendsto become independent8 of trsquohe grazing angle This is attJributed to a subsurface layer of isotropic scattrsquoerers probably of biological origin which masks the reverberation due to scattrsquoering from srlrface roughness For larger grazing angles thc volrlnle scatterers will act as a precursor but surface scatteringwill dominate A portion of the precursor may be attrihutgtedto scattering from a layer of air bubbles tmpped just below the sea surface [37] The suspended air content of seawater has a marked effect upon underwater sound due to air having a highly different densitrsquoy and compressibility than seawatcr and because of the resonant characteristics of air bubbles At high grazing angles back-scattering is primarily a coherent scattering or reflection from wave facets inclined a t right angles to t8he direction of the incident sound It is important to note that wind velocity rather than wave height (or sea-state) is used to cleternline the sea surface back-scattering strength This is hrcause it is trsquohe small scale roughness that is important Wind velocity may be considered to ldquomodulaterdquo the wave (the period of ocean waves average from 3 to 8 seconds) and is trsquoherefore a more accurate description of thc snrface roughness than sea-state
Bottomreverberation is somewhat nmre subtleAt present there are two theories concerning its origin The first and most popular is that it is due to hottorn rough-ness similar to sea surface scattering The srcond is that it is due to thesize of the particles or grains i n the bottom similar to volume scattering The dependence o f tlhe bot-tom reverberation level on the type of sedinlent tcnds to justify botgth theories As wind velocity is a mmsurr c j f sea
302 IEEE TRANSACTIOXS ON SONICS AND GLTRASOXICS SEPTEMBER 1975
surface roughness so is bottom type (eg mud silt sand rock) a measure of bottom roughness Measurements have shown that a theory based upon particle size or bottom composition gives only an approximate indication of the
u I I
Fig 9 Comparison of directivityatterns of (A) discretelinear arrayhavingelementsspaced a t Ralf-wavelengths and (B) con-tinuous uniform line transducer
back-scattering strength at a given grazing angle Thus there must be another contribution to bottom reverbera- tion Experiments indicate that rock bottoms havea back-scattering strength with little or no frequency dependence while sand and silt bottoms haveone which increases with frequency at a rate of 3 dBoctave(variesasthe first power of frequency) [38][39] This has been attributed to the difference in the scale of bottom roughness and agrees with basic scattering theory It therefore appears that bottom roughness is a major and possibly a dominantcontribution to bottom reverberation
At present the models for bottom back-scattering are either too simpleor rather involved for computation Data indicates that a good description of the back-scattering of sound by very rough bottoms is to consider the spatial distribution of scattered energy to satisfy an omnidirec- tional law or Lambertrsquos law that is a sine or sine-squared processor (including displays) for frequency and temporal dependence of the grazing angle respectively [ M ] There discrimination Thus the beamformer may be considered is no theory to justify either behavior Lambertrsquoslaw to beaspatial filter and can employanalog or digital has been previously used as a measure of the radiation of components for forming the beams light by radiant absorptive materials In this model there Analog beamforming operatrsquoes in a linear manner is no frequency dependence A more ambitious theory is Therefore there is no performancedegradation dueto one which treats the rough bottom as a diffraction gratingnonlinear effects However the size and weight of the where the scattering is primarily generated by the wave- length component of thebottom roughness for which phase reinforcement occurs [41] This involves the notion of a ldquoroughness power spectrumrdquo which is the amplitude squared of the irregularity in the bottomcontourasa function of wave number Presently there is little data on the roughness power spectrsquorum of the sea bottom
Volume reverberation is produced by a three-dimen-sional distribution of biological scattererswhichare located in large part in a diffuse layer generally referred to as thedeepscatteringlayer(DSL) [42] [43] The DSL is rather complex in composition and distribution and exhibits a diurnal migration in depth The model for biological back-scattering is still incomplete andthe greatestunknown in long-range echo-ranging This is most significant in convergence zone operation Diurnal dependencemaycausevolumereverberation levels to increase 10 dB at sundown and decrease 10 dB at sunrise These changes are the cause for surface ship sonar to have its poorest performance in the afternoon However there are areas which show no diurnal effect but strong seasonal dependence
G CONVENTIONALBEAMFORMING Beamforming is the process by which an array of spatial
elements of arbitrary geometry and dimensionality spatially discriminates against noise and reverberation fields This is accomplished in the beamformer through a series of operations involving the weighting delay and summation of the signals received by the spatsialelements The summed output is then sent to the electronic signal
beamformer becomesexcessive if many simultaneous beams are formed Adigitalbeamformer is compatible withmultibeamformatmion of large acoustic arrays and computerbeamforming algorithms It utilizes an AD converter m-hith is a nonlinear device This may introduce a slight degradation inperformancebut will generally reduce hardware size weight and complexity and simplify data handling
In this section many space-time aspects of conventional beamforming are discussed These include linear super- position space-frequency equivalence the significance of thedirectivityfactorand space-time sampling the im- portance of the array gain and space-time correlation function as operational measures the effects of wideband operation in reception on a single-frequency design super gain concepts and the status of digital beamforming
Linear Superposition
A spatial element is said to be linear if it obeys the law of linear superposition The practical result is that the directive properties of a spatial element such as an acous- tic line transducer may be determined by examining the behavior of a number of discrete receiving points spaced along the line [44] Figure 9 shows a comparison of the directivitypatterns of adiscrete linear arrayhaving elementsspaced at intervals of X2 anda continuous uniform linear transducer [45] Each have a total length of 5k and the relative acoustic pressure is specified by the ratio of the voltage developed by the acoustic energy of given intensity at a given bearing to that developed by the acoustic energy of the same intensity arriving along
303 WINDERUNDERWATERSOUND
ZRIOUS SPACECOMPLEXITILS OPERA- h 2-ELEMENTCORRELATION ARRAY OPFRA ING ING AGAINST ASINGLEFREOUENCY GAINST A SOURCE HAVINGVARIOUS
E Q L J F N C YC O M P L U L T I E S B E A MP A T T E R N
SPATIAL FREOUENCY SPATIAL FREOUENCY CONFIGURATIONCONFIGURATION
FULLDIRECTIONAL RADIATOR
DISCRETE RADIATORS SPACED X12 APART
0 0 0 0 W
i+ RADIATORSSPACED gtgtAf2 APART
0 o w
CONFIGURATION CONFIGURATION
CONTINUOUS BANI OF FREOUENCIES
DISCRETEFREC CLOSELY SPACED
D I S C R E T E F R E O ~ IWIDELYSPACFD
Fig 10 Equivalence between complexity of receiving array and complexity of frequency configIratian of source
-the axis normal to the arrayA line transducer is equiva- lent to a discrete array having an infinite number of ele-ments It is seen that there is little improvement in direc- tionality to warrant providing a discrete array with more elements than are sufficient to give a half-wave spacing The height of the secondary lobes may be slightly in- creased but the width of the major lobe is practically unchanged
When the response of discrete receiving elements are known the response of an arbitrary configuration can be derived by using the principle of pattern multiplication The radiation pattern of an array of spatial elements each of which has the same pattern with the same orientation in space may be found by 1)replacing each of the elements by an omnidirectional element at the same point and with the same amplitude and phase excitation 2 ) determining the array pattern of the resulting array of omnidirectional elements and 3 ) multiplying the arraypatternbythe radiation pattern of the individual elements of the original array
The analogy to the impulse response in the time domain is the response of a spatialelement to a distant point source A point source is one whose dimensions are small in comparison with the wavelength emitted so as to radiate a spherical wave Such a source radiates uniformly in all directions and is the building block needed for linear superposition Hence analogous to a temporal system the output of a spatial element is the convolution of its point source response and source distribution This is the spatial convolution theorem Although spatial convolution can be readily formulated it cannot always be evaluated in closed form and either numerical analysis or transfer function descriptions may be required
The plane wave response pattern of a receiving array is obtained when the radiator is a point source at a suffi-
cient distance such that a n inc-rmsp in thr distance will produce no detectahle changei n thr pattern If the source subtends an apprecia1)lr angle thr rcsponw pattern will be modified [46] The direct8ional discrimination of the array depends on the responsc to sourccs out8side the major lobe Boundaries inlpos4 on spatial extent produce sidelobes in the response and affect the interpretrsquoation of the various spatial descriptions
Methods for describing basic propcrties of spatial elements may use space or ldquosl)ttiaI-frcqllencyrdquo as vari- ables The freedom o f selection corrcywnds to the choice of time or frequency in circuit) prohlt~ns The space trnnsjer function completely charactcrizes n spatial element It is primarily a steady-state or far-field dcscription and is often more convenient to work with than the point source response From the properties of Frsquoouricr transforms the spatial-frequency spectrum of an aperture distribution modified by any numhrr of suc(~twiwlinear operations is the product of the spatial-frcclucncy spectrum of the original distribution and the spatitl spcctm of the several linear operations Therefore an analysis performed in the spatial-frequency domain replnrrs s~~cccssive intcgrations by successive multiplirations
Space-Frequency Bquivalmce A relationship of considerable importtanre in represent-
ing spatial structuraldet8ailand analyzing spataid problems is one which establishes that the relocity amplitude dis- tribution across the array and its tlirectgtivity pattern in the far-field (Fraunhofer region) are Fourier transforms of each other [47] [48] Therefore Fourier analysis can be used t30 compute the directivity pattern if the aperture distribution is known or may hn used to detrsquoermine the aperture distribution required to prorluce a desired direc- tivity pattern (synthesis problem)
304
When a Fourier relationship exists between pattern and excitation there is reciprocal spreading between aperture and pattern widths For example if the aperture width is increased by a factor m the pressure level increases m times at broadside and the beamwidth is reduced by lm
The reciprocal relationship between aperture and pat-tern widths is displayed by similarity of the directivity patterns for isofrequency receivers of large spatial extent and wideband receivers of small spatial extent [49] The equivalence existing in a receiving array between its spatial configuration and the frequency configuration of the source is illustrated in Figure 10 As the spatial con- figuration is varied to improve the directionality against a single frequency source in the frequency case this corre-sponds to using a 2-element correlation array operating against a source transmitting wideband signals If the continuous uniform array is replaced by point elements spaced at half-wavelength intervals then the continuous frequency distributionof the sources will be replaced by a set of discrete frequencies When the element spacing or discrete frequency spacing is made large multiple major lobes result These relationships can be utilized to improve spatial processing gain and in formulating new systems
Directivity Factor Directivity I n d e x
The concept Of directivity expresses the Of a spatial element or an array of such elements to 1) concen-trate signal energy in the desired transmitting directions or 2) to descriminate against interference arriving from bearings other than those desired Directivity both in transmitting and receiving is dependent upon the ratio of the sound wavelength to the dimensions of the elements and their spacing For a single element if the wavelength is large compared to the dimensions the sound is emitted uniformly in all directions and the elements response will be independent of the direction of sound incidence If the dimensions are large comparedto a wavelength the sound energy-transmitted or received-will be directional Use- ful measures o f the directive properties of spatial elements are the directivity factor and directivityindex [io] [ill
The directivity factor(DIT) is defined as the ratioof the intensity or mean square pressure of the radiated sound in a free field a t a remote point on the maximum response axis (MRA) totheintensity or meansquare pressure averaged over all directions The distance must he sufi-ciently great SO that the sound appears to diverge spheri- cally from tht effective acoustic center of the source The averageintensity of the sound passing through a large sphere of radius ( r ) is found byintegratingthenormal component of the intensity (I) over the surface ( S ) of the sphere and dividing by the area 4 d The directivity factor may then be expressed as
IIn C~S
where Iois the intensity at the remote point on the RIR-4
IEEE TRANSACTIONS ON SONICS AND ULTRASONICS SEPTEMBER 1975
Fig 11 Rectangular plots of typical (a) difference pattern and (b) sum pattern
In the far-field the intensity of the radiated sound is the square of the absolute value of the pressure divided by the specific acoustic impedance
The directivity index (DI) is the expression of the direc- tivity factor in decibels thus
D1 = 10 log DF (2)
For linear array of point spacedelements at integral half-wavelengths the maximum directivity index (RIDI) is obtained with uniform constant phase excita- tion The maximum directivity factor is then numerically equal to the number of eleTnents (even or in the
array
DF = V dX = n2 ( n = 12 ) (3)
For other values of element spacing the MD1 is not obtained with uniform excitation Thereis little difference between the 1IDIand the directivity index due to uniform excitation for element spacings greater than half-wave-length However for d X lt l 2 tgthere may he asignificant improvement in the directivity index in going from uni- form excitation to MD1 excitation The beam patterns due to the latter are referred to as superdirective and are obtained at the expense of requiring out-of-phase excita- tionanda relatively large range of amplitudes These amplitudesmust be controllcd with extremeaccuracy to achieve the predicted spatial gain and in addition the element spacings and operating frequency must be ac-curately controlled to the same degree
Certain applications may require special types of direc- tivity patterns such as a difference pattern Whereas the sum pattern exhibits even symmetry about a line drawn perpendicular to the aperture at its midpoint the differ-ence pattern exhibits oddsymmetryaboutthesame axis A conlparison is shown in Figure l 1 for a line source A sumpattern usually will have onemajor lobe in the direction of the principal axis while a difference pattern has two equal lobes with a null in the direction of the principal axis
WINDER UNDERWATER SOUND 305
Combinations of sum and difference patterns are used insonar (andradar) systems to improve the accuracy of bearing measurements Theerror signal obtained is primarily determined by the slope of the difference pat- tern in the vicinity of the origin To enhance the sensitivity to small changes in angle it is necessary that the slope be as steep as possible For sum patterns the influencing propertiesaredirectivity index beamwidth and side-lobes For difference patterns slope and sidelobe level are significant for determiningangularsensitivity If the sidelobes are too large false indications of target direction may result in the presence of multiple targets Theory C521 shows that a constant phase (except for a 180phase reversal) linear excitation function gives rise to a maxi-mum slope pattern The maximum slope pattern may not be the most desirable pattern to use in that the sidelobe level is quite high Thus a compromise must be made be- tween slope and sidelobe level for angular error sensitivity
If the elements of a linear array are uniformly spaced then the sidelobe level and beamwidth may be controlled byvaryingthe element excitation A general result of uniformly spaced arrays is that the sidelobe level may be reduced by decreasing the aperture excitation toward the extremes of the array This reduction is obtained at the expense of the array beamwidth
If the elements are nonuniformly spaced thearray will be characterized by spatial frequencies which are not related by integers An unequally spaced array has many interesting properties [53] [54] C-551For example there is an equivalence betweenamplitudetapering of a uni-formlyspaced arrayandthe spacevariation in a non- uniformlyspaced array Hencenonuniformelement spacingmaybe used to reduce sidelobes increasing the spatial processing gain Use of perturbation methods can reduce the sidelobe level to about 2AV timesthemain lobe where N is the number of array elements To achieve this reduction implies retaining uniform excitation
A perturbation analysis may be performed to indicate small nonlinear changes in element spacing However the more useful properties of nonuniformlyspaced arrays depend upon large nonlinearities in the element spacings An approximate method for making an analysis of such arrays may be achieved by representing it with an equiva- lent uniformlyspaced arraythroughspatial sampling techniques
Space-Time Sampling The use of samplingtechniques [56]-[59] in array
design is a natural extension of sampling theory in signal representationA linear array of N equally spaced ele- mentshas hr degrees of freedom since it is possible to establish N coefficients of the Fourier series for the far- field radiation pattern When the elements are arbitrarily distributed each element will have an added degree of freedom namely its position along the axis of the array This is analogous to nonuniform temporal sampling of a signal
If the analysis time and signal bandwidth at the array outputare limited to ( T ) and ( W ) respectively the
received pressure distribution at any point on the aperture can be represented by 2WT sampled values Similarly if ( e ) is the half-power beamwidth and ( L ) the length of theaperture parallel to some axis the onedimensional distribution at any instgtantof time can be represented by OLX sampled values across the apertureThe factor of two(in 2WT) is unnecessary here because knowledge about phase a t sample pointsspaced AI0 apart on the aperture is obtained fromthe 2WT samplepoints in time The total number of sampled values may be taken as theproduct of thespatialand temporal degrees of freedom Thus the received pressure distribution across the aperture ( L ) during time ( 5 ) may be represented by X = 2WTBLA sampled values
If ( H ) possible amplitudes of the pressure can be meas-ured at each sample point then for the one-dimensional aperture the total number of different signals which can be described by (Vg)sampled values is N ( 2 w T e L I X ) Any one of these signals can give the history across the length ( L ) and for t8he time (T) butt8here is only onewhich gives the actual history of the spare-time domain Sam-pling theory can be easily rxtended t80multidimensional arrays It is important to recognize that various problems require proper tradeoff betjiveen spatial andtemporal samples basedupon the desired accuracyhardware complexity and display fornxtt The best sampling dis- tance in space will depend upon the spatial strurture of the masking background In general the detection process 11411 require less degrres o f freedom than that for rlassifica- tion which often includes an assessment of size and shape Multidimensionalsampling of thc aroustir ficld employs multibeamforming techniques
The angular resolution of a sonar system is intimately associated with the r0nstraints of space-time sampling I t is dependent on the signal-to-noisc ratio of the received signal the size and shape of the source (or target) the beam pattern of the receiving array andthe dynamic range of the receiver and display subsystems
Array Gain The array gain is a measure of rereiver spatial processing
which has greater operatgtional significanre than the direc- tivity index [W] This is berause i t is expressed in terms of the space-time correlation structure of the signal and noisefields [Sl] thereby representing the dynamics of the medium and sonar platform and the effects of hydro- phone directivity The array gain is fornlulated as
where
pi j ( s ) signal correlation between (ij)th elements p i j(n ) noise correlation between (ij)th elements N total number of array e1ements
306 IEEE TRANSACTIONS ON SONICS AND ULTRZSONICS SEPTEMBER 1975
Clearly the signal class js very important for evaluating the array gain since it establishes whether the formulation and measurement of the signal and noise inberelement correlations should be made on the basis of energy or power It is interesting that at sea the minimum detect-able signal level is measured by injecting a simulated echo into the receiver for a specific condition of interest and determining the weakest signal level detectable by the sonar operator Therefore in practice the computed figure-of-the merit for the sonar system reflects the array gain established by the existing signal and noise fields and not the directivity index For a homogeneous com-pletely correlated signal field and an uncorrelated uniform noise field the array gain reduces to the directivity index value
Space--Tinje Correlation Funrtion
The ahilit8y of ~ J Iarray to discriminate against plane waves is determined hy the coherence of tjhe waves at various points on the array Thisimplies that a correlation function description would he a meaningful measure of how far apart the hydrophone elenrents may he and still preserve the phase coherence o f the signal and also of the coherence introclucrd in the noisefield bythe element spacing If the ampate of Irnou-ledge is the value o f the pres- sureat two arhitrary points ( X ) and ( X ) andtime instants ( t l ) and ( h ) then the coherence may be described by averaging the product of the pressures either tem- porally statistically or spatially
Inthe case of time averaging the representation is called the space-time correlation function +(XltX2tzgt and is expressed as [C21
4 ( X l h j S P t ) = )( p Xtl) p (X) ( 5 )
where the angular bracket refers to a time average Statis- tical averaging corresponds tothe different possible states of the rrledium If the pressure waveis ergodic time averaging and statistica1 averaging yield identica1 results depending only on the time difference T = tz - t l For a spatially homogeneous process the spacetime correlahn functiondepcnds only on the coordinate difference T = X - X y = Yz - Ylz = Zz- 2 Thus for a station-ary and spatially homogrnwus random process
$(XltlXztz)= + ( X - X 1 T j = ( p ( X l t ) p ( X s t+ 7 ) )
(6)
and wouldyield equivalent results if averaged spatially 4s the distance between points and the difference hetn-een time instantsincreases the correlation function decreases
Vor anisotropicnoise field whitened and band- limited to one octavegt the zero-lag space-time correlation function for a lirlmr arra parallel to the I axis is [SS]
S(395)- Si(27rS)$( r O) = - (7)
2TC
Pz
0 8
o 06 U v)Ing 04 U
p 0 2
Ic---t--t-------- xg 4
OZwg I O li2=-l6 18 20W N
-02-r SPACiNG (IN WAVELENGTHS)
Fig 12 Crosscorrelation of octave hand noise
where (x) is the spacing in wavelengths and S ( r ) de-notes the sine-integral Figure 12 shows a plot of p(rO) as a function of the separationin wavelengths at the lower cutoff frequency Numerical cvaluat~ion indivwtes that the correlation is essentially zero hen ( S ) is greater than 0348 It may be generalized that the effcctive dirw- tivityfactor for uniform noise for a sct of receiving elements arranged arhitmrilp ill space is X providrcl tlrat the spacing betwen adjacent elemcnts is oqunl to or greater than a half-vavcleagt4h ~ t t he gromctric r r l rnn frequency of the band [04] This v a ~given earlicr for the specific case of a linear array
Wideband Reception
When the directivity index of an array has Iwcn mnxi-mized a t a single frequency nttcrnpting to oprraic the array in trankmission with signals of finite bantlnitlth or in reception 7vith background noise of finite bandwidth may seriously reduce the DT
The amplitude shding rcquircd to rnaxilnixr thr dirrct-tivity index in reception for any spectrur~may h r drtcr-mined by considering the space-correlation funampon of the noise field Shxinrizing the receiving response of an arrcly depends almost entirely upon these noise corrrlations and requires selecting that shading which will cancel the coherent parts o f the noise rccamped 113-the various c l a n c ~ ~ t s as much as possible As was stated previonsly if the spacing is sufficientlywide so that thrrr islittle 11oisc coherence little can be done to maximize tbe directivity index by using nonuniform shading
By applying the method of Lagrangian nlultiplicrs Faran and 1lillq [C] have used the space noisc correlation function t0 maximize the directivitv index They s h o ~ e d that theD1 of a broadside linear array nlaximized for operation a t a finite bandnidth is less tlrnn the XfLgtIfor operation at a single frcquency hut i s much grmtrr t 8 h n n the D1 realized by using tshc sinamp frequrncy dcsign it t h e finite bandwidth
The presence of self-noise in the individual elenrents of an arrav or their preamplifiws may srriously rrduce thn effective gain of the array designcd for maximunL dirrc-tivit8pindex This degradation of perfonnancct is parf8icu-lady enhancrd if theamplitude rhatlirrg of m y o f thr
SOUND WINDER
elements is considerably larger than the overall value required for uniform shading Thissituationmaybe considerably improved by designing the array for maxi- mum effective gain in the presence of self-noise
A problem of particular interest is the abilityto charac- terize the information in a modulated signal For a linear array of discrete point elements if the element spacing is less than the modulation wavelength then the directional properties of the array will not be appreciably reduced An order of magnitude for the modulation wavelength (h) is the product of the velocity of sound ( c ) in the medium and the period of the modulation (lmodulation bandwidth = F ) X W 2cF If thisconstraint on the element spacing is met then the level of the normalized mean-square response for amodulated signal will be nearly that for a signal of a single frequency within the band [SS]
When the modulation wavelength is much less than the element spacing it is convenient to determine the response as a function of time and of angle For a linear array at broadside the response as a function of time will consist of a single signal having the sameshapebutgreater amplitude thanthat received by each element As the bearing off the MRA is increased the beamwidth will increase and cause the response to be spread over alonger period of time Due to interference between the signals from the separate elements the amplitude response will be reduced relative to that atbroadside A further increase inbearing willminimize the interference resulting in a time response comprised of a series of signals correspond- ing t0 each element When this occurs increasing the bearing will increase the distance between individual signals and consequentlyspread the response over a longer period of time Furthermore all amplitude levels of the response will remain fixed
Superdirectivity
A maximum or super gain array [67] [SS] is one whose mainbeam is narrower than that from an array of the samelengthandoperatingfrequencyhavinguniform excitation This increases the effective directivity index of the array which may be considered as an increase in thetotaldetection threshold of the system Therefore a super gain array is particularly attractive in applications requiring detecbing signals in the threshold condition [SS] The use of super gain arrays in transmission and reception results in large losses inarray efficiency and involves maintaining close tolerances of the amplitude and phase characteristics of thearray elements The severity of these tolerances tends to increase with in- creasing improvement in directivity In addition receiver self-noise is a major consideration in realizing super gain In underwater acoustics sea and own-ship noise levels at low frequencies may be much greater than the thermal noiselevels of the transducer elements and their pre-amplifiers Although directivitypatternshavinganar-rower beam than may be obtained from uniformexcitation
UNDERWATER 307
of an aperture of the same dimensions are theoretically possible the realization of such patterns is characterized by severe restrictions of bandwidth element spacing op- erating frequency and a susceptibility to inhomogeneities in the medium in the vicinity of the array
Digital Beamforming The advantages of a digital beamformer with respect to
an analog beamformer are
simplifies data handling less size and weight formation of many simultaneous beams with minimal
increase in hardware complexity deleterious effects of noisy sensors are minimized amplitudeandphaseweightingsareindependent of
frequency beamforming algorithms can be implemented as soft-
ware in special purpose mini-computers
A typical beamformer model is one where each hydro-phone output is sent to an AGC amplifier followed by an ADconverter whose output is time sampled and de- layedamplitude weighted and summedwith other similarly processed hydrophone outputsto form the beam The AGC amplifier is required for dynamic range compression and normalization reducing the operational constraints on the ADconverterTheADconverter or quantizertransformsanaloginformation to digital informationor binarynumbersThe effectiveness of quantization depends on the number of quantizing levels the step size and the input signal-to-noise ratio as well asthe dynamic range backgroundfluctuationsand conversionaccuracy Thetimedelay corresponds to delaying the entirebinarynumberthetimedelay ele-ments are usually obtained with digital shiftregisters The amplitudeweightingfactorprovidesadditional degrees of freedom prior to summing When carried out digitally the weighting corresponds to shifting the symbols or bits representing the binary number resulting in weightings of multiples of one-half
When the beamformer employs a one-bit quantizer or hard-limiter it is referred to as DIMUS (DIgital MUlti- beamSteering) [70]C71-j The reduction in signal-to- noise ratio (SNR) by extreme clipping at the beamformer output without post-filtering is a function of the input SNR and the number of staves used to form the beam Measurements indicate that the clipping loss against noise is about 24 dB minimum and against reverberation it is about 30 dB minimum
Thedirectivitypattern of a l-bitdigitalbeamformer has a distorted slightly narrower major lobe and higher sidelobes than a linear beamformer [72] In practice the sidelobes for a DIMUS-typesystemareabout -14 dB to -16 dB This may result in poorer spatial discrimina- tion against reverberation dependingupon thetrans-mittingdirectivitypatternthan a linearbeamformer Filtering the output of the beamformer may reduce some of the deleterious effects However it is quite doubtful
308
that performance can ever be achieved comparable to the linear beamformer over the full range of input signal-to- noise ratio multiple targets and reverberant fields
Analysis of multibit quantization [73]-C781 has shown that for an uncorrelateduniform noise field the on-target array gain increases monotonically with the number of bits of quantization with the array gain at 4bi ts per channelapproximately equal to that of an ideal linear beamformer From the point of view of achieving maxi-mum array gain a 4b i t optimum quantizer is therefore adequate for the conversion of analog signals in each channel to digital numbers prior to delay compensation and summing The optimum quantizer step size normal- ized with respect to the variance of the input noise for a given number of output levels (or bits) varies with the input SNR I t appears that an optimum step size exists for the small input SNR which is of primary interest for long range detection-active or passive
H ADAPTIVE ARRAY BEAMFORMING Adaptive array beamforming refers to the technique of
placing points of insensitivity or lowered response of a receiving beam pattern in the direction of large far-field coherent noise sources This will reduce the total back-ground noise power received by thearraythereby in-creasing the signal-to-noise ratio of the system Coherent directional noise sources may beattributedto multiple targetsbackscatteringmultipaths self-noise mutual systems interference and jamming countermeasures This technology is presently being applied in the fields of sonar radar and seismology
Three types of spatial filters commonly used for remov-ing coherent noise depending on the performance cri- terion are
I) the maximum signal-to-noise ratio or Matched filter 2) the minimum signal distortion or Wiener filter and 3) the minimum total probability of error or Bayes
filter For an array of N elements the spatial filtering properties of these filters are the when detecting monochromaticsame signals and all require the measurement of N Z correlation coefficients and a 2N X 2 N matrix inversion However their temporal filtering properties are generally different as well as their areas of application The three filters can be designed to operate in an adaptive mode which permits the system to operate efficiently in a changing environ- mentThedirectapproach to adaptivityappears to be quiteimpractical since it requires a large number of correlators for determining the correlation coefficients and a large capacity computer to perform the operation of matrix inversion This process would have to be repeated periodically since the input noise background statistics are usually changing Also an infinite statistical sample would be required to obtain the exact correlation coeffi- cients-whichisimpossible Thiscomplexitymay be avoided by applying a gradient-search method One such algorithm is the method of steepest descent The per- formance criteria given above are approached systemati-
IEEE TRANSACTIONS ON SONICS AND ULTRASONICS SEPTEMBER 1975
cally by changing the weight vector along the direction of the estimated negative gradient vector of the error surface
DICANNE
A straight-forward approach to null steering is called DICANNE(DigitalInterference Cancelling Adapthe Null Network Equipment) the block diagram is shown in Figure 13(a) It is assumed that there is a priori in-formation of the directions of arrival of the interfering ( T z )and target (TI)signals and that I T2 I gtgt 1 TI1 ie the small signal case The essence of the techniqueis to generate an estimate of the interfering waveform For a plane wave interfering noise source in an isotropic noise background the p2-estimate is the output of aconven-tional with element weighting beamformer uniform divided by the total number of elen~ents used for estima- tion ( N ) Thisrepresents an ensemble average of all element interfering waveforms which are in-phase amph one anotherpzis then subtracted from each elementwave-form(phased in the T2-direction) generating a residual signal which contains information of the target and iso-tropic noise field and a minimal of interfering waveform The set of residual signals are then restored to their original phase relationship An estimate of the target may then be obtained by conventional beamformingin the T1-direc- tion followed by adetectorand display for temporal processing The null steering processor causes each omni- directional receiving element tocentera null on the interfering source asillustratedin Figures 13(b) and 13(c) The depth of the null will depend on the precision of the subtraction process
The processing gain ( G ) for this method defined as the ratio of the output SNR to the input SNR is given by
where S N i l and h are the powers of the desired target incoherent isotropic noise and coherent directional noise respectively The term U is a function of N andthe amplitude and phase errors in the subtractionprocess For very large coherent noise sources (Vcgtgt N i gtgt S ) the processing gain is primarily dependent on the amplitude and phase tolerances of the hardware In the absence of coherent interference (hT= 0 N gtgt S) there will be a reduction in the processing gain depending on the number of elements used for the spatial estimate Theeffectiveness of null steering is also limited by the phase errors intro- duced by near-field sources and the asymmetry of the element-to-element amplitudephase response The errors may be greatly reduced by applying feedbackerror-control to each element (after phasing in the T2-direction) In sea testsagainst ship-generated interferences the DI-CANNE processor consistently formed nulls 10-15 dB deep
309 WINDERUNDERWATERSOUND
CONVENTIONAL BEAMFORMER
FOR TI
DETECTOR
( 0 1 BLOCKDIAGRAM OF NULL STEERING PROCESSOR
900
I600
( b) OMNIDIRECTIONAL PATTERN OF ELEMENT ( c 1 ELEMENT PATTERN WITH NULL STEERING
Fig 13 Principle of nullsteering forplane wave interfering noise source in isotropic noise field
Bayes Filter The null steering technique described above is the
degenerate form of a Bayes spatial filter used for optimally processing against a plane wave coherent noise background [Sl] The desired likelihood ratio (LR) to be compared to a threshold value for detection is defined as
(fn(x - Pgt)LR = (9)f n (x)
where x is the observation vector fn(x) is the probability density of x when the signal vector y is absent and the brackets implies averaging over the signal ensemble ( S
The Bayes optimumspatial filter for detecting plane wave Gaussian signals in additive Gaussian nonisotropic noise fields requires a frequencydependent amplitude and phaseweightingnetwork to be applied to each array element In t3he small signal case f n (x - y) can be ex-
panded in a Taylor series about x and the magnitude of x is essentially determined by the background noise field The likelihood ratio criterion reduces the problem to one where the element weighting network subtracts the best linear estimate of the coherent noise component from the received waveform and delays the residual signal on a common plane perpendicular to the direction of the desired signal Assuming hr-array elements the Bayes filter is comprised of NZlinear filters followed by conventional beamforming for each possible signal direction It also requires the measurement and inversion of a 2X X 2N noise correlation matrix a t each Fourier frequency com- ponent in the band
The Bayes filter uses thespectral correlation of the noise field to reduce the noise power through a subtraction process The estimator beam and signal beam are opti- mum-in the Bayes sense and the residual voltages used to form a beam in the direction of the signal will contain
310
a smaller component of the interfering point source than thosein DICANNE The Bayes spatial filter produces deeper nulls and greater processing gain thanDICANNE and in additiontends to cancel all quasi-stationary received noise field componentswhichhavespatial co-herency
Matched Filter Figure 14 shows an example of an adaptive technique
to discriminate against coherent noise in a narrow-band system using the signal-to-noise ratio as aperformance criterion CS2] [83] This is accomplished by changing the gains ai and bi of the ith element according to the method of steepest descent The resulting algorithms are
ai+ = a(z + -2p [ - s i ( t ) s ( t )dt T S
and
where S and N are the signal and total noise power respec- tively T is the period of the center frequency of the band T4 is a time delay which makes the delayedsignal orthog- onal tothe undelayed signal for maximum parameter sensitivity andp is a fixed step change for the lth iteration
(c) Fig 14 Example of adative technique to discriminate against
coherent noise in narrow and system (a) System to be optimized (b) Beam patterns optimized against omnidirectional random noise (c) Beam patterns optimized against omnidirectional ran-dom noise plus a strong interfering signalat -15 The interfering signal is equivalent to coherent noise The adaptive process gen- erated a null about 50 dB deep in the direction of the interfering signal
The method requires 41V correlations for each iteration in the direction defined by the gradient The signal pro- posed for measurement of the signal correlations is a test signal that is injected into the system andproperly phased so as to retain the direction of the desired target For best results recorded target echoes should be employed The noise background required for measurement of the noise correlations may be obtained by transmitting a ping in the expected direction of the targetand receiving the noise and reverberation(orclutter)fromtheexpected range of the target with no target present For the small signal case the signal correlations may not significantly effect the gradient-search procedure and may be omitted A computersimulatedexperiment shown in Figures 14(b) and 14(c) illustrates how the method effectively suppresses a strong coherent interfering signal generating nulls 50 dB deep However the degree of suppression is very sensitive to small changes in the bearing of the interfering signal to the tolerance of gain control of ai and bi and to the statistical fluctuations of the measured correlations due to the finite integration time ( T )
Wiener Filter The application of the methodof steepest descent to the
otherperformancecriteriaie the Wiener and Bayes
IEEE TRANSACTIONS ON SONICS AND ULTRASONICS SEPTEMBER 1975
filters [84] tends to provide simpler implementation of thearray processor The system now requires a priori information of the direction of arrival andspectrum of the target signal only-but not of the noise field It does not directly require the computation of any correlation coefficients but only needs to store thevalues of amplitude weightings
311
1cor vidd)and signals the array processing filteris conlprised of a tapped-dclay line with linear multipliers The processor output signal y ( t ) is formed from the summation o f all delayed and weighted input signals x ( 1 )
NL
y ( t ) = c r i ( t ) W i = W X ( 1 ) (12) i=1
Lvhert WT is the transpose o f the weight vector x ( t ) is the receivcd-input vector I is the number of tap points of tho filter having I - l time delays of A seconds each and is tho nurrher of array ckments For narrow-bandAlsquo
signals the processor for each element reduces to a complex gain bveighting and a single time delay of A equal to 74 seconds as tlescrihed for the matched filter ahove
If thetargct signal and allinterfering noise sources arc assumed statrsquoionary zero-mean random processes and that the signal and noise processes are uncorrelated then the optirnunl veight vector W of a Wiener filter is one whichnliuirllizes the mean-square-error between the desired target Lvaveform q ( t ) and the array processor output y ( t ) This is achievd by the weight vector W given hy the Wiener-Hopf equation
W ==R-rsquoP (13)
wllero R is the syrnnletric correlation matrix ofrsquo the received signals and P is the cross-correlation vector hetween the received vector x ( t ) and the target waveform ( ~ ( t ) Approaching the weight vector Wby the method of steepest descent the algorithm is
W ( k + 1 ) = WCkj + p [ P - R W(k)] (14)
where h is the step size at each iteration Modifications of this algorithnl are
J$rsquotiiLYI I Llsquo
w(k +-1) = W ( k j + r r [ y ( k )- y j k ) ] x j k ) (15)
Crirsquoith S
wjx f 1) = W( )-t - y(k)x(k j ] (16j
Widrovs tcchnique [S51 is to itcrxtr t hc wight vcctor ill the dirwtiorl of the instantaneous squared error This rcquirw the us( o f a pilot-signalwhich generally leads to a biased solution GriKiths technique [S61 is a combina- tion of the steepwt descentalgorithm and Widrowrsquos algoritlltrl---it requires anestimate of the target signal cross-correlatiorl vector P (inlieu of a pilot-signal) and a nwasurelnent of y ( t ) and ~ ( t ) Both algorithms converge to the optimunl processor ( W)in the limit as the number of adaptations l m o ~ n e slarge also the step biee in each is houndcd from above by the reciprocal of the total input power lsquorhcse techniques are analogous to those proposed for adaptive equalization o f digitalconmnmication sys-terns to rnillinliee the intersymbol interference caused by rnediuln sprtading
In a preformed beam sonar adaptive arraJ- bcamform- ing climinltcts the fluctuation and bias effects of the
THRESHOLD
A gt - A C C E P T A AltO-REJECTA
Fig Logical sidelobe eliminatioi very simple kut
effective algorithm for eliminatingdirectional interference
coherent interference on the bcu~nslsquol71~efluctuation refers to the random component of the spatial power distribution and bias is the uncertainty ahtrut the mean component which represents the actualdistrsquoribution Clearly detec- tion would then be limited by the fluctuation and bias effects of the remaining isotropic colnponent of the inter-ference Finally it appears that adaptivearray beam-forming lends itself more readily to tracking rather than detectionapplications since it requires an ttstimate of target bearing and cmss-correl~tion vecf or between the received vector wavefornl and thc target ~vaveform In fact the initial operation for inlproving detection may be first estimate thetarget wavefornl twforc applying the detection decision
Logicul Switching Algorithms
Logical switching Side1obc Elirninatim (SIZ) [S7] [S81 is a very simple but effectivc algorithm for elirninat-ing interference in sonar receivers When a strong signal is received on any sidelobe of thc receiving directivity patternappropriate threshold gstingutilizinglogical switching algoritrsquohnls cuts off the receiver for the duration of the signal only This vonld eliminatedisplay and operator overload
A logical switching SLE syxtrrn fornls two directivity patterns ldquoArdquo andldquoBrdquoPatternldquoArdquo rcpresents the conventional narrotv-beam receiving directivity pattwn Pattern ldquoBrdquo representsanauxiliary or cwntrol pattern which is considerably broader than ldquohrdquo A I I I ( rsquo ~ S U I rsquo Co f the amplitude modulation of the interfcrence field is made with ldquoBJrdquo a weighted estinlatc is formed and threshold compared with the acoustic f i d t l of ldquolrdquo aftw col~ventional beamformlng Therefore the SLK technique utilizes t8he relative difference in levcls o f ldquoAJrsquo andldquoRrdquo tvhich dcpctnds upon the direction of the irltrrferencc and trsquohrrtshold logical switching If a s h n g signal isin tile side1ol)e of ldquoArdquo the output from ldquoArdquo is smaller than that from ldquoUrdquo and a logic gate prevents the signal fro111 reaching the processor and display If the signal is in the intersection of ldquoArdquo and ldquoRrdquo the output from ldquoArdquo is largctr than that from ldquoBrdquo and the signal reaches thc processor and dis-play Thus the spatial pattern presented to thc display is that portion of the conventional pattern highrrthan
312
the control pattern The SIX algorithm is depicted in Figure 15
An SLE system would enhance the performance of active sonar track receivers It has the advantages of conceptual and hardware realization simplicity with corresponding low cost A consideration that may reduce the effectiveness of an SLE systemis multipletarget interaction Although simultaneous multiple targetsare not too likely to occur in actual operation range and velocity gating would greatly minimize such interaction
The techniques discussed earlier for adaptive array beamforming utilize coherent subtraction matrix inver-sion and gradient searchTheyhave theadvantage of never hlinding the receiver ie it is always on-line Although they are optimum in the processing sense what they also have in common is hardware complexity con- siderable cost and extreme sensitivity to channel-to-channelunbalance caused by hydrophone failure toler- ances and background nonstationarity The suboptimum SLEsystem with its simpler and lower cost structure may prove to be the most operationally effective approach for eliminating coherentdirectional masking backgrounds I t is recommended thatthe sonaroperatorhave the option to switch the SLE inor out of the receiver
An example of simple logical switching nonadaptive receiving arrays is the use ofon-off switching of the elementsin a logical sequence to gmerate a directivity pattern with reduced sidelobes (re the static pattern) The measured time-modulated patterns shown in Figure 16 illustrakthat logical scqucntial svitching can produce N-dR sidelobe level Chehyshev distrihutions (re dB theoretical) [SS] The advanOages of this technique are that it reduces the effects of system tolerances and pro-vides the flexibility of matching the sidelobe pattern to the operational environmentie it is adaptableThe effectiveness of the algorithm would depend upon the tradeoff of sidelobe level and array gain reductions and sideband pattern effects
Spatial Threshold Xormalization Spatial threshold normalization (STN) is an example
of incoherentsubtraction n-hich may be applied to a preformed beam sonar system I t is effective in reducing coherent noise and large transient spokes due to machinery noise and those induced electrically It also tends to normalize the rms fluctuationdue to distributed back- ground noise sources
A plane wave representing the target will essentially be contained in a singlc preformed beam while adjacent beams will have considerahly more noise than signal STN is accomplished by subtracting the average of the background noise present in adjacent beams from the beam containing the target Thus the noise threshold in each beam is estgtahlished by a spatial estimate of~both the coherent and incoherent noise in a space sector containing the beam For example consider five adjacent detected beams designated iz B C DE where the target is as-sumed to be in the centerbeam Then a signal output
IEEE TRANSACTIONS ON SONICS AND ULTRASONICS SEPTEMBER 1975
STATIC 1MbSlDELOBE LEVEL ~ SWITCHED 50dbSlDELOBE LEVEL UNIFORM OlSTRlBWTlON CHEBYSHEV DISTRIBUTION
FIRST SIDEBAND PATTERN lOdb STATIC WbSWlTCHED
Fig 16 Measured time-modulated pattern for sidelobe suppression
of the STN matrix is given by
1STN output = C - - ( A + B + D + E ) (17)
4
This may be considered an approximation to a derivative operation Therefore the STN output will tend to follow the rate of change of the detected or correlation envelope reducing dynamic range The dynamic range will be compressed by a factor of a t least 2 1 This method also tends to suppress any beam-to-beam unbalance although it will probably be insufficient for an operational sonar There are many variations to the above algorithm It is important to note that this general technique does not require any a priori information of the acoustic field
I DYNA41ilIC RANGE COMPRESSION ANDNORMALIZATION
The sonar receiver must have sufficient dynamic range so that it can detectthe weakest signal and yetnot saturate upon receiving the largest expected echo re-verberation andambient noise If theoutput of the receiver is fed directly to some form of data processor1 decision device such as a digital computerthenit is necessary to prevent relatively large interference from overloading the capacity of thecomputer A display console operator is affected by distinctive changes in the displaypresentation and thus requires the best display contrast in the vicinity of the returning echo The opti- mum display background for target recognition is one which has a constant temporal variartce at a given bearing and a constantspatialvariance at a given range This presents a backgroundwith uniform fluctuations as a function of range and azimuth resulting in maximum target detection sensitivity These properties arenot inherent since sonar systems operate in the presence of a
RECEIVED LEVEL(db1 DRCNOUTPUT LEVEL
SURCACESURCACE -SURFACE-SURFACEBOTTOMBOTTOM REVERBERATION REFLECTIONSREFLECTIONSREVETRATION
REVERBERATION
RANGE RANGEIDYNAMICDYNAMIC COMPRESSIONCOMPRESSION
l I I 1 1 1 I 1 l I I I 1 i AND 00 11 22 33 44 55 66 77 00 99 NORMALIZATION
BLOCKTIMETIME (SECONDS)(SECONDS)
U FigFig1717IdealIdealperformanceperformance ofof DRCNDRCN blockblock inin activeactive sonarsonar
313WINDERUNDERWATERSOUND
directive time-varying noise and reverberant field and objectives Therefore since reverberation is a signal-in a randomly varying transmission medium generated noise which depends on the acoustic properties
In order to properly evaluate the received information of the medium (eg attenuation coefficient phase veloc-it is therefore necessary to have a referencz or threshold ityandboundaryscatteringstrcngths) dynamicrange level which is independent of the direction and propaga- and normalization constraintsmay be controlled to a tion of the receivedwaveform and the limiteddynamic considerable degree in the transnlitter Thesc constraints range of the receiver The techniques used t80adapt the are further-ontrolled in the receiver by using a preformed high dynamic range of the received signal to the limited beam systenl and thm applyingeachbeam output to a dynamicrange of the display and to obtain a constant narrowband gain control rrceiver nith possible provision spatial and temporal variance background on the display for doppler normalization are referred to as dynamicrange compression and nor- The limiting interference in passive sonar is ambient malization (DRCN) The methods employed are denoted noise since there isobviously no reverheration In practice by the DRCNblock shown in Ipigurc 5 and arerequired to there are large variationsin noise power from hydrophone optimize performance in the processor and display These to hydrophoneresultingfrom the directivityand non-aspects are clearly understood when viewed with respect stationarity of background noise Thissituation isen-to the two types of sonar operation-active and passive hanced by the machinery and flow noise of the receiving sonar platfornl Dynamicrange is generally not a stringent
The limitinginterference in activesonaris sound re- design parameter so thatspatial normalization only is flected or scattered hack to the receiver Since the ocean theprimary consideration In passive sonar these con-is multilayered and anisotropic the scattered returns or straints are controlled in a n-ideband receiver employing reverberation forhigh energy transmissions establish the a preformed beamsystemand hard clipping Hard clip-primary requirement for dynamic range compression and ping simplifies such problems as automatic level control normalization rather than ambient noise Ambient noise and normalization before applyingthresholdingtech-becomes significant only a t long ranges after thereverbera- niques andmayhe incorporatedineither the signal tion has sufficiently decayed These aspects are shown in processor or the beamformer Figure 17 The purpose of the DRCN block is to produce A complete spatial normalization can only be obtained a uniform output for the input shown The reverberation if coherent noise sources arc climinated Thismaybe waveform was recorded on a shallow water omnidirectional accomplished by employing thcadaptivt beamforming sensor following an explosive charge in deep water The techniques discussed in the previous section initial return issurface revcrherationwhich decays rapidly The concept of dynamicrange compression and nor-into volume reverberation originating primarily inthe malization is generally omitted when studying detection DSL The remainder of thereturn is due to multiple andestimation theory Its importance however cannot reflection and scatteringa t the surface and bottom bound- he overstressed---itwill usually inlake or breaksystem aries These slowly decay into the ambient noise back- design since it sperifies the integratgtionof a theoretically ground designed optimum processor to it8sinterfacesie the
Withactivesonar the designer is free to choose the operational environment and the humanobserver acoustic properties (amplitude frequencypulselength)
Gain Control Receiversof the signal the transmission mode (RDT and scanning sonar) and the propagation mode (surface duct bottom A constant temporal variancr combinedamph a fixed bounce convergence zone) required to meetgt mission thresholdgives a constant falsc alarm probability (CFAP)
314 IEEE TRANSACTIONS ON SONICS AND ULTRASONICS SEPTEMBER 1975
T R A N S M I T T E R E C O V E R YP U L S E W I D T H TIMET V G _I
Fig 18 TVG control waveform
to t8he displa reducing the minimum detectable level For a constant output bardwidth this implies a constant false alarm rate (CI1l) A constant temporal variance requires the hackground to have statistical stationarity Since reverberation isnonstationary CFAP canonlybe achieved by employing a tinle-varying threshold or by transforming the reverberation to a stationary process prior to fixed thresholding At present sonar technology employs gain control rwtwers
The optimization o f receiver design requires a con-sideration of the dependence of reverberation on the transmitted signal the ratc o f change of reverberation amplitude with t h e and thestatisticalnonstationarity of reverheration I n addition optimization is dependent upon the rate of change of reverberation configuration between difftrcnt transmissions or pings
In all cases to he discussed the gain of the receiver varies as a furlction of tirne and thus range after the emission o f thc sonar pulse What distinguishes one re-ceiver from the other isits gain control characteristic and how well it is mat~ched to the highly variable ocean en-vironment
U ) Time-Furzetl (hin
Time-varicd gain (TV() controls the receiver gain so thatitfollow a prescribed variation withtime inde-pendent of the prevailing hackground conditions [go] [Sl] TVG is accomplished hy generating a voltage waveform of a prescribed waveshape and applying it as a bias to a recviver amplifier The question arises as to what is the appropriate-aveshapc that must he generated For the simplification of instruInentation and for ease of adjustment T V ( action is obtained by charging a capaci- tor with a negative voltage during the transmispion cycle and after this cycle discharging the capacitor through a shuntresistorThe overbias voltage then decays ex-ponentially to the r~ormalhias level Thus the amplifier is designed to h~vt a gain i n dB that is approximately linear with the I)iasvoltage
TheTVG waveform is sholvn in Figure 18 It is a function o f tz-o paran~eters iethe voltage t o which the capacitor is charged and the rate of capacitor dis- charge (recover time constant)Initial reverberation returns h a v c t ~ W I I measur(din e x e s of +35 dBIn practice the iriitial reduction in gain is about f40 dB
which usually satisfies most visual and audio require- ments The recovery time should be as rapid as possible and still be consistent with the desired rcduction in re- verberation and to prevent saturation by strong echoes fromnearbytargets The recovery time constant is in general from 05 to 10 second
Adisadvantage of TVG is that the variation of gain with time does not follow any of the basic laws of reverberation theory For long range sonars in deep water the intensity for surface and bottom reverberation varies inversely as the cube of time (range) and for volume reverberation it varies inversely as the squareof time (range)In addition TVG is only sufficient if the reverberation is uniform in azimuthand monotonically decreasing in range Since this is not the case (particularly in shallow watcr) what is desired is a controlled form of TVG coupled amph a preformed beam system for azimuthal normalization each beam having its own gain control receiver Two common methods of supplementing TVG control are AGC and RCG which greatly reduce the necessity for the sonar operator t o makemanual gain adjustrnents during a search phase
b ) Automatic ampin Control
Automatic gain control (AGC) continuously monitors the receiver gain according to the prevailing reverberation [91]-[96] This technique is considerably more compli- catedthan TVG sincereverberation is a function of space time and doppler
An automatic gain control system refers to the closed- loop error-actuated gain control of a linear 11 amplifier where the error signal is proportional to the mean value of the background envelope A typical diagram of an AGC receiver is shown in Figure 19 The forward path contains a variable gain amplifier Tvhich nlay he con-sidered to be comprised of a control stage folloned by a fixed gain amplifier The feedback path contains a de-tector-averager It rectifies and integrates the receiver output and applies Ohe detected envelope t o the control stage varying the forward path gain
An AGC receiver is a type-0 servomechanism This implies that a constant error-actuating signal produces a constantvalue for the controlled variable ie a step input produces a finitesteady-state trackingerror In practice the detected envelope is compared with a fixed
315 WINDERUNDERWATER SOUND
I I FILTER DETECTOR- I h I I BANK AVERAGERlsquoS I
I I lsquo I --c BANDPASS I + 4 FILTER I I TO P P I
+ t I IBEAM - - I DISPLAY INPUT
CONTROL STAGE AMPLIFIERrsquo rsquo b
NOTCH A-D FILTER
I I - DETECTOR-I AVERAGERI I I AGC RECEIVERL _ - - _ _ - - - _ _ _ --J
I I --) CIRCUITRY
I a
I I
I CW DOPPLERNORMALIZATIONI L --------------------I
I TO P P I DETECTOR-I AVERAGER DISPLAY
I I I I I
J
Fig 19 Blockdiagram of typical sonar receiveremployingautomaticgain control CW dopplernormalization and notch filtering
voltage and the difference is used as the error signal This is called ldquodelayedrdquo AGC Its purpose is to keep the varia-tions in the desired signal level below a given value When the detected envelope is equal to or less than the reference voltage the error signal is zero and the receiver behaves like a fixed (maximum) gain amplifier Error signals greater than zero produce an 4GC action which reduces the gain
There are fourfactors which spetify the performance of an AGC receiver 1 ) dynamic range 2) flatness factor 3) linearity and 4) pulselength optimization
Dynamicrangerequirements are determined by the signal variation with range by variation in target strength with aspect and by variability of the medium and target A dynamic range of 70-80 dB is adequate for most sonar applications The problem now is to match this dynamic range to the limited dynamic range of an intensity modu- lated CRT display The displayrsquos dynamic range is usually less than 12 dB in an operational environment
The receiver output fluctuations are inversely propor- tional to the receiver bandwidth-integration trsquoime product andare enhanced by thenonstationarity of the back- ground They are also increased by nonlinearities in the gain control characteristicparticularlynear the ampli- fierrsquoscutoff bias Amplitude fluctuations will give poor contrast on the PPI and generate false alarms
A measure of the degree of fluctuation that is acceptable in the receiver output is the ldquoflatness factorrdquo The flatness factor is the ratio of the required receiver dynamic range (in dB) to the fluctuation (in dB) about the output level If it is desired to maintain an output level of 1 volt =cldB for an input level change of 80 dB then the flatness factor is 40 The selection of a suitable flatness factor is de-pendent on the form of processing that follows the i lGC receiver
Linearity refers to the input echo dynamic range that is supported by the receiver without output distortmion An echo dynamic range of at least + l 5 dB is generally re- quired and is specifiedfor the entire background change in the receiver input An AGC receiver should be provided
with a manual gain control to allow the operator to reduce the receiver gain and prevent strong echoes from saturat- ing the PPI
The basis of present AGC design is that the rate of change of the reverberation amplitude is small compared to thatof the echo The time constant is sufficiently short to permit the control stage to respond to reverberation and long enough so that the loop does not respond to the target echo A short time constant gives a fast receiver recovery time This provides good trsquoracking capability but at the expense of generating false alarms due to short- time power fluctuations As the response to reverberation is increased by shortening the timeconstantthe echo envelope becomes more distorted it will have a greater negative slope or ldquodrooprdquo which reduces the signal power However a long time constant suppresses false alarm generation and reduces echo distortion but it also reduces the receiver tracking capability To decrease the receiver recovery time when a high-level short echo pulse is applied it is necessary to shunt theresistive element of trsquohe integra-tor with a fast discharge diode A rapid discharge circuit preventsinteraction between close but nonoverlapping multitarget echoes and multipaths but it increases false alarms In general the closed loop trsquoime constant is in-versely proportional to the instantaneous output voltage saturation will then result in a long recovery time There- fore it is apparent that the ldquooptimumrdquo time constant isa compromise between several factors suchastracking capability false alarm generation echo distortion and output variance
The integrator time constant should be larger than the pulselength although the ldquooptimumrdquovaluedepends more on the rateof change of the reverberation amplitude and configuration with time It is important to remember that AGC senses the mean of the detected envelope and changes the gain accordingly For shortrsquo pulselengths of less than 15 msecs the reverberation is discrete or impul-sive in time with ldquoholesrdquo in trsquohe waveform The detected envelopeis notrsquo very well defined-itis highly discon- tinuous which tends to increase false alarm generation The
316 IEEE TRANSACTIONS ON SONICS AND ULTRASONICS SEPTEMBER 1975
time constant can he sufficiently increased to prevent this hut it is not desirable for reasons already statamp For long pulselengths of more than 500 msecs the required time constant is slightly greater than the pulselength due in part to thesmoothing effect of the medium The ability of the receiver to discriminate between reverberation and echo is somewhat poor It appearsthat for very short pulselengths thedetected envelope is too sensitive a paranletrsquoer for gain control and for very long pulselengths i t is not sensitive enough Therefore for these two cases parameters other than the detected envelope eg LLholerdquo
Fig 20 Photographs showing effectiveness of AGC operation(RDTmode-pulse length 15 msecs) (a) Preamplifier output vertical scale 02 voltsjdiv horizontal scale 02 secsdiv (b)Preformed-beam output vertical scale 001 voltsdiv horizontal scale 020 secsdiv (c) AGC receiver output vertical scale 05 voltsdivhorizontal scale 05 secsdiv(d) DC controlbiasvertical scale 20 voltsjdiv horizontal scale 10 secsdiv
time or phase should be investigated to control the re- ceiver gain For intermediate values of pulselength the timeconstant is ldquooptimizedrdquo at approximately 3 to 4 times the transmitted pulselength Forimproved per-formance when different pulselengths are transmitted the receiver should have a variable time constant circuitrsquo in the feedback patrsquoh
The effectiveness of 4GC is shown in Figure 20 for an RDT sonar system and a pulselength of 15 msecs Figure (h) depicts the effect of summing the reverberation outputs of several receiving array elements toform a beamThe reverheration attheAGCinput contains a large numher of spikes or ldquoblobsrdquo due to discrete scattering patches each ldquoblobrdquo is approximately the same width as the emitted pulse If examined closely the long pulse shown in Figures 2O(a) (b) preceding the received re-verberation decay is seen to be comprised of the original twelve pings that were transmitted sequentially (RDT mode) The reverberation in the receiver output (Figure 20 (c) ) has hem strongly suppressed but it ampill has a spikey irrftgular character including self-generated false alarms The ACC output may be considered to have a constant mean hut not a constant variance However this is a good approximation to ideal DRCN operation shown in Figure 17 The dc-bias for controlling the receiver gain is shown in Pigure 20(d)
c ) Votrlz FzrsquolteT
To optimize receiver design the background should be ldquoprewhitenedrdquo before processing u-itrsquoh AGC anda matched filter This CUI he considered as a normalization in the frequency domain For a background of reverheration and noiscl vith ponw spcctra R ( f ) and Ar(f) respectively tho tralrsfcr function H ( j ) of t8he prewhitening filter is
Thc power spcctrunl of the received reverberation is essentially the sanle as that for the transmitted signal Its frequency components are incoherent while those for the discrete echo arc cohcrently related
I n practice if the receiver is reverberation-limited the filter charactoristic given above is approximated bp the response o f a high Q resonant circuitThis is generally referred to as a ldquonotch filterrdquo The notch filter may be comhiued with t8he bandpass filter at theinput to the
AGC receiver (refer to Figure 19) to suppress reverbera- trsquoion thus enhancing the detectability of high doppler targets However this is at the expense of rejecting low doppler targets which if imbedded in a noise-limited region (ie a t long ranges) would otherwise have been discernible The notch filter may he switched in or out of the system at the optgtion of the console operator (de- pending upon target and background conditions)
A typical combined frequency response of a reverbera- tion notch filter and bandpass filter is shown in Figure 21
317 WINDERUNDERWATERSOUND
I l
-48 - J -32 -24 -16 -8 o e 16 24 32 40 48
TARGET DOPPLER (KNOTS)
Fig21 Combined response for typical notch filter and bandpassfilter
Fig 22 Effectiveness of notch filtering low dopplerreverberation
The attenuation for a zero doppler target is 40 dB and the -3 dB points are for a target doppler of about =t5 knots The required specification depends upon the charac- teriatics of the transmitted signal the target doppler and and the degree of frequency spreading of the reverberation spectrum which may be attributed to scatterer motion the finite widths of the transmitting and receiving beams and the finite accuracies of the ODN circuitry For these reasons notch filtering is not practical forlong pulse-lengths ( gtZOO msecs) with the corresponding narrow bandwidths It is importantrsquo that the amplitude response
be the same with the notch filter in or out so that hoth high and low doppler targets produce the same brightness (or deflection) on the display
The effectiveness of notch filtering is shown for a pre- formedbeamsystemwithAGC by the photgtographs of the PPI display in Figure 22 (these were taken within a short time of each obher so that water conditions may be assumed relatively constant) Withthebandpass filter only (notch out) the reverberatjon returns preventrsquo the recognition of the targetat a bearing of 280rsquo (refer to Figure 22(a)) The multiple target indication is the range ambiguitydueto a sequentialping within the echo- ranging cycle ie the trsquootal transmission is RDT followed by an OMNI pulse In addition thereis a spoking or ldquobrick silordquo effect due to the finite beam interpolation of the system This causes the reverberatrsquoion to have the same characteristic pattern as the target thus degrading target detectability With the notch filter in the circuit it is seen that the reverberation and ldquobrick silordquo effects are eliminated (refer to Figure 22 (h)) The targetrsquo shown is now a t bearing 225rdquo
For optimumperformance thedepthandbandwidth of the notch filter should be continuously controlled by the prevailing reverberation and noise This is referred to as an adaptivenotch filter Several such filters have been developed and sea tested in the past five years Bow-ever none are operational in current sonar systems Ex-perimentshave shown that anadaptive n o t c h filter in the CW receiver can greatly enhancr the detection o f low doppler targets when reverberation-limited and insure the detectmionof IOW doppler targets --hen noise-limited
d ) Post-Detection A GC An AGC receiver tends to maintain a ronstant power
outputThe AGC output is then processed by a post-detector-averager (with or without predetection filtering see Figure 19) which is matched to the transrtlitted pulse- length for maximum processing gain This permits most of the narrowband reverheration power to pass while greatly limiting the wideband noisepower Therefore during an echo-ranging cycle as the reverhcration rrturns from short and intermediate ranges slowly decay into the ambient noise (corresponding to longer rangrs) a constant power AGC output tendsto produce n timc-varying variance at the output of the detector-averagrr If t8his varianceis not normalized since t h PPI has R lirnitcd dynamic range there can he x loss of rithrr c101erange or long range targets depending on the manual gain control setting of the AGC receiver Normalizing tjhe variance will permit the sonar operator to lower the t8hrcshold and enhance the detection of noise-limitrd targets A constant temporalvarianceinput tothe display is rcquircd and may be obtained by applying the detector-avcrager output to a second AGC receiver This techniqur is callrd post-detection AGC An analysis of it is shown in krsquoigure 23
It is often stated that the reason AGC sonar rcceivcrs sometimes do not perform very well ist)r(aauw of thtt difference in statistics of reverberation and r~oiscThis i s
318 IEEE TRANSACTIONS ON SONICS AND ULTRASONICS SEPTEMBER 1975
( a ) Preformed-beam output t
REVERBERATION
I REGIONREGION
( b ) 1st AGC receiveroutput t
( c ) Post detector-averageroutput
( d l 2nd AGC receiveroutput
l THRESHOLD t =o LEVEL
Fig 23 Illustration of posedetection AGC to provide constant variance
true but the majorreason for the statistics being different appears to be primarily due tothe difference in band-widths
e ) Reverberation Controlled Gain A reverberation controlled gain (RCG) restores the
receiver gain through a capacitor discharge circuit as for TVG but at a rate controlled by the prevailing level of reverberation similar to AGC [91] RCG act8ion within an echo-ranging cycle is irreversible As the reverberation decays a sudden increase in background level will clamp the gain at its existing value When the receiver output finally falls below the previous level or somepredeter-mined threshold the gain will continue to increase accord- ing to the recovery time constant Therefore increases in background level do not reduce the receiver gain as in AGC but only delay further increases in receiver sensi- tivity RCG doesnot distinguish between slow rises in the input level caused by increased reverberation or sudden rises due to echoes An RCG system may be considered as a unidirectional AGC receiver controlling the rate of discharge (or recovery time) of a TVG circuit
RCGandAGCare equally effective in deepwater where the reverberation has a somewhat continuous decay thoughRCGmay bemore desirable since it does not distort the echo envelope Shallow water propagation is characterized by multiple surface and bottom reflections This causes reverberation to increase during reception and have a considerable number of blobs 4GC counter- acts this by increasing the control bias thus reducing the hackground level-while RCGcannotadjust t o an in-creased reverberation level and produces an increase in receiver output Comparative shallowwaterbehavior is shown in Figure 24 for an AGC time constant of about 500 msecs AGC is seen to be superior to RCG in com- pressing reverberation in shallow water
The use of several time constants in an RCG circuit improvessystemperformance For a low reverberation amplitude a short time constant of about 05 seconds is required for fast recovery For a high reverberation ampli-tude a long time constant of several seconds is required For in-betweenreverberation levels the two limiting time constants may be shared proportionatelyalthough an intermediate time constant is preferred Multiple time
- -
WINDER UNDERWATER SOUND 319
Fig 24 Comparison of RCG and AGC action in shallow water (frequency 15 kHz) (a) Receiver uncontrolled (b) RCG (c) Bias acrosscontrolline during (b) (d) AVC diode shunted by 5 meg-ohm (e) Bias acrms control line during (d)
constant RC(- TVG is an interpolative AGC Thresholds for sclectillg the time constants may be established with respect t o tgthe reverberationamplitudeabovea preset level of uniform ambient noise background on the PPI
The design of an ItCG -TVG circuit is similar to AGC It may be conlprised of an attenuator which uses field- effect transistors or diodes as control elements a detector-averager R I I ~t rorr~paratc~r circuitfor selecting the proper timeconstant (when more than one timeconstant is available) Typical values for amplitude and phase simi- larity between channels arc hO5dB andampS0 respectively
f) Logarithmic IleceWer
A technique which under certain conditions results in CEAP operathrt and provides a largedynamic range is a logarithmic receiver A block diagram of the receiver is shown in Figure 25
Tho idealiztrti logarithmic detector is characterized by r97l
y ( t ) = a l n h R ( t ) ab gt 0 (19)
where R ( t ) is the envelope of the receiver input and y(t) is the output of the linear envelope detectorThe con-stants (U) and ( b ) are the slope and gain of the logarithmic cbaracteristic respectively If the envelope is nonstation- ary it is assumed that its probability distribution depends onlyon a single time-varying paaameter m ( t ) For y ( t ) to have a constant variance it is necessary and sufficient that either C981
R-)--R(1)
- a (constant)
or
where the bar Pignifies ensemble avcraging These tests -areindependent of U ( t ) R2(t ) and R(ti are sufficient statistics ie they contain all the information necessary to make a decision The dimension of t8he decision space has thus been reduced to that of the sufficient statistic namelytwo-dimensional If ampher of thesetestsare satisfied then the output of the linear detector contains a constantvarianceand a time-varyingmeanThe time-varyingmeanmustberemovedtoobtain a stationary background A fasttimeconstant (FTlt) differentiator or high pass filter is generally used to subtgtract out the mean Another technique for removing the slowly-varying dc is with a pulselength discriminator C99-J
It was noted in Section F that as the density of the scatterers increases the reverberation tends to approach a nonstationary Gaussian process The envelope R(t ) of the process has a Rayleigh distribution expressed as
Rp(Rt) = -exp [-R22u2(t)] R E [0+m] (22)
Yt)
and satisfies the tests given above For the Rayleigh distribution the variance at t8he ontput of the FTC filter is calculated to be
Note that theoutput variance is independent of ~ ( t ) and depends upon the slope of the logarithmic lalhn- only Thusa fixed output threshold provides CFAP tmothe display
A realizable logarithmic amplifier characteristic is of the form
y ( t ) = a l n [l + b R ( t ) ] (24)
gt
B E W ENVELOPE LOGARITHMIC F TC BAND-PASS CONSTANT-
INPUT FILTER AMPLIFIER DETECTOR FILTER OUTPUT
1 l
Fig 25 Block diagram of logarithmicreceiver
-
320
Performance degradation using this characteristic in lieu of the ideal can be greatlyminimized if bR( t ) gt 1 a large gain ( b ) is desirable Also the amplifier must be logarithmic to -20 dB below the rms noiselevel This lower bound on the logarithmic behavior is quite sufficient since the probability of any fluctuation of aRayleigh distribution reaching a value less than 20 dB below the rms level is only about 1 For aninput background dynamic range of 80 dB the variance of y(t) will change byabout 025 dBTheoutputvariancedepends upon the slope for it to be independent of the input signal the slope tolerance shouldbe ampZO which is compatible with the limited PPI dynamic range
There are several factors which determine the effective- ness of a logarithmic receiver These are1) differentiation 2) probability of detection and3) display signal contrast
The purpose of the differentiator is to remove the time- varyingmean level of the reverberation Asimple RC differentiatingnetwork is generally used where the for- ward time constant (RC) is a compromisebetween the value required to eliminate the varying meanand the value required to pass the echo energy spectra Excellent results have beenobtained when the timeconstant is about 15 times the transmitted pulse length Atime constant of this order gives rise to shadows on the PPI immediately after each echo and provides a poor tracking capability These effects may be eliminated by shunting the resistive element of the differentiator withafast discharge diode to obtain a short backward time constant (about 02 times the pulselength) or fast recovery How- everthere is then areduction in signal-tenoise ratio of at least 3 dB This loss does not occur when the same differentiatingcircuit follows a linear receiver (eg AGC) It may be attributed to the increase in the nega- tive-going noise peaks at theoutput of the logarithmic receiver Therefore the optimum backward time constant is a compromise between several factors such as tracking capability shadows on display and signal-to-noise ratio
The ROC curves for the logarithmic detector (without differentiation)have been computed over the following range of parameters 001 5 P D 5 099 10-l-O 5 PPI5
1 5 n 5 100 where PB is the probability of detec- tion PFa is the probability of false alarm and n is the number of pulses integrated or summed after detection to improve the signal-to-noise ratio [lOO] It is concluded that there is a slight reduction in the probabilityof detec-tion for a fixed probability of false alarm when using a logarithmic detectorThis loss in sensitivitymaybe expressed in terms of the reduction in power of a square-law detector which produces the same loss of sensitivity The loss (in dB) is approximately proportional tothe logarithm of the number of pulses integrated Therefore for one (1) pulse (no integration)there isno loss For ten (10) pulses integrated theloss is about 05 dB while for one hundred (100) pulses integrated the loss is about 1 dB The advantages of a logarithmic detector far out- weigh the loss in sensitivity
Due to logarithmic compression and differentiation there is a lack of signal contrast on a PPI display-al-
XEEE TRANSACITONS ON SONICS AND ULTRASONICS SEPTEMBER 1975
though the background is rather uniform spatially It is especially important tohave sufficient signal contrast when operating in a high reverberant field (with a short range scale) and when there is a crowding of targets on the display (with a long range scale) By applying either base clipping or an antilogarithmic transformation to the receiver output the original signal contrast or signal-to- noise ratio may be restored without a loss in detectability
In practice a preformed beam time-multiplexed sysbem is used in conjunction with a logarithmic receiver This isrequired for background normalization without beam-to- beam unbalance An important consideration is where to perform the ODN correction (refer to end of Section E) Bandpass filtering a waveformtime-multiplexed will produceinterchannel crosstalk Also abandpass filter at theoutput of the logarithmic amplifier degrades the desired CFAP property of the receiver Therefore ODN must be performed prior to multiplexing and logarithmic actionAnotherpractical consideration is that a loga-rithmic law may not suppress high close range reverbera- tionreturns which enter throughthe sidelobes of the receiving beam To minimize these returns TVG must be used prior to the logarithmic receiver
Hard Clipping Hard clippers have three very attractive properties-
they provide 1) a large dynamic range of operation 2) instantaneous amplitude normalization and 3) high compatibility with present digital processing techniques As a result they have found extensive use in sonar system design for detection and tracking purposes as well as in other fields such as satellite communications [loll (in a satelliterepeater a bandpass clipper precedes a TWT amplifier in order to assure maximum RI+power efficiency without saturation) The input to a hard clipper is gen-erally a multiple signal input due to multitargets multi-patharrivalsand background noise Multiple signals may also be attributed to pulse overlap and echo-splitting associated with long pulse transmissions as in high resolu- tion FM sonars Recognizing that ahard clipper is a nonlinear device it is a natural question to ask what is the interaction between signals due to this particular design and how does it affect system performance
The transfer characteristic g ( ) for a hard clipper with input z ( t ) and normalized output y ( t ) is given by
I+l IO Y ( t ) = qCs(t)l= if z ( t ) = 0 ( 2 5 )I-
Thereare several properties that may be predicted for the clipper output due to the odd symmetry of the clip- pers amplitudecharacteristic [102] In general the output of any full-wave (odd) 7th-law device contains only odd harmonics of the input frequencies The hard clipper ( v = 0) output is approximately a rectangular waveformwith the samephase structureastheinput Therefore the total power in the kth-odd harmonic band
321 WINDER UNDERWATER BOUND
is equal to the power of the kth harmonicin a Fourier series expansion of arectangularwaveformThekth-harmonic power is 8 ( ~ k ) ~which is constant regardless of how the power is distributed within the band
If the signal plus noise complex is assumed to have Gaussian statistics the effect of extreme clipping without post-filtering is to transformthe correlation function T ( T ) before clipping to a new correlation function R ( T )
given by C1031
2R(7) = -sin-rsquo r ( 7 ) (26) A
where the correlation functions are normalized ie R ( 0 ) = r ( 0 ) = 1 Expanding the arcsine in a Taylorrsquos series R (7)may be written as
-1 (27)
where O ( T ) representsthe nonlinear effect of clipping Thus as indicated above high input SNRrsquos enhance the nonlinear characteristic of the clipper This produces significant power fluctuations in the output In the case of small input SNRrsquos 0(T ) is negligible and
2 R(T) 2 - r(7) (28)
n-
The reduction in SNR by extreme clipping is 2 ~or - 2 dB For small SNRrsquos a hard clipper behaves linearlywith respect to power This indicates the effectiveness of a clipper together with a power detector to detect a single signal embedded in noise-a change in signal power at the clipper input results in a proportionate change in power at thedetectoroutput Using a zonal (firstharmonic) post-filter results in a gainin the output SNRof 7r28The loss due to clipping after filtering becomes (ZA) X (w2S) or ( ~ 4 ) a loss of about l-dB results are similar for a sinusoid in Gaussian noise [104] C1051 This is true even for an arbitrary non-Gaussian signal if it is sufficiently small relative to noise
Consider aninput comprised of twounmodulated sinusoids andnarrowbandstationary Gaussian noise where the signals have random phase angles statistically independent and uniformly distributed from 0 to 2r The spectrum of the filtered output contains both discrete and continuous components [lOS]
When the noise dominates both signals the SNRrsquos decrease by the factor (aj4) as for the one signal case regardless of relative signal strength An interesting case occurs when the two signals close in frequency are of equal amplitude The ratio of output to input SNR tends to zero for both signals as the input noise decreases The explanation in part is that asthe signals are beating destructively together (the envelope crosses the time axis at the difference frequency) the noise has the opportunity
to ldquoslip throughrdquo the limiter a t each zero crossing There- forehighinputSNRrsquoscan resultrsquo in very low output SNRrsquos for signals of equal strength
When the two signals are embedded in noise where the larger of the input SNRs is -10 dB or less their relative strengths are preserved and there is virtuallyno signal suppression For large input SNRrsquos the maximum degree of suppression of a weak signal by a strong signal is +6 dB ie the weak signal is reduced by a power facbor of 14relative to the larger signal and occurs for large input SNRrsquos This signal suppression is thesameresult one would obtain for clipping a weak sinusoidal signal (or echo) plus strong sinusoidal ldquonoiserdquo (or reverberation) Working backwards (14) (8r2) = 2 r 2 which suggests thatthe relationship between the normalized autocor-relation function at the output of a hard clipper to that at the inputis approximately C107 J
2R(7) = - r ( 7 ) (29)
8 2
for a signal-to-noise ratio much less than unity The loss without post-filtering is 2r2 ( - 7 dB) Comparing the last two equations we see that a sinusoidal noise input is about 5 d B poorer than Gaussian noise
It is seen that the effect of raw data clipping on target detectability will depend not only on the input signal-to- noise ratio and noise statistics but also upon the signal phase structure which characterizes the crossproducts and associated distortionRecentexperimentshaveshown that for small signal-to-noise ratios the loss due to clip- pinglinear FM pulses is less than that for a Gaussian signal approximately l-dB If the signal plus noise com-plex is non-Gaussian as for strong impulsive type noise the loss will generally be greater than 2-dB
A consequence of signal suppression in an operational sonar is reflected in the ability of strong signals or rever-berations off the maximum response axis (MRA) to mask weak signals on the MRA Ina clipped active sonar that is reverberation-limited the effect of intermodulation betweenecho andreverberation is that as the level of one decreases the spectrum level of the other will increase If the reverberation is dominant as is usually the case this results in an increased loss of detectability If there is just signal and background noise and the signal level is nearly constant then in a clipped sonar as the noise increases the displayed signal level (ie on a A-scan) will decrease This can seriously affect the problem of classification where absolute echo levels are often required (eg to determine target strength)
J SIGNALPROCESSING
Signal processing refers to the operations performed in the time-frequency domain for detecting or extracting a desired signal from some maskingbackground The problem of greatest consideration is that of separating a given signal from random noise whose spectrum overlaps that of the signal In this case the statistics of the signals play an important role in the determination of the pro-
322 IEEE TRANSACTIONS ON SONIC~AND ULTRASONICS SEPTEMBER 1975
awREwt W ALL ASPECTS LFY AM M P a 7
ONLY
Imx)mRE)(TW L N liLL ASPECTS co(EREwI LFY 101
ONLY
20 40 I 2 4 6 8 I O 6 0 0 0 ~ ~ )zoo MLWDII)T)I-TIYPROOW1
Fig 26 Comparison of incoherent and coherent processing of pulse CW and linear FM
cessor It is necessary to select a suitable criterion and to determine how much noise may be accepted andhow much signal energy may be rejected to achieve the desired result
Basic detection theory states that a sufficient statistic for detection is the likelihood ratio [lOS] [l09] defined as the ratio of the conditional probability density of the received data vector when the signal is present to that when the signal is absent The optimum processor struc- ture is onewhich maximizes the likelihood ratio for Gaussian statistics the optimum processor is well defined
In active sonar the signal processors are broadly classi- fied as eitherincoherent or coherent An incoherent processor is one which is sensitive only to the amplitude modulation of the received waveform regardless of the doppler band signal coherence is not utilized For a given timeband- widthproductthe processing gain of an incoherent processor is generally inferior to that obtainedwith a coherent processor ie one which utilizes both the ampli- tudeand phasemodulation of the signal To maximize the detection and classification capability of a receiver it is required to process coherently For a stationary white Gaussian noise background the processor which maxi- mizes the output signal-to-noise ratio is the matched jiZter [110]-[112]whose transferfunction is the complex conjugate of the Fourier spectrum of the input signal to be detected The matched filter criterion is equivalent to the impulse response being the time reverse of the signal Since the output of the matched filter is the crosscorrela- tion function of the transmitted signal and the received signal plus noise complex the optimum processor is equivalent to a crosscorrelator
In passive sonar the problem is one of detecting a noise-like signal in a noise masking background The signal contains both coherent and incoherent components If the signal and noise are Gaussian random processes with known spectra the signal is completely characterized by its second moment so that the optimum (incoherent) processor is some form of energy detector
Active Sonar Detection The signal processing techniques employedin active
sonar receivers must be matched to the signal class and targetdynamics [113]C114-J Acomparison of signal
processing gain for incoherent and coherent processing of pulse CW and linear FM isshown in Figure 26 as a function of the bandwidth-time product and the depend- ence on target aspect It assumes Gaussian noise masking and completely incoherent scattering with the scattered energy conserved From an initialdetectionpoint of view there is often little to be gained in processing co- herently when the bandwidth-time product is less than 100 This is supportedby the fact that in practicea coherent processor has greater hardware complexity and morenormalizationproblems which produce losses in processing gain for a multichannel (gt10 channels) system it can be as much as 4-10 dB Incoherent process- inghas the desirable feature that it is independent of target aspect thereby providing reliable processing gain undermostoperational conditions However it is not doppler sensitive and thus does not provide information on target range-rate The efficiency of coherent processing with respect to target aspect depends upon the type of signal transmitted the latter also determines the range and doppler resolution ambiguities of the system
Since the signals most successfully utilized in an opera- tionalenvironmentare pulse CW and linear FM only their processors will be discussed here The CW processors are shown in Figure 19 designated post detector-averager and CW doppler normalization both preceded by a notch filter and AGC receiver The linear FM processors con- sidered are the post detector-averager clipped and linear DELTICcorrelatorsandpostdetection pulse com-pression
a ) CW Processors The post detector-averager is anincoherent processor
comprised of an envelope detector followed by an integra- tor or low-pass filter matched to the pulselength of the transmitted signal The detector is a nonlinear device which has a square-lawbehavior for weak input signal levels and is realized with a full-wave or half-wave recti- fier For a receiver bandwidth ( W ) and signal pulse- length (T)the processing gain against noise is approxi-mately 5 log WT CW envelope detection will not provide any processing gain against reverberation since the signal and reverberation bandwidths are almost equal
323 WINDER BOUND UNDERWATER
cw LINEAR FM - ~
Fig 27 Effectiveness of incoherentprocessing of ~
linear FM
Coherent processing is achieved by predetection or doppler Jiltering prior to envelopedetectionDoppler filtering is obtained with a bankof contiguous narrowband (comb) filters in cascade with the output of the beam- former (plus ODN and AGC) The filter bank subdivides thetotal received bandwidth rsquo into small bandwidths inversely proportional tothe pulselength The received signal will pass through one or a t most two of the in- dividual filters depending upon thetarget doppler and the degree of time and frequency spreading due to target structureand motion The signal-to-noise ratio is im- proved by an amount proportional to the ratio of receiver inputbandwidth ( W ) to filter bandwidth ( B ) If the postintegrationbandwidth is ( l T ) thenthetotal processing gain against noise is approximately equal to 10 log W T - -5 log BT The second term is the effect of a mismatched input filter maximum gain is obtained when the comb filter is matched to the signal spectrum There is no improvement in performance when the system is reverberation-limited since the power spectrum of the received reverberation is essentially the same as that for thc trsquoransmitted signal
Doppler filtering applies the information contained in one acoustic beam to many channels thereby increasing thedatarate of the receiver If all of the information channels are displayed simultaneously on a CRTand examinedbya single sonar operatorexperimentshave shown there can be a considerable reduction in processing gain (for small signal-to-noise ratios visual scanning can reduce the processing gain in dB by about3 of that which can beobtained using matched filtering)This loss is attributed to the limited data-handling capacity of the operatorandtothe increase in the number of ldquofalse targetsrdquoThedataratecan bereduced to that of one channel by employing ldquoORrdquo-circuitry at the outputs of the filter bank
By ORrsquoing the envelope detected outputs of a bank of doppler filters the data rate of the system is the same as if the channels were monitored individually the size of the display canthenbegreatly reduced However combining the channels bymaxima (an OR-circuit re-spondsinstantaneouslytothemaximumamplitude) produces a loss in signal-to-noise ratio which is a function of 1) the signal-to-noise ratio 2) the probability of false alarmineach channel 3) the number of channelsand 4) the channel-to-channel output balance Channel un-balance is further pronounced by reverberation returns which candominatetheoutputs of several of the low doppler filters (althoughthe sidelobe structure of the product of certain transmitter-receiver beam patterns and ship speed can produce reverberation in intermediate doppler filters as well) These outputs can subsequently capturethe OR-circuit and tthus suppress high doppler signals in other channels
The OR-circuit loss is primarily due to the increase in the probability of false alarm by a factor nearly equal tothe number of data channels (assumingthesame probability of false alarm in each) In order to maintain thesame false alarm rateas for a single channel only higher amplitude signals which can exceed the threshold will be detected Inpracticetherearetimes when the CW signal is captured entirelyby the noise indicating an infinite loss in signal-to-noise ratio To reduce the OR-circuit loss it is required that the peak-to-mean ratio at theoutput of eachenvelopedetectorbe constant prior to ORrsquoing One approach for accomplishing this is to incorporateanAGC amplifier after each envelope detector ie post-detection AGC (refer to Section I) In addition a not8ch filter can be employed before t8he filter bank to notch out thelow doppler reverberation spectrum and enhance the detection of highdoppler targetsas shown inFigure 2 2 Utilizing current normalization
324
technology at-sea measurements indicatethat multi-channel input OR-circuit losses average 2 4 dB
h ) Linear F M Processors Although an incoherent processor operates on the ampli-
tude modulation only of the received signal it does provide processing gain against reverberation for a linear F M pulse This is to fact that theattributed the reverbera-tion spectrum is spread over the modulation bandwidth ( F ) andthen bandlimited by thepostdetection filter to the bandwidth of the pulse envelope (1T) the process- ing gain is 5 log FTWhen noise-limited the processing gain will he the same as for a CW input for the same pulselength-receiver bandwidthproduct Therefore in-coherent processing of a linear F M pulse provides process- inggainagainst both noise and reverberation masking backgrounds
A comparison of incoherent reverberation processing of CW and linear FRI is shown in the PPI photographs in Figure 27 The improvement) in target recognition seen with linear FM is attrihuted primarily to reverberation spectrum spreading The incidence of an LFM sweep on a scatterer structure generates a series of discrete reverbera- tion echoes each with a different frequency producing an interference pattern which significantly reduces the standard deviation of the background fluctuations
A crosscorrelator is the optimum signal processor in white Gaussian noise Processing gain is obtained against reverberation by enhancing the range resolution of the system To process the outputs of many receiving beams with high range resolution could result in considerable electronic cbircuitry for conventional real-time correlation utilizing a single replica If more than one reference is required to compensate for spectrum compression or expansion due to target doppler then the hardware com- plexity is further increased A technique which greatly reduces correlator requirements while providing high range resolution in real-time is the DELTIC Correlator C11i)-[117]
TheIIElay Line TIme Compressor (DELTIC) is a time-compression system for clipped and sampled signals employing a closed-loop digitsal delay line with input and recirculation logic to control the flow of stored samples The sequence of instantaneous samples are squeezed together to form a high-speed replica of the incoming signal having a total duration equal to the interval between samples The ratio of the transmitted pulselength to the sampling pcriod is the time-compression factor which is the number of correlations that may be carried out within the d~rat~ionof the original signal The major lobe width of the correlation function is the effective pulselength or range resolution of the system The time-compressed signal is stored in a high-speed recirculationstorage channel In practice a high-speed replica of the trans- mitted signal and the received signal are stored in two such DELTICS a reference DELTIC anda received DELTIC The outputs of these DELTICS are thencrosscorrelated---
IEEE T R A N S A ~ I O N SON SONICS AND IJLTRASONICS SEPTEMBER 1975
LFM REFERENCE
PREFORMED
CORRELATOR
SNR-ODE SNR - +l0DE
Fig 28 Effectivenessof coherentprocessing of linear FM
a binary multiplier for multiplication followed by comb filtering for time averaging (only a single recirculation of the DELTIC) This is called an AC-correlator since integration is accomplished with a bandpass filter instead of a lowpass filter (DC--correla tor)
The effectiveness of coherent processing of linear FM utilizing a clipped DELTIC correlator is shown in Figure 28 The time-bandwidth product of the signal is 65 rcsult-ing in a theoretical processing gain of about 182 dB However the processing gain measured was 16 dB the difference is attributed to losses in clipping and sampling
For a narrowband linear F31 signal [118]-[120] where the modulation bandwidth is much smaller than the carrier frequency and a targct with constant range-rate the frequency-time slopes of tjhe received and reference signalswill be parallel The doppler frequency shift will he equivalent to a time shift of the FRT slide plus a phase shift so thatthe correlator output will he doppler-in- variant involving only a translation in time This implies that a single (zero) rloppler reference DELTIC correlator may be employed to give almost optimum results There is no absolute range error or loss in correlationgain
For a widehand linear F M signal [11S]-[120] the effect of a moving target (constant range-ratgte) will producetranslational doppler and a changein the slope of the F31 signal The frequency-time slopes will be linear but not parallel Target acceleration [121]C1221 would introduce waveform curvature with additional echo dispersion from target rotation This will result in both an absolute range error and a loss in correlation When the doppler shift-pulselength (dispersion)product exceeds unity the peak signal amplitude at the correlator will be significantly reduced and the compressedpulse widened
The effect o f clipping reverheration is rather com-plicated If a linear FYI pulse is transmitted clipping the echo return will produce artificial LFRI sweeps which will generate falsc reverheration peaks as a function of time (range) in the correlator output tgthereby increasing the false alarm rate [117] This will degrade target track-ing and classifiration
A liueur or multileoel DE7TTIC correlutor is superior t o the clipped DELTIC for detecting multitargets particu-larly in an environmentcharacterized by multipaths andor high signal-to-noise ratios For a linear FM pulse a linear system will not suffer the incrcase in false alarm rate as occurs i n (slipped system However a multilevel
WINDER UNDERWATER SOUND 325
Fig 29 Bearing versus time recording of clipper correlator output
correlator requires a greater data handling capacity and more DELTICS than the clipped correlator
A linear DELTIC correlator is obtained by employing an AD converter after the receiver beamforming opera- tion and prior to t$ime-cornpression This quantization may also be applied to the reference signal although polarity information only ie a clipped DELTIC would suffice RIeasurements indicate that a amphit AD mnverter would be sufficient for quantizing trsquohe received echoes and masking hackgroundsunder most operatingconditions
An effective processing technique of linear FRI signals is post detection pulse compression (PDPC) Similar to theDELTIC correlator it compresses a received echo pulse to obtain the resolution of a short pulse without the necessity of transmitting a high peak power pulse Where it differs is that it operates in the frequencydomain through a combination of both coherent and incoherent processing
Thetransmitted signal is a stepped frequency pulse which approximates a linear F111 slide Aftrsquoer heamforming the received echo is sent to a comb filter hank Each filter passes the appropriate step frequency to which it is matched Each comb filter output is delayed by an amount
equal to its position in the sweep such that all outputs arein ldquophaserdquowitheach otherThe filtered-delayed frequency step is then incoherently detected or coherently detected by correlation and all outputs summed and sent to the display For small signal-to-noise ratios the processing gain of the system is approximately 8 log W T ThePDPC processoris suboptimum with respect to a linear crosscorrelator and has a poorer resolution capability for the same IYT-product however it is superior to an envelope detector-averager for the same total pulselength For the PDPC processor to operate properly the outputs of the comb filter bank must be normalized with respect to a fixed threshold
Passive Sonar Detection and Bearirlg Estimution The signal processing techniques generally employed
in passive sonar for broadbanddetectionarethe split-beam clipper correlator and the DIMTIS receiver The clipper correlator is also the basis of a split-beam tgtracker or bearingdeviationindicator (BDI) whose dc output can be used as an error signal to drive an automatic target follower (ATF) servo or as an input tjoa right-left indica- tor (RIA) meter to indicate bearing deviatrsquoion
326 IEEE TRANSACTIONS ON SONICS AND ULTRASONICS SEPTEMBER 1975
In a split-beamclipper correlator theoutputs corre-sponding to the two halves of the array are clipped cor- related and displayed on a bearing-time recorder which provides tracking information in addition to detection There is approximately a 3-dB loss due to beam splitting in general detection performance is slightly inferior to fullbeamenergydetectionPerformance is degraded if there is appreciable noise correlation between the two split beams Full spatial coverage is obtained by scanning the two half-beams through 360 -4scanning beam does not suffer from beam-to-beamunbalance and provides infinite bearing interpolation
The effect of clipping on arraydirectivitymay be significant and must be taken into account to effectively evaluate system performance [123] A clipper correlator is a function of the correlation coefficient between input signals The signals in turnandthusthecorrelation coefficient are functions of the arrays beam pattern For an input SNR ltlt 1 the structure and spatial properties of the beam pattern are preserved Houever for an input SNR gtgt 1 there is a distinct change in directivity due to clipping The output of a clipper correlator varies between +l and -1 independent of the amplitude sidelobe structure of the pattern This spatial normalization effect is enhanced for wideband inputs
A significant advantage of hard clipping in operational sonar is that ittendstoimprovesystem performance when there are large variations in noise power from hydro-phone-to-hydrophone resulting from the directionality andnonstationarity of background noise [124][125] This situation enhanced by machinery and flow noise is quite realistic An example of the normalization property of hard clipping is shown on the bearing-time recording in Figure 29 Approximately six targets areindicated whose SNR at the output of the beamformer range from about -4 to -13 dB The ambient noise background is seen to mark uniformly at all bearings which is necessary for maximum targetdetectionsensitivity The uniform correlated patterns in the lower and upper right of the recording are attributed to the arrays backlobe response to the strong targets indicated on the left Similar pat- terns are obtainedfor sinusoidal sources such as machinery and power line components
A DIMUS receiver is a one-bit digitalbeamformer whose multibeam outputsare energydetectedand dis-played on a bearing-time recorder The theoretical im-provement in the spatial average of the display with respect to a split-beam correlator is about 5 log (number of preformed beams) However at-sea results indicate that the operational threshold for a DIMUS receiver or a split-beam correlator is about the same with the DIMUS receiver having amuchpoorerbearingaccuracyAddi-tionalinformation on DIMUS can be found in Section G in the discussion on digital beamforming
For a Gaussian noise background the optimum likeli- hood-ratio processor for detection is a square-law (energy) detector followed by an integrator(smoothing j l t e r ) A
full-wave or half-wave linear rectifier can be used but its detectionperformance is somewhat poorer than that of the square-law detectorThe energydetector is incor- porated in both the split-beam correlator and the DIMUS receiver Inthe split-beam correlator the integration time is determined by the 3 d B beamwidth andscan speed In theDIMUS receiver the integrationtime is about 1-3 seconds to remove short-term noise fluctuations If the number of scansintegrated incoherently on the bearing-time recorder is ( n ) then the detection threshold (in dB) will be reduced by 5 log n In practice a t least a 14inch of line-to-line correlation or track history on the display is required before the operator can just discern the target (minimum detectable level)
If the split-beam outputs arephaseshifted 90 with respect to each other the system is referred to as a split-beamtracker or BDI The polarity and amplitude of the output correlation represents the direction and magnitude respectively of the error angle between the target bearing and the MRA of the array The split-beam tracker is very nearly optimal (in a maximum likelihood sense) for target bearingestimation when operating in aspatially inco-herent noise field [l26] If the noise field contains a strong plane-wave interference there will be an increase in fluctuation error and a bias introduced into the estimate This will seriously degrade performance If the inter- ference is spatially separated from the target by at least one-beamwidth then the interference can be removed by applying any oneof the appropriate adaptivebeamforming (ABF) techniques discussed in Section H If ABF is not effective then the bias will be amajorconstraint on performanceNearoptimal estimation can be obtained with a simple split-beam tracker with bias compensation [127]
Audio Receiver
The audio receiver is used for listening to target echoes and signatures and for receiving sonar telegraphy signals The operational function of audio in active sonar is ex- tremely desirable Sonar operators are often reluctant to identifyobvioustargets on thevideo display without audio confirmation the operators have an understandable desire to want to hear the echo thereby increasing their confidence level Operational results indicate that simul- taneous utilization of both the audio and video modes assumingeachhascomparable recognition differential can increase the effective system recognition differential by as much as 6 dB
The functional system diagram of a conventional audio receiver is shown in Figure 30 For apreformedbeam system the scan switch is replaced by a selector switch withallother operations remaining tmhesame The pre- amplifier-bandpass filtered outputs are fed to the stators of the audio scanswitch A delayline is mounted in- ternally on the rotors of the switch and the rotor signals are then properly shaded delayed and summedto provide a single beam output The position of the audio beam
327 WINDERUNDERWATER M U N D
RECEIVE OWN TARGET snw BEARING HEADSET
A
LOUD WEAKER
WITCH
Fig 30 Block diagram of conventional sonar audioreceiver
2P k 2 U 0S a
10 loo 1 m
ECHO LENGTH (mil l imnd1 FREQUENCY DIFFERENCE BETWEEN ECHO amp REVERBERATION (Hz1
echo midpoint 10amp 70 m - Britishdata 0 800 Hz pinpl nvrbaltion level m Cho loo0 Hzlisteningvel 80 db
mid-point 0 l M I O - H z p i n p m ~ M t h a t o f 3 6 amp 1 1 4 m - U C D W R 6 t a
PJrr in nbohmd of signal 800 Hz l i n i n g IndW db
PRESENT NO WPPLERDOPPLER
Fig 31 Aural recognition differential of echoes in reverberation
can be smoothly trained to any bearing by the respective position of the console target cursor Theaudiobeam is then corrected for own ship doppler as a function of relative target bearing and own ship speed on reception The bandpass filtered own doppler nullifier (ODN) output isfed to an autornatic gain control (AGC) receiver for signal processing and acoustic normalization Provision is usually made to disable the AGC and provide manual gain control for the audio receiver when the system is in the passive listen mode of operation A mixer translates the center frequency of the 4GC output to 800 Hz The audio amplifier provides the power capability for driving a loudspeaker and headset the amplifier is muted during transmission
The measured recognition differential is in approximate agreementwith that predicted according to theaural critical band model of the ear The critical band concept states that the masking behavior of the ear can be simu-lated by a predetection filter of bandwidth equal to that of the ldquocriticalbandrdquo at the frequency of the tone an energy detector of some sort and a low pass smoothing filter with a certain integration time At a frequency of 800 Hz studies of noise masking indicate that the critical
bandwidth of the ear is about 50 Hz and the integration time is of the order of one ( 1 ) second
For the case of zero target doppler trhe data in Figure31 shows that when ideal pulses or recorded beam echoes are injected in recordedreverberationbackgrounds the recognition differential improveswith increasing echo length The measured recognition differential of pings in reverberation backgrounds is also presented for different pinglengths and doppler shifts It is seen that when the sonar is reverberation-limited theaural recognition dif- ferential is a sensitive function of the frequency difference between echo and reverberation especially when trsquohey lie in different critical bands of the ear It is important to recognize that the plot is asymmetric with respect to opening and closing doppler targets and that the point of inflection occurs a t a frequency difference of about 50 Hz The corresponding value of targetrange-rate will dependupon thetransmitting frequency andtarget aspect
The simple audio receiver can thus provide on a single beam basis a recognition differential comparable to a relatively complex and expensive videosearch receiver for the initial detection of moving targets The advantage
328
of auraldetectionwith respect to conventional visual presentation is that thelatter provides no frequency discrimination against the backgroundfor initial detection (except possibly through color)Thecriticalbands of the ear correspond to a weighted spectrum analysis of the signal and background spectra This is particularly impor-tant when reverberation-limited since there is a very large improvement in recognition differential for a slight frequency difference between echo and reverberation The primary advantage of video search receivers is that they are multidimensional processors which includes multi- parameter estimation and target classification and inter-face with computer controlsystems Clearly the combined use of both video and audio would significantly enhance the initial detection capability of the sonar system over the entire range of target doppler
Systemperformancecanbe further improved by in-creasing the rate of change of aural recognition differential with frequency difference between echo and reverberation This may be accomplished by normalizing the reverbera- tion mean and variance in the critical band
K SYSTEMPERFORMANCEEVALUATION In echo-ranging applications performance is predicted
by computing the average echo excess for a specific prob-abi1ity of detection usually 50 percent The echo excess is defined as the sum of the figure-of-merit and target strength minus the two-way propagation loss and repre- sents the excess of echo over that required for detection The figure-of-merit is the source level of the sonar minus the minimum detectable signal level the latter depending upon the noise level prevalent at the array-water inter-face the directivity index of the receiving array and the detection threshold for the signal processor and display The echo excess formulation should include the effects of dome loss and system directivity the latteris expressed in terms of transmitting and receiving deviation losses
Unfortunatelythe sonar range equations presently used for system analysis areinadequate for predicting performance in an operational environment Some of the major inadequacies are the following
1) Thecomputed echo excess is merely an average value over large numbers of pings of sonar equipments of the particular type under consideration of sonar opera- tors and of targets There is thus a short-term and long-term variability associated with echo excess
2) Thetargetstrength is usually characterized by a single value independent of the sonaroperating mode andthe effects of target induced time and frequency spreading(commonly referred to as energy splitting)
3) Thedirectivity index is also usually characterized
XEEE TRANSACTIONS ON SONICS AND ULTRASONICS SEPTEMBER 1975
considerably for a moving platform as well as the sound velocity profile (requiring different time delays for beam-forming)
4) There is no provision for representing the effective- ness of gain control receivers and normalization circuitry
5) The effects of medium-target-sonarvariability on echo excess is not related to the performance of the search- track modas and corresponding displays
The above considerations are also appropriate in the evaluation of passive sonars if target strength variability is replaced with radiated signature variability Thepassive sonar equation(s) have been reformulated to include the beam-to-beam standard deviation of sidelobe levels and they relate the resulting bias effects to spoking on the bearing-time display
To summarize thesonarequations used to evaluate system performance should reflect the dynamics of sonar operation This requires that dynamical system measures be incorporated in the equations which include the con- cepts of echo formation array gain data normalization space-timevariabilityandprobability of detection contours
Echo formation is a function of the fine structural detail of the target the extended length of the target the target aspect the vertical incidence angle the pulselength the acoustic frequency andthesystem resolution These interrelationships have been investigated to some degree [l281 but have never been unified into a general target strength model This is required since the target strength is generally different when the sonar is operating in the detection track or classification mode
The significance of array gain and the importance of obtaining DRCK havebeen extensively discussed Both concepts are intimatelyrelated to at-sea measurements and hardware design
The space-time variability in system performance may be attributed to thefluctuations in the figure-of-merit the target strength and propagation loss The figure-of-merit variability is caused by differences in system equipments and sonar operators and by fluctuationswithin the detec- tion process attributed to factorssuchasthe direction of the cursor with respect to the direction of the echo and the (closing or opening)speed of the target The target strengthvariability is causedby differences in target structure highlights and aspect angles The propagation loss variability is caused by ping-to-ping fluctuations and the imperfect formulation relating propagation loss to the actualenvironmentThecumulative effect is often re-ferred to as the long-term variability in echo excess In the case of sequential pings the target sonar system and operatorremainunchanged so thatthe only source of
by a single value depending only upon the array geometryvariability is the fluctuation in propagation loss This is and dimensionality acoustic wavelength and a particular sound velocity assumed for determining the time-delays inbeamformingHowever in practice the spatial dis-criminating properties of the sonar are influenced by the character of the signal and noise fields which can change
referred to as the short-term variability anddepends upon the character of the masking background
All of the above parameters must be evaluated in order to obtain areasonable accuracy in predicting performance The target strength array gain and DRCK factor deter-
329 WINDERUNDERWATERSOUND
mine the instantaneous echo excess This together with the error distribution of echo excess due to variability define the probability of detection contoursThese con-toursexistinrangeazimuth and doppler and maybe related to corresponding displays inthesystemThey will establish in a dynamical sense the relative effective- ness of the sonars search and track modes This may be illustrated by the following scenario of on-board operation
The target is initially detected on the search display eithera PPI or B-scan The operatorputs the display cursor on the target which will bring the acoustic field about the cursor to the track displays on the next ping The objective is to obtain accurate target azimuth and doppler information for mission-control However on the next ping the target is lost on either the doppler display andor the azimuth display (sector scan indicator) The fact that a target may be easily detectable on one display and not on another may be demonstrated by the prob- ability of detection contours a target may be on the peak of one contour while being in the null or valley of another
The probability of detectioncontoursrepresenta significantimprovement in computing and measuring system operational performance Although the probability ofdetectionversusrangecontourhasbeenutilized in systemanalyseswith some degree of success extending this concept to otherinformationalvariablesnamely azimuth and doppler will complete the picture for open+ tional assessment Optimum system design would then be concerned with finding the global maxima on the multi- dimensional surface defined by the contours
L CONCLUDINGREMARKS In this review we have describedvariousfunctional
operations employed in sonarsystems andhavealso indicated some areas for further investmigation The most significantdevelopmentssince 1960 havebeenin the area of spatial processing In particular space and signal diversitydigitaltechnologyadaptivecontroland non-linear acoustics have been applied successfully to beam- formingThis work is continuing and it includes the utilization of logical switching algorithms andthe en-hancement of fine detail information via maximum entropy criteria
In recent years considerable attention has focussed on multichannelsignal processors utilizinghigherorder statistics for signal detection parameter estimation and waveform estimation It should be noted that very often the most excitingaspects of temporal signal processing is the theory and what one designs for rather than whatis achieved in the field The problem is usually not in the theory but in the integration of system disciplineswith the constraints of the physical medium In practice most losses occur at interfaces characterized bya change in the form of energy namely at the array-water processor- display and display-operator interfaces
A recurring theme of this paper has been the require-ment for and the operational design of dynamicrange
compression and normalization in sonar receivers These techniquesshouldbeextended to include higherorder gaincontrolcharacteristics andadaptive doppler nor-malization in both the video and audio mode
One important trend in sonar design is the requirement forgreaterreliabilityandmaintainabilitytherebyin-creasing system availability Thisis defined quantitatively by the mean-time-between-failures and the mean-time-to- repair A related area is the availability of the sonar plat-form itself which specifies the need for anautomated system for performancemonitoringdirectcontrol and maintainance planning of the marine power plant Simi- larlyampIitude and phase tolerances of the electronic components and array elementsestablish the feasibility in approachingtheoreticalacousticperformance The primarylimitations on achieving the designed accuracy in range bearing and range rate are the errors introduced by the propagating medium and sonar operator
The growing interplay between manandcomputer points to the development of a computer-aided display A software controlled display system would facilitate signal detectionmultitargettrackingmonitoring processed video data and control of data formats and would also beamenable tofuture systemgrowthThis is the first step in realizing receiver-transmitterfeedback an in-formation link from the receiver to the transmitter which would automatically control subsequent signal parameters and transmission and propagation modes Another obvious direction is the utilization of the fast Fourier transform (FFT) for beamforming in the frequency domain and for narrowband processing of acousticradiatedsignatures
It is hoped that this review will facilitate understanding of the significance and limitations of the present state of the art in sonar technology and provide a basis for which further progress might take place The references given were not intended to be conclusive but to recognize out- standing contributions and unique approaches The treat-ment of the acoustic channel was highly influenced by the work of Marsh The discussions on conventional beam- forming and d-ynamic range compression and normalization were summarized from C1291 and [130] respectively
ABBREVIATIONS ABF Adaptive beamforming A D Analog to digital AGC Automatic gain control ATF Automatic target follower BD1 Bearing deviation indicator CFAP Constant false alarm probability CFAR Constant false alarm rate CRT Cathode ray tube CTFM Continuoustransmissionfrequency modu-
lation cw Continuous wave (pulsed) DELTIC Delay line time compressor DF Directivity factor D1 Directivity index
330
DICANNE Digital interference cancelling adaptive null network
DIMUS Digital multibeam steering DRCN Dynamicrange compression and normali-
zation DSL Deep scattering layer FTC Fast time constant differentiator LFM Linear frequency modulation LR IJikelihood ratio MD1 Maximum directivity index MRA Maximum response axis ODN Own doppler nullifying PDPC Post detection pulse compression PFB Preformed beam PPI Plan position indicator PRN Pseudorandom noise RAP Reliable acoustic patjh RCG Reverheration controlled gain RDI Rotational directional transmission RL1 Right-left indicator RSR Refracted surface reflected SLE Sidelobe elimination SNR Signal to noise ratio SOFAR Sound fixing and ranging(deepsound
channel) SRE Shift-register encoder STN Spatial threshold normalization TVG Tinle-varied gain VC0 Voltage-controlled oscillator WT Bandwidth-time product
REFERENCES [l] American Standard Acoustical Terminology Sl1-1960 New
York American Standards Association May 25 1960 121 J Klauder A Price S Darlingtonand W Albersheim
ldquoThe Theory and Design of Chirp Radarsrdquo BSTJ Vol 39745-808 July 1960
[3] J L Stewart W H Allen R M Zarnowitz and M K Brandon ldquoPseudorandom Signal-Correlation Methods of Underwater Acoustic Research I Principlesrdquo JASA Vol 37 1079-1090 June 1965
141 RH Cole ldquoUnderwater Explosionsrdquo Princeton UniversityPress 1948
[51 C Polk ldquoTransient Behavior of Aperture Antennasrdquo IRE P T O C Vol 48 1281-1288 July 1960
[6] J PachnerldquoInstantaneousDirectivityPatternsrdquo JASAVol 28 1956
[7] M C Junger ldquoEnergy Exchange Between Incompressible Nearand Acoustic Far-Fieldrdquo JASA Vol 40 10251030 1966
[8] R Hickling ldquoAnalysis of Echoes froma Hollow Metallic S here in Waterrdquo JASA Vol 36 1124-1137 June 1964
[9] 8 B Officer ldquoIntroduction to theTheory of SoundTrans-mission with Application to the Oceanrdquo McGraw-Hill New York 1958
[l01 I M -
I3rekhovskikh ldquoWaves inLayered Mediarsquorsquo Academic Press Inc New York 1960
1111 R J Urick ldquoPrinciples of Underwater Sound for EngineersrdquoMcGraw-Hill New York 1967 Chauters 5 and 6
[l21 B F Cole ldquoMari)re Sediment AttenGation and Ocean-Bottom- Reflected Sound Proc 68th Meeting of the Acoustical So-ciety of AmyiFa October 1964
(131 F E Hale Long-Range Sound Propagation in the Deep Oceanrdquo JASA Vol 33 456464 1961
(141 R J Tirick rdquoCaustics and Convergence Zones in Deepwater Sound Transmissionrdquo JASA Vol 38 348-358 1965
[l51 MEwingand J L Worzel ldquoLong-range Sound Transmis-sionrdquo in ldquoPropagation of Sound in the Oceanrdquo Geological Society of America Mem 27 1948
IEEE TRANSACTIONS ON SONICS AND TTLTHASONICS S E P T E M B E R 1975
[l61 P Hirsch and A H CarterldquoMathematical Models for the Prediction of SOFAR Propagation effect^ JASA Vol 3790-941965
[l71 D A MurphyldquoStudy of Arrival Angles for ldquoRSR-typerdquoEnergy Received on a Model Sloping Ocean Bottomrsquorsquo JASAVol 35 1879 1963
[l81 J W Horton ldquoFundamentals of Sonarrdquo 1J S Naval Insti-tute Annapolis 1957 Chapter 3
[l91 N L Liebermann ldquoThe Origin of Sound Absorption in Water and in Sea Waterrdquo JASA Vol 20 868 -873 1948
1201 M Schulkin and- H W Marsh ldquoSound Absorption in Sea Waterrdquo JASA Vol 34 864-865 1962
[21] R J Urick ldquoLow Frequency Sound Attenuation in the DeepOceanrsquorsquo JASA Vol 351413--14221963
[22] W H ThorpldquoDeep Ocean Sound Attenuation in the Sub- and Low-Kilocycle-per-second Regionrdquo JASA Vol 38648 1965
[23] M J Sheehy and R Halley ldquoMemurement o f the Attenua-tion of Low-Frequency Underwater Soundrdquo JASA Vol 29464 1957
[24] H W Marsh and S R Elarn ldquorsquoIrsquohe Illfornlation Content of SignalsrdquoPresented a t the NATO Advanced Study Institute on StochasticProblems in Tinderwater Sound Propagation Lerici (Italy) September 18 23 1967
[25] R SThomas ldquoLimitations Imposed on Signal Processing in Near-Surface EchoRanging Systems by a Time Varying Medium and Target and by Reverberationrdquo Presented at the KAT0 Advanced Study Institute on Stochatic Problems in UnderwaterPropagation Im-ici (Italy) Sttptember 18-231967
[26] R-H Mellen ldquoDo pler Shift of Sonar Backscatterfrom the Sea Surfacerdquo JASf Vol 36 1395 19fX
[27] H W Marsh R H Mellen and W 1 Kor~ratlldquoAnomalous AbsorDtion of Pressure Waves from Exnlosions in Sea Waterrdquo JASArsquo Vol 38326-3381965
[28] D T BlackstockldquoApproximate Eqr~ations Governing Finite Amplitude Sound in Thermoviscolw Ersquolrlidsrdquo AFOSR-5223 Sup 1 Tech Report May 1963
[29] J 8 Stersquolnberg and T G Hirdsd ldquoTTnderwater Sound Propagation in the Straitv of Floritlardquo J B S A Vol 39 301- 315 1966
[30] J LStewartandMK Brandon ldquoRandom Medium Correlation Lossrdquo Presented at the NAlsquoIrsquoO Advanced Study Institute on StochasticProblems in Tnderwater Sound Propagation Lerici (Italy) Septemljcr 18 -23 1967
[31] D E WestonldquoPropagation of Sound i n Shallow Waterrdquo ProcSymposium on Sonar Systems 13irmirlgham (England) 9-11 July 196
[32] D E Weston Horizontal Refraction in L Three-lknensional Medium of VariableStratificationrdquo P m r Phys hrsquooc London Vol 78 46G52 July 1961 D Micfleton ldquoStatistical Models o f Iteverberationand Clutter Tech Rept TR65-2-RF 15 April 1965 Titton Systems Inc ldquoPrinciples of Underwater S o u I d rdquo Nail Ucfense Res Comm Div 6 Sum Tech ReDt Vol 7 10--98 1947 P Faure ldquoTheoreticalrsquo Motlei of deverberation NoiserdquoJASA Vol 36 259-266 1964 R P ChapmanandJH Harris ldquoSllrfwc Backscattering Strengths Measured With Explosive Sound Sourcesrdquo Vol 34 1592-15971962 C S Clay and H Meclwin ldquoHigh-Frequency Acoustical Re-verberation from a Rough-Sea Surfacerdquo JASA Vol 36 2131-21341964 R J Urick ldquoBackscattering of Sou11~11~rsquororna Harbor Bot-tomrdquo JASA Vol 26 231 1954 CM McKinneyand C D Antlerbon ldquoMeasurements of Backscattering of SoundFrom the Ocean Ihttomrdquo JASAVol 3615amp1631964 K V Mackenzie ldquoBottom1tevcrlxrttlon for 530 and 1030 cps Sound in Deep Waterrdquo JASA Vol 3 3 1498--15041961 H W Marsh ldquoReflection and Scattering of Sound by the Sea Bottomrdquo Proc 68th Meeting o f thc Acoustiral Societyof America October 1964 CF Eyring R J Christensen and R W h i t t ldquoReverbera-tion in the Seardquo JASA Vol 20 162 1918 J R Marshall and R P Chapman ldquoKcverheration From a DeepScattering 1ayer Measured W i t h Explosive Sound Sourcesrdquo JASA Vol 36 164-167 1964 S A Schelkunoff ldquoA Mathematicl Theory o f Iinear Arraysrdquo BSTJ Vol 22 80-107 January 1443 J W Horton ldquoFundamentals of Sonarrdquo IJnitJetl States Naval Institute 17amp1761957 S Matt and J D Kraus lsquo T h e Effwt o f tlkc Source Distribu- tion on Antenna Patternsrdquo I RE Irsquoroc 821-825 July 1955
331
1
WINDER UNDERWATER SOUND
[47] J F RamseyldquoFourier Transforms in Aerial TheoryrdquoMarconi Rariew No 83139 No 8417 No 8 5 41 No 8 6 81 No 87 157 No 8945 1946-1948
[48] P M Woodward ldquoA Method of Calculating the Field Over a Plane Required to Producea Given Polar Diagramrdquo JZEE Vol 93 Part I11 A 1554-1561 September 1959 W E Kock and J L Stone lsquo Space-Frequency Equiva- lencerdquo ZRE PTOCVol 46 499-500 F b r u a r y 1958 J W Horton ldquoFundamentals of Sonar United States Naval Institute 180-205217-221228-2361957 R L PritchardldquoDirectivity of Acoustic Linear Point Ar- raysrdquo Tech Memo 21 Acoustics Research LaboratoryHarvard University Chapter IV January 15 1951 E J Powers Jr ldquoAnalysis and Synthesis of a General Class of Difference Patternsrdquo Tech Rept No 8 Research Laborac tory of Electronics MIT July 30 1959 S S Sandler ldquoSome Eq$valence Between Equally and Un- equally Spaced Arrays ZRETrans m Antennasand Propagation 496-500 September 1960 R F Harrington ldquoSidelobe Reduction by Non-Uniform Element hacinerdquo IRE Trans Vol AP-9 187-192 MarchL1961
I
D D King R F Packard and R K Thomas ldquoUnequally Spaced Broadband AntennaArrays ZRETrans Vol AP-8 380-385 July 1960 D L Jagerman and L F Fogel ldquoSome General Aspects of the Sampling Theoremrdquo ZRETrans Vol IT-2 139-145 December 1956 J L Y ldquoOn Non-Uniform Sampling of Bandwidth-Limited Signals IRE Trans Vol CT-3 251-257 December 1956 J L Yen ldquo9n the Synthesis of Line-Sources and Infinite Strip-Sources ZRETrans on AntennasandPropagatimJanuary 1957 P L Storklin Lecture on Space-Time Sam ling Delivered a t TheNATO Advanced StudvInstituteerenoble France 14-26 September 1964 B Cron and G Becker ldquoGain of a Three-Dimensional Array in a Directional Noise Fieldrdquo USNUSL USL Rept No 71013 A ril 1966 B 8 o n and C Sherman ldquoS atial-Correlation Functions for Various Noise Modelsrdquo JASK) Vol 34 1732-1736 November 1962 C EckartldquoTheTheorv of Noise in Continuous Mediardquo J A S A Vol 25195-199-March1953 H W Marsh ldquoCorrelation inWaveFieldsrdquoUSL QuarterlyReport Part 11 63-68 l October 1949-31 March 1950 B F Cron B C Hassell and F J Keltonic ldquoComparison of Theoretical and Experimental Values of Spatial Correlationrdquo J A S A Vol 37 No 3 523-529 March 1965 J J Faran and R Hills ldquoWide-band Directivity of ReceivingArraysrdquo Acoustic Research Laboratory Harvard UniversityTech Memo 31 May 1953 R LPritchard Directivity of Acoustic Linear Point Ar- raysrdquoTech Memo 21 Acoustics Research LaboratoryHarvard University Chapter V January 15 1951 N Yaru ldquoA Note on Su er Gain Antenna Arraysrdquo ZRE Proc Vol 39 10l-1085 8eGember 1951 G T DiFrancia Directivity SuperGain and InformationrdquoElectromagnetic Wave Symposium 463 July 1956 D G Tucker ldquoThe SignalNoise Performance of Super-Directive Arraysrdquo Awustica Vol 8112-1h61958 V CAnderson ldquoDigitalArray Phasing J A S A Vol 32867-8701960 P Rudnick ldquoSmall Signal Detection in the DIMUS Arrayrdquo J A S A Vol 32 871-877 1960 B Picinbono ldquoAlteration of Directivity by Clipping in Passive Detectionrsquorsquo Proc NATO Advanced Study Institute on Signal Processing with Emphasis on Underwater Acoustics Grenoble France 14-26 September 1964 J Max rdquoQuantizing for Minimum Distortionrsquorsquo ZEEE Trans PGIT-6 7-12 March 1960 R Widrow Analysis of Amplitude-QuantizedldquoStatisticSampled-Data Systems Tech Rept 2103-1 Stanford Elec- tronics Lab 10-39 10 May 1960 A I Velickin ldquoOptimum Characteristics of QuantizersrdquoRadio Eng 1-7 February 1963 A M Vural ldquoEffects of Signal Quantizing on Beamformer PerformanceTechInform Ser Rep R67EMH33 General Electric Co Heavy Electronics Dep Syracuse N Y9-11 November 1967 A H Nuttall ldquoSpectrum Reproduction Capability of a Beam-former withMultibit Quantization and Samplingrsquorsquo Tech Rep MS2381 Litton Systems Inc Van Nuys Calif 1-37September 1967 A M Vural ldquoEffects of Signal Quantization on the
Performance of Multichannel Processing Systemsrdquo J A S A Vol 46 293-313 1969
[79] V C Anderson ldquoDICANNE A Realizable Adaptive Processrdquo J A S A Vol 45 398-405 1969
[SO] V C Anderson and P RudnickldquoRejection of a Coherent Arrival at an Arrayrdquo J A S A Vol 45 406-410 1969
[81] F Bryn ldquoOptimum Signal Processing of Three-Dimensional Arrays Operating onGaussian Signals and Noiserdquo J A S A Vol 34 289-297 1962
[82] H Mermoz ldquoMatched Filter and Optimum Use of an Arrayrdquo Proc NATO Advanced Study Institute on Signal Processing withEmphasis on Underwater Acoustics Grenoble France 14-26 September 1964
[83] S W W Shor ldquoAdaptive Technique to Discriminate AgainstCoherent Noise in a Narrow-Band Systemrdquo J A S A Vol 3974-781966_~ ~
[ 8 4 ] J P -
rsquoBurg ldquoThree-Dimensional Filtering with anArray of Seismometersrdquo Geophysics Vol 29 693-713 1964
[Ss] B Widrow P E Mantey L J Griffiths and B B Goode ldquoAdaptiveAntenna Systemsrdquo ProcZEEE Vol 552143-21591967
[86] L Jrsquo Griffiths ldquoA Simple Adagtive Algorithm for Real-Time Processing in Antenna Arrays ProcZEEE Vol 57 1696- 1704 October 1969
[87] A Ksienski G G Comisar and 0 R Price ldquoLogical Pattern Synthesisrdquo Microwave Laboratory Hughes Aircraft Com-y y Culver City California IRE Wescon Conv Record
art I 1959 32-39 [88] B Y Mills and A G Little ldquoA High Resolution Aerial
System of a New Typerdquo Australian J Phys Vol 6 272 1953 [89] W H Kummer A T Villeneuve T S Fong and F G
Terrio ldquoUltra-Low Sidelobes from Time-Modulated ArraysrsquorsquoZEEE Trans on Antennas and Propagation 633439 Novem-ber 1963
[90] J L Lawson and G E Uhlenbeck ldquoThreshold SignalsrdquoDover Pub Inc Chapter 11
I911 ldquoUnderwaterSound Equipment 11Echo-RangingSystemsrdquoVol 15 Summary Technical Report of Division 6 NDRC1946
1921 B-M Oliver ldquoAutomatic Volume Control as a Feedback Problemrdquo ZRE Proc Vol 36 466473 April 1948
1931 W F Chow and A P SternldquoAutomatic Gain Control of Transistor Amplifiersrdquo ZREProc Vol 431119-1127 September 1955
[94] R H Delano and I Pfeffer ldquoThe Effect of AGC on Radar Tracking Noiserdquo ZRE Proc 801-810 June 1956
[95] J C G Field ldquoThe Design of AutomaticGainControl Systems for Auto-Tracking Radar Receiversrdquo The Institution of Electrical Engineers Monograph No 258 R 93-108 October 1957
[Ss] J H Dunn and D D Howard ldquoThe Effects of Automatic Gain Control Performance on the Tracking Accuracy of Mono- pulse Radar Systemsrdquo ZREProc 43amp435 March 1959
[97] J Croney ldquoClutter on Radar Displays Reduction by Use of Logarithmic Receiversrdquo WirelessEngineer Vol 33 83-96 1956
[98] R H Pragerand F L Reese ldquoApplications of Logarithmic Receivers to Signal Detection in Nonstationary Backgroundsrdquo NEL Report 1098 18 January 1962
1991 V GHannsen lsquolsquoStudies of LoearithmicRadar Receiver Using Pulse-Length Discriminationrdquordquo IEEE Trans Aero and E k d Syst Vol AES1 246-253 1965
[l001 B A Green Jr ldquoRadar Detection Probability with Logarith- mic Detectorsrdquo I R E Trans Znjo Theory Vol IT4 5amp52 1958
[loll I Jacobs ldquoThe Effects of Video Clipping on the Performance of an Active Satellite PSK CommunicationSystemrdquo IEEE Trans Commun Tech Vol COM-13 1965
[l021 W B DavenportJr ldquoAn Introduction totheTheory of Random Signals and Noiserdquo McGraw-Hill June 1958 Chapter 13 J H Van Vleck ldquoThe Spectrum of Clipped Noiserdquo Radio Res Lab Harvard Univ Rept 51 21 July 1943 W B Davenport Jr ldquoSignal-To-Noise Ratio in Band-Pass Limitersrdquo J Appl Phys Vol 24 720-727 1953 J L Sevy ldquoThe Effect of Hard Limiting an Angle-Modulated Signal Plus Noiserdquo IEEE Trans Aero and Elect Syst Vol AES-4 24-30 1968 J J JonesldquoHard-Limiting of Two Siqnals in Random Noiserdquo ZEEE Trans on Info TheoryVol IT-93442 1963 W R Remley ldquoSome Effects of Clipping on Array Proc- essingrdquo J A S A Vol 39 702-707 1966 W W Peterson T G Birdsall and W C Fox ldquoThe Theoryof Signal Detectabilityrdquo ZRETrans on Info Theory Vol 4 171-212 September 1954
E L Lehman ldquoTesting Statistical Hypothesesrdquo Wiley New York 1959 D 0 North ldquoAnalysis of the Facto which Determine SignalNoiseDiscrimination inRadarReportPTRGCRCA Laboratories 1943 I A Zadeh and J R Ragaseini ldquo0 timumFilters for the Detection of Signals in Noiserdquo I r R 8 eurolsquoroc Vol 40 1223- 12311952 G L Turin ldquoAn Introduction to Matched Filtersrdquo ZRE Trans Vol IT-6 311-330 June 1960 J I Stewartand E C Westerfield ldquoA Theory of Active Sonar Detectionrdquo ZRE Proc Vol 47 872-881 1959 E C Westerfield R H Prager and JL Stewart ldquoProcessing Gains Against (Clutter) MatchedReverberation UsingFiltersrdquo IRETrans on InfoTheory Vol 6 342-348 Tllnp- --- 1MO- -
[l151 V I
C Anderson ldquoDELTIC Correlatorrdquo Harvard Acoust 1ab Tech Memo No 37 5 Januar 1956
[l161 W B Allen and E C Westerfield ldquofligital Compressed-Time Correlators and Matched Filters for Active Sonarrsquorsquo JASA 1lsquo01 36121-139 JerlU 1964
11171 C van Schooneveld drrelator Technologyrdquo Presented at theNATO Advanced Study Institute on Signal Processing withEmphasis on Underwater Acoustics Enschede (TheNetherlands) 12-23 August 1968
[l181 S A Kramer ldquoDo pler and Acceleration Tolerances of High-Gain WidebandLinear FM Correlation Sonarsrdquo I E E E Proc Vol 55 627-636 May 1967
[l191 B Harris and S A Kramer ldquoAsym totic Evaluation of the Ambiguity Functions of High-Gain Fh Matched Filter Sonar Systemsrdquo ZEEE Proc Vol 56 2149-2157 December 1968
[l201 T Glisson C Black and A Sage ldquoOn Sonar Signal Analysisrdquo
IEEE TRANSACXTONS ON SONICS AND ULTRASONICS SEPTEMBER 1975
IEEETrans Aero and Elect Syst Vol AESG 37-50
[l211 i ic tnd RP Wishner ldquoMatched Filter Theory for High-Velocity Accelerating Targetsrdquo IEEETrans Mil Eleet Vol MILS 56-69 January 1965
[l221 D E WestonldquoCorrelation Loss in Echo Rangingrdquo JASAVol 37 119-124 January 1965
[l231 B Picinboo ldquoAlteration of Directivity by Clipping in Passive Detection Proc NATO Advanced Study Institute on Signal Processing with Emphasis on Underwater Acoustics Grenoble (France) September 14-26 1964
[l241 J B Thomas and T R Williams ldquoOn the Detection of Sig-nals in Nonstationary Noise by Product Arraysrdquo JASA Vol 31 453462 1959
[l251 T Usher Jr ldquoSignal Detection by Arrays in Noise Fields with Local Variationsrdquo JASA Vol 36 1444-1449 1964
[l261 V H MacDonald and P M Schultheiss ldquoOptimum Passive Bearing Estimation in a Spatially Incoherent Noise Environ- mentrdquo JASA Vol 46 July 1969
[l271 V HMacDonald ldquoOptimum Bearing Estimationwith PassiveSonarSystemsrdquoPhDDissertationYale Univer-sity 1971
[l281 A Freedman ldquoThe High Frequency Echo Structure of Some SimleBodyShapesrdquo A c o u s l i ~ ~ ~ o l 1261-701962
[l291 A xWinder and C J Loda Introductionto Acoustical Space-Time InformationProcessingrdquo Office of Naval Re-search ONR t ACR63 January 1963
[l301 A A Winder bynamic Range Compression and Normaliea- tion in Sonar Receiversrdquo Presented at the NATO Advanced Study Institute on Signal Processing with Emphasison Under-water Acoustics Enschede (The Netherlauds) 12-23 August1968
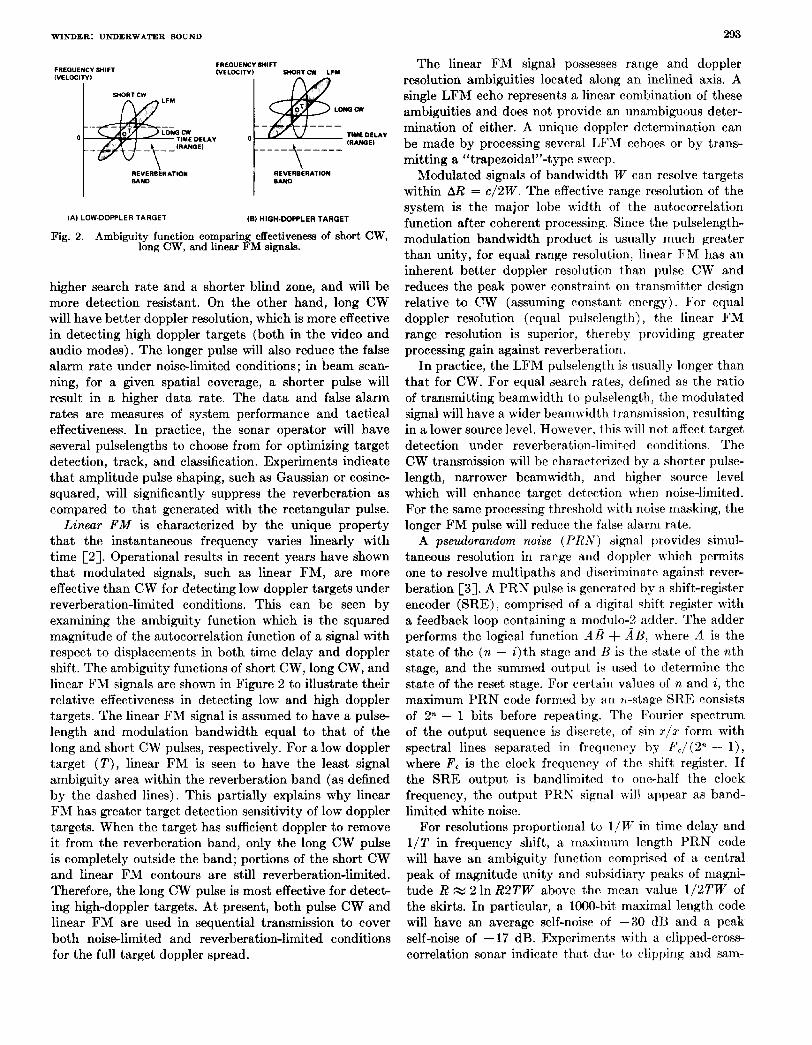
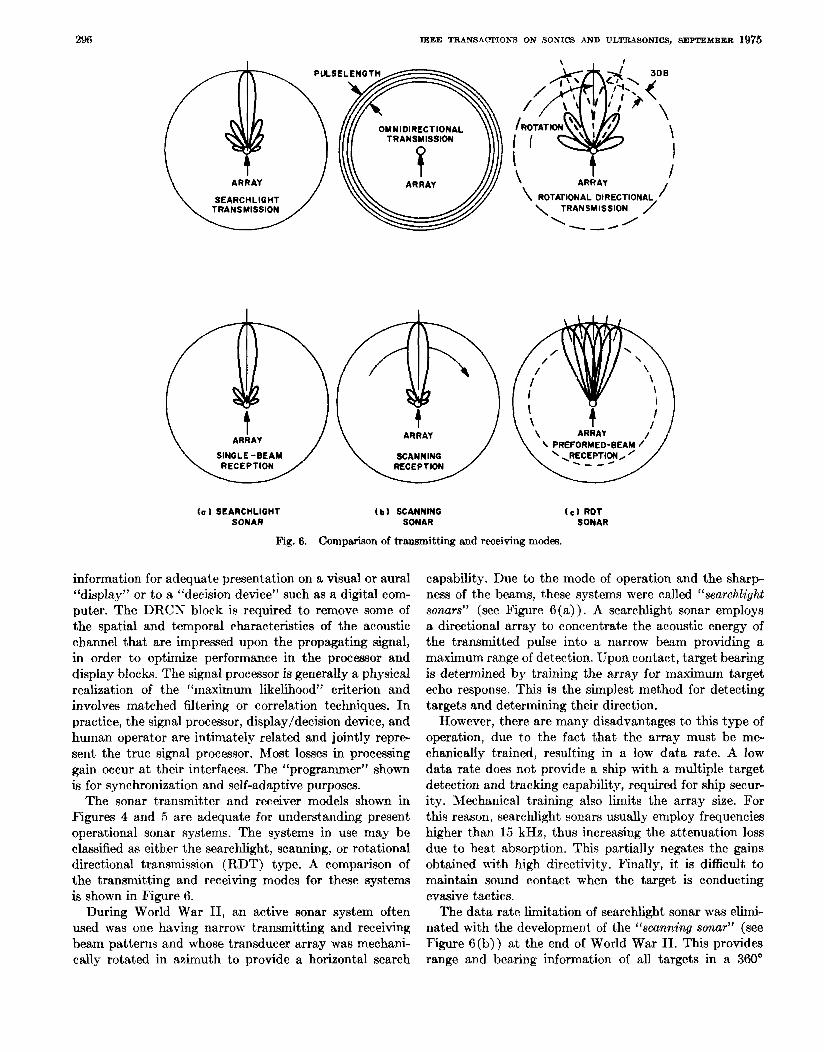

WINDER SOUND
azimuthal sector continuously and simultaneously Speci- fically an omnidirectional short-duration pulse is trans- mitted In reception the target returns are scanned by rapidly rotating a narrow receiving beam The receiving beam outputis then presented to a panoramic display The latter is onewhich gives a visual representation of the entire (360rsquo) acoustic field A panoramic display used extensively in radar and sonar is a plan position indicator or PPI The PPI maps the targetrsquos position in azimuth and range in polar coordinates on a cathoderaytube (CRT) where target amplitude is used to modulate the electron beam intensity (orz axis) Therefore a PPI is an example of an intensity modulated CRT polar display and generally uses a P7 (long persistance) phosphor for integration
A scanning-type sonar provides the ship witha multiple targetdetectionandtrackingcapability for maximum security The high data rate of a scanning sonar greatly reduces the percentage of loss-of-target contactrsquo due to time-varying multipaths andamplitudephase fluctua-tions of the ocean In addition since there is no need to mechanically train the array lower operating frequencies may be used With lower frequencies the losses due to absorption are decreased thereby tending to increase the detection range There are however several limitations Omnidirectional transmission implies that the transmitting beam has no directivity A comparisonof searchlight and scanning sonar becomes a question of high transmitting directivityandhigh absorption losses versus notrans-mitting directivity and low absorption losses respectively However in general for a fixed amount of acoustic energy a searchlight sonar will give a greater range of detection than a scanning sonar The scan speed of the receiving beam must be a compromise between the desired target resolution andthe maximum receiver bandwidth(or minimum input signal-to-noise ratio) allowable Also the ambient noise background presented to the display is averagedover 360rsquo which may be considerably higher than the actual ambient level at the true target bearing
The above limitationswere eliminated with the develop- ment of an ldquoRDTrdquo SOWT in the 1950rsquos An RDT type sonar is comprised of rotational directional transmission (RDT) with a preformedbeam (PFB) receiver It pro-vides high transmitting directivity and a high data rate togetherwitha low operating frequency Clearly it combines the best features of searchlight and scanning sonars
Specifically during transmission a sector of the array is properly phasedtoconcentratemaximum acoustic energy into a narrow beam similar to searchlight trans- mission By exciting different usually overlapping sectors the narrow beammaybesequentiallyrotatedthrough 360rdquo Thetransmitted beamremains at eachdiscrete bearingonly long enough to transmit the entire signal ie a timeequaltothe pulse length The number of discrete bearings is equal to 360rsquo divided by the 3-dB beamwidth It is important to note that RDT requires a
UNDERWATER 297
longer time to complete the trsquootal echo ranging cycle This presents a ldquoblind-zonerdquo to the searching vessel
In reception the beams shown in Figure 6(c) are fixed in space relative to the receiving array They aregenerally designed to overlap at the - 3 db points and continuously and simultaneously monitor the entire acoustic field The outputs of the preformed bedm matrix are in parallel form andare applied to individual DRCNsignal processors whose outputs arethen electronically scanned and dis- played on a PPI Each preformed beam output represents acoustic information obtainedwith respect to a finite space sector The preformed beam system has quantized the acoustic field in azimuth and may be considered as an azimuthal normalization The latterattemptstoobtain a constantldquospatialvariancerdquo or a uniformbackground (at a given range) on a PPI display System performance is considerably improved overaconventionalscanning receiver which averages the background over 3i30rdquo How-ever there may be a loss in targetrsquo detectability due to beam-to-beam unbalance (The latter may be eliminated by employing time-division multiplexing j In addition the finite interpolation of a preformed beam system leads to a serious detection degradatrsquoion known as the ldquobrick silordquo or ldquospokingrdquo effect This effect is not present with a conventionalscanner which has an infinite interpolation (theoretically)
Finally animportant difference between ascanning and PFB receiver is that the latter can be corrected for doppler due to own ships motion and the former cannot This means that a PFB receiver can have a smaller band- width thus improving the signal-to-the-noise ratio The method for accomplishing this is referred toas ldquoown doppler nullifyingrdquo (ODN)Each preformedbeam is mixed with an ODN oscillator The ODN oscillator is a voltage-controlled oscillator (VCO) in which the control signal is proportional to the product of the shiprsquos speed and the cosine of the relative bearing of the beam This technique is not possible with ascannerbecauseahigh speed video scan switch cannot be synchronized with the very small changes in the VC0 output
This is a good point to leave the discussion of the various transmission and reception modes and discuss the charac- terization of the acoustic channel block in Figure 1 The acoustic channel is generally trsquohe weakestlink in sonar system design
F ACOUSTICCHANNEL
It is customary when studying the detection and estima- tion problem to initially consider an ideal communication channel A communication channel is the vehicle by which information or data is transferred from one point (source) to another (destination) When assumed tto be ideal it is considered to be homogeneous lossless physically un-boundedand to provide distortionless transmission although the channel may be subject to various types of noise disturbance whichmayproducedistortion at the destination Clearly this simple model is not appropriate
298
for physical reality but is useful in the sense that it facili- tates understanding and visualization of the problem Generally the complexity of the problem is increased to include the effects of random amplitudeand phase scatteringand fading In practice thereareadditional effects to consider For example since a channel is usually not homogeneous or isotropic the received signals are strongly dependent upon the direction from whichthey are received Also the scatterersmay be distributed nonuniformly which leads toa nonstationary process
The acoustic channel in Figure 1 is represented by the ldquolinesrdquo connecting the transmitter and receiver a scatter-ing volume and ambient noise The ldquolinesrdquo may represent hundreds of nautical miles bounded by the air-water interface and on the bottom by mud sand gravel and rock The sea surface is both a reflector and scatterer of sound The sea bottom is similar but its effects are more complicated because of its multilayered composition The sea bottom has a densityandsound velocity that may change gradually or abruptly with depth which implies that its reflection loss is less easily predicted than that of the sea surface In addition ambient noise shown as an additive medium generated signal is a complex boundary and propagation effect a sourcemain of it is due to motion at the air-water interface Therefore it appears that propagation and boundary effects are closely interrelated Too some effects are actually influenced more by bound-aries than the internal acoustic properties of the ocean and vice versa
Propagation Effects Formally the propagation of acoustic waves of rela-
tively small amplitude inan isotropic perfectly elastic homogeneousunbounded and lossless medium can be described bythe linear acoustic waveequation Two approaches to a solution of the wave equation are ldquonor-mal-mode theoryrdquo and ldquoray theoryrdquo [g] [lo]
Normal-mode theory is valid when the wavelength of sound is the same order of magnitude as the water depth It is particularly useful in describing sound propagabion in shallow water or at very low frequencies in deep water This is analogous to the propagation of electromagnetic waves through waveguides Specifically normal-mode theorytreatsthe ocean asa whole and characterizes sound propagation in terms of the natural or eigenmodes of vibration of the ocean body analogous to string vibra- tion The computations involved areeasily carried out on a digital computer However this theory does not facilitate visualization or understanding of the propagation proc- ess-but ray theory does
Acoustic ray trsquoheory is analogous to that employedin geometric optics Similarly it postulates the existence of wavefronts along which the phase or time function of the solution to thewave equation is constant It also postulates that for a given set of conditions the sound patrsquoh between any two points in the ocean is fixed independent of trsquohe direction of propagation This pathis called a ldquosound rayrdquo or ldquoray pathrdquo anda description of the entire propagatrsquoion
IEEE TRANSACTIONS ON SONICS AND ULTRASONICS SEPTEMBER 1975
process is called a ldquoray diagramrdquo This has considerable intuitive appeal However there are several limitations It does not provide a good solution when the ray curvature or pressure amplitude changes appreciably over a distance of one wavelength Therefore ray theory is restricted to high frequencies or short wavelengths
The direction of a ray path is governed by Snellrsquos law The velocity of sound is an increasing function of water temperature pressure and salinityVariations in these variables produce velocity changes which in turn cause a sound wave to refract or change its direction as it propa- gates Therefore a propagation mode is specified by the velocity profile or velocity gradient of the medium A velocity gradient depicts thechange in velocity with depth If the velocity increases with deptrsquoh the gradient is said to be positive producing a ray curvature which is concave upward If the velocity decreases with depth the gradient is said to be negative producing a ray curvature which is concave downward
The deep ocean profile is comprised of two main layers ie 1) a seasonally dependent part consisting of an isothermal or surface layer and seasonal thermocline that extends from the surface down to a few hundred feet and 2) a permanent nonseasonally dependent part consisting of the main thermocline and deep isothermal layer that extends down trsquoo the bottom During the winter and spring and in the Arctic the seasonal thermocline tends to merge with the isothermal layer During thesummer and fall the isothermal layer is only about 50 feet deep and the sea- sonal t(hermoc1ine iswell defined The main thernlocline is a negative gradient due to the decreasing temperature and thus decreasing velocity In the deep isothermal layer thetemperature is nearly constant a t about 39degF and the velocity of sound increases with depth due to increase in pressure The positive gradient is about 0016 feet per secondperfoot A velocity minimum is thus formed at about 1000 meterswhich is the axis of the deep sound channel or so-called SOFAR channel
Velocity profiles and ray theory completely characterize deep water propagation This is a form of ducted propaga-tion where the sound is prevented from spreading in all directions and is bounded within a duct or sound channel These boundaries may be the sea surface and sea bottom multilayerswithin the medium or combinations of the two Deep water (gt1000 fathoms) propagation may be separated into two depending upon the depthof thedasses source
For a near surface source (upper 1500 feet of the ocean) therearethreedistinct modes-the surfaceduct mode [ll] the bottom-bounce mode [K] and the convergence zone mode [13] [14] These are shown in the ray dia-grams in Figure 7 and represent all present applications of sonar for surface vessel submarine and airborne plat-forms
The surface duct or mixed-layer sound channel is the acoustic analog of the ground based duct in radar Vir- tuallyall of the ship sonar systemsdeveloped prior to 1960used thesepaths exclusively The velocity profile
299 WINDERUNDERWATERSOUND
SURFACE DUCT
SINGLE-SURFACE
LEAKAGE BY DIFFRACTION SCATTERING AND
V
Fig 7 Ray diagrams for deep water propagation near surface source
Fig 8 Ray diagrams for deep water propagation deep source
requiredfor this mode has initiallyapositivegradient and then a the propaga- negative gradient At short ranges tion pathis nearly a straight line At longer ranges propa-gation is characterized by repeated surface reflections A ldquoshadow zonerdquo is thus created beneath the layer having little insonification except forsoundleakagefrom the surface duct The leakage has been found to increase with the ratio of wave height to layer depth The importance of a shadow zone is indicated by the fact that it canreduce a surface sonar with a 20 kiloyard range capability to one having less than a 5 kiloyard capability
In recentyearssonarsystemshave employed the bottom-bounce and convergence zone modes for greater ranges of detection than those obtainable in the surface duct The bottom-bounce path requires a strong negative gradient and becomes important in the range region from about 10 to 30 kiloyards At shorter ranges the high angle of incidence causes a largeportion of the sound energy hitting the bottom to be absorbed and thus wasted Be- yond 30 kiloyardsbottom-bounceinvolvesmultiple
reflections where the loss per ldquobouncerdquo at the bottom and surface strongly reduce the received energy In addition bottom-bounce produces a degradation in range resolution due to time dispersion and a bearing error due to a sloping bottom The convergence zone mode requiresinitiallya negativegradientand thena positivegradient which results in a ldquofocussingrdquo of the sound rays Multiple con-vergences can occur similarto multiple bottom reflections The zones are at intervals of 30 to 35 nautical miles having a width of the order of 5 to 10 percent of the range For these modes to be effective it is necessary that the trans- mitted acousticbeambeproperlytiltedin thevertical plane(ie inelevation)for themost efficient ray path transmission
For a deep ocean source thereare two distinct modes- the SOFAR channel and the refractedsurface reflected (RSR) mode Their ray diagrams are shown in Figure 8
The SOFAR channel [15] [l61 is formed by placing the source approximately atrsquo the depthof minimum veloc- ity Sound waves aboveand below this depth will be
300 IEEE TRANSACTIONS ON SONICS AND ULTRASONICS SEPTEMBER 1975
refracteddownwardandupward respectively SOFAR propagation is actually an oscillatory mode where sound can travel thousands of nautical miles with little loss of energy since there are no boundary reflections
The RSR mode [l71 is quiteinterestingbecause it includes the so-called reliable acoustic path (RAP) The latter rays travel from the deep source to a shallow re-ceiver--without surface reflection RAP raysare ldquore-liablerdquo because tgthey are insensitive to near-surface effects and losses due to reflections This bypasses the difficult problem of detecting a shallow depth target a t moderate ranges from a shallow depth source
The selection of o n e propagationmodeoveranother depends upon the propagation loss associated with each mode Propagation loss is defined as the total decrease in sound intensity associated with any given length of ray path a t some specified frequency [lS] The loss of sound energy may be attributed to geometric spreading absorp- tion reflection andor scatteringandmultipathsThe last two loss mechanisms are rather complicated and are generally treated as boundary effects
The spreading loss is independent of frequency and is primarily due trsquoothe increasing area over which energy is distributed during propagation If the ocean can be con- sidered as infinite in extent and homogeneous in composi- tionthenradiatedsoundspreads spherically in trsquohree dimensions and the intensity decreases at the rateof 6 dB per doubled path length Spherical spreading is approached in deep water modes (excluding SOFAR) and for short ranges in the surface duct and shallow water If the radi-ated sound is confined within a duct and can only spread in two dimensions then the intensity decreases at the rate of 3 dB per doubled path length This is known as cylin- drical spreading and is valid for the SOFAR channel and long ranges in thesurfaceductand shallow water At intermediate ranges there is a transitionfrom spherical to cylindrical spreading which is determined eitherby extrapolation between the two regions or by computing the spreading loss using ray theory The latter may appear considerably more accurate but remember it is only as good as the velocity profiles assumed
Theabsorption mechanism [l9]--[28] is extremely interestingFormally it is the conversion of acoustic energy into heat due to repeated compressions and expan- sions of the ocean associated with the propagation of a soundwave and is highly dependent uponrangeand frequency Below 100 kHzabsorption is primarily due to the ionic relaxation of magnesium sulfate ions in sea water This is where the MgS04 ions dissociate and then reassociate under the pressure of the sound wave involving a finite time interval called the relaxation time At about 100 kHz there is additional absorption due to shear and volume viscosity Above 1 h4Hz the dissociation loss disappears and ahsorption is due entirely to viscosity At frequencies below about 5 kHztheabsorption lossis much higher than that caused by ionic relaxation of MgS04Soundabsorption is discussed more thoroughly
in a companion paper by Marsh Caustics developedwithinachannel will result in
absorption losses much lower than that computed A caustic is the envelope formed by the intersection of ad- jacent rays (focussing) producing high sound intensities When a caustic intersects the sea surface the region a t or near the surface is known as a convergence zone as discussed before Propagation loss to the first convergence zone is generally 10 to 15 dB lower than that computed with spherical spreading and absorption This is a big plus for convergence zone operation
When a complex signal is transmitted the received waveform will have thesame amplitude-phasecharac-teristicsasthe original signal only if all of its Fourier components are attenuated equally and if they all propa-gate at trsquohe same phase velocity Therefore distortionless transmission requires that the attenuation coefficient be independent of frequency and that the phase coefficient be linearly proportional to frequency Howeverthese conditions arenot satisfied As indicatedabove the attenuation coefficient (the coefficient of that part of the propagation loss which is proportional to range) is a function of temperature pressure and salinity as well as frequency In practice the total attenuation is due to thesurfacebottomand volume scattering losses as well as to conversion of the sound to heat by absorption The phase coefficient is the retardation per unit length from the phase shift corresponding to zero frequency The effects of phase distortion have thus far not been experi- mentallyconfumedThese effects will depend uponthe fine time structure of the signal waveform Thismay result in appreciable distortion in wideband signals
Other propagation effects which cause signal distortion are multiple propagation paths doppler finite amplitude medium coherency and time dispersion
The existence of multiple propagation paths [24] each having a different travel time may result in a lengthening of the duration of pulsed signals particularly if the signal is initially of short duration eg transients In experi-ments involving explosives impulses whichlasted a few milliseconds near the source have produced distant signals which persisted for several seconds It was estimated that nearly 200 separate arrivals contributed to the received waveformoverarange of about 500 nautical miles Multipaths are essentially boundary effects
The doppler effects [25] C261 or frequency shifts are attributed to path lengths changing with time which may be caused by reflection and scattering by objects inmotion relative to the source andor receiver Experiments have shown that doppler spreading in the surface duct (depth 55 meters wind speed 6 meterssecond) can exceed 5 Hz
An interesting propagation effectis the anomaly pro- duced by a sound wave traveling with a finite amplitude [27] [as] Finite amplitude waves are those whose peak pressures are comparable in magnitude to the st8atic pres- sure Propagation is characterized by a steepening of the wavefrontwhichenhances the high frequency content
WINDER SOUND
with respect to the low frequencies and is opposed by the broadening due to high frequency absorption Finite amplitude therefore represents a departure from the linear acoustic wave equation ie superposition is no longer valid The velocity of a finite amplitude wave is frequency dependent resulting in waveformdistortion-even for transmission through an ideal medium
Recent studies of medium coherency most notably the MIMI tests have established that the ocean has a remark- able phase stability andthatitis not the random in- homogeneous medium often described [as] The large fluctuations which characterize acoustic propagation are primarily duetothe interference of close multipaths generated by reflections from the air-water interface and sea bottomThe observed temporal fluctuations are therefore due to doppler spreading If themultipaths have a discrete distribution in range (or doppler) they may be resolved and trsquoheir interference is thus removed In fact the notion of signal coherence only has meaning after this multipath interference has been removed [30]
Time dispersion is a constraint on the range accuracy in an echo-ranging sonar [31) It isdue mainly to the dispersion in the vertical angle of arrival which is highly pronounced for shallow water propagation At short ranges there will be a series of discrete arrivals each with little frequency dispersion For longer ranges there will be discretearrivals with appreciable frequency dispersion within each arrivalandthey will generally overlap Dispersion not only depends on range but also on the number of sound rays (or normal modes) received and effective bandwidth for each ray (or mode) Vertical dispersion in arrival angle will also limit the azimuthal angular accuracy [ 3 2 ]
Reverberation Effects
Long-range sonar performance is stronglydependent upon surface biological and bottomscattering in the backward directrsquoion In practice tmhe transmitting and receiving arrays are usually in very close proximity to one another (if not one andthesame) Therefore a scattering of prime importance is that of back scattering- where the scattered energy returns along the path of incidence Analogous toarchitectural acoustics this interference is generallytermed ldquoreverberationrdquo which also refers to all sound refleckd and scattered back to the receiver regardless of the path In radar applications this is called clutter
If the scatterers aredistributed uniformly in range then reverberation returnstendto a stationary process A nonuniform distribution in rmge tends toa nonstationary process which is further enhanced by the finite bandwidth of thetransmitted signal [33] Nonstationarity implies a time-varying mean and variance which is primarily responsible for poor signal processing and for a background having a nonuniform contrast on a display For a very narrow beamwidth and short pulselength the reverbera- tion is impulsive or discrete in time (there are finite holes
UNDERWATER 301
in the reverberation waveform) As the density of the scatterers increases the reverberation tends to a Gaussian process and thus may be characterized by second mo-ments(eg auto-and-crosscorrelatioru) Experiments show that for a wide range of ocean conditions the in- stantaneous reverberation amplitudeis Rayleigh dis-tributed (ie at a given range from one ping to the next) [34] In addition the reverberation envelope for bottom scattering usually has a higher degree of coherence than for surface and volume returns If thescatterersarein motion relative to the transmitting and receiving arrays thescatteredreturnsare doppler distrsquoorted In general different scattering regions have different) velocity dis- tributions causing the reverberation bandwidth to vary as a function of time C351 Clearly reverheration is a stochastic process of both space and time
A fundamental parameter which characterizes revcrbera- tion is called scattering strength It is the ratio in dB of theintensity of the sound scattered by a unitarea or volume referred to a distance of 1 yard t o the incident plane-wave intenshy Since the direction o f scatkcring is normally back toward the source thc parameter of in- terest is the back scattering cross section of a unitrsquo area or volume
The surface back-scattering strength is a function of wind velocity grazing angle and frequency [ R G ] A t low grazing angles it tendsto become independent8 of trsquohe grazing angle This is attJributed to a subsurface layer of isotropic scattrsquoerers probably of biological origin which masks the reverberation due to scattrsquoering from srlrface roughness For larger grazing angles thc volrlnle scatterers will act as a precursor but surface scatteringwill dominate A portion of the precursor may be attrihutgtedto scattering from a layer of air bubbles tmpped just below the sea surface [37] The suspended air content of seawater has a marked effect upon underwater sound due to air having a highly different densitrsquoy and compressibility than seawatcr and because of the resonant characteristics of air bubbles At high grazing angles back-scattering is primarily a coherent scattering or reflection from wave facets inclined a t right angles to t8he direction of the incident sound It is important to note that wind velocity rather than wave height (or sea-state) is used to cleternline the sea surface back-scattering strength This is hrcause it is trsquohe small scale roughness that is important Wind velocity may be considered to ldquomodulaterdquo the wave (the period of ocean waves average from 3 to 8 seconds) and is trsquoherefore a more accurate description of thc snrface roughness than sea-state
Bottomreverberation is somewhat nmre subtleAt present there are two theories concerning its origin The first and most popular is that it is due to hottorn rough-ness similar to sea surface scattering The srcond is that it is due to thesize of the particles or grains i n the bottom similar to volume scattering The dependence o f tlhe bot-tom reverberation level on the type of sedinlent tcnds to justify botgth theories As wind velocity is a mmsurr c j f sea
302 IEEE TRANSACTIOXS ON SONICS AND GLTRASOXICS SEPTEMBER 1975
surface roughness so is bottom type (eg mud silt sand rock) a measure of bottom roughness Measurements have shown that a theory based upon particle size or bottom composition gives only an approximate indication of the
u I I
Fig 9 Comparison of directivityatterns of (A) discretelinear arrayhavingelementsspaced a t Ralf-wavelengths and (B) con-tinuous uniform line transducer
back-scattering strength at a given grazing angle Thus there must be another contribution to bottom reverbera- tion Experiments indicate that rock bottoms havea back-scattering strength with little or no frequency dependence while sand and silt bottoms haveone which increases with frequency at a rate of 3 dBoctave(variesasthe first power of frequency) [38][39] This has been attributed to the difference in the scale of bottom roughness and agrees with basic scattering theory It therefore appears that bottom roughness is a major and possibly a dominantcontribution to bottom reverberation
At present the models for bottom back-scattering are either too simpleor rather involved for computation Data indicates that a good description of the back-scattering of sound by very rough bottoms is to consider the spatial distribution of scattered energy to satisfy an omnidirec- tional law or Lambertrsquos law that is a sine or sine-squared processor (including displays) for frequency and temporal dependence of the grazing angle respectively [ M ] There discrimination Thus the beamformer may be considered is no theory to justify either behavior Lambertrsquoslaw to beaspatial filter and can employanalog or digital has been previously used as a measure of the radiation of components for forming the beams light by radiant absorptive materials In this model there Analog beamforming operatrsquoes in a linear manner is no frequency dependence A more ambitious theory is Therefore there is no performancedegradation dueto one which treats the rough bottom as a diffraction gratingnonlinear effects However the size and weight of the where the scattering is primarily generated by the wave- length component of thebottom roughness for which phase reinforcement occurs [41] This involves the notion of a ldquoroughness power spectrumrdquo which is the amplitude squared of the irregularity in the bottomcontourasa function of wave number Presently there is little data on the roughness power spectrsquorum of the sea bottom
Volume reverberation is produced by a three-dimen-sional distribution of biological scattererswhichare located in large part in a diffuse layer generally referred to as thedeepscatteringlayer(DSL) [42] [43] The DSL is rather complex in composition and distribution and exhibits a diurnal migration in depth The model for biological back-scattering is still incomplete andthe greatestunknown in long-range echo-ranging This is most significant in convergence zone operation Diurnal dependencemaycausevolumereverberation levels to increase 10 dB at sundown and decrease 10 dB at sunrise These changes are the cause for surface ship sonar to have its poorest performance in the afternoon However there are areas which show no diurnal effect but strong seasonal dependence
G CONVENTIONALBEAMFORMING Beamforming is the process by which an array of spatial
elements of arbitrary geometry and dimensionality spatially discriminates against noise and reverberation fields This is accomplished in the beamformer through a series of operations involving the weighting delay and summation of the signals received by the spatsialelements The summed output is then sent to the electronic signal
beamformer becomesexcessive if many simultaneous beams are formed Adigitalbeamformer is compatible withmultibeamformatmion of large acoustic arrays and computerbeamforming algorithms It utilizes an AD converter m-hith is a nonlinear device This may introduce a slight degradation inperformancebut will generally reduce hardware size weight and complexity and simplify data handling
In this section many space-time aspects of conventional beamforming are discussed These include linear super- position space-frequency equivalence the significance of thedirectivityfactorand space-time sampling the im- portance of the array gain and space-time correlation function as operational measures the effects of wideband operation in reception on a single-frequency design super gain concepts and the status of digital beamforming
Linear Superposition
A spatial element is said to be linear if it obeys the law of linear superposition The practical result is that the directive properties of a spatial element such as an acous- tic line transducer may be determined by examining the behavior of a number of discrete receiving points spaced along the line [44] Figure 9 shows a comparison of the directivitypatterns of adiscrete linear arrayhaving elementsspaced at intervals of X2 anda continuous uniform linear transducer [45] Each have a total length of 5k and the relative acoustic pressure is specified by the ratio of the voltage developed by the acoustic energy of given intensity at a given bearing to that developed by the acoustic energy of the same intensity arriving along
303 WINDERUNDERWATERSOUND
ZRIOUS SPACECOMPLEXITILS OPERA- h 2-ELEMENTCORRELATION ARRAY OPFRA ING ING AGAINST ASINGLEFREOUENCY GAINST A SOURCE HAVINGVARIOUS
E Q L J F N C YC O M P L U L T I E S B E A MP A T T E R N
SPATIAL FREOUENCY SPATIAL FREOUENCY CONFIGURATIONCONFIGURATION
FULLDIRECTIONAL RADIATOR
DISCRETE RADIATORS SPACED X12 APART
0 0 0 0 W
i+ RADIATORSSPACED gtgtAf2 APART
0 o w
CONFIGURATION CONFIGURATION
CONTINUOUS BANI OF FREOUENCIES
DISCRETEFREC CLOSELY SPACED
D I S C R E T E F R E O ~ IWIDELYSPACFD
Fig 10 Equivalence between complexity of receiving array and complexity of frequency configIratian of source
-the axis normal to the arrayA line transducer is equiva- lent to a discrete array having an infinite number of ele-ments It is seen that there is little improvement in direc- tionality to warrant providing a discrete array with more elements than are sufficient to give a half-wave spacing The height of the secondary lobes may be slightly in- creased but the width of the major lobe is practically unchanged
When the response of discrete receiving elements are known the response of an arbitrary configuration can be derived by using the principle of pattern multiplication The radiation pattern of an array of spatial elements each of which has the same pattern with the same orientation in space may be found by 1)replacing each of the elements by an omnidirectional element at the same point and with the same amplitude and phase excitation 2 ) determining the array pattern of the resulting array of omnidirectional elements and 3 ) multiplying the arraypatternbythe radiation pattern of the individual elements of the original array
The analogy to the impulse response in the time domain is the response of a spatialelement to a distant point source A point source is one whose dimensions are small in comparison with the wavelength emitted so as to radiate a spherical wave Such a source radiates uniformly in all directions and is the building block needed for linear superposition Hence analogous to a temporal system the output of a spatial element is the convolution of its point source response and source distribution This is the spatial convolution theorem Although spatial convolution can be readily formulated it cannot always be evaluated in closed form and either numerical analysis or transfer function descriptions may be required
The plane wave response pattern of a receiving array is obtained when the radiator is a point source at a suffi-
cient distance such that a n inc-rmsp in thr distance will produce no detectahle changei n thr pattern If the source subtends an apprecia1)lr angle thr rcsponw pattern will be modified [46] The direct8ional discrimination of the array depends on the responsc to sourccs out8side the major lobe Boundaries inlpos4 on spatial extent produce sidelobes in the response and affect the interpretrsquoation of the various spatial descriptions
Methods for describing basic propcrties of spatial elements may use space or ldquosl)ttiaI-frcqllencyrdquo as vari- ables The freedom o f selection corrcywnds to the choice of time or frequency in circuit) prohlt~ns The space trnnsjer function completely charactcrizes n spatial element It is primarily a steady-state or far-field dcscription and is often more convenient to work with than the point source response From the properties of Frsquoouricr transforms the spatial-frequency spectrum of an aperture distribution modified by any numhrr of suc(~twiwlinear operations is the product of the spatial-frcclucncy spectrum of the original distribution and the spatitl spcctm of the several linear operations Therefore an analysis performed in the spatial-frequency domain replnrrs s~~cccssive intcgrations by successive multiplirations
Space-Frequency Bquivalmce A relationship of considerable importtanre in represent-
ing spatial structuraldet8ailand analyzing spataid problems is one which establishes that the relocity amplitude dis- tribution across the array and its tlirectgtivity pattern in the far-field (Fraunhofer region) are Fourier transforms of each other [47] [48] Therefore Fourier analysis can be used t30 compute the directivity pattern if the aperture distribution is known or may hn used to detrsquoermine the aperture distribution required to prorluce a desired direc- tivity pattern (synthesis problem)
304
When a Fourier relationship exists between pattern and excitation there is reciprocal spreading between aperture and pattern widths For example if the aperture width is increased by a factor m the pressure level increases m times at broadside and the beamwidth is reduced by lm
The reciprocal relationship between aperture and pat-tern widths is displayed by similarity of the directivity patterns for isofrequency receivers of large spatial extent and wideband receivers of small spatial extent [49] The equivalence existing in a receiving array between its spatial configuration and the frequency configuration of the source is illustrated in Figure 10 As the spatial con- figuration is varied to improve the directionality against a single frequency source in the frequency case this corre-sponds to using a 2-element correlation array operating against a source transmitting wideband signals If the continuous uniform array is replaced by point elements spaced at half-wavelength intervals then the continuous frequency distributionof the sources will be replaced by a set of discrete frequencies When the element spacing or discrete frequency spacing is made large multiple major lobes result These relationships can be utilized to improve spatial processing gain and in formulating new systems
Directivity Factor Directivity I n d e x
The concept Of directivity expresses the Of a spatial element or an array of such elements to 1) concen-trate signal energy in the desired transmitting directions or 2) to descriminate against interference arriving from bearings other than those desired Directivity both in transmitting and receiving is dependent upon the ratio of the sound wavelength to the dimensions of the elements and their spacing For a single element if the wavelength is large compared to the dimensions the sound is emitted uniformly in all directions and the elements response will be independent of the direction of sound incidence If the dimensions are large comparedto a wavelength the sound energy-transmitted or received-will be directional Use- ful measures o f the directive properties of spatial elements are the directivity factor and directivityindex [io] [ill
The directivity factor(DIT) is defined as the ratioof the intensity or mean square pressure of the radiated sound in a free field a t a remote point on the maximum response axis (MRA) totheintensity or meansquare pressure averaged over all directions The distance must he sufi-ciently great SO that the sound appears to diverge spheri- cally from tht effective acoustic center of the source The averageintensity of the sound passing through a large sphere of radius ( r ) is found byintegratingthenormal component of the intensity (I) over the surface ( S ) of the sphere and dividing by the area 4 d The directivity factor may then be expressed as
IIn C~S
where Iois the intensity at the remote point on the RIR-4
IEEE TRANSACTIONS ON SONICS AND ULTRASONICS SEPTEMBER 1975
Fig 11 Rectangular plots of typical (a) difference pattern and (b) sum pattern
In the far-field the intensity of the radiated sound is the square of the absolute value of the pressure divided by the specific acoustic impedance
The directivity index (DI) is the expression of the direc- tivity factor in decibels thus
D1 = 10 log DF (2)
For linear array of point spacedelements at integral half-wavelengths the maximum directivity index (RIDI) is obtained with uniform constant phase excita- tion The maximum directivity factor is then numerically equal to the number of eleTnents (even or in the
array
DF = V dX = n2 ( n = 12 ) (3)
For other values of element spacing the MD1 is not obtained with uniform excitation Thereis little difference between the 1IDIand the directivity index due to uniform excitation for element spacings greater than half-wave-length However for d X lt l 2 tgthere may he asignificant improvement in the directivity index in going from uni- form excitation to MD1 excitation The beam patterns due to the latter are referred to as superdirective and are obtained at the expense of requiring out-of-phase excita- tionanda relatively large range of amplitudes These amplitudesmust be controllcd with extremeaccuracy to achieve the predicted spatial gain and in addition the element spacings and operating frequency must be ac-curately controlled to the same degree
Certain applications may require special types of direc- tivity patterns such as a difference pattern Whereas the sum pattern exhibits even symmetry about a line drawn perpendicular to the aperture at its midpoint the differ-ence pattern exhibits oddsymmetryaboutthesame axis A conlparison is shown in Figure l 1 for a line source A sumpattern usually will have onemajor lobe in the direction of the principal axis while a difference pattern has two equal lobes with a null in the direction of the principal axis
WINDER UNDERWATER SOUND 305
Combinations of sum and difference patterns are used insonar (andradar) systems to improve the accuracy of bearing measurements Theerror signal obtained is primarily determined by the slope of the difference pat- tern in the vicinity of the origin To enhance the sensitivity to small changes in angle it is necessary that the slope be as steep as possible For sum patterns the influencing propertiesaredirectivity index beamwidth and side-lobes For difference patterns slope and sidelobe level are significant for determiningangularsensitivity If the sidelobes are too large false indications of target direction may result in the presence of multiple targets Theory C521 shows that a constant phase (except for a 180phase reversal) linear excitation function gives rise to a maxi-mum slope pattern The maximum slope pattern may not be the most desirable pattern to use in that the sidelobe level is quite high Thus a compromise must be made be- tween slope and sidelobe level for angular error sensitivity
If the elements of a linear array are uniformly spaced then the sidelobe level and beamwidth may be controlled byvaryingthe element excitation A general result of uniformly spaced arrays is that the sidelobe level may be reduced by decreasing the aperture excitation toward the extremes of the array This reduction is obtained at the expense of the array beamwidth
If the elements are nonuniformly spaced thearray will be characterized by spatial frequencies which are not related by integers An unequally spaced array has many interesting properties [53] [54] C-551For example there is an equivalence betweenamplitudetapering of a uni-formlyspaced arrayandthe spacevariation in a non- uniformlyspaced array Hencenonuniformelement spacingmaybe used to reduce sidelobes increasing the spatial processing gain Use of perturbation methods can reduce the sidelobe level to about 2AV timesthemain lobe where N is the number of array elements To achieve this reduction implies retaining uniform excitation
A perturbation analysis may be performed to indicate small nonlinear changes in element spacing However the more useful properties of nonuniformlyspaced arrays depend upon large nonlinearities in the element spacings An approximate method for making an analysis of such arrays may be achieved by representing it with an equiva- lent uniformlyspaced arraythroughspatial sampling techniques
Space-Time Sampling The use of samplingtechniques [56]-[59] in array
design is a natural extension of sampling theory in signal representationA linear array of N equally spaced ele- mentshas hr degrees of freedom since it is possible to establish N coefficients of the Fourier series for the far- field radiation pattern When the elements are arbitrarily distributed each element will have an added degree of freedom namely its position along the axis of the array This is analogous to nonuniform temporal sampling of a signal
If the analysis time and signal bandwidth at the array outputare limited to ( T ) and ( W ) respectively the
received pressure distribution at any point on the aperture can be represented by 2WT sampled values Similarly if ( e ) is the half-power beamwidth and ( L ) the length of theaperture parallel to some axis the onedimensional distribution at any instgtantof time can be represented by OLX sampled values across the apertureThe factor of two(in 2WT) is unnecessary here because knowledge about phase a t sample pointsspaced AI0 apart on the aperture is obtained fromthe 2WT samplepoints in time The total number of sampled values may be taken as theproduct of thespatialand temporal degrees of freedom Thus the received pressure distribution across the aperture ( L ) during time ( 5 ) may be represented by X = 2WTBLA sampled values
If ( H ) possible amplitudes of the pressure can be meas-ured at each sample point then for the one-dimensional aperture the total number of different signals which can be described by (Vg)sampled values is N ( 2 w T e L I X ) Any one of these signals can give the history across the length ( L ) and for t8he time (T) butt8here is only onewhich gives the actual history of the spare-time domain Sam-pling theory can be easily rxtended t80multidimensional arrays It is important to recognize that various problems require proper tradeoff betjiveen spatial andtemporal samples basedupon the desired accuracyhardware complexity and display fornxtt The best sampling dis- tance in space will depend upon the spatial strurture of the masking background In general the detection process 11411 require less degrres o f freedom than that for rlassifica- tion which often includes an assessment of size and shape Multidimensionalsampling of thc aroustir ficld employs multibeamforming techniques
The angular resolution of a sonar system is intimately associated with the r0nstraints of space-time sampling I t is dependent on the signal-to-noisc ratio of the received signal the size and shape of the source (or target) the beam pattern of the receiving array andthe dynamic range of the receiver and display subsystems
Array Gain The array gain is a measure of rereiver spatial processing
which has greater operatgtional significanre than the direc- tivity index [W] This is berause i t is expressed in terms of the space-time correlation structure of the signal and noisefields [Sl] thereby representing the dynamics of the medium and sonar platform and the effects of hydro- phone directivity The array gain is fornlulated as
where
pi j ( s ) signal correlation between (ij)th elements p i j(n ) noise correlation between (ij)th elements N total number of array e1ements
306 IEEE TRANSACTIONS ON SONICS AND ULTRZSONICS SEPTEMBER 1975
Clearly the signal class js very important for evaluating the array gain since it establishes whether the formulation and measurement of the signal and noise inberelement correlations should be made on the basis of energy or power It is interesting that at sea the minimum detect-able signal level is measured by injecting a simulated echo into the receiver for a specific condition of interest and determining the weakest signal level detectable by the sonar operator Therefore in practice the computed figure-of-the merit for the sonar system reflects the array gain established by the existing signal and noise fields and not the directivity index For a homogeneous com-pletely correlated signal field and an uncorrelated uniform noise field the array gain reduces to the directivity index value
Space--Tinje Correlation Funrtion
The ahilit8y of ~ J Iarray to discriminate against plane waves is determined hy the coherence of tjhe waves at various points on the array Thisimplies that a correlation function description would he a meaningful measure of how far apart the hydrophone elenrents may he and still preserve the phase coherence o f the signal and also of the coherence introclucrd in the noisefield bythe element spacing If the ampate of Irnou-ledge is the value o f the pres- sureat two arhitrary points ( X ) and ( X ) andtime instants ( t l ) and ( h ) then the coherence may be described by averaging the product of the pressures either tem- porally statistically or spatially
Inthe case of time averaging the representation is called the space-time correlation function +(XltX2tzgt and is expressed as [C21
4 ( X l h j S P t ) = )( p Xtl) p (X) ( 5 )
where the angular bracket refers to a time average Statis- tical averaging corresponds tothe different possible states of the rrledium If the pressure waveis ergodic time averaging and statistica1 averaging yield identica1 results depending only on the time difference T = tz - t l For a spatially homogeneous process the spacetime correlahn functiondepcnds only on the coordinate difference T = X - X y = Yz - Ylz = Zz- 2 Thus for a station-ary and spatially homogrnwus random process
$(XltlXztz)= + ( X - X 1 T j = ( p ( X l t ) p ( X s t+ 7 ) )
(6)
and wouldyield equivalent results if averaged spatially 4s the distance between points and the difference hetn-een time instantsincreases the correlation function decreases
Vor anisotropicnoise field whitened and band- limited to one octavegt the zero-lag space-time correlation function for a lirlmr arra parallel to the I axis is [SS]
S(395)- Si(27rS)$( r O) = - (7)
2TC
Pz
0 8
o 06 U v)Ing 04 U
p 0 2
Ic---t--t-------- xg 4
OZwg I O li2=-l6 18 20W N
-02-r SPACiNG (IN WAVELENGTHS)
Fig 12 Crosscorrelation of octave hand noise
where (x) is the spacing in wavelengths and S ( r ) de-notes the sine-integral Figure 12 shows a plot of p(rO) as a function of the separationin wavelengths at the lower cutoff frequency Numerical cvaluat~ion indivwtes that the correlation is essentially zero hen ( S ) is greater than 0348 It may be generalized that the effcctive dirw- tivityfactor for uniform noise for a sct of receiving elements arranged arhitmrilp ill space is X providrcl tlrat the spacing betwen adjacent elemcnts is oqunl to or greater than a half-vavcleagt4h ~ t t he gromctric r r l rnn frequency of the band [04] This v a ~given earlicr for the specific case of a linear array
Wideband Reception
When the directivity index of an array has Iwcn mnxi-mized a t a single frequency nttcrnpting to oprraic the array in trankmission with signals of finite bantlnitlth or in reception 7vith background noise of finite bandwidth may seriously reduce the DT
The amplitude shding rcquircd to rnaxilnixr thr dirrct-tivity index in reception for any spectrur~may h r drtcr-mined by considering the space-correlation funampon of the noise field Shxinrizing the receiving response of an arrcly depends almost entirely upon these noise corrrlations and requires selecting that shading which will cancel the coherent parts o f the noise rccamped 113-the various c l a n c ~ ~ t s as much as possible As was stated previonsly if the spacing is sufficientlywide so that thrrr islittle 11oisc coherence little can be done to maximize tbe directivity index by using nonuniform shading
By applying the method of Lagrangian nlultiplicrs Faran and 1lillq [C] have used the space noisc correlation function t0 maximize the directivitv index They s h o ~ e d that theD1 of a broadside linear array nlaximized for operation a t a finite bandnidth is less tlrnn the XfLgtIfor operation at a single frcquency hut i s much grmtrr t 8 h n n the D1 realized by using tshc sinamp frequrncy dcsign it t h e finite bandwidth
The presence of self-noise in the individual elenrents of an arrav or their preamplifiws may srriously rrduce thn effective gain of the array designcd for maximunL dirrc-tivit8pindex This degradation of perfonnancct is parf8icu-lady enhancrd if theamplitude rhatlirrg of m y o f thr
SOUND WINDER
elements is considerably larger than the overall value required for uniform shading Thissituationmaybe considerably improved by designing the array for maxi- mum effective gain in the presence of self-noise
A problem of particular interest is the abilityto charac- terize the information in a modulated signal For a linear array of discrete point elements if the element spacing is less than the modulation wavelength then the directional properties of the array will not be appreciably reduced An order of magnitude for the modulation wavelength (h) is the product of the velocity of sound ( c ) in the medium and the period of the modulation (lmodulation bandwidth = F ) X W 2cF If thisconstraint on the element spacing is met then the level of the normalized mean-square response for amodulated signal will be nearly that for a signal of a single frequency within the band [SS]
When the modulation wavelength is much less than the element spacing it is convenient to determine the response as a function of time and of angle For a linear array at broadside the response as a function of time will consist of a single signal having the sameshapebutgreater amplitude thanthat received by each element As the bearing off the MRA is increased the beamwidth will increase and cause the response to be spread over alonger period of time Due to interference between the signals from the separate elements the amplitude response will be reduced relative to that atbroadside A further increase inbearing willminimize the interference resulting in a time response comprised of a series of signals correspond- ing t0 each element When this occurs increasing the bearing will increase the distance between individual signals and consequentlyspread the response over a longer period of time Furthermore all amplitude levels of the response will remain fixed
Superdirectivity
A maximum or super gain array [67] [SS] is one whose mainbeam is narrower than that from an array of the samelengthandoperatingfrequencyhavinguniform excitation This increases the effective directivity index of the array which may be considered as an increase in thetotaldetection threshold of the system Therefore a super gain array is particularly attractive in applications requiring detecbing signals in the threshold condition [SS] The use of super gain arrays in transmission and reception results in large losses inarray efficiency and involves maintaining close tolerances of the amplitude and phase characteristics of thearray elements The severity of these tolerances tends to increase with in- creasing improvement in directivity In addition receiver self-noise is a major consideration in realizing super gain In underwater acoustics sea and own-ship noise levels at low frequencies may be much greater than the thermal noiselevels of the transducer elements and their pre-amplifiers Although directivitypatternshavinganar-rower beam than may be obtained from uniformexcitation
UNDERWATER 307
of an aperture of the same dimensions are theoretically possible the realization of such patterns is characterized by severe restrictions of bandwidth element spacing op- erating frequency and a susceptibility to inhomogeneities in the medium in the vicinity of the array
Digital Beamforming The advantages of a digital beamformer with respect to
an analog beamformer are
simplifies data handling less size and weight formation of many simultaneous beams with minimal
increase in hardware complexity deleterious effects of noisy sensors are minimized amplitudeandphaseweightingsareindependent of
frequency beamforming algorithms can be implemented as soft-
ware in special purpose mini-computers
A typical beamformer model is one where each hydro-phone output is sent to an AGC amplifier followed by an ADconverter whose output is time sampled and de- layedamplitude weighted and summedwith other similarly processed hydrophone outputsto form the beam The AGC amplifier is required for dynamic range compression and normalization reducing the operational constraints on the ADconverterTheADconverter or quantizertransformsanaloginformation to digital informationor binarynumbersThe effectiveness of quantization depends on the number of quantizing levels the step size and the input signal-to-noise ratio as well asthe dynamic range backgroundfluctuationsand conversionaccuracy Thetimedelay corresponds to delaying the entirebinarynumberthetimedelay ele-ments are usually obtained with digital shiftregisters The amplitudeweightingfactorprovidesadditional degrees of freedom prior to summing When carried out digitally the weighting corresponds to shifting the symbols or bits representing the binary number resulting in weightings of multiples of one-half
When the beamformer employs a one-bit quantizer or hard-limiter it is referred to as DIMUS (DIgital MUlti- beamSteering) [70]C71-j The reduction in signal-to- noise ratio (SNR) by extreme clipping at the beamformer output without post-filtering is a function of the input SNR and the number of staves used to form the beam Measurements indicate that the clipping loss against noise is about 24 dB minimum and against reverberation it is about 30 dB minimum
Thedirectivitypattern of a l-bitdigitalbeamformer has a distorted slightly narrower major lobe and higher sidelobes than a linear beamformer [72] In practice the sidelobes for a DIMUS-typesystemareabout -14 dB to -16 dB This may result in poorer spatial discrimina- tion against reverberation dependingupon thetrans-mittingdirectivitypatternthan a linearbeamformer Filtering the output of the beamformer may reduce some of the deleterious effects However it is quite doubtful
308
that performance can ever be achieved comparable to the linear beamformer over the full range of input signal-to- noise ratio multiple targets and reverberant fields
Analysis of multibit quantization [73]-C781 has shown that for an uncorrelateduniform noise field the on-target array gain increases monotonically with the number of bits of quantization with the array gain at 4bi ts per channelapproximately equal to that of an ideal linear beamformer From the point of view of achieving maxi-mum array gain a 4b i t optimum quantizer is therefore adequate for the conversion of analog signals in each channel to digital numbers prior to delay compensation and summing The optimum quantizer step size normal- ized with respect to the variance of the input noise for a given number of output levels (or bits) varies with the input SNR I t appears that an optimum step size exists for the small input SNR which is of primary interest for long range detection-active or passive
H ADAPTIVE ARRAY BEAMFORMING Adaptive array beamforming refers to the technique of
placing points of insensitivity or lowered response of a receiving beam pattern in the direction of large far-field coherent noise sources This will reduce the total back-ground noise power received by thearraythereby in-creasing the signal-to-noise ratio of the system Coherent directional noise sources may beattributedto multiple targetsbackscatteringmultipaths self-noise mutual systems interference and jamming countermeasures This technology is presently being applied in the fields of sonar radar and seismology
Three types of spatial filters commonly used for remov-ing coherent noise depending on the performance cri- terion are
I) the maximum signal-to-noise ratio or Matched filter 2) the minimum signal distortion or Wiener filter and 3) the minimum total probability of error or Bayes
filter For an array of N elements the spatial filtering properties of these filters are the when detecting monochromaticsame signals and all require the measurement of N Z correlation coefficients and a 2N X 2 N matrix inversion However their temporal filtering properties are generally different as well as their areas of application The three filters can be designed to operate in an adaptive mode which permits the system to operate efficiently in a changing environ- mentThedirectapproach to adaptivityappears to be quiteimpractical since it requires a large number of correlators for determining the correlation coefficients and a large capacity computer to perform the operation of matrix inversion This process would have to be repeated periodically since the input noise background statistics are usually changing Also an infinite statistical sample would be required to obtain the exact correlation coeffi- cients-whichisimpossible Thiscomplexitymay be avoided by applying a gradient-search method One such algorithm is the method of steepest descent The per- formance criteria given above are approached systemati-
IEEE TRANSACTIONS ON SONICS AND ULTRASONICS SEPTEMBER 1975
cally by changing the weight vector along the direction of the estimated negative gradient vector of the error surface
DICANNE
A straight-forward approach to null steering is called DICANNE(DigitalInterference Cancelling Adapthe Null Network Equipment) the block diagram is shown in Figure 13(a) It is assumed that there is a priori in-formation of the directions of arrival of the interfering ( T z )and target (TI)signals and that I T2 I gtgt 1 TI1 ie the small signal case The essence of the techniqueis to generate an estimate of the interfering waveform For a plane wave interfering noise source in an isotropic noise background the p2-estimate is the output of aconven-tional with element weighting beamformer uniform divided by the total number of elen~ents used for estima- tion ( N ) Thisrepresents an ensemble average of all element interfering waveforms which are in-phase amph one anotherpzis then subtracted from each elementwave-form(phased in the T2-direction) generating a residual signal which contains information of the target and iso-tropic noise field and a minimal of interfering waveform The set of residual signals are then restored to their original phase relationship An estimate of the target may then be obtained by conventional beamformingin the T1-direc- tion followed by adetectorand display for temporal processing The null steering processor causes each omni- directional receiving element tocentera null on the interfering source asillustratedin Figures 13(b) and 13(c) The depth of the null will depend on the precision of the subtraction process
The processing gain ( G ) for this method defined as the ratio of the output SNR to the input SNR is given by
where S N i l and h are the powers of the desired target incoherent isotropic noise and coherent directional noise respectively The term U is a function of N andthe amplitude and phase errors in the subtractionprocess For very large coherent noise sources (Vcgtgt N i gtgt S ) the processing gain is primarily dependent on the amplitude and phase tolerances of the hardware In the absence of coherent interference (hT= 0 N gtgt S) there will be a reduction in the processing gain depending on the number of elements used for the spatial estimate Theeffectiveness of null steering is also limited by the phase errors intro- duced by near-field sources and the asymmetry of the element-to-element amplitudephase response The errors may be greatly reduced by applying feedbackerror-control to each element (after phasing in the T2-direction) In sea testsagainst ship-generated interferences the DI-CANNE processor consistently formed nulls 10-15 dB deep
309 WINDERUNDERWATERSOUND
CONVENTIONAL BEAMFORMER
FOR TI
DETECTOR
( 0 1 BLOCKDIAGRAM OF NULL STEERING PROCESSOR
900
I600
( b) OMNIDIRECTIONAL PATTERN OF ELEMENT ( c 1 ELEMENT PATTERN WITH NULL STEERING
Fig 13 Principle of nullsteering forplane wave interfering noise source in isotropic noise field
Bayes Filter The null steering technique described above is the
degenerate form of a Bayes spatial filter used for optimally processing against a plane wave coherent noise background [Sl] The desired likelihood ratio (LR) to be compared to a threshold value for detection is defined as
(fn(x - Pgt)LR = (9)f n (x)
where x is the observation vector fn(x) is the probability density of x when the signal vector y is absent and the brackets implies averaging over the signal ensemble ( S
The Bayes optimumspatial filter for detecting plane wave Gaussian signals in additive Gaussian nonisotropic noise fields requires a frequencydependent amplitude and phaseweightingnetwork to be applied to each array element In t3he small signal case f n (x - y) can be ex-
panded in a Taylor series about x and the magnitude of x is essentially determined by the background noise field The likelihood ratio criterion reduces the problem to one where the element weighting network subtracts the best linear estimate of the coherent noise component from the received waveform and delays the residual signal on a common plane perpendicular to the direction of the desired signal Assuming hr-array elements the Bayes filter is comprised of NZlinear filters followed by conventional beamforming for each possible signal direction It also requires the measurement and inversion of a 2X X 2N noise correlation matrix a t each Fourier frequency com- ponent in the band
The Bayes filter uses thespectral correlation of the noise field to reduce the noise power through a subtraction process The estimator beam and signal beam are opti- mum-in the Bayes sense and the residual voltages used to form a beam in the direction of the signal will contain
310
a smaller component of the interfering point source than thosein DICANNE The Bayes spatial filter produces deeper nulls and greater processing gain thanDICANNE and in additiontends to cancel all quasi-stationary received noise field componentswhichhavespatial co-herency
Matched Filter Figure 14 shows an example of an adaptive technique
to discriminate against coherent noise in a narrow-band system using the signal-to-noise ratio as aperformance criterion CS2] [83] This is accomplished by changing the gains ai and bi of the ith element according to the method of steepest descent The resulting algorithms are
ai+ = a(z + -2p [ - s i ( t ) s ( t )dt T S
and
where S and N are the signal and total noise power respec- tively T is the period of the center frequency of the band T4 is a time delay which makes the delayedsignal orthog- onal tothe undelayed signal for maximum parameter sensitivity andp is a fixed step change for the lth iteration
(c) Fig 14 Example of adative technique to discriminate against
coherent noise in narrow and system (a) System to be optimized (b) Beam patterns optimized against omnidirectional random noise (c) Beam patterns optimized against omnidirectional ran-dom noise plus a strong interfering signalat -15 The interfering signal is equivalent to coherent noise The adaptive process gen- erated a null about 50 dB deep in the direction of the interfering signal
The method requires 41V correlations for each iteration in the direction defined by the gradient The signal pro- posed for measurement of the signal correlations is a test signal that is injected into the system andproperly phased so as to retain the direction of the desired target For best results recorded target echoes should be employed The noise background required for measurement of the noise correlations may be obtained by transmitting a ping in the expected direction of the targetand receiving the noise and reverberation(orclutter)fromtheexpected range of the target with no target present For the small signal case the signal correlations may not significantly effect the gradient-search procedure and may be omitted A computersimulatedexperiment shown in Figures 14(b) and 14(c) illustrates how the method effectively suppresses a strong coherent interfering signal generating nulls 50 dB deep However the degree of suppression is very sensitive to small changes in the bearing of the interfering signal to the tolerance of gain control of ai and bi and to the statistical fluctuations of the measured correlations due to the finite integration time ( T )
Wiener Filter The application of the methodof steepest descent to the
otherperformancecriteriaie the Wiener and Bayes
IEEE TRANSACTIONS ON SONICS AND ULTRASONICS SEPTEMBER 1975
filters [84] tends to provide simpler implementation of thearray processor The system now requires a priori information of the direction of arrival andspectrum of the target signal only-but not of the noise field It does not directly require the computation of any correlation coefficients but only needs to store thevalues of amplitude weightings
311
1cor vidd)and signals the array processing filteris conlprised of a tapped-dclay line with linear multipliers The processor output signal y ( t ) is formed from the summation o f all delayed and weighted input signals x ( 1 )
NL
y ( t ) = c r i ( t ) W i = W X ( 1 ) (12) i=1
Lvhert WT is the transpose o f the weight vector x ( t ) is the receivcd-input vector I is the number of tap points of tho filter having I - l time delays of A seconds each and is tho nurrher of array ckments For narrow-bandAlsquo
signals the processor for each element reduces to a complex gain bveighting and a single time delay of A equal to 74 seconds as tlescrihed for the matched filter ahove
If thetargct signal and allinterfering noise sources arc assumed statrsquoionary zero-mean random processes and that the signal and noise processes are uncorrelated then the optirnunl veight vector W of a Wiener filter is one whichnliuirllizes the mean-square-error between the desired target Lvaveform q ( t ) and the array processor output y ( t ) This is achievd by the weight vector W given hy the Wiener-Hopf equation
W ==R-rsquoP (13)
wllero R is the syrnnletric correlation matrix ofrsquo the received signals and P is the cross-correlation vector hetween the received vector x ( t ) and the target waveform ( ~ ( t ) Approaching the weight vector Wby the method of steepest descent the algorithm is
W ( k + 1 ) = WCkj + p [ P - R W(k)] (14)
where h is the step size at each iteration Modifications of this algorithnl are
J$rsquotiiLYI I Llsquo
w(k +-1) = W ( k j + r r [ y ( k )- y j k ) ] x j k ) (15)
Crirsquoith S
wjx f 1) = W( )-t - y(k)x(k j ] (16j
Widrovs tcchnique [S51 is to itcrxtr t hc wight vcctor ill the dirwtiorl of the instantaneous squared error This rcquirw the us( o f a pilot-signalwhich generally leads to a biased solution GriKiths technique [S61 is a combina- tion of the steepwt descentalgorithm and Widrowrsquos algoritlltrl---it requires anestimate of the target signal cross-correlatiorl vector P (inlieu of a pilot-signal) and a nwasurelnent of y ( t ) and ~ ( t ) Both algorithms converge to the optimunl processor ( W)in the limit as the number of adaptations l m o ~ n e slarge also the step biee in each is houndcd from above by the reciprocal of the total input power lsquorhcse techniques are analogous to those proposed for adaptive equalization o f digitalconmnmication sys-terns to rnillinliee the intersymbol interference caused by rnediuln sprtading
In a preformed beam sonar adaptive arraJ- bcamform- ing climinltcts the fluctuation and bias effects of the
THRESHOLD
A gt - A C C E P T A AltO-REJECTA
Fig Logical sidelobe eliminatioi very simple kut
effective algorithm for eliminatingdirectional interference
coherent interference on the bcu~nslsquol71~efluctuation refers to the random component of the spatial power distribution and bias is the uncertainty ahtrut the mean component which represents the actualdistrsquoribution Clearly detec- tion would then be limited by the fluctuation and bias effects of the remaining isotropic colnponent of the inter-ference Finally it appears that adaptivearray beam-forming lends itself more readily to tracking rather than detectionapplications since it requires an ttstimate of target bearing and cmss-correl~tion vecf or between the received vector wavefornl and thc target ~vaveform In fact the initial operation for inlproving detection may be first estimate thetarget wavefornl twforc applying the detection decision
Logicul Switching Algorithms
Logical switching Side1obc Elirninatim (SIZ) [S7] [S81 is a very simple but effectivc algorithm for elirninat-ing interference in sonar receivers When a strong signal is received on any sidelobe of thc receiving directivity patternappropriate threshold gstingutilizinglogical switching algoritrsquohnls cuts off the receiver for the duration of the signal only This vonld eliminatedisplay and operator overload
A logical switching SLE syxtrrn fornls two directivity patterns ldquoArdquo andldquoBrdquoPatternldquoArdquo rcpresents the conventional narrotv-beam receiving directivity pattwn Pattern ldquoBrdquo representsanauxiliary or cwntrol pattern which is considerably broader than ldquohrdquo A I I I ( rsquo ~ S U I rsquo Co f the amplitude modulation of the interfcrence field is made with ldquoBJrdquo a weighted estinlatc is formed and threshold compared with the acoustic f i d t l of ldquolrdquo aftw col~ventional beamformlng Therefore the SLK technique utilizes t8he relative difference in levcls o f ldquoAJrsquo andldquoRrdquo tvhich dcpctnds upon the direction of the irltrrferencc and trsquohrrtshold logical switching If a s h n g signal isin tile side1ol)e of ldquoArdquo the output from ldquoArdquo is smaller than that from ldquoUrdquo and a logic gate prevents the signal fro111 reaching the processor and display If the signal is in the intersection of ldquoArdquo and ldquoRrdquo the output from ldquoArdquo is largctr than that from ldquoBrdquo and the signal reaches thc processor and dis-play Thus the spatial pattern presented to thc display is that portion of the conventional pattern highrrthan
312
the control pattern The SIX algorithm is depicted in Figure 15
An SLE system would enhance the performance of active sonar track receivers It has the advantages of conceptual and hardware realization simplicity with corresponding low cost A consideration that may reduce the effectiveness of an SLE systemis multipletarget interaction Although simultaneous multiple targetsare not too likely to occur in actual operation range and velocity gating would greatly minimize such interaction
The techniques discussed earlier for adaptive array beamforming utilize coherent subtraction matrix inver-sion and gradient searchTheyhave theadvantage of never hlinding the receiver ie it is always on-line Although they are optimum in the processing sense what they also have in common is hardware complexity con- siderable cost and extreme sensitivity to channel-to-channelunbalance caused by hydrophone failure toler- ances and background nonstationarity The suboptimum SLEsystem with its simpler and lower cost structure may prove to be the most operationally effective approach for eliminating coherentdirectional masking backgrounds I t is recommended thatthe sonaroperatorhave the option to switch the SLE inor out of the receiver
An example of simple logical switching nonadaptive receiving arrays is the use ofon-off switching of the elementsin a logical sequence to gmerate a directivity pattern with reduced sidelobes (re the static pattern) The measured time-modulated patterns shown in Figure 16 illustrakthat logical scqucntial svitching can produce N-dR sidelobe level Chehyshev distrihutions (re dB theoretical) [SS] The advanOages of this technique are that it reduces the effects of system tolerances and pro-vides the flexibility of matching the sidelobe pattern to the operational environmentie it is adaptableThe effectiveness of the algorithm would depend upon the tradeoff of sidelobe level and array gain reductions and sideband pattern effects
Spatial Threshold Xormalization Spatial threshold normalization (STN) is an example
of incoherentsubtraction n-hich may be applied to a preformed beam sonar system I t is effective in reducing coherent noise and large transient spokes due to machinery noise and those induced electrically It also tends to normalize the rms fluctuationdue to distributed back- ground noise sources
A plane wave representing the target will essentially be contained in a singlc preformed beam while adjacent beams will have considerahly more noise than signal STN is accomplished by subtracting the average of the background noise present in adjacent beams from the beam containing the target Thus the noise threshold in each beam is estgtahlished by a spatial estimate of~both the coherent and incoherent noise in a space sector containing the beam For example consider five adjacent detected beams designated iz B C DE where the target is as-sumed to be in the centerbeam Then a signal output
IEEE TRANSACTIONS ON SONICS AND ULTRASONICS SEPTEMBER 1975
STATIC 1MbSlDELOBE LEVEL ~ SWITCHED 50dbSlDELOBE LEVEL UNIFORM OlSTRlBWTlON CHEBYSHEV DISTRIBUTION
FIRST SIDEBAND PATTERN lOdb STATIC WbSWlTCHED
Fig 16 Measured time-modulated pattern for sidelobe suppression
of the STN matrix is given by
1STN output = C - - ( A + B + D + E ) (17)
4
This may be considered an approximation to a derivative operation Therefore the STN output will tend to follow the rate of change of the detected or correlation envelope reducing dynamic range The dynamic range will be compressed by a factor of a t least 2 1 This method also tends to suppress any beam-to-beam unbalance although it will probably be insufficient for an operational sonar There are many variations to the above algorithm It is important to note that this general technique does not require any a priori information of the acoustic field
I DYNA41ilIC RANGE COMPRESSION ANDNORMALIZATION
The sonar receiver must have sufficient dynamic range so that it can detectthe weakest signal and yetnot saturate upon receiving the largest expected echo re-verberation andambient noise If theoutput of the receiver is fed directly to some form of data processor1 decision device such as a digital computerthenit is necessary to prevent relatively large interference from overloading the capacity of thecomputer A display console operator is affected by distinctive changes in the displaypresentation and thus requires the best display contrast in the vicinity of the returning echo The opti- mum display background for target recognition is one which has a constant temporal variartce at a given bearing and a constantspatialvariance at a given range This presents a backgroundwith uniform fluctuations as a function of range and azimuth resulting in maximum target detection sensitivity These properties arenot inherent since sonar systems operate in the presence of a
RECEIVED LEVEL(db1 DRCNOUTPUT LEVEL
SURCACESURCACE -SURFACE-SURFACEBOTTOMBOTTOM REVERBERATION REFLECTIONSREFLECTIONSREVETRATION
REVERBERATION
RANGE RANGEIDYNAMICDYNAMIC COMPRESSIONCOMPRESSION
l I I 1 1 1 I 1 l I I I 1 i AND 00 11 22 33 44 55 66 77 00 99 NORMALIZATION
BLOCKTIMETIME (SECONDS)(SECONDS)
U FigFig1717IdealIdealperformanceperformance ofof DRCNDRCN blockblock inin activeactive sonarsonar
313WINDERUNDERWATERSOUND
directive time-varying noise and reverberant field and objectives Therefore since reverberation is a signal-in a randomly varying transmission medium generated noise which depends on the acoustic properties
In order to properly evaluate the received information of the medium (eg attenuation coefficient phase veloc-it is therefore necessary to have a referencz or threshold ityandboundaryscatteringstrcngths) dynamicrange level which is independent of the direction and propaga- and normalization constraintsmay be controlled to a tion of the receivedwaveform and the limiteddynamic considerable degree in the transnlitter Thesc constraints range of the receiver The techniques used t80adapt the are further-ontrolled in the receiver by using a preformed high dynamic range of the received signal to the limited beam systenl and thm applyingeachbeam output to a dynamicrange of the display and to obtain a constant narrowband gain control rrceiver nith possible provision spatial and temporal variance background on the display for doppler normalization are referred to as dynamicrange compression and nor- The limiting interference in passive sonar is ambient malization (DRCN) The methods employed are denoted noise since there isobviously no reverheration In practice by the DRCNblock shown in Ipigurc 5 and arerequired to there are large variationsin noise power from hydrophone optimize performance in the processor and display These to hydrophoneresultingfrom the directivityand non-aspects are clearly understood when viewed with respect stationarity of background noise Thissituation isen-to the two types of sonar operation-active and passive hanced by the machinery and flow noise of the receiving sonar platfornl Dynamicrange is generally not a stringent
The limitinginterference in activesonaris sound re- design parameter so thatspatial normalization only is flected or scattered hack to the receiver Since the ocean theprimary consideration In passive sonar these con-is multilayered and anisotropic the scattered returns or straints are controlled in a n-ideband receiver employing reverberation forhigh energy transmissions establish the a preformed beamsystemand hard clipping Hard clip-primary requirement for dynamic range compression and ping simplifies such problems as automatic level control normalization rather than ambient noise Ambient noise and normalization before applyingthresholdingtech-becomes significant only a t long ranges after thereverbera- niques andmayhe incorporatedineither the signal tion has sufficiently decayed These aspects are shown in processor or the beamformer Figure 17 The purpose of the DRCN block is to produce A complete spatial normalization can only be obtained a uniform output for the input shown The reverberation if coherent noise sources arc climinated Thismaybe waveform was recorded on a shallow water omnidirectional accomplished by employing thcadaptivt beamforming sensor following an explosive charge in deep water The techniques discussed in the previous section initial return issurface revcrherationwhich decays rapidly The concept of dynamicrange compression and nor-into volume reverberation originating primarily inthe malization is generally omitted when studying detection DSL The remainder of thereturn is due to multiple andestimation theory Its importance however cannot reflection and scatteringa t the surface and bottom bound- he overstressed---itwill usually inlake or breaksystem aries These slowly decay into the ambient noise back- design since it sperifies the integratgtionof a theoretically ground designed optimum processor to it8sinterfacesie the
Withactivesonar the designer is free to choose the operational environment and the humanobserver acoustic properties (amplitude frequencypulselength)
Gain Control Receiversof the signal the transmission mode (RDT and scanning sonar) and the propagation mode (surface duct bottom A constant temporal variancr combinedamph a fixed bounce convergence zone) required to meetgt mission thresholdgives a constant falsc alarm probability (CFAP)
314 IEEE TRANSACTIONS ON SONICS AND ULTRASONICS SEPTEMBER 1975
T R A N S M I T T E R E C O V E R YP U L S E W I D T H TIMET V G _I
Fig 18 TVG control waveform
to t8he displa reducing the minimum detectable level For a constant output bardwidth this implies a constant false alarm rate (CI1l) A constant temporal variance requires the hackground to have statistical stationarity Since reverberation isnonstationary CFAP canonlybe achieved by employing a tinle-varying threshold or by transforming the reverberation to a stationary process prior to fixed thresholding At present sonar technology employs gain control rwtwers
The optimization o f receiver design requires a con-sideration of the dependence of reverberation on the transmitted signal the ratc o f change of reverberation amplitude with t h e and thestatisticalnonstationarity of reverheration I n addition optimization is dependent upon the rate of change of reverberation configuration between difftrcnt transmissions or pings
In all cases to he discussed the gain of the receiver varies as a furlction of tirne and thus range after the emission o f thc sonar pulse What distinguishes one re-ceiver from the other isits gain control characteristic and how well it is mat~ched to the highly variable ocean en-vironment
U ) Time-Furzetl (hin
Time-varicd gain (TV() controls the receiver gain so thatitfollow a prescribed variation withtime inde-pendent of the prevailing hackground conditions [go] [Sl] TVG is accomplished hy generating a voltage waveform of a prescribed waveshape and applying it as a bias to a recviver amplifier The question arises as to what is the appropriate-aveshapc that must he generated For the simplification of instruInentation and for ease of adjustment T V ( action is obtained by charging a capaci- tor with a negative voltage during the transmispion cycle and after this cycle discharging the capacitor through a shuntresistorThe overbias voltage then decays ex-ponentially to the r~ormalhias level Thus the amplifier is designed to h~vt a gain i n dB that is approximately linear with the I)iasvoltage
TheTVG waveform is sholvn in Figure 18 It is a function o f tz-o paran~eters iethe voltage t o which the capacitor is charged and the rate of capacitor dis- charge (recover time constant)Initial reverberation returns h a v c t ~ W I I measur(din e x e s of +35 dBIn practice the iriitial reduction in gain is about f40 dB
which usually satisfies most visual and audio require- ments The recovery time should be as rapid as possible and still be consistent with the desired rcduction in re- verberation and to prevent saturation by strong echoes fromnearbytargets The recovery time constant is in general from 05 to 10 second
Adisadvantage of TVG is that the variation of gain with time does not follow any of the basic laws of reverberation theory For long range sonars in deep water the intensity for surface and bottom reverberation varies inversely as the cube of time (range) and for volume reverberation it varies inversely as the squareof time (range)In addition TVG is only sufficient if the reverberation is uniform in azimuthand monotonically decreasing in range Since this is not the case (particularly in shallow watcr) what is desired is a controlled form of TVG coupled amph a preformed beam system for azimuthal normalization each beam having its own gain control receiver Two common methods of supplementing TVG control are AGC and RCG which greatly reduce the necessity for the sonar operator t o makemanual gain adjustrnents during a search phase
b ) Automatic ampin Control
Automatic gain control (AGC) continuously monitors the receiver gain according to the prevailing reverberation [91]-[96] This technique is considerably more compli- catedthan TVG sincereverberation is a function of space time and doppler
An automatic gain control system refers to the closed- loop error-actuated gain control of a linear 11 amplifier where the error signal is proportional to the mean value of the background envelope A typical diagram of an AGC receiver is shown in Figure 19 The forward path contains a variable gain amplifier Tvhich nlay he con-sidered to be comprised of a control stage folloned by a fixed gain amplifier The feedback path contains a de-tector-averager It rectifies and integrates the receiver output and applies Ohe detected envelope t o the control stage varying the forward path gain
An AGC receiver is a type-0 servomechanism This implies that a constant error-actuating signal produces a constantvalue for the controlled variable ie a step input produces a finitesteady-state trackingerror In practice the detected envelope is compared with a fixed
315 WINDERUNDERWATER SOUND
I I FILTER DETECTOR- I h I I BANK AVERAGERlsquoS I
I I lsquo I --c BANDPASS I + 4 FILTER I I TO P P I
+ t I IBEAM - - I DISPLAY INPUT
CONTROL STAGE AMPLIFIERrsquo rsquo b
NOTCH A-D FILTER
I I - DETECTOR-I AVERAGERI I I AGC RECEIVERL _ - - _ _ - - - _ _ _ --J
I I --) CIRCUITRY
I a
I I
I CW DOPPLERNORMALIZATIONI L --------------------I
I TO P P I DETECTOR-I AVERAGER DISPLAY
I I I I I
J
Fig 19 Blockdiagram of typical sonar receiveremployingautomaticgain control CW dopplernormalization and notch filtering
voltage and the difference is used as the error signal This is called ldquodelayedrdquo AGC Its purpose is to keep the varia-tions in the desired signal level below a given value When the detected envelope is equal to or less than the reference voltage the error signal is zero and the receiver behaves like a fixed (maximum) gain amplifier Error signals greater than zero produce an 4GC action which reduces the gain
There are fourfactors which spetify the performance of an AGC receiver 1 ) dynamic range 2) flatness factor 3) linearity and 4) pulselength optimization
Dynamicrangerequirements are determined by the signal variation with range by variation in target strength with aspect and by variability of the medium and target A dynamic range of 70-80 dB is adequate for most sonar applications The problem now is to match this dynamic range to the limited dynamic range of an intensity modu- lated CRT display The displayrsquos dynamic range is usually less than 12 dB in an operational environment
The receiver output fluctuations are inversely propor- tional to the receiver bandwidth-integration trsquoime product andare enhanced by thenonstationarity of the back- ground They are also increased by nonlinearities in the gain control characteristicparticularlynear the ampli- fierrsquoscutoff bias Amplitude fluctuations will give poor contrast on the PPI and generate false alarms
A measure of the degree of fluctuation that is acceptable in the receiver output is the ldquoflatness factorrdquo The flatness factor is the ratio of the required receiver dynamic range (in dB) to the fluctuation (in dB) about the output level If it is desired to maintain an output level of 1 volt =cldB for an input level change of 80 dB then the flatness factor is 40 The selection of a suitable flatness factor is de-pendent on the form of processing that follows the i lGC receiver
Linearity refers to the input echo dynamic range that is supported by the receiver without output distortmion An echo dynamic range of at least + l 5 dB is generally re- quired and is specifiedfor the entire background change in the receiver input An AGC receiver should be provided
with a manual gain control to allow the operator to reduce the receiver gain and prevent strong echoes from saturat- ing the PPI
The basis of present AGC design is that the rate of change of the reverberation amplitude is small compared to thatof the echo The time constant is sufficiently short to permit the control stage to respond to reverberation and long enough so that the loop does not respond to the target echo A short time constant gives a fast receiver recovery time This provides good trsquoracking capability but at the expense of generating false alarms due to short- time power fluctuations As the response to reverberation is increased by shortening the timeconstantthe echo envelope becomes more distorted it will have a greater negative slope or ldquodrooprdquo which reduces the signal power However a long time constant suppresses false alarm generation and reduces echo distortion but it also reduces the receiver tracking capability To decrease the receiver recovery time when a high-level short echo pulse is applied it is necessary to shunt theresistive element of trsquohe integra-tor with a fast discharge diode A rapid discharge circuit preventsinteraction between close but nonoverlapping multitarget echoes and multipaths but it increases false alarms In general the closed loop trsquoime constant is in-versely proportional to the instantaneous output voltage saturation will then result in a long recovery time There- fore it is apparent that the ldquooptimumrdquo time constant isa compromise between several factors suchastracking capability false alarm generation echo distortion and output variance
The integrator time constant should be larger than the pulselength although the ldquooptimumrdquovaluedepends more on the rateof change of the reverberation amplitude and configuration with time It is important to remember that AGC senses the mean of the detected envelope and changes the gain accordingly For shortrsquo pulselengths of less than 15 msecs the reverberation is discrete or impul-sive in time with ldquoholesrdquo in trsquohe waveform The detected envelopeis notrsquo very well defined-itis highly discon- tinuous which tends to increase false alarm generation The
316 IEEE TRANSACTIONS ON SONICS AND ULTRASONICS SEPTEMBER 1975
time constant can he sufficiently increased to prevent this hut it is not desirable for reasons already statamp For long pulselengths of more than 500 msecs the required time constant is slightly greater than the pulselength due in part to thesmoothing effect of the medium The ability of the receiver to discriminate between reverberation and echo is somewhat poor It appearsthat for very short pulselengths thedetected envelope is too sensitive a paranletrsquoer for gain control and for very long pulselengths i t is not sensitive enough Therefore for these two cases parameters other than the detected envelope eg LLholerdquo
Fig 20 Photographs showing effectiveness of AGC operation(RDTmode-pulse length 15 msecs) (a) Preamplifier output vertical scale 02 voltsjdiv horizontal scale 02 secsdiv (b)Preformed-beam output vertical scale 001 voltsdiv horizontal scale 020 secsdiv (c) AGC receiver output vertical scale 05 voltsdivhorizontal scale 05 secsdiv(d) DC controlbiasvertical scale 20 voltsjdiv horizontal scale 10 secsdiv
time or phase should be investigated to control the re- ceiver gain For intermediate values of pulselength the timeconstant is ldquooptimizedrdquo at approximately 3 to 4 times the transmitted pulselength Forimproved per-formance when different pulselengths are transmitted the receiver should have a variable time constant circuitrsquo in the feedback patrsquoh
The effectiveness of 4GC is shown in Figure 20 for an RDT sonar system and a pulselength of 15 msecs Figure (h) depicts the effect of summing the reverberation outputs of several receiving array elements toform a beamThe reverheration attheAGCinput contains a large numher of spikes or ldquoblobsrdquo due to discrete scattering patches each ldquoblobrdquo is approximately the same width as the emitted pulse If examined closely the long pulse shown in Figures 2O(a) (b) preceding the received re-verberation decay is seen to be comprised of the original twelve pings that were transmitted sequentially (RDT mode) The reverberation in the receiver output (Figure 20 (c) ) has hem strongly suppressed but it ampill has a spikey irrftgular character including self-generated false alarms The ACC output may be considered to have a constant mean hut not a constant variance However this is a good approximation to ideal DRCN operation shown in Figure 17 The dc-bias for controlling the receiver gain is shown in Pigure 20(d)
c ) Votrlz FzrsquolteT
To optimize receiver design the background should be ldquoprewhitenedrdquo before processing u-itrsquoh AGC anda matched filter This CUI he considered as a normalization in the frequency domain For a background of reverheration and noiscl vith ponw spcctra R ( f ) and Ar(f) respectively tho tralrsfcr function H ( j ) of t8he prewhitening filter is
Thc power spcctrunl of the received reverberation is essentially the sanle as that for the transmitted signal Its frequency components are incoherent while those for the discrete echo arc cohcrently related
I n practice if the receiver is reverberation-limited the filter charactoristic given above is approximated bp the response o f a high Q resonant circuitThis is generally referred to as a ldquonotch filterrdquo The notch filter may be comhiued with t8he bandpass filter at theinput to the
AGC receiver (refer to Figure 19) to suppress reverbera- trsquoion thus enhancing the detectability of high doppler targets However this is at the expense of rejecting low doppler targets which if imbedded in a noise-limited region (ie a t long ranges) would otherwise have been discernible The notch filter may he switched in or out of the system at the optgtion of the console operator (de- pending upon target and background conditions)
A typical combined frequency response of a reverbera- tion notch filter and bandpass filter is shown in Figure 21
317 WINDERUNDERWATERSOUND
I l
-48 - J -32 -24 -16 -8 o e 16 24 32 40 48
TARGET DOPPLER (KNOTS)
Fig21 Combined response for typical notch filter and bandpassfilter
Fig 22 Effectiveness of notch filtering low dopplerreverberation
The attenuation for a zero doppler target is 40 dB and the -3 dB points are for a target doppler of about =t5 knots The required specification depends upon the charac- teriatics of the transmitted signal the target doppler and and the degree of frequency spreading of the reverberation spectrum which may be attributed to scatterer motion the finite widths of the transmitting and receiving beams and the finite accuracies of the ODN circuitry For these reasons notch filtering is not practical forlong pulse-lengths ( gtZOO msecs) with the corresponding narrow bandwidths It is importantrsquo that the amplitude response
be the same with the notch filter in or out so that hoth high and low doppler targets produce the same brightness (or deflection) on the display
The effectiveness of notch filtering is shown for a pre- formedbeamsystemwithAGC by the photgtographs of the PPI display in Figure 22 (these were taken within a short time of each obher so that water conditions may be assumed relatively constant) Withthebandpass filter only (notch out) the reverberatjon returns preventrsquo the recognition of the targetat a bearing of 280rsquo (refer to Figure 22(a)) The multiple target indication is the range ambiguitydueto a sequentialping within the echo- ranging cycle ie the trsquootal transmission is RDT followed by an OMNI pulse In addition thereis a spoking or ldquobrick silordquo effect due to the finite beam interpolation of the system This causes the reverberatrsquoion to have the same characteristic pattern as the target thus degrading target detectability With the notch filter in the circuit it is seen that the reverberation and ldquobrick silordquo effects are eliminated (refer to Figure 22 (h)) The targetrsquo shown is now a t bearing 225rdquo
For optimumperformance thedepthandbandwidth of the notch filter should be continuously controlled by the prevailing reverberation and noise This is referred to as an adaptivenotch filter Several such filters have been developed and sea tested in the past five years Bow-ever none are operational in current sonar systems Ex-perimentshave shown that anadaptive n o t c h filter in the CW receiver can greatly enhancr the detection o f low doppler targets when reverberation-limited and insure the detectmionof IOW doppler targets --hen noise-limited
d ) Post-Detection A GC An AGC receiver tends to maintain a ronstant power
outputThe AGC output is then processed by a post-detector-averager (with or without predetection filtering see Figure 19) which is matched to the transrtlitted pulse- length for maximum processing gain This permits most of the narrowband reverheration power to pass while greatly limiting the wideband noisepower Therefore during an echo-ranging cycle as the reverhcration rrturns from short and intermediate ranges slowly decay into the ambient noise (corresponding to longer rangrs) a constant power AGC output tendsto produce n timc-varying variance at the output of the detector-averagrr If t8his varianceis not normalized since t h PPI has R lirnitcd dynamic range there can he x loss of rithrr c101erange or long range targets depending on the manual gain control setting of the AGC receiver Normalizing tjhe variance will permit the sonar operator to lower the t8hrcshold and enhance the detection of noise-limitrd targets A constant temporalvarianceinput tothe display is rcquircd and may be obtained by applying the detector-avcrager output to a second AGC receiver This techniqur is callrd post-detection AGC An analysis of it is shown in krsquoigure 23
It is often stated that the reason AGC sonar rcceivcrs sometimes do not perform very well ist)r(aauw of thtt difference in statistics of reverberation and r~oiscThis i s
318 IEEE TRANSACTIONS ON SONICS AND ULTRASONICS SEPTEMBER 1975
( a ) Preformed-beam output t
REVERBERATION
I REGIONREGION
( b ) 1st AGC receiveroutput t
( c ) Post detector-averageroutput
( d l 2nd AGC receiveroutput
l THRESHOLD t =o LEVEL
Fig 23 Illustration of posedetection AGC to provide constant variance
true but the majorreason for the statistics being different appears to be primarily due tothe difference in band-widths
e ) Reverberation Controlled Gain A reverberation controlled gain (RCG) restores the
receiver gain through a capacitor discharge circuit as for TVG but at a rate controlled by the prevailing level of reverberation similar to AGC [91] RCG act8ion within an echo-ranging cycle is irreversible As the reverberation decays a sudden increase in background level will clamp the gain at its existing value When the receiver output finally falls below the previous level or somepredeter-mined threshold the gain will continue to increase accord- ing to the recovery time constant Therefore increases in background level do not reduce the receiver gain as in AGC but only delay further increases in receiver sensi- tivity RCG doesnot distinguish between slow rises in the input level caused by increased reverberation or sudden rises due to echoes An RCG system may be considered as a unidirectional AGC receiver controlling the rate of discharge (or recovery time) of a TVG circuit
RCGandAGCare equally effective in deepwater where the reverberation has a somewhat continuous decay thoughRCGmay bemore desirable since it does not distort the echo envelope Shallow water propagation is characterized by multiple surface and bottom reflections This causes reverberation to increase during reception and have a considerable number of blobs 4GC counter- acts this by increasing the control bias thus reducing the hackground level-while RCGcannotadjust t o an in-creased reverberation level and produces an increase in receiver output Comparative shallowwaterbehavior is shown in Figure 24 for an AGC time constant of about 500 msecs AGC is seen to be superior to RCG in com- pressing reverberation in shallow water
The use of several time constants in an RCG circuit improvessystemperformance For a low reverberation amplitude a short time constant of about 05 seconds is required for fast recovery For a high reverberation ampli-tude a long time constant of several seconds is required For in-betweenreverberation levels the two limiting time constants may be shared proportionatelyalthough an intermediate time constant is preferred Multiple time
- -
WINDER UNDERWATER SOUND 319
Fig 24 Comparison of RCG and AGC action in shallow water (frequency 15 kHz) (a) Receiver uncontrolled (b) RCG (c) Bias acrosscontrolline during (b) (d) AVC diode shunted by 5 meg-ohm (e) Bias acrms control line during (d)
constant RC(- TVG is an interpolative AGC Thresholds for sclectillg the time constants may be established with respect t o tgthe reverberationamplitudeabovea preset level of uniform ambient noise background on the PPI
The design of an ItCG -TVG circuit is similar to AGC It may be conlprised of an attenuator which uses field- effect transistors or diodes as control elements a detector-averager R I I ~t rorr~paratc~r circuitfor selecting the proper timeconstant (when more than one timeconstant is available) Typical values for amplitude and phase simi- larity between channels arc hO5dB andampS0 respectively
f) Logarithmic IleceWer
A technique which under certain conditions results in CEAP operathrt and provides a largedynamic range is a logarithmic receiver A block diagram of the receiver is shown in Figure 25
Tho idealiztrti logarithmic detector is characterized by r97l
y ( t ) = a l n h R ( t ) ab gt 0 (19)
where R ( t ) is the envelope of the receiver input and y(t) is the output of the linear envelope detectorThe con-stants (U) and ( b ) are the slope and gain of the logarithmic cbaracteristic respectively If the envelope is nonstation- ary it is assumed that its probability distribution depends onlyon a single time-varying paaameter m ( t ) For y ( t ) to have a constant variance it is necessary and sufficient that either C981
R-)--R(1)
- a (constant)
or
where the bar Pignifies ensemble avcraging These tests -areindependent of U ( t ) R2(t ) and R(ti are sufficient statistics ie they contain all the information necessary to make a decision The dimension of t8he decision space has thus been reduced to that of the sufficient statistic namelytwo-dimensional If ampher of thesetestsare satisfied then the output of the linear detector contains a constantvarianceand a time-varyingmeanThe time-varyingmeanmustberemovedtoobtain a stationary background A fasttimeconstant (FTlt) differentiator or high pass filter is generally used to subtgtract out the mean Another technique for removing the slowly-varying dc is with a pulselength discriminator C99-J
It was noted in Section F that as the density of the scatterers increases the reverberation tends to approach a nonstationary Gaussian process The envelope R(t ) of the process has a Rayleigh distribution expressed as
Rp(Rt) = -exp [-R22u2(t)] R E [0+m] (22)
Yt)
and satisfies the tests given above For the Rayleigh distribution the variance at t8he ontput of the FTC filter is calculated to be
Note that theoutput variance is independent of ~ ( t ) and depends upon the slope of the logarithmic lalhn- only Thusa fixed output threshold provides CFAP tmothe display
A realizable logarithmic amplifier characteristic is of the form
y ( t ) = a l n [l + b R ( t ) ] (24)
gt
B E W ENVELOPE LOGARITHMIC F TC BAND-PASS CONSTANT-
INPUT FILTER AMPLIFIER DETECTOR FILTER OUTPUT
1 l
Fig 25 Block diagram of logarithmicreceiver
-
320
Performance degradation using this characteristic in lieu of the ideal can be greatlyminimized if bR( t ) gt 1 a large gain ( b ) is desirable Also the amplifier must be logarithmic to -20 dB below the rms noiselevel This lower bound on the logarithmic behavior is quite sufficient since the probability of any fluctuation of aRayleigh distribution reaching a value less than 20 dB below the rms level is only about 1 For aninput background dynamic range of 80 dB the variance of y(t) will change byabout 025 dBTheoutputvariancedepends upon the slope for it to be independent of the input signal the slope tolerance shouldbe ampZO which is compatible with the limited PPI dynamic range
There are several factors which determine the effective- ness of a logarithmic receiver These are1) differentiation 2) probability of detection and3) display signal contrast
The purpose of the differentiator is to remove the time- varyingmean level of the reverberation Asimple RC differentiatingnetwork is generally used where the for- ward time constant (RC) is a compromisebetween the value required to eliminate the varying meanand the value required to pass the echo energy spectra Excellent results have beenobtained when the timeconstant is about 15 times the transmitted pulse length Atime constant of this order gives rise to shadows on the PPI immediately after each echo and provides a poor tracking capability These effects may be eliminated by shunting the resistive element of the differentiator withafast discharge diode to obtain a short backward time constant (about 02 times the pulselength) or fast recovery How- everthere is then areduction in signal-tenoise ratio of at least 3 dB This loss does not occur when the same differentiatingcircuit follows a linear receiver (eg AGC) It may be attributed to the increase in the nega- tive-going noise peaks at theoutput of the logarithmic receiver Therefore the optimum backward time constant is a compromise between several factors such as tracking capability shadows on display and signal-to-noise ratio
The ROC curves for the logarithmic detector (without differentiation)have been computed over the following range of parameters 001 5 P D 5 099 10-l-O 5 PPI5
1 5 n 5 100 where PB is the probability of detec- tion PFa is the probability of false alarm and n is the number of pulses integrated or summed after detection to improve the signal-to-noise ratio [lOO] It is concluded that there is a slight reduction in the probabilityof detec-tion for a fixed probability of false alarm when using a logarithmic detectorThis loss in sensitivitymaybe expressed in terms of the reduction in power of a square-law detector which produces the same loss of sensitivity The loss (in dB) is approximately proportional tothe logarithm of the number of pulses integrated Therefore for one (1) pulse (no integration)there isno loss For ten (10) pulses integrated theloss is about 05 dB while for one hundred (100) pulses integrated the loss is about 1 dB The advantages of a logarithmic detector far out- weigh the loss in sensitivity
Due to logarithmic compression and differentiation there is a lack of signal contrast on a PPI display-al-
XEEE TRANSACITONS ON SONICS AND ULTRASONICS SEPTEMBER 1975
though the background is rather uniform spatially It is especially important tohave sufficient signal contrast when operating in a high reverberant field (with a short range scale) and when there is a crowding of targets on the display (with a long range scale) By applying either base clipping or an antilogarithmic transformation to the receiver output the original signal contrast or signal-to- noise ratio may be restored without a loss in detectability
In practice a preformed beam time-multiplexed sysbem is used in conjunction with a logarithmic receiver This isrequired for background normalization without beam-to- beam unbalance An important consideration is where to perform the ODN correction (refer to end of Section E) Bandpass filtering a waveformtime-multiplexed will produceinterchannel crosstalk Also abandpass filter at theoutput of the logarithmic amplifier degrades the desired CFAP property of the receiver Therefore ODN must be performed prior to multiplexing and logarithmic actionAnotherpractical consideration is that a loga-rithmic law may not suppress high close range reverbera- tionreturns which enter throughthe sidelobes of the receiving beam To minimize these returns TVG must be used prior to the logarithmic receiver
Hard Clipping Hard clippers have three very attractive properties-
they provide 1) a large dynamic range of operation 2) instantaneous amplitude normalization and 3) high compatibility with present digital processing techniques As a result they have found extensive use in sonar system design for detection and tracking purposes as well as in other fields such as satellite communications [loll (in a satelliterepeater a bandpass clipper precedes a TWT amplifier in order to assure maximum RI+power efficiency without saturation) The input to a hard clipper is gen-erally a multiple signal input due to multitargets multi-patharrivalsand background noise Multiple signals may also be attributed to pulse overlap and echo-splitting associated with long pulse transmissions as in high resolu- tion FM sonars Recognizing that ahard clipper is a nonlinear device it is a natural question to ask what is the interaction between signals due to this particular design and how does it affect system performance
The transfer characteristic g ( ) for a hard clipper with input z ( t ) and normalized output y ( t ) is given by
I+l IO Y ( t ) = qCs(t)l= if z ( t ) = 0 ( 2 5 )I-
Thereare several properties that may be predicted for the clipper output due to the odd symmetry of the clip- pers amplitudecharacteristic [102] In general the output of any full-wave (odd) 7th-law device contains only odd harmonics of the input frequencies The hard clipper ( v = 0) output is approximately a rectangular waveformwith the samephase structureastheinput Therefore the total power in the kth-odd harmonic band
321 WINDER UNDERWATER BOUND
is equal to the power of the kth harmonicin a Fourier series expansion of arectangularwaveformThekth-harmonic power is 8 ( ~ k ) ~which is constant regardless of how the power is distributed within the band
If the signal plus noise complex is assumed to have Gaussian statistics the effect of extreme clipping without post-filtering is to transformthe correlation function T ( T ) before clipping to a new correlation function R ( T )
given by C1031
2R(7) = -sin-rsquo r ( 7 ) (26) A
where the correlation functions are normalized ie R ( 0 ) = r ( 0 ) = 1 Expanding the arcsine in a Taylorrsquos series R (7)may be written as
-1 (27)
where O ( T ) representsthe nonlinear effect of clipping Thus as indicated above high input SNRrsquos enhance the nonlinear characteristic of the clipper This produces significant power fluctuations in the output In the case of small input SNRrsquos 0(T ) is negligible and
2 R(T) 2 - r(7) (28)
n-
The reduction in SNR by extreme clipping is 2 ~or - 2 dB For small SNRrsquos a hard clipper behaves linearlywith respect to power This indicates the effectiveness of a clipper together with a power detector to detect a single signal embedded in noise-a change in signal power at the clipper input results in a proportionate change in power at thedetectoroutput Using a zonal (firstharmonic) post-filter results in a gainin the output SNRof 7r28The loss due to clipping after filtering becomes (ZA) X (w2S) or ( ~ 4 ) a loss of about l-dB results are similar for a sinusoid in Gaussian noise [104] C1051 This is true even for an arbitrary non-Gaussian signal if it is sufficiently small relative to noise
Consider aninput comprised of twounmodulated sinusoids andnarrowbandstationary Gaussian noise where the signals have random phase angles statistically independent and uniformly distributed from 0 to 2r The spectrum of the filtered output contains both discrete and continuous components [lOS]
When the noise dominates both signals the SNRrsquos decrease by the factor (aj4) as for the one signal case regardless of relative signal strength An interesting case occurs when the two signals close in frequency are of equal amplitude The ratio of output to input SNR tends to zero for both signals as the input noise decreases The explanation in part is that asthe signals are beating destructively together (the envelope crosses the time axis at the difference frequency) the noise has the opportunity
to ldquoslip throughrdquo the limiter a t each zero crossing There- forehighinputSNRrsquoscan resultrsquo in very low output SNRrsquos for signals of equal strength
When the two signals are embedded in noise where the larger of the input SNRs is -10 dB or less their relative strengths are preserved and there is virtuallyno signal suppression For large input SNRrsquos the maximum degree of suppression of a weak signal by a strong signal is +6 dB ie the weak signal is reduced by a power facbor of 14relative to the larger signal and occurs for large input SNRrsquos This signal suppression is thesameresult one would obtain for clipping a weak sinusoidal signal (or echo) plus strong sinusoidal ldquonoiserdquo (or reverberation) Working backwards (14) (8r2) = 2 r 2 which suggests thatthe relationship between the normalized autocor-relation function at the output of a hard clipper to that at the inputis approximately C107 J
2R(7) = - r ( 7 ) (29)
8 2
for a signal-to-noise ratio much less than unity The loss without post-filtering is 2r2 ( - 7 dB) Comparing the last two equations we see that a sinusoidal noise input is about 5 d B poorer than Gaussian noise
It is seen that the effect of raw data clipping on target detectability will depend not only on the input signal-to- noise ratio and noise statistics but also upon the signal phase structure which characterizes the crossproducts and associated distortionRecentexperimentshaveshown that for small signal-to-noise ratios the loss due to clip- pinglinear FM pulses is less than that for a Gaussian signal approximately l-dB If the signal plus noise com-plex is non-Gaussian as for strong impulsive type noise the loss will generally be greater than 2-dB
A consequence of signal suppression in an operational sonar is reflected in the ability of strong signals or rever-berations off the maximum response axis (MRA) to mask weak signals on the MRA Ina clipped active sonar that is reverberation-limited the effect of intermodulation betweenecho andreverberation is that as the level of one decreases the spectrum level of the other will increase If the reverberation is dominant as is usually the case this results in an increased loss of detectability If there is just signal and background noise and the signal level is nearly constant then in a clipped sonar as the noise increases the displayed signal level (ie on a A-scan) will decrease This can seriously affect the problem of classification where absolute echo levels are often required (eg to determine target strength)
J SIGNALPROCESSING
Signal processing refers to the operations performed in the time-frequency domain for detecting or extracting a desired signal from some maskingbackground The problem of greatest consideration is that of separating a given signal from random noise whose spectrum overlaps that of the signal In this case the statistics of the signals play an important role in the determination of the pro-
322 IEEE TRANSACTIONS ON SONIC~AND ULTRASONICS SEPTEMBER 1975
awREwt W ALL ASPECTS LFY AM M P a 7
ONLY
Imx)mRE)(TW L N liLL ASPECTS co(EREwI LFY 101
ONLY
20 40 I 2 4 6 8 I O 6 0 0 0 ~ ~ )zoo MLWDII)T)I-TIYPROOW1
Fig 26 Comparison of incoherent and coherent processing of pulse CW and linear FM
cessor It is necessary to select a suitable criterion and to determine how much noise may be accepted andhow much signal energy may be rejected to achieve the desired result
Basic detection theory states that a sufficient statistic for detection is the likelihood ratio [lOS] [l09] defined as the ratio of the conditional probability density of the received data vector when the signal is present to that when the signal is absent The optimum processor struc- ture is onewhich maximizes the likelihood ratio for Gaussian statistics the optimum processor is well defined
In active sonar the signal processors are broadly classi- fied as eitherincoherent or coherent An incoherent processor is one which is sensitive only to the amplitude modulation of the received waveform regardless of the doppler band signal coherence is not utilized For a given timeband- widthproductthe processing gain of an incoherent processor is generally inferior to that obtainedwith a coherent processor ie one which utilizes both the ampli- tudeand phasemodulation of the signal To maximize the detection and classification capability of a receiver it is required to process coherently For a stationary white Gaussian noise background the processor which maxi- mizes the output signal-to-noise ratio is the matched jiZter [110]-[112]whose transferfunction is the complex conjugate of the Fourier spectrum of the input signal to be detected The matched filter criterion is equivalent to the impulse response being the time reverse of the signal Since the output of the matched filter is the crosscorrela- tion function of the transmitted signal and the received signal plus noise complex the optimum processor is equivalent to a crosscorrelator
In passive sonar the problem is one of detecting a noise-like signal in a noise masking background The signal contains both coherent and incoherent components If the signal and noise are Gaussian random processes with known spectra the signal is completely characterized by its second moment so that the optimum (incoherent) processor is some form of energy detector
Active Sonar Detection The signal processing techniques employedin active
sonar receivers must be matched to the signal class and targetdynamics [113]C114-J Acomparison of signal
processing gain for incoherent and coherent processing of pulse CW and linear FM isshown in Figure 26 as a function of the bandwidth-time product and the depend- ence on target aspect It assumes Gaussian noise masking and completely incoherent scattering with the scattered energy conserved From an initialdetectionpoint of view there is often little to be gained in processing co- herently when the bandwidth-time product is less than 100 This is supportedby the fact that in practicea coherent processor has greater hardware complexity and morenormalizationproblems which produce losses in processing gain for a multichannel (gt10 channels) system it can be as much as 4-10 dB Incoherent process- inghas the desirable feature that it is independent of target aspect thereby providing reliable processing gain undermostoperational conditions However it is not doppler sensitive and thus does not provide information on target range-rate The efficiency of coherent processing with respect to target aspect depends upon the type of signal transmitted the latter also determines the range and doppler resolution ambiguities of the system
Since the signals most successfully utilized in an opera- tionalenvironmentare pulse CW and linear FM only their processors will be discussed here The CW processors are shown in Figure 19 designated post detector-averager and CW doppler normalization both preceded by a notch filter and AGC receiver The linear FM processors con- sidered are the post detector-averager clipped and linear DELTICcorrelatorsandpostdetection pulse com-pression
a ) CW Processors The post detector-averager is anincoherent processor
comprised of an envelope detector followed by an integra- tor or low-pass filter matched to the pulselength of the transmitted signal The detector is a nonlinear device which has a square-lawbehavior for weak input signal levels and is realized with a full-wave or half-wave recti- fier For a receiver bandwidth ( W ) and signal pulse- length (T)the processing gain against noise is approxi-mately 5 log WT CW envelope detection will not provide any processing gain against reverberation since the signal and reverberation bandwidths are almost equal
323 WINDER BOUND UNDERWATER
cw LINEAR FM - ~
Fig 27 Effectiveness of incoherentprocessing of ~
linear FM
Coherent processing is achieved by predetection or doppler Jiltering prior to envelopedetectionDoppler filtering is obtained with a bankof contiguous narrowband (comb) filters in cascade with the output of the beam- former (plus ODN and AGC) The filter bank subdivides thetotal received bandwidth rsquo into small bandwidths inversely proportional tothe pulselength The received signal will pass through one or a t most two of the in- dividual filters depending upon thetarget doppler and the degree of time and frequency spreading due to target structureand motion The signal-to-noise ratio is im- proved by an amount proportional to the ratio of receiver inputbandwidth ( W ) to filter bandwidth ( B ) If the postintegrationbandwidth is ( l T ) thenthetotal processing gain against noise is approximately equal to 10 log W T - -5 log BT The second term is the effect of a mismatched input filter maximum gain is obtained when the comb filter is matched to the signal spectrum There is no improvement in performance when the system is reverberation-limited since the power spectrum of the received reverberation is essentially the same as that for thc trsquoransmitted signal
Doppler filtering applies the information contained in one acoustic beam to many channels thereby increasing thedatarate of the receiver If all of the information channels are displayed simultaneously on a CRTand examinedbya single sonar operatorexperimentshave shown there can be a considerable reduction in processing gain (for small signal-to-noise ratios visual scanning can reduce the processing gain in dB by about3 of that which can beobtained using matched filtering)This loss is attributed to the limited data-handling capacity of the operatorandtothe increase in the number of ldquofalse targetsrdquoThedataratecan bereduced to that of one channel by employing ldquoORrdquo-circuitry at the outputs of the filter bank
By ORrsquoing the envelope detected outputs of a bank of doppler filters the data rate of the system is the same as if the channels were monitored individually the size of the display canthenbegreatly reduced However combining the channels bymaxima (an OR-circuit re-spondsinstantaneouslytothemaximumamplitude) produces a loss in signal-to-noise ratio which is a function of 1) the signal-to-noise ratio 2) the probability of false alarmineach channel 3) the number of channelsand 4) the channel-to-channel output balance Channel un-balance is further pronounced by reverberation returns which candominatetheoutputs of several of the low doppler filters (althoughthe sidelobe structure of the product of certain transmitter-receiver beam patterns and ship speed can produce reverberation in intermediate doppler filters as well) These outputs can subsequently capturethe OR-circuit and tthus suppress high doppler signals in other channels
The OR-circuit loss is primarily due to the increase in the probability of false alarm by a factor nearly equal tothe number of data channels (assumingthesame probability of false alarm in each) In order to maintain thesame false alarm rateas for a single channel only higher amplitude signals which can exceed the threshold will be detected Inpracticetherearetimes when the CW signal is captured entirelyby the noise indicating an infinite loss in signal-to-noise ratio To reduce the OR-circuit loss it is required that the peak-to-mean ratio at theoutput of eachenvelopedetectorbe constant prior to ORrsquoing One approach for accomplishing this is to incorporateanAGC amplifier after each envelope detector ie post-detection AGC (refer to Section I) In addition a not8ch filter can be employed before t8he filter bank to notch out thelow doppler reverberation spectrum and enhance the detection of highdoppler targetsas shown inFigure 2 2 Utilizing current normalization
324
technology at-sea measurements indicatethat multi-channel input OR-circuit losses average 2 4 dB
h ) Linear F M Processors Although an incoherent processor operates on the ampli-
tude modulation only of the received signal it does provide processing gain against reverberation for a linear F M pulse This is to fact that theattributed the reverbera-tion spectrum is spread over the modulation bandwidth ( F ) andthen bandlimited by thepostdetection filter to the bandwidth of the pulse envelope (1T) the process- ing gain is 5 log FTWhen noise-limited the processing gain will he the same as for a CW input for the same pulselength-receiver bandwidthproduct Therefore in-coherent processing of a linear F M pulse provides process- inggainagainst both noise and reverberation masking backgrounds
A comparison of incoherent reverberation processing of CW and linear FRI is shown in the PPI photographs in Figure 27 The improvement) in target recognition seen with linear FM is attrihuted primarily to reverberation spectrum spreading The incidence of an LFM sweep on a scatterer structure generates a series of discrete reverbera- tion echoes each with a different frequency producing an interference pattern which significantly reduces the standard deviation of the background fluctuations
A crosscorrelator is the optimum signal processor in white Gaussian noise Processing gain is obtained against reverberation by enhancing the range resolution of the system To process the outputs of many receiving beams with high range resolution could result in considerable electronic cbircuitry for conventional real-time correlation utilizing a single replica If more than one reference is required to compensate for spectrum compression or expansion due to target doppler then the hardware com- plexity is further increased A technique which greatly reduces correlator requirements while providing high range resolution in real-time is the DELTIC Correlator C11i)-[117]
TheIIElay Line TIme Compressor (DELTIC) is a time-compression system for clipped and sampled signals employing a closed-loop digitsal delay line with input and recirculation logic to control the flow of stored samples The sequence of instantaneous samples are squeezed together to form a high-speed replica of the incoming signal having a total duration equal to the interval between samples The ratio of the transmitted pulselength to the sampling pcriod is the time-compression factor which is the number of correlations that may be carried out within the d~rat~ionof the original signal The major lobe width of the correlation function is the effective pulselength or range resolution of the system The time-compressed signal is stored in a high-speed recirculationstorage channel In practice a high-speed replica of the trans- mitted signal and the received signal are stored in two such DELTICS a reference DELTIC anda received DELTIC The outputs of these DELTICS are thencrosscorrelated---
IEEE T R A N S A ~ I O N SON SONICS AND IJLTRASONICS SEPTEMBER 1975
LFM REFERENCE
PREFORMED
CORRELATOR
SNR-ODE SNR - +l0DE
Fig 28 Effectivenessof coherentprocessing of linear FM
a binary multiplier for multiplication followed by comb filtering for time averaging (only a single recirculation of the DELTIC) This is called an AC-correlator since integration is accomplished with a bandpass filter instead of a lowpass filter (DC--correla tor)
The effectiveness of coherent processing of linear FM utilizing a clipped DELTIC correlator is shown in Figure 28 The time-bandwidth product of the signal is 65 rcsult-ing in a theoretical processing gain of about 182 dB However the processing gain measured was 16 dB the difference is attributed to losses in clipping and sampling
For a narrowband linear F31 signal [118]-[120] where the modulation bandwidth is much smaller than the carrier frequency and a targct with constant range-rate the frequency-time slopes of tjhe received and reference signalswill be parallel The doppler frequency shift will he equivalent to a time shift of the FRT slide plus a phase shift so thatthe correlator output will he doppler-in- variant involving only a translation in time This implies that a single (zero) rloppler reference DELTIC correlator may be employed to give almost optimum results There is no absolute range error or loss in correlationgain
For a widehand linear F M signal [11S]-[120] the effect of a moving target (constant range-ratgte) will producetranslational doppler and a changein the slope of the F31 signal The frequency-time slopes will be linear but not parallel Target acceleration [121]C1221 would introduce waveform curvature with additional echo dispersion from target rotation This will result in both an absolute range error and a loss in correlation When the doppler shift-pulselength (dispersion)product exceeds unity the peak signal amplitude at the correlator will be significantly reduced and the compressedpulse widened
The effect o f clipping reverheration is rather com-plicated If a linear FYI pulse is transmitted clipping the echo return will produce artificial LFRI sweeps which will generate falsc reverheration peaks as a function of time (range) in the correlator output tgthereby increasing the false alarm rate [117] This will degrade target track-ing and classifiration
A liueur or multileoel DE7TTIC correlutor is superior t o the clipped DELTIC for detecting multitargets particu-larly in an environmentcharacterized by multipaths andor high signal-to-noise ratios For a linear FM pulse a linear system will not suffer the incrcase in false alarm rate as occurs i n (slipped system However a multilevel
WINDER UNDERWATER SOUND 325
Fig 29 Bearing versus time recording of clipper correlator output
correlator requires a greater data handling capacity and more DELTICS than the clipped correlator
A linear DELTIC correlator is obtained by employing an AD converter after the receiver beamforming opera- tion and prior to t$ime-cornpression This quantization may also be applied to the reference signal although polarity information only ie a clipped DELTIC would suffice RIeasurements indicate that a amphit AD mnverter would be sufficient for quantizing trsquohe received echoes and masking hackgroundsunder most operatingconditions
An effective processing technique of linear FRI signals is post detection pulse compression (PDPC) Similar to theDELTIC correlator it compresses a received echo pulse to obtain the resolution of a short pulse without the necessity of transmitting a high peak power pulse Where it differs is that it operates in the frequencydomain through a combination of both coherent and incoherent processing
Thetransmitted signal is a stepped frequency pulse which approximates a linear F111 slide Aftrsquoer heamforming the received echo is sent to a comb filter hank Each filter passes the appropriate step frequency to which it is matched Each comb filter output is delayed by an amount
equal to its position in the sweep such that all outputs arein ldquophaserdquowitheach otherThe filtered-delayed frequency step is then incoherently detected or coherently detected by correlation and all outputs summed and sent to the display For small signal-to-noise ratios the processing gain of the system is approximately 8 log W T ThePDPC processoris suboptimum with respect to a linear crosscorrelator and has a poorer resolution capability for the same IYT-product however it is superior to an envelope detector-averager for the same total pulselength For the PDPC processor to operate properly the outputs of the comb filter bank must be normalized with respect to a fixed threshold
Passive Sonar Detection and Bearirlg Estimution The signal processing techniques generally employed
in passive sonar for broadbanddetectionarethe split-beam clipper correlator and the DIMTIS receiver The clipper correlator is also the basis of a split-beam tgtracker or bearingdeviationindicator (BDI) whose dc output can be used as an error signal to drive an automatic target follower (ATF) servo or as an input tjoa right-left indica- tor (RIA) meter to indicate bearing deviatrsquoion
326 IEEE TRANSACTIONS ON SONICS AND ULTRASONICS SEPTEMBER 1975
In a split-beamclipper correlator theoutputs corre-sponding to the two halves of the array are clipped cor- related and displayed on a bearing-time recorder which provides tracking information in addition to detection There is approximately a 3-dB loss due to beam splitting in general detection performance is slightly inferior to fullbeamenergydetectionPerformance is degraded if there is appreciable noise correlation between the two split beams Full spatial coverage is obtained by scanning the two half-beams through 360 -4scanning beam does not suffer from beam-to-beamunbalance and provides infinite bearing interpolation
The effect of clipping on arraydirectivitymay be significant and must be taken into account to effectively evaluate system performance [123] A clipper correlator is a function of the correlation coefficient between input signals The signals in turnandthusthecorrelation coefficient are functions of the arrays beam pattern For an input SNR ltlt 1 the structure and spatial properties of the beam pattern are preserved Houever for an input SNR gtgt 1 there is a distinct change in directivity due to clipping The output of a clipper correlator varies between +l and -1 independent of the amplitude sidelobe structure of the pattern This spatial normalization effect is enhanced for wideband inputs
A significant advantage of hard clipping in operational sonar is that ittendstoimprovesystem performance when there are large variations in noise power from hydro-phone-to-hydrophone resulting from the directionality andnonstationarity of background noise [124][125] This situation enhanced by machinery and flow noise is quite realistic An example of the normalization property of hard clipping is shown on the bearing-time recording in Figure 29 Approximately six targets areindicated whose SNR at the output of the beamformer range from about -4 to -13 dB The ambient noise background is seen to mark uniformly at all bearings which is necessary for maximum targetdetectionsensitivity The uniform correlated patterns in the lower and upper right of the recording are attributed to the arrays backlobe response to the strong targets indicated on the left Similar pat- terns are obtainedfor sinusoidal sources such as machinery and power line components
A DIMUS receiver is a one-bit digitalbeamformer whose multibeam outputsare energydetectedand dis-played on a bearing-time recorder The theoretical im-provement in the spatial average of the display with respect to a split-beam correlator is about 5 log (number of preformed beams) However at-sea results indicate that the operational threshold for a DIMUS receiver or a split-beam correlator is about the same with the DIMUS receiver having amuchpoorerbearingaccuracyAddi-tionalinformation on DIMUS can be found in Section G in the discussion on digital beamforming
For a Gaussian noise background the optimum likeli- hood-ratio processor for detection is a square-law (energy) detector followed by an integrator(smoothing j l t e r ) A
full-wave or half-wave linear rectifier can be used but its detectionperformance is somewhat poorer than that of the square-law detectorThe energydetector is incor- porated in both the split-beam correlator and the DIMUS receiver Inthe split-beam correlator the integration time is determined by the 3 d B beamwidth andscan speed In theDIMUS receiver the integrationtime is about 1-3 seconds to remove short-term noise fluctuations If the number of scansintegrated incoherently on the bearing-time recorder is ( n ) then the detection threshold (in dB) will be reduced by 5 log n In practice a t least a 14inch of line-to-line correlation or track history on the display is required before the operator can just discern the target (minimum detectable level)
If the split-beam outputs arephaseshifted 90 with respect to each other the system is referred to as a split-beamtracker or BDI The polarity and amplitude of the output correlation represents the direction and magnitude respectively of the error angle between the target bearing and the MRA of the array The split-beam tracker is very nearly optimal (in a maximum likelihood sense) for target bearingestimation when operating in aspatially inco-herent noise field [l26] If the noise field contains a strong plane-wave interference there will be an increase in fluctuation error and a bias introduced into the estimate This will seriously degrade performance If the inter- ference is spatially separated from the target by at least one-beamwidth then the interference can be removed by applying any oneof the appropriate adaptivebeamforming (ABF) techniques discussed in Section H If ABF is not effective then the bias will be amajorconstraint on performanceNearoptimal estimation can be obtained with a simple split-beam tracker with bias compensation [127]
Audio Receiver
The audio receiver is used for listening to target echoes and signatures and for receiving sonar telegraphy signals The operational function of audio in active sonar is ex- tremely desirable Sonar operators are often reluctant to identifyobvioustargets on thevideo display without audio confirmation the operators have an understandable desire to want to hear the echo thereby increasing their confidence level Operational results indicate that simul- taneous utilization of both the audio and video modes assumingeachhascomparable recognition differential can increase the effective system recognition differential by as much as 6 dB
The functional system diagram of a conventional audio receiver is shown in Figure 30 For apreformedbeam system the scan switch is replaced by a selector switch withallother operations remaining tmhesame The pre- amplifier-bandpass filtered outputs are fed to the stators of the audio scanswitch A delayline is mounted in- ternally on the rotors of the switch and the rotor signals are then properly shaded delayed and summedto provide a single beam output The position of the audio beam
327 WINDERUNDERWATER M U N D
RECEIVE OWN TARGET snw BEARING HEADSET
A
LOUD WEAKER
WITCH
Fig 30 Block diagram of conventional sonar audioreceiver
2P k 2 U 0S a
10 loo 1 m
ECHO LENGTH (mil l imnd1 FREQUENCY DIFFERENCE BETWEEN ECHO amp REVERBERATION (Hz1
echo midpoint 10amp 70 m - Britishdata 0 800 Hz pinpl nvrbaltion level m Cho loo0 Hzlisteningvel 80 db
mid-point 0 l M I O - H z p i n p m ~ M t h a t o f 3 6 amp 1 1 4 m - U C D W R 6 t a
PJrr in nbohmd of signal 800 Hz l i n i n g IndW db
PRESENT NO WPPLERDOPPLER
Fig 31 Aural recognition differential of echoes in reverberation
can be smoothly trained to any bearing by the respective position of the console target cursor Theaudiobeam is then corrected for own ship doppler as a function of relative target bearing and own ship speed on reception The bandpass filtered own doppler nullifier (ODN) output isfed to an autornatic gain control (AGC) receiver for signal processing and acoustic normalization Provision is usually made to disable the AGC and provide manual gain control for the audio receiver when the system is in the passive listen mode of operation A mixer translates the center frequency of the 4GC output to 800 Hz The audio amplifier provides the power capability for driving a loudspeaker and headset the amplifier is muted during transmission
The measured recognition differential is in approximate agreementwith that predicted according to theaural critical band model of the ear The critical band concept states that the masking behavior of the ear can be simu-lated by a predetection filter of bandwidth equal to that of the ldquocriticalbandrdquo at the frequency of the tone an energy detector of some sort and a low pass smoothing filter with a certain integration time At a frequency of 800 Hz studies of noise masking indicate that the critical
bandwidth of the ear is about 50 Hz and the integration time is of the order of one ( 1 ) second
For the case of zero target doppler trhe data in Figure31 shows that when ideal pulses or recorded beam echoes are injected in recordedreverberationbackgrounds the recognition differential improveswith increasing echo length The measured recognition differential of pings in reverberation backgrounds is also presented for different pinglengths and doppler shifts It is seen that when the sonar is reverberation-limited theaural recognition dif- ferential is a sensitive function of the frequency difference between echo and reverberation especially when trsquohey lie in different critical bands of the ear It is important to recognize that the plot is asymmetric with respect to opening and closing doppler targets and that the point of inflection occurs a t a frequency difference of about 50 Hz The corresponding value of targetrange-rate will dependupon thetransmitting frequency andtarget aspect
The simple audio receiver can thus provide on a single beam basis a recognition differential comparable to a relatively complex and expensive videosearch receiver for the initial detection of moving targets The advantage
328
of auraldetectionwith respect to conventional visual presentation is that thelatter provides no frequency discrimination against the backgroundfor initial detection (except possibly through color)Thecriticalbands of the ear correspond to a weighted spectrum analysis of the signal and background spectra This is particularly impor-tant when reverberation-limited since there is a very large improvement in recognition differential for a slight frequency difference between echo and reverberation The primary advantage of video search receivers is that they are multidimensional processors which includes multi- parameter estimation and target classification and inter-face with computer controlsystems Clearly the combined use of both video and audio would significantly enhance the initial detection capability of the sonar system over the entire range of target doppler
Systemperformancecanbe further improved by in-creasing the rate of change of aural recognition differential with frequency difference between echo and reverberation This may be accomplished by normalizing the reverbera- tion mean and variance in the critical band
K SYSTEMPERFORMANCEEVALUATION In echo-ranging applications performance is predicted
by computing the average echo excess for a specific prob-abi1ity of detection usually 50 percent The echo excess is defined as the sum of the figure-of-merit and target strength minus the two-way propagation loss and repre- sents the excess of echo over that required for detection The figure-of-merit is the source level of the sonar minus the minimum detectable signal level the latter depending upon the noise level prevalent at the array-water inter-face the directivity index of the receiving array and the detection threshold for the signal processor and display The echo excess formulation should include the effects of dome loss and system directivity the latteris expressed in terms of transmitting and receiving deviation losses
Unfortunatelythe sonar range equations presently used for system analysis areinadequate for predicting performance in an operational environment Some of the major inadequacies are the following
1) Thecomputed echo excess is merely an average value over large numbers of pings of sonar equipments of the particular type under consideration of sonar opera- tors and of targets There is thus a short-term and long-term variability associated with echo excess
2) Thetargetstrength is usually characterized by a single value independent of the sonaroperating mode andthe effects of target induced time and frequency spreading(commonly referred to as energy splitting)
3) Thedirectivity index is also usually characterized
XEEE TRANSACTIONS ON SONICS AND ULTRASONICS SEPTEMBER 1975
considerably for a moving platform as well as the sound velocity profile (requiring different time delays for beam-forming)
4) There is no provision for representing the effective- ness of gain control receivers and normalization circuitry
5) The effects of medium-target-sonarvariability on echo excess is not related to the performance of the search- track modas and corresponding displays
The above considerations are also appropriate in the evaluation of passive sonars if target strength variability is replaced with radiated signature variability Thepassive sonar equation(s) have been reformulated to include the beam-to-beam standard deviation of sidelobe levels and they relate the resulting bias effects to spoking on the bearing-time display
To summarize thesonarequations used to evaluate system performance should reflect the dynamics of sonar operation This requires that dynamical system measures be incorporated in the equations which include the con- cepts of echo formation array gain data normalization space-timevariabilityandprobability of detection contours
Echo formation is a function of the fine structural detail of the target the extended length of the target the target aspect the vertical incidence angle the pulselength the acoustic frequency andthesystem resolution These interrelationships have been investigated to some degree [l281 but have never been unified into a general target strength model This is required since the target strength is generally different when the sonar is operating in the detection track or classification mode
The significance of array gain and the importance of obtaining DRCK havebeen extensively discussed Both concepts are intimatelyrelated to at-sea measurements and hardware design
The space-time variability in system performance may be attributed to thefluctuations in the figure-of-merit the target strength and propagation loss The figure-of-merit variability is caused by differences in system equipments and sonar operators and by fluctuationswithin the detec- tion process attributed to factorssuchasthe direction of the cursor with respect to the direction of the echo and the (closing or opening)speed of the target The target strengthvariability is causedby differences in target structure highlights and aspect angles The propagation loss variability is caused by ping-to-ping fluctuations and the imperfect formulation relating propagation loss to the actualenvironmentThecumulative effect is often re-ferred to as the long-term variability in echo excess In the case of sequential pings the target sonar system and operatorremainunchanged so thatthe only source of
by a single value depending only upon the array geometryvariability is the fluctuation in propagation loss This is and dimensionality acoustic wavelength and a particular sound velocity assumed for determining the time-delays inbeamformingHowever in practice the spatial dis-criminating properties of the sonar are influenced by the character of the signal and noise fields which can change
referred to as the short-term variability anddepends upon the character of the masking background
All of the above parameters must be evaluated in order to obtain areasonable accuracy in predicting performance The target strength array gain and DRCK factor deter-
329 WINDERUNDERWATERSOUND
mine the instantaneous echo excess This together with the error distribution of echo excess due to variability define the probability of detection contoursThese con-toursexistinrangeazimuth and doppler and maybe related to corresponding displays inthesystemThey will establish in a dynamical sense the relative effective- ness of the sonars search and track modes This may be illustrated by the following scenario of on-board operation
The target is initially detected on the search display eithera PPI or B-scan The operatorputs the display cursor on the target which will bring the acoustic field about the cursor to the track displays on the next ping The objective is to obtain accurate target azimuth and doppler information for mission-control However on the next ping the target is lost on either the doppler display andor the azimuth display (sector scan indicator) The fact that a target may be easily detectable on one display and not on another may be demonstrated by the prob- ability of detection contours a target may be on the peak of one contour while being in the null or valley of another
The probability of detectioncontoursrepresenta significantimprovement in computing and measuring system operational performance Although the probability ofdetectionversusrangecontourhasbeenutilized in systemanalyseswith some degree of success extending this concept to otherinformationalvariablesnamely azimuth and doppler will complete the picture for open+ tional assessment Optimum system design would then be concerned with finding the global maxima on the multi- dimensional surface defined by the contours
L CONCLUDINGREMARKS In this review we have describedvariousfunctional
operations employed in sonarsystems andhavealso indicated some areas for further investmigation The most significantdevelopmentssince 1960 havebeenin the area of spatial processing In particular space and signal diversitydigitaltechnologyadaptivecontroland non-linear acoustics have been applied successfully to beam- formingThis work is continuing and it includes the utilization of logical switching algorithms andthe en-hancement of fine detail information via maximum entropy criteria
In recent years considerable attention has focussed on multichannelsignal processors utilizinghigherorder statistics for signal detection parameter estimation and waveform estimation It should be noted that very often the most excitingaspects of temporal signal processing is the theory and what one designs for rather than whatis achieved in the field The problem is usually not in the theory but in the integration of system disciplineswith the constraints of the physical medium In practice most losses occur at interfaces characterized bya change in the form of energy namely at the array-water processor- display and display-operator interfaces
A recurring theme of this paper has been the require-ment for and the operational design of dynamicrange
compression and normalization in sonar receivers These techniquesshouldbeextended to include higherorder gaincontrolcharacteristics andadaptive doppler nor-malization in both the video and audio mode
One important trend in sonar design is the requirement forgreaterreliabilityandmaintainabilitytherebyin-creasing system availability Thisis defined quantitatively by the mean-time-between-failures and the mean-time-to- repair A related area is the availability of the sonar plat-form itself which specifies the need for anautomated system for performancemonitoringdirectcontrol and maintainance planning of the marine power plant Simi- larlyampIitude and phase tolerances of the electronic components and array elementsestablish the feasibility in approachingtheoreticalacousticperformance The primarylimitations on achieving the designed accuracy in range bearing and range rate are the errors introduced by the propagating medium and sonar operator
The growing interplay between manandcomputer points to the development of a computer-aided display A software controlled display system would facilitate signal detectionmultitargettrackingmonitoring processed video data and control of data formats and would also beamenable tofuture systemgrowthThis is the first step in realizing receiver-transmitterfeedback an in-formation link from the receiver to the transmitter which would automatically control subsequent signal parameters and transmission and propagation modes Another obvious direction is the utilization of the fast Fourier transform (FFT) for beamforming in the frequency domain and for narrowband processing of acousticradiatedsignatures
It is hoped that this review will facilitate understanding of the significance and limitations of the present state of the art in sonar technology and provide a basis for which further progress might take place The references given were not intended to be conclusive but to recognize out- standing contributions and unique approaches The treat-ment of the acoustic channel was highly influenced by the work of Marsh The discussions on conventional beam- forming and d-ynamic range compression and normalization were summarized from C1291 and [130] respectively
ABBREVIATIONS ABF Adaptive beamforming A D Analog to digital AGC Automatic gain control ATF Automatic target follower BD1 Bearing deviation indicator CFAP Constant false alarm probability CFAR Constant false alarm rate CRT Cathode ray tube CTFM Continuoustransmissionfrequency modu-
lation cw Continuous wave (pulsed) DELTIC Delay line time compressor DF Directivity factor D1 Directivity index
330
DICANNE Digital interference cancelling adaptive null network
DIMUS Digital multibeam steering DRCN Dynamicrange compression and normali-
zation DSL Deep scattering layer FTC Fast time constant differentiator LFM Linear frequency modulation LR IJikelihood ratio MD1 Maximum directivity index MRA Maximum response axis ODN Own doppler nullifying PDPC Post detection pulse compression PFB Preformed beam PPI Plan position indicator PRN Pseudorandom noise RAP Reliable acoustic patjh RCG Reverheration controlled gain RDI Rotational directional transmission RL1 Right-left indicator RSR Refracted surface reflected SLE Sidelobe elimination SNR Signal to noise ratio SOFAR Sound fixing and ranging(deepsound
channel) SRE Shift-register encoder STN Spatial threshold normalization TVG Tinle-varied gain VC0 Voltage-controlled oscillator WT Bandwidth-time product
REFERENCES [l] American Standard Acoustical Terminology Sl1-1960 New
York American Standards Association May 25 1960 121 J Klauder A Price S Darlingtonand W Albersheim
ldquoThe Theory and Design of Chirp Radarsrdquo BSTJ Vol 39745-808 July 1960
[3] J L Stewart W H Allen R M Zarnowitz and M K Brandon ldquoPseudorandom Signal-Correlation Methods of Underwater Acoustic Research I Principlesrdquo JASA Vol 37 1079-1090 June 1965
141 RH Cole ldquoUnderwater Explosionsrdquo Princeton UniversityPress 1948
[51 C Polk ldquoTransient Behavior of Aperture Antennasrdquo IRE P T O C Vol 48 1281-1288 July 1960
[6] J PachnerldquoInstantaneousDirectivityPatternsrdquo JASAVol 28 1956
[7] M C Junger ldquoEnergy Exchange Between Incompressible Nearand Acoustic Far-Fieldrdquo JASA Vol 40 10251030 1966
[8] R Hickling ldquoAnalysis of Echoes froma Hollow Metallic S here in Waterrdquo JASA Vol 36 1124-1137 June 1964
[9] 8 B Officer ldquoIntroduction to theTheory of SoundTrans-mission with Application to the Oceanrdquo McGraw-Hill New York 1958
[l01 I M -
I3rekhovskikh ldquoWaves inLayered Mediarsquorsquo Academic Press Inc New York 1960
1111 R J Urick ldquoPrinciples of Underwater Sound for EngineersrdquoMcGraw-Hill New York 1967 Chauters 5 and 6
[l21 B F Cole ldquoMari)re Sediment AttenGation and Ocean-Bottom- Reflected Sound Proc 68th Meeting of the Acoustical So-ciety of AmyiFa October 1964
(131 F E Hale Long-Range Sound Propagation in the Deep Oceanrdquo JASA Vol 33 456464 1961
(141 R J Tirick rdquoCaustics and Convergence Zones in Deepwater Sound Transmissionrdquo JASA Vol 38 348-358 1965
[l51 MEwingand J L Worzel ldquoLong-range Sound Transmis-sionrdquo in ldquoPropagation of Sound in the Oceanrdquo Geological Society of America Mem 27 1948
IEEE TRANSACTIONS ON SONICS AND TTLTHASONICS S E P T E M B E R 1975
[l61 P Hirsch and A H CarterldquoMathematical Models for the Prediction of SOFAR Propagation effect^ JASA Vol 3790-941965
[l71 D A MurphyldquoStudy of Arrival Angles for ldquoRSR-typerdquoEnergy Received on a Model Sloping Ocean Bottomrsquorsquo JASAVol 35 1879 1963
[l81 J W Horton ldquoFundamentals of Sonarrdquo 1J S Naval Insti-tute Annapolis 1957 Chapter 3
[l91 N L Liebermann ldquoThe Origin of Sound Absorption in Water and in Sea Waterrdquo JASA Vol 20 868 -873 1948
1201 M Schulkin and- H W Marsh ldquoSound Absorption in Sea Waterrdquo JASA Vol 34 864-865 1962
[21] R J Urick ldquoLow Frequency Sound Attenuation in the DeepOceanrsquorsquo JASA Vol 351413--14221963
[22] W H ThorpldquoDeep Ocean Sound Attenuation in the Sub- and Low-Kilocycle-per-second Regionrdquo JASA Vol 38648 1965
[23] M J Sheehy and R Halley ldquoMemurement o f the Attenua-tion of Low-Frequency Underwater Soundrdquo JASA Vol 29464 1957
[24] H W Marsh and S R Elarn ldquorsquoIrsquohe Illfornlation Content of SignalsrdquoPresented a t the NATO Advanced Study Institute on StochasticProblems in Tinderwater Sound Propagation Lerici (Italy) September 18 23 1967
[25] R SThomas ldquoLimitations Imposed on Signal Processing in Near-Surface EchoRanging Systems by a Time Varying Medium and Target and by Reverberationrdquo Presented at the KAT0 Advanced Study Institute on Stochatic Problems in UnderwaterPropagation Im-ici (Italy) Sttptember 18-231967
[26] R-H Mellen ldquoDo pler Shift of Sonar Backscatterfrom the Sea Surfacerdquo JASf Vol 36 1395 19fX
[27] H W Marsh R H Mellen and W 1 Kor~ratlldquoAnomalous AbsorDtion of Pressure Waves from Exnlosions in Sea Waterrdquo JASArsquo Vol 38326-3381965
[28] D T BlackstockldquoApproximate Eqr~ations Governing Finite Amplitude Sound in Thermoviscolw Ersquolrlidsrdquo AFOSR-5223 Sup 1 Tech Report May 1963
[29] J 8 Stersquolnberg and T G Hirdsd ldquoTTnderwater Sound Propagation in the Straitv of Floritlardquo J B S A Vol 39 301- 315 1966
[30] J LStewartandMK Brandon ldquoRandom Medium Correlation Lossrdquo Presented at the NAlsquoIrsquoO Advanced Study Institute on StochasticProblems in Tnderwater Sound Propagation Lerici (Italy) Septemljcr 18 -23 1967
[31] D E WestonldquoPropagation of Sound i n Shallow Waterrdquo ProcSymposium on Sonar Systems 13irmirlgham (England) 9-11 July 196
[32] D E Weston Horizontal Refraction in L Three-lknensional Medium of VariableStratificationrdquo P m r Phys hrsquooc London Vol 78 46G52 July 1961 D Micfleton ldquoStatistical Models o f Iteverberationand Clutter Tech Rept TR65-2-RF 15 April 1965 Titton Systems Inc ldquoPrinciples of Underwater S o u I d rdquo Nail Ucfense Res Comm Div 6 Sum Tech ReDt Vol 7 10--98 1947 P Faure ldquoTheoreticalrsquo Motlei of deverberation NoiserdquoJASA Vol 36 259-266 1964 R P ChapmanandJH Harris ldquoSllrfwc Backscattering Strengths Measured With Explosive Sound Sourcesrdquo Vol 34 1592-15971962 C S Clay and H Meclwin ldquoHigh-Frequency Acoustical Re-verberation from a Rough-Sea Surfacerdquo JASA Vol 36 2131-21341964 R J Urick ldquoBackscattering of Sou11~11~rsquororna Harbor Bot-tomrdquo JASA Vol 26 231 1954 CM McKinneyand C D Antlerbon ldquoMeasurements of Backscattering of SoundFrom the Ocean Ihttomrdquo JASAVol 3615amp1631964 K V Mackenzie ldquoBottom1tevcrlxrttlon for 530 and 1030 cps Sound in Deep Waterrdquo JASA Vol 3 3 1498--15041961 H W Marsh ldquoReflection and Scattering of Sound by the Sea Bottomrdquo Proc 68th Meeting o f thc Acoustiral Societyof America October 1964 CF Eyring R J Christensen and R W h i t t ldquoReverbera-tion in the Seardquo JASA Vol 20 162 1918 J R Marshall and R P Chapman ldquoKcverheration From a DeepScattering 1ayer Measured W i t h Explosive Sound Sourcesrdquo JASA Vol 36 164-167 1964 S A Schelkunoff ldquoA Mathematicl Theory o f Iinear Arraysrdquo BSTJ Vol 22 80-107 January 1443 J W Horton ldquoFundamentals of Sonarrdquo IJnitJetl States Naval Institute 17amp1761957 S Matt and J D Kraus lsquo T h e Effwt o f tlkc Source Distribu- tion on Antenna Patternsrdquo I RE Irsquoroc 821-825 July 1955
331
1
WINDER UNDERWATER SOUND
[47] J F RamseyldquoFourier Transforms in Aerial TheoryrdquoMarconi Rariew No 83139 No 8417 No 8 5 41 No 8 6 81 No 87 157 No 8945 1946-1948
[48] P M Woodward ldquoA Method of Calculating the Field Over a Plane Required to Producea Given Polar Diagramrdquo JZEE Vol 93 Part I11 A 1554-1561 September 1959 W E Kock and J L Stone lsquo Space-Frequency Equiva- lencerdquo ZRE PTOCVol 46 499-500 F b r u a r y 1958 J W Horton ldquoFundamentals of Sonar United States Naval Institute 180-205217-221228-2361957 R L PritchardldquoDirectivity of Acoustic Linear Point Ar- raysrdquo Tech Memo 21 Acoustics Research LaboratoryHarvard University Chapter IV January 15 1951 E J Powers Jr ldquoAnalysis and Synthesis of a General Class of Difference Patternsrdquo Tech Rept No 8 Research Laborac tory of Electronics MIT July 30 1959 S S Sandler ldquoSome Eq$valence Between Equally and Un- equally Spaced Arrays ZRETrans m Antennasand Propagation 496-500 September 1960 R F Harrington ldquoSidelobe Reduction by Non-Uniform Element hacinerdquo IRE Trans Vol AP-9 187-192 MarchL1961
I
D D King R F Packard and R K Thomas ldquoUnequally Spaced Broadband AntennaArrays ZRETrans Vol AP-8 380-385 July 1960 D L Jagerman and L F Fogel ldquoSome General Aspects of the Sampling Theoremrdquo ZRETrans Vol IT-2 139-145 December 1956 J L Y ldquoOn Non-Uniform Sampling of Bandwidth-Limited Signals IRE Trans Vol CT-3 251-257 December 1956 J L Yen ldquo9n the Synthesis of Line-Sources and Infinite Strip-Sources ZRETrans on AntennasandPropagatimJanuary 1957 P L Storklin Lecture on Space-Time Sam ling Delivered a t TheNATO Advanced StudvInstituteerenoble France 14-26 September 1964 B Cron and G Becker ldquoGain of a Three-Dimensional Array in a Directional Noise Fieldrdquo USNUSL USL Rept No 71013 A ril 1966 B 8 o n and C Sherman ldquoS atial-Correlation Functions for Various Noise Modelsrdquo JASK) Vol 34 1732-1736 November 1962 C EckartldquoTheTheorv of Noise in Continuous Mediardquo J A S A Vol 25195-199-March1953 H W Marsh ldquoCorrelation inWaveFieldsrdquoUSL QuarterlyReport Part 11 63-68 l October 1949-31 March 1950 B F Cron B C Hassell and F J Keltonic ldquoComparison of Theoretical and Experimental Values of Spatial Correlationrdquo J A S A Vol 37 No 3 523-529 March 1965 J J Faran and R Hills ldquoWide-band Directivity of ReceivingArraysrdquo Acoustic Research Laboratory Harvard UniversityTech Memo 31 May 1953 R LPritchard Directivity of Acoustic Linear Point Ar- raysrdquoTech Memo 21 Acoustics Research LaboratoryHarvard University Chapter V January 15 1951 N Yaru ldquoA Note on Su er Gain Antenna Arraysrdquo ZRE Proc Vol 39 10l-1085 8eGember 1951 G T DiFrancia Directivity SuperGain and InformationrdquoElectromagnetic Wave Symposium 463 July 1956 D G Tucker ldquoThe SignalNoise Performance of Super-Directive Arraysrdquo Awustica Vol 8112-1h61958 V CAnderson ldquoDigitalArray Phasing J A S A Vol 32867-8701960 P Rudnick ldquoSmall Signal Detection in the DIMUS Arrayrdquo J A S A Vol 32 871-877 1960 B Picinbono ldquoAlteration of Directivity by Clipping in Passive Detectionrsquorsquo Proc NATO Advanced Study Institute on Signal Processing with Emphasis on Underwater Acoustics Grenoble France 14-26 September 1964 J Max rdquoQuantizing for Minimum Distortionrsquorsquo ZEEE Trans PGIT-6 7-12 March 1960 R Widrow Analysis of Amplitude-QuantizedldquoStatisticSampled-Data Systems Tech Rept 2103-1 Stanford Elec- tronics Lab 10-39 10 May 1960 A I Velickin ldquoOptimum Characteristics of QuantizersrdquoRadio Eng 1-7 February 1963 A M Vural ldquoEffects of Signal Quantizing on Beamformer PerformanceTechInform Ser Rep R67EMH33 General Electric Co Heavy Electronics Dep Syracuse N Y9-11 November 1967 A H Nuttall ldquoSpectrum Reproduction Capability of a Beam-former withMultibit Quantization and Samplingrsquorsquo Tech Rep MS2381 Litton Systems Inc Van Nuys Calif 1-37September 1967 A M Vural ldquoEffects of Signal Quantization on the
Performance of Multichannel Processing Systemsrdquo J A S A Vol 46 293-313 1969
[79] V C Anderson ldquoDICANNE A Realizable Adaptive Processrdquo J A S A Vol 45 398-405 1969
[SO] V C Anderson and P RudnickldquoRejection of a Coherent Arrival at an Arrayrdquo J A S A Vol 45 406-410 1969
[81] F Bryn ldquoOptimum Signal Processing of Three-Dimensional Arrays Operating onGaussian Signals and Noiserdquo J A S A Vol 34 289-297 1962
[82] H Mermoz ldquoMatched Filter and Optimum Use of an Arrayrdquo Proc NATO Advanced Study Institute on Signal Processing withEmphasis on Underwater Acoustics Grenoble France 14-26 September 1964
[83] S W W Shor ldquoAdaptive Technique to Discriminate AgainstCoherent Noise in a Narrow-Band Systemrdquo J A S A Vol 3974-781966_~ ~
[ 8 4 ] J P -
rsquoBurg ldquoThree-Dimensional Filtering with anArray of Seismometersrdquo Geophysics Vol 29 693-713 1964
[Ss] B Widrow P E Mantey L J Griffiths and B B Goode ldquoAdaptiveAntenna Systemsrdquo ProcZEEE Vol 552143-21591967
[86] L Jrsquo Griffiths ldquoA Simple Adagtive Algorithm for Real-Time Processing in Antenna Arrays ProcZEEE Vol 57 1696- 1704 October 1969
[87] A Ksienski G G Comisar and 0 R Price ldquoLogical Pattern Synthesisrdquo Microwave Laboratory Hughes Aircraft Com-y y Culver City California IRE Wescon Conv Record
art I 1959 32-39 [88] B Y Mills and A G Little ldquoA High Resolution Aerial
System of a New Typerdquo Australian J Phys Vol 6 272 1953 [89] W H Kummer A T Villeneuve T S Fong and F G
Terrio ldquoUltra-Low Sidelobes from Time-Modulated ArraysrsquorsquoZEEE Trans on Antennas and Propagation 633439 Novem-ber 1963
[90] J L Lawson and G E Uhlenbeck ldquoThreshold SignalsrdquoDover Pub Inc Chapter 11
I911 ldquoUnderwaterSound Equipment 11Echo-RangingSystemsrdquoVol 15 Summary Technical Report of Division 6 NDRC1946
1921 B-M Oliver ldquoAutomatic Volume Control as a Feedback Problemrdquo ZRE Proc Vol 36 466473 April 1948
1931 W F Chow and A P SternldquoAutomatic Gain Control of Transistor Amplifiersrdquo ZREProc Vol 431119-1127 September 1955
[94] R H Delano and I Pfeffer ldquoThe Effect of AGC on Radar Tracking Noiserdquo ZRE Proc 801-810 June 1956
[95] J C G Field ldquoThe Design of AutomaticGainControl Systems for Auto-Tracking Radar Receiversrdquo The Institution of Electrical Engineers Monograph No 258 R 93-108 October 1957
[Ss] J H Dunn and D D Howard ldquoThe Effects of Automatic Gain Control Performance on the Tracking Accuracy of Mono- pulse Radar Systemsrdquo ZREProc 43amp435 March 1959
[97] J Croney ldquoClutter on Radar Displays Reduction by Use of Logarithmic Receiversrdquo WirelessEngineer Vol 33 83-96 1956
[98] R H Pragerand F L Reese ldquoApplications of Logarithmic Receivers to Signal Detection in Nonstationary Backgroundsrdquo NEL Report 1098 18 January 1962
1991 V GHannsen lsquolsquoStudies of LoearithmicRadar Receiver Using Pulse-Length Discriminationrdquordquo IEEE Trans Aero and E k d Syst Vol AES1 246-253 1965
[l001 B A Green Jr ldquoRadar Detection Probability with Logarith- mic Detectorsrdquo I R E Trans Znjo Theory Vol IT4 5amp52 1958
[loll I Jacobs ldquoThe Effects of Video Clipping on the Performance of an Active Satellite PSK CommunicationSystemrdquo IEEE Trans Commun Tech Vol COM-13 1965
[l021 W B DavenportJr ldquoAn Introduction totheTheory of Random Signals and Noiserdquo McGraw-Hill June 1958 Chapter 13 J H Van Vleck ldquoThe Spectrum of Clipped Noiserdquo Radio Res Lab Harvard Univ Rept 51 21 July 1943 W B Davenport Jr ldquoSignal-To-Noise Ratio in Band-Pass Limitersrdquo J Appl Phys Vol 24 720-727 1953 J L Sevy ldquoThe Effect of Hard Limiting an Angle-Modulated Signal Plus Noiserdquo IEEE Trans Aero and Elect Syst Vol AES-4 24-30 1968 J J JonesldquoHard-Limiting of Two Siqnals in Random Noiserdquo ZEEE Trans on Info TheoryVol IT-93442 1963 W R Remley ldquoSome Effects of Clipping on Array Proc- essingrdquo J A S A Vol 39 702-707 1966 W W Peterson T G Birdsall and W C Fox ldquoThe Theoryof Signal Detectabilityrdquo ZRETrans on Info Theory Vol 4 171-212 September 1954
E L Lehman ldquoTesting Statistical Hypothesesrdquo Wiley New York 1959 D 0 North ldquoAnalysis of the Facto which Determine SignalNoiseDiscrimination inRadarReportPTRGCRCA Laboratories 1943 I A Zadeh and J R Ragaseini ldquo0 timumFilters for the Detection of Signals in Noiserdquo I r R 8 eurolsquoroc Vol 40 1223- 12311952 G L Turin ldquoAn Introduction to Matched Filtersrdquo ZRE Trans Vol IT-6 311-330 June 1960 J I Stewartand E C Westerfield ldquoA Theory of Active Sonar Detectionrdquo ZRE Proc Vol 47 872-881 1959 E C Westerfield R H Prager and JL Stewart ldquoProcessing Gains Against (Clutter) MatchedReverberation UsingFiltersrdquo IRETrans on InfoTheory Vol 6 342-348 Tllnp- --- 1MO- -
[l151 V I
C Anderson ldquoDELTIC Correlatorrdquo Harvard Acoust 1ab Tech Memo No 37 5 Januar 1956
[l161 W B Allen and E C Westerfield ldquofligital Compressed-Time Correlators and Matched Filters for Active Sonarrsquorsquo JASA 1lsquo01 36121-139 JerlU 1964
11171 C van Schooneveld drrelator Technologyrdquo Presented at theNATO Advanced Study Institute on Signal Processing withEmphasis on Underwater Acoustics Enschede (TheNetherlands) 12-23 August 1968
[l181 S A Kramer ldquoDo pler and Acceleration Tolerances of High-Gain WidebandLinear FM Correlation Sonarsrdquo I E E E Proc Vol 55 627-636 May 1967
[l191 B Harris and S A Kramer ldquoAsym totic Evaluation of the Ambiguity Functions of High-Gain Fh Matched Filter Sonar Systemsrdquo ZEEE Proc Vol 56 2149-2157 December 1968
[l201 T Glisson C Black and A Sage ldquoOn Sonar Signal Analysisrdquo
IEEE TRANSACXTONS ON SONICS AND ULTRASONICS SEPTEMBER 1975
IEEETrans Aero and Elect Syst Vol AESG 37-50
[l211 i ic tnd RP Wishner ldquoMatched Filter Theory for High-Velocity Accelerating Targetsrdquo IEEETrans Mil Eleet Vol MILS 56-69 January 1965
[l221 D E WestonldquoCorrelation Loss in Echo Rangingrdquo JASAVol 37 119-124 January 1965
[l231 B Picinboo ldquoAlteration of Directivity by Clipping in Passive Detection Proc NATO Advanced Study Institute on Signal Processing with Emphasis on Underwater Acoustics Grenoble (France) September 14-26 1964
[l241 J B Thomas and T R Williams ldquoOn the Detection of Sig-nals in Nonstationary Noise by Product Arraysrdquo JASA Vol 31 453462 1959
[l251 T Usher Jr ldquoSignal Detection by Arrays in Noise Fields with Local Variationsrdquo JASA Vol 36 1444-1449 1964
[l261 V H MacDonald and P M Schultheiss ldquoOptimum Passive Bearing Estimation in a Spatially Incoherent Noise Environ- mentrdquo JASA Vol 46 July 1969
[l271 V HMacDonald ldquoOptimum Bearing Estimationwith PassiveSonarSystemsrdquoPhDDissertationYale Univer-sity 1971
[l281 A Freedman ldquoThe High Frequency Echo Structure of Some SimleBodyShapesrdquo A c o u s l i ~ ~ ~ o l 1261-701962
[l291 A xWinder and C J Loda Introductionto Acoustical Space-Time InformationProcessingrdquo Office of Naval Re-search ONR t ACR63 January 1963
[l301 A A Winder bynamic Range Compression and Normaliea- tion in Sonar Receiversrdquo Presented at the NATO Advanced Study Institute on Signal Processing with Emphasison Under-water Acoustics Enschede (The Netherlauds) 12-23 August1968
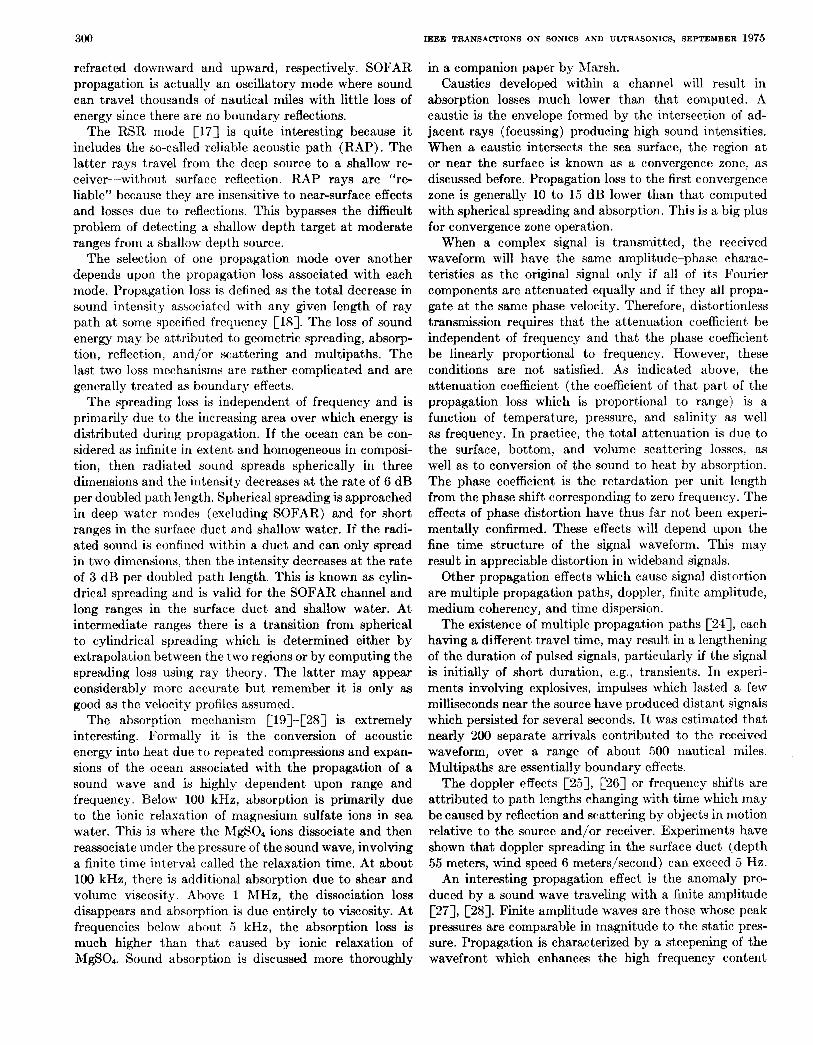
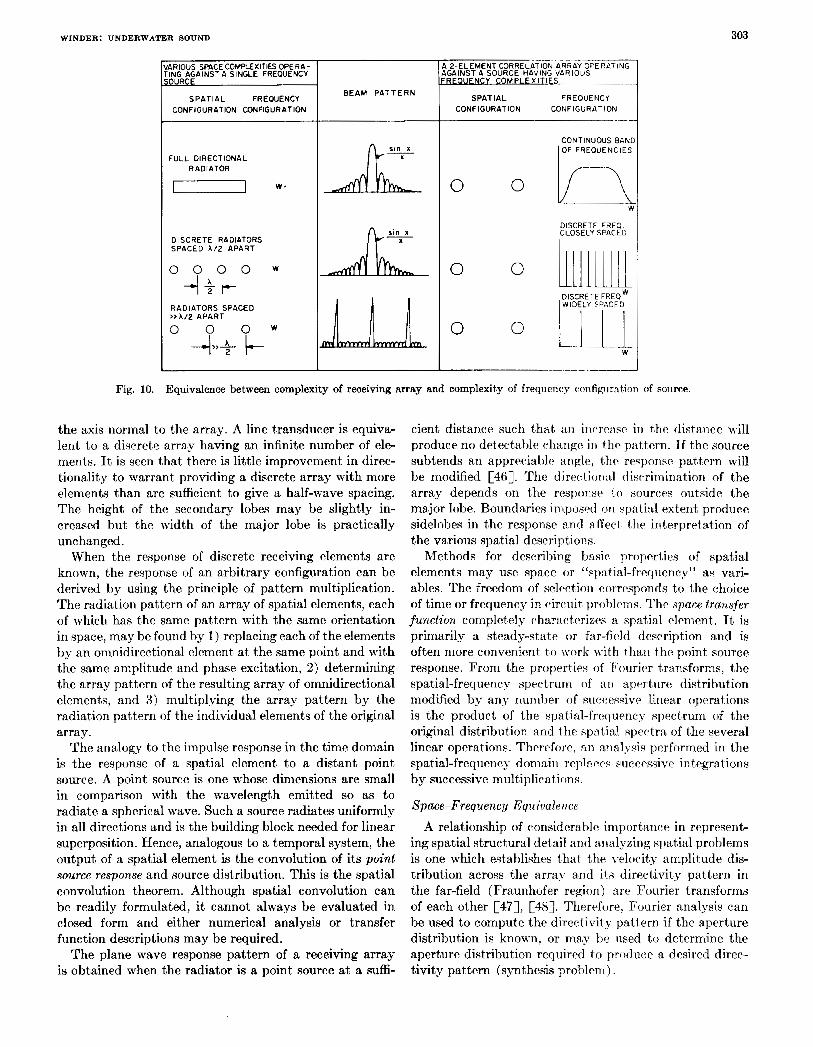
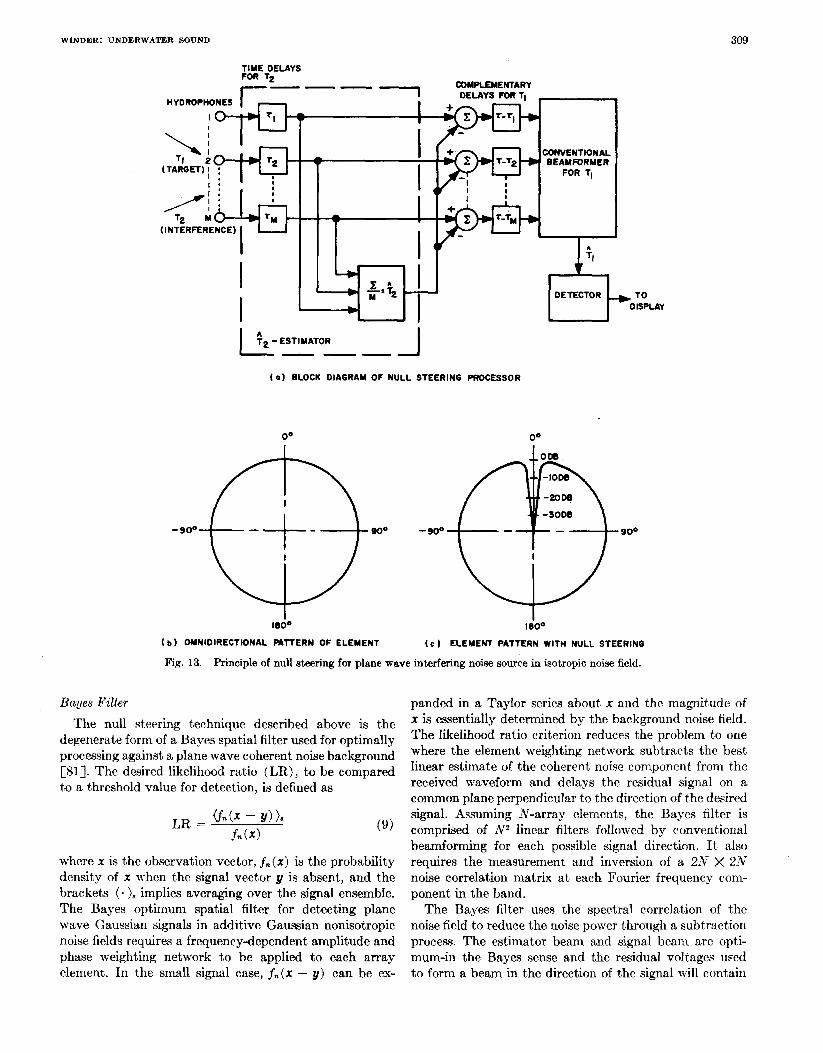
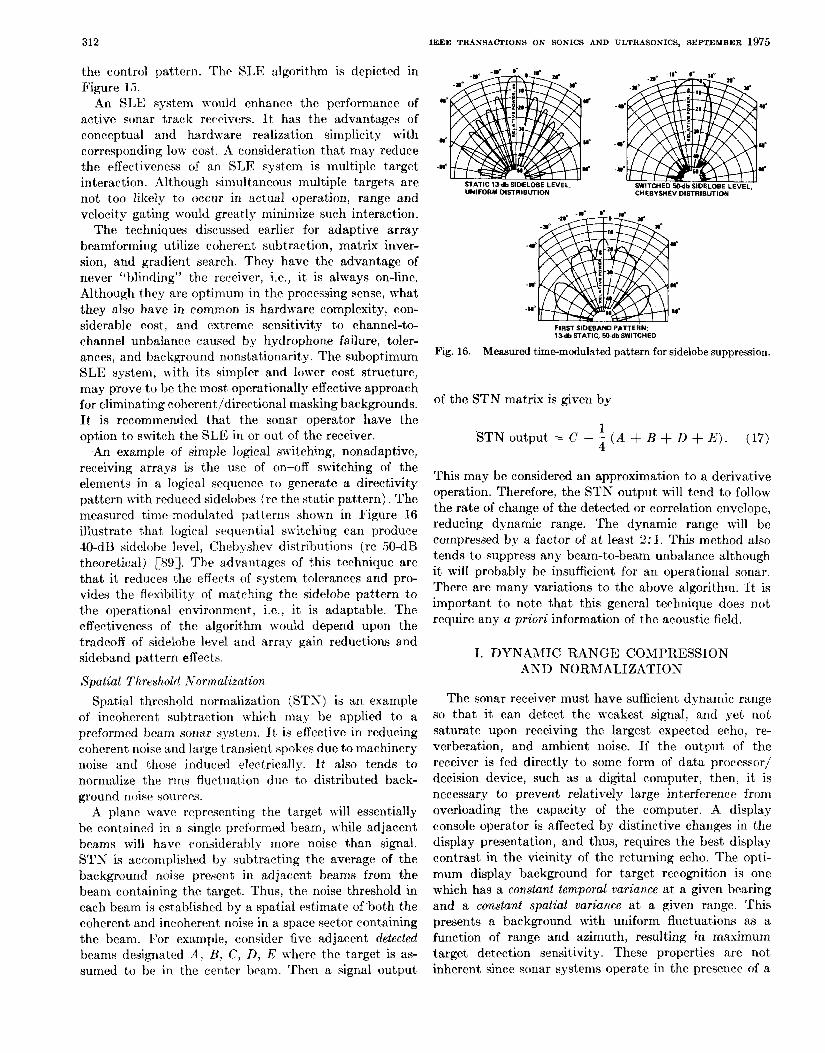
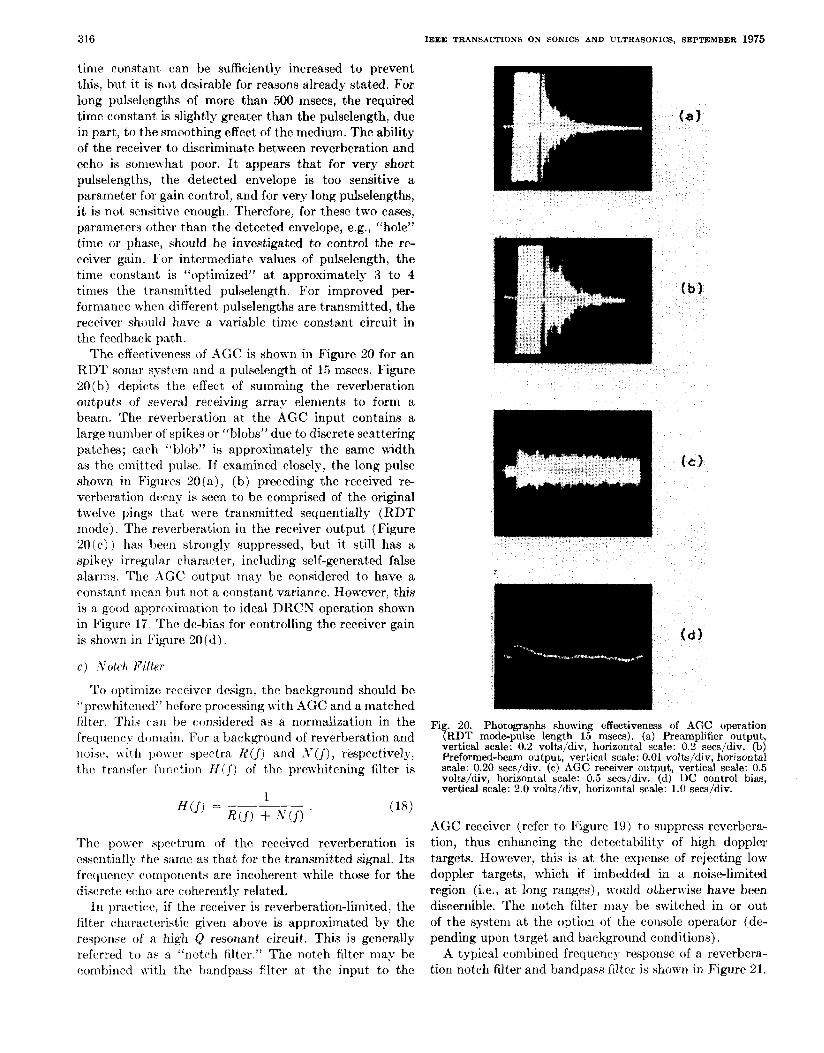
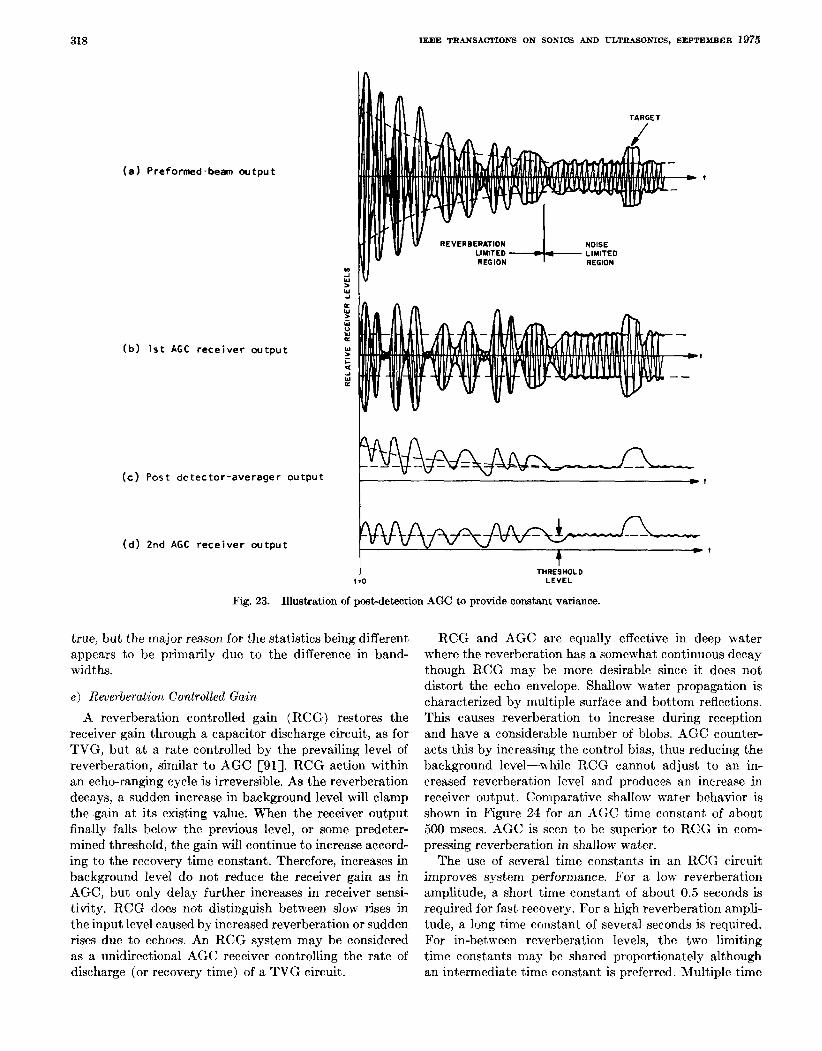
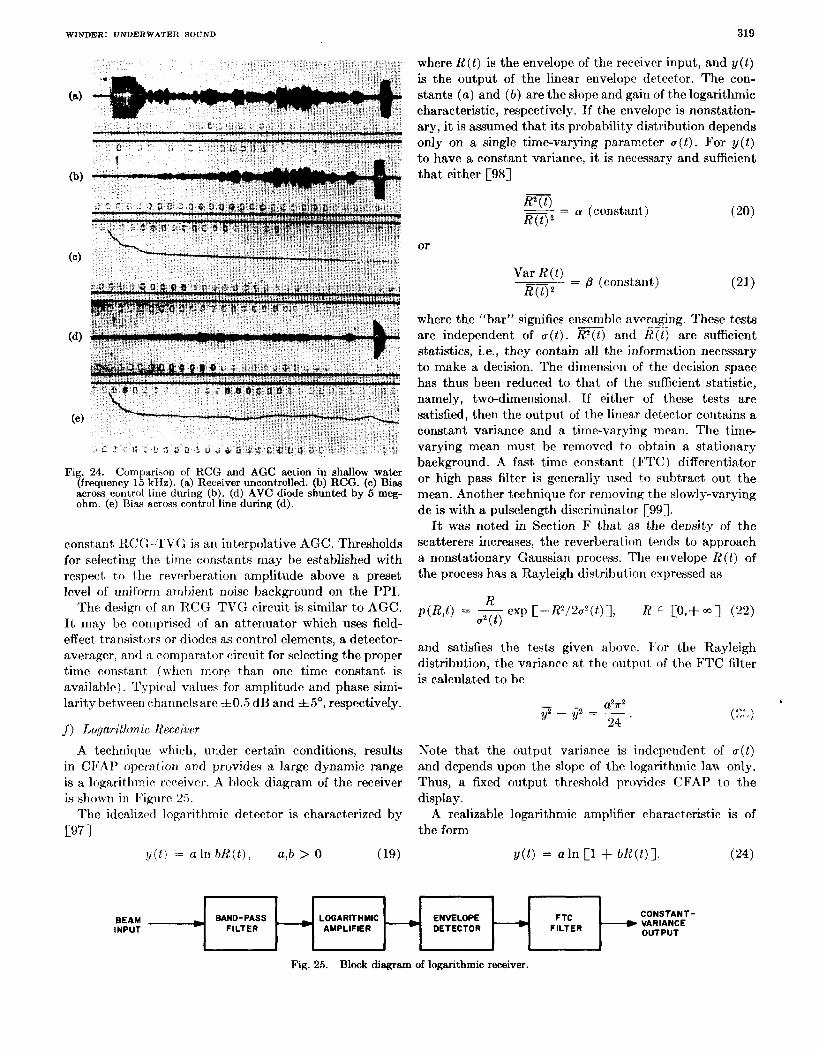
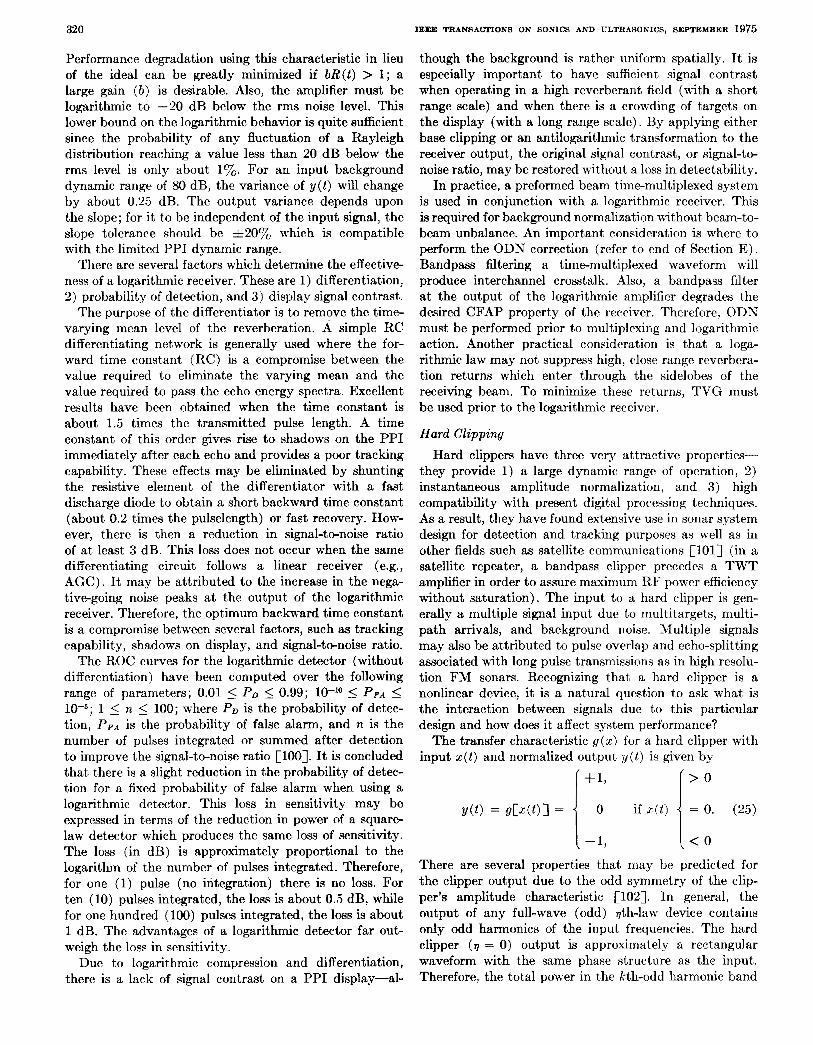
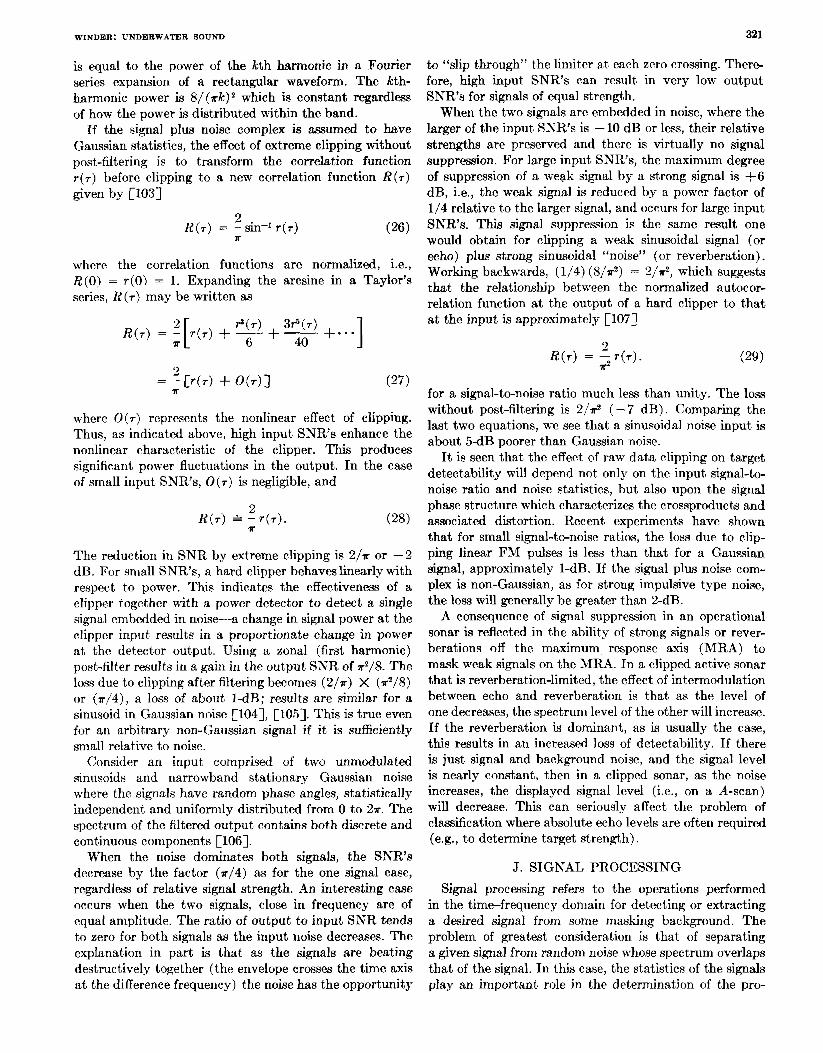
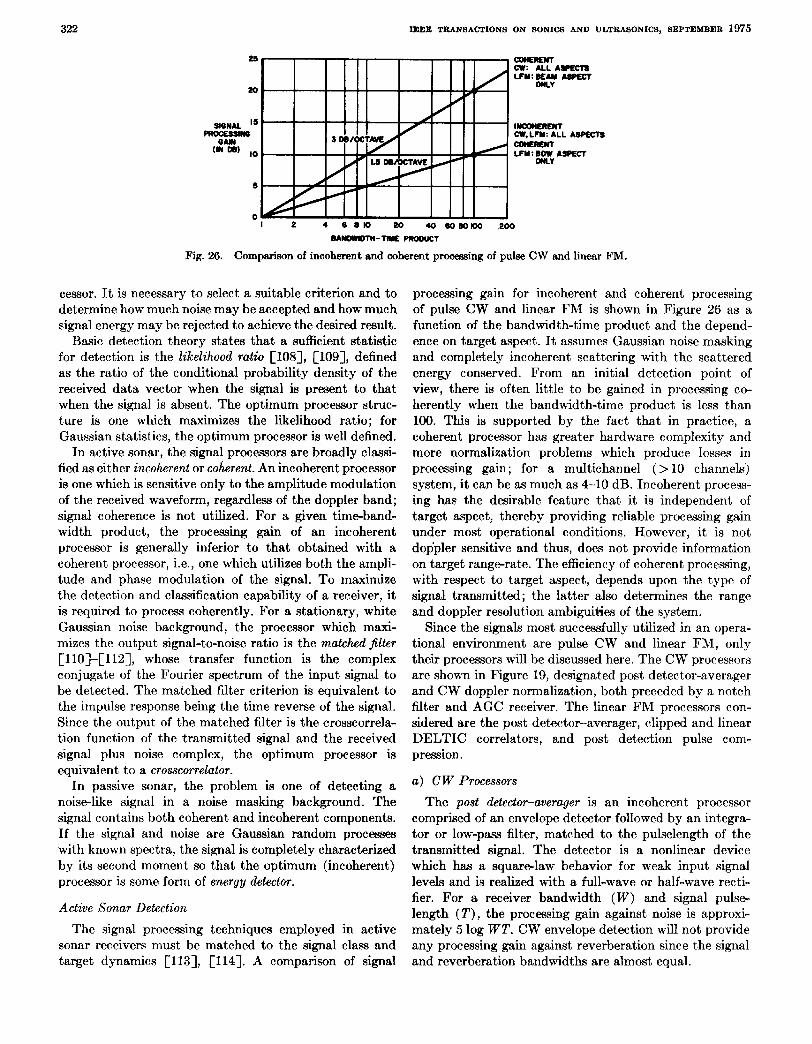
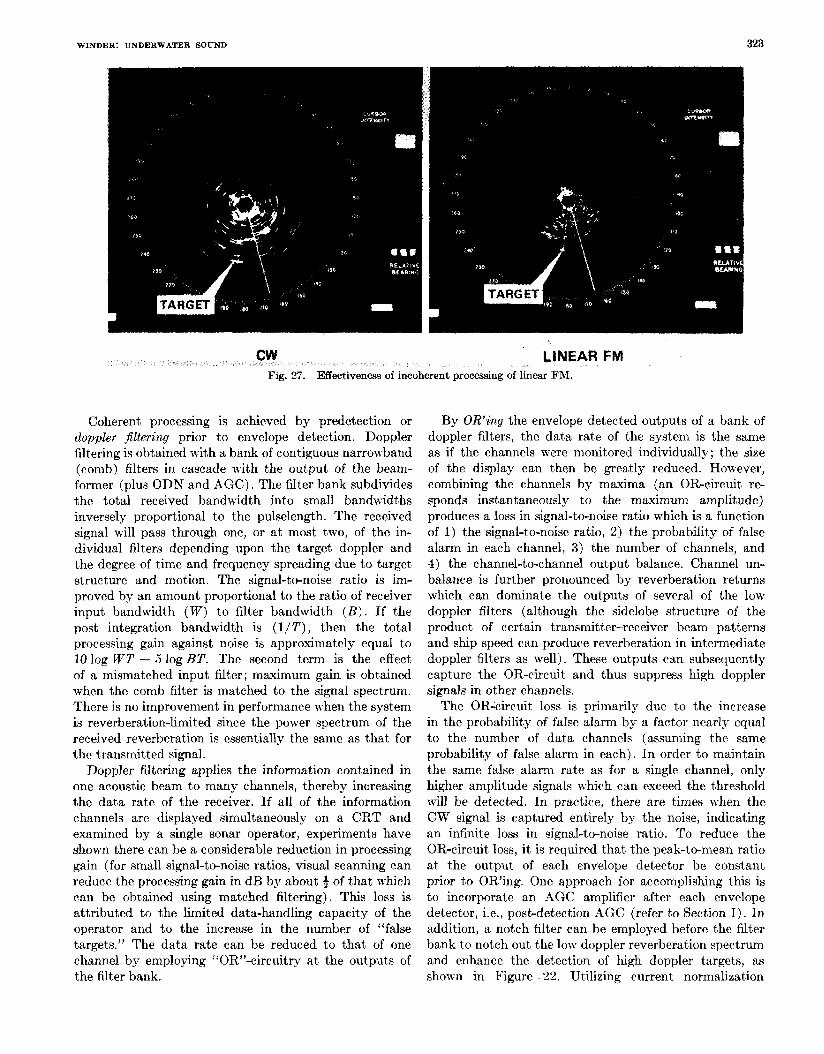