iiot data collection for oee measurements · 2018-10-12 · iiot data collection for oee...
TRANSCRIPT

IIoT data collection for OEE measurementsÁsgeir Halldórsson
Final Report in Electrical Engineering B.Sc.
2016
Name: Ásgeir HalldórssonKennitala: 041283–2549Supervisor: Baldur Þorgilsson
School of Science and EngineeringTækni- og verkfræðideild

ii

Heiti verkefnis:
Námsbraut: Tegund verkefnis:
Önn: Námskeið: Ágrip:
Höfundur:
Umsjónarkennari:
Leiðbeinandi:
Fyrirtæki/stofnun:
Dagsetning: Lykilorð íslensk: Lykilorð ensk:
Dreifing:opin lokuð til:
Háskólinn í Reykjavík Menntavegi 1, 101 Reykjavík sími: 599 6200 www.ru.is
IIoT data collection for OEE measurements
Electrical Engineering B.Sc. Final Report in Tæknifræði B.Sc.
2016–2 RT LOK1012
Ásgeir Halldórsson
Baldur Þorgilsson
Haraldur Þorkelsson
Samey ehf.Lyngás 13210 Garðabæ
5.12.2016 Iðntölvur, Tölvusam-skipti, Gagnasafns-kerfi
IIoT, M2M, OEE
The aim of this project was to compile alist of requirements for connecting industrialcomputers and devices to collect data andsend to the cloud. Furthermore design andbuild a prototype that fulfills all requirements.The data can be analyzed to improve Over-all Equipment Effectiveness(OEE) and helpcompanies make more efficient and produc-tive use of their production methods.There are many types of communication pro-tocols between devices. Tests were con-cluded on different methods to fulfill the re-quirements defined for the system.The prototypes made fulfilled all the require-ments, users can connect devices to a gate-way that sends the data to the cloud wheredata can be analyzed.The results show that by collecting datafrom production, companies can improve theirOEE and increase profits.
X

iv

The undersigned hereby grants permission to the Reykjavík University Library to reproducesingle copies of this Final Report entitled IIoT data collection for OEE measurements and tolend or sell such copies for private, scholarly or scientific research purposes only.The author reserves all other publication and other rights in association with the copyright in theFinal Report, and except as herein before provided, neither the Final Report nor any substantialportion thereof may be printed or otherwise reproduced in any material form whatsoever withoutthe author’s prior written permission.
date
Ásgeir HalldórssonBachelor of Science

vi

I dedicate this to my mom.

viii
ix
Contents
Contents ix
List of Figures xi
List of Abbreviations xiii
1 Introduction 11.1 Introduction . . . . . . . . . . . . . . . . . . . . . . . . . . . . . . . . . . . . 11.2 Background . . . . . . . . . . . . . . . . . . . . . . . . . . . . . . . . . . . . 2
1.2.1 IIoT . . . . . . . . . . . . . . . . . . . . . . . . . . . . . . . . . . . . 21.2.2 OEE . . . . . . . . . . . . . . . . . . . . . . . . . . . . . . . . . . . . 3
1.3 Requirements for the system . . . . . . . . . . . . . . . . . . . . . . . . . . . 51.4 Structure of thesis . . . . . . . . . . . . . . . . . . . . . . . . . . . . . . . . . 6
2 The design of the solutions 72.1 Unitronics PLC/HMI - Cloud . . . . . . . . . . . . . . . . . . . . . . . . . . . 82.2 Unitronics PLC - Red Lion HMI - FTP Server . . . . . . . . . . . . . . . . . . 112.3 Future research suggestions . . . . . . . . . . . . . . . . . . . . . . . . . . . . 12
2.3.1 Data dashboard . . . . . . . . . . . . . . . . . . . . . . . . . . . . . . 122.3.2 Arduino . . . . . . . . . . . . . . . . . . . . . . . . . . . . . . . . . . 122.3.3 dweet.io . . . . . . . . . . . . . . . . . . . . . . . . . . . . . . . . . . 122.3.4 Machine learning . . . . . . . . . . . . . . . . . . . . . . . . . . . . . 12
3 Testing and Usage 133.1 Testing . . . . . . . . . . . . . . . . . . . . . . . . . . . . . . . . . . . . . . . 13
3.1.1 PLC to IoT Gateway . . . . . . . . . . . . . . . . . . . . . . . . . . . 133.1.2 Red Lion HMI . . . . . . . . . . . . . . . . . . . . . . . . . . . . . . 14
3.2 Usage . . . . . . . . . . . . . . . . . . . . . . . . . . . . . . . . . . . . . . . 153.3 Use case I . . . . . . . . . . . . . . . . . . . . . . . . . . . . . . . . . . . . . 163.4 Use Case II . . . . . . . . . . . . . . . . . . . . . . . . . . . . . . . . . . . . 17
4 Results and discussion 194.1 Benefits of OEE . . . . . . . . . . . . . . . . . . . . . . . . . . . . . . . . . . 194.2 Data handling . . . . . . . . . . . . . . . . . . . . . . . . . . . . . . . . . . . 204.3 Collecting Data . . . . . . . . . . . . . . . . . . . . . . . . . . . . . . . . . . 214.4 Present Data . . . . . . . . . . . . . . . . . . . . . . . . . . . . . . . . . . . . 21
5 Discussion 235.1 Conclusion . . . . . . . . . . . . . . . . . . . . . . . . . . . . . . . . . . . . 235.2 Future work . . . . . . . . . . . . . . . . . . . . . . . . . . . . . . . . . . . . 23

x
Bibliography 25
A Instructions manual 27A.1 MODBUS TCP/IP in Node-Red . . . . . . . . . . . . . . . . . . . . . . . . . 27
A.1.1 Node-Red to Google Spreadsheet . . . . . . . . . . . . . . . . . . . . 28A.1.2 Node-Red to Azure IoT Hub . . . . . . . . . . . . . . . . . . . . . . . 28
A.2 PLC - HMI - FTP - Spreadsheet . . . . . . . . . . . . . . . . . . . . . . . . . 29
B Hardware and software used 35
xi
List of Figures
1.1 Internet of Things[1] . . . . . . . . . . . . . . . . . . . . . . . . . . . . . . . . . 11.2 IIoT flow[5] . . . . . . . . . . . . . . . . . . . . . . . . . . . . . . . . . . . . . . 21.3 Example of IIoT data flow . . . . . . . . . . . . . . . . . . . . . . . . . . . . . . 31.4 Flow chart proposal to measure OEE in a production line . . . . . . . . . . . . . . 41.5 Example of visual presentation of OEE measurement results made in Google Spread-
sheet. . . . . . . . . . . . . . . . . . . . . . . . . . . . . . . . . . . . . . . . . . 5
2.1 Flow chart of design parameter . . . . . . . . . . . . . . . . . . . . . . . . . . . . 72.2 The 7 layer OSI model[8] . . . . . . . . . . . . . . . . . . . . . . . . . . . . . . . 82.3 Outlook of the Visilogic software application with a MODBUS configuration func-
tion block . . . . . . . . . . . . . . . . . . . . . . . . . . . . . . . . . . . . . . . 92.4 Node-Red configured as a Master to read from the PLC . . . . . . . . . . . . . . . 102.5 Visilogic Ladder configured to send a HTTP GET request. . . . . . . . . . . . . . 102.6 Communication protocol between PLC and HMI defined in the Crimson . . . . . . 112.7 Machine learning design flow . . . . . . . . . . . . . . . . . . . . . . . . . . . . . 12
3.1 Example of the testing flow in Node-Red reading holding registers in PLC overMODBUS and send it to Google Spreadsheet . . . . . . . . . . . . . . . . . . . . 13
3.2 MODBUS communication between Master and Slave . . . . . . . . . . . . . . . . 143.3 Node-Red flow reading MODBUS TCP/IP and sending it to the Microsoft Azure
IoT Hub . . . . . . . . . . . . . . . . . . . . . . . . . . . . . . . . . . . . . . . . 143.4 FTP server with data from HMI rolling in . . . . . . . . . . . . . . . . . . . . . . 153.5 Google Spreadsheet showing data imported, going from the HMI gateway device
to the FTP server where the Spreadsheet imports it from . . . . . . . . . . . . . . . 153.6 Flow chart proposal to measure OEE in a production line . . . . . . . . . . . . . . 16
4.1 OEE measurement of low wine output measured for 46 weeks . . . . . . . . . . . 194.2 Flow of the prototype design idea . . . . . . . . . . . . . . . . . . . . . . . . . . . 204.3 0auth 1.0a authorization diagram, source [18] . . . . . . . . . . . . . . . . . . . . 21
A.1 Set up MODBUS function block in PLC, define the start of vector . . . . . . . . . 27A.2 Define MODBUS between RPI and PLC and make sure the address of vector is
same as in PLC and IP address . . . . . . . . . . . . . . . . . . . . . . . . . . . . 28A.3 Node-Red setup of Azure IoT Hub . . . . . . . . . . . . . . . . . . . . . . . . . . 29A.4 Communication protocol between PLC and HMI defined in the Crimson . . . . . . 30A.5 Red Lion Crimson application for data collection . . . . . . . . . . . . . . . . . . 30A.6 Crimson software sync manager connection with ftp server . . . . . . . . . . . . . 31A.7 Data logging in Crimson application . . . . . . . . . . . . . . . . . . . . . . . . . 31

xii

xiii
List of Abbreviations
ADU Application Data UnitAMQP Advanced Message Queuing ProtocolAPI Application programming InterfaceASCII American Standard Code for Information InterchangeCoAP Constrained Application ProtocolDDS Data Design SystemFTP File Transfer ProtocolHDLC High level Data Link ControlHMI Human Machine InterfaceHTTP Hypertext Transfer ProtocolHTTPS Hypertext Transfer Protocol SecureIETF Internet Engineering Task ForceIoT Internet of ThingsIIoT Industrial Internet of ThingsIP Internet ProtocolI/O Input/OutputJSON JavaScript Object NotationMAC Media Access ControlMB MODBUS ProtocolMQTT MQ Telemetry TransportOPC Open Platform CommunicationsOSI Open Systems InterconnectionPDU Protocol Data UnitPLC Programmable logic computerREST Representational state transferSDU Service Data UnitTCP Transmission Control ProtocolTCP/IP Internet protocol suiteURL Uniform Resource LocatorURI Uniform Resource IdentifierXMPP Extensible Messaging and Presence Protocol

xiv

1
Chapter 1
Introduction
1.1 Introduction
This B.Sc final project in Electrical Engineering at the University of Reykjavik was done inco-operation with Samey, a local company that has been selling automation solutions for 25years.
Figure 1.1: Internet of Things[1]
With the increased amount of devices that are ableto communicate with each other over the Internet, com-panies are now able to to make more efficient and pro-ductive use of their production methods. By being ableto receive data that has never been accessible beforewhere they can get feedback from their production andthe market instantly, offers endless possibilities in busi-ness models and companies service offerings. Today,many factories are run by computers that have mas-tered the art of productivity, by using data available tomaximize the production using pattern recognition andmachine learning, also known as artificial intelligence.However, up to 85% of devices are in isolated systemsor unconnected, and replacing them all costs a lot of money and takes a long time[2]. To beable to utilize all the benefits of smart systems, there must be a way to connect them.
The goal of this project is to find a way to collect data from industrial devices and send itto a cloud based server where the data can be analyzed and to measure the Overall EquipmentEffectiveness(OEE). The collection of the data is the most difficult task in OEE measurementsas there are many types of communication protocols and network constrictions that need to besolved. Furthermore, sending the data straight to the cloud is often tricky because of securityreasons. Therefore, there needs to be some kind of a gateway on the edge of the network whichneeds to be implemented in a secure way so it won’t be vulnerable to cyber-attacks. Once thedata has been collected in the cloud, it can be analyzed and used to develop concepts with thepossibility to transform businesses.
The results are shown in a step-by-step manual in Appendix A for anyone who wishes tocopy or get ideas on how to connect devices, collect data and send it to the cloud. Testing willbe completed on a couple of different types of devices and applications and other methods arediscussed.
2 CHAPTER 1. INTRODUCTION
1.2 Background
1.2.1 IIoT
Since the beginning of the industrial revolution, the manufacturing industry has been evolvingrapidly. With the help of automation, companies have been able to increase their productionand operational effectiveness. Samey has been doing research on the overall equipment effec-tiveness(OEE) with the objective to provide those measurements along with their automationsystems. This application would collect data from the system, namely availability, performanceand quality rate. This data would be sent to a server in the cloud where the data can be analyzedand measure the OEE factor.
Automation in manufacturing is getting more common and is often referred to as the Indus-try 4.0 or smart factory[3], where the physical world of the atoms is connected to the cyber-physical world of bytes. As competition in manufacturing is constantly growing, manufacturersare always trying to increase their productivity. By measuring the OEE, they would have thetool they need to increase their productivity. As OEE is not about complex mathematical equa-tions, but rather about collecting simple data during operation and analyzing the trends. Simpleanalysis like comparing productivity between days, time of day or shifts can give productionmanagers a better overview in order to make adjustments.
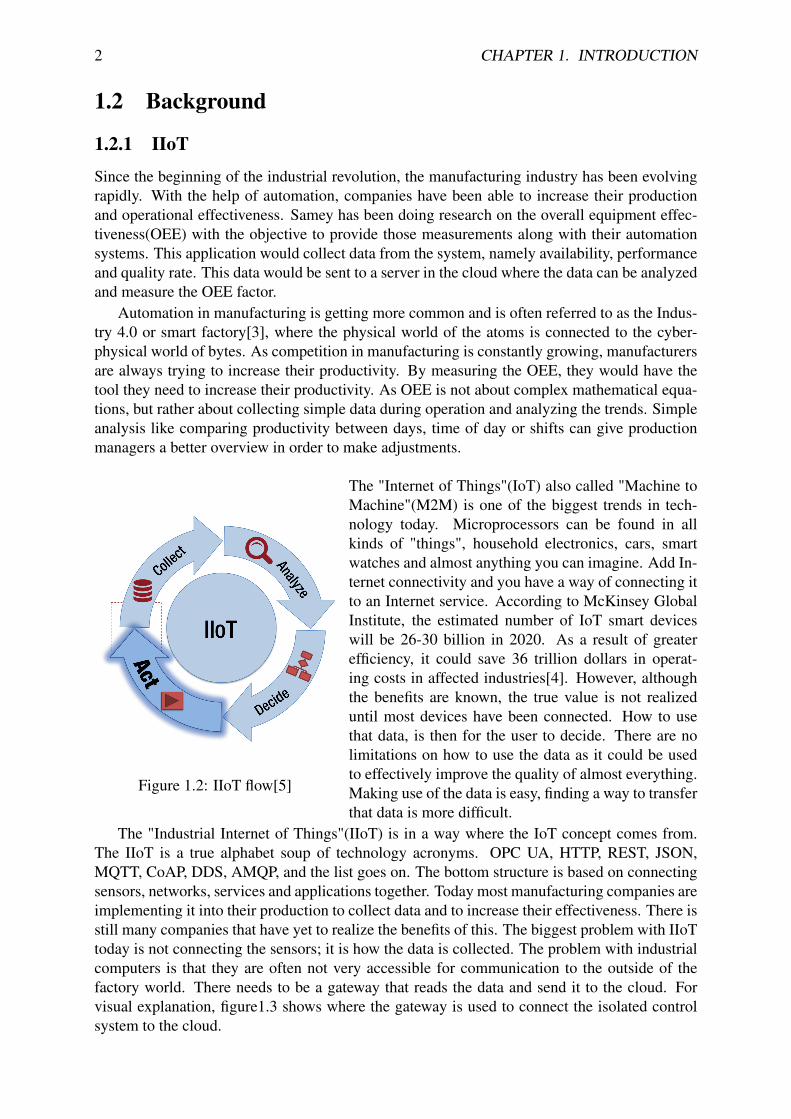
Figure 1.2: IIoT flow[5]
The "Internet of Things"(IoT) also called "Machine toMachine"(M2M) is one of the biggest trends in tech-nology today. Microprocessors can be found in allkinds of "things", household electronics, cars, smartwatches and almost anything you can imagine. Add In-ternet connectivity and you have a way of connecting itto an Internet service. According to McKinsey GlobalInstitute, the estimated number of IoT smart deviceswill be 26-30 billion in 2020. As a result of greaterefficiency, it could save 36 trillion dollars in operat-ing costs in affected industries[4]. However, althoughthe benefits are known, the true value is not realizeduntil most devices have been connected. How to usethat data, is then for the user to decide. There are nolimitations on how to use the data as it could be usedto effectively improve the quality of almost everything.Making use of the data is easy, finding a way to transferthat data is more difficult.
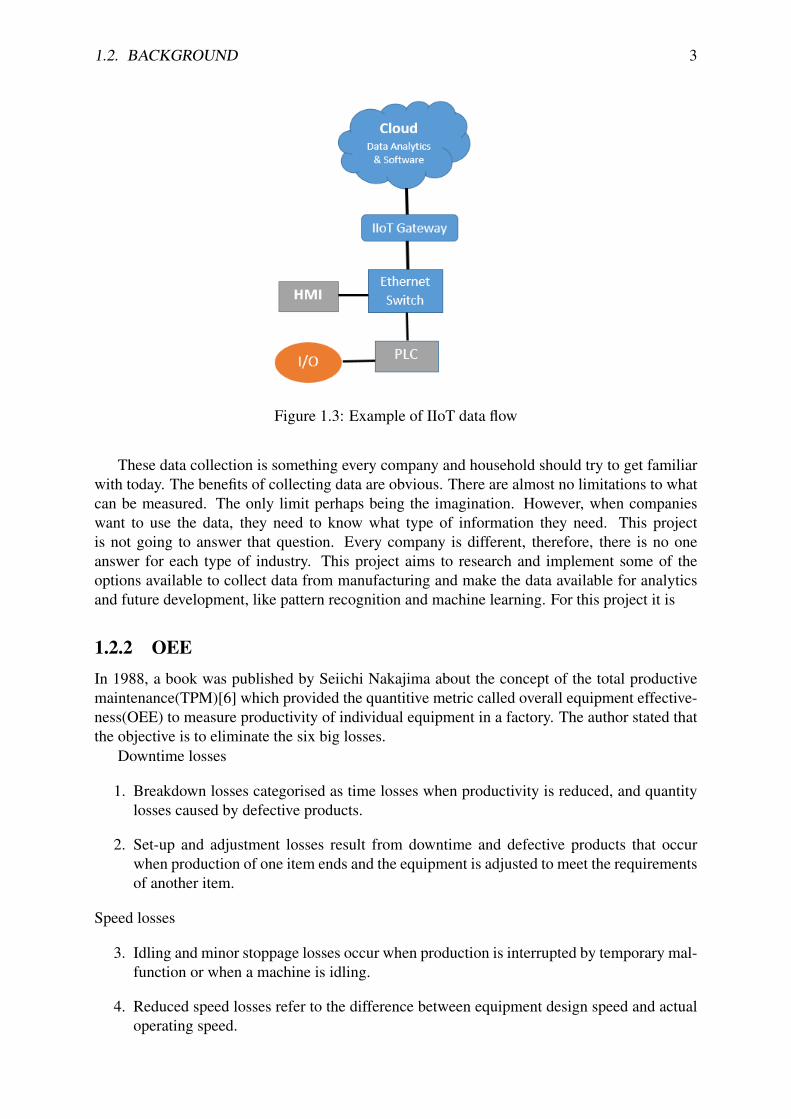
The "Industrial Internet of Things"(IIoT) is in a way where the IoT concept comes from.The IIoT is a true alphabet soup of technology acronyms. OPC UA, HTTP, REST, JSON,MQTT, CoAP, DDS, AMQP, and the list goes on. The bottom structure is based on connectingsensors, networks, services and applications together. Today most manufacturing companies areimplementing it into their production to collect data and to increase their effectiveness. There isstill many companies that have yet to realize the benefits of this. The biggest problem with IIoTtoday is not connecting the sensors; it is how the data is collected. The problem with industrialcomputers is that they are often not very accessible for communication to the outside of thefactory world. There needs to be a gateway that reads the data and send it to the cloud. Forvisual explanation, figure1.3 shows where the gateway is used to connect the isolated controlsystem to the cloud.
1.2. BACKGROUND 3
Figure 1.3: Example of IIoT data flow
These data collection is something every company and household should try to get familiarwith today. The benefits of collecting data are obvious. There are almost no limitations to whatcan be measured. The only limit perhaps being the imagination. However, when companieswant to use the data, they need to know what type of information they need. This projectis not going to answer that question. Every company is different, therefore, there is no oneanswer for each type of industry. This project aims to research and implement some of theoptions available to collect data from manufacturing and make the data available for analyticsand future development, like pattern recognition and machine learning. For this project it is
1.2.2 OEEIn 1988, a book was published by Seiichi Nakajima about the concept of the total productivemaintenance(TPM)[6] which provided the quantitive metric called overall equipment effective-ness(OEE) to measure productivity of individual equipment in a factory. The author stated thatthe objective is to eliminate the six big losses.
Downtime losses
1. Breakdown losses categorised as time losses when productivity is reduced, and quantitylosses caused by defective products.
2. Set-up and adjustment losses result from downtime and defective products that occurwhen production of one item ends and the equipment is adjusted to meet the requirementsof another item.
Speed losses
3. Idling and minor stoppage losses occur when production is interrupted by temporary mal-function or when a machine is idling.
4. Reduced speed losses refer to the difference between equipment design speed and actualoperating speed.

4 CHAPTER 1. INTRODUCTION
Quality losses
5. Quality defects and rework are losses in quality caused by the malfunctioning of theproduction equipment.
6. Start-up losses are yield losses that occur during the early stages of production, frommachine start-up to stabilisation.
The OEE calculations takes these 6 big losses and gathers them into one number that rep-resents the effective operating rate of the equipment or a production line. It measures keyfactors in production, availability, performance and quality rate to find the percentage of timethe equipment or line is operating effectively. This percentage shows the comparison betweenthe produced product and what could have been produced. It is calculated as follows:
OEE = A ∗ P ∗Q (1.1)
AvailabilityRate(A) =OperatingT ime(hrs)
LoadingT ime(hrs)∗ 100 (1.2)
PerformanceEfficiency(P ) =TheoreticalCycleT ime(hrs) ∗ ActualOutput(Units)
OperatingT ime(hrs)(1.3)
QualityRate(Q) =TotalProduction−DefectAmount
TotalProduction(units)∗ 100 (1.4)
The availability rate is the measured total time the system is not operating. The reasoncould be breakdown, adjustments or other stoppages. It calculated as the ratio between actualoperating time and the planned time available. The performance rate is the ratio of actualoperating speed of the equipment and the ideal speed. The quality rate only looks at qualitylosses. Therefore, it is perhaps the most tricky part in the OEE. There could be multiple reasonsfor losses which may be hard to identify. Hence, it should be kept simple in order to makecalculations easier. However, what isn’t measured can’t be improved, therefore, it needs to belooked at by production managers. What data should be collected depends on the type and howmany variables. When the process is really complex, it would be optimal to break down theprocess into groups and measure the data as illustrated in figure3.6.
Figure 1.4: Flow chart proposal to measure OEE in a production line

1.3. REQUIREMENTS FOR THE SYSTEM 5
OEE measurements can be as simple as ON or OFF data. Therefore, the data representationcould be as easy to display as shown in figure 1.5 where each box represents one hour. Greenfor production ON, and red for OFF. Further evaluation might not be needed to measure OEE.Hence, a simple device might be used without having to connect to the production equipment.
Figure 1.5: Example of visual presentation of OEE measurement results made in GoogleSpreadsheet.
1.3 Requirements for the systemFunctional Requirements (FR) and Design Parameters (DP) strategy.
FR1 Read data from device
DP1 Set up communication protocol on device to enable connection to the Internet or a Gate-way device
FR2 Decide what data to collect and time interval
DP2 Set up server application that can send/receive data from IoT device
FR3 Send the data to cloud
DP3 Set up cloud database
FR4 Sort the data for analysis
DP4 Design a program to read the data and forward it to the right place

6 CHAPTER 1. INTRODUCTION
1.4 Structure of thesisThe thesis is organized as follows: Chapter 2 describes the design process for the prototypesthat were made and also talks about design suggestions for future design projects. Chapter 3presents the results of testing the prototypes and discusses the usage opportunities the solutionhas. Chapter 4 discusses the results of these solutions. Chapter 5 concludes this thesis andAppendix A presents programming code used, installation guide of the solutions and otherrelated material.

7
Chapter 2
The design of the solutions
In this chapter the design process behind different methods of data transfer is reviewed and thedifferent aspects which can be seen in the design flow in figure 2.1. Data is collected in a localarea network and sent to a cloud based server where the data can be analyzed.
Figure 2.1: Flow chart of design parameter
The original plan was to send data straight from the PLC to the cloud. The problem withthe Unitronics PLC is lack of communication protocols. Therefore, an alternate solution wasneeded. The solution included an IoT gateway device. It is sometimes used to provide the con-nection and translation between devices and the cloud. A gateway device has many advantages,such as:
• Translate different protocols and other interoperability tasks
• Condense data so it can be sent to the cloud over a single link

8 CHAPTER 2. THE DESIGN OF THE SOLUTIONS
• Store the data in a local database if constant connection to the cloud is not available orneeded
• Provide real time clock, with battery backup, to provide accurate timestamp for devices.
As stated in Chapter1 this project was supported by Samey which offers a wide selectionof automation solution. In addition, the industrial computers from Unitronics and Red Lionwere supplied. As a result, this project focuses on solutions with the use of these computersas data source. This chapter lists different types of combinations that were tested, followed bythe description of the design process behind some of the prototypes that were made to meet therequirements discussed in chapter1.3 in addition to some suggestions for future development.The setup process for these prototypes is explained in more details in AppendixA.
2.1 Unitronics PLC/HMI - CloudUnitronics makes HMI PLCs that are very compact and have a touchscreen, multiple I/O op-tions, are easy to use, and are sold at affordable price. The software application for it is free andeasy to use, called Visilogic. It is programmed by using Ladder logic and is used to develop thePLC/HMI application in one environment. It can configure hardware and communication overEthernet. Ladder is based on boolean principals and follows IEC 1131-3 conventions[7].
The Unitronics V350-35-T2 model that was used for this prototype has an Ethernet port andcan communicate with MODBUS over TCP/IP[9]. MODBUS is an application layer messagingprotocol positioned at level 7 of the OSI model see figure2.2.
Figure 2.2: The 7 layer OSI model[8]
MODBUS TCP/IP is a request/reply protocol and con-sists of an application data unit (ADU) and a proto-col data unit (PDU). The data is stored in 2-byte reg-isters. To request data from the device over ModbusTCP/IP, a software called Node-Red was used, a toolfor wiring together hardware devices, APIs, and onlineservices in a very creative way. It’s a browser basedflow editor that is built on Node.js and therefore canrun on a cloud based server. Nodes are wired togetherto make a flow, each node is a JavaScript function soit can be programmed to do multiple things. As seenin figure 2.4 Node-Red was configured to use the ReadHolding Register function and read contiguous blocksof registers. The maximum size of a Modbus proto-col data unit is 253 bytes. In the request, 3 bytes areused by a function code (1 byte) and the starting register address (2 bytes). Two bytes areused for the amount of registers to read, therefore the maximum is 125 16-bit registers. Theresponse consists of 1 byte for the function code, 1 byte for count and the remaining for thevalues needed to be read out[10]. In this design feature the MODBUS information data ispassed to TCP where it adds information and gives it to IP. The IP protocol places the datain a packet and transmits it. TCP must establish a connection between the master(client inMODBUS TCP/IP) and the slave(server). The slave waits for information from the master andonce a connection is established, data can be transferred. One packet consists of an Ethernet

2.1. UNITRONICS PLC/HMI - CLOUD 9
header(14 bytes), IP header(20 bytes) and TCP header(20 bytes), which encapsulate the Mod-bus ADU (8 + x bytes) and the Ethernet checksum (4 bytes). Therefore, each packet has asize of 14+20+20+8+x+4=66+x bytes. For the "Read Holding Register" request, the packetsize with x=4 bytes is 70 bytes. The response depends on the amount of requested values N.With x=1+2·N bytes, the response packet has a size of 67+2·N bytes. The ACK is an emptyTCP packet with some activated option flags and has a size of 58 bytes for header overhead +6 padding bytes, due to the fact, that every Ethernet frame must be at least 64 bytes. Based onthese numbers, the request-response block is of size 70+2·64+67+2·N=265+2·N bytes, whichis transferred each second per Modbus device[11].
Figure 2.3: Outlook of the Visilogic software application with a MODBUS configuration func-tion block
As seen in figure2.3, the configuration asks for Ethernet card initialization and a MODBUSfunction block where the Ethernet socket and port are defined. By default socket 2 communi-cates over TCP over port 502 which is configured for MODBUS communication.
The Node-Red application can be installed on all types of computer operating systems thatcan run JavaScript. There is a MODBUS TCP library for Node-Red which is easy to use. Thedebug node shows the registers coming from the PLC see figure 2.4.
Another option for this PLC, is to send a HTTP GET request locally. The Node-Red can alsobe configured for HTTP GET to request values for various time periods or request live valueswhich are the last current values in the PLC memory. The GET URL for a request consists ofsome project parameters and the request parameters, such as device ID and the desired data.For each measurement type, the device ID and data are appended to the URL. And because thedesired data is mapped to different string values instead of simple small numbers, the URL sizefluctuates and increases depending on the data size. The response HTTP header has a fixed

10 CHAPTER 2. THE DESIGN OF THE SOLUTIONS
Figure 2.4: Node-Red configured as a Master to read from the PLC
size of 127 bytes and the HTTP body depends on the amount of requested N data values. Theresponse contains data in a JSON format which includes a time stamp, device ID and requesteddata value. The size of the HTTP body can be approximated: x=40+N·31+N·38 bytes with40-byte JSON overhead, N·31 bytes for the measurements, and N·38 bytes for the timestamps.Therefore, the HTTP response has a size of 167+N·31+N·38 bytes. With Ethernet, IP Header,etc., the whole packet size is 225+N·31+N·38 bytes. For a full request-response block, the sizeis 485+28·N/3+69·N bytes[12]. The HTTP GET request function in Visilogic can be seen infigure 2.5 below.
Figure 2.5: Visilogic Ladder configured to send a HTTP GET request.
When the communication is established with the PLC, the JSON string[13] can be splitand values appended individually and forwarded in the Node-Red application. The Node-Redoffers a wide selection of data forwarding options. It is possible to send the data to GoogleSpreadsheet by making a HTTP request to Google Form and in the Spreadsheet make a sub-scription to those Form Responses. Then you have a timestamped data rolling automaticallyinto Spreadsheet where it can be analyzed. Other possibility tested was Node-Red to send thedata to a service from Microsoft called Azure IoT Hub. It stores the data in the cloud where it

2.2. UNITRONICS PLC - RED LION HMI - FTP SERVER 11
can be viewed in Microsoft Power BI, data analytics tool. Set up process of the prototype is ininstruction manual in Appendix A.
2.2 Unitronics PLC - Red Lion HMI - FTP ServerCrimson software application is used to configure the HMI operator made by Red Lion. TheHMI can communicate with 300 protocols[14], it is used to interpret and collect the data sentfrom each device over Ethernet or other protocols. For this prototype the HMI was connected to4 Unitronics PLCs on the same LAN over Ethernet. Therefore, the HMI acts as a IoT gatewaydevice as described in the beginning of this chapter.
The Red Lion Crimson application has a built in driver called UNITRONICS PCOM ASCIITCP/IP MASTER. It allows the Red Lion to access all the data values, in the PLCs as seen infigure A.5.
Figure 2.6: Communication protocol between PLC and HMI defined in the Crimson
The Crimson IDE offers a "Sync Manager" where data connection to FTP Server is estab-lished and the data logs are sent to the server. In the Data Logger function, there is an option toset up a data log and set which integers from the connected devices should be logged to the datalogger. There is also options to choose the rate of measurements and how many each file holds.The FTP server is running a php based web host. It reads the CSV file that is sent from theHMI, renames it and gives it a unique URL. In Google Spreadsheet offers users to make theirown script that runs in the background of the Spreadsheet. So there is a script running in thebackground that imports the CSV files from the FTP server automatically at user defined rate.

12 CHAPTER 2. THE DESIGN OF THE SOLUTIONS
In the Spreadsheet the data can be analyzed for OEE. See instruction manual for this method inAppendix A.
2.3 Future research suggestionsOther options that were tested but not implemented through the whole process. In general theseare research suggestions for future development.
2.3.1 Data dashboardThere needs to be a user interface where they can access the data and analyze them in a simpleway. Data dashboard is the key to making this into an appealing product to buy.
2.3.2 ArduinoSensors can be connected to an Arduino to receive data. Furthermore, there is a possibility toattach an Ethernet Shield on the Arduino that allows it to connect to a network. It is based on theWiznet W5100 ethernet chip [15]. The Wiznet W5100 provides a network (IP) stack capableof both TCP and UDP communication. It supports up to four simultaneous socket connections.The Arduino can connected with sensors and it can be used to send a JSON script as an Ethernetpackage.
2.3.3 dweet.ioDweeting is a web based RESTful API service that allows data to be sent as a HTTP query. Thedata source sends data as unique URL, where the slave knows the recipe of the message bodyand can filter out the data values. The query strings:https://dweet.io/dweet/for/my-thing-name?hello=world
is filled out with the unique name of the device and put into the string where it says "my thingname" and after the question mark comes the data string.
2.3.4 Machine learningAs the design of the solution evolves and it shows that it is stable and secure. The next stepwould be to implement machine learning into the design and offer customers to use the data thisproduct has been providing with the goal to make the system more automatic. Computers canlearn patterns and take action based on the data to increase the OEE[16].
Figure 2.7: Machine learning design flow

13
Chapter 3
Testing and Usage
3.1 TestingThis chapter contains results from testing various combinations of devices.
3.1.1 PLC to IoT Gateway
The MODBUS TCP/IP communication tests between the Unitronics PLC and Node-Red appli-cation in the gateway device were successful. Node-Red is easy to customize, it offers variousways to manipulate the data received from the PLC. For example, a JavaScript function can beprogrammed to do calculations or add anything needed to the data before it forwards it to thecloud. Tests were performed with the use of both a Raspberry PI 3 and a HP 850 G2 laptop PCas the IoT gateway running the Node-Red application successfully. As seen in the Node-Redflow in figure 3.1 below. The first node is the MODBUS TCP/IP communication establishingconnection to the PLC and reading the holding registers. Thereafter the incoming data array ispassed into a function node that splits the array and identifies each data register whereas the PLCdoes not. The user knows where the data starts and ends, therefore he knows how the payload isconfigured and uses the function node to identify the values he wants to be sent. Thereafter, aninjection node takes the new payload from the previous function node and passes it into anotherfunction node that passes the URL parameters before it gets sent to Google Spreadsheet as aHTTP GET request.
Figure 3.1: Example of the testing flow in Node-Red reading holding registers in PLC overMODBUS and send it to Google Spreadsheet

14 CHAPTER 3. TESTING AND USAGE
Wireshark can be used to inspect the MODBUS TCP/IP query/response packets being sentand calculate the overhead latency and the bandwidth need. The size of transferred packetsdepend on the amount of registers to be read. This transaction can be seen in figure 3.2 wherethe IP address of PC is 10.2.28.19 and the PLC is 10.2.28.50. Tests were performed on the RULAN.
Figure 3.2: MODBUS communication between Master and Slave
Tests were successfully made sending the message payload from the PLC to Node-Red andforwarding it to a cloud server from Azure, see figure 3.3.
Figure 3.3: Node-Red flow reading MODBUS TCP/IP and sending it to the Microsoft AzureIoT Hub
3.1.2 Red Lion HMISuccessful tests were concluded with a Red Lion HMI operator as the gateway device whichgathered data from 4 Unitronics PLCs locally. The Crimson software has a built-in data loggerand it can send the data as a CSV file to an ftp server..
The data logger was configured to update measurements every minute to the log and log for60 minutes before sending the CSV file to the FTP server. Figure 3.5 shows the data in GoogleSpreadsheet, there is a script running that automatically imports the CSV files so they can beanalyzed.
In the Google Spreadsheet users can analyze the data and create data tables with calculationsand measure OEE for example using the pivot table and graph functions. The script collects all24 files created per day and puts them into the same sheet so OEE measurements can be madeeasier for each day. Example of usage can also be seen in Chapter3.4 below.

3.2. USAGE 15
Figure 3.4: FTP server with data from HMI rolling in
Figure 3.5: Google Spreadsheet showing data imported, going from the HMI gateway device tothe FTP server where the Spreadsheet imports it from
3.2 Usage
These applications can be used by anyone with knowledge of computer programming and Eth-ernet protocols. Hopefully with the help of the user guide in appendix A, anyone interested canuse this solution and tailor it to their needs. The gateway device acts as a hub which all kindsof devices can be connected to. The basic idea is to increase efficiency. There is no limit onhow to use the data available. However, further development of this application is difficult toanswer. In order to get some idea of the capabilities of the application, two use cases will bediscussed.

16 CHAPTER 3. TESTING AND USAGE
3.3 Use case IFor use case 1, a fish factory in Iceland has a production line where fish is processed, packagedaccording to type and class. Thereafter the packaging is distributed on a pallet by type or classfor shipping. The owner of the factory wants to convert the factory into a "smart factory". Withthe application, there are multiple options. First, a list of possibilities that are achievable withour solution. For this case, it is assumed that we are using a Raspberry PI with Node-Red.
• Connect to the computer that knows what fresh fish is coming into the factory before it isfed to the production line. Buffer 1
• Connect to the computer at the beginning of the production line to get data about whattype or class. Buffer 2
• Connect to the computer that controls the distribution of packaging. Buffer 3
We could perform various OEE measurements with the use the data read by all the com-puters to see where improvements can be made. For example if these numbers are visible tothe workers in the factory, they could see wether there is a difference in load on the productionline. Perhaps if there is too much load in the beginning where fish is processed, the workers inthe loading department have no product to load, they could be relocated for a period to help outelsewhere which could even out the overall effectiveness of the production system. This systemin a very simple visual can be seen in figure 3.6.
Figure 3.6: Flow chart proposal to measure OEE in a production line
To measure the OEE factor these are the parameters needed to be found.
1. Availability A
• To find the availability, see equation 1.2 as we would need operating time and load-ing time. Operating time is the length of each shift which is usually a constant.The loading time could be a counter sensor at the beginning of the line. Thereafter,calculate the ratio of the theoretical max load it can take
2. Performance efficiency P
3.4. USE CASE II 17
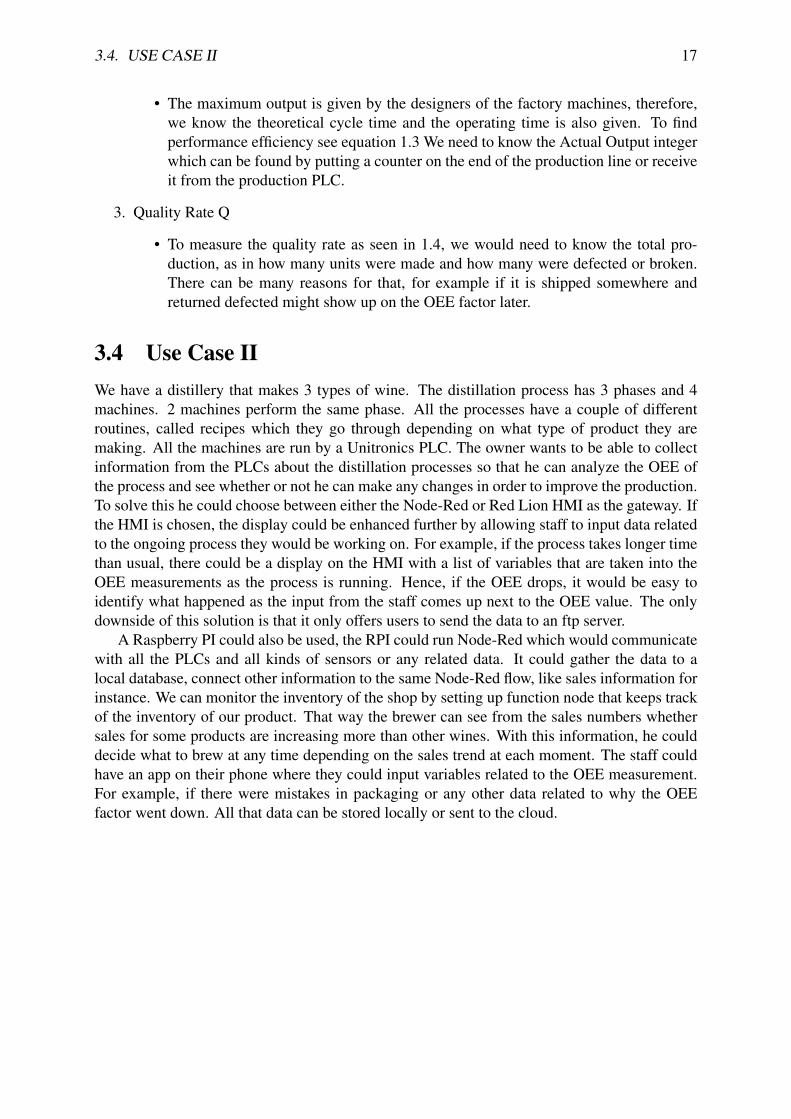
• The maximum output is given by the designers of the factory machines, therefore,we know the theoretical cycle time and the operating time is also given. To findperformance efficiency see equation 1.3 We need to know the Actual Output integerwhich can be found by putting a counter on the end of the production line or receiveit from the production PLC.
3. Quality Rate Q
• To measure the quality rate as seen in 1.4, we would need to know the total pro-duction, as in how many units were made and how many were defected or broken.There can be many reasons for that, for example if it is shipped somewhere andreturned defected might show up on the OEE factor later.
3.4 Use Case IIWe have a distillery that makes 3 types of wine. The distillation process has 3 phases and 4machines. 2 machines perform the same phase. All the processes have a couple of differentroutines, called recipes which they go through depending on what type of product they aremaking. All the machines are run by a Unitronics PLC. The owner wants to be able to collectinformation from the PLCs about the distillation processes so that he can analyze the OEE ofthe process and see whether or not he can make any changes in order to improve the production.To solve this he could choose between either the Node-Red or Red Lion HMI as the gateway. Ifthe HMI is chosen, the display could be enhanced further by allowing staff to input data relatedto the ongoing process they would be working on. For example, if the process takes longer timethan usual, there could be a display on the HMI with a list of variables that are taken into theOEE measurements as the process is running. Hence, if the OEE drops, it would be easy toidentify what happened as the input from the staff comes up next to the OEE value. The onlydownside of this solution is that it only offers users to send the data to an ftp server.
A Raspberry PI could also be used, the RPI could run Node-Red which would communicatewith all the PLCs and all kinds of sensors or any related data. It could gather the data to alocal database, connect other information to the same Node-Red flow, like sales information forinstance. We can monitor the inventory of the shop by setting up function node that keeps trackof the inventory of our product. That way the brewer can see from the sales numbers whethersales for some products are increasing more than other wines. With this information, he coulddecide what to brew at any time depending on the sales trend at each moment. The staff couldhave an app on their phone where they could input variables related to the OEE measurement.For example, if there were mistakes in packaging or any other data related to why the OEEfactor went down. All that data can be stored locally or sent to the cloud.

18

19
Chapter 4
Results and discussion
4.1 Benefits of OEEThe real value of collecting data and doing OEE calculations was tested on the use case II inChapter 3.4 where one sector of the production line was measured. Output from the productionwas collected at the end of each week. The results can be seen in figure 4.1. However theresults were not analyzed until week 40. The results showed the production manager the trendof the output which helped identify the cause of the fluctuations. By using data analytics theproduction manager was able to make changes and the graph shows that productivity increased.
Figure 4.1: OEE measurement of low wine output measured for 46 weeks
Studying the numbers further to evaluate the real value after the data collection started canbe seen in table below.
Week Year Value +Value p.year +Value p.monthAverage 1.680 84.000 168.000.000 0 0
Max 2.708 135.400 270.800.000 102.800.000 2.056.000Avg last 8 2.110 105.491 210.981.250 42.981.250 859.625
Where the theoretical max output is 3.000L. Average produced 1.680. Max produced is2.708L in week 45. Average produced last 8 weeks is 2.110L. The target OEE factor is set to
20 CHAPTER 4. RESULTS AND DISCUSSION
75% If the market value for each liter is 2.000 ISK,- we can find the value. Finding the addedvalue after production has been analyzed shows an increased income of nearly 43 million ISKper year if the productivity keeps the same pace as last 8 weeks. This is only a small exampleof how easy it is to quickly increase productivity and profit using data analytics. This could bea great starting point for OEE measurements. Start with simple data like output quantity, workfrom there to build better understanding of the whole system.
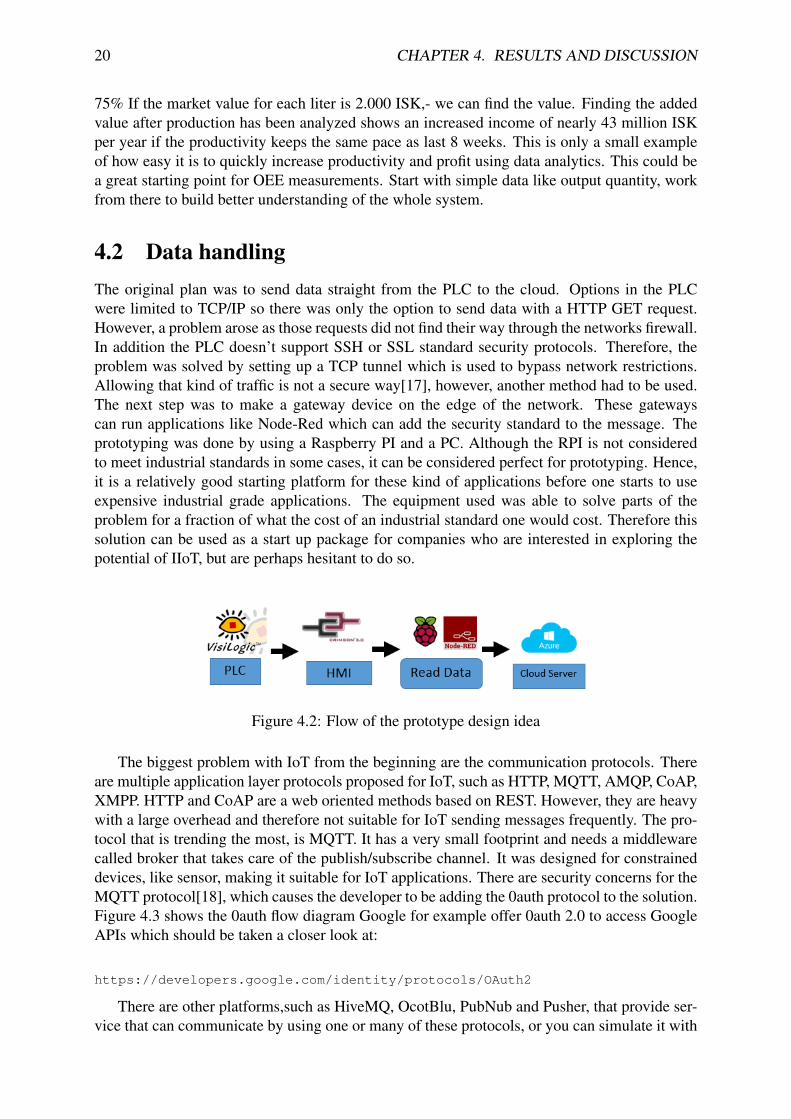
4.2 Data handlingThe original plan was to send data straight from the PLC to the cloud. Options in the PLCwere limited to TCP/IP so there was only the option to send data with a HTTP GET request.However, a problem arose as those requests did not find their way through the networks firewall.In addition the PLC doesn’t support SSH or SSL standard security protocols. Therefore, theproblem was solved by setting up a TCP tunnel which is used to bypass network restrictions.Allowing that kind of traffic is not a secure way[17], however, another method had to be used.The next step was to make a gateway device on the edge of the network. These gatewayscan run applications like Node-Red which can add the security standard to the message. Theprototyping was done by using a Raspberry PI and a PC. Although the RPI is not consideredto meet industrial standards in some cases, it can be considered perfect for prototyping. Hence,it is a relatively good starting platform for these kind of applications before one starts to useexpensive industrial grade applications. The equipment used was able to solve parts of theproblem for a fraction of what the cost of an industrial standard one would cost. Therefore thissolution can be used as a start up package for companies who are interested in exploring thepotential of IIoT, but are perhaps hesitant to do so.
Figure 4.2: Flow of the prototype design idea
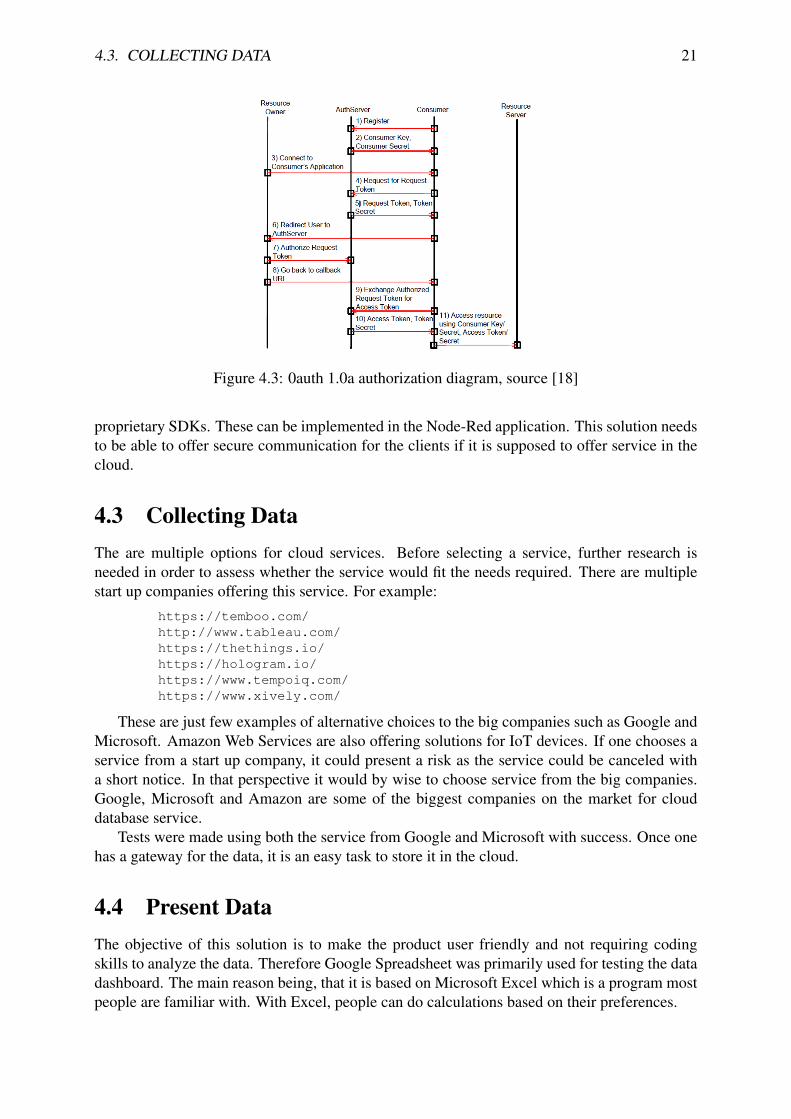
The biggest problem with IoT from the beginning are the communication protocols. Thereare multiple application layer protocols proposed for IoT, such as HTTP, MQTT, AMQP, CoAP,XMPP. HTTP and CoAP are a web oriented methods based on REST. However, they are heavywith a large overhead and therefore not suitable for IoT sending messages frequently. The pro-tocol that is trending the most, is MQTT. It has a very small footprint and needs a middlewarecalled broker that takes care of the publish/subscribe channel. It was designed for constraineddevices, like sensor, making it suitable for IoT applications. There are security concerns for theMQTT protocol[18], which causes the developer to be adding the 0auth protocol to the solution.Figure 4.3 shows the 0auth flow diagram Google for example offer 0auth 2.0 to access GoogleAPIs which should be taken a closer look at:
https://developers.google.com/identity/protocols/OAuth2
There are other platforms,such as HiveMQ, OcotBlu, PubNub and Pusher, that provide ser-vice that can communicate by using one or many of these protocols, or you can simulate it with
4.3. COLLECTING DATA 21
Figure 4.3: 0auth 1.0a authorization diagram, source [18]
proprietary SDKs. These can be implemented in the Node-Red application. This solution needsto be able to offer secure communication for the clients if it is supposed to offer service in thecloud.
4.3 Collecting DataThe are multiple options for cloud services. Before selecting a service, further research isneeded in order to assess whether the service would fit the needs required. There are multiplestart up companies offering this service. For example:
https://temboo.com/http://www.tableau.com/https://thethings.io/https://hologram.io/https://www.tempoiq.com/https://www.xively.com/
These are just few examples of alternative choices to the big companies such as Google andMicrosoft. Amazon Web Services are also offering solutions for IoT devices. If one chooses aservice from a start up company, it could present a risk as the service could be canceled witha short notice. In that perspective it would by wise to choose service from the big companies.Google, Microsoft and Amazon are some of the biggest companies on the market for clouddatabase service.
Tests were made using both the service from Google and Microsoft with success. Once onehas a gateway for the data, it is an easy task to store it in the cloud.
4.4 Present DataThe objective of this solution is to make the product user friendly and not requiring codingskills to analyze the data. Therefore Google Spreadsheet was primarily used for testing the datadashboard. The main reason being, that it is based on Microsoft Excel which is a program mostpeople are familiar with. With Excel, people can do calculations based on their preferences.

22

23
Chapter 5
Discussion
5.1 ConclusionThis thesis hopefully presents some insight into the trending world of IIoT devices and theircapabilities. This thesis forms the basis of future product development for an IIoT gatewaydevice for the manufacturing industry. Hopefully this thesis can give some context on how tomake something similar, and how to collect data with the objective to provide real time dataanalysis of OEE. Many of these parts can be used independent from each other. This projecttouched many different job titles and previously studied material was used to solve difficultproblems. OEE is a powerful tool that should be used to drive improvements for users. Thetarget is always changing, be it small or large increments.
5.2 Future workThe demand for this kind of product is growing rapidly as more companies are getting familiarwith the term IIoT and Big Data. Further development of this project could entail countlesspossibilities. As data handling can be considered one of the most complicated areas for furtherdevelopment, a collaboration with a professional IT company could be advantageous for bothparties as an IT company could be more familiar with networking protocols and security issues.Raspberry PI is a very solid IoT gateway solution for small projects. Other factors to considerinclude further development on the data dashboards display, getting a better understanding ofthe data, and security issues have to be looked at to make sure the product is safe to use.
Perhaps what this as a product lacks most importantly, it needs someone to sell the idea ofOEE to potential buyers. This product needs someone to:
• Define and establish effective system for collecting, analyzing and report OEE data inreal time.
• Understand the process and establish where the OEE data will be collected and how itcan be used to make improvements.
• Establish effective methods to control both systems and process to make sure OEE isintegrated for the production
As a future final project suggestion would be either in the field of operations analysis or BigData analysis for IIoT data.

24
25
Bibliography
[1] jeferrb, Network iot internet of things, May 2015. [Online]. Available: https://pixabay.com/p-782707/.
[2] A. Pye, “The internet of things: Connecting the unconnected”, Engineering & Technol-ogy, vol. 9, no. 11, pp. 64–64, 2014.
[3] C. J. Bartodziej, “The concept industry 4.0”, in The Concept Industry 4.0 : An EmpiricalAnalysis of Technologies and Applications in Production Logistics. Wiesbaden: SpringerFachmedien Wiesbaden, 2017, pp. 27–50, ISBN: 978-3-658-16502-4. DOI: 10.1007/978-3-658-16502-4_3. [Online]. Available: http://dx.doi.org/10.1007/978-3-658-16502-4_3.
[4] H. Bauer, M. Patel, and J. Veira, “The internet of things: Sizing up the opportunity”,McKinsey at http://www. mckinsey. com/insights/high_tech_telecoms_internet/the_internet_of_things_sizing_up_the_opportunity (visited november 29, 2016), 2014.
[5] M. Bowne, Iiot in reverse, Nov. 2015. [Online]. Available: http://profinews.com/2015/11/iiot-in-reverse/.
[6] S. Nakajima, Introduction to tpm: Total productive maintenance, ser. Preventative Main-tenance Series. Productivity Press, 1988, ISBN: 9780915299232. [Online]. Available:https://books.google.is/books?id=XKc28H3JeUUC.
[7] R. W. Lewis, Programming industrial control systems using iec 1131-3, 50. Iet, 1998.
[8] H. Zimmermann, “Osi reference model-the iso model of architecture for open systemsinterconnection”, IEEE Transactions on communications, vol. 28, no. 4, pp. 425–432,1980.
[9] Unitronics, Visilogic knowledgebase v230-21-g23, Online, May 2016. [Online]. Avail-able: http://unitronicsplc.com/Download/SoftwareHelp/VisiLogic_Knowledgebase/VisiLogic.htm.
[10] I. Modbus, “Modbus messaging on tcp/ip implementation guide v1. 0b”, North Grafton,Massachusetts (www. modbus. org/specs. php), 2004.
[11] S. Kenner, R. Thaler, M. Kucera, K. Volbert, and T. Waas, “Comparison of smart grid ar-chitectures for monitoring and analyzing power grid data via modbus and rest”, EURASIPJournal on Embedded Systems, vol. 2017, no. 1, p. 12, 2017.
[12] R. Fielding and J. Reschke, Rfc 7230: Hypertext transfer protocol (http/1.1): Messagesyntax and routing, 2014.
[13] D. Crockford, “The application/json media type for javascript object notation (json)”,2006.
[14] R. Lion, G3 hmi panel. [Online]. Available: http://www.redlion.net/products/industrial-automation/hmis-and-panel-meters/hmi-operator-panels/g3-hmis.

26 BIBLIOGRAPHY
[15] Wiznet. (2008). W5100 datasheet version 1.1.6, [Online]. Available: https://www.sparkfun.com/datasheets/DevTools/Arduino/W5100_Datasheet_v1_1_6.pdf.
[16] J. Gubbi, R. Buyya, S. Marusic, and M. Palaniswami, “Internet of things (iot): A vision,architectural elements, and future directions”, Future Generation Computer Systems, vol.29, no. 7, pp. 1645–1660, 2013.
[17] S. Kent and K. Seo, “Security architecture for the internet protocol”, Tech. Rep., 2005.
[18] A. Niruntasukrat, C. Issariyapat, P. Pongpaibool, K. Meesublak, P. Aiumsupucgul, and A.Panya, “Authorization mechanism for mqtt-based internet of things”, in CommunicationsWorkshops (ICC), 2016 IEEE International Conference on, IEEE, 2016, pp. 290–295.
27
Appendix A
Instructions manual
A.1 MODBUS TCP/IP in Node-RedThis instruction manual goes through setting up a Raspberry PI and setting up MODBUSTCP/IP comminucation with a PLC and forward it to Microsoft Azure IoT Hub. Keep in mindthat you can use any type of OS as long as it supports JavaScript Node.js. Begin by setting upthe RPI OS Raspbian Jessie full version:
\item https://www.raspberrypi.org/downloads/raspbian/
Next follow this installation manual for Node.js and Node-Red:
https://nodered.org/docs/hardware/raspberrypi
Type in these commands in the Terminal on the RPI to install the MODBUS node, note that allnodes have to be install into the node-red directory to be available in the flow editor:
sudo apt-get install npmsudo npm install -g [email protected] -rcd ~/.node-rednpm install node-red-contrib-modbusifconfig (gives you the IP address of the RPI)
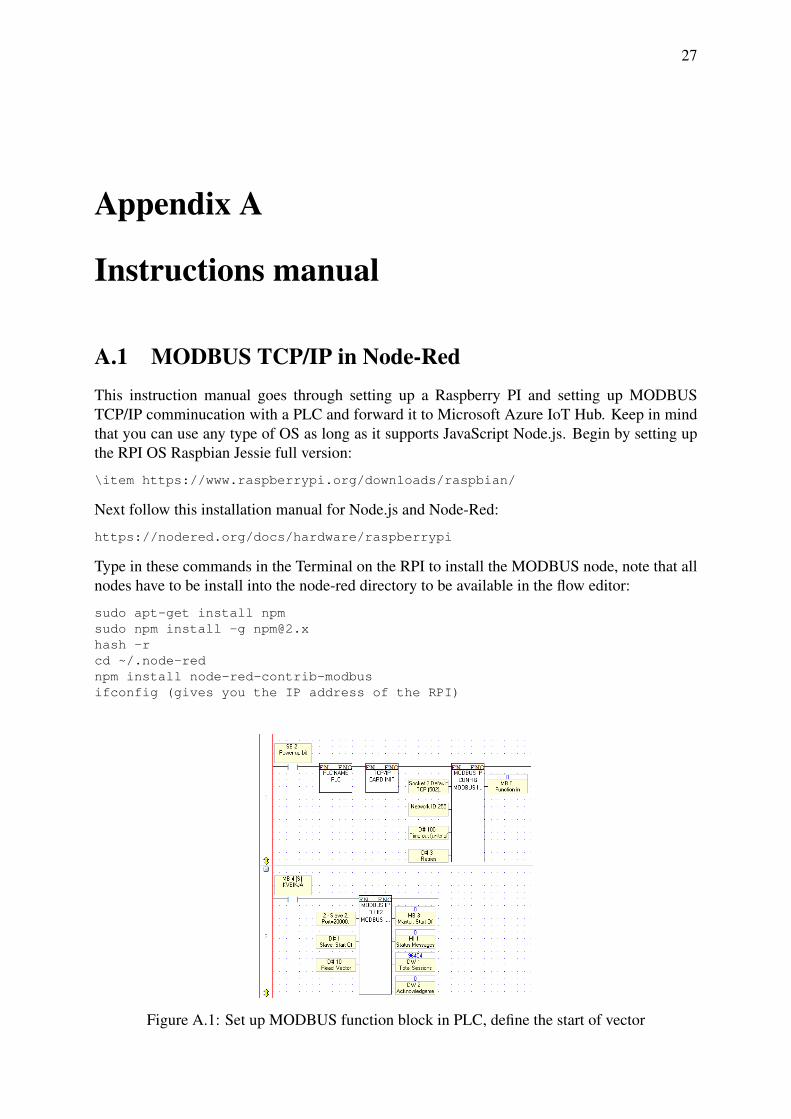
Figure A.1: Set up MODBUS function block in PLC, define the start of vector

28 APPENDIX A. INSTRUCTIONS MANUAL
Find the MODBUS READ node in the node panel and put it in the node, give it a name,choose what you want to read. Here we read Holding Registers, set Address at same as start ofvector in PLC and how many registers. Choose Polla rate, here it is 5 seconds. And define thePLC Server attributes.
Figure A.2: Define MODBUS between RPI and PLC and make sure the address of vector issame as in PLC and IP address
There you have established the data read between the Node-Red and PLC and can manipulatethe data however you want.
A.1.1 Node-Red to Google SpreadsheetHere is an example on how to send the data to Google Spreadsheet by using Google Form:
Goto drive.google.com and choose New->More->Google FormCreate a question with name of variable being sent and as a text answerCreate a new Spreadsheet for this Form or link it to existingAnswer the question once and it will generate this link:https://docs.google.com/forms/d/e/<Your Form ID>/viewform?entry.<Your text
↪→ID>Copy to text editor and we will use it in our Node-Red flowInsert a HTTP request node from the function panel in Node-RedDefine Method as GETAnd from use the URL you copied to text editor and insert ID and payload is
↪→ dataURL: https://docs.google.com/forms/d/<Your Form ID>/formResponse?entry.<
↪→Your text ID key>={{payload.id}}If you want to add data entry just make another question and add:?entry.<Your 2 text ID key>={{payload.id-2}}Payload should be a JSON string with question and data integer
A.1.2 Node-Red to Azure IoT HubHere we send the data to Microsoft Azure IoT Hub. Set up your free account at
https://azure.microsoft.com/en-us/services/iot-hub/

A.2. PLC - HMI - FTP - SPREADSHEET 29
In the Raspberry pi install these and decide which messaging protocol to use. In this examplewe use mqtt.
npm install node-red-contrib-azure-iot-hubnpm install azure-iot-devicenpm install azure-iot-device-mqttnpm install https://github.com/lcarli/NodeRedIoTHub.git
In your Microsoft dashboard go to your IoT Hub in
General->Shared access policies->iothubowner->Connection string primary key↪→:
HostName=.azure-devices.net;SharedAccessKeyName=iothubowner;SharedAccessKey↪→=<copy-this-key>=
copy/paste into the Azure IoT Hub Registry node see in figure A.3
"Register Payload" node is sending the device ID like {"deviceId": "↪→FinalProj"}
Figure A.3: Node-Red setup of Azure IoT Hub
Insert the following into "Send Payload" and select message protocol in "Azure Iot Hub"node see figureA.3.
"Send Payload" node select JSON string and insert{"deviceID": "FinalProj", "key": "<your key>", "Protocol": "mqtt", "Data":
↪→{ <payload JSON string>}}
"Azure IoT Hub" insert protocol of choice and your Hostname, make sure your routers portallow traffic. Use:
http://www.canyouseeme.org/
To see if port is open. Then you can define the update rate of the messages to your IoT Hub,it´s free to receive 8k messages per day.
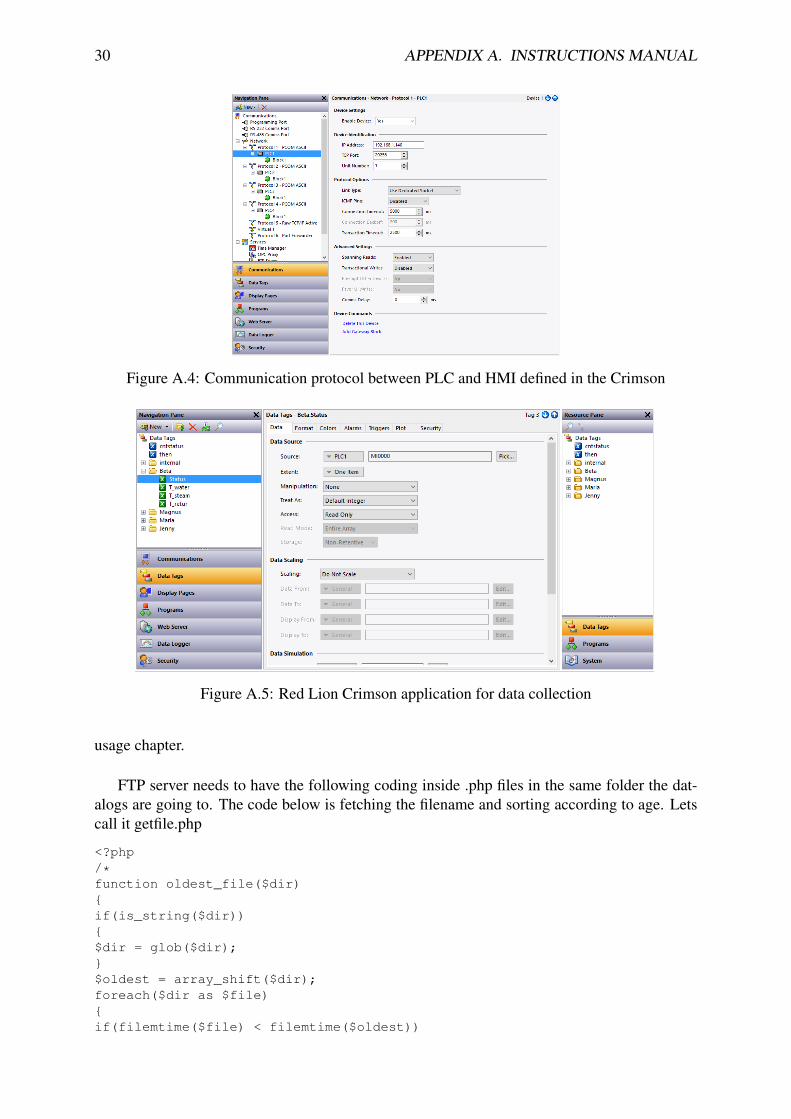
A.2 PLC - HMI - FTP - SpreadsheetCrimson software application is used to configure the HMI operator made by Red Lion[14].The HMI can communicate with 300 protocols, it is used to interpret and collect the data eachdevice is sending over Ethernet or other protocols. Ethernet was used for this design project.
The Red Lion Crimson application has a built in driver called UNITRONICS PCOM ASCIITCP/IP MASTER, it allows the Red Lion to access all the integers that are being used by thePLC as seen in figure A.5.
The sync manager seen in figure A.6 is where data connection to ftp server is establishedand the data logs are sent to the server which was a FTP server running a PHP web service.
In the Data Logger function see figure A.7, is an option to set up a data log and set whichmemory integers should be logged to the data logger. There is also options to choose the updaterate and how many measurements each file holds which will be discussed in more details in the
30 APPENDIX A. INSTRUCTIONS MANUAL
Figure A.4: Communication protocol between PLC and HMI defined in the Crimson
Figure A.5: Red Lion Crimson application for data collection
usage chapter.
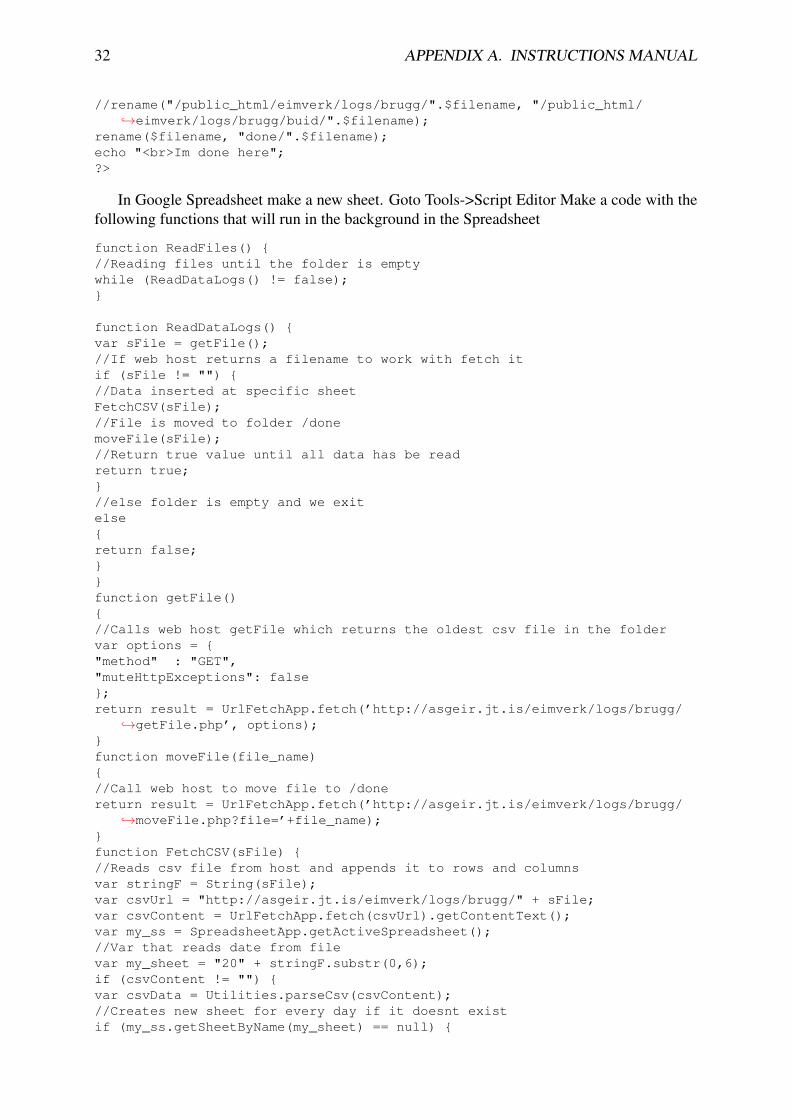
FTP server needs to have the following coding inside .php files in the same folder the dat-alogs are going to. The code below is fetching the filename and sorting according to age. Letscall it getfile.php
<?php/*function oldest_file($dir){if(is_string($dir)){$dir = glob($dir);}$oldest = array_shift($dir);foreach($dir as $file){if(filemtime($file) < filemtime($oldest))

A.2. PLC - HMI - FTP - SPREADSHEET 31
Figure A.6: Crimson software sync manager connection with ftp server
Figure A.7: Data logging in Crimson application
{$oldest = $file;}}return $oldest;}
*/$csv = glob(’*.csv’);echo $csv[0];
Then we make another .php file that moves the file once it has renamed it into a folder calleddone/
<?phperror_reporting(ALL);$filename = $_REQUEST["file"];echo "Moving file $filename";
32 APPENDIX A. INSTRUCTIONS MANUAL
//rename("/public_html/eimverk/logs/brugg/".$filename, "/public_html/↪→eimverk/logs/brugg/buid/".$filename);
rename($filename, "done/".$filename);echo "<br>Im done here";?>
In Google Spreadsheet make a new sheet. Goto Tools->Script Editor Make a code with thefollowing functions that will run in the background in the Spreadsheet
function ReadFiles() {//Reading files until the folder is emptywhile (ReadDataLogs() != false);}
function ReadDataLogs() {var sFile = getFile();//If web host returns a filename to work with fetch itif (sFile != "") {//Data inserted at specific sheetFetchCSV(sFile);//File is moved to folder /donemoveFile(sFile);//Return true value until all data has be readreturn true;}//else folder is empty and we exitelse{return false;}}function getFile(){//Calls web host getFile which returns the oldest csv file in the foldervar options = {"method" : "GET","muteHttpExceptions": false};return result = UrlFetchApp.fetch(’http://asgeir.jt.is/eimverk/logs/brugg/
↪→getFile.php’, options);}function moveFile(file_name){//Call web host to move file to /donereturn result = UrlFetchApp.fetch(’http://asgeir.jt.is/eimverk/logs/brugg/
↪→moveFile.php?file=’+file_name);}function FetchCSV(sFile) {//Reads csv file from host and appends it to rows and columnsvar stringF = String(sFile);var csvUrl = "http://asgeir.jt.is/eimverk/logs/brugg/" + sFile;var csvContent = UrlFetchApp.fetch(csvUrl).getContentText();var my_ss = SpreadsheetApp.getActiveSpreadsheet();//Var that reads date from filevar my_sheet = "20" + stringF.substr(0,6);if (csvContent != "") {var csvData = Utilities.parseCsv(csvContent);//Creates new sheet for every day if it doesnt existif (my_ss.getSheetByName(my_sheet) == null) {

A.2. PLC - HMI - FTP - SPREADSHEET 33
my_ss.insertSheet(my_sheet);}var sheet = my_ss.getSheetByName(my_sheet);//Appends values to file according to date that is in timestampsheet.getRange(1, 1, csvData.length, csvData[0].length).setValues(csvData);}}
In the toolbar is a clock symbol which users can define how frequently the script runs. Forthis project the trigger was set to 60 minutes. Data is now ready to be analyzed. Security factorswere not investigated for this method
The FTP server is hosted atTölvustoð ehfHlíðasmára 17201 KópavogurIceland
www.tolvustod.is

34

35
Appendix B
Hardware and software used
Hardware VersionUnitronics V350-35-T2Red Lion G306Raspberry PI 3 Model B V1.2HP Elitebook 850 G2
Software Version BuildCrimson 3.0 683.002Visilogic Vision OPC 9.8.31 0Visual Studio 2015 14 025431.01Wireshark 2.2.2 g775fb08
Raspberry PIName VersionLinux 4.4.32-v7Node.js 5.12.0Node-Red 0.15.2

36


School of Science and EngineeringReykjavík UniversityMenntavegur 1101 Reykjavík, IcelandTel. +354 599 6200Fax +354 599 6201www.ru.is