ijmss vol.03 issue-05, (may, 2015) issn: 2321-1784...
TRANSCRIPT

IJMSS Vol.03 Issue-05, (May, 2015) ISSN: 2321-1784 International Journal in Management and Social Science (Impact Factor- 4.747)
A Monthly Double-Blind Peer Reviewed Refereed Open Access International e-Journal - Included in the International Serial Directories
International Journal in Management and Social Science http://www.ijmr.net.in email id- [email protected] Page 59
Company analysis of major private banks in India as a part of fundamental analysis
Dr.Madhusudhan Reddy
Associate Professor
DVM College of Business Management, Nalgonda, Telanagna State. India.
Abstract
The study represents the brief idea about Indian banking sector and company analysis under fundamental analysis of private sector banks. Investment decision is a vital part in our economic life. Investment decisions are to be made in a systematic manner with two approaches such as technical and fundamental analysis. The present study aims to analyse the company analysis of major private banks in India with a sample size of three banks such as ICICI, HDFC and Axis Bank for a period from 2009-10 to 2013-14. The present study considers the variables such as Operating Profit Margin, Net Profit Margin, Return On Equity, Earnings Per Share, Price-Earnings Ratio, Dividends Per Share, Dividend Payout Ratio and Compound Annual Growth Rate. In this research paper, I try to evaluate the company analysis by adopting the statistical techniques such as standard deviation, Average, One way Anova and Hypothesis.
Keywords: Fundamental analysis, Operating Profit Margin, Net Profit Margin, Return On Equity, Earnings Per Share, Price Earnings Ratio, Dividend Per Share, Dividend Per Share and CAGR.
Introduction
Without a sound and effective banking system in India, it cannot have a healthy economy. The banking system of India should not only be hassle free but it should be able to meet new challenges posed by the technology and any other external and internal factors. For the past three decades India's banking system has several outstanding achievements to its credit. It is no longer confined to only metropolitans or cosmopolitans in India; in fact, Indian banking system has reached even to the remote corners of the country. This is one of the main reasons of India's growth process. The government's regular policy for Indian bank since 1969 has paid rich dividends with the nationalisation of 14 major private banks of India. Not long ago, an account holder had to wait for hours at the bank counters for getting a draft or for withdrawing his own money. Today, he has a choice. Gone are days when the most efficient bank transferred money from one branch to other in two days. Now it is simple as instant messaging or dial a pizza. Money has become the order of the day.
Fundamental analysis
Fundamental analysis attempts to determine the value of a company by analysing the financial data from the annual report and using other qualitative data about the company and the environment in which they operate. This value is often called 'intrinsic value'. Fundamental analysis assumes that over the long term, a stock price will reflect the company's intrinsic value. So, fundamental analysis an approach to determine “ what ought to be price” otherwise, known as intrinsic or true value of a security.

IJMSS Vol.03 Issue-05, (May, 2015) ISSN: 2321-1784 International Journal in Management and Social Science (Impact Factor- 4.747)
A Monthly Double-Blind Peer Reviewed Refereed Open Access International e-Journal - Included in the International Serial Directories
International Journal in Management and Social Science http://www.ijmr.net.in email id- [email protected] Page 60
Company analysis is the final stage of fundamental analysis. The economic analysis provides the investor a broad outline of the prospects of growth in the economy. The industry analysis helps investors to select the industry in which investment would be rewarding. The company analysis facilitates the investors to select the company where they should invest their money. Company analysis was done based on past five years data available and ratios used are as follows. A conceptual framework for the study is proposed and is presented in the figure 1..
Figure 1: Conceptual framework
Source: Asia Pacific Finance and Accounting Review1.3 (2013): 37-55
A brief review of literature would help the researcher, reader and other research scholars in gaining an insight into the studies, which were made in areas related to the subject of this study. The findings of some of the studies are briefly summarized as follows.
Review of literature
P.Hanmantha Rao and Subendu Dutta (2014) have emphasized that the banking sector has always been one of the important sectors for investment. They analysed how the internal factors influence the investment decisions of investors by considering general and comprehensive profitability ratios.
Hossein Khanifar (2012) analysed the factors which affect prospective investors investment decisions by performing fundamental analysis. The study shows that EPS, profit margin, P/E ratio, sales have highest importance in analysts decision followed by economy related factor and industry related factor.
Mishra, Sarma and Avadhanam (2011) found that Indian banks have experienced significant change in the levels of competition after the advent of liberalization in the 90s and the entry of private players.
FUNDAMENTAL ANALYSIS
Economic
Analysis
Industry
Analysis
Company
Analysis
GNP, GDP, GDCF, GDS,
Savings Rate
Inflation Rate
Exchange Rate
Forex Reserves
Agri Production
Govt. Receipts
Govt. Expenditure BOP
Growth Rate
Swot Analysis
Operating Profit Margin
Net Profit Margin
Return On Equity
Earnings Per Share
Price-Earnings Ratio
Dividend Per Share
Dividend Payout Ratio

IJMSS Vol.03 Issue-05, (May, 2015) ISSN: 2321-1784 International Journal in Management and Social Science (Impact Factor- 4.747)
A Monthly Double-Blind Peer Reviewed Refereed Open Access International e-Journal - Included in the International Serial Directories
International Journal in Management and Social Science http://www.ijmr.net.in email id- [email protected] Page 61
Ramudu and Rao (2006) have analysed the profitability of the three major banks in India such as SBI, ICICI and HDFC for the period from 200-2005 and examined the comparative efficiency of SBI, ICICI and HDFC.
Objectives of the study
1. To analyse the profitability position of the sample banking companies. 2. To make the comparative analysis among the fundamentals of the sample banks.
Methodology
Source of Data
The study is based on secondary data. The data pertaining to sample banks were collected from the annual reports of the respective banks. magazines and journals relating to finance have also been used as sources of data. The present study is descriptive and analytical in nature.
Statistical Tools
To analyse the fundamentals of selected banks, the important statistical techniques such as arithmetic mean, standard deviation, compound annual growth rate (CAGR) and one – way analysis of variance (ANOVA) have been used for the study.
Period of Study
The study covers a period of five years from 2009-10 to 2013-2014.
Sampling
The sample for the present study consists of three major private banks in India such as Industrial Credit and Investment Corporation of India(ICICI), Housing Development Finance Corporation(HDFC) and AXIS bank.
Key variables
The variable that have been adopted for the present study are Operating Profit Margin (OPM), Net Profit Margin (NPM), Return On Equity (ROE), Earning Per Share (EPS), Price-Earnings Ratio (PER), Dividend Per Share (DPS) and Dividend Payout Ratio (DPR).
Hypotheses
H0 = There is no significant difference between the selected variables of the sample banking companies.
HA = There is significant difference between selected variables of the sample banking companies.
Scope of the Study
The research study covers three important major private banks; Industrial Credit and Investment Corporation of India(ICICI), Housing Development Finance Corporation(HDFC) and AXIS bank.

IJMSS Vol.03 Issue-05, (May, 2015) ISSN: 2321-1784 International Journal in Management and Social Science (Impact Factor- 4.747)
A Monthly Double-Blind Peer Reviewed Refereed Open Access International e-Journal - Included in the International Serial Directories
International Journal in Management and Social Science http://www.ijmr.net.in email id- [email protected] Page 62
Limitations of the study
1. The present study is based on only secondary data. 2. Analysis is restricted to only banking sector. 3. Study is only confined to evaluate the company analysis as part of the fundamental analysis of three
major private banks.
Data analysis and interpretation
Operating Profit Margin (OPM): Operating profit margin also known as operating margin is the ratio of operating income divided by net sales, usually presented in percent. It is a measurement of what proportion of a company's revenue is left over after paying for variable costs of production such as wages, raw materials, etc. This ratio is used to measure a company's pricing strategy and operating efficiency. Table 1 shows the operating profit margin of three major private banks for the last five years. It can be clearly seen from the this table that the average operating profit margin of ICICI bank is highest in the three banks followed by HDFC bank and Axis bank. So, we can understand that ICICI bank controls operating expenses effectively than HDFC and Axis bank. Standard deviation is a measure that is used to quantify the amount of variation or dispersion of a set of data values. As compared the standard deviation of OPM of three banks, the OPM of Axis bank has the highest degree of variability.
Table 1. Operating Profit Margin(OPM)
Year ICICI HDFC AXIS
2009-10 29.33 24.36 25.58
2010-11 27.74 19.5 13.67
2011-12 21.37 15.57 10.69
2012-13 18.35 14.90 11.41
2013-14 20.47 17.20 14.40
Average 23.45 18.31 15.15
SD 4.80 3.82 6.03
Source: Annual reports of the banks
Table 2. One - Way Anova for OPM
Source of Variation SS df MS F P-value F crit
Between Groups 175.6080933 2 87.80404667 3.55964035 0.061130533 3.885293835
Within Groups 295.9986 12 24.66655
Total 471.6066933 14
The following hypothesis has been used to compare and test the OPM of the banks.
Null Hypothesis 1 (H01): There is no significant difference between OPM of all the three major private banks.

IJMSS Vol.03 Issue-05, (May, 2015) ISSN: 2321-1784 International Journal in Management and Social Science (Impact Factor- 4.747)
A Monthly Double-Blind Peer Reviewed Refereed Open Access International e-Journal - Included in the International Serial Directories
International Journal in Management and Social Science http://www.ijmr.net.in email id- [email protected] Page 63
According to table 2, since the calculated value (3.5596) is lower than the tabulated value (3.8852) at 5% level of significance, the null hypothesis 1 is accepted and therefore I conclude that there is no significance difference between OPM of ICICI bank, HDFC bank and AXIS bank.
Net Profit Margin (NPM): Net profit margin is the percentage of revenue remaining after all operating expenses, interest, taxes and preference dividend have been deducted from a company's total revenue. Table 3 indicates the net profit margin of the banks selected for the study. The average NPM of Axis bank is higher than other two banks. It is revealed that Axis bank and HDFC bank are controlling the costs properly as compared with ICICI banks whose NPM is 14.51%.
Table 3. Net Profit Margin(NPM)
Year ICICI HDFC AXIS
2009-10 12.13 14.76 16.10
2010-11 15.79 16.18 17.12
2011-12 16.14 15.88 15.47
2012-13 15.74 16.04 15.35
2013-14 12.73 17.28 16.34
Average 14.51 16.03 16.08
SD 1.91 0.90 0.72
Source: Annual reports of the banks
Table 4. One - Way Anova for NPM
Source of Variation SS df MS F P-value F crit
Between Groups 7.972813333 2 3.986406667 2.401941763 0.132626253 3.885293835
Within Groups 19.91592 12 1.65966
Total 27.88873333 14
For testing the NPM of all the three private banks, the below hypothesis is used.
Null Hypothesis 2 (H02): There is no significant difference between NPM of all the three major private banks.
According to table 4, since the calculated value (2.4019) is lower than the tabulated value (3.8852) at 5% level of significance, the null hypothesis 2 is accepted and therefore it is concluded that there is no significance difference between NPM of ICICI bank, HDFC bank and AXIS bank.
Return On Equity (ROE): ROE is a ratio of earnings after taxes and preferred dividend to owner’s equity. It indicates how much profit is generated using the owner’s capital. Table 5 shows the return on equity of the selected banks for the last 5 years. Among three banks, ICICI bank has the highest average ROE followed by HDFC bank with 2.10% and Axis bank with 1.06%. however, there is high degree of variability in the ROE of ICICI bank as compared with other two banks. The Axis bank has least volatility in ROE.

IJMSS Vol.03 Issue-05, (May, 2015) ISSN: 2321-1784 International Journal in Management and Social Science (Impact Factor- 4.747)
A Monthly Double-Blind Peer Reviewed Refereed Open Access International e-Journal - Included in the International Serial Directories
International Journal in Management and Social Science http://www.ijmr.net.in email id- [email protected] Page 64
Table 5. Return On Equity
Year ICICI HDFC AXIS
2009-10 7.79 16.8 19.15
2010-11 9.35 16.52 19.34
2011-12 11.2 18.69 20.29
2012-13 13.1 20.34 18.53
2013-14 14.02 21.28 17.43
Average 11.09 18.73 18.95
SD 2.58 2.10 1.06
Source: Annual reports of the banks
Table 6. One - Way Anova for ROE
Source of Variation SS df MS F P-value F crit
Between Groups 200.0732933 2 100.0366467 24.63234832 5.6471E05 3.885293835
Within Groups 48.73428 12 4.06119
Total 248.8075733 14
To compare and test the NPM of selected banks, the below hypothesis has been adopted.
Null Hypothesis 3 (H03): There is no significant difference between ROE of all the three major private banks.
Since the calculated value (24.6323) is higher than the tabulated value (3.8852) at 5% level of significance, the null hypothesis 3 is rejected and hence it is concluded that there is significance difference between ROE of ICICI bank, HDFC bank and AXIS bank.
Earnings Per Share (EPS): The term earnings per share represents the portion of a company's earnings after deducting taxes and preferred stock dividends, that is allocated to each share of common stock. The figure can be calculated simply by dividing net income earned by the total number of outstanding shares in a period of time. It is clearly depicted from the table 7 that Axis bank has the highest average of EPS at 98.10% which is very high followed by ICICI bank at 58.94% and HDFC bank at 47.64%. As far as variability of EPS is concerned, HDFC bank has highest variability that followed by Axis bank and ICICI bank.

IJMSS Vol.03 Issue-05, (May, 2015) ISSN: 2321-1784 International Journal in Management and Social Science (Impact Factor- 4.747)
A Monthly Double-Blind Peer Reviewed Refereed Open Access International e-Journal - Included in the International Serial Directories
International Journal in Management and Social Science http://www.ijmr.net.in email id- [email protected] Page 65
Table 7. Earnings Per Share
Year ICICI HDFC AXIS
2009-10 36.14 67.6 62.06
2010-11 45.27 85 82.54
2011-12 56.09 22.01 102.67
2012-13 72.2 28.27 110.68
2013-14 84.99 35.34 132.56
Average 58.94 47.64 98.10
SD 19.81 27.28 26.96
Source: Annual reports of the banks
Table 8. One - Way Anova for EPS
Source of Variation SS df MS F P-value F crit
Between Groups 7012.30516 2 3506.15258 5.644126946 0.018718279 3.885293835
Within Groups 7454.44448 12 621.2037067
Total 14466.74964 14
Earnings per share (EPS) of selected banks has been compared and tested with the following hypothesis.
Null Hypothesis 4 (H04): There is no significant difference between EPS of all the three major private banks.
Since the calculated value (5.6441) is higher than the tabulated value (3.8852) at 5% level of significance, the null hypothesis 4 has been rejected and hence it is concluded that there is significance difference between EPS of ICICI bank, HDFC bank and AXIS bank.
Price Earnings Ratio (PER): Price earnings ratio (P/E ratio) is the ratio of a company's share price to its earnings per share. As the name implies, to calculate the P/E, you simply take the current stock price of a company and divide by its earnings per share (EPS). What I observed in the table 9 is that the average price earnings ratio of HDFC is higher at 24.775 followed by ICICI at 20.81 % and Axis bank at 10.315. The higher the P/E ratio, the better for the wealth of shareholders. In case of Axis bank it is far less than other two banks.

IJMSS Vol.03 Issue-05, (May, 2015) ISSN: 2321-1784 International Journal in Management and Social Science (Impact Factor- 4.747)
A Monthly Double-Blind Peer Reviewed Refereed Open Access International e-Journal - Included in the International Serial Directories
International Journal in Management and Social Science http://www.ijmr.net.in email id- [email protected] Page 66
Table 9. Price Earnings Ratio
Year ICICI HDFC AXIS
2009-10 27.5 28.62 18.84
2010-11 25.9 27.59 17.01
2011-12 15.82 24.39 11.16
2012-13 14.48 22.08 2.35
2013-14 20.34 21.19 2.21
Average 20.81 24.77 10.31
SD 5.83 3.28 7.86
Source: Annual reports of the banks
Table 10. One - Way Anova for PER
Source of Variation SS df MS F P-value F crit
Between Groups 558.24132 2 279.12066 7.859404137 0.006583247 3.885293835
Within Groups 426.17072 12 35.51422667
Total 984.41204 14
To examine and test the Price earnings ratio (PER) of sample banks, the following hypothesis has been used.
Null Hypothesis 5 (H05): There is no significant difference between PER of all the three major private banks.
As the calculated value (7.8594) is higher than the tabulated value (3.8852) at 5% level of significance, the null hypothesis 5 has been rejected and hence it is concluded that there is significance difference between PER of ICICI bank, HDFC bank and AXIS bank.
Dividend Per Share (DPS): Dividend per share refers to the sum of declared dividends for every ordinary share. Dividend per share can be calculated by dividing the total dividends paid out by the number of outstanding ordinary shares. The higher DPS indicates higher earnings for the shareholders. The trends of DPS of sample banks are reflected in the table 11. It is observed that Axis bank has the highest DPS as compared to ICICI bank and HDFC bank which have same average DPS i.e., Rs.9.03. As far as the degree of variability is concerned, Axis bank has lowest degree of variability whereas both ICICI and HDFC bank have similar variability.

IJMSS Vol.03 Issue-05, (May, 2015) ISSN: 2321-1784 International Journal in Management and Social Science (Impact Factor- 4.747)
A Monthly Double-Blind Peer Reviewed Refereed Open Access International e-Journal - Included in the International Serial Directories
International Journal in Management and Social Science http://www.ijmr.net.in email id- [email protected] Page 67
Table 11. Dividend Per Share
Year ICICI HDFC AXIS
2009-10 12 12 12
2010-11 16.5 16.5 14
2011-12 4.3 4.3 16
2012-13 5.5 5.5 18
2013-14 6.85 6.85 20
Average 9.03 9.03 16
SD 5.10 5.10 3.16
Source: Annual reports of the banks
Table 12. One - Way Anova for DPS
Source of Variation SS df MS F P-value F crit
Between Groups 161.9363333 2 80.96816667 3.911253703 0.049219358 3.885293835
Within Groups 248.416 12 20.70133333 Total 410.3523333 14
The following hypothesis has been used to compare and test the DPS of the sample banks.
Null Hypothesis 6 (H06): There is no significant difference between DPS of all the three major private banks.
According to table 12, since the calculated value (3.9112) is higher than the tabulated value (3.8852) at 5% level of significance, the null hypothesis 6 is rejected and therefore I conclude that there is significance difference between DPS of ICICI bank, HDFC bank and AXIS bank.
Dividend Payout Ratio (DPR): The dividend payout ratio is the amount of dividends paid to shareholders relative to the amount of total net income of a company. The amount that is not paid out in dividends to shareholders is held by the company for growth. The amount that is kept by the company is called retained earnings. This ratio indicates what percentage of earnings are distributed to the shareholders. The higher ratio implies higher earnings to the shareholders. The table 13 reveals the position of DPR of al the sample banks. It can be observed that ICICI banks much dividends to its shareholders as compared with HDFC and Axis bank. Axis bank reflects the higher degree of variability as its standard deviation is the highest than ICICI and HDFC bank.

IJMSS Vol.03 Issue-05, (May, 2015) ISSN: 2321-1784 International Journal in Management and Social Science (Impact Factor- 4.747)
A Monthly Double-Blind Peer Reviewed Refereed Open Access International e-Journal - Included in the International Serial Directories
International Journal in Management and Social Science http://www.ijmr.net.in email id- [email protected] Page 68
Table 13. Dividend Payout Ratio
Year ICICI HDFC AXIS
2009-10 33.2 17.75 22.56
2010-11 30.93 19.41 16.91
2011-12 32.82 20.54 15.51
2012-13 27.71 19.46 16.29
2013-14 27.07 19.38 15.11
Average 30.35 19.31 17.28
SD 2.84 1.00 3.03
Source: Annual reports of the banks
Table 14. One - Way Anova for DPR
Source of Variation SS df MS F P-value F crit
Between Groups 494.65228 2 247.32614 40.59589171 4.5585E-06 3.885293835
Within Groups 73.10872 12 6.092393333
Total 567.761 14
By using the following hypothesis, the DPR position of the sample three banks has been compared and tested.
Null Hypothesis 7 (H07): There is no significant difference between DPR of all the three major private banks.
Since the calculated value (40.5958) is higher than the tabulated value (3.8852) at 5% level of significance, the null hypothesis 7 is rejected and therefore I conclude that there is significance difference between DPR of ICICI bank, HDFC bank and AXIS bank.
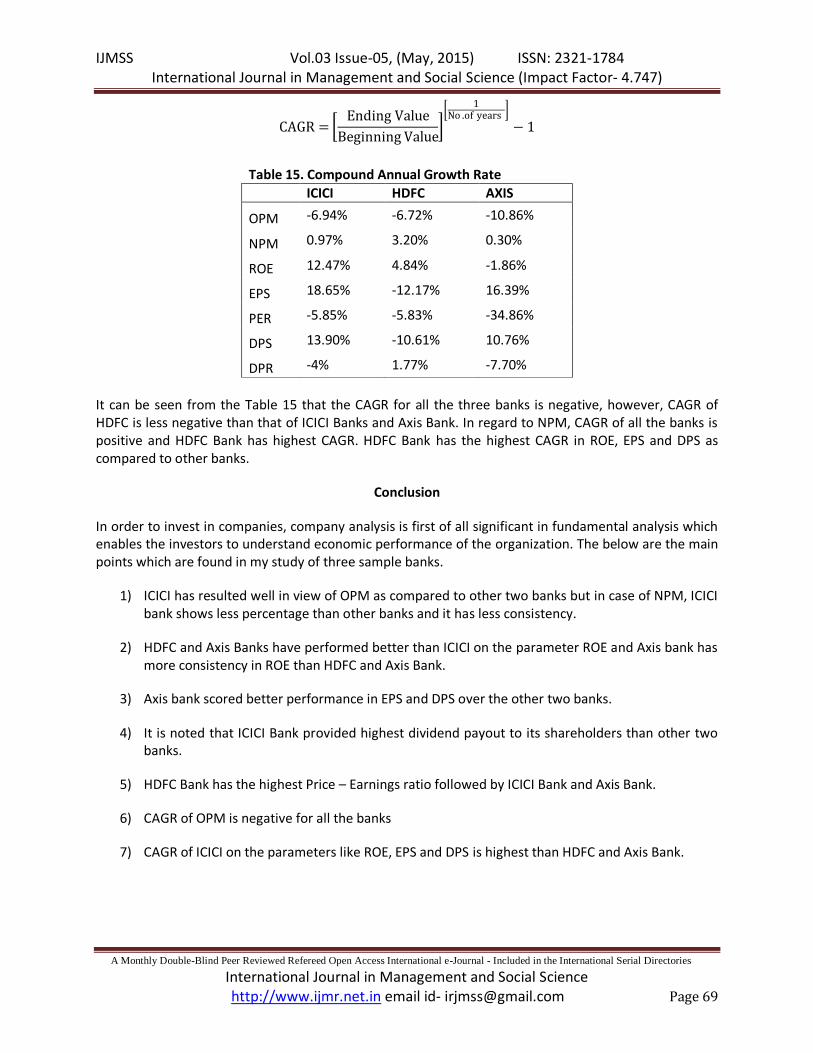
Compound Annual Growth Rate (CAGR): The year-over-growth rate of an investment over a specific period of time. The compound annual growth rate is calculated by taking nth root of the total percentage growth rate, where the number of years in the period is being considered. CAGR is not the actual return in reality. It is an imaginary number that describes the rate which an investment would have grown if it grew at steady rate.
IJMSS Vol.03 Issue-05, (May, 2015) ISSN: 2321-1784 International Journal in Management and Social Science (Impact Factor- 4.747)
A Monthly Double-Blind Peer Reviewed Refereed Open Access International e-Journal - Included in the International Serial Directories
International Journal in Management and Social Science http://www.ijmr.net.in email id- [email protected] Page 69
CAGR = Ending Value
Beginning Value
1No .of years
− 1
Table 15. Compound Annual Growth Rate
ICICI HDFC AXIS
OPM -6.94% -6.72% -10.86%
NPM 0.97% 3.20% 0.30%
ROE 12.47% 4.84% -1.86%
EPS 18.65% -12.17% 16.39%
PER -5.85% -5.83% -34.86%
DPS 13.90% -10.61% 10.76%
DPR -4% 1.77% -7.70%
It can be seen from the Table 15 that the CAGR for all the three banks is negative, however, CAGR of HDFC is less negative than that of ICICI Banks and Axis Bank. In regard to NPM, CAGR of all the banks is positive and HDFC Bank has highest CAGR. HDFC Bank has the highest CAGR in ROE, EPS and DPS as compared to other banks.
Conclusion
In order to invest in companies, company analysis is first of all significant in fundamental analysis which enables the investors to understand economic performance of the organization. The below are the main points which are found in my study of three sample banks.
1) ICICI has resulted well in view of OPM as compared to other two banks but in case of NPM, ICICI bank shows less percentage than other banks and it has less consistency.
2) HDFC and Axis Banks have performed better than ICICI on the parameter ROE and Axis bank has more consistency in ROE than HDFC and Axis Bank.
3) Axis bank scored better performance in EPS and DPS over the other two banks.
4) It is noted that ICICI Bank provided highest dividend payout to its shareholders than other two banks.
5) HDFC Bank has the highest Price – Earnings ratio followed by ICICI Bank and Axis Bank.
6) CAGR of OPM is negative for all the banks
7) CAGR of ICICI on the parameters like ROE, EPS and DPS is highest than HDFC and Axis Bank.

IJMSS Vol.03 Issue-05, (May, 2015) ISSN: 2321-1784 International Journal in Management and Social Science (Impact Factor- 4.747)
A Monthly Double-Blind Peer Reviewed Refereed Open Access International e-Journal - Included in the International Serial Directories
International Journal in Management and Social Science http://www.ijmr.net.in email id- [email protected] Page 70
References
1. Amsaveni.R and Gomathi. S (2013). Fundamental Analysis of Selected FMCG Companies in India. Asia-Pacific Finance and Accounting Review 1.3 (2013): 3.
2. Chowdari Prasad and K.S. Srinivasa Rao (2004) : “Private Sector Banks in India - A SWOT Analysis, Bankers Profession, pp 28-33.
3. Hanmantha Rao.P and Subhendu Dutta (2014). Fundamental analysis of the banking sector in India. Indian Journal of Finance, September, 2014, 47-56.
4. Investment Analysis and Portfolio Management – Prasanna Chandra.
5. Investment Management – Preeti Singh
6. Mishra, R.K., Sarma, K. J., Avadhanam, P.K. (2011). Influence of corporate fundamentals on equity returns of public sector banks and public sector financial institutions in India. Journal of Institute of Public Enterprise, 34(1/2), 59-72.
7. Ramudu, J., Rao, D. (2006). A fundamental analysis of Indian banking industry. The ICFAI Journal of Bank Management, 5 (4), 68,69.
8. Security Analysis and Portfolio Management – V.A Avadhani
9. www.axisbank.com
10. www.hdfcbank.com
11. www.icicibank.com
12. www.moneycontrol.com