ill health and retirement in britain: a panel data based ... · ill-health and retirement in...
TRANSCRIPT

ILL HEALTH AND RETIREMENT IN BRITAIN: APANEL DATA BASED ANALYSIS
Richard DisneyCarl Emmerson
Matthew Wakefield
THE INSTITUTE FOR FISCAL STUDIESWP03/02

3 March, 2003
Ill-health and retirement in Britain: A panel data-based analysis
Richard Disney*, Carl Emmerson† and Matthew Wakefield†
Abstract
We examine the role of ill-health in retirement decisions in Britain, using the first eight waves of the British Household Panel Survey (1991-98). As self-reported health status is likely to be endogenous to the retirement decision, we instrument self-reported health by a constructed ‘health stock’ measure using a set of health indicator variables and personal characteristics, as suggested by Bound et al (1999). Using both linear and non-linear fixed effects estimators, we show that adverse individual health shocks are an important predictor of individual retirement behaviour. We compare the impact of our constructed health measure on economic activity with that arising from the use of other health variables in the data set. We also examine the impact of the 1995 reform of disability benefits on the retirement decision.
Key Words Ill health Retirement Disability insurance JEL classification H55 I12 J26
Acknowledgements
We are grateful to the Nuffield Foundation for funding the project: ‘A study of health and the labour market behaviour of older workers’, and to Sharon Witherspoon in particular. Co-funding was provided by the ESRC Centre for the Microeconomic Analysis of Public Policy (CPP). We thank Erich Battistin and Frank Windmeijer for valuable advice and comments, and participants at seminars at the Institute for Fiscal Studies, and the Universities of Newcastle, St Andrews and Strathclyde. The British Household Panel Survey data used in this paper were made available through the UK Data Archive, funded by the ESRC. The usual disclaimers apply.
* Institute for Fiscal Studies, London and University of Nottingham † Institute for Fiscal Studies, London.

1
Executive Summary
This paper examines the role of ill-health in retirement decisions in Britain, using
the first eight waves of the British Household Panel Survey (1991-98). To tackle the
problem that self-reported health status is likely to be endogenous to the retirement
decision, a two-stage method, as suggested by Bound et al (1999), is adopted. The first
stage is to construct a ‘health stock’ measure that is cleansed of the effects of reporting
behaviour reflecting labour market participation. This measure is then introduced into a
reduced form model of labour market (in)activity. At this latter stage, modelling how
labour market transitions are related to time variation in health and other characteristics,
helps to eliminate any unchanging person-specific association between characteristics and
the decision to work.
The ‘health-stock’ measure is constructed by regressing self-reported health on a
set of more objective health indicator variables and a set of other personal characteristics.
Few personal characteristics, other than those related to health, are found to be
significant in explaining self-assessed health. Many of the health indicators are significant
in the model, and as expected having health problems is associated with reporting poor
health.
The panel structure of the data set is exploited to estimate a non-linear ‘fixed-
effects’ model that allows an exploration of how time variation in various characteristics
relates to transitions out of (and in to) work. Deterioration in an individual’s health is
found to be strongly positively associated with movement out of work. Sensitivity
analyses suggest that there may be some asymmetry between the respective effects of
health deteriorations and improvements on transitions out of, and in to, work.
The final section briefly considers a reform to the public disability insurance
programme in 1995, which both tightened formal eligibility conditions and reduced the
economic incentives to retire via the disability insurance ‘route’. No significant effects are
found. This may reflect that there indeed were no effects (a result that is not incompatible
with the aggregate data), or it may reflect the weakness of the test that could be
constructed given the framework and data used.

2
Ill-health and retirement in Britain: A panel data-based analysis
1. Introduction
The number of people on disability benefits more than doubled between the late
1970s and the middle of the 1990s in Britain. ‘Ill health’ is a major reason for retirement
among men, especially for men without access to an occupation pension (Tanner, 1998,
Table 7). Indeed ‘own ill health’ is the most commonly cited reason for retirement
among both men and women in the early 1990s (Disney, Grundy and Johnson, 1997,
Table 2.19). Similar trends have been observed in other countries such as the
Netherlands and the United States (Bound and Burkhauser, 1999).
There is a strong correlation between observing a person not working and their
self-reported poor health status, but this may give a misleading impression of the impact
of health status on retirement. First, individuals who are inactive often have an incentive,
for self-esteem if nothing else, to report worse-than-actual health. Second, differences in
reported self-assessed health are large, even for individuals in identical labour market
states – individual heterogeneity is important. Third, individuals with genuine ill-health
may never have worked, so they cannot be observed ‘retiring’. Fourth, genuine ill-health
may impact on other labour market attributes of the worker (for example, the wage they
earn – see Meghir and Whitehouse, 1997) which implies that there are both income and
substitution effects on labour supply arising from shocks to the worker’s health status.
Finally, the health stock may be endogenous to the labour market state of the individual
(Kerkhofs, Lindeboom and Theeuwes, 1999).
The potential measurement error and endogeneity of self-reported health status
has led some writers to reject the use of self-reported health status (Myers, 1982) even
though it has been, and continues to be, commonly used in this field for want of better
measures.1 A further problem is that, in the UK at least, for those individuals with no
occupational pension rights, disability benefits are the only ‘route’ into early retirement
through the social security programme, since the social security pension cannot be
1 For a survey of US evidence that uses self-reported measures, see Quinn, Burkhauser and Myers (1990). There are relatively few studies of retirement behaviour in the United Kingdom. Zabalza, Pissarides and Barton (1980) use self-reported ‘poor health’, Meghir and Whitehouse (1997) use self-reported ‘health problems’ as their proxy for ill health and Miniaci and Stancanelli (1998) use ‘ill health as a reason for leaving last job’ in modelling the ill health-retirement ‘route’. Blundell, Meghir and Smith (2002) is described below.

3
received before the state pension age (currently 65 for men and 60 for women).
Consequently, there is an inducement for early retirees to utilise the ill-health route and
their self-assessed health status will correlate with preferences for early retirement
(Blundell and Johnson, 1998).2
For the researcher interested in the link between ill health and retirement, one
obvious strategy is to substitute more objective measures of ill health (if available) for
self-reported health status in the model ‘explaining’ retirement.3 Some studies have
argued for the intrinsic superiority of this approach, since it eliminates the errors-in-
variables and biases arising from the subjective health measure (many such studies are
cited in Quinn, Burkhauser and Myers, 1990). But, Bound (1991) points out, we cannot
be sure that such proxies are any better predictors of (in)activity than self-reported health
status, as the researcher implicitly thereby assumes some link between work status and
these other health measures.4 Such a strategy does not eliminate the errors-in-variables
problem but replaces it with a similar problem on a proxy variable, and may thereby lose
any additional information on the ‘true’ association between health and behaviour that
might be intrinsic to the self-reported ‘subjective’ measure.5
Another pertinent suggestion, explored by Anderson, Burkhauser and Quinn
(1986) and Bound, Schoenbaum, Stinebrickner and Waidmann (1999) (hereafter Bound et
al) is that changes in labour market status e.g. ‘retirement’ (whether permanent or
temporary) should be associated with ‘shocks’ to the individual’s underlying ‘health
stock’. Bound et al’s strategy is to construct a latent health stock or index of health for
each individual as a function of personal characteristics and health indicators. This
constructed variable can be used to instrument self-reported health in a panel data model
of economic activity in order to explore the relationship between time variation in health
and changes in work status (see also Stern, 1989). Modelling health ‘shocks’, it can be
argued, eliminates any person-specific association between characteristics and labour
2 Of course, receipt of disability benefit is also conditioned on various ‘objective’ health assessments and work capability tests. These have changed over time – for further discussion see Disney, Emmerson, Smith and Smith (2002). 3 This ‘objective’ measures may also be self-reported, or externally assessed by the interviewer or by some form of medical examination. In the UK context again, Blundell, Meghir and Smith (2002), in their model of the impact of pension incentives on retirement, use a disability ‘severity score’ calculated from various ‘objective’ measures of self-reported disability, and also estimate an auxiliary reduced form probit for receipt of Invalidity Benefit. 4 For example, construction of a disability ‘score’ such as the well known Disability Living Index may not primarily be motivated by attempts to measure the employment capacity of the individual.

4
market outcomes (such as preferences for work, or longstanding disability), whilst
proxying self-reported health status by time-varying health and personal characteristics
should ameliorate any reporting bias in the former.
This paper follows the strategy suggested by these authors. It exploits the panel
element of the data set to construct individual ‘health stocks’, and uses time variation in
these ‘stocks’ as an explanatory variable in reduced form models of labour market
(in)activity amongst older people. These labour market outcomes are modelled using
linear and non-linear fixed effects estimator. We also experimented with other indicators
of health-related retirement, including applying a similar modelling technique to a
question concerning work-limiting health, as well as direct input of the more objective
health measures that we describe shortly. We test for symmetry in the relationship of
labour market transitions to improving and worsening health. We do not, in this paper,
explore the ‘feedback’ of labour market activity or inactivity on the evolving health stock.
We also examine the regime change in 1995, which replaced Invalidity Benefit by
Incapacity Benefit, tightened some eligibility conditions and cut real benefits. In
principle, this policy change strengthened the link between ‘true’ work-related disability
and inactivity, so that we might observe a change in the health stock-economic activity
relationship around this time.
The structure of the paper is as follows. Section 2 describes the construction of
our health stock variable. Section 3 uses this variable as an instrument for health status in
a reduced form labour market (in)activity model. Section 4 describes our sensitivity
analysis to alternative health measures, asymmetries in the health-economic activity
relationship, and possible omitted variables. It also reports our attempts to model the
change in the disability benefit regime. Section 5 concludes.
2. Modelling the individual’s health stock 2.1 Data and modelling issues
To construct an individual’s underlying ‘health stock’, we follow Bound et al
(1999). Assume that the ith individual’s health at time t is determined by a linear
combination of exogenous personal characteristics (such as age and education) xit, a
5 There is some evidence, for example, that self-reported health status is an additional predictor of individual mortality after controlling for observables (Kaplan and Camacho, 1983; Wannamethe and Shaper, 1991).

5
vector of detailed personal health indicators (such as functional limitations) zit and
unobservables υit uncorrelated with xit and zit. We allow the impact of these
characteristics to vary over time. Denote this (unobserved) health state as ηit. So:
it it t it t itx zη β γ υ′ ′= + + (1)
Although this health state is not observed, a self-reported health status is
observed in our data, as a categorical variable with five ‘states’: ‘excellent’, ‘good’, ‘fair’,
‘poor’ and ‘very poor’ (the exact form of the question is discussed below). Denote this
categorical variable as hit. The latent counterpart to hit, which is denoted by h*it, is a simple
function of ηit and a term reflecting reporting error:
*it it ith η ε= + (2)
Crucially, we assume that εit is uncorrelated with υit. Reporting error may well be
correlated with the state in which the individual is located. By using this instrumental
variable-type procedure, we are assuming that the errors are uncorrelated with those
arising when reporting specific health limitations. Thus we write:
* [ ]*
it it t it t it it
it it t it t it
h x zh x z u
β γ υ εβ γ′ ′= + + +′ ′= + +
(3)
Assuming that uit is normally distributed, equation (3) can be estimated as an ordered
probit.
To reiterate, therefore: we construct this time varying individual ‘health stock’ to
strip the health term in the labour force participation equation of possible endogeneity of
response. Using self-reported health status, hit, as a proxy for ηit directly will be biased if
the reporting error term in equation (2) is correlated with terms in the labour force
participation equation that we estimate in the next section. However, simply entering the
zit vector in equation (1) directly into a labour force participation equation will likely
induce errors-in-variables biases, because more specific health factors, even if accurately
reported, may not perfectly predict current capacity to work.6 Using the latent variable
model in equation (3), Bound et al (1999) argue, is a standard measure of dealing with
these problems, by using a proxy with error to instrument an endogenous and error-
ridden variable such as h* (see also Griliches (1974)).
6 Bound (1991) illustrates these likely outcomes concerning h* and the use of ‘objective factors’, formally: see ibid pp.110-114.

6
The data used in the analysis are drawn from the first eight waves of the British
Household Panel Survey (BHPS), 1991-98.7 This survey provides a sample that was
selected to be representative of the population of England, Wales and Scotland (south of
the Caledonian Canal). Since we are interested in the retirement behaviour of older
workers we use a subsample of people aged 50 to 64 in 1991 and who by the end of our
sample period have reached ages 57 to 71. This selection by age, coupled with the
requirement that we observe certain variables (particularly work status and health) leaves
us with a sample of 1,712 individuals in 1991, reduced to 1,253 by 1998.
One advantage of using this data is that it is a panel that allows us to track
individuals over a relatively long period of time: our eight year panel is significantly
longer than that available to Bound et al (1999), for example. The BHPS also records a
rich set of characteristics for individuals in the sample. In what follows we use data on
educational achievement, family composition, region of residence and a derived variable
on housing wealth,8 as the components of the xit vector, and the many measures of
individual health that are contained in the survey as the components of the zit vector.
What measures of health status are contained in the data set: i.e. the zit vector in
equation (1)? Aside from recording whether or not the individual is registered disabled
these come in two sets, the first recording whether or not individuals say that they have
certain health problems and disabilities and the second recording whether or not
individuals feel that their health limits their ability to perform certain daily activities. The
health problems and disabilities that individuals are asked about are: problems with arms,
legs, hands, feet, back or neck; difficulty seeing; difficulty hearing; skin conditions and
allergies; chest or breathing problems including asthma and bronchitis; heart problems
and blood pressure or circulation problems; stomach, liver, kidney or digestive problems;
diabetes; anxiety, depression or bad nerves; alcohol or drug related problems; epilepsy;
migraine or frequent headaches; other health problems. After being asked “does your
health limit your daily activities compared to most people of your age?”, the specific
activities that BHPS respondents are asked about are: doing the housework; climbing
stairs; dressing oneself; walking for at least ten minutes.9
7 The question relating to health status changed in the BHPS in 1999. 8 Our thanks to Andrew Henley at University College, Aberystwyth for providing the results of his programme that models housing equity in the BHPS. 9 The BHPS also contains a series of questions that contribute to a constructed index of “subjective well being”. These questions ask things like whether or not people feel that recently their concentration has been good, and whether or not they feel that recently they “have been playing a useful part in

7
As explained above, the specific indicators of health are used to cleanse the more
subjective general assessment of health of response patterns that, we argued, might be
correlated with work status. The general health measure hit is a response to the question:
“Please think back over the last 12 months about how your health has been. Compared to
other people of your own age, would you say that your health on the whole has been: excellent;
good; fair; poor; very poor; don’t know” (our italics).10
It is noteworthy that the self-reported health status variable that we use is derived
from a question that specifically asks respondents to compare their own health to that of
other people of their own age. The likely expected decline in health status as the panel of
respondents ages should not therefore be picked up by the variable. It follows that, in our
retirement model, we should interpret a significant coefficient on our constructed health
variable as indicating that individual-specific variations in health have an impact on
labour market activity. The cumulative effect on retirement decisions of the general
deterioration of health with age should be picked up through other variables in the
model, in particular by the age terms.
Notwithstanding the relative nature of the health question, there does seem to be a
general decline in self-assessed health relative to the cohort. This is seen from year-on-
year comparisons of the data. The overall effect can be seen by comparing the first and
last years of data, presented in Table 1, where we differentiate between the whole sample
in each year, and those who were present in both years:11
Table 1 here
This, of course, provides another reason for being cautious about simply using
the self-reported overall health measure in an analysis of economic (in)activity. The
average decline in self-reported health relative to the cohort may arise from a change in
self-perception, or a change in the comparison group implicitly used by the respondent
things”. In total there are twelve such questions, but after some experimentation we decided not to use these variables as asking how people feel about themselves may be more subjective than the sets of questions about health problems and limitations on daily activities. 10 Contoyiannis and Rice (2001) use this exact variable in their analysis of the impact of health on wages. When they use panel IV estimators, the impact of self-reported health status is not significant (ibid Tables 3 and 4) suggesting that measurement error (heterogeneity) dominates. Note that we allow for person specific effects at the second stage of our estimation procedure. 11 The numbers decline due to sample attrition over the period of the panel, either through death or non-response. Note that biases due to the association of poor health and mortality should lead to an overestimate of the average health of the ageing cohort since subsequent responses are conditioned on survival. The smaller number in the second set of cells arises because some individuals observed in 1998 failed to respond to all the health questions in 1991.

8
(who may be, for example, assessing only those people of similar ages who are still
economically active – although our sample includes both the active and the inactive).
2.2 Estimation
We now estimate the model for the latent ‘health stock’. Using as the dependent
variable the categorical variable described above, Table 2 depicts the ordered probit
underlying equation (3) for 1991.
Table 2 here
Looking at the sample characteristics, the first column of the table reveals that
there are slightly more women than men in the initial sample. Almost four fifths of
respondents are in a couple rather than single. The majority are owner occupiers, and
almost 40% own outright. Housing equity is defined in thousand pounds. Almost half
the sample have no educational qualifications, although there is wide variation. Of the
sample, only 6% are registered disabled but significant proportions of the sample report
having difficulties or health problems, notably with arms/legs/hands, lung or heart
problems.
Examining the parameter estimates, few personal characteristics, other than those
related to health, are significant in explaining self-assessed health. Individuals in a couple
and with higher housing equity are likely to report ‘better’ categorical health status; those
without qualifications worse. The education variables are jointly significant with more
highly educated people in general reporting better health. The regional dummies are
jointly insignificant in explaining self-reported health status, although previous studies of
the incidence of disability benefit receipt (such as Disney and Webb, 1991) show strong
regional disparities, suggesting that regional labour market differences might be
important in explaining economic inactivity. However it should be borne in mind again
that the question invites the respondent to compare their health status with people of a
similar age, which may be geographically-specific.
In contrast to personal characteristics, and as expected, many of the health
measures are individually significant at the one or five percent levels, and tests of joint
significance show that the measures of functional limitations are very significant when
considered together, as are the variables recording health conditions and problems.

9
Among these variables only ‘getting dressed’, ‘registered disabled’ and ‘hearing
difficulties’ have an insignificant impact on self-reported health status.
It is would be desirable to provide some interpretation of the coefficients as
‘marginal effects’. But it is well known that it is difficult to interpret the coefficients in an
ordered discrete choice model like this ordered probit in this way.12 A positive coefficient
unambiguously means that an increase in the variable concerned will decrease the
probability with which an individual is predicted to be in the lowest health category (very
poor) and increase the probability with which they are predicted to be in excellent health,
and vice versa. So the negative sign on coefficients on all of the health variables are (with
the one exception of ‘hearing difficulties’) as we would expect. To get a feel for
parameter estimates: if we take a representative individual who has the average (mean)
values for characteristics measured by continuous variables and is assigned values of the
dummy variable characteristics that are the most common in the data, then the predicted
probability of being in excellent health if the person has no chest or breathing problems
is 0.30. If they have chest problems it is only 0.07.
The predicted values of the index for each individual from this equation
constitute the individual ‘health stocks’ in 1991. We normalise these to give an absolute
deviation of the individual’s health stock from the cohort average for each year.
Normalising in this way avoids the need to make any further assumptions to identify the
constant in each separate ordered probit. These predicted individual ‘health stocks’ for
each successive year are then updated in the light of new information on the zit and xit
vectors contained in the data. We update by running a new ordered probit for each year
on same set of independent variables that are used in the first year. We predict the health
stock index and normalise by subtracting the year specific mean, in the same way as
described for the 1991 data. In this fashion, we construct an evolving health stock for
each individual (relative to the year-on-year average for the sample) in the data set over
the period 1991-98.13 These are the latent health stock measures that will be introduced
into the reduced form equations describing the evolution of each individual’s economic
(in)activity. The descriptive statistics for these constructed health stocks, which are useful
12 See, Greene (2000, p.876ff.) or Wooldridge (2002, p. 504ff.).
13 Results of the ordered probits for the years 1992-1998 can be obtained from the authors on request. Qualitatively they are similar to the results for 1991.

10
for interpreting coefficients in the models that follow, appear in an Appendix to the
paper.
3. The impact of health on ‘retirement’ 3.1 Theory
The economic theory underlying the relationship between ill-health and
retirement is standard (for example, Lazear, 1986). Agents have preferences over current
and future leisure, with the value of current and future leisure depending, inter alia, on
current and expected states of health. Agents form expectations over future states of
health. They maximise utility subject to the lifetime budget constraint, and standard
dynamic optimisation conditions determine choice of retirement date, R*. Shocks to
income, preferences, or both, will affect R*. There are various models of how people
solve this optimisation problem.14 There may be some institutional constraints that limit
choice of R* but, in the United Kingdom, these are relatively few – participants can
annuitise a private pension from age 50 and can both receive pensions and continue to
work (for another employer) for as long as they like without a retirement test, at least
since the abolition of the Earnings Rule in 1989 (Disney and Smith, 2002).
Poorer health status, ceteris paribus, will reduce the probability of continued work
for several reasons. First, poorer health may raise the current disutility of work. Second,
poorer health reduces the return from work if there is a relationship between poor health
and low wages. Third, poor health may entitle the individual to non-wage income, such
as disability benefits, which is contingent on not being in work. The only counteracting
principle is if poor health raises consumption requirements (for example, the cost of
health treatment) and requires greater income than can be provided through the disability
insurance programme. On the other hand, if poorer health is associated with lower life
expectancy, the annualised consumption available from existing wealth is raised which
might induce earlier retirement.
In this framework, however, it is important to differentiate ‘levels’ of health from
health ‘shocks’. As mentioned in the introduction, longstanding poor health may be
14 For example, individuals may notionally evaluate the utility from retirement now against all future prospective utility streams, including returns to work, as in a dynamic programming problem, or else evaluate retirement now against the highest valued stream from future retirement, assuming retirement is an absorbing state, as in the ‘option value’ model.

11
associated with a lower lifetime probability of work and thus, in extreme cases,
retirement will not be observed simply because the individual never worked. Moreover, a
slow decline in health status later in the working life may be anticipated and already
incorporated into the optimal retirement strategy. Thus a measure of the time variation in
the individual’s health ‘stock’, as constructed here, estimated over those that change
status between activity and inactivity, should provide an appropriate test of the standard
model.
3.2 Estimation
We now examine the role of the constructed health stock in a reduced form
model of retirement. Here, we estimate a simplified version of the underlying model as
described in equation (4) of the previous section. In the next section, a sensitivity analysis
to the measure of the health stock is considered, as well as the impact of the 1995 change
to the disability insurance regime.
Since only the outcome is observed, a discrete choice model that incorporates
dynamics (fixed effects) is appropriate. The fixed effects discrete choice model is:
, * 1.... , 1...1 if * 0, and 0 otherwise
it i it it it
it it
lf x i n t Tlf lf
α η λ β ε′= + + + = =
= > (4)
where lf*it is the latent variable that indexes the probability of participation of individual i
at time t, here defined as whether the individual reports that they are currently working
(including self-employment), ηit is the unobserved health state, itx′ is a vector of other
characteristics and αi is the individual fixed effect. The fixed effects (conditional) logit
model is written in general as:
Pr( 1 ( , )1it it it
i it it
i it it
a x
a xlf x ee
η λ β
η λ βη+ + ′
+ + ′= =+
(missing bracket here) (5)
Chamberlain (1980) notes that the conditional likelihood function is free of the incidental
(‘fixed effect’) parameters, αi. This is because a contribution to the likelihood only arises
from those groups of observations (of a given individual over time, say) that are not
always zero or one – in this case, those who transit ‘states’ between economic activity
and inactivity.

12
The vector of explanatory variables for economic activity status comprises ith ,
which is the predicted value of the underlying health ‘stock’ ηit for the individual, relative
to the average for each year, obtained from estimating equation (3) as described
previously, and a vector of time-varying individual characteristics. Variable definitions are
as follows:
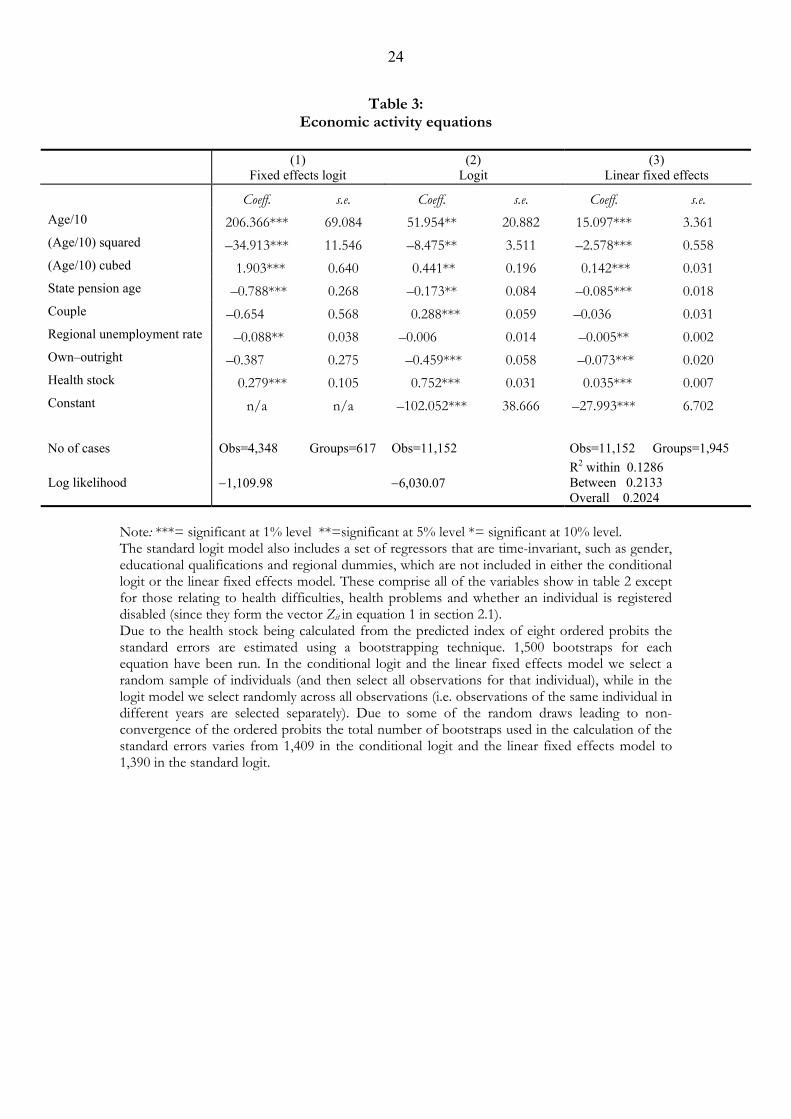
Table 3 illustrates the results of this exercise.
Table 3 here
Economic activity is related to age via a cubic and a dummy representing whether
the individual is over state pension age or not.15 Individuals in couples are less likely to
work, as are individuals who own their home outright (although neither is significant at
the 5% level in the preferred specification).16 We interpret these characteristics as
reducing the consumption requirements of households, and thus the probability of
working. As would be expected, higher local unemployment rates are associated with a
lower probability of economic activity. Of most interest, however, is the coefficient on
15 Since, since strictly speaking, health measures are relative to the cohort, the age effects should also be proxying the gradual cohort deterioration in health status, but the relationship between age and activity is not linear. Moreover, as shown in Table 1, individuals do not appear wholly to interpret the categorical health status question as a measure relative to their entire age group. 16 In the fixed effects logit, we can also interpret this as saying that becoming married or cohabiting, and paying off a mortgage, increases the probability of retirement. This is also the interpretation to be put on the coefficients in the linear fixed effects model.
Dependent variable: 1 if self-reported economically active (employed or self-employed), 0 otherwise.
Age: a cubic in age SPA: if individual is aged at State Pension age or above = 65+ for men,
60+ for women. Couple: if respondent is in a couple = 1 (default = single, widowed,
divorced) Regional unemployment rate: the regional unemployment rate at t Owned outright = 1 if house is owned outright Health stock = Deviations of individual health stock measure from
average at t as defined in Section 2

13
the individual’s relative health status, which is strongly positively associated with
economic activity (a higher value indicating better health). This is an important result,
bearing in mind that we are using a constructed variable proxying an assumed underlying
health stock. Moreover, by focussing on individuals who change state, we have
established the link between changing health status and retirement, as opposed simply to
underlying (in)activity.
The other specifications in Table 3 are for comparison. A simple logit without
fixed effects but augmented with standard time invariant characteristics (column 2) gives
a much stronger relationship of activity with health status (and correspondingly weaker
age effects). These effects are identified off all individuals, including those who are active
and inactive over the whole period, rather than simply those who transit states. The
coefficients derived from the standard logit are mostly significantly different from those
derived from the fixed effects logit and we prefer the latter since most other studies
suggest that individual fixed effects are important in modelling retirement (as in Meghir
and Whitehouse, 1997, and Blundell, Meghir and Smith, 2002).
Column 3 provides the standard linear fixed effects estimator. This identifies
effects off time-varying characteristics – such as marital status or home ownership – of
all individuals. It gives similar results to column 1, and the coefficients are more easily
interpretable than the conditional logit. However the linear model is an inappropriate
choice when the variable of interest is dichotomous, as in the present case. Thus we
prefer the specification in column 1.
4. Sensitivity Analysis, and the 1995 reform
4.1 Sensitivity to health measures and other variables
We focus here on the sensitivity of the results to alternative specifications, most
particularly to using more specific measures of health status. We examine also whether
the response of state transitions is symmetrical, especially in relation to the health
variable. Finally, we look for evidence of a change in retirement behaviour as a result of
the 1995 reform to the public disability insurance programme, which reduced eligibility
for disability benefits and reduced the financial incentives to claim disability insurance
benefit relative to other insurance benefits. Throughout the analysis, we evaluate
alternatives relative to the results for the fixed effect logit in column (1) of Table 3.

14
First, we examine the inclusion of additional conditioning variables. We
examined whether the impact of the health stock proxy on the probability of economic
activity is different for men and women, by including an additional interaction of ‘health
stock’ with a gender dummy. The inclusion of the extra variable is, however, easily
rejected (χ2 = 1.85, Prob > χ2 = 0.17). We also examined whether partner’s health is an
important predictor of changes in labour market status. Although there is the possibility
that partner’s health status may also suffer from reporting bias, missing values mean that
we would have to reduce sample size considerably if we were to follow the same
procedure to construct a health stock for both the respondent and partner.17 Even using
the categorical self-reported variable for the partner introduces a number of missing
observations. Nevertheless, including the partner’s self-reported status (classified by five
possible outcomes as before) plus a dummy for missing values for partner’s health was
insignificant (using a Likelihood Ratio test, χ2 = 0.46, Prob > χ2 = 0.80)
Second, we tested whether the participation response of individuals to health
shocks is symmetric – that is, whether improvements in health are associated with
transitions into work in the same way that deteriorations are linked to movements out of
work. Alternatively there may be a ‘ratchet’ effect such that after an individual’s poor
health has caused exit from work, it requires health to recover beyond the threshold that
induced exit in order to encourage new efforts to seek work.18 However, given that the
sample variable used, and the ‘health stock’ derived from it, measures an individual’s
health relative to that of other people of a similar age, it is misleading to utilise it to
evaluate the direction of change in that individual’s health status: a measured
improvement may reflect that the health of the individual concerned has deteriorated by
less than the average change across the whole sample. So, to carry out a test of symmetry,
we utilised another variable in the data set, derived from the response to the question:
‘Does your health limit the type of work or amount of work you can do?’ [YES/NO]
Responses to this variable are of course likely to be strongly endogenous to labour
market status, and it is of some interest to see whether our instrumental variable-type
technique gives similar results on this variable. We interpret responding negatively to this
question as reporting being in ‘good health’. We then use the same variable set as in
17 This is because many of the individuals in our sample have a partner who is not in the cohort used for this analysis. 18 Thus, if retirement is always an ‘absorbing state’, then deteriorations in health will lead to retirement but improvements in health will not induce a return to work. In our data, there are roughly 3 times as many

15
Table 2 in order to obtain derived individual year-specific predictions of the probability
of responding negatively to this question (results are available on request from the
authors). Unlike in the ordered probit used previously, there is just one probability of this
kind that can be predicted from this standard probit. Further, in this case an increase in
this probability can be interpreted as meaning that health has improved and become less
of a constraint on work. The predicted probabilities are inserted in the labour market
(in)activity equation in the same way as was our more detailed ‘health stock’ measure.
The results using this new predicted variable No health limit on work, analogous to
Table 3, are contained in Table 4. Results are similar, but there is one additional variable.
Since the probability of health affecting work is now measured as an ‘absolute’
probability, we introduce an interactive dummy capturing whether predicted health has
improved or worsened.19 The term Symmetric health impact is this dummy multiplied by
the predicted health measure where the dummy takes the value 1 when the health
measure has improved relative to the previous year. By adding this additional term, we
have an indirect test of a positive ‘ratchet effect’ of ill health on the retirement
probability. A significant negative coefficient on the interacted health term suggests that
an improvement in health has a weaker impact on the probability of transiting from
inactivity to activity than the reverse. And this is the result obtained, significant at
between 1% and 3% depending on specification. Note, however, that the coefficient
does not fully cancel out the health effect – the impact of improving health on the
transition to economic activity is weaker, but present.
Table 4 here
We also investigate further sensitivity of the results to the measure of the health
stock. As argued in Section 1, economic activity should be strongly correlated with
subjective, work-related, measures of health status in part due to reporting bias. On the
other hand, specific indicators of disability may have a weaker correlation with economic
activity simply because there some of these disabilities may have relatively little impact on
capacity to work.
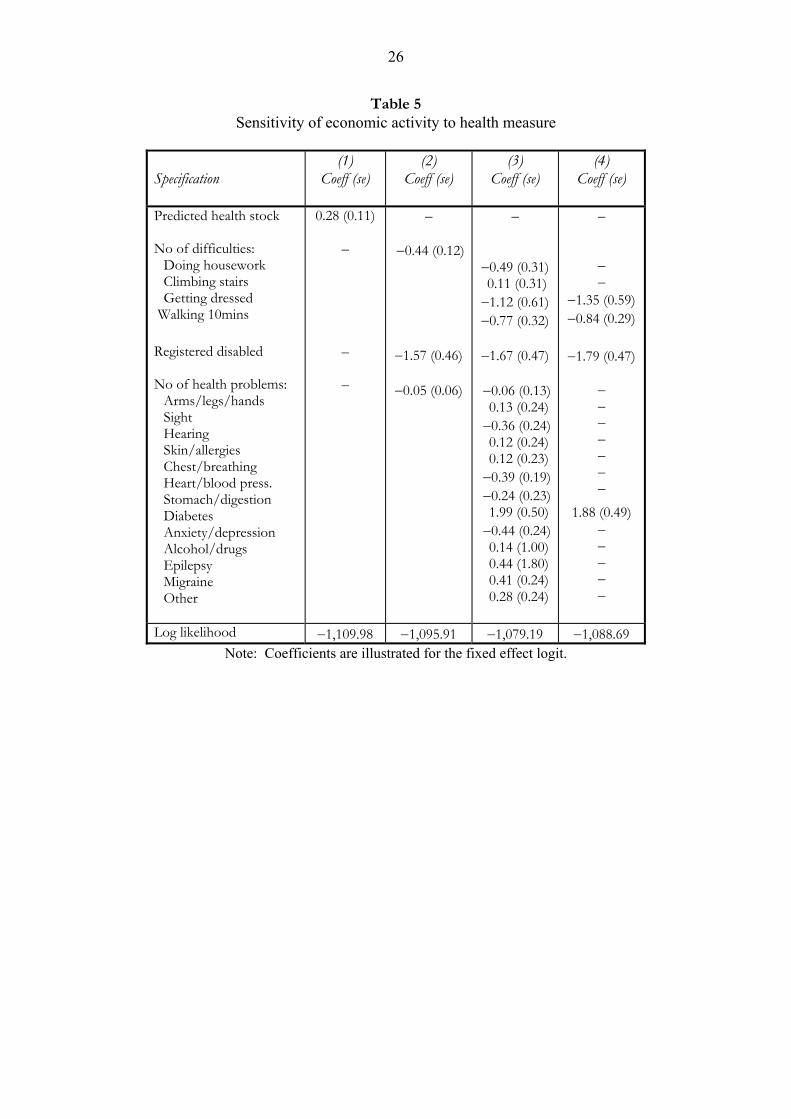
Table 5 provides coefficients and standard errors for our baseline specification of
the ‘health stock’ variable and for directly input measures of health difficulties and
moves ‘out’ of economic activity as there are ‘in’; moreover these moves ‘in’ are concentrated among a smaller number of multiple movers. 19 Note that we require at least two observations to observe this change, so that the first observation of each respondent is absent. This is why the sample size is smaller in Table 4 than Table 3.

16
functional limitations without the instrumental variable-type approach used in Tables 3
and 4. Column 1 gives the coefficient and standard error from the calculated measure
used in Table 3, as a benchmark.
Table 5 here
Column 2 provides the coefficient on two count variables, which count up the
number of difficulties in basic physical activities (j=1 to 4) and the number of reported
health problems (n=1 to 13), as well as whether the individual is registered disabled, as
reported by the individual. A higher count in each case should be associated with a
greater number of functional limitations or incapacities and therefore with a greater
probability of retirement, so these can be regarded as crude self-reported ‘disability
indices’. It will be noted that the sign on the number of self-reported difficulties and, not
surprisingly, being registered disabled, is negative. This is also true with the count of up
to 13 ‘health problems’ but the latter, unlike the other variables, is not statistically
significant.
We can see why the count variable is insignificant in Column 3, which includes
separately all the self-reported difficulties and health limitations that were utilised to
construct the health stock measure in Table 3 and the count variables in Column 2 of
Table 5. A negative sign is associated with a greater probability of inactivity. The first
striking feature, which underpins the result in column 2, is that many self-reported health
difficulties have the ‘wrong’ sign, in the sense that they are associated with economic
activity, rather than predicting inactivity.
By sequential restrictions, we can eliminate the insignificant regressors to arrive at
a parsimonious specification of a model that enters the zit vector directly. This is
contained in column 4 of Table 5. In so doing, it can be seen that the only ‘health
difficulty’ that survives this simplifying process – reporting a diabetic condition - is
positively associated with work status.20 The other remaining variables: self-reported
difficulties in walking and getting dressed, and registered disabled are all likely to be
associated with severer disability.
Overall, columns 2 to 4 suggest that the strategy of entering specific health
problems and self-reported difficulties in basic physical activities into the retirement
model is not particularly successful. It is of course possible that a proper objective (i.e.

17
measured by an impartial third party) indicator of functional limitations and/or
incapacity is required to pin down the exact relationship between measures of physical
and mental ill-health and retirement behaviour. However, the results suggest that the best
way to introduce these more objective factors, given the data available, is through the
two-stage process by which the combination of these, and other, factors generate
underlying health stocks, measures of which are the key to explaining the link between
health status and economic activity.
4.2 Reform of the disability insurance programme
In 1995, the government introduced a number of significant reforms to the
public disability insurance programme. Invalidity Benefit (IVB), the main insurance
benefit for those with chronic ill-health and disabilities, was to be phased out and
replaced by Incapacity Benefit (ICB). ICB is not available to individuals over state
pension age (men, 65 and women, 60) unlike IVB, which was available until men and
women were respectively 70 and 65. As existing claimants reached 70 and 65, therefore,
claims to IVB above state pension age would phase out. The reason that individuals
might prefer to be on Invalidity Benefit rather the basic state retirement pension at state
pension age was that the former was not liable to income tax, unlike the basic state
pension. ICB is treated as taxable income. Finally, eligibility conditions to be accepted
onto disability insurance were tightened up. Full details can be obtained in Disney et al
(2003). The whole policy package was designed to arrest the rise in numbers of disability
insurance recipients that had occurred since the 1970s, especially among older men.
Figure 1 illustrates the trends in receipt of disability insurance benefits among
older age groups, both men and women, from the early 1980s. After 1995, the number of
male claimants falls sharply, but it is apparent that this is almost wholly due to phasing
out claims in the age group above state pension age (65+). There is, however, a
stabilisation in numbers for the age groups just below state pension age, relative to the
rapid increase of the previous decade.21 For women, in contrast, it is seems clear that the
20 In this sample, almost all those reporting a diabetic condition are working at the start of the period, which is why the coefficient appears so large. 21 One surmise is that the rapid rise in claimant numbers in the late 1980s is related to another institutional change – namely, government measures to target the long-term unemployed such as Restart. Circumstantial evidence suggests that Restart led to the transfer of significant number of unemployed claimants on to Invalidity Benefit. In which case, tapering out Restart, combined with the 1995 Act, may have led to a reversion to the earlier, slower, trend growth in claimant numbers. However this surmise requires further analysis.

18
1995 reform did nothing to abate the rise in the number of disability insurance claimants
for those below state pension age.
Figure 1 here
In principle, the object of such a reform is to change the link between ill-health
and retirement. The number of individuals retiring on grounds of ill-health should
diminish, as a result of the tightening of eligibility conditions. Whether a priori this
reduces the total number of retirements is unclear, as the reform changes the economic
incentives to retire across different retirement ‘routes’. There are at least two implicit
hypotheses that can tested in the present context. The first is that the 1995 legislation
discouraged premature retirement (i.e. before state pension age). The second is that the
link between retirement and ill-health was tightened as a result of the 1995 legislation so
that, post-1995, the probability of a ‘shock’ of given intensity being associated with ill-
health has changed. This can be thought of as raising the threshold at which a health
shock precipitates a change in the economic status of the individual. It should be borne
in mind from Figure 1, that, apart from the exclusion of individuals post-state pension
age, there is no evidence of a change in trend among women, and only evidence of a
slowing down in the increase in numbers of disability benefit recipients among men. The
likelihood of a ‘big’ effect of the 1995 Act is going to be limited in our analysis, even if
we have an appropriate model and the correct indicators of the health-disability
insurance link.
To model the legislation we introduce two further variables into the basic
retirement model. The basic hypothesis is that a given health shock will be associated
with different behaviour after the tightening of eligibility requirements and reduced
economic incentives post-1995. The first variable is a dummy variable that describes
whether the individual is in the post-1995 Incapacity Benefit system, which requires that
the individual is below state pension age after 1995 and not already in a spell of Invalidity
Benefit. Since such individuals are no longer able to receive tax free Invalidity Benefit
after state pension age, the present value of retiring through the disability ‘route’ is
reduced. If eligibility conditions were effectively tightened, then people would also find it
more difficult to move from work onto disability benefits after the reform. Our basic
hypothesis therefore is that some people might stay in work longer in the new regime.
The variable eligible ICB characterises this group of individuals. The second variable
interacts this dummy with the calculated health stock, which we denote as

19
hstock*eligible ICB. The interpretation here is that the 1995 reform raised the
threshold ‘shock’ to health required to enter the ICB regime, thus changing the health
stock-retirement relationship.
Table 6 presents the result for the two fixed effect specifications in Table 3, for
the relevant variables: hstock, spa (state pension age or above), eligible ICB and
hstock*eligible ICB (coefficients for the other controls are not reported here). As before,
the health stock and state pension age variables are significant. The interaction between
health stock and the post-1995 regime (hstock* eligible icb) is insignificant, suggesting
that there may be no evidence of a break in the relationship between changes in the
health stock and economic activity after 1995. The variable proxying eligibility post-1995
(eligible ICB) is also positive but insignificant with bootstrapped standard errors. A test
of the joint exclusion restriction for both additional variables is not rejected. These weak
results may reflect either a weak, or indeed no, relationship, or the difficulty of finding
suitable proxies for the 1995 reform within the existing modelling framework.
Table 6 here
5. Conclusion
This paper represents one of the first attempts to examine the impact of ill-health
on retirement in some detail in the United Kingdom, using the British Household Panel
Survey. The focus of the paper is on the nature of health measures that are utilised in
reduced form retirement models of the type described here. It argues that reporting bias
is intrinsic to self-reported measures of general health (especially, in questions that
explicitly link health to economic activity status), but that there is a lack of ‘fit’ between
objective measures of disability and functional limitations on the one hand and health as
it relates to economic activity on the other. We therefore follow the approach of Bound
et al (1999) in constructing an underlying ‘health stock’ of the individual, and in treating
temporal variations in this measure as proxying individual-specific ‘health shocks’ that
affect retirement behaviour.
The paper shows that a constructed proxy variable of this type can explain
transitions between economic activity and inactivity in a reduced form model that
incorporates other time-varying covariates. Moreover, the approach seems superior, in
terms of explanatory power, to the application of disability index-type health measures.
The paper tested for symmetry in labour market transitions to changes in health, using

20
predictions on an alternative subjective measure of ill health. Some evidence of
asymmetry was found. No systematic differences were found in the response of men and
women to changes in the health stock.
The final section briefly considered the reform to the public disability insurance
programme in 1995, which both tightened formal eligibility conditions for disability
insurance and also reduced the economic incentives to retire via the disability insurance
‘route’. No significant effects were found. The failure to find a significant effect may
reflect the possibility that there indeed was no effect (a result that is not incompatible
with the aggregate data). Alternatively, it may reflect the weakness of the test in a reduced
form framework that aggregates different retirement ‘routes’ into a single transition. This
therefore suggests a strategy for future work – to identify separately the economic
incentives attached to different retirement ‘routes’ in the UK (broadening the work of
Blundell, Meghir and Smith, 2002) and to estimate a model that allows for greater choice
of exit. It would also be useful to follow the path pursued by others, such as Kerkhof et
al (1999), in handling the endogeneity of health status, and also in examining the impact
of health status on the utility derived from different retirement routes – for example, the
impact of health changes on prospective wages.
6. References
Anderson, K.H., Burkhauser, R. and Quinn, J.F. (1986) ‘Do retirement dreams come true? The
effect of unanticipated events on retirement plans’, Industrial and Labor Relations Review, 39, July, 518-526.
Banks, J., Blundell, R., Disney, R. and Emmerson, C. (2002) ‘Retirement, pensions and the adequacy of saving: A guide to the debate’, Institute for Fiscal Studies Briefing Note 29, London.
Blundell, R. and Johnson, P. (1998) ‘Pensions and labour market participation in the UK’, American Economic Review, 88, May, 168-172.
Blundell, R., Meghir, C., and Smith, S. (2002) ‘Pension incentives and the pattern of early retirement’, Economic Journal, 112, March, C153-C170.
Bound, J. (1991) ‘Self-reported versus objective measures of health in retirement models’, Journal of Human Resources, 26, 106-138.
Bound, J. and Burkhauser, R. (1999) ‘Economic analysis of transfer programs targeted on people with disabilities’, in O. Ashenfelter and D. Card (eds) Handbook of Labor Economics Volume 3C, Amsterdam: Elsevier Science, 3417-3528.
Bound, J., Schoenbaum, M., Stinebrickner, T.R. and Waidmann, T. (1999) ‘The dynamic effects of health on the labor force transitions of older workers’, Labour Economics, 6, 179-202.
Chamberlain, G. (1980) ‘Analysis of covariance with qualitative data’, Review of Economic Studies, 47, 225-238.

21
Contoyannis, P. and Rice, N. (2001) ‘The impact of health on wages: Evidence from the British Household Panel Survey’, Empirical Economics, 26, 599-622.
Disney, R., Emmerson, C., Smith, S. and Smith, Z. (2003, forthcoming) Disability Benefits: A Tale of Two Reforms, mimeo, Institute for Fiscal Studies, London.
Disney, R., Grundy, E. and Johnson, P. (1997) The Dynamics of Retirement, Research Report No. 72, Department of Social Security, HMSO: London.
Disney, R. and Smith, S. (2002) ‘The labour supply effect of the abolition of the earnings rule for older workers in the United Kingdom’, Economic Journal, 112, March, C136-C152.
Disney, R. and Webb, S. (1991) ‘Why are there so many long term sick in Britain?’ Economic Journal, 101, March, 252-262.
Greene, W.H. (2000) Econometric Analysis, 4th edition, Prentice Hall: London.
Griliches, Z. (1974) ‘Errors in variables and other unobservables’, Econometrica, 42, November, 971-998.
Kaplan, G. and Camacho, T. (1983) ‘Perceived health and mortality: A nine-year follow-up of the human population laboratory cohort’, American Journal of Epidemiology, 117, 292-304.
Kerkhofs, M., Lindeboom, M. and Theeuwes,, J. (1999) ‘Retirement, financial incentives and health’, Labour Economics, 6, 203-227.
Lazear, E. (1986) ‘Retirement from the labor force’, 305-355 in O. Ashenfelter and R. Layard (eds) Handbook of Labour Economics, Volume 1, Elsevier Science Publishers, BV, Amsterdam.
Meghir, C. and Whitehouse, E. (1997) ‘Labour market transitions and retirement of men in the UK’, Journal of Econometrics, 79, 327-354.
Miniaci, R. and Stancanelli, E. (1998) ‘Microeconometric analysis of the retirement decision: United Kingdom’, OECD Economics Department Working Papers No. 206, Paris.
Myers, R.J. (1982) ‘Why do people retire early from work?’, Aging and Work, 5, 83-91.
Quinn, J.F., Burkhauser, R. and Myers, D.A. (1990) Passing the Torch: The influence of economic incentives on work and retirement, W.E. Upjohn Institute for Employment Research, Kalamazoo, Michigan.
Stern, S. (1989) ‘Measuring the effect of disability on labor force participation’, Journal of Human Resources, 24, Summer, 361-395.
Tanner, S. (1998) ‘The dynamics of male retirement behaviour’, Fiscal Studies, 19, May, 175-196.
Wannamethe, L. and Shaper, A.G. (1991) ‘Self-assessment of health status and mortality in middle-aged British men’, International Journal of Epidemiology, 20, 239-245.
Wooldridge, M. (2002) Econometric Analysis of Cross Section and Panel Data, MIT Press: Cambridge, Mass.
Zabalaza, A., Pissarides, C. and Barton, M. (1980) ‘Social security and the choice between full-time work, part-time work, and retirement’, Journal of Public Economics, 14, 245-276.

22
Table 1: Self-assessed health, relative to cohort, 1991 and 1998
Percentage of whole sample
reporting relative health status as:
Percentage of sample present in 1991 and 1998
reporting relative health status as:
1991 1998 1991 1998
Excellent 26.5 16.4 27.4 17.0
Good 44.3 46.7 44.7 45.8
Fair 19.0 24.7 19.4 25.2
Poor 7.7 9.4 6.3 9.2 Very poor 2.6 2.8 2.2 2.9
No. of observations 1,712 1,253 1,137 1,137
Source: constructed by the authors from successive waves of the BHPS

23
Table 2: Results of 1991 Ordered Probit estimating self–reported health
status as a function of ‘objective’ health measures and individual characteristics
Variable Mean s. deviation Coefficient Standard error Male 0.472 0.499 –0.005 0.058 In a couple 0.771 0.420 0.141 ** 0.071 Age/10 5.998 0.493 –55.152 43.652 (Age/10) squared 36.218 5.932 9.436 7.693 (Age/10) cubed 220.157 53.910 –0.534 0.451 Owner-occupier 0.776 0.417 –0.070 0.080 Own-outright 0.486 0.500 0.049 0.067 Housing equity (£,‘000) 54.628 74.907 0.001 ** 0.000 Regional unemployment rate, % 7.421 2.031 –0.081 0.075 White 0.976 0.154 0.013 0.170 Number of children in household 0.063 0.320 –0.106 0.078 Regional dummies:
Live in conurbation 0.290 0.454 0.059 0.094 South West 0.102 0.303 0.067 0.113 East Midlands 0.078 0.268 0.032 0.139 West Midlands 0.096 0.294 0.128 0.151 North West 0.107 0.309 0.303 0.239 Yorkshire/Humberside 0.087 0.282 0.150 0.197 Rest of North 0.060 0.238 0.306 0.326 Wales 0.059 0.235 0.145 0.248 Scotland 0.077 0.267 0.279 0.264
Education dummies: A-level (or equivalent) 0.074 0.262 –0.185 0.119 O-level (or equivalent) 0.131 0.337 –0.084 0.100 Low education 0.104 0.305 –0.123 0.108 No qualifications 0.476 0.499 –0.357 *** 0.078
Health ‘difficulties’: Doing housework 0.071 0.257 –0.659 *** 0.156 Climbing stairs 0.091 0.287 –0.369 ** 0.155 Getting dressed 0.024 0.153 –0.378 0.221 Walking 10mins 0.090 0.286 –0.762 *** 0.149
Registered disabled 0.073 0.261 –0.128 0.134 Health ‘problems’:
Arms/legs/hands 0.403 0.491 –0.554 *** 0.061 Sight 0.058 0.235 –0.374 *** 0.099 Hearing 0.120 0.325 0.027 0.095 Skin/allergies 0.089 0.285 –0.219 ** 0.101 Chest/breathing 0.133 0.339 –0.926 *** 0.093 Heart/blood press. 0.245 0.430 –0.693 *** 0.071 Stomach/digestion 0.084 0.277 –0.544 *** 0.110 Diabetes 0.043 0.202 –0.933 *** 0.163 Anxiety/depression 0.073 0.261 –0.656 *** 0.118 Alcohol/drugs 0.003 0.058 –0.957 ** 0.399 Epilepsy 0.007 0.086 –0.662 ** 0.308 Migraine 0.076 0.264 –0.464 *** 0.104 Other 0.054 0.227 –0.632 *** 0.120
F-tests: Chi-Squared P-Value Regional dummies 2.83 0.971 Education dummies 25.90 *** 0.000 Health ‘difficulties’ 151.06 *** 0.000 Health ‘problems’ 405.66 *** 0.000 **: significant at 5% level ***: significant at 1% level Number of obs = 1,712; Log likelihood = –1,774.5939; LR χ2(42) = 965.75
A full set of results from the other 7 years is available from the authors on request.
24
Table 3: Economic activity equations
(1) Fixed effects logit
(2) Logit
(3) Linear fixed effects
Coeff. s.e. Coeff. s.e. Coeff. s.e. Age/10 206.366*** 69.084 51.954** 20.882 15.097*** 3.361 (Age/10) squared –34.913*** 11.546 –8.475** 3.511 –2.578*** 0.558 (Age/10) cubed 1.903*** 0.640 0.441** 0.196 0.142*** 0.031 State pension age –0.788*** 0.268 –0.173** 0.084 –0.085*** 0.018 Couple –0.654 0.568 0.288*** 0.059 –0.036 0.031 Regional unemployment rate –0.088** 0.038 –0.006 0.014 –0.005** 0.002 Own–outright –0.387 0.275 –0.459*** 0.058 –0.073*** 0.020 Health stock 0.279*** 0.105 0.752*** 0.031 0.035*** 0.007 Constant n/a n/a –102.052*** 38.666 –27.993*** 6.702
No of cases Obs=4,348 Groups=617 Obs=11,152 Obs=11,152 Groups=1,945
Log likelihood −1,109.98 −6,030.07 R2 within 0.1286 Between 0.2133 Overall 0.2024
Note: ***= significant at 1% level **=significant at 5% level *= significant at 10% level. The standard logit model also includes a set of regressors that are time-invariant, such as gender, educational qualifications and regional dummies, which are not included in either the conditional logit or the linear fixed effects model. These comprise all of the variables show in table 2 except for those relating to health difficulties, health problems and whether an individual is registered disabled (since they form the vector Zit in equation 1 in section 2.1). Due to the health stock being calculated from the predicted index of eight ordered probits the standard errors are estimated using a bootstrapping technique. 1,500 bootstraps for each equation have been run. In the conditional logit and the linear fixed effects model we select a random sample of individuals (and then select all observations for that individual), while in the logit model we select randomly across all observations (i.e. observations of the same individual in different years are selected separately). Due to some of the random draws leading to non-convergence of the ordered probits the total number of bootstraps used in the calculation of the standard errors varies from 1,409 in the conditional logit and the linear fixed effects model to 1,390 in the standard logit.

25
Table 4: Economic activity equations (Alternative health question)
(1) Fixed effects logit
(2) Logit
(3) Linear fixed effects
Coeff. s.e. Coeff. s.e. Coeff. s.e. Age/10 319.196*** 61.904 98.833*** 25.685 19.526*** 3.152 (Age/10) squared –53.331*** 10.283 –16.093*** 4.263 –3.364*** 0.520 (Age/10) cubed 2.894*** 0.566 0.853*** 0.235 0.185*** 0.028 State pension age –0.976*** 0.228 –0.238*** 0.093 –0.101*** 0.013 Couple –0.210 0.467 0.329*** 0.067 –0.022 0.025 Regional unemployment rate –0.147** 0.058 –0.003 0.016 –0.005* 0.003 Own–outright –0.300 0.250 –0.444*** 0.065 –0.059*** 0.015 No health limit on work 1.865*** 0.397 2.695*** 0.123 0.143*** 0.022 Symmetric health impact −0.258** 0.123 −0.304*** 0.062 −0.022*** 0.008 Constant n/a n/a –199.940*** 51.427 –37.944*** 5.990
No of cases Obs=3002 Groups=475 Obs=8,906 Obs=8,906 Groups=1,666
Log likelihood −782.16 −4,605.98 R2 within 0.1132 Between 0.2424 Overall 0.2163
Note: ***= significant at 1% level **=significant at 5% level *= significant at 10% level. The IV-type technique is applied to the question: ‘Does your health affect the type or amount of work that you undertake?’ [YES/NO] As in Table 3, standard errors are estimated using a bootstrapping technique. 1,500 bootstraps for each equation have been run. All random draws converged as the 1st stage estimation is a probit as opposed to the ordered probit used in table 3.
26
Table 5 Sensitivity of economic activity to health measure
Specification
(1) Coeff (se)
(2) Coeff (se)
(3) Coeff (se)
(4) Coeff (se)
Predicted health stock No of difficulties:
Doing housework Climbing stairs Getting dressed
Walking 10mins Registered disabled No of health problems:
Arms/legs/hands Sight Hearing Skin/allergies Chest/breathing Heart/blood press. Stomach/digestion Diabetes Anxiety/depression Alcohol/drugs Epilepsy Migraine Other
0.28 (0.11)
–
–
–
–
−0.44 (0.12)
−1.57 (0.46)
−0.05 (0.06)
–
−0.49 (0.31) 0.11 (0.31) −1.12 (0.61) −0.77 (0.32)
−1.67 (0.47)
−0.06 (0.13) 0.13 (0.24) −0.36 (0.24) 0.12 (0.24) 0.12 (0.23) −0.39 (0.19) −0.24 (0.23) 1.99 (0.50) −0.44 (0.24) 0.14 (1.00) 0.44 (1.80) 0.41 (0.24) 0.28 (0.24)
–
– –
−1.35 (0.59) −0.84 (0.29)
−1.79 (0.47)
– – – – – – –
1.88 (0.49) – – – – –
Log likelihood −1,109.98 −1,095.91 −1,079.19 −1,088.69 Note: Coefficients are illustrated for the fixed effect logit.

27
Table 6: Economic Activity equations
pre- and post-1995 reform (selected coefficients)
(1) Fixed effects logit
(3) Linear fixed effects
Coeff. s.e. Coeff. s.e. State pension age −0.67** 0.28 −0.08** 0.02 Health stock 0.26** 0.11 0.03** 0.01 Eligible ICB 0.27 0.21 0.01 0.02 Hstock*eligible ICB 0.10 0.20 0.01 0.01 Log likelihood −1108.62
Test to exclude ICB vars: χ2(2) = 2.69 Prob>χ2 = 0.26
R2 within 0.1288 between 0.2125 overall 0.2023
Note: **=significant at 5% level
As in Table 3, standard errors are estimated using a bootstrapping technique. 1,500 bootstraps for each equation have been run. Due to some of the random draws leading to non-convergence of the ordered probits the total number of bootstraps used in the calculation of the standard errors varies from 1,397 in the conditional logit and the linear fixed effects model to 1,387 in the standard logit.
Figure 1 Numbers of claimants of Invalidity and Incapacity Benefit aged 50
and over, 1980 to 2000
Men
0
200
400
600
800
1,000
1,200
1980 1983 1986 1989 1992 1995 1998Year
65-69
60-64
50-59
Women
0
200
400
600
800
1,000
1,200
1980 1983 1986 1989 1992 1995 1998Year
60-64
50-59
Source: Banks et al (2002)

28
Appendix
Descriptive statistics for constructed health stock variable
Variable
25th percentile
Median 75th percentile
Mean (s. d.)
Health stock, those in work –0.157 0.319 0.701 0.190 (0.695) Health stock, those not in work –0.341 0.225 0.663 0.027 (0.886)
Health stock, all in baseline –0.248 0.270 0.681 0.108 (0.801) Change in health stock –0.291 –0.005 0.257 –0.027 (0.555) Difference between maximum
and minimum health stock 0.679 0.992 1.391 1.100 (0.637)
These ‘stocks’ are measured for the 617 individuals that make up the sample for our
“baseline” fixed effects logit model. This gives 4,348 person year observations (2,148 for people
who are in work and 2,200 for those who are out of work) and 3,558 observed first differences.
Whilst our health stock variable is constructed to be mean zero across all person year
observation in our full sample, we see that in the subset of the data that are used for estimating
the fixed effects logit model the mean is slightly positive: the tail of unhealthy people who are
dropped because they never work have health stocks that are sufficiently bad (on average) to
more than offset the fact that some healthy people are dropped from the fixed effects logit
because they work in every period.
These data show that it is uncommon for the measured health stock of an individual to
change by as much as one unit between one year and the next: 8 per cent (289 observations) of
the year-on-year changes that we observe are of one unit of more in either direction (of these,
170 are declines and 119 are increases).
However, as the median in the last row of the table indicates, almost half (actually 49 per
cent or 303 people) of the people in this sample have a maximum measured health stock that is
one unit or more greater than their minimum measured health stock across all years.