illinois river fingernail clam toxicity study
TRANSCRIPT

I LLINO SUNIVERSITY OF ILLINOIS AT URBANA-CHAMPAIGN
PRODUCTION NOTE
University of Illinois atUrbana-Champaign Library
Large-scale Digitization Project, 2007.


TA/LI/S
C A"flqcIllinois Natural History SurveyCenter for Aquatic EcologyTechnical Report 93/5
F-94-R
ILLINOIS RIVER FINGERNAIL CLAM TOXICITY STUDY
July 1, 1990 - December 31, 1991
Final Report to
Illinois Department of Conservation
by
Richard E. Sparks and Frank S. Dillon
Illinois Natural History SurveyRiver Research LaboratoryForbes Biological Station
P.O. Box 590Havana, IL 62644
Richard E. SparksPrincipal Investigator
3$JcrrAtAdDavid P. Philipp, DirectorCenter for Aquatic Ecology
Robert A. HerendeenActing Director
Natsl mistory Sur' yUibrary
3


DISCLAIMER
The findings, conclusions, and views expressed herein are those of theresearchers and should not be considered as the official position ofeither the U.S. Fish and Wildlife Service or the Illinois Department ofConservation.
Mention of product names and vendors does not imply endorsement by theU.S. Fish and Wildlife Service, the Illinois Department of Conservation,or the Illinois Natural History Survey.
ACKNOWLEDGEMENT OF SUPPORT
The Illinois River Fingernail Clam Toxicity Study (F-94-R) was supportedby the Federal Aid in Sport Fish Restoration Act (P.L. 81-681, Dingell-Johnson/Wallop-Breaux).
ii

EXECUTIVE SUMMARY
A filtering performance bioassay was developed for the fingernail clam, Musculiumtransversum, a dominant bottom-dwelling organism in many waters of the midwesternUnited States, and a key link in food chains leading from organic matter in water andsediment to fish and ducks valued by humans. The bioassay was used with a battery ofstandard bioassays to assess the toxicity of porewaters obtained from sediments of theIllinois River and its associated canals (known collectively as the Illinois Waterway),where fingernail clams and other benthic macroinvertebrates died out in 1955-1958 andhave not recolonized, despite the availability of seed populations in tributaries andisolated refugia within the river. Inhibition of filtering performance was easilymeasured with relatively simple equipment available in most laboratories and proved tobe directly related to the concentration of a reference toxicant, sodium cyanide. Thefiltering response of M. transversum was consistent with the mortality response of astandard reference zooplankter, Ceriodaphnia dubia: both organisms exhibited no responseto porewaters obtained from sediments from the lower Illinois River or from a referencesite on the Upper Mississippi River, whereas porewaters from 7 of 13 upstream sites weretoxic to C. dubia and 12 of the sites inhibited filtering performance of the clam. Theresponses of the clam and zooplankter were inconsistent with the responses of standardreference organisms, a freshwater alga (Selenastrum capricornutum) and a marinebacterium (Photobacterium phosphoreum), which were actually stimulated by someporewaters that were toxic to the clam and zooplankter. In view of the greatphysiological differences among plants, bacteria, and animals, this result was not toosurprising; e.g., ammonia is toxic to aquatic animals at concentrations that can be used asa nitrogen source by plants and some bacteria.
The toxic porewaters were treated to remove certain classes of toxicants, then retestedfor toxicity with C. dubia. Based on these tests and chemical analyses of the porewaters,the toxicity in the upper Illinois Waterway is attributable largely to ammonia, with somemarked local toxicity attributable to petroleum-based hydrocarbons.
During the course of this study M. transversum recolonized some areas in the upper Illi-nois Waterway where it had been absent and declined at the reference site and severalother places on the Upper Mississippi River. The baseline filtering rates of clams fromdifferent sources varied, probably depending on their previous exposure to stress,including ammonia, in the waterways. Clams from some sources on the lower IllinoisRiver and the Chicago waterways either did not respond or were actually stimulated byadded ammonia concentrations of up 0.09 mg/1 (un-ionized NH 3-N), indicating that theyeither were too stressed to respond or had been exposed to ammonia long enough to havebeen selected for ammonia tolerance. In contrast, added ammonia significantly inhibitedthe filtering of clams from the reference site in the Upper Mississippi River and twosites in the Chicago Sanitary and Ship Canal. In the short span of two months, weobserved abundant clam populations disappear at some sites in the Chicago waterways,leaving only dead shells. Although a general recovery in fingernail clam populations inthe Illinois Waterway does seem to be underway, this recovery apparently is set back byepisodes of sediment toxicity. An investigation similar to the one reported here shouldbe undertaken in the Upper Mississippi River where clam populations at several siteshave undergone sharp fluctuations recently.
iii

TABLE OF CONTENTS
Disclaimer...........................Acknowledgement of Support...........Executive Summary................Table of Contents....................List of Figures....................List of Tables.......................List of Appendices...................Index to Federal Aid Jobs............Acknowledgement......................1.0 Introduction............. .......
1.1 Importance of Fingernail Clams1.2 Relationship to Other Research.1.3 History of the F-94 Project....1.4 Objectives......... ...........
2.0 Methods.......... . .............
· · · · · · o···o·····o·····
and This Research......· · · o······e···········
· · t······t··l·t·t·tttl
OOOIIOOOOOOOO0+llO+I*+
· · · · tt··tl······ll··lt
2.1 Site Description..................................2.2 Sampling Design ....... .........................2.3 Sample Collection Procedures......... .............. .
2.3.1 Sediment Collection...........................2.3.2 Extraction of Sediment Porewater...............2.3.3 Collection of Surface Water..................
2.4 Chemical Analyses............................... .2.5 Collection and Maintenance of Fingernail Clams.......2.6 Fingernail Clam Gill Bioassay.....................2.7 Fingernail Clam Filtering Bioassay...................
2.7.1 Rationale and General Procedure .................2.7.2 Assessment of Response..........................
2.8 Reference Toxicant....................................2.9 Sensitivity of Clams from Different Sites to Ammonia......2.10 Reference Bioassays..................................
2.10.1 Reference Species and Responses.................2.10.2 Standardization of Responses..... ................2.10.3 Test Samples. ...................................
3.0 Results................ ......................3.1 Development of the Fingernail Clam Filtering Bioassay.....3.2 Comparison with Other Bioassays....... ................
3.2.1 Filtering Assay Compared to Gill Assay..............3.2.2 Filtering Assay Compared to Standard Bioassays.......
3.3 Pattern of Toxicity in the Illinois Waterway.............3.4 Toxicity Identification and Evlauation (TIE)..............3.5 Ammonia Tolerance of Clams from Different Sources.........
3.5.1 Field Observations.... ...........................Water Fleas.................. ...................
3.5.2 Comparative Bioassays.............................4.0 Discussion...........................................
4.1. The Fingernail Clam Filtering Bioassay..................4.2. Toxicity in the Illinois Waterway......................
5.0 Literature Cited... ....................................
iv
........ ii
........ ii
........ iii
........ iv
........ v
.. . . . v . V
. .. . . . . V
........ vi
........ vii
........ 1-1
........ 1-1
........ 1-1
........ 1-2
........ 1-3
........ 2-1
.........2-1
........ 2-1
........ 2-1
........ 2-1
........ 2-5
........ 2-5
........ 2-5
........ 2-7
........ 2-7
........ 2-9
........ 2-9
........ 2-11
........ 2-11
........ 2-11
........ 2-12
........ 2-12
....... 2-12
........ 2-13
........ 3-1
........ 3-1
........ 3-1
........ 3-1
........ 3-4
........ 3-4
........ 3-6
........ 3-6
........ 3-6
........ 3-11
........ 3-12
........ 4-1
........ 4-1
........ 4-1
........ 5-1

LIST OF FIGURES
Figure 2.1.
Figure 2.2.
FigureFigureFigure
FigureFigureFigureFigure
2.3.2.4.2.5.
3.1.3.2.3.3.3.4.
Figure 3.5
Location of Sediment Sampling Stationsin the Illinois Waterway ................................ 2-2Location of Sediment Sampling Stations in
Chicago-Joliet Area ................................... 2-3Steps in Fingernail Clam Filtering Bioassay...............2-10Toxicity Identification and Evaluation Procedure (TIE).....2-14Phase I Toxicity Identification and EvaluationProcedure (TIE).........................................2-15
Clam Filtering Response to a Reference Toxicant.............3-2Comparison of Gill Assay and Filtering Assay................3-3Responses of Five Organisms to Sediment Porewaters..........3-5Toxicity and Total Ammonia Concentrations,1989 and 1990........................................... 3-7
Correlation of Toxicity with TotalAmmonia Concentrations ................................... 3-8
LIST OF TABLES
Table 2.1. Location of Sampling Stations............................ 2-4
Table 3.1 Characteristics of Surface Water and SedimentPore Water................................................ 3-9
Table 3.2 Comparison of Responses of Fingernail Clams andTable 3.3 Observations on Status of Clam Populations...................3-13Table 3.4. Response of Clams from Different Sources to Ammonia..........3-14
LIST OF APPENDICES
Appendix Table A.1........................................... ........A-1

Index to Federal Aid Jobs
Sections, Tables, FiguresMethods Results
Toxicity screening
Toxicant fractionationand testing
Report preparation
Section 2.2Figures 2.1, 2.2,Table 2.1
2.3
Section 2.9.3Figure 2.5
Section 3.3Figure 3.3
Section 3.4Table 3.2
This completion report
vi
JobNumber
JobTitle

ACKNOWLEDGEMENT
Many people contributed to this project. Dr. Anthony A. Paparo,Department of Zoology and School of Medicine, Southern IllinoisUniversity at Carbondale, did much of the early development of a variety
of methods for assessing responses of clams and mussels to contaminants.Dr. Philippe Ross, who at the time was in the Center for Aquatic Ecology
at the Natural History Survey in Champaign-Urbana, assisted Dr. Paparo
in preparing the initial proposal. Ms. Diane Dillon, Mr. JeffreyArnold, and Mr. Kurt Pemberton provided valuable technical assistance at
Western Illinois University, as did Ms. Louann Burnett at the Natural
History Survey in Champaign, and Mr. K. Douglas Blodgett at the Natural
History Survey's Long Term Resource Monitoring Station in Havana. Mr.
Arnold assumed much responsibility for running bioassays and analyzing
results toward the end of the project period. Mr. Blodgett wrote the
LOTUS program for converting total ammonia to un-ionized ammonia and
prepared the maps of the study area and several of the figures used in
this report. Ms. Camilla Smith provided secretarial assistance at the
River Research Laboratory of the Stephen A. Forbes Biological Station in
Havana. The research could not have been done without the laboratoryfacilities, office space, and equipment provided by Dr. Richard V.
Anderson and the Department of Biological Sciences at Western Illinois
University--to both we express our great appreciation. We also thank
the following people at the Illinois Department of Conservation: theproject officer, Mr. William Bertrand, Administrator of the Streams andRivers Program; Mr. Larry Dunham, Administrator Research and Operations;and Mr. Michael Sweet, Federal Aid Coordinator in the Division ofResource Management Finance. The Acting Head of the Center for AquaticEcology of the Illinois Natural History Survey, Dr. Daniel Soluk, alsoreviewed the report. Finally, this research would not have been donewithout the grant from the Federal Aid in Sport Fish RestorationProgram, administered by the Region 3 U.S. Fish and Wildlife Serviceoffice in Twin Cities, MN.
vii

July 31, 1993
1.0 INTRODUCTION
1.1 Importance of Fingernail Clams and this Research
Fingernail clams (family Sphaeriidae) are dominant bottom-dwellinganimals in many waters of the midwestern United States. They are foundin major rivers (Gale 1969), lakes (Emmling 1974), and bottomlands(Hubert 1972). They are key links in food chains leading from nutrientsin water and mud to fish and ducks which are utilized by humans,including the highly-valued channel catfish, Ictalurus punctatus.Fingernail clams filter algae, bacteria and organic matter from water.Because the clams are small (<15mm or 0.6 in. long when full-grown) incomparison to mussels (family Unionidae), they are readily consumed bybenthivorous fish. One species of fingernail clam, Musculiumtransversum, is especially important as a food item for fish (Ranthum1969 and dude 1968 and 1973) because it occurs at densities up to100,000/mi or 83,600/yd (Gale 1969), has a fragile, easily-masticatedshell, and contains 13% protein and 2% fat (dry weight basis, Thompsonand Sparks 1978). Also, Musculium transversum has been used as anindicator species for the benthic food base, representing other smallmollusks, including snails, as well as mayflies and other burrowingaquatic insects that were virtually eliminated from certain reaches ofthe Illinois River by 1958 (Sparks 1984; Paloumpis and Starrett 1960).
Musculium transversum has not recolonized the Illinois River inits former numbers since 1958, despite the fact that seed populationsare available in tributaries and the clam is capable of quicklyrepopulating an area because it has a very short life cycle--33 days inmidsummer (Gale 1969). Our working hypothesis was that if we can findout what prevents the fingernail clam from recolonizing portions of theIllinois River where it was formerly abundant, we will have a strongindication of what killed the other species. Once the inimical factorsare identified, they could perhaps be eliminated or controlled, so thatthe benthos of the river would recover, to the benefit of benthivorousfishes and diving ducks.
Declines of fingernail clams have not been limited to the IllinoisRiver. Wilson et al. (unpublished manuscript) concluded thatpopulations of fingernail clams declined significantly in five of eightnavigation pools on the Upper Mississippi River for which historicaldata existed, and warned that these decreases could signal a large-scaledeterioration in the health of this ecosystem. Results of research onclam declines in the Illinois River might help explain or even forestallsimilar declines in other rivers, such as the Upper Mississippi River.
1.2 Relationship to Other Research
Previous research demonstrated that the inimical factor wasassociated with sediment, rather than with the water itself, becausefingernail clams survived in Illinois River water that was filtered toremove sediment (Sparks, Sandusky and Paparo 1981), and bulk sedimentsobtained from backwaters and floodplain lakes along the river weretoxic, as measured by a clam gill bioassay (Sparks, Sandusky and Paparo1983; Blodgett et al. 1984).
CLAMTOX Intro Page 1-1

July 31, 1993
In 1988, we obtained funding from the Illinois Department ofEnergy and Natural Resources and the Illinois Environmental ProtectionTrust Fund to use a battery of standard bioassays to assess the patternof toxicity in the river sediments and, if possible, to identify thetoxic agents by treating the sediments to remove certain contaminantsand then reassaying them to check for reductions in toxicity. The USEPA(Mount and Anderson-Carnahan 1988 and 1989; Mount 1988) refers to theseprocedures as Toxicity Identification Evaluation (TIE). The pattern oftoxicity might indicate potential sources: e.g., if toxicity increasedupstream, the Chicago urban area would be suspect. If toxicityincreased below major tributaries that drain agricultural land in thecentral part of the state, then agricultural sources would be suspect.The clam gill bioassay is not a standard bioassay and so was notincluded. The purpose of F-94 was to use the fingernail clam bioassayin conjunction with the standard bioassays, to insure that the resultswere relevant to the problem of the fingernail clam decline andsubsequent failure to recolonize. It is also useful to know whether thestandard reference organisms are in fact good surrogates for keyorganisms that are important in particular aquatic ecosystems.
1.3 History of the F-94 Project
The clam gill assay was developed by Dr. Anthony Paparo,Department of Zoology and School of Medicine, Southern IllinoisUniversity at Carbondale. He became incapacitated during the course ofthe project and could no longer continue the bioassays. His bioassayprocedure requires special equipment and skills because it involvesmicrosurgery on the small clams and microscopic observation of particletransport rates and rates of beating of cilia on the exposed gills ofthe clams. The project was amended to develop a much simpler functionalassay to substitute for the more complex technique, and the location ofthe work was shifted from Southern Illinois University to WesternIllinois University in Macomb. The simpler procedure measures theability of intact clams to filter yeast suspensions (which serve as foodfor the clams) from water, following exposure to test solutions. Bothmethods are described in this report because some interesting resultswere obtained with the original method.
Two other surprises occurred during the project, one pleasant andone unpleasant, that required modifications to our original plans. Theunpleasant surprise was a collapse in fingernail clam populations andpersistent low numbers during the period 1988-1992 in Pool 19 of theUpper Mississippi River, which had always been the source of ourbioassay clams and of our supposedly uncontaminated control sediment.For a time we could not obtain enough clams to run bioassays, until welocated another source, but with much lower densities, in Swan Lake onthe lower Illinois River. The pleasant surprise was the reappearance offingernail clams in several locations in the Illinois Waterway includingportions of the canal system in and near Chicago. Since clamsreappeared in some locations where our initial results had indicatedtoxicity, we ran a series of bioassays with stocks of clams fromdifferent parts of the river to determine whether some stocks were moretolerant of toxic sediments than others, perhaps having undergone
CLAMTOX Intro Page 1-2

July 31, 1993
selection for resistance through a long history of exposure to localtoxicants.
1.4 Objectives
In summary, the objectives of the project, as modified by thecircumstances above, were: (1) to develop a simple functional bioassayfor the fingernail clam, Musculium transversum, (2) to compare the newbioassay to the previous technique (the gill assay) and to bioassayswith standard reference organisms, (3) to use the bioassay, inconjunction with the standard bioassays, to assess the pattern oftoxicity in sediments of the Illinois River, (4) to use the bioassay,again in conjunction with standard bioassays, to identify toxic agentsin the sediments, and (5) to determine whether stocks of clams fromdifferent parts of the river were differentially sensitive to the toxicagents. Objectives (1), (2), (3), and (5) were met. Objective (4) waspartially met, by testing treated (5 treatments to reduce toxicity)sediment porewater from one location on fingernail clams, as well as ona standard reference organism, the water flea, Ceriodaphnia dubia, whoseresponses more closely paralleled those of the clam than any of theother three reference species we tested. The water flea was used forall the other toxicity identification procedures because the new clamassay was not developed as quickly as we had hoped and because ofadditional delays in finding a new source of clams following the declinein our original source population in the Upper Mississippi River.
CLAMTOX Intro Page 1-3

CLAMTOX Method
2.0 METHODS
2.1 Site Description
Today's Illinois Waterway is approximately 327 miles (526 km) longconnecting Lake Michigan and the Chicago-Joliet metropolitan area withthe Mississippi River and the agricultural heartland, near Grafton,Illinois (Figure 2.1). The headwaters are in the highly industrializedChicago area where the flow of the Chicago River was reversed to carrywastes away from Lake Michigan into the Illinois River via the ChicagoSanitary and Ship Canal and the downstream portion of the Des PlainesRiver (Figure 2.2). The Calumet Sag Channel enters the Sanitary andShip Canal near Lemont. The Illinois River proper begins with theconfluence of the Des Plaines and Kankakee rivers, and flows through apredominantly agricultural drainage, although the industrial city ofPeoria is situated approximately mid-way along the waterway.
Locations on the waterways are designated by river mile asrecorded in river charts prepared by the U.S. Army Corps of Engineers(1987) and by markers along the waterways, starting with mile 0.0 at theconfluence with the Mississippi and proceeding upstream to Chicago. Thefollowing abbreviations are used in the text, figures, and tables toidentify reaches of the waterway, and stations are identified by reachabbreviation and river mile:
IR Illinois River properDP Des Plaines RiverCS Calumet Sag ChannelSS Chicago Sanitary and Ship CanalCR Chicago River
The one reference station on the Upper Mississippi River is located377.0 miles above the confluence with the Ohio River and is designatedMR 377.0. The locations of the sample stations are given in Table 2.1and Figures 2.1 and 2.2. In accordance with Corps of Engineersterminology, the designation "left bank" or "right bank" assumes theobserver is facing downstream.
2.2 Sampling Design
Nineteen sampling stations were established throughout theIllinois Waterway (Figures 2.1 and 2.2). Samples were collected from 15stations from November 1989 to June 1990, and from all 19 stations fromNovember 1990 to June 1991 (Table 2.1).
2.3 Sample Collection Procedures
2.3.1 Sediment Collection. It is important to limit thedisruption of the sediment so that toxicity evaluations are conductedunder conditions that closely match the in situ conditions (ASTM 1991).The most appropriate sediment sampling device is study specific.Sediment corers generally disrupt the sediment little but collect alimited sample volume (ASTM 1991). This study employed a battery ofbioassays as well as the TIE procedures, all of which used sediment
July 31, 1993 Page 2-1

CLAMTOX Method
Figure 2.1. Location of sediment sampling stations on the Illinois Waterway. Stations arc
identified according to river miles: Illinois River miles (IR) start at Grafton at mile 0.0
and proceed upstream to Chicago. A reference station was established on the Mississippi
river (MR), 377 miles above the confluence with the Ohio River.
July 31, 1993 Page 2-2

CLAMTOX Method July 31, 1993 Page 2-3
c 0
(It
4- 4-
( * ( I
-U5 o *
. o 4
co
S0
or-
am -
4 .C o
. 0)
(0 U -
C- -
0C 0U 0 )
S CS (U
U 4)
oM 0 ;.'
O Ur -
4-J 0
cn U
*c
S.~ C)..
0 O(.2 In*
O 0) 2
.C 7 J2-' E
I
U
3
m
z
c
LU
CL
4)
Q..
m
"
4-
0)(U
cfC
41
I-
gs
0
i
C
CO
C0.
4-'
4'Q
4)>C)
(U
0)
-c
C.
I-t
In
00
0)L.(U
(U4)L.(U
0C)(U0
Ux
CO
(U3L.4)4-'(U3
0)
4-'
C30
'4-
'4-
0
4.'C-)0)C..
~0
(U
0)
(UU
0)
C-.-4:

CLAMTOX Method
Table 2.1. Location of sampling stations.
River Mile Description
CR 326.4 North Branch of Chicago River at Michigan Avenue BridgeCR 324.8 South Branch of the Chicago River at Harrison Street Bridge
CS 318.5 Upstream of Division Street Bridge on Calumet Sag ChannelCS 307.4 Upstream of 104th Street Bridge on Calumet Sag Channel
SS 317.0 -5 m (16 ft) from left bankSS 315.3 -25 m (82 ft) from left bankSS 313.0 -2 m (6.5 ft) from right bank downstream of Route 171 BridgeSS 310.0 -10 m (33 ft) from left bank upstream from Justice Navigation LightSS 292.2 10 m (33 ft) upstream of sunken barge and 30 m from right bank
DP 286.3 Left bank -300 m (984 ft) upstream of Brandon Road Lock and DamDP 281.1 -30 m (98 ft) from left bank across from Olin ChemicalDP 277.0 Upstream of Du Page River Daymark -500 m (1,639 ft) from right bank
IR 248.2 -100 m (328 ft) upstream of Ballards IslandIR 215.0 Center of Turner LakeIR 180.0 Upper Peoria Lake, south of ChillicotheIR 125.5 SE Corner of Lake ChautauquaIR 72.0 Center of Meredosia LakeIR 6.0 Entrance to Swan Lake
MR 377.0 Montrose Flats, Pool 19, Mississippi River
Note: The Illinois Waterway includes the Illinois River (IR), Des Plaines River(DP), Chicago Sanitary and Ship Canal (SS), Chicago river (CR), and Calumet SagChannel (CS). The mileages start at IR 0.0 at the confluence with the Mississippiand proceed upstream to Chicago. Mileages on the Upper Mississippi River (MR) startat the confluence with the Ohio. "Right" and "left" assume the observer is facingdownstream. m = meters.
July 31, 1993 Page 2-4

CLAMTOX Method
porewater. The volume of porewater needed for this work made the use ofsediment corers impractical. We used a 25.4-cm (10-inch) Ekman dredgethat works well in the soft to semi-soft sediments that characterize theIllinois Waterway and collects a relatively large sample volume (ASTM1991).
The sampler was rinsed with river water at the site prior tosediment collection. The sample was placed in prewashed (Biosoap wash,ultrapure water rinse) high density polyethylene containers. Highdensity polyethylene containers are relatively inert and are optimal forsamples contaminated with a variety of chemicals (ASTM 1991). Thecontainers were filled completely to achieve zero sample head space.Sample containers were placed on ice as soon as possible followingcollection (never exceeding 2 hours). Samples were transported to thelaboratory and stored at 4UC (39.20 F) for no more than two weeks.
2.3.2 Extraction of Sediment Porewater. We used sedimentporewater in our toxicity tests. Numerous studies (Adams, Kimerle andMosher 1985; Swartz et al. 1985; Knezovich and Harrison 1988; Connell,Bowman and Hawker 1988; Swartz et al. 1988, Di Toro et al. 1992) haveshown that porewater is an appropriate surrogate for bulk sediment.Porewater can be collected from sediment samples by several methods:centrifugation, squeezing, suction, and equilibrium dialysis (ASTM1991). Centrifugation is generally used if large volumes of porewaterare required (Edmunds and Bath 1976). Constituents such as salinity,dissolved inorganic carbon, ammonia, sulfide, and sulfate are generallynot affected as long as oxidation is prevented; however, dissolvedorganic carbon (DOC) and dimethylsufide may be significantly reducedusing this method (Howes, Dacey and Teal 1985). Sediment porewater wasextracted by centrifugation at 4000 g (g = the acceleration due togravity) at 40C (39.2°F) for 45 minutes. The supernatant porewater wassiphoned through a Nitex 110-mesh screen and stored with zero head spaceat 40C (39.20F) in a decontaminated cubitainer for a maximum of 1 week.The time from collection to testing ranged from 1 to 6 days, andaveraged 2.6 days for all sediments.
2.3.3 Collection of Surface Water. Surface water samples werecollected just prior to collection of sediment. Surface water wascollected from approximately mid-depth in the water column using a VanDorn sampler. Samples were placed in pre-cleaned cubitainers andimmediately placed on ice. Surface water samples were stored at 4°C(39.2 0 F) for a maximum of one week.
2.4 Chemical Analyses
Routine chemical measurements were taken on both surface water andporewater samples. Samples were brought to ambient temperature (20-24°C, 68-75°F) prior to making the following measurements in thelaboratory:
July 31, 1993 Page 2-5

CLANTOX Method
SURFACE WATER PORE WATER
Dissolved Oxygen Dissolved OxygenpH pHConductivity ConductivityAlkalinity AlkalinityHardness HardnessTotal Ammonia-N (ammonia Total Ammonia-Nmeasured as nitrogen, N)
Total Cl (chlorine)H2 S (hydrogen sulfide)Sulfide
Dissolved oxygen was measured using a standard Y.S.I. Model 57oxygen meter with a Y.S.I. Model 5739 probe. Temperature and pH weremeasured using a Jenco Microcomputer pH-Vision 6071 pH meter with atemperature-compensating Ross electrode filled with Ross referenceelectrode filling solution #81-00-07. The pH meter was calibrated withCole-Parmer pH 4.01 and 7.00 standard buffer solutions before use.Specific conductance was measured using a Y.S.I. Model 35 ConductanceMeter with a Y.S.I. Model 3401 probe. Total alkalinity was measuredusing the ASTM (1982) standard titration method. Fifty ml (1.5 fl oz)of sample water was stirred by a magnetic stirrer at medium speed whilethe sample was titrated with 0.02 N H2 SO4 to a pH of 3.7. Millilitersof titrant were multiplied by 20 to calculate mg/l total alkalinity asCaCO 3 . Total hardness, as CaCO3, was measured by the Hach burettemethod (Hach 1985) adapted from the EDTA titrametric method of APHA(1976). Total ammonia nitrogen was determined using the HachNesslerization method (adapted from APHA 1976). The method was modifiedby adding 1 drop of Rochelle salt solution prior to the Nessler reagentto prevent precipitation of magnesium hydroxide in the sample cell inwater samples where hardness exceeded 100 mg/1l CaCO3 . Results arereported as mg/l total ammonia nitrogen. Total residual chlorine wasdetermined by the DPD colorimetric method, sulfide by the methylene bluemethod, and hydrogen sulfide by the lead sufide method, following theHach Water Analysis Handbook (1985), which is adapted from APHA (1976).All instrumentation was calibrated prior to testing.
We intended to calculate the fraction of the total ammonia thatexisted in the un-ionized state during the toxicity tests (see below)using aqueous ammonia equilibrium calculations and knowing the pH andtemperature (Emerson et al. 1975). In aqueous ammonia solutions anequilibrium exists between ammonia in the highly toxic un-ionized form(NH3) and ammonia in the relatively nontoxic ionized form (NH4 ). Thedominant factor regulating the equilibrium between the two forms is pH,with the temperature having a lesser effect. We were not able tocalculate un-ionized ammonia concentrations in the toxicity testsbecause the pH of the porewater drifted slightly during the tests.Temperature was held constant. However, our subsequent analysis of thecorrelation between toxicity and total ammonia is justified because theinitial pHs of the samples were similar (6.5-7.25) and all drifted in asimilar manner, so the average un-ionized ammonia concentrations duringthe tests were some consistent fraction of the total ammoniaconcentrations.
July 31, 1993 Page 2-6

CLAMTOX Method
Measurements of total organic carbon (TOC) were performed on bulksediment samples. The results are expressed in percent organic carbon.
2.5 Collection and Maintenance of Fingernail Clams
Barely enough fingernail clams were obtained from Pool 19,Mississippi River (MR 377.0) at the beginning of the project to run thegill assay described below. Another source of clams eventually waslocated in Swan Lake on the lower Illinois River, near IR 6.0, and thesewere used throuc' )ut most of the project period to develop the bioassaythat measured filtering performance and to test the toxicity ofporewater from sediments. Finally, near the end of the project period,we collected clams from MR 365.5, IR 5.1, and two sites in the Chicagowaterways (Sanitary and Ship Canal, SS 292.7; Calumet Sag Channel, CS318.5; see Figure 2.1 and 2.2), to compare the sensitivity of clams fromthe different sites to ammonia. We also recorded observations on thenumber of live clams and dead shells at several other sites where we didnot obtain clams in sufficient numbers to run bioassays.
Sediments were collected with an Ekman dredge and sieved through awash bucket with a 500-micron screen. Clams were hand-picked from thescreen and kept in a cooler with aerated river water until delivered tothe laboratory. They were held in aquaria in river water and fed asuspension of the green alga, Selenastrum capricornutum, and a yeast-Cerophyl-trout food (YCT) that is normally used for Ceriodaphnia dubia(NETAC 1989b). Clams were used within 14 days of capture. They wereplaced in synthetic dilution water 1 hour prior to being tested. Thetotal hardness of the dilution water was adjusted to match that of thesediment pore water, by adding the appropriate salts to increasehardness, or by dilution with distilled, deionized water to reducehardness.
Although every effort was made to obtain clams in the field thatwere approximately the same size, and again to choose clams of the samesize from the holding aquaria for the experiments, we were forced to usea wider range of sizes than we wished, because it took so much effort tofind clams at the field sites. The shell lengths of clams used in theseexperiments ranged from 5.9 to 12.0 mm (0.236-0.480 in), averaging 9.0mm (0.360 in).
2.6 Fingernail Clam Gill Bioassay.
Dr. Anthony Paparo conducted the gill assays on clams kept for atleast seven days in circulating, aerated river water in an InstantAquarium (temp. 17-200 C 62.6-680 F, pH 7.5) in a laboratory at SouthernIllinois University in early April 1989. Before each experiment, clams5.0-10.0 mm in length were placed in finger bowls of the same riverwater. The posterior adductor muscles were cut, and each gill with itsbranchial nerve, visceral ganglion, and a piece of adductor for support,were isolated. The ganglion/nerve/gill preparation was pinned to arubber mat glued to the bottom of a Petri dish containing river water,and the dish was placed in a holder fastened to the adjustable stage ofa microscope. Under magnification (100OX), the gill was seen to consistof numerous parallel gill filaments. Three major types of ciliatedcells were clearly distinguished: frontal, laterofrontal and lateral.
July 31, 1993 Page 2-7

CLANTOX Method
The rate of beating of the lateral cilia was measured. These cilia beatin such a way that metachronal waves appear to travel in oppositedirections along the two sides of each gill filament.
The optical field was selected for observation by measuring 2.0 mmin an anterior direction from the visceral ganglion. A field of viewcontained about 50 gill filaments which were grouped for ease ofobservation into three vertical columns. By moving the microscope stageeach gill filament was followed from its dorsal attachment at the axisto its free ventral end. Each column was subdivided into fourhorizontal rows, demarcated by their fixed number of interfilamentaryjunctions, from dorsal to ventral end. The rate of ciliary beating inbeats per second was measured by synchronizing the rate of flashing of acalibrated stroboscopic light (used in place of the substage lamp) withthe rate of beating of the cilia. Synchronization was achieved when themetachronal wave appeared to stand still. The rate was then read from adigital flash rate on the strobe. Measurements were made from dorsal toventral border, and from left to right across the field: 12 sets ofmeasurements for each gill preparation, which then were averaged.
Sediment suspensions were prepared by adding the same arbitraryvolume of spoon-mixed wet sediment from each site (collected from Pool19, Upper Mississippi River, on 21-22 March 1989, and from the UpperIllinois River 28-29 March) to one liter of standard molluscanphysiological solution. The test solutions then were diluted with thephysiological saline solution until they all had similar particleconcentrations, as determined by counting the particles with ahemocytometer. Control suspensions were prepared to match the averageparticle concentration of the test solutions, only using yeast insteadof sediment. Blodgett (1983) reported the following ranges in meansediment and yeast suspensions from similar experiments:
Particle Size Density Cgncentration'm mg/l 10 particles/1
(.04x10 -3 in) (ppm) (1.06x10⁶ particles/qt)
sediment 2.9 - 7.2 29.3 - 78.4 2.1 - 3.9
yeast 6.8 - 7.2 46.3 - 59.1 2.5 - 2.7
The suspensions were pumped across the Petri dishes containing thegill preparations via a four-channel, variable-speed pump with a flowrate of about 0.5 ml/min (.015 fl oz/min). The planetary gear mechanismof this pump ensured minimum pulsing and stable drift-free flow,permitting accurate measurement of ciliary movement. A positivedisplacement piston metering pump with micrometric adjustment removedthe solution from the other side of the dish, thereby maintaining acontinuous flow of solution across the dish. The temperature wasmaintained at 200 C (680) by circulating water from a constanttemperature bath at 2.0 ml/min (.06 fl oz/min) through stainless steeltubing in the movable microscope platform that held the Petri dish.Dissolved oxygen remained at 8.0 ppm during the exposure periods, andthe pH was monitored and adjusted to 7.5 by adding acid or base, ifnecessary.
Ten gill preparations were used for each sample tested: fivecontrols (exposed to yeast suspensions) and five experimental
July 31, 1993 Page 2-8

CLAMTOX Method
preparations (exposed to the sediment suspensions). Measurements weremade prior to introduction of the suspensions and again after 30 minutesof exposure to the suspensions. The measurements were averaged acrossthe five animals in each group, and the results expressed as apercentage increase (stimulation) or decrease (inhibition) in ciliarybeating rates of the experimental animals relative to the controls. In20 previous control tests with equivalent yeast suspensions the gillpreparations showed a net change of 0 ciliary beats/sec + a standarddeviation of 1.25 during the 30-min. exposure period (Blodgett et al.1984). Therefore, a reduction in the ciliary beating rate of the testgills was regarded as a response to toxicity in the sediments and not tothe particle concentrations.
2.7 Fingernail Clam Filtering Bioassay.
2.7.1 Rationale and General Procedure. The fingernail clamfiltering assay developed in this study is based on observations byAldridge, Payne and Miller (1987), Sparks and Sandusky (1983), Sparks,Sandusky and Paparo (1981), and Anderson, Sparks and Paparo (1978) thatstresses, including toxicants, impair the ability of bivalves to filterparticles from water (including food particles, such as yeast, on whichthe clams feed). Only the 1990-1991 porewater samples were evaluatedusing this assay because it was not fully developed until late 1990. Adetailed description of the general procedure follows.
Fingernail clams are first exposed to the porewater sample for onehour. They are then removed from the test solution and given afiltering performance test, which consists of placing them in a yeastsuspension in dilution water (10% by weight, based on dry weight ofyeast) and allowing them to filter for one hour (Figure 2.3). Twocontrols are used: the first consists of the yeast suspension alone andis used to determine the change in concentration due to settling of theyeast. The second control determines the baseline filtering rate ofclams exposed for 1 hour in clean, uncontaminated water.The yeast concentrations are measured indirectly at the beginning andend of the filtering period, by measuring light transmission in watersamples from the test chambers with a spectrophotometer, then using aregression equation that relates light transmission to measured yeastconcentrations:
Y = yeast concentration (mg/1)
T = % transmittance of light
Y = 676.378 - 6.788 T
The filtering rates of the exposure and control tests are determined bytaking the initial yeast concentration minus the final concentrationminus the amount settled divided by the weight of the test organisms.
July 31, 1993 Page 2-9

CLAMTOX Method
Exposure Phase
Filtering Rate
Measure Final Yeast Concentration
Figure 2.3. Steps in fingernail clam filtering bioassay.
July 31, 1993 Page 2-10

CLAMTOX Method
Filtering rates are expressed as the concentration of yeast filtered perunit weight of organisms per unit time.
Ci = initial concentration of yeast
Cf = final concentration of yeast
W = live weight of clams, in g (grams), x 0.035=oz
Cs = change in yeast concentration due to settling
Ci - C - CsS- - = filtering rate in mg (milligrams) yeast/g clam/hourW (mg x 3.527 x 10 = oz)
The organism weights are for whole live animals, with shells, blotteddry with Chem Wipes, a tissue type of absorbent material. Five clamswere used in each test chamber.
2.7.2 Assessment of Response. The filtering rate of clams exposedto the test solutions is then compared to the control to determine thedegree of response. Since there is natural variation in the filteringrate of healthy clams, we decided to calculate a threshold value for achange in filtering rate that we would consider to be beyond the rangeof normal variation. We took the maximum range of variation infiltering rate observed in all the control trials and added two timesthe standard deviation. This threshold amounted to 10.6% of the meancontrol value, so filtering rates would have to decline more than 10.6%in relation to the control before the test solution would be regarded astoxic (inhibitory). Likewise, the filtering rate would have to increasemore than 10.6% before the test solution would be classified asstimulatory.
2.8 Reference Toxicant.
It is useful to have a bioassay with a graded response so thatsampling sites can be ranked according to relative toxicity, thusrevealing spatial and temporal trends that might indicate sources. "Allor none" (death or survival, toxic or nontoxic) responses are lessuseful for this purpose. In order to determine whether filteringinhibition was proportional to toxicant concentration, we tested areference toxicant, cyanide, over a range of concentrations (1-100 mg/ladded as sodium cyanide salt) known to bracket a lethal level for fishand other standard test species.
2.9 Sensitivity of Clams from Different Sites to Ammonia.
This component was added late in the project when it becameobvious that fingernail clams were reappearing in portions of theIllinois Waterway where our Toxicity Identification Evaluation (TIE)procedures had identified toxicity attributable to ammonia. Fingernailclams from the various sources were exposed to dilution water as acontrol and to three concentrations of ammonia in dilution water, to
July 31, 1993 Page 2-11

CLAMTOX Method
determine whether clams from different sites differed in their tolerancefor ammonia. The ammonia was added as ammonium chloride, measured inthe test solutions as described in section 2.3, and the un-ionizedammonia nitrogen, NH3-N, concentrations calculated and reported.
2.10 Reference Bioassays.
2.10.1 Reference Species and Responses. We compared the responseof fingernail clams, Musculium transversum, to the responses of fourstandard reference species, as determined in the DENR project (Sparks,Ross and Dillon 1992). The standard bioassays employed the followingorganisms- the marine bacterium, Photobacterium phosphoreum(MicrotoxTM), the freshwater alga, Selenastrum capricornutum, therotifer, Branchionus calyciflorus, the daphnid, Ceriodafqnia dubia, andthe sphaerid clam, Musculium transversum. The Microtox assay measuresthe luminescence of P. phosphoreum (Bulich, Greene and Isenberg 1981).Inhibition of this luminescence is considered a toxic response. The S.capricornutum assay measures the inhibition of photosynthetic activityof an algal culture as a measure of toxicity (Ross, Jarry and Sloterdijk1988). The rotifer assay is a mortality test (Snell and Personne 1989).The C. dubia assay was the standard USEPA (1985) acute assay (48-hourmortality). The dilution water used initially ijMthe toxicity tests andfor maintaining the organisms was 1 part Perrier bottled water to 9parts distilled water passed through a Millipore Ultrapure water system.Following a contaminant scare, all Perrier water was removed from themarket, so we made our own systhetic dilution water, starting with waterfrom the Ultrapure system and adding salts (Marking and Dawson 1973).
Results of the C. dubia bioassay are expressed in toxicity units,as well as 48-hour LC50s, where toxicity units = 100/(48-hour LC50).The 48-hour LC50 is the percent dilution of porewater (or treatedporewater) that kills 50% of the test organisms in 48 hours. Forexample, if a 7% solution (by volume) of porewater in dilution water isthe LC50 (see site CS307.4, Table 3.1 in the Results Section), then:
7% = 48-hour LC50100/LC50 = 100/7 = 14.3 toxic units
meaning that the toxicity in the porewater is more than 14 times thelethal dose.
2.10.2 Standardization of Responses. The results of the variousassays were standardized for easier comparisons. The treatment resultswere divided by the control results and then 1 was subtracted from thequotient. A negative value indicates inhibition (toxicity), a positivevalue indicates stimulation, and 0 indicates no response (no difference
July 31, 1993 Page 2-12

CLAMTOX Method
with respect to the control).' If we use the fingernail clam filteringbioassay as an example:
T = test response to sample of sediment porewater
C = control response to uncontaminated dilution water
T = 3.4 mg yeast/g clam/hour
C = 6.5 mg yeast/g clam/hour
T/C = 3.4/6.5 = .52
.52 - 1.00 = -.48 A decline of 48% from the control value,a marked inhibition of the filtering abilityof the clams.
2.10.3 Test Samples. A battery of bioassays, including the clam filter-ing bioassay, were used on raw porewater from Pool 19 of the Upper MississippiRiver and from sites along the entire length of the Illinois Waterway, butconcentrated in the Chicago metropolitan area (Figures 2.1 and 2.2). Thepurpose of this comparison was to determine whether the various bioassaysconsistently identified the same upstream-downstream patterns, including "hotspots" of toxicity. In addition, the clam filtering bioassay was compared tothe Ceriodaphnia dubia bioassay, using treated porewater from a "hot spot" onthe Des Plaines River portion of the waterway (DP 277.0). The purpose of thelatter test was to determine how well the filtering bioassay performed withinthe Toxicity Identification Evaluation (TIE) protocols developed for usewith C. dubia and other standard reference species at the USEPA'sNational Effluent Toxicity Assessment Center (NETAC 1989a; Mount 1988;Mount and Anderson-Carnahan 1988 and 1989).
The goal of TIE is to separate toxicants from nontoxic compounds, usingsample fractionation techniques in combination with bioassays to determinewhich fractions contain most of the toxicity. The TIE approach consists ofthree phases outlined in Figure 2.4. Only samples from Phase 1 treatmentswere assessed with the clam filtering bioassay. Phase 1 characterizes thephysical and chemical properties of the sample toxicants by altering orrendering biologically unavailable generic classes of compounds (Mountand Anderson-Carnahan 1988). After Phase I the toxicants are classifiedas having characteristics of cationic metals, non-polar organics,volatiles, oxidants, or substances not affected by Phase I methods. ThePhase I treatments are outlined in Figure 2.5. The primary tool ofPhase I is manipulation of sample pH. The questions asked are: (1) Istoxicity different at different pHs? (2) Does sample manipulation atdifferent pHs affect toxicity? (3) Is toxicity attributable to cationicmetals, such as copper or lead? (4) Is toxicity associated withoxidizing agents, such as chlorine or chloramines? The graduated pHtest answers the first question and is designed to indicate a pH-dependent toxicant such as un-ionized ammonia. The second question isanswered by performing the following tests at different pHs: aeration,filtration and reverse-phase, solid phase extraction (SPE) on C18columns. Aeration tests determine whether toxicity is attributable tovolatile or oxidizable compounds. The filtration tests indicate whether
July 31, 1993 Page 2-13

CLAMTOX Method
0
>-*
0H
Hz
H
0H
July 31, 1993 Page 2-14
HQ)
0H
Vl)
o
o
',-0
Q.
4J
0
F4
.4.40
cl
C
O0
'-4

CLAMTOX Method
4
-. LILJ
jyl 4.c,. .
/0 O
July 31, 1993 Page 2-15
cl
0
o
* 00cl
44
l-I*4 •
O 0
W0~
^oo
. .2 0
1 0
w *- 0o
I- I £ c*a t- 1 o
^ ^°'" O< <L> 2

CLAMTOX Method July 31, 1993 Page 2-16
toxicity is associated with filterable components. Reverse-phase SPEindicates whether toxicity is attributable to non-polar compounds.Presence of toxic cationic metals is indicated if addition of achelating agent, ethylenediaminetetraacetic acid (EDTA), diminishestoxicity. Presence of chlorine or other oxidizing agents is indicatedby a reduction in toxicity following addition of the reducing agent,sodium thiosulfate.

CLAMTOX Results
3.0 RESULTS
3.1 Development of the Fingernail Clam Filtering Bioassay
The filtering performance bioassay certainly required lessspecialized equipment and skill than the clam gill bioassays usedpreviously (Blodgett et al. 1984; Anderson, Sparks, and Paparo 1978;Sparks, Sandusky and Paparo 1981; Sparks, Sandusky and Paparo 1983). Aswe had hoped, the inhibition of filtering rate was proportional to theamount of the reference toxicant, sodium cyanide, added to testsolutions (Figure 3.1). We also observed that some individualfingernail clams would eject water while they were being blotted dry.If some individuals retained water within their valves when they wereweighed, and others ejected it, the weight wets and hence the filteringrates per gram wet weight would be highly variable, perhaps masking realdifferences in response. Another problem was that our clams came frompopulations that were clearly under various degrees of stress from 1988to 1991. Many organisms lose tissue mass under stress, which means thatthe weight of living tissue in our clams might have been below averageor highly variable, while the weight of the shells and the water theyenclosed would remain the same. Since it is the living tissue that doesthe filtering, it would be better to measure filtering rates per unitweight of tissue, preferably oven-dried (1000 C) tissue, to avoid anyadditional variation caused by differences in water retention of thetissue.
3.2 Comparison with Other Bioassays.
3.2.1 Filtering Assay Compared to Gill Assay. Both the clam gillassay and the clam filtering assay indicate toxicity in sediments in theupper Illinois Waterway, close to the Chicago area, and much less, or notoxicity in Pool 19 of the Upper Mississippi River (Figure 3.2). Thefiltering assay indicates no toxicity in the Illinois Waterway belowRiver Mile 248 (Figure 3.2). Unfortunately, no samples below River Mile286.0 were tested with the gill assay for comparison during thisproject, although sediment samples taken from Quiver Lake (IllinoisRiver Mile 123.0) in November 1980 and water column samples from themain channel at Havana (Illinois River Mile 119.6) in October 1977 weretoxic, as measured by the gill assay (Sparks, Sandusky and Paparo 1983and Anderson, Sparks, and Paparo 1978). Both assays agree thattoxicities in the North Branch of the Chicago River (miles 325 and 326)are lower than at some downstream stations, indicating a likely sourceof toxicity between mile 325 and the downstream points.
The toxicities recorded by the two methods differ in detail,however, which is not too surprising considering that bulk sedimentsamples collected in March 1989 were used for the gill assay andporewater from samples collected more than two years later, in 1991,were used for the filtering assay. 1988-1989 was a period of droughtand extreme low flows in both the Upper Mississippi River and IllinoisRiver, and fingernail clam populations were declining in Pool 19. Flowsreturned to nearly normal in 1990. The gill assay indicated nearly a20% inhibition in response to Pool 19 sediments in 1989, whereas the
July 31, 1993 Page 3-1

Page 3-2CLAMTOX Results
Filtering Rate (mg yeast/g/
6
5
4
3
2
1
n
clam/hour)
0.0 1.0 10.0 100.0Reference Toxicant (NaCN, mg/1)
Figure 3.1. Fingernail clam filtering response to a reference toxicant, sodium cyanide (inmg/l added as salt, NaCN).
July 31, 1993
I
I - I#

CLAMTOX Results July 31, 1993 Page 3-3*
CO
-.05
01
.1A I
Pooll19 292 313 326
286 307 325
1.0
+ = stimulationB. Clearance rate - = inhibition
0 .5 ........ ... ... ... . .. .... ....... ... ................................................... .. .. ..................................
0CD-0
-0 .5---........................ ..................... .............. . . .... ... . .......
-1.0 1 I I I I I I I
Pool19 72 180 248 281 292 313 318 326 CS319
6 124 215 277 286 310 316 325 CS308
Mississippi -Downstream ChicagoRiver
Illinois River Mile
Figure 3.2. Comparison of the response of isolated clam gills (A) and the filtering
response of intact clams (B) to sediments from the Illinois Waterway. the gill response is
expressed in terms of the inhibition of the beating rate of cilia on the gills, incomparison to control gills maintained in uncontaminated dilution water. The gills were
exposed to dilutions of bulk sediments collected in March 1989. The filtering responsemeasure s the ability of the lams to clear yeast suspensions, in comparison to controls.These clams were exposed to sediment porewater collected in 1991.
CLAMTOX Resu ts July 31, 1993 Page 3-3

CLAMTOX Results
filtering assay indicated a barely significant stimulation in 1991,perhaps in response to sodium, potassium, calcium, and magnesium saltsin the porewater. Anderson, Sparks and Paparo (1978) demonstrated theimportance of these salts in regulating the beating of the cilia on thegills of the clams. Salts that affect the cilia are likely to affectfiltering performance because the lateral cilia produce the watercurrents that bring food into the clam and the latero-frontal cilia actas filters. Also, the presence of organic matter in the sedimentporewaters may have stimulated a feeding response in the clams, whichare deposit feeders, as well as water column filterers. The most toxicsite on the Illinois Waterway in 1991, according to the filtering assay,was DP 277.0, a site not tested in 1989. The most toxic site in 1989was SS 313.0, which the filtering assay also rated as toxic in 1991, butless so than 5 sites that were 3-36 miles downstream (Figure 3.2).
3.2.2 Filtering Assay Compared to Standard Bioassays. There weremarked differences in the responses of the five test organisms tosediment porewater from the same sites (Figure 3.3). Luminescence ofthe marine bacterium, Photobacterium phosphoreum, (Microtox test) wasinhibited by 34% at SS313.0 on the Sanitary and Ship Canal and 32% atCS307.4 on the Calumet Sag Channel. Maximum stimulation ofapproximately 50% occurred at the next site upstream on the Calumet SagChannel, CS318.5. Responses to porewaters from other sites were slightand variable, sometimes mildly inhibitory and sometimes mildlystimulatory.
Photosynthesis by the freshwater alga, Selenastrum capricornutum,was markedly stimulated, by a factor of nearly 2, by sediment porewatersfrom the mouth of Swan Lake, IR6.0, and the Sanitary and Ship Canal,SS310.0. Stimulation is an indication of nutrient enrichment; e.g., bynitrogen and phosphorus (Ross et al. 1988). The greatest inhibition,-86%, was caused by sediment porewater from Lake Chautauqua, IR125.5,although inhibition also occurred at IR72.0, IR281.1, SS313.0, SS315.3,and CS307.4.
A large percentage of the rotifers, Branchionus calciflorus, diedin porewaters from Meredosia Lake (IR72) and Lake Chautauqua (IR125.5),but the rotifers exhibited no significant responses anywhere else(Figure 3.3).
In contrast to the microorganisms (bacterium, alga, and rotifer),the macroinvertebrates C. dubia and M. transversum were remarkablyconsistent in their responses to the sediment porewaters. Bothorganisms exhibited no inhibitory response to porewaters from the lowerIllinois River or from the reference site in the Upper Mississippi River(Figure 3.3). The clam and the water flea likewise are consistent inindicating toxicity in the upper waterway. Filtering performance in theclam was inhibited starting with sediment porewaters from IR248.2 nearMarseilles and water flea mortality started at DP277.0, just above themouth of the Du Page River near the Interstate 55 bridge.
3.3 Pattern of Toxicity in the Illinois Waterway.
Toxicity in sediment porewaters, as measured by bioassays usingmacroinvertebrates as test organisms, increases in the upstreamdirection, toward the Chicago-Joliet area, indicating a likely source oftoxicity in that region. Sediment porewaters from 7 of the 13 upstream
July 31, 1993 Page 3-4

CLAMTOX Results July 31, 1993
Z3
0
esuodseG IseiL
Page 3-5
- NC')
LO- C4
c')
SP^
= * *7
cJ7w
0zLL.
-Q-0d
CD
00
°<=
I,/)UOco
0'.4
I-
.0 0
CL'I-*..C
' -0 -L
En
CL,
scc
o 0.tso
0o0 .0
CI,o a00
0
C4S < **^
so * O
o0 CI
e 2
. q .0
0 Q 0
0 0~CL» o
U > cd
IIs~
-- C
C0
- i
x Kz x x
K
! -·
CDCO)
CO)
0
coC)j
0))co
- C4
- r
- N<
cs

CLAMTOX Results
sites were toxic to the water flea C. dubia, and 12 of 13 inhibited thefiltering performance of the fingernail clam (Figure 3.3). Neitherorganism indicated any toxicity in porewaters from the lower IllinoisRiver or in Pool 19 of the Upper Mississippi River. The toxicity ofporewater to C. dubia appeared to be closely related to the totalammonia concentration in the porewater in 1989 and 1990, with the excep-tion of site DP277.0 in 1990, where factors other than ammonia may havecontributed to the peak toxicity there (Figure 3.4). Toxicity to C.dubia correlated with total ammonia in porewater samples taken in 1990and 1991 (r = 0.85, Figure 3.5). Porewaters generally had much highertotal ammonia concentrations and greater conductivities than surfacewaters from the same sites (Table 3.1).
Porewater from site DP277.0 was most toxic to the fingernail clam,and highly toxic to the water flea, so it was subjected to TIE Phase Ianalysis, the results of which are described below. This was the onlyTIE analysis that employed both types of .bioassays (M. transversum andC. dubia) and therefore is included in the results section of thisreport. All other TIE analyses used C. dubia toxicity tests and theseresults are reported in Sparks, Ross, and Dillon (1992).
3.4 Toxicity Identification and Evaluation (TIE).
The C. dubia mortality test and the M. transversum filtering assayboth indicated that toxicity of porewater from DP277.0 was not removedby chelation with EDTA, so toxicity was not attributable to heavy metals(Table 3.2). Both tests were consistent in indicating that toxicitypersisted when the bioassays were run at both lower (6.5) and higher(8.5) pHs (Table 3.2). The clam assay indicated toxicity increased atboth the higher and lower pH, a result that might be caused by thepresence of two toxicants whose chemical equilibria are pH-sensitive.For example, the proportion of ammonia existing in the toxic, un-ionizedform (NH3) will increase at higher pHs, and the proportion of hydrogensulfide existing in the toxic, un-ionized form (H2S) increases at lowerpHs. Both bioassay techniques indicated that toxicity decreased fromthe initial baseline value upon standing or with aeration at the higherpH of 11 (Table 3.2). This result is consistent with the presence ofammonia, whose un-ionized form can be oxidized and volatilized.
Results of the two bioassays are inconsistent with each other invirtually all the other combinations of treatments. According to the C.dubia bioassay, virtually all the toxicity was removed by filtration orpassage through the C18 column at a pH of 3, whereas the clam assayrecorded the highest toxicity (-0.94) with the C18C-pH 3 treatment andconsiderable toxicity even after filtering the porewater (Table 3.2).The clam assay recorded the least toxicity (-0.04) following aeration ata pH of 3, whereas there was considerable mortality in the C. dubiabioassay.
3.5 Ammonia Tolerance of Clams from Different Sources
3.5.1 Field Observations. In October and November 1991 we triedto obtain sufficient clams from Pool 19 of the Mississippi River, SwanLake on the Illinois River, and from waterways in the Chicago area toassay ammonia tolerance of clams from populations that presumably hadbeen exposed to different levels of ammonia in sediment pore water.
July 31, 1993 Page 3-6

CLAMTOX Results
6
5
4
3
00~1
(J)74-'
04I.-
3
2
1
0
100
80
60
40
2020
E0
zsEm"
100 0EE
80 c
60 0I--
40
20
0
Mississippi River-- p Upstream -- Chicago Metro Area
Figure 3.4. Toxicity and total ammonia concentrations in sediments of the IllinoisWaterway in 1989 and 1990. Toxicity was measured with the Ceriodaphnia dubiabioassay. The highest toxicity observed (in the Des Plaines River portion of theWaterway, DP277.0, in 1990) was attributed to a combination of ammonia and petroleum-related hydrocarbons.
July 31, 1993 Page 3-7
gorI .a4 %0

CLAMTOX Results July 31, 1993
C0EE
O0F->0
C)
00--4-'
00
0)c
00O)
C(0 C\
(o9o01/ooL) si!un
Page 3-8
0(0
C
~10LO
C)
E
cC:C 0.coEEo1--w
C
-C
0 "s-.
04-
C....-
0 c
L
S(
t-
c o
0
Su
c U
0 -0
S4-o
48m
0-'
m 0
0 s
S4-
( 0
(5 4-
S-C
-0
04-a *
C.)|0
0
0
o!xoI

CLAMTOX Results July 31, 1993
* 0 P . - I m o , (j 0 * ,3 * r3 I,
-- ,N-. .• , 0 0 * '0
3 C>0> 0 * 0 i * 0 C0) 0 C 0Dj ,- %- - ( . - t, 1 -- t -.L . '-3o 0 , 0 0 , 0 D 0 , 0 0 0
0. 0. 0 O O , O , * ' O
C 0 0 0 0 , 0 0 0 00. O O 0000 , 0 , 0 0.
, O 0 . 0 , 0 , 0 0 0 , 0 ,
3.0 0 * 0. 0.«0 * 0 * 0.«0 '
g ' o : m : co : f^ ' c ' fM : o ' m :
D 0 C , O * ,0 CO * N 0 ' 00 >0 0 0 C0 o0 C C.0.C0.0. 0 . 0 ;0 . 0 . 0;
41)>
(13(13
(13(13
3:
0
3
e-
4)
v-
oo
t.
0
8.
4-,"g
(03
0.
L.
4)
,-,
<0
4)
t.,
4-
§
(13
^-,
0
'4-
C->
'4-
(0
(n>
C-4)1
(0
0*-C
*-o0
I-*
N »"
4)
CM-
-c
= •,
[ - 30 gCJU
c
ze
c"
<-, (" i ,-I
-( U
t- as
L.
0C)0
L- U
UE
0i0
0
LA
0)
LA
00
co
0;
N
0oI-0D
0%4-n
0
O LAO ' 000 0 O D so m
%4 N '- -- ' V- '- N
. Nin * *0
(N . 0 0 .0 .t , -" 4 O
n* LA * (, N fM (0, M * M
S 0) * 0% N ,t * , -a 03 co *N q- * c 4- r * a- 0 L A ' *L An 0N * M 0 LA. 0 * N M I r N 0
n0%-- 0- 0) - 0C0D - ON M (M OD s0 V %00%LAN- in VN- 0%s Ln vn % %tO ) %T ccON-0(0 30'C DA O LA N- % -I t 0% 6n- % ' N
- co co ? rn -N o N- ViL 0%( L Ms . ' %0 % N N% N-NO Ds -o T '- L M O cM- N -0 0 - 00 3 K) vi
N-: N-N r-N- rN -N-'0' N - %8N ' r.- %N- 8 rON - -
0000 0000 0 0 0 0 0 0 00oCN O 00 '- NN (\i 0 3(N co 0% m 1,- %0 ' %0 r -.: -i-
(00 '.4^-0 '00 LAcomN- LAN - <03 Noo ^-a-. 03(0 O%
%0 %0 -0 N - o N- L V CD C V A0%
(V (V cM (V (sV fMj r\J (M CMJ MJ C4 fMJ M (V (M% "M V- (VJ
0. 03 0. 03'4. 03^r co
Lo o)
0.
inconLA03
0(0C-)
L)Q-C
. 03 0. 03 0. 0 0 0 0. m 0
N-
(0!03»
(0
LA
(0"0303
03
0 N
0 N0%
(0 N03 0303 03
(\j I ton . <r0' . Ns- . h
0 * O 003 C D4 ( N\0 , 0 * N ,
0 . 0 * 0
,: § , 8 :
*.0 0'*o* .0 * 0
0 * 0
* . 0 * 0M
* . 0 . N
,0)0
in
0
V-C:
'4-NTC;
N-030
0
0 0% N- 0% co '%0
N-. -- . 0I *, '4 . LA
NO I- 03 V0-%0 w0 0% 0 'O r-NM '-03 '*0 (V 'O
%0 '0 0 0 C 4- 40 LA N N- 0 3-
0 0 C0 0 00N 0 CD 0 %0 '-.+. 0
(0303 0:% N-0%
C)N- 0 N V- '-T
t 0 N( re ;LA LA
(\i co o » i-o
0. CA a. c3 L. 0c
(0
CL0.0
03MI0.0
0
0.0
Page 3-9
1' . • ,
0 , 0 ,
0 0 0
0 o 00 , 00 0 ,o o ,
LD
,M (%j I0 * 0
0 * 0
.4-0%
0
LA
o00)
00^
d0
%00%8
0
0
=30.
t Ulo
IN oý tv (M4k
A 0
0% NOL
* N-
0* * hLA(0 * N
Ni * 003» * ^0(0> * (0
N- N N- (0% *'.' '0 LA
LA in »- (0
N- N- N-l N-
0\ 0 0 0»
'0 LA 0~N\ NM N\ N
4.
>
C-
0
04-(D46(A
0- (3
NIOH
0. 03
0
in
SO4r

CLAMTOX Results July 31, 1993
* , 0 * 0 * 0 o
C) * I C) 0% 0
rj* Co. * LA. o
0 0 0 0 %
* 0 0 * 0 * 0 ** 0 00 * 0 * 0* Cý 0 o 0 0 ,* C) C) C 0 * 0)
* C o.LA C• LA 0
*C)C) 0.. .. ..
C.,0 aA•I-
C/) _Jc-.J .-.
0
0N Z
u
c
<I
09g
N.-(Ni(CN00
stCD
C)
0C)
00
0
(N-iC)00
NO'00C)
0
00%
0
0
0C)
I'm 1 LNj 0% o D 0 DL.. .. ....C t C
, cO o CO , ,
*^ , oo . - . o o*, (
s O v-l * h,. t .
CM * (i ( (i\j* 0% * LA rN
o0 C) 0 0%( rij D o Nr\J L L % : 0% LA LO Ln A LAn % LA rt NL- LA
r in L - L r t ?o LA M
z0 0L ' 0 P 0: 0,
N- i N- - m m o %N1-: »~ - i »-: rsj cý Vn o»\1 0% i (\j c\ j C\j -\ i C -
L. 0) a. (A . C ) 0 ( . CL n
Lntfý
LA(\j
oc
o0 0
K ^ fc0
Page 3-10
,-
(Ni
o)
0
C)
o ,
0
0 ,
0 ,
C)D ,C)
Lt
o
0 CO
o 0
*o ,'0 ,
0 ,0C)LA
Lno tM
0% *
N- LA-C) (Ni
0. CO
0C-)(U
C-)
6C-)
Co0
(0
o-LU
SV
(I
14%%
0.
U,.0
0*g
0
44
L.
0c
"Q.
m
4-J
L-
c
041
4-' iCo>S0
C.)
S(Ni
C
- -J~
C-)ajo
C0C-)
4,
-Q(U
0)
L.
C-'a,
3
z
cC
o,
I

CLAMTOX Results
Table 3.2. Comparison of responses of fingernail clamsa (Musculiumtransversum) and water fleas (Ceriodaphnia dubia) to sediment porewater from the Des Plaines River portion of the Illinois Waterway(DP277.0). The pore water was subjected to various treatments to removeor change the toxicity of suspected contaminants.
pHTreatment 3 Initial 11
1. StandingC. dubia 6.2 13.8c 5.6M. transversum -0.139 -0.328 -0.202
2. AeratedC. dubia 9.9 11.3 6.2M. transversum -0.045 -0.431 -0.187
3. FilteredC. dubia 0 2.8 1.12M. transversum -0.457 -0.795 -0.352
4. C18C. dubia 0 1.59 1.4M. transversum -0.943 -0.198 -0.328
pH5. Graduated pH 6.5 7.5 8.5
C. dubia Toxic Toxic ToxicM. transversum -0.513 -0.353 -0.405
pH6. EDTA Initial
C. dubia ToxicM. transversum -0.636
Notes: 'The M. transversum response is the decline in filtering rate,following 1 hour of exposure to porewater, relative to the controlfiltering rate. -1.000 = complete cessation of filtering. 0.000 =no reduction.
bThe C. dubia response is measured in toxic units = 100/(48-hourLC50). The LC50 is the percent dilution of porewater (or treatedporewater) that kills 50% of the water fleas in 48 hours.
cThe baseline toxicity of the porewater, prior to any treatment:i.e., the porewater is 13.8 times the lethal level for the waterflea and depresses the filtering rate of the clam by 32.8%.
In the first 4 treatments the pH of the porewater is adjusted tothe values shown and treated. Then the pH is readjusted to theinitial value (7.8) and bioassayed. The porewater is allowed tostand, aerated, filtered, or subjected to reverse-phase, solidphase extraction on a C18 column.
In treatment 5, the pH is adjusted to the values shown, andbioassayed.
In treatment 6, the porewater is bioassayed following treatmentwith the chelating agent EDTA to tie up heavy metals.
July 31, 1993 Page 3-11

CLAMTOX Results
However, several sites on the Sanitary and Ship Canal (SS 319.3, SS312.7, and SS 310.0) where we had obtained clams two months previously(July) now contained few or no live clams, but many recently deadshells, indicating that inimical conditions had developed in the interim(Table 3.3). Another indication of stress was the relatively small sizeof clams in some areas, such as the Sanitary and Ship Canal at Lockport(SS 292.7, Table 3.3). A normal population in the fall of the yearshould contain some very small newborns (1-2 mm shell length) and someadults up to at least 12 mm in shell length. Also of note was thepresence of the European zebra mussel in the Sanitary and Ship Canal (SS312.7).
We were successful in obtaining sufficient clams from Pool 19 ofthe Upper Mississippi River, Swan Lake of the Illinois River, and fromtwo of the waterways in Chicago (the Sanitary and Ship Canal and theCalumet Sag Channel) to run the comparative assays, described next.
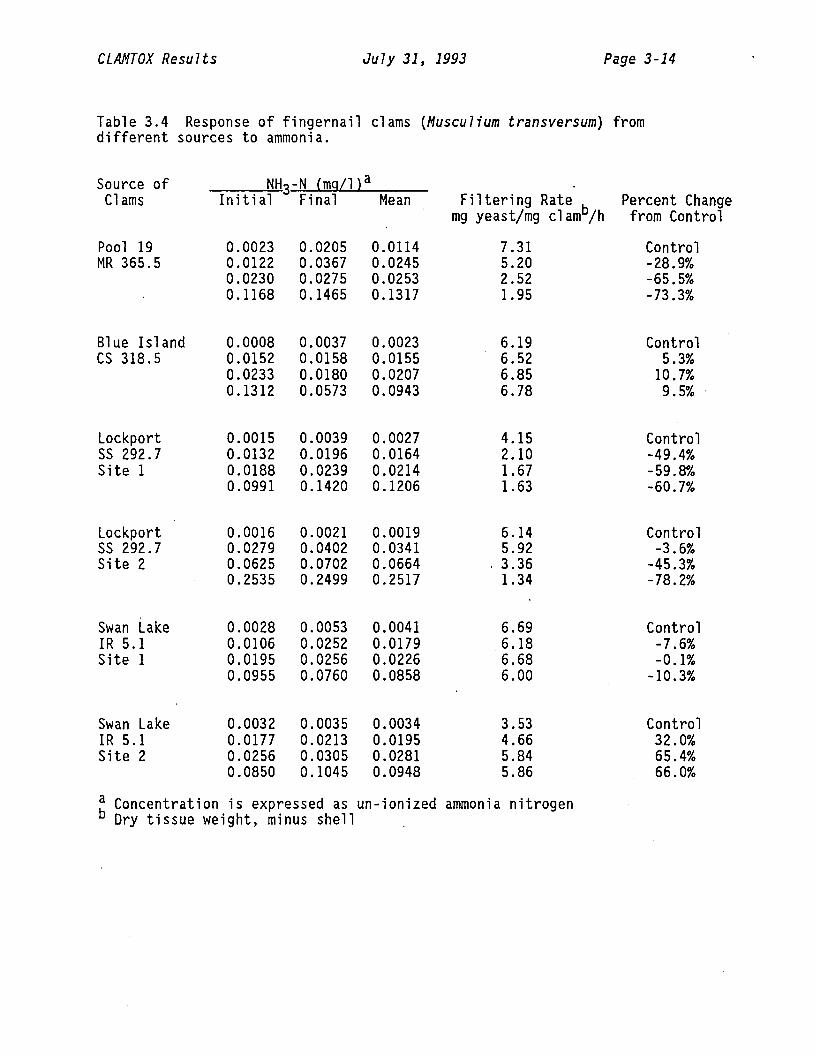
3.5.2 Comparative Bioassays. Clams from the six sources differedgreatly in the baseline filtering rates of the control animals that werenot exposed to added ammonia (Table 3.4). The control rates differedmarkedly among clams taken from different sites within the same locale;e.g., the control rate for clams from Swan Lake site 1 was nearly doublethat from site 2 (6.69 vs 3.53 mg yeast/mg clam tissue) and the ratefrom site 1 of the Sanitary and Ship Canal at Lockport was two thirdsthat from site 2 (4.15 vs. 6.14). Excluding these two values of 3.53and 4.15 mg yeast/mg clam, the control rates averaged 6.58 + standarddeviation of 0.54 (range 6.14 - 7.31). The low control rates mayindicate the clams had been subject to some kind of stress at those twosites. Since one site is from the upper waterway (Lockport) and theother from the extreme lower portion of the waterway (Swan Lake), theseresults indicate that populations throughout the waterway may be understress, at least in certain local microhabitats.
The experimental groups of clams from the various sources werechallenged by exposure to added ammonia. We expected that clams thathad been chronically exposed to ammonia might have undergone selectionfor ammonia tolerance and thus exhibit less response to added ammonia.The clams with the lowest control filtering rate (Swan Lake site 2)actually increased their rate in response to added ammonia, but nevercame within the control range (Table 3.4). The clams from Swan Lakesite 1 did not decrease their filtering significantly (the criterion fora significant response is a change greater than 10.6% from the controlrate), but the highest un-ionized ammonia nitrogen concentrationachieved in this test (0.0858 mg/1) was lower than the highestconcentrations in all of the other tests (0.0943 - 0.2517 mg/l, Table3.4).The filtering rate of clams from the Calumet Sag Channel near Chicagoincreased slightly, but the increase in just one concentration exceededthe response criterion (maximum change was +10.7%). Clams from allother sources decreased their filtering rates significantly whenchallenged with ammonia. In summary, clams from Swan Lake site 2appeared to have been under some previous stress (based on theirexceptionally low baseline filtering rate) and to be relativelyinsensitive to ammonia, based on the increase in their filtering ratesabove baseline in response to added ammonia. Clams from Swan Lake site1 and from the Calumet Sag Channel likewise showed little response toadded ammonia, whereas clams from both sites at Lockport (in theSanitary and Ship Canal) and from Pool 19 of the Upper Mississippi River
July 31, 1993 Page 3-12

CLAMTOX Results
Table 3.3.
Site,Date
Qualitative observations on the status of clampopulations in Chicago waterways, Pool 19 of theUpper Mississippi River, and Swan Lake of the IllinoisRiver in October and November 1991. Duration ofsampling or number of samples is noted.
Qualitative Observations(Mt = Musculium transversum
Ss = Sphaerium striatinum)
MR 365.5 300 Mt in 2 hr, ranging from newborns toPool 19, Miss. R. 12 mm. Most were 5-7 mm.11 Oct 1991
CR 326.4N. Branch, Chicago R.29 Oct 1991
CS 318.5Cal-Sag Channel29 Oct 1991
SS 319.3SS Canal4 Oct 1991
SS 312.7SS Canal4 Oct 1991
SS 310.0SS Canal4 Oct 1991
150-200 Ss in 2 Ekman grab samples.
200-250 Mt in 4 Ekman samples.
No live clams in several hours. Substrateconsisted mostly of dead clam shells, 10-15%recently dead. Live clams had been obtainedin July.
No native clams, just 15 small zebra musselsin 15 min.
No live clams.
SS 292.7SS Canal, Lockport4 Oct 1991
SS 292.7SS Canal, Lockport12 Nov 1991
IR 5.1Swan Lake, Il. R. 917 Oct 1991
25 Mt and 25 Ss inlarger than 7 mm.
about 50 min. No MtSs were 6-10 mm.
300 Mt and 75-100 Ss in several hours.
325 Mt in 2 hr. 20-30% under 5 mm, 50% 7-mm, 10-15% 9-11 mm, 10-15% 11-14 mm.
July 31, 1993 Page 3-13
CLAMTOX Results
Table 3.4 Response of fingernail clams (Musculium transversum) fromdifferent sources to ammonia.
Source ofClams
Pool 19MR 365.5
Blue IslandCS 318.5
LockportSS 292.7Site 1
LockportSS 292.7Site 2
Swan LakeIR 5.1Site 1
Swan LakeIR 5.1Site 2
NH3-N (mq/l)aInitial Final Mean
0.00230.01220.02300.1168
0.00080.01520.02330.1312
0.00150.01320.01880.0991
0.00160.02790.06250.2535
0.00280.01060.01950.0955
0.00320.01770.02560.0850
0.02050.03670.02750.1465
0.00370.01580.01800.0573
0.00390.01960.02390.1420
0.00210.04020.07020.2499
0.00530.02520.02560.0760
0.00350.02130.03050.1045
0.01140.02450.02530.1317
0.00230.01550.02070.0943
0.00270.01640.02140.1206
0.00190.03410.06640.2517
0.00410.01790.02260.0858
0.00340.01950.02810.0948
Filtering Ratemg yeast/mg clamb/h
7.315.202.521.95
6.196.526.856.78
4.152.101.671.63
6.145.923.361.34
6.696.186.686.00
3.534.665.845.86
Percent Changefrom Control
Control-28.9%-65.5%-73.3%
Control5.3%10.7%9.5%
Control-49.4%-59.8%-60.7%
Control-3.6%
-45.3%-78.2%
Control-7.6%-0.1%
-10.3%
Control32.0%65.4%66.0%
a Concentration is expressed asb Dry tissue weight, minus shell
un-ionized ammonia nitrogen
July 31, 1993 Page 3-14

CLANTOX Results July 31, 1993 Page 3-15
decreased their filtering rates substantially in response to ammonia.Clams from different sources do vary in theirY tolerance of ammonia, buttheir tolerance does not increase in the upstream direction on theIllinois Waterway, where ammonia concentrations in sediment pore watertend to be higher than in downstream areas.

CLAMTOX Discussion
4.0 DISCUSSION
4.1 The Fingernail Clam Filtering Bioassay
The fingernail clam filtering bioassay can be performed withrelatively simple equipment commonly available in most laboratories. Itis relatively quick, requiring only one hour of exposure to the testsolution, followed by one hour to assess filtering performance. Itmeasures a sublethal response, filtering ability, that is critical tothe survival of the organism, so the bioassay meets the test ofphysiological relevance to the organism. The bioassay also meets thetest of ecological relevance because the test species, M. transversum,is an important link in food chains leading to fish and ducks and it isa dominant member of the benthic macroinvertebrate community in manyMidwestern aquatic systems. Another aspect of ecological relevance isthat M. transversum is a member of the infauna, the organisms thatburrow into the sediment rather than living on top of the sediment or onplants, snags or other structure extending into the water column, so itis actually exposed in the environment to the sediment porewater we weretesting. In contrast, many of the standard test organisms, including C.dubia, are water column dwellers or structure dwellers that never comein contact with sediment porewater in nature. The filtering response isgraded; i.e., the degree of inhibition of filtering performance is afunction of the concentration of the toxicant, as demonstrated in thetest with a reference toxicant, sodium cyanide.
The results obtained by the two types of clam bioassays weregenerally consistent. In one bioassay, the beating rate of cilia onisolated clam gills was inhibited by bulk sediments from the upperIllinois Waterway, even though the sediments were diluted with molluscansaline solution. In the other bioassay, the filtering rate of intactclams was inhibited by sediment porewaters from the same area. The sameporewaters caused significant mortality in C. dubia. In contrast,porewaters from some of the same sites stimulated two other standardtest organisms, the freshwater alga Selenastrum capricqrnutum and themarine bacterium Photobacterium phosphoreum (Microtox test). In viewof the great physiological differences among plants, bacteria andanimals this result is not too surprising; e.g., ammonia is toxic toaquatic animals at relatively low concentrations, but is used as anitrogen source by plants and some bacteria.
4.2 Toxicity in the Illinois Waterway
Two different patterns of toxicity apparently occur in thesediment porewaters of the Illinois Waterway. There is a gradient ofincreasing toxicity in the upstream direction, associated withincreasing concentrations of total ammonia in the sediments (Figures3.2, 3.4, and 3.5). The second pattern is characterized by patches oftoxicity associated with polycyclic aromatic hydrocarbons (PAHs), suchas naphthalene, and long-chain hydrocarbons, both evidently derived frompetroleum (Sparks, Ross and Dillon 1992). One of the latter sites waslocated on the lower Des Plaines River section of the waterway, nearseveral refineries. Previous studies have measured elevated levels ofmetals, pesticides, PAHs, and PCBs in the sediments of the upper
July 31, 1993 Page 4-1

CLAMTOX Discussion
Illinois Waterway (IEPA 1990) and demonstrated that sediments are toxic(Sparks, Sandusky and Paparo 1981; Blodgett et al. 1984; Schubauer-Berigan and Ankley 1991). The two toxicity problems might even berelated: Ankley et. al. (1991) suggest that natural microbial processesin aquatic ecosystems may be compromised by organic loading or selectivetoxicity. The alteration of microbial processes could play a role inthe incidence of ammonia accumulation and subsequent toxicity insediments in the Upper Illinois Waterway.
It is well established that certain sediments can contain highconcentrations of ammonia (Keeney 1973, Berner 1980). Nitrogen-containing organic matter is decomposed in sediments by heterotrophicbacteria. The amount of ammonification that takes place depends onoxygen availability (Kleerekoper 1953). Ammonia can accumulate to toxiclevels under anaerobic conditions (Berner 1980). Ammonia formation isgreatest about 10 cm below the sediment-water interface (Serruya 1974).In this situation, ammonia probably diffuses from the deeper sedimentsto surficial sediments, and perhaps even to the overlying water,especially if sediments are resuspended by currents or boat- or wind-driven waves. The fingernail clam, Musculium transversum, the organismof primary interest in this study, makes shallow burrows in the sedimentand may be exposed to much higher levels of ammonia than organismsliving in the water column.
M. transversum is sensitive to ammonia. Anderson, Sparks andPaparo (1978) found that un-ionized ammonia concentrations of 0.08-0.09mg/l inhibited the cilia on the gills of the clams, and the growth ofthe clams in the laboratory was reduced at concentrations between 0.20and 0.34 mg/1 NH -N. The C. dubia acute LC50 for ammonia is 1.04 mg/l(Ankley et. al. 1990). Arthur et. al (1987) reported un-ionized ammoniatoxicity to 5 invertebrates that ranged from 1.95 to 18.3 mg/l un-ionized ammonia, as nitrogen (see below).
SPECIES LC50 (mg/1)SnailPhysa gyrina - adult 1.95Helisoma trivolvis - adult 2.17
AmphipodCrangonyx pseudogracilis - adult 3.12
MayflyCallibaetis skokianus - nymph 3.12
IsopodAsellus racovitzai - adult 5.02
CaddisflyPhilarctus giaeris - larvae 10.1
CrayfishOrconectes immunis - adult 18.3
July 31, 1993 Page 4-2

CLANTOX Discussion
Concentrations of un-ionized NH3-N ranged up to 0.41 in the sediments inthe Upper Illinois Waterway, based on total ammonia concentrations andpHs measured in samples returned to the laboratory (Table3.1)--sufficient to impair filtering and reduce growth. Ammonia placesorganisms in double jeopardy because it exerts an oxygen demand in theprocess of nitrification (conversion to nitrites and then nitrates) andlow oxygen levels place organisms under additional stress (USEPA 1985).Ammonification may be occurring in the deep, anaerobic zones of thesediments and nitrification in the shallower, aerobic zones, or in theboundary water at the sediment surface, so benthic invertebrates areexposed to the worst of both worlds: they are exposed to ammonia and tolow oxygen at the same time.
The highest ammonia concentrations in sediments are associatedwith nitrogen-enriched sediments or high organic loading, as from sewagetreatment plants (Brezonik 1973; Ankley et. al. 1990; and Schubauer-Berigan and Ankley 1991). Although most sewage treatment plants removea substantial portion of carbon that is in municipal waste, most do notremove nitrogen, but convert it from ammonia into nitrate. It ispossible that nitrate is carried down into the sediments where it isconverted back into ammonia in the anaerobic zones. If this is thecase, ammonia toxicity in the sediments might be reduced by reducing thenitrogen loading of the river.
The proportion of total ammonia existing in the toxic, un-ionizedform is controlled primarily by pH and temperature (Emerson et. al.1975). The pH of sediments can fluctuate dramatically on a seasonalbasis, and the pH of the overlying water can fluctuate daily, so thatepisodes of toxicity may occur even if the total ammonia concentrationremains relatively constant. Ammonia loading of rivers tends toincrease during winter because the microorganism-mediated conversion ofammonia to nitrate stops at cold temperatures. Also, aquatic vegetationdoes not remove ammonia (a plant nutrient) during winter dormancy.Water quality standards frequently allow higher levels of ammonia in thewinter because the proportion of total ammonia existing in the toxic,un-ionized form is less at cold temperatures. However, the sensitivityof fish to ammonia increases at cold temperatures, and this biologicaleffect overrides the physical-chemical effect of cold temperature onammonia equilibria (Reinbold and Pescitelli 1990). Research is neededto determine the effect of cold temperatures on the sensitivity ofinvertebrates, such as fingernail clams, as well as fish, to ammonia.
During the course of this study, several species of fingernailclams, including M. transversum, reappeared in the Chicago areawaterways and in the Illinois River at Peoria and Havana. There are atleast four possible explanations for this surprising reappearance ofclams in the same general areas where the porewaters tested toxic.First, we found that clams from different locations differ in theirsensitivity to ammonia, and clams from at least one site on the upperIllinois (the Calumet Sag Channel) responded less to added ammonia thanthe clams from Pool 19 and from one site in Swan Lake on the lowerIllinois, where the organisms were obtained for all of the early bioas-says. Second, our previous research demonstrated that the surfacelayers of sediment in some areas are less toxic than layers a fewcentimeters deeper (Sparks, Sandusky and Paparo 1981; Blodgett et al.1984). Toxicity may have been overestimated in tests where surface anddeep layers of sediment were mixed prior to testing. Third, toxic
July 31, 1993 Page 4-3

CLAMTOX Discussion
episodes may be brief and infrequent, allowing organisms to colonize inbetween episodes. In the span of just two months, we sometimes foundlive clams in the Sanitary and Ship Canal where there had been nonebefore, and conversely, recently-dead shells where live clams had beenrelatively abundant (see section 3.5.1 and Table 3.3). Fourth, thedistribution of toxicity in sediments may be extremely patchy, so thathealthy organisms are found adjacent to barren or stressed areas. Clamsfrom adjacent sites in both Swan Lake on the lower Illinois River and atLockport in the Chicago Sanitary and Ship Canal differed markedly intheir control filtering rates and in their sensitivity to added ammonia,indicating that they had experienced different levels of stress prior tocollection (Table 3.4). If the latter two hypotheses prove to be true,toxicity in the Illinois River has changed recently from a widespread,chronic problem to a more localized or episodic problem. Reduction oftoxicity in surface sediments may reflect recent reductions in ammonialoading from sewage treatment plants in the Chicago area, although it isnot clear whether the sources of ammonia in the porewaters areeffluents, the deeper layers of sediments (as described above), or both.
We remind the reader that all the toxicity tests we conducted wereshort-term, acute tests. The fingernail clams, Musculium transversum,were exposed to sediment porewater for only 1 hour and then theirfiltering performance was tested in clean dilution water. The waterflea, Ceriodaphnia dubia, was exposed to porewater for just 48 hours.The organisms in the waterways are exposed to contaminants for theirentire life spans. In the past, more sensitive tests with fingernailclams have demonstrated toxicity even in downriver sediments, includingfish and wildlife areas such as Peoria Lake and Quiver Lake (Sparks,Sandusky and Paparo 1981).
In addition to being a problem for the benthic invertebrates thatfish feed upon, ammonia may be a problem for the fish themselves. In1987, the U.S. Fish and Wildlife Service simulated resuspension ofbottom sediments by boat- or wind-driven waves by stirring sediments inclean water, allowing the sediment to settle for 24 to 48 hours, thenexposing larval fathead minnows, Pimephales promelas, to the water.Water mixed with surface sediments from the Chicago River and the DesPlaines River killed all the fish within 24 hours. Surface sedimentsfrom Lake Chautauqua, a bottomland lake and federal wildlife refugealong the Illinois River at Havana, killed 15% of the test fish in 96hours; deeper-sediments, taken at the 12- to 18-inch depth, killed 25%.Fish mortality correlated (R = 0.71, P < 0.01) with the concentration ofun-ionized ammonia released from the sediment and both ammonia and fishmortality increased upstream toward Chicago. The Long-Term ResearchMonitoring Station (LTRM) at Havana started measuring ammoniaconcentrations in Anderson Lake, a floodplain lake of the Illinois Riverand a state fish and wildlife area, on 1 May 1990, 2 days after a fishkill. The total ammonia nitrogen concentration was 0.90 mg/1 and theun-ionized ammonia nitrogen was calculated to be 0.36 mg/1 at thetemperature of 16.60 C and pH of 9.34. NH3 -N concentrations of 0.32mg/1 at 3-50 C and 1.35 mg/1 at 24-250 C were acutely lethal to bluegillsunfish in bioassays conducted at our laboratory. The fish kill mighthave been caused by ammonia, if the un-ionized ammonia had peaked athigher concentrations before our samples were taken.
Elevated un-ionized ammonia concentrations might be triggered byresuspension of sediments or episodes of elevated pH resulting from
July 31, 1993 Page 4-4

CLAMTOX Discussion
phytoplankton blooms. Plants remove carbon dioxide from the water, inthe form of carbonic acid and bicarbonate, and thereby elevate the pH ofthe water, which in turn increases the proportion of ammonia existingthe toxic, un-ionized form. The Havana LTRM station measured pHs ashigh as 10.12 in backwater lakes of the Illinois River in July 1990 andvalues between 9.0 and 10.0 occur fairly often. Episodes of acuteammonia toxicity thus may be occurring sporadically in places other thanjust the upper Illinois River, and it takes only one brief episode peryear to kill or reduce populations that take many months or years tobuild up. Potential sources of ammonia or nitrogen, besides sewageplants and anaerobic sediments, include industrial plants (especiallyrefineries and munitions plants), feedlots, and agricultural fields.
Although a general recovery does seem to be beginning in theIllinois River, with the return of fingernail clams in some areas wherethey have been absent at least 30 years and appearance of largemouthbass throughout the Illinois River proper, the pace and permanence ofrecovery still appears to be threatened by ammonia, even if the problemnow turns out to be episodic instead of chronic. Reports of fingernailclam and mussel die-offs in the Upper Mississippi River and other rivers(Wilson et al. in press; Blodgett and Sparks 1987; Neves 1987) indicatethat drastic population declines in macroinvertebrates that burrow insediments are not unique to the Illinois River.
July 31, 1993 Page 4-5

CLAMTOX Literature Cited
5.0 LITERATURE CITED
Adams, W.J., R.A. Kimerle, and R.G. Mosher. 1985. Aquatic safetyassessment of chemicals sorbed to sediments. Pages 429-453 in R.D.Cardwell, R. Purdy, and R.C. Bahner, eds. Aquatic Toxicity andHazard Assessment: Seventh Symposium, ASTM 854, American Societyfor Testing and Materials, Philadelphia, PA.
Aldridge, D.W., B.S. Payne, and A.C. Miller. 1987. The effects ofintermittent exposure to suspended solids and turbulence on threespecies of freshwater mussels. Environmental Pollution 45:17-28.
American Public Health Association (APHA). 1976. Standard methods forthe examination of water and wastewater. 14th Edition. AmericanPublic Health Association, Washington, D.C. 1193 p.
Anderson, K.B., R.E. Sparks, and A.A. Paparo. 1978. Rapid assessmentof water quality using the fingernail clam, Musculium transversum.University of Illinois Water Resources Center, Center ResearchReport No. 133.
Anderson, R.V., D.M. Day, M. Demissie, F.S. Dillon, J.W. Grubaugh, M.S.Henebry, K.S. Lubinski, and R.E. Sparks. 1984. Flows, equationsand input values for the nine state-vaiable biological model, Pool19, Mississippi River--second generation. A computer-modellingproject of the Large-River, Long-Term Ecological Research Project(LTER). Unpublished report. 106 pp.
Ankley, G.T., A. Katko, and J. Arthur. 1990. Identification of ammoniaas an important sediment-associated toxicant in the lower Fox Riverand Green Bay, Wisconsin. Environmental Toxicology and Chemistry9:313-322.
Ankley, G.T., K. Lodge, D.J. Call, M.D. Balcer, L.T. Brooke, P.M. Cook,R.G. Kreis, Jr., A.R. Carlson, R.D. Johnson, G.J. Niemi, R.A. Hoke,C.W. West, J. P. Giesy, P.D. Jones, and Z.C. Fuying. 1991.Integrated assessment of contaminated sediments in the lower FoxRiver and Green Bay, Wisconsin. Ecotoxicology and EnvironmentalSafety 23:46-63.
Arthur, J.W., W.W. Corlis, K.N. Allen, and S.F. Hedtke. 1987. Seasonaltoxicity of ammonia to five fish and nine invertebrate species.Bulletin of Environmental Contamination and Toxicology 38:324-331.
ASTM. 1982. Annual book of ASTM standards. Part 31. Water. AmericanSociety for Testing and Materials, Philadelphia, PA. 1554 pp.
ASTM. 1991. Annualfor Testing and
book of ASTM standards. Water. American SocietyMaterials, Philadelphia, PA.
Berner, R.A. 1980. Early Diagenesis: a theoretical approach.Princeton University Press, Princeton, NJ.
July 31, 1993 Page 5-1

CLAMTOX Literature Cited
Blodgett, K.D. 1983. Distribution of toxicity in sediments of theupper Illinois Waterway. M.S. Thesis. Western IllinoisUniversity, Macomb. 72 p.
Blodgett, K.D., R.E. Sparks, A.A. Paparo, R.A. Cahill, and R.V.Anderson. 1984. Distribution of toxicity in sediments of theIllinois Waterway. Pages 293-308 in W. Blake-Coleman, ed.Proceedings of the Conference of Urban Effects on Water Quality andQuantity. Urbana, IL 20-21 October 1983.
Blodgett, K.D., and R.E. Sparks. 1987. Documentation of a mussel die-off in Pools 14 and 15 of the Upper Mississippi River. Pages 76-90in R.J. Neves, ed. Proceedings of the workshop on Die-Offs ofFreshwater Mussels in the United States. U.S. Fish and WildlifeService and Upper Mississippi River Conservation Committee. 23-25.June, Davenport, IA.
Brezonik, P.L. 1973. Nitrogen sources and cycling in natural watersU.S. Environmental Protection Agency, National EnvironmentalResearch Center, Washington, D.C. EPA60013-73-002. 167 pp.
Bulich, A.A., M.W. Greene, and D.L. Isenberg. 1981. Reliability of thebacterial luminescence assay for the determination of the toxicityof pure compounds and complex effluents. Pages 338-347 in ASTM-STPNo. 737, Philadelphia.
Connell, D.W., M. Bowman, and D.W. Hawker. 1988. Bioaccumulation ofchlorinated hydrocarbons from sediment by oligochaetes.Ecotoxicology and Environmental Safety 16:293-302.
Di Toro, D.M., J.D. Mahony, D.J. Hansen, L.J. Scott, A.R. Carlson, andG.T. Ankley. 1992. Acid volatile sulfide predicts the acutetoxicity of cadmium and nickel in sediments. Environmental Scienceand Technology 26(1):96-101.
Eckblad, J.W. 1978. Laboratory manual of aquatic biology. Wm. C.Brown Company Publisher, Dubuque, IA. 231 p.
Edmunds, W.M., and A.H. Bath. 1976. Centrifuge extraction and chemicalanalysis of intersitial waters. Environmental Science andTechnology 10:467-472.
Emerson, K., R.C. Russo, R.E. Lund, and R.V. Thurston. 1975. Aqueousammonia equilibrium calculations: effect of pH and temperature.Journal of Fisheries Research Board of Canada 32:2379-2383.
Emmling, Philip J. 1974. Sphaeriid-sediment interaction in theMilwaukee Harbor, Lake Michigan. Page 11 in Midwest BenthologicalSociety titles & abstracts of papers presented at the 22nd AnnualMeeting, March 27-29, NERC, Cincinnati, OH.
July 31, 1993 Page 5-2 "

CLAMTOX Literature Cited
Gale, W.F. 1969. Bottom fauna of Pool 19, Mississippi River withemphasis on the life history of the fingernail clam, Sphaeriumtransversum. Ph Dissertation Iowa State University of Science andTechnology, Ames. 235 p.
HACH. 1985. HACH water analysis handbook. HACH Company. 359 p.
Hamilton, M.A., R.C. Russo, and R.B. Thurston. 1977. The TrimmedSpearman Carver method for estimating median lethal concentrationsin toxicity bioassays. Environmental Science and Technology11:714-719.
Howes, B.L., J.W.H. Dacey, and J.M. Teal. 1985. Annual carbonmineralization and belowground production of Spartina alterniflorain a New England salt marsh. Ecology 66(2):595-605.
Hubert, W.A. 1972. Seasonal fluctuations of aquatic macroinvertebratesin Oakwood Bottoms Greentree Reservoir. B.S. Thesis. SouthernIllinois University. 19 p.
Illinois Environmental Protection Agency.report 1988-1989. IEPA/WPC/90-160.Protection Agency, Division of WaterSpringfield, IL. 352 pp.
1990. Illinois water qualityIllinois EnvironmentalPollution Control,
Jude, D.J. 1968. Bottom fauna utilization and distribution of 10species of fish in Pool 19, Mississippi River. M.S. Thesis. IowaState University, Ames. Unpublished. 238 p.
Jude, D.J. 1973. Food and feeding habits of gizzard shad in Pool 19,Mississippi River. Transactions of the American Fisheries Society102 (2):378-383.
Keeney, D.R. 1973. The nitrogen cycle in sediment-watersystems.Journal of Environmental Quality 2:15-29.
Kleerekoper, H. 1953. The mineralization of plankton.Fisheries Research Board of Canada 10:283-291.
Journal of
Knezovich, J.P., and F.L. Harrison. 1988. The bioavailability ofsediment-sorbed chlorobenzenes to larvae of the midge, Chironomusdecorus. Ecotoxicology and Environmental Safety 15:226-241.
Marking, L.L.,to fish.Service.
and V.K. Dawson. 1973.Invest. Fish Contr. No.Washington, D.C. 8 p.
Toxicity of quinaldine sulfate48, U.S. Fish and Wildlife
Mount, D.I. 1988. Methods of aquatic toxicity identificationevaluations: phase III toxicity confirmation procedures. EPAResearch Series Report. Environmental Research Laboratory, Duluth,MN. EPA/600/3-88/036.
July 31, 1993 Page 5-3
CLAMTOX Literature Cited
Mount, D.I., and L. Anderson-Carnahan. 1988. Methods of aquatictoxicity identification evaluations: phase I toxicitycharacterization procedures. EPA Research Series Report.Environmental Research Laboratory, Duluth, MN. EPA/600/3-88/034.
Mount, D.I., and L. Anderson-Carnahan. 1989. Methods of aquatictoxicity identification evaluations: phase II toxicityidentification procedures. EPA Research Series Report.Environmental Research Laboratory, Duluth, MN. EPA/600/3-88/035.
National Effluent Toxicity Assessment Center (NETAC). 1989a. Standardoperating procedures for Ceriodaphnia culturing. 4 p.
National Effluent Toxicity Assessment Center (NETAC). 1989b. Standardoperating procedures for Ceriodaphnia food regime. 4 p.
Neves, R.J., ed. 1987. Proceedings of the workshop on die-offs offreshwater mussels in the United States. U.S. Fish and WildlifeService and Upper Mississippi River Conservation Committee. 23-25June, Davenport, IA.
Pennak, R.W. 1989. Fresh-water invertebrates of the United States:Protozoa to Mollusca. John Wiley & Sons Inc., New York. 628 p.
Peterson, A. 1951. Larvae of insects: an introduction to Nearcticspecies: Coleoptera, Diptera, Neuroptera, Siphonaptera, Mecoptera,Trichoptera Part II. Edward Brothers Inc., Ann Arbor, MI. 416 p.
Paloumpis, A.A., and W.C. Starrett. 1960. An ecological study ofbenthic organisms in three Illinois River flood plain lakes.American Midland Naturalist 64(2):406-435.
Ranthum, Richard Gilbert. 1969. Distribution and food habits ofseveral species of fish in Pool 19, Mississippi River. M.S.Thesis, Iowa State University, Ames, .IA. 207 p.
Ross, P.E., V. Jarry, and H. Sloterdijk. 1988. A rapid bioassay usingthe green alga, Selenastrum capricornutum, to screen for toxicityin St. Lawrence River sediment elutriates. Pages 68-73 in J.Cairns, Jr., and J.R. Pratt, eds. Functional Testing of AquaticBiota for Estimating Hazards of Chemicals. American Society forTesting Materials, Special Technical Publication No. 988, Philadel-phia, PA. 242 pp.
Schubauer-Berigan, M.K., and G.T. Ankley. 1991. The contribution ofammonia, metals and nonpolar organic compounds to the toxicity ofsediment interstitial water from an Illinois River tributary.Environmental Toxicology and Chemistry 10:925-939.
Serruya, C. 1974. Nitrogen and phosphorus balances and load-biomassrelationship in Lake Kinneret. Verh. Internat. Verein. Limnol.19:1357-1369.
July 31, 1993 Page 5--4 " "

CLAMTOX Literature Cited
Snell, T.W., and G. Personne. 1989. Acute toxicity bioassay usingrotifers II. A freshwater test With Brachionus rubens. AquaticToxicology 14:81-92.
Sparks, R.E. 1984. The role of contaminants in the decline of theIllinois River: Implications for the Upper Mississippi. Pages 25-66 in J.G. Wiener, R.V. Anderson, and D.R. McConville, eds.Contaminants in the Upper Mississippi River. Proceeceedings of the15th Annual Meeting of the Mississippi River Research Consortium.Butterworth Publishers, Stoneham, MA. 368 pp.
Sparks, R.E., M.J. Sandusky, and A.A. Paparo. 1981. Identification ofthe water quality factors which prevent fingernail clams fromrecolonizing the Illinois River, Phase II. University of Illinois,Water Resources Center Research Report No. 157. Urbana, IL.
Sparks, R.E., and K.D. Blodgett. 1983. Toxicity of sediments in theIllinois Waterway: implications for the proposed increases indiversion of Lake Michigan water into the Illinois Waterway.Project Completion Report STIL-TRWRTOXSED39483, U.S. Army Corps ofEngineers, Chicago, IL.
Sparks, R.E., and M.J. Sandusky. 1983. Identification of the waterquality factors which prevent fingernail clams from recolonizingthe Illinois River, Phase III. University of Illinois WaterResources Center Research Report No. 179. Urbana, IL. 55 pp.
Sparks, R.E., M.J. Sandusky, and A.A. Paparo. 1983. Identification ofthe water quality factors which prevent fingernail clams fromrecolonizing the Illinois River, Phase III. Water Resources CenterResearch Report No. 179, University of Illinois, Champaign-Urbana.53 p.
Sparks, R.E., P.E. Ross, and F.S. Dillon. 1992. Identification oftoxic substances in the upper Illinois River. Illinois Departmentof Energy and Natural Resources, Springfield. Final ReportContract WR3691. ILENR/RE-WR-92/07. 59 p.
Swartz, R.C., G.R. Ditsworth, D.W. Schults, and J.0. Lamberson. 1985.Sediment toxicity to a marine infaunal amphipod: cadmium and itsinteraction with sewage sludge. Marine Environmental Research18:133-153.
Swartz, R.C., P.F. Kemp, D.W. Schults, and J.0. Lamberson. 1988.Effects of mixtures of sediment contaminants on the infaunalamphipod, Rhepoxynius abronius. Environment Toxicology andChemistry 7:1013-1020.
Thompson, C.M., and R.E. Sparks. 1978. Comparative nutritional valueof a native fingernail clam and the introduced Asiatic clam. TheJournal of Wildlife Management 42(2):391-396.
U.S. Army Corps of Engineers. 1987. Illinois River charts. U.S. ArmyCorps of Engineers.
Ju7y 31, 1993 Page 5-5
CLANTOX Literature Cited July 31, 1993 Page 5'-
U.S. Environmental Protection Agency. 1985. Methods for measuring theacute toxicity of effluents to freshwater and marine organisms.Environmental Research Laboratory, Cincinnati, OH. EPA/600/4-85-013.
Wilson, D.M., T.J. Naimo, J.G. Wiener, R.V. Anderson, M.B. Sandheinrich,and R.E. Sparks. (Submitted). Declining populations of thefingernail clam Musculium transversum in the Upper MississippiRiver. Submitted to the Journal of the North AmericanBenthological Society.

CLANTOX Appendices
Appendix Table A.I. Relationship between yeast concentration and % lighttransmittance measured by a spectrophotometer.
Yeastmg/l
100908070605040302010
xl86.5087.1087.8089.0090.1391.6993.2594.7096.6199.22
% Transmittance
x286.0087.0087.2089.0090.3191.6893.2394.7396.4599.39
x386.0086.9887.2089.1090.3591.7193.3094.8096.4599.47
x86.1787.0287.4089.0390.2691.6993.2694.7496.5099.36
Yeast concentrations were calculated fromabove data:
a regression equation based on the
Y = yeast concentration (mg/1)
T = % transmittance of light
Y = 676.378 - 6.788 T
I ..
July 31, 1993 Page A-1