illinois small business economic profile
TRANSCRIPT

Gains
Losses
Net change
-400
0
400
2000 2010 2020
Thousands of jobs
Openings
Closings
Net change
-20
0
20
2000 2010 2020
Thousands of establishments
p y yyy
2021 Small Business ProfileRESEARCH OUTREACHREGULATION
U.S. SMALL BUSINESS ADMINISTRATION
Illinois 1.2 million small businesses 2.5 million small business employees 99.6 percent of Illinois businesses 44.8 percent of Illinois employees
0
25
50
75
100Percent
Share of employees working at small businesses by county Source of data: Statistics of US Businesses (Census)
Business dynamics
Establishments Between March 2019 and March 2020, 29,817 Illinois establishments opened and 33,702 closed, for a net decrease of 3,885. Employment expanded at 64,146 and contracted at 70,044. Small businesses accounted for 29,384 openings and 33,117 closings.
Employment Opening and expanding Illinois establishments added 434,435 jobs, while closing and contracting establishments lost 479,543, for a net decrease of 45,108 jobs. Small businesses gained 346,788 jobs and lost 375,638, for a net decrease of 28,850 jobs.
Counts include temporary closures and reopenings Source: Business Employment Dynamics (BLS)
1

g gg
y
Small business loans
The Community Reinvestment Act New lending to businesses with revenues under $1 million requires large banks to report new small business loans. In 2019, reporting banks issued $3.3 billion in loans to Illinois businesses with revenues of $1 million or less. Total reported new lending to businesses through loans of $100,000 or less was $3.5 billion, and total reported new lending to businesses through loans of $1 million or less was $11.0 billion. Source: gCRA Aggregate Data (FFIEC)
0
1
2
3
4
5
2000 2005 2010 2015 2020
$Billion
Small business count by size and industry
No 1–19 20–499 All small Industry employees employees employees businesses
Professional, Scientific, and Technical Services 133,515 32,886 2,624 169,025 Transportation and Warehousing 146,248 14,014 1,123 161,385 Other Services (except Public Administration) 114,188 27,752 2,161 144,101 Construction 91,482 27,062 1,865 120,409 Health Care and Social Assistance 84,088 21,789 3,451 109,328 Real Estate and Rental and Leasing 97,487 9,774 662 107,923 Administrative, Support, and Waste Management 85,421 12,550 1,673 99,644 Retail Trade 70,292 20,189 2,323 92,804 Arts, Entertainment, and Recreation 54,764 4,040 674 59,478 Finance and Insurance 29,943 10,423 1,179 41,545 Accommodation and Food Services 15,162 17,177 4,942 37,281 Educational Services 31,618 3,056 871 35,545 Wholesale Trade 13,157 10,755 2,694 26,606 Manufacturing 10,238 7,935 3,289 21,462 Information 11,829 2,530 521 14,880 Agriculture, Forestry, Fishing and Hunting 5,362 299 13 5,674 Mining, Quarrying, and Oil and Gas Extraction 1,533 333 49 1,915 Management of Companies and Enterprises * 146 609 755 Utilities 343 110 45 498 Industries not classified * 276 0 276
Total 996,670 222,922 29,483 1,249,075
* Not reported by the Census Bureau Sources: Nonemployer Statistics, 2018 (Census); Statistics of US Businesses, 2018 (Census)
Small business exports A total of 23,133 identified firms exported goods worth $54.7 billion from Illinois in 2019. Of those exporters, 20,615—or 89.1 percent—were small. Small firms exported goods worth $13.3 billion, making up 24.2 percent of exports by identified firms. Source: A profile of US importing and exporting companies, 2018–2019 (Census)
Illinois 2021 2 SBA Office of Advocacy

p yy yy gg p
Business ownership share by demographic group
Women
Veterans
Hispanics
Racial minorities
Ownership
Workers
Ownership
Workers
Ownership
Workers
Ownership
Workers
Women made up 47.6 percent of workers and owned
42.2 percent of businesses.
Veterans made up 3.7 percent of workers and owned
4.7 percent of businesses.
Hispanics made up 16.7 percent of workers and owned
9.5 percent of businesses.
Racial minorities made up 25.2 percent of workers and owned 20.2 percent of businesses.
Ownership shares include equal and majority ownership Sources of data: American Community Survey, 2018 (Census and IPUMS); Annual Business Survey, 2018 (Census); Nonemployer Statistics by Demographics, 2017 (Census)
Business count by owner demographic group
Without With Ownership employees employees Total
Female 407,000 47,362 454,362 Male 532,000 155,819 687,819
Owned equally by both groups 18,500 29,923 48,423
Veteran 38,000 10,726 48,726 Not veteran 916,000 217,353 1,133,353
Owned equally by both groups 2,500 5,025 7,525
Hispanic 98,000 12,566 110,566 Not Hispanic 858,000 219,324 1,077,324
Owned equally by both groups 1,100 1,212 2,312
American Indian and Alaska Native 1,800 526 2,326 Asian 73,000 22,192 95,192 Black or African American 138,000 4,221 142,221 Native Hawaiian and Other Pacific Islander 450 67 517 White 743,000 206,265 949,265
Hispanic or racial minority 297,000 39,213 336,213 White and not Hispanic 658,000 191,527 849,527
Owned equally by both groups 2,100 2,362 4,462
Counts include only businesses classifiable by owner demographic group Sources: Annual Business Survey, 2018 (Census); Nonemployer Statistics by Demographics, 2017 (Census)
Illinois 2021 3 SBA Office of Advocacy
gg gg pp p p ///p yyy gg
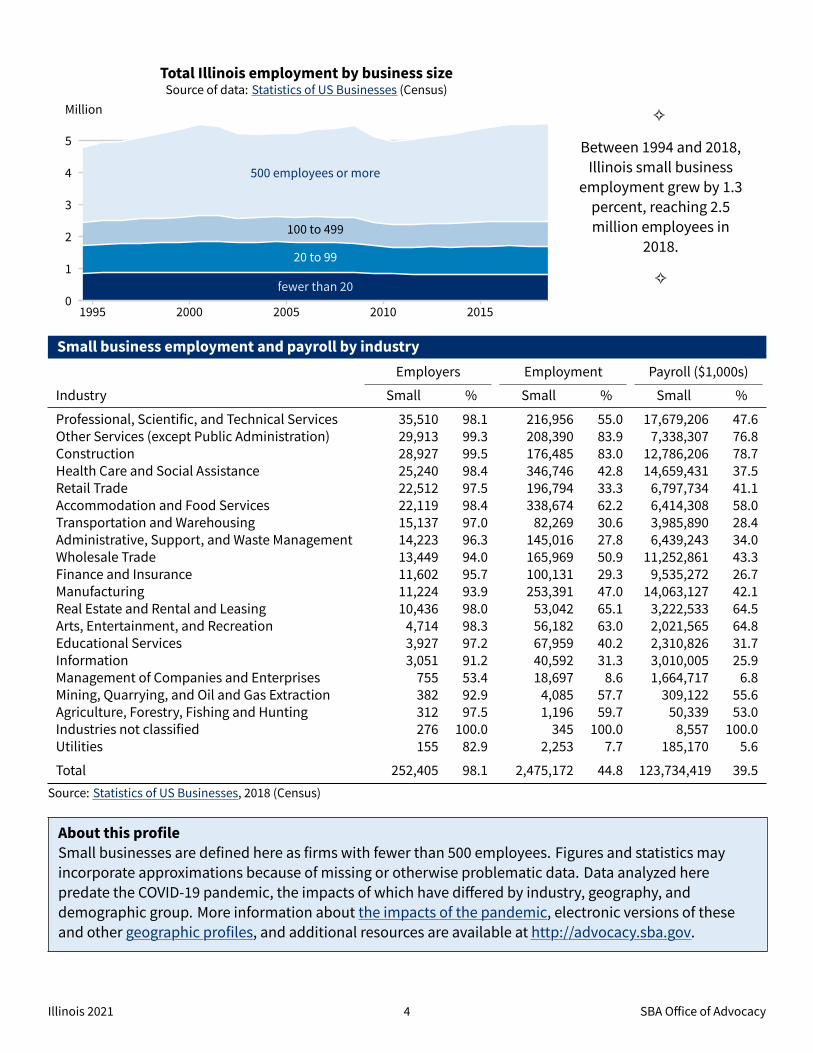
Total Illinois employment by business size Source of data: Statistics of US Businesses (Census)
fewer than 20
20 to 99
100 to 499
500 employees or more
0
1
2
3
4
5
1995 2000 2005 2010 2015
Million G
Between 1994 and 2018, Illinois small business
employment grew by 1.3 percent, reaching 2.5 million employees in
2018.
G
Small business employment and payroll by industry
Employers Employment Payroll ($1,000s)
Industry Small % Small % Small %
Professional, Scientific, and Technical Services 35,510 98.1 216,956 55.0 17,679,206 47.6 Other Services (except Public Administration) 29,913 99.3 208,390 83.9 7,338,307 76.8 Construction 28,927 99.5 176,485 83.0 12,786,206 78.7 Health Care and Social Assistance 25,240 98.4 346,746 42.8 14,659,431 37.5 Retail Trade 22,512 97.5 196,794 33.3 6,797,734 41.1 Accommodation and Food Services 22,119 98.4 338,674 62.2 6,414,308 58.0 Transportation and Warehousing 15,137 97.0 82,269 30.6 3,985,890 28.4 Administrative, Support, and Waste Management 14,223 96.3 145,016 27.8 6,439,243 34.0 Wholesale Trade 13,449 94.0 165,969 50.9 11,252,861 43.3 Finance and Insurance 11,602 95.7 100,131 29.3 9,535,272 26.7 Manufacturing 11,224 93.9 253,391 47.0 14,063,127 42.1 Real Estate and Rental and Leasing 10,436 98.0 53,042 65.1 3,222,533 64.5 Arts, Entertainment, and Recreation 4,714 98.3 56,182 63.0 2,021,565 64.8 Educational Services 3,927 97.2 67,959 40.2 2,310,826 31.7 Information 3,051 91.2 40,592 31.3 3,010,005 25.9 Management of Companies and Enterprises 755 53.4 18,697 8.6 1,664,717 6.8 Mining, Quarrying, and Oil and Gas Extraction 382 92.9 4,085 57.7 309,122 55.6 Agriculture, Forestry, Fishing and Hunting 312 97.5 1,196 59.7 50,339 53.0 Industries not classified 276 100.0 345 100.0 8,557 100.0 Utilities 155 82.9 2,253 7.7 185,170 5.6
Total 252,405 98.1 2,475,172 44.8 123,734,419 39.5
Source: Statistics of US Businesses, 2018 (Census)
About this profile Small businesses are defined here as firms with fewer than 500 employees. Figures and statistics may incorporate approximations because of missing or otherwise problematic data. Data analyzed here predate the COVID-19 pandemic, the impacts of which have differed by industry, geography, and demographic group. More information about the impacts of the pandemic, electronic versions of these and other geographic profiles, and additional resources are available at http://advocacy.sba.gov.
Illinois 2021 4 SBA Office of Advocacy