illinois state board of education 21st century community ... · 21st century community learning...
TRANSCRIPT
1
Illinois State Board of Education 21st Century Community Learning Centers
Program
State-Level Program Evaluation 2014-2015
January 2016
Authors: Leslie Goodyear, Ph.D. Sophia Mansori Joshua Cox Sheila Rodriguez
EDC Illinois 21st Century Community Learning Center Program
2015 Evaluation Report 2
Executive Summary
The United States Department of Education’s 21st Century Community Learning Centers program (21st CCLC), authorized under Title IV, Part B, of the No Child Left Behind Act of 2001, is designed to address three purposes: 1) To provide students opportunities and access to academic resources; 2) To provide students in grades K-12 with youth development services, programs, and activities; and 3) To provide families served by the 21st CCLC programs opportunities for literacy and related educational and personal development. To this end, the Illinois State Board of Education (ISBE) has implemented the statewide 21sct CCLC program since 2003. The state program has seven goals. 21st Century Community Learning Center Statewide Goals Goal 1: Schools will improve student achievement in core academic areas. Goal 2: Schools will show an increase in student attendance and graduation from high school. Goal 3: Schools will see an increase in the social emotional skills of their students. Goal 4: Programs will collaborate with the community. Goal 5: Programs will coordinate with schools to determine the students and families with the
greatest need. Goal 6: Programs will provide ongoing professional development to program personnel. Goal 7: Programs will collaborate with schools and community-based organizations to provide
sustainable programs. Summary of implementation Sub-grants awarded in the 2013 Cohort were joined by a new 2015 Cohort of grants during
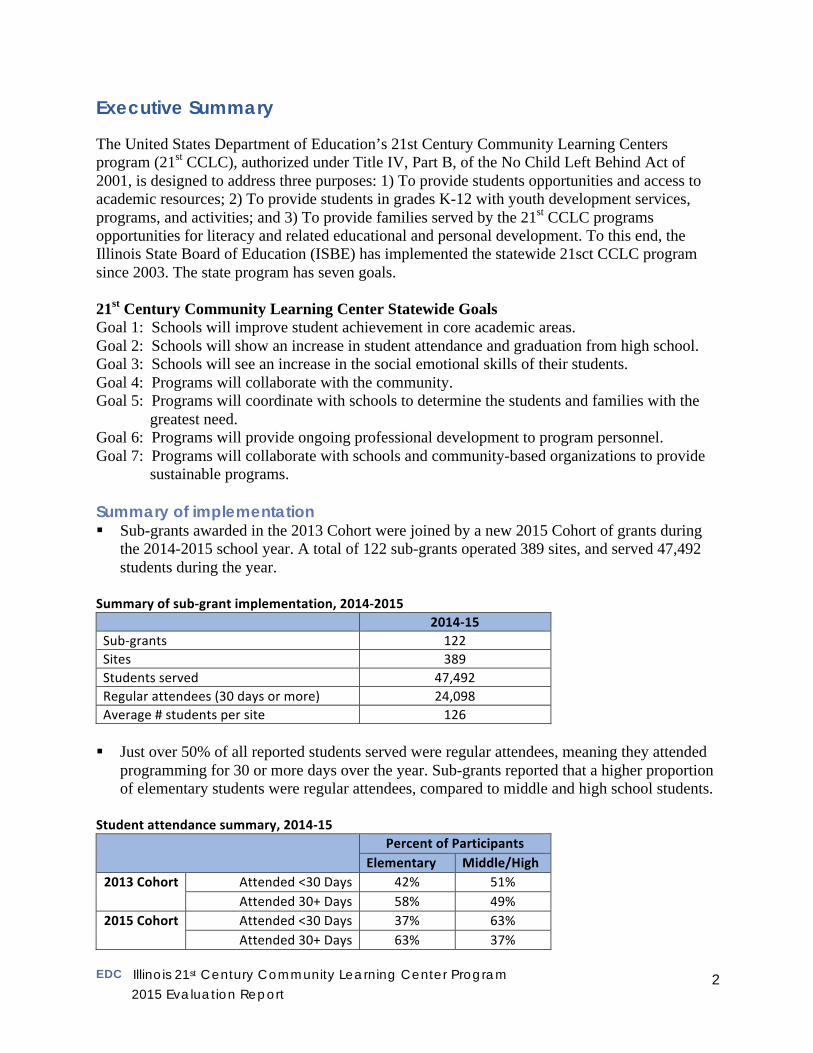
the 2014-2015 school year. A total of 122 sub-grants operated 389 sites, and served 47,492 students during the year.
Summary of sub-‐grant implementation, 2014-‐2015 2014-‐15 Sub-‐grants 122 Sites 389 Students served 47,492 Regular attendees (30 days or more) 24,098 Average # students per site 126
Just over 50% of all reported students served were regular attendees, meaning they attended
programming for 30 or more days over the year. Sub-grants reported that a higher proportion of elementary students were regular attendees, compared to middle and high school students.
Student attendance summary, 2014-‐15 Percent of Participants Elementary Middle/High
2013 Cohort Attended <30 Days 42% 51% Attended 30+ Days 58% 49%
2015 Cohort Attended <30 Days 37% 63% Attended 30+ Days 63% 37%
EDC Illinois 21st Century Community Learning Center Program
2015 Evaluation Report 3
Nearly all sub-grantees relied on school staff referrals in recruiting participants, with 98% of sub-grantees serving elementary, middle school, and high school indicating this.
Sub-grantees indicated that they aimed to create an inviting and inclusive environment as a primary strategy for encouraging student attendance (97-100% by student age group).
Phone calls were a primary method of communicating with parents/guardians, as 95-98% of sub-grants by age group indicated using this strategy.
While the vast majority of both 2013 and 2015 Cohort sub-grants reported making significant progress or meeting requirements with respect to implementing academic and enrichment activities, coordinating afterschool programming with the school’s day programming was the area in which some sub-grants needed to make progress.
The three most frequently indicated program components for elementary school participants were arts programs (98%); science, technology, engineering, mathematics (STEM) programming (92%); and social-emotional components (91%).
The three most frequently indicated program components for middle school participants were arts programs (92%), STEM programming (92%) and social-emotional components (88%).
The three most frequently indicated program components for high school participants were social-emotional components (90%), arts programs (84%), and entrepreneurial skills, career development and job skills programming (84%).
Summary of outcomes
Sub-grants reported that youth participants were involved in a wide range of enrichment activities:
o Arts programming was a dominant enrichment activity, and 94% of sub-grants offering arts programs indicated visual arts (e.g., drawing, photography) were included.
o 84% of sub-grants offering entrepreneurial skills, career development, or job skills activities indicated that this included career exploration, such as skill inventories and exposure to careers and professionals.
o 57% of sub-grants reported offering a service learning component in their program.
o 92% of sub-grants indicated offering STEM programming, and Lego Robotics was the most frequently STEM described activity.
o The most common use of technology for students (outside of STEM programming) was for research or finding information and resources.
o 90% of sub-grants working with high school students indicated they offered college preparation activities.
According to teachers (surveyed using the Teacher APR Survey), the majority of students participating in 2013 Cohort sub-grants improved their behavior in class:
o 63% of elementary students improved with respect to behaving well in class and coming to school motivated to learn.
o 55% of middle and high school students improved with respect to behaving well in class, and 53% improved with respect to coming to school motivated to learn.
EDC Illinois 21st Century Community Learning Center Program
2015 Evaluation Report 4
According to 2013 Cohort sub-grant data, some regular student participants improved their grades over the course of the school year:
o 26.2% of elementary students improved in mathematics, and 30.7% improved in reading.
o 27.1% of middle/high school students improved in mathematics, and 29.7% improved in reading.
2013 Cohort teachers also reported student improvement with respect to academic achievement: 71% of elementary students and 61% of middle/high students improved their academic performance.
Organizational capacity
Sub-grantees offered a diverse set of professional development and training opportunities to their staff. All sub-grants indicated that they participated in 21st CCLC program training and technical assistance activities; 73% indicated that staff participated in training on Illinois and Common Core Standards.
Sub-grantees reported progress in using data to improve their programs. 80-89% of 2013 Cohort sub-grantees indicated they meet or exceed requirements in this area; 48-59% of 2015 Cohort 2015 sub-grantees indicated this.
Sub-grants reported using several methods for measuring progress and outcomes of their grants. 87% of local evaluations reported using the Teacher APR Survey to understand student outcomes; 71% reported using grades and/or test scores. Sub-grantees supplemented their local evaluation by collecting data and feedback from students, parents, and staff on positive changes they have observed or experienced, and on how programs were working and could be improved.
Sustainability appeared to be a challenge for many sub-grants. Only 6% of 2013 Cohort sub-grants indicated that all critical components of their programs were sustainable. The majority of sub-grants from both cohorts indicated that “some” critical components are sustainable.
Challenges and recommendations
Poor parent involvement was cited as the most common barrier or challenge with respect to participation across age groups, with 85% of elementary, 89% of middle and high school serving sub-grantees indicating this. The need to increase parental involvement was also the most commonly cited area for program improvement in local grantee evaluations.
Sub-grantees serving middle and high school students indicated that they face a greater number of barriers to student participation, as competing activities at school and at home, as well as competing responsibilities at a job after school.
Sub-grantee local evaluations offered a number of common recommendations and areas for improvement, in addition to parental involvement. The most frequent recommendations included increasing staff training and professional development; improving program evaluation, data collection, and/or data use; addressing student recruitment, attendance, and retention issues; and increasing or improving social emotional learning supports and activities.
EDC Illinois 21st Century Community Learning Center Program
2015 Evaluation Report 5
Table of Contents
1. Introduction ............................................................................................................. 6 1.1. About this report .................................................................................................................... 7
2. Program Implementation ....................................................................................... 8 2.1. Program totals ........................................................................................................................ 8 2.2. Program operations .............................................................................................................. 10
3. Participant Outcomes .......................................................................................... 16 3.1. Participation in activities ..................................................................................................... 16 3.2. Behavior and social-emotional skills ................................................................................... 20 3.3. Student achievement ............................................................................................................ 22 3.4. Attendance and graduation .................................................................................................. 23 3.5. Student and family inclusion ............................................................................................... 24
4. Organizational Capacity ..................................................................................... 28 4.1. Professional development and training ............................................................................... 28 4.2. Evaluation and continuous improvement ............................................................................ 29 4.3. Funding and sustainability ................................................................................................... 30
5. Program-Reported Challenges ........................................................................... 32
6. Conclusion ............................................................................................................ 36
Appendix A: ISBE 21st CCLC Goals, Objectives, Indicators, and Data Sources ... 38
Appendix B: ISBE 21st CCLC Logic Model ................................................................. 40
Appendix C: EDC Evaluation Design ......................................................................... 42 Evaluation questions ...................................................................................................................... 42 Evaluation questions and data sources .......................................................................................... 44
Appendix D: Instruments and Protocols .................................................................... 47 Spring Survey ................................................................................................................................ 47 Fall Survey ..................................................................................................................................... 63 Site Visit Protocol .......................................................................................................................... 66 Interview Protocol ......................................................................................................................... 68
Appendix E: Summary of Site Visits ........................................................................... 72
Appendix F: Summary of FY2015 Sub-Grant Local Evaluation Reports ................. 82
Appendix G: Teacher APR Survey Data .................................................................... 93
EDC Illinois 21st Century Community Learning Center Program
2015 Evaluation Report 6
1. Introduction The Illinois State Board of Education (ISBE) has implemented the United States Department of Education-funded 21st Century Community Learning Centers program (21st CCLC) since 2003. The program, authorized under Title IV, Part B, of the No Child Left Behind Act of 2001, is designed for three purposes:
1) Provide opportunities and access to academic resources designed for students, especially those from underrepresented groups, high poverty areas, and low-performing schools. These activities are focused on core academic areas, as well as extra-curricular subjects and activities. Programs and sites use strategies such as tutorial services, and academic achievement enhancement programs to help students meet Illinois and local student performance standards in core academic subjects such as reading and mathematics.
2) Provide students in grades K-12 with youth development services, programs, and activities, including drug and violence prevention programs, counseling programs, art, music, and recreation programs, technology education programs, and character education programs designed to reinforce and complement the regular academic program of participating students and their families.
3) Provide families served by the 21st CCLC programs opportunities for literacy and related
educational and personal development. In 2003, the Illinois State Board of Education received funding from the Department of Education to fund both public and private schools to provide students and their families academic and personal development activities to supplement students’ daily school programs. Since 2003, over 300 grantees have been funded to serve students and families throughout the state of Illinois. ISBE identified seven statewide goals for the 21st CCLC program, listed below. The complete documentation of goals, along with objectives and indicators is included in the Appendices. 21st Century Community Learning Center Statewide Goals Goal 1: Schools will improve student achievement in core academic areas. Goal 2: Schools will show an increase in student attendance and graduation from high school. Goal 3: Schools will see an increase in the social emotional skills of their students. Goal 4: Programs will collaborate with the community. Goal 5: Programs will coordinate with schools to determine the students and families with the
greatest need. Goal 6: Programs will provide ongoing professional development to program personnel. Goal 7: Programs will collaborate with schools and community-based organizations to provide
sustainable programs.
EDC Illinois 21st Century Community Learning Center Program
2015 Evaluation Report 7
1.1. About this report
This report is an evaluation of ISBE’s 21st CCLC program sub-grantees active during 2014-2015, including the 122 grants awarded as part of Cohorts 2013 and 2015. Sub-grants for the 2015 cohort were not awarded until mid-way through the 2014-15 school year. Therefore, many of these sub-grants were able to offer only a few months of programming during the timeframe of this report. Because of this, there is little expectation that these sub-grants would have made substantial progress with respect to implementation of activities or realization of outcomes. This report distinguishes between 2013 and 2015 Cohorts to illustrate the differences in progress when it is relevant. This report provides a summary and analysis of the data collected by and made available to EDC up until December 31, 2015. These data include responses to the Spring Survey and Fall Survey (designated in tables and figures throughout the report as SS and FS), data collected through site visits and interviews, and the review of extant data in for the form of sub-grant local evaluation reports. A detailed description of the evaluation design and data sources used for this report is included in the Appendices. This year’s evaluation was hampered by changes in the federal reporting system for the 21st CCLC program. This system serves as a primary source of data for the evaluation, and the system was not available during 2015. Therefore, some data reflecting program activities and outcomes that have been included in previous evaluations are not part of this report. In response to this challenge, EDC conducted a Fall Survey to collect key data that would have otherwise been downloaded from the federal reporting system. This report is organized into the following sections: Program Implementation: This section includes information about what sub-grantees did to implement the program in 2014-15. It includes program totals for attendees and sites, as well as information about organizations and staffing, recruitment and retention, and program components. Participant Outcomes: This section provides data about student achievement, participation in activities, attendance in school and graduation from high school, student behavior, and student and family inclusion. Organizational Capacity: This section provides information about the organizational capacity of sub-grantees, including staff development, progress toward meeting stated program goals, program evaluation, and sustainability. Program Challenges and Recommendations: This section summarizes the barriers and challenges that sub-grantees experienced during implementation of the program, as well as a summary of grantees’ evaluators recommendations for program improvement.
EDC Illinois 21st Century Community Learning Center Program
2015 Evaluation Report 8
2. Program Implementation
2.1. Program totals
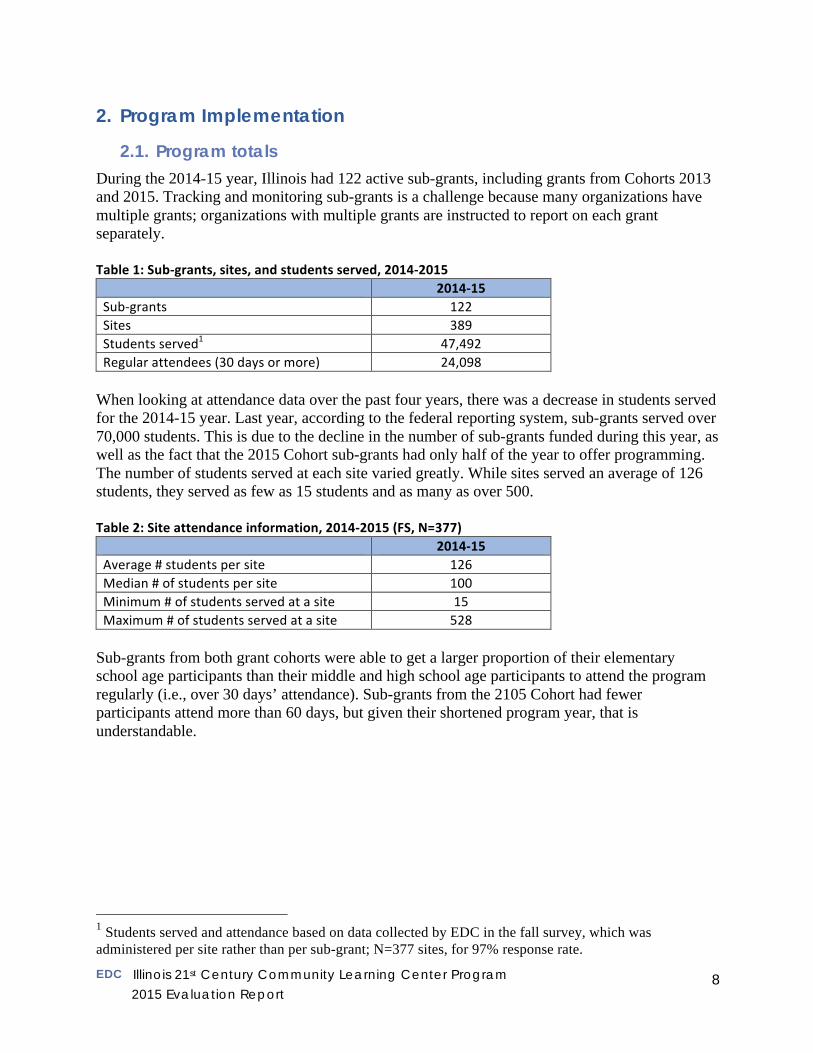
During the 2014-15 year, Illinois had 122 active sub-grants, including grants from Cohorts 2013 and 2015. Tracking and monitoring sub-grants is a challenge because many organizations have multiple grants; organizations with multiple grants are instructed to report on each grant separately. Table 1: Sub-‐grants, sites, and students served, 2014-‐2015 2014-‐15 Sub-‐grants 122 Sites 389 Students served1 47,492 Regular attendees (30 days or more) 24,098
When looking at attendance data over the past four years, there was a decrease in students served for the 2014-15 year. Last year, according to the federal reporting system, sub-grants served over 70,000 students. This is due to the decline in the number of sub-grants funded during this year, as well as the fact that the 2015 Cohort sub-grants had only half of the year to offer programming. The number of students served at each site varied greatly. While sites served an average of 126 students, they served as few as 15 students and as many as over 500. Table 2: Site attendance information, 2014-‐2015 (FS, N=377) 2014-‐15 Average # students per site 126 Median # of students per site 100 Minimum # of students served at a site 15 Maximum # of students served at a site 528
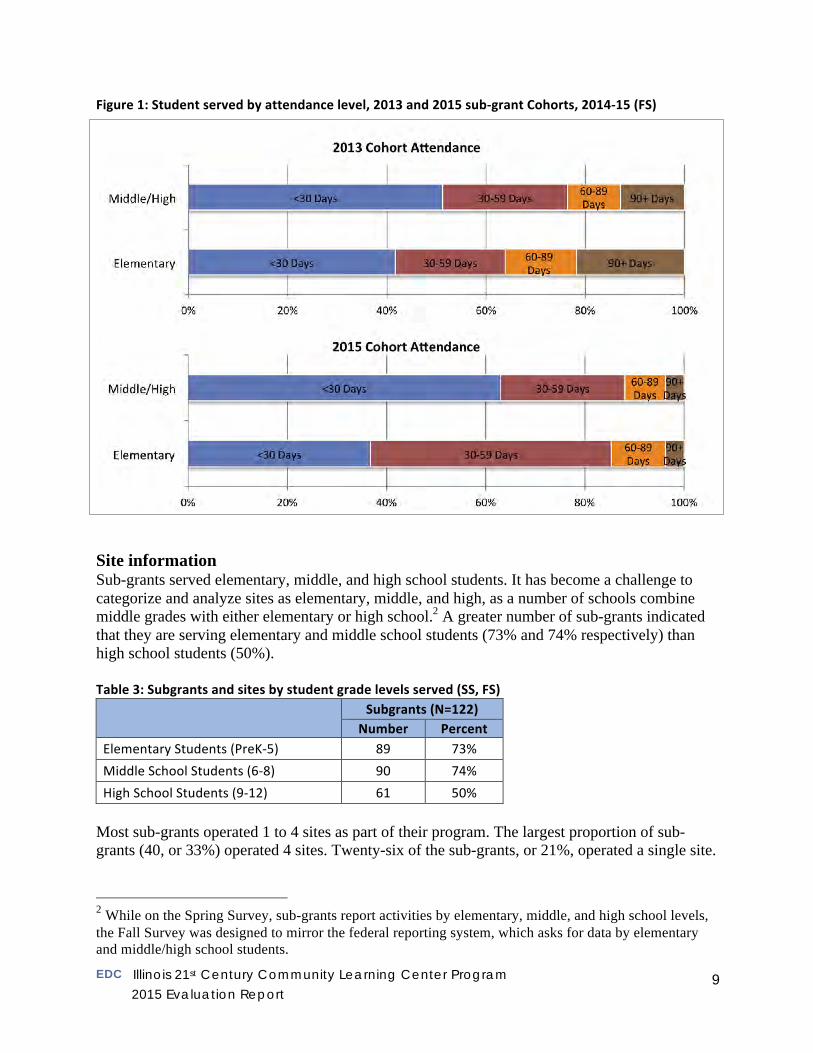
Sub-grants from both grant cohorts were able to get a larger proportion of their elementary school age participants than their middle and high school age participants to attend the program regularly (i.e., over 30 days’ attendance). Sub-grants from the 2105 Cohort had fewer participants attend more than 60 days, but given their shortened program year, that is understandable.
1 Students served and attendance based on data collected by EDC in the fall survey, which was administered per site rather than per sub-grant; N=377 sites, for 97% response rate.
EDC Illinois 21st Century Community Learning Center Program
2015 Evaluation Report 9
Figure 1: Student served by attendance level, 2013 and 2015 sub-‐grant Cohorts, 2014-‐15 (FS)
Site information Sub-grants served elementary, middle, and high school students. It has become a challenge to categorize and analyze sites as elementary, middle, and high, as a number of schools combine middle grades with either elementary or high school.2 A greater number of sub-grants indicated that they are serving elementary and middle school students (73% and 74% respectively) than high school students (50%). Table 3: Subgrants and sites by student grade levels served (SS, FS)
Subgrants (N=122)
Number Percent Elementary Students (PreK-‐5) 89 73% Middle School Students (6-‐8) 90 74% High School Students (9-‐12) 61 50%
Most sub-grants operated 1 to 4 sites as part of their program. The largest proportion of sub-grants (40, or 33%) operated 4 sites. Twenty-six of the sub-grants, or 21%, operated a single site.
2 While on the Spring Survey, sub-grants report activities by elementary, middle, and high school levels, the Fall Survey was designed to mirror the federal reporting system, which asks for data by elementary and middle/high school students.
EDC Illinois 21st Century Community Learning Center Program
2015 Evaluation Report 10
Nine sub-grants (7%) operated more than 5 sites, with one of those operating 21 sites (Chicago Public Schools). Table 4: Number of sites per sub-‐grant (SS, N =122)
Sub-‐grants Number Percent
1 Site 26 21% 2 Sites 23 19% 3 Sites 17 14% 4 Sites 40 33% 5 Sites 7 6% More than 5 Sites 9 7%
2.2. Program operations
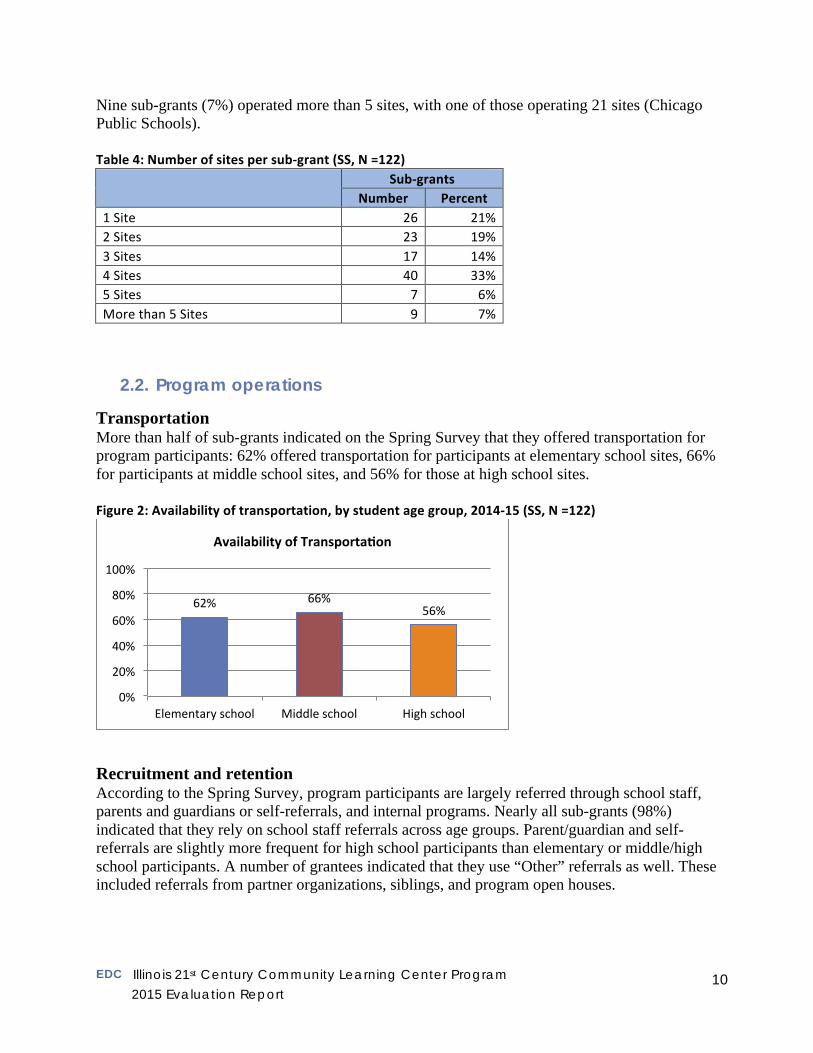
Transportation More than half of sub-grants indicated on the Spring Survey that they offered transportation for program participants: 62% offered transportation for participants at elementary school sites, 66% for participants at middle school sites, and 56% for those at high school sites. Figure 2: Availability of transportation, by student age group, 2014-‐15 (SS, N =122)
Recruitment and retention According to the Spring Survey, program participants are largely referred through school staff, parents and guardians or self-referrals, and internal programs. Nearly all sub-grants (98%) indicated that they rely on school staff referrals across age groups. Parent/guardian and self-referrals are slightly more frequent for high school participants than elementary or middle/high school participants. A number of grantees indicated that they use “Other” referrals as well. These included referrals from partner organizations, siblings, and program open houses.
62% 66% 56%
0%
20%
40%
60%
80%
100%
Elementary school Middle school High school
Availability of TransportaNon
EDC Illinois 21st Century Community Learning Center Program
2015 Evaluation Report 11
Table 5: Type of student referrals, 2014-‐15 (SS, N=122)
Type of Referral
% of Sub-‐grants Indicating Referrals For: Elementary School
Participants Middle School Participants
High School Participants
School staff referrals (e.g. teachers, administrators, etc.) 98% 98% 98% Parent/Guardian or self-‐referrals 89% 88% 93% Internal program referrals 85% 81% 87% Other 22% 28% 21%
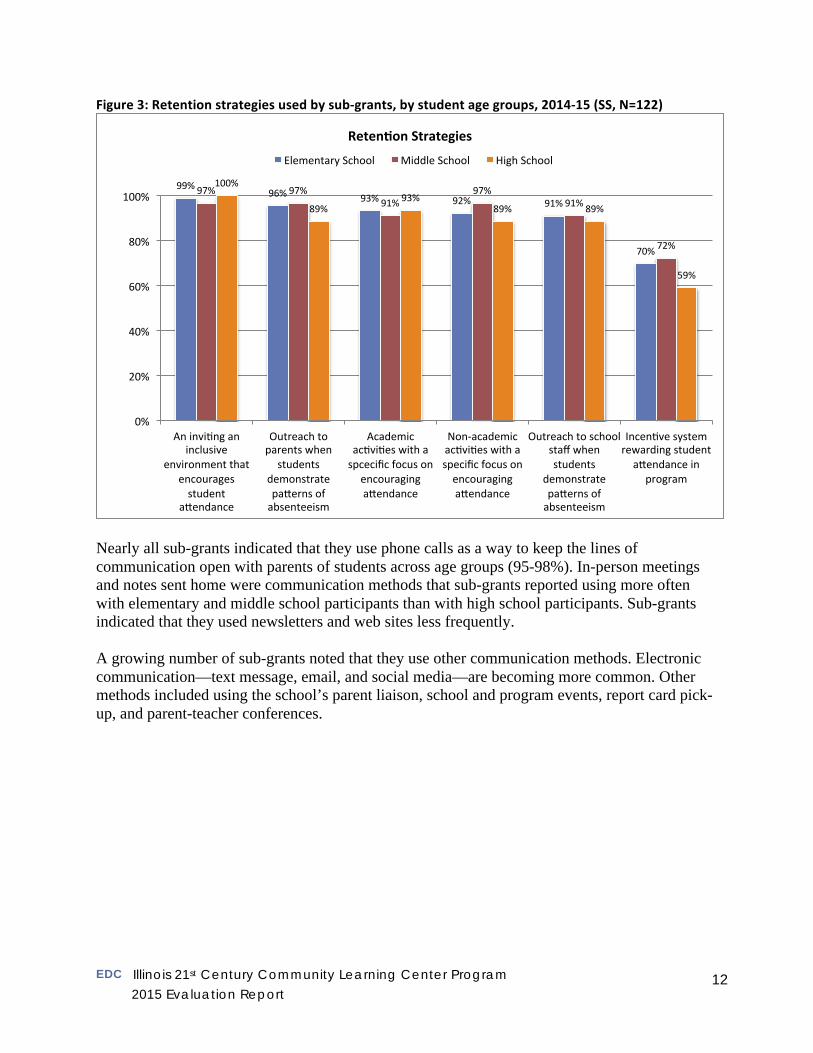
Retention is a common challenge, and as sub-grants indicated in the Spring Survey, they do many things across age groups to turn participants into “regular attendees” (that is, students that come to more than 30 days of programming during the year). Nearly all sub-grants indicated that they worked to create an inviting and inclusive environment that encourages student attendance (97-100%). Most reported that they reach out to parents when students demonstrated patterns of absenteeism, although fewer sub-grants do that when working with high school students (89%, in contrast with 96% for elementary and 97% for middle grade students). The use of incentives rewarding attendance was employed more often with elementary and middle school students than high school students. Sub-grants noted a small number of strategies that they use to help keep students in their programs in addition to the core ones included in Figure 3. These included: soliciting input from youth on what activities would interest them, or involving youth in the planning of program activities; holding field trips or other special events that attract youth; building relationships with youth and talking with them about attendance issues as they arise.
EDC Illinois 21st Century Community Learning Center Program
2015 Evaluation Report 12
Figure 3: Retention strategies used by sub-‐grants, by student age groups, 2014-‐15 (SS, N=122)
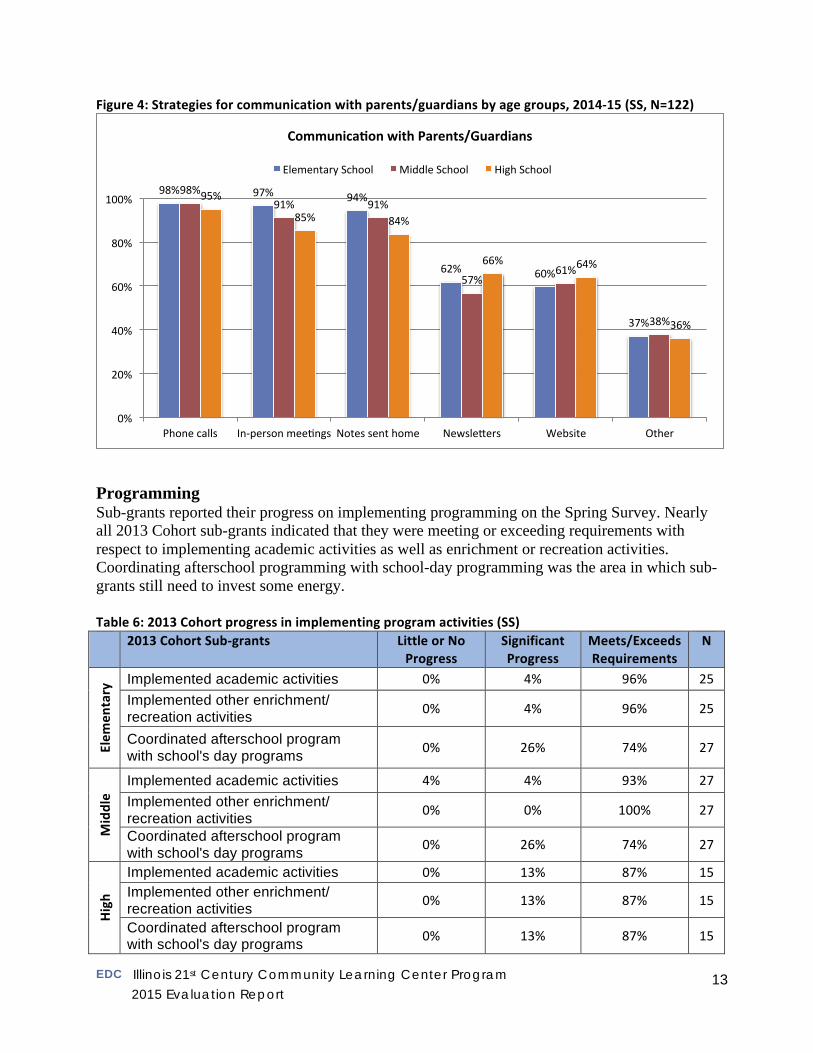
Nearly all sub-grants indicated that they use phone calls as a way to keep the lines of communication open with parents of students across age groups (95-98%). In-person meetings and notes sent home were communication methods that sub-grants reported using more often with elementary and middle school participants than with high school participants. Sub-grants indicated that they used newsletters and web sites less frequently. A growing number of sub-grants noted that they use other communication methods. Electronic communication—text message, email, and social media—are becoming more common. Other methods included using the school’s parent liaison, school and program events, report card pick-up, and parent-teacher conferences.
99% 96% 93% 92% 91%
70%
97% 97% 91%
97% 91%
72%
100%
89% 93%
89% 89%
59%
0%
20%
40%
60%
80%
100%
An inviWng an inclusive
environment that encourages student
aXendance
Outreach to parents when
students demonstrate paXerns of absenteeism
Academic acWviWes with a spcecific focus on
encouraging aXendance
Non-‐academic acWviWes with a specific focus on encouraging aXendance
Outreach to school staff when students
demonstrate paXerns of absenteeism
IncenWve system rewarding student aXendance in
program
RetenNon Strategies
Elementary School Middle School High School
EDC Illinois 21st Century Community Learning Center Program
2015 Evaluation Report 13
Figure 4: Strategies for communication with parents/guardians by age groups, 2014-‐15 (SS, N=122)
Programming Sub-grants reported their progress on implementing programming on the Spring Survey. Nearly all 2013 Cohort sub-grants indicated that they were meeting or exceeding requirements with respect to implementing academic activities as well as enrichment or recreation activities. Coordinating afterschool programming with school-day programming was the area in which sub-grants still need to invest some energy. Table 6: 2013 Cohort progress in implementing program activities (SS) 2013 Cohort Sub-‐grants Little or No
Progress Significant Progress
Meets/Exceeds Requirements
N
Elem
entary Implemented academic activities 0% 4% 96% 25
Implemented other enrichment/ recreation activities 0% 4% 96% 25
Coordinated afterschool program with school's day programs 0% 26% 74% 27
Middle
Implemented academic activities 4% 4% 93% 27 Implemented other enrichment/ recreation activities 0% 0% 100% 27
Coordinated afterschool program with school's day programs 0% 26% 74% 27
High
Implemented academic activities 0% 13% 87% 15 Implemented other enrichment/ recreation activities 0% 13% 87% 15
Coordinated afterschool program with school's day programs 0% 13% 87% 15
98% 97% 94%
62% 60%
37%
98% 91% 91%
57% 61%
38%
95%
85% 84%
66% 64%
36%
0%
20%
40%
60%
80%
100%
Phone calls In-‐person meeWngs Notes sent home NewsleXers Website Other
CommunicaNon with Parents/Guardians
Elementary School Middle School High School
EDC Illinois 21st Century Community Learning Center Program
2015 Evaluation Report 14
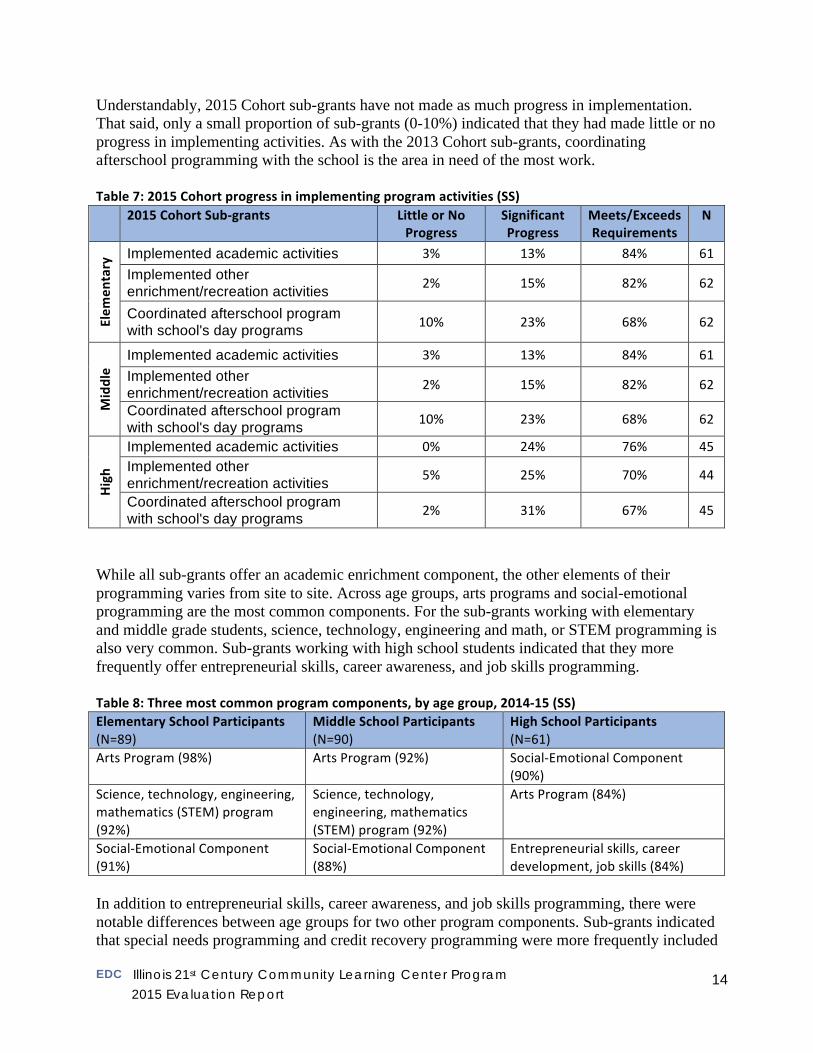
Understandably, 2015 Cohort sub-grants have not made as much progress in implementation. That said, only a small proportion of sub-grants (0-10%) indicated that they had made little or no progress in implementing activities. As with the 2013 Cohort sub-grants, coordinating afterschool programming with the school is the area in need of the most work. Table 7: 2015 Cohort progress in implementing program activities (SS) 2015 Cohort Sub-‐grants Little or No
Progress Significant Progress
Meets/Exceeds Requirements
N
Elem
entary Implemented academic activities 3% 13% 84% 61
Implemented other enrichment/recreation activities 2% 15% 82% 62
Coordinated afterschool program with school's day programs 10% 23% 68% 62
Middle
Implemented academic activities 3% 13% 84% 61 Implemented other enrichment/recreation activities 2% 15% 82% 62
Coordinated afterschool program with school's day programs 10% 23% 68% 62
High
Implemented academic activities 0% 24% 76% 45 Implemented other enrichment/recreation activities 5% 25% 70% 44
Coordinated afterschool program with school's day programs 2% 31% 67% 45
While all sub-grants offer an academic enrichment component, the other elements of their programming varies from site to site. Across age groups, arts programs and social-emotional programming are the most common components. For the sub-grants working with elementary and middle grade students, science, technology, engineering and math, or STEM programming is also very common. Sub-grants working with high school students indicated that they more frequently offer entrepreneurial skills, career awareness, and job skills programming. Table 8: Three most common program components, by age group, 2014-‐15 (SS) Elementary School Participants (N=89)
Middle School Participants (N=90)
High School Participants (N=61)
Arts Program (98%) Arts Program (92%) Social-‐Emotional Component (90%)
Science, technology, engineering, mathematics (STEM) program (92%)
Science, technology, engineering, mathematics (STEM) program (92%)
Arts Program (84%)
Social-‐Emotional Component (91%)
Social-‐Emotional Component (88%)
Entrepreneurial skills, career development, job skills (84%)
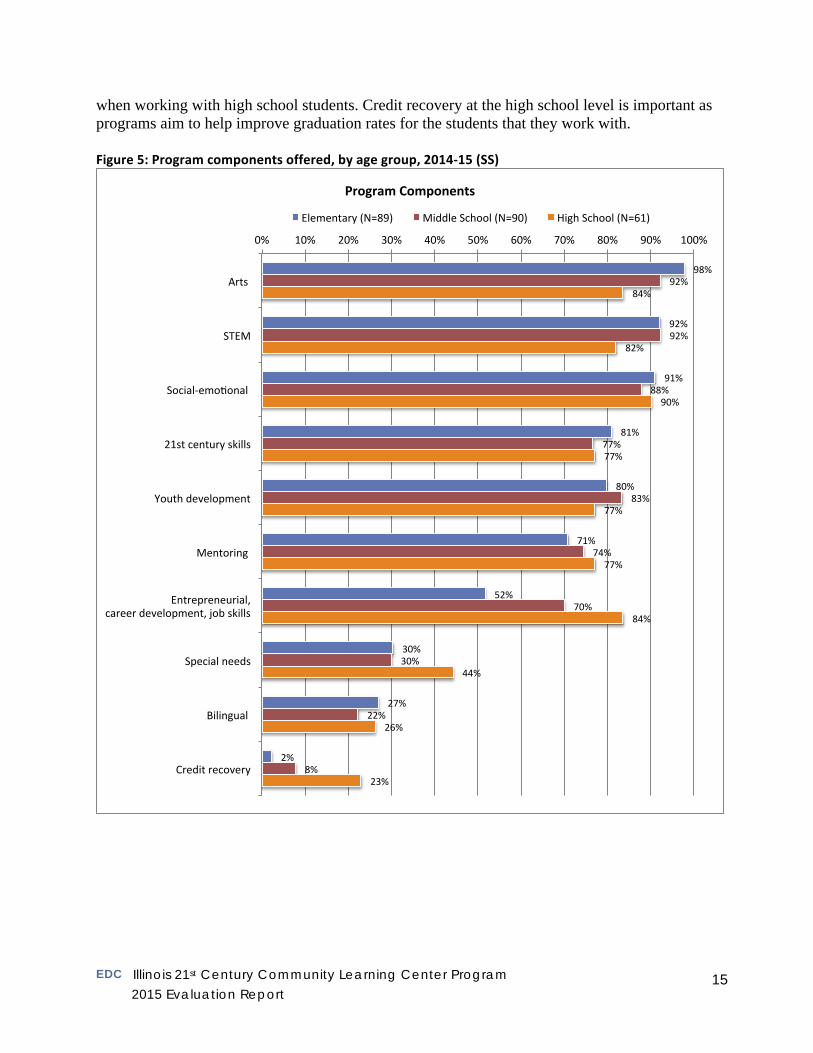
In addition to entrepreneurial skills, career awareness, and job skills programming, there were notable differences between age groups for two other program components. Sub-grants indicated that special needs programming and credit recovery programming were more frequently included
EDC Illinois 21st Century Community Learning Center Program
2015 Evaluation Report 15
when working with high school students. Credit recovery at the high school level is important as programs aim to help improve graduation rates for the students that they work with. Figure 5: Program components offered, by age group, 2014-‐15 (SS)
98%
92%
91%
81%
80%
71%
52%
30%
27%
2%
92%
92%
88%
77%
83%
74%
70%
30%
22%
8%
84%
82%
90%
77%
77%
77%
84%
44%
26%
23%
0% 10% 20% 30% 40% 50% 60% 70% 80% 90% 100%
Arts
STEM
Social-‐emoWonal
21st century skills
Youth development
Mentoring
Entrepreneurial, career development, job skills
Special needs
Bilingual
Credit recovery
Program Components
Elementary (N=89) Middle School (N=90) High School (N=61)
EDC Illinois 21st Century Community Learning Center Program
2015 Evaluation Report 16
3. Participant Outcomes
3.1. Participation in activities
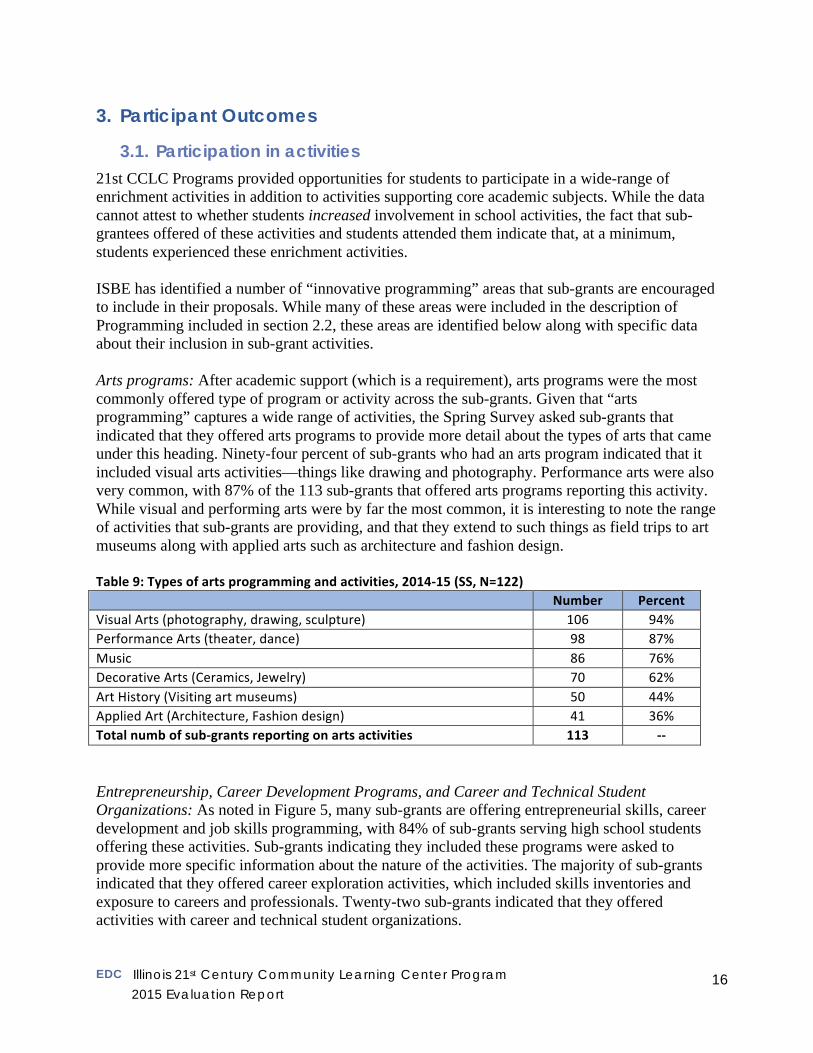
21st CCLC Programs provided opportunities for students to participate in a wide-range of enrichment activities in addition to activities supporting core academic subjects. While the data cannot attest to whether students increased involvement in school activities, the fact that sub-grantees offered of these activities and students attended them indicate that, at a minimum, students experienced these enrichment activities. ISBE has identified a number of “innovative programming” areas that sub-grants are encouraged to include in their proposals. While many of these areas were included in the description of Programming included in section 2.2, these areas are identified below along with specific data about their inclusion in sub-grant activities. Arts programs: After academic support (which is a requirement), arts programs were the most commonly offered type of program or activity across the sub-grants. Given that “arts programming” captures a wide range of activities, the Spring Survey asked sub-grants that indicated that they offered arts programs to provide more detail about the types of arts that came under this heading. Ninety-four percent of sub-grants who had an arts program indicated that it included visual arts activities—things like drawing and photography. Performance arts were also very common, with 87% of the 113 sub-grants that offered arts programs reporting this activity. While visual and performing arts were by far the most common, it is interesting to note the range of activities that sub-grants are providing, and that they extend to such things as field trips to art museums along with applied arts such as architecture and fashion design. Table 9: Types of arts programming and activities, 2014-‐15 (SS, N=122) Number Percent Visual Arts (photography, drawing, sculpture) 106 94% Performance Arts (theater, dance) 98 87% Music 86 76% Decorative Arts (Ceramics, Jewelry) 70 62% Art History (Visiting art museums) 50 44% Applied Art (Architecture, Fashion design) 41 36% Total numb of sub-‐grants reporting on arts activities 113 -‐-‐ Entrepreneurship, Career Development Programs, and Career and Technical Student Organizations: As noted in Figure 5, many sub-grants are offering entrepreneurial skills, career development and job skills programming, with 84% of sub-grants serving high school students offering these activities. Sub-grants indicating they included these programs were asked to provide more specific information about the nature of the activities. The majority of sub-grants indicated that they offered career exploration activities, which included skills inventories and exposure to careers and professionals. Twenty-two sub-grants indicated that they offered activities with career and technical student organizations.
EDC Illinois 21st Century Community Learning Center Program
2015 Evaluation Report 17
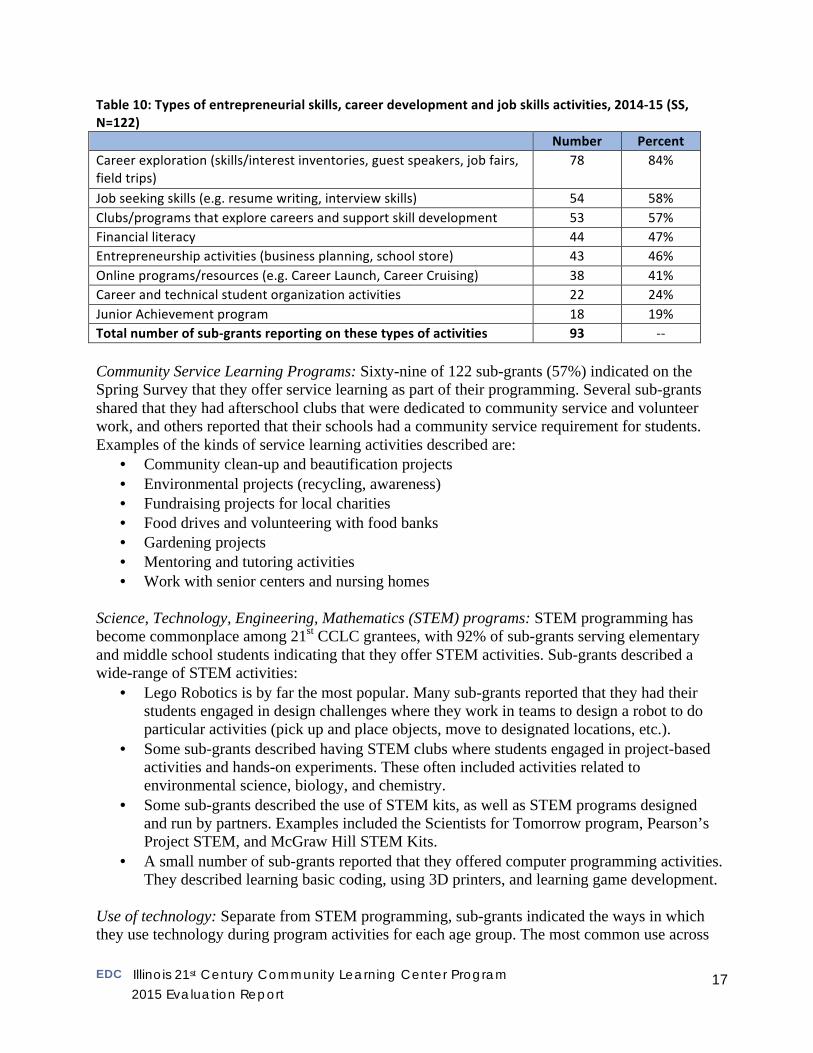
Table 10: Types of entrepreneurial skills, career development and job skills activities, 2014-‐15 (SS, N=122) Number Percent Career exploration (skills/interest inventories, guest speakers, job fairs, field trips)
78 84%
Job seeking skills (e.g. resume writing, interview skills) 54 58% Clubs/programs that explore careers and support skill development 53 57% Financial literacy 44 47% Entrepreneurship activities (business planning, school store) 43 46% Online programs/resources (e.g. Career Launch, Career Cruising) 38 41% Career and technical student organization activities 22 24% Junior Achievement program 18 19% Total number of sub-‐grants reporting on these types of activities 93 -‐-‐ Community Service Learning Programs: Sixty-nine of 122 sub-grants (57%) indicated on the Spring Survey that they offer service learning as part of their programming. Several sub-grants shared that they had afterschool clubs that were dedicated to community service and volunteer work, and others reported that their schools had a community service requirement for students. Examples of the kinds of service learning activities described are:
• Community clean-up and beautification projects • Environmental projects (recycling, awareness) • Fundraising projects for local charities • Food drives and volunteering with food banks • Gardening projects • Mentoring and tutoring activities • Work with senior centers and nursing homes
Science, Technology, Engineering, Mathematics (STEM) programs: STEM programming has become commonplace among 21st CCLC grantees, with 92% of sub-grants serving elementary and middle school students indicating that they offer STEM activities. Sub-grants described a wide-range of STEM activities:
• Lego Robotics is by far the most popular. Many sub-grants reported that they had their students engaged in design challenges where they work in teams to design a robot to do particular activities (pick up and place objects, move to designated locations, etc.).
• Some sub-grants described having STEM clubs where students engaged in project-based activities and hands-on experiments. These often included activities related to environmental science, biology, and chemistry.
• Some sub-grants described the use of STEM kits, as well as STEM programs designed and run by partners. Examples included the Scientists for Tomorrow program, Pearson’s Project STEM, and McGraw Hill STEM Kits.
• A small number of sub-grants reported that they offered computer programming activities. They described learning basic coding, using 3D printers, and learning game development.
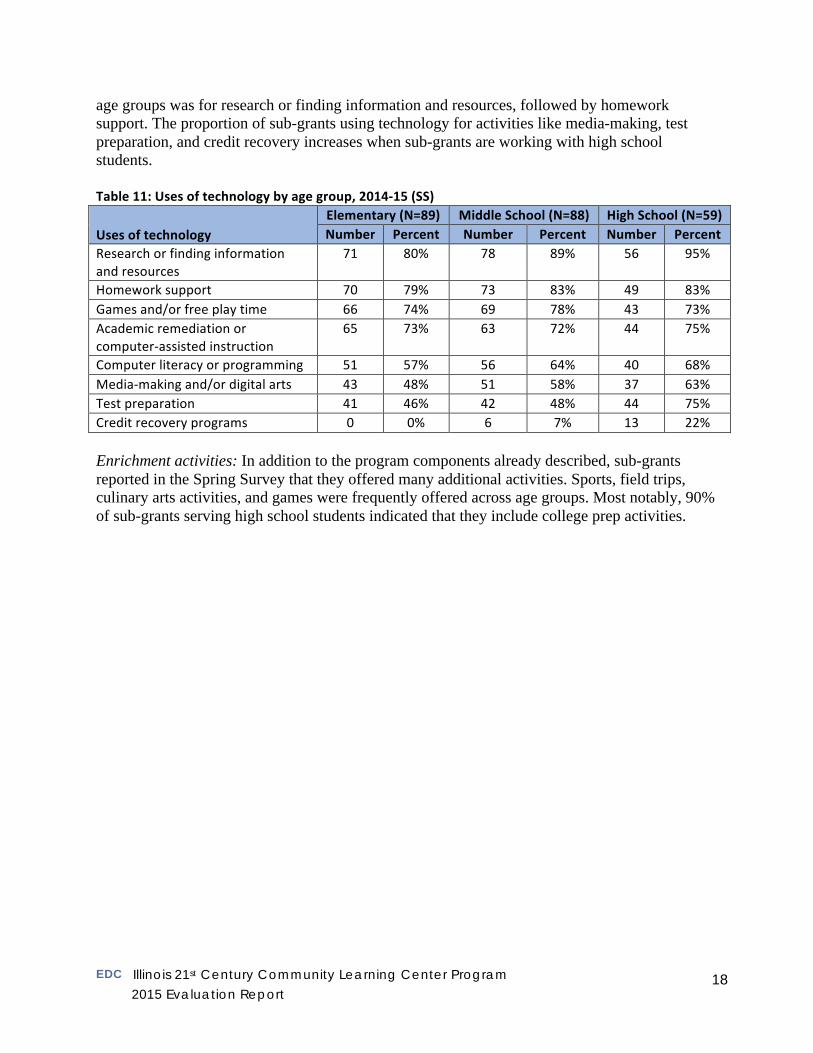
Use of technology: Separate from STEM programming, sub-grants indicated the ways in which they use technology during program activities for each age group. The most common use across
EDC Illinois 21st Century Community Learning Center Program
2015 Evaluation Report 18
age groups was for research or finding information and resources, followed by homework support. The proportion of sub-grants using technology for activities like media-making, test preparation, and credit recovery increases when sub-grants are working with high school students. Table 11: Uses of technology by age group, 2014-‐15 (SS)
Uses of technology Elementary (N=89) Middle School (N=88) High School (N=59) Number Percent Number Percent Number Percent
Research or finding information and resources
71 80% 78 89% 56 95%
Homework support 70 79% 73 83% 49 83% Games and/or free play time 66 74% 69 78% 43 73% Academic remediation or computer-‐assisted instruction
65 73% 63 72% 44 75%
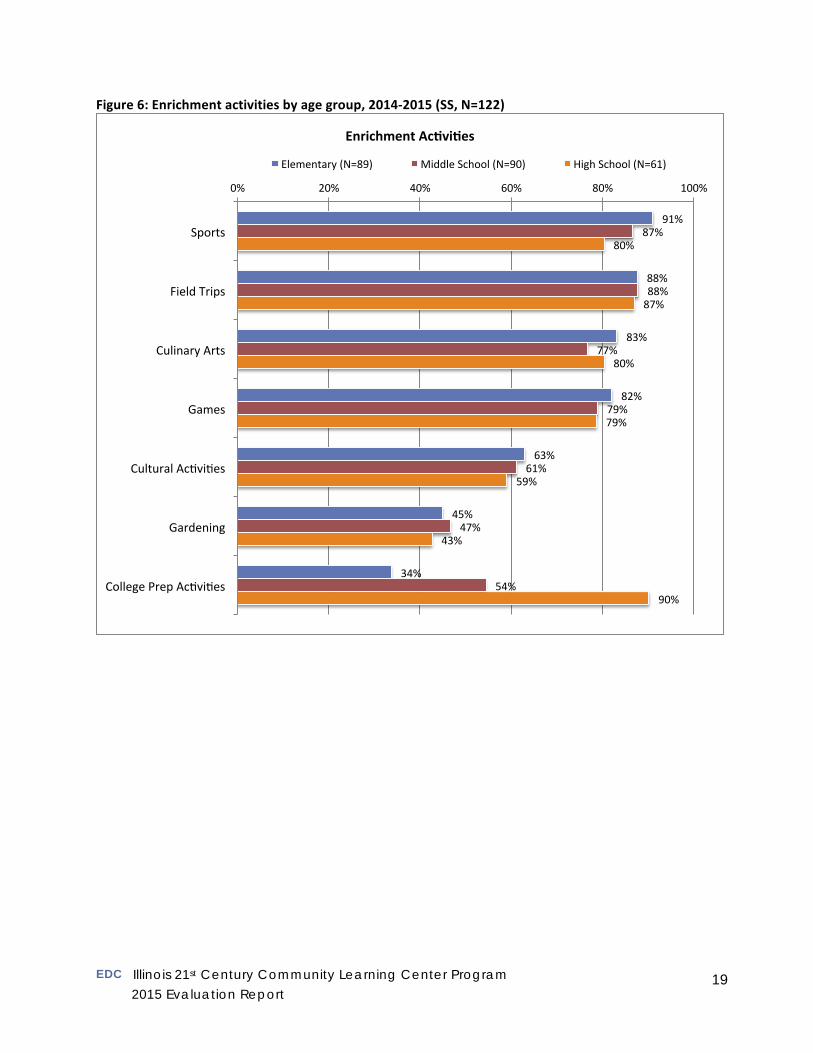
Computer literacy or programming 51 57% 56 64% 40 68% Media-‐making and/or digital arts 43 48% 51 58% 37 63% Test preparation 41 46% 42 48% 44 75% Credit recovery programs 0 0% 6 7% 13 22% Enrichment activities: In addition to the program components already described, sub-grants reported in the Spring Survey that they offered many additional activities. Sports, field trips, culinary arts activities, and games were frequently offered across age groups. Most notably, 90% of sub-grants serving high school students indicated that they include college prep activities.
EDC Illinois 21st Century Community Learning Center Program
2015 Evaluation Report 19
Figure 6: Enrichment activities by age group, 2014-‐2015 (SS, N=122)
91%
88%
83%
82%
63%
45%
34%
87%
88%
77%
79%
61%
47%
54%
80%
87%
80%
79%
59%
43%
90%
0% 20% 40% 60% 80% 100%
Sports
Field Trips
Culinary Arts
Games
Cultural AcWviWes
Gardening
College Prep AcWviWes
Enrichment AcNviNes
Elementary (N=89) Middle School (N=90) High School (N=61)
EDC Illinois 21st Century Community Learning Center Program
2015 Evaluation Report 20
3.2. Behavior and social-emotional skills
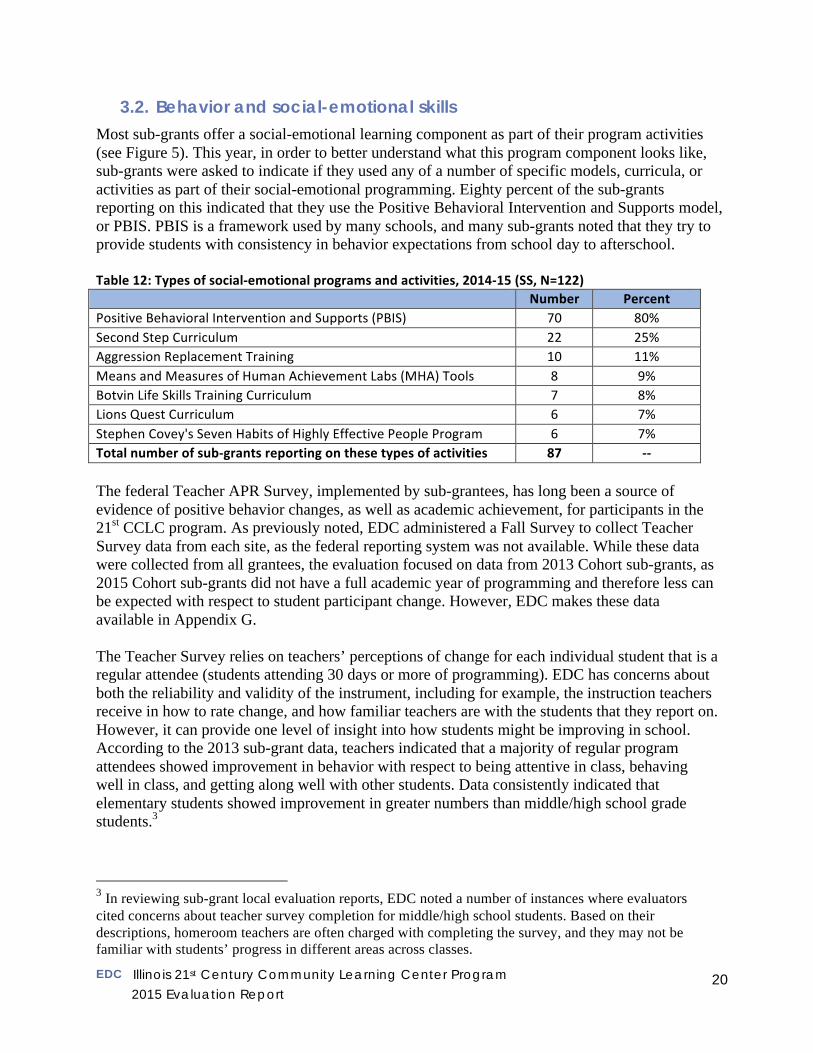
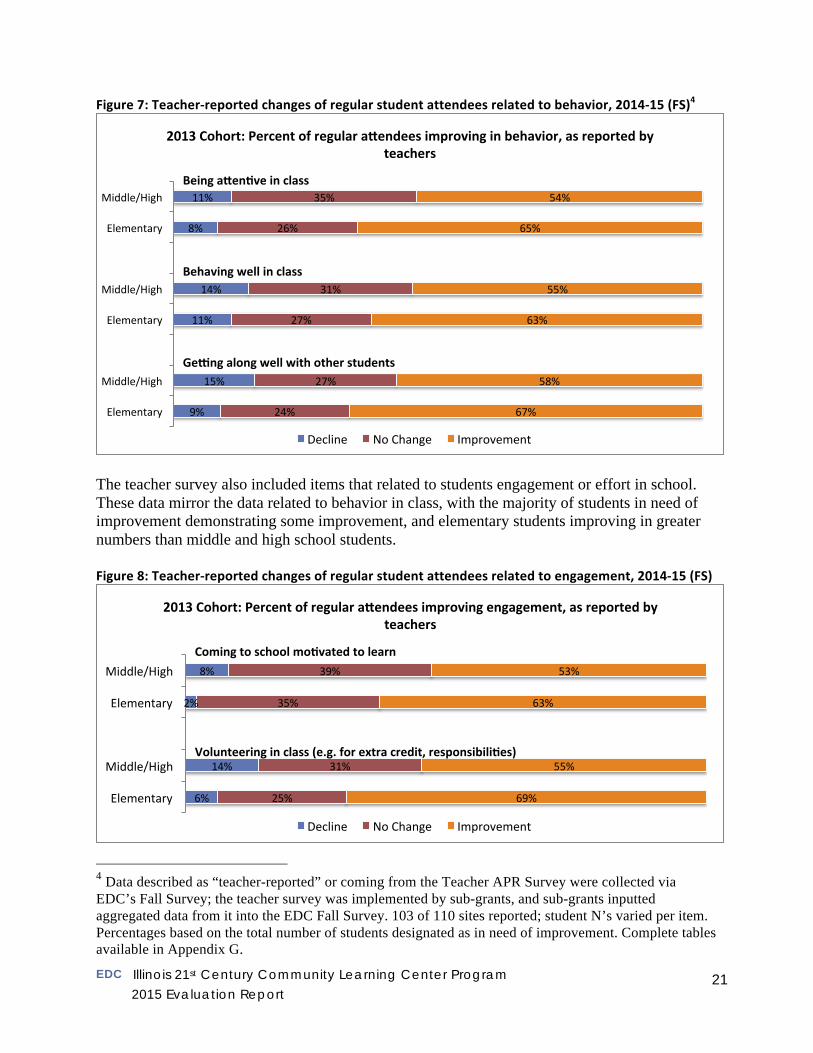
Most sub-grants offer a social-emotional learning component as part of their program activities (see Figure 5). This year, in order to better understand what this program component looks like, sub-grants were asked to indicate if they used any of a number of specific models, curricula, or activities as part of their social-emotional programming. Eighty percent of the sub-grants reporting on this indicated that they use the Positive Behavioral Intervention and Supports model, or PBIS. PBIS is a framework used by many schools, and many sub-grants noted that they try to provide students with consistency in behavior expectations from school day to afterschool. Table 12: Types of social-‐emotional programs and activities, 2014-‐15 (SS, N=122) Number Percent Positive Behavioral Intervention and Supports (PBIS) 70 80% Second Step Curriculum 22 25% Aggression Replacement Training 10 11% Means and Measures of Human Achievement Labs (MHA) Tools 8 9% Botvin Life Skills Training Curriculum 7 8% Lions Quest Curriculum 6 7% Stephen Covey's Seven Habits of Highly Effective People Program 6 7% Total number of sub-‐grants reporting on these types of activities 87 -‐-‐ The federal Teacher APR Survey, implemented by sub-grantees, has long been a source of evidence of positive behavior changes, as well as academic achievement, for participants in the 21st CCLC program. As previously noted, EDC administered a Fall Survey to collect Teacher Survey data from each site, as the federal reporting system was not available. While these data were collected from all grantees, the evaluation focused on data from 2013 Cohort sub-grants, as 2015 Cohort sub-grants did not have a full academic year of programming and therefore less can be expected with respect to student participant change. However, EDC makes these data available in Appendix G. The Teacher Survey relies on teachers’ perceptions of change for each individual student that is a regular attendee (students attending 30 days or more of programming). EDC has concerns about both the reliability and validity of the instrument, including for example, the instruction teachers receive in how to rate change, and how familiar teachers are with the students that they report on. However, it can provide one level of insight into how students might be improving in school. According to the 2013 sub-grant data, teachers indicated that a majority of regular program attendees showed improvement in behavior with respect to being attentive in class, behaving well in class, and getting along well with other students. Data consistently indicated that elementary students showed improvement in greater numbers than middle/high school grade students.3
3 In reviewing sub-grant local evaluation reports, EDC noted a number of instances where evaluators cited concerns about teacher survey completion for middle/high school students. Based on their descriptions, homeroom teachers are often charged with completing the survey, and they may not be familiar with students’ progress in different areas across classes.
EDC Illinois 21st Century Community Learning Center Program
2015 Evaluation Report 21
Figure 7: Teacher-‐reported changes of regular student attendees related to behavior, 2014-‐15 (FS)4
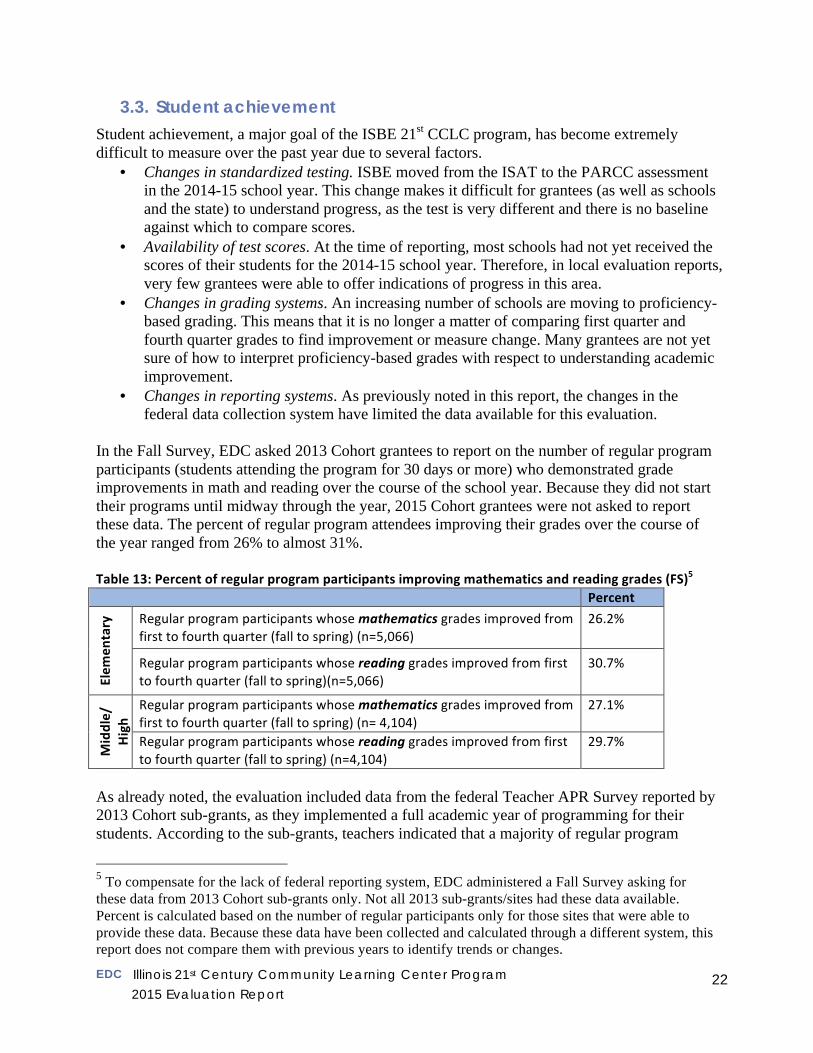
The teacher survey also included items that related to students engagement or effort in school. These data mirror the data related to behavior in class, with the majority of students in need of improvement demonstrating some improvement, and elementary students improving in greater numbers than middle and high school students. Figure 8: Teacher-‐reported changes of regular student attendees related to engagement, 2014-‐15 (FS)
4 Data described as “teacher-reported” or coming from the Teacher APR Survey were collected via EDC’s Fall Survey; the teacher survey was implemented by sub-grants, and sub-grants inputted aggregated data from it into the EDC Fall Survey. 103 of 110 sites reported; student N’s varied per item. Percentages based on the total number of students designated as in need of improvement. Complete tables available in Appendix G.
9%
15%
11%
14%
8%
11%
24%
27%
27%
31%
26%
35%
67%
58%
63%
55%
65%
54%
Elementary
Middle/High
Elementary
Middle/High
Elementary
Middle/High
2013 Cohort: Percent of regular a]endees improving in behavior, as reported by teachers
Decline No Change Improvement
Being a]enNve in class
Behaving well in class
Ge_ng along well with other students
6%
14%
2%
8%
25%
31%
35%
39%
69%
55%
63%
53%
Elementary
Middle/High
Elementary
Middle/High
2013 Cohort: Percent of regular a]endees improving engagement, as reported by teachers
Decline No Change Improvement
Coming to school moNvated to learn
Volunteering in class (e.g. for extra credit, responsibiliNes)
EDC Illinois 21st Century Community Learning Center Program
2015 Evaluation Report 22
3.3. Student achievement
Student achievement, a major goal of the ISBE 21st CCLC program, has become extremely difficult to measure over the past year due to several factors.
• Changes in standardized testing. ISBE moved from the ISAT to the PARCC assessment in the 2014-15 school year. This change makes it difficult for grantees (as well as schools and the state) to understand progress, as the test is very different and there is no baseline against which to compare scores.
• Availability of test scores. At the time of reporting, most schools had not yet received the scores of their students for the 2014-15 school year. Therefore, in local evaluation reports, very few grantees were able to offer indications of progress in this area.
• Changes in grading systems. An increasing number of schools are moving to proficiency-based grading. This means that it is no longer a matter of comparing first quarter and fourth quarter grades to find improvement or measure change. Many grantees are not yet sure of how to interpret proficiency-based grades with respect to understanding academic improvement.
• Changes in reporting systems. As previously noted in this report, the changes in the federal data collection system have limited the data available for this evaluation.
In the Fall Survey, EDC asked 2013 Cohort grantees to report on the number of regular program participants (students attending the program for 30 days or more) who demonstrated grade improvements in math and reading over the course of the school year. Because they did not start their programs until midway through the year, 2015 Cohort grantees were not asked to report these data. The percent of regular program attendees improving their grades over the course of the year ranged from 26% to almost 31%. Table 13: Percent of regular program participants improving mathematics and reading grades (FS)5 Percent
Elem
entary Regular program participants whose mathematics grades improved from
first to fourth quarter (fall to spring) (n=5,066) 26.2%
Regular program participants whose reading grades improved from first to fourth quarter (fall to spring)(n=5,066)
30.7%
Middle/
High
Regular program participants whose mathematics grades improved from first to fourth quarter (fall to spring) (n= 4,104)
27.1%
Regular program participants whose reading grades improved from first to fourth quarter (fall to spring) (n=4,104)
29.7%
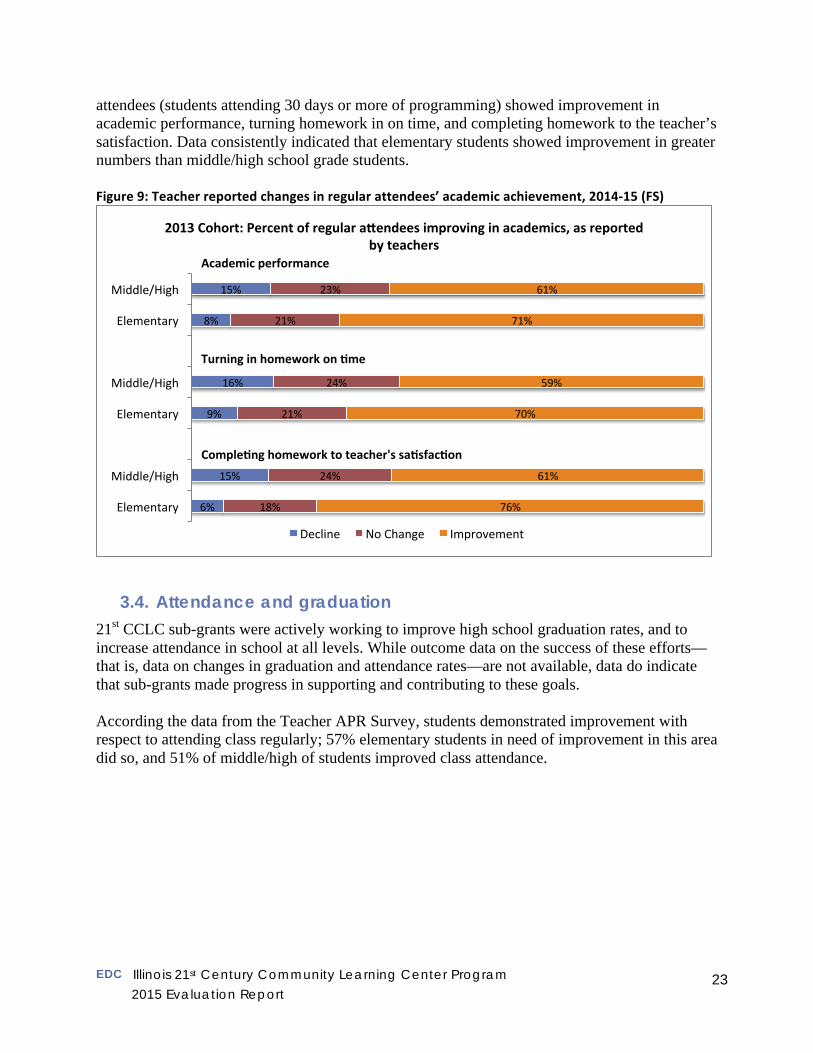
As already noted, the evaluation included data from the federal Teacher APR Survey reported by 2013 Cohort sub-grants, as they implemented a full academic year of programming for their students. According to the sub-grants, teachers indicated that a majority of regular program
5 To compensate for the lack of federal reporting system, EDC administered a Fall Survey asking for these data from 2013 Cohort sub-grants only. Not all 2013 sub-grants/sites had these data available. Percent is calculated based on the number of regular participants only for those sites that were able to provide these data. Because these data have been collected and calculated through a different system, this report does not compare them with previous years to identify trends or changes.
EDC Illinois 21st Century Community Learning Center Program
2015 Evaluation Report 23
attendees (students attending 30 days or more of programming) showed improvement in academic performance, turning homework in on time, and completing homework to the teacher’s satisfaction. Data consistently indicated that elementary students showed improvement in greater numbers than middle/high school grade students. Figure 9: Teacher reported changes in regular attendees’ academic achievement, 2014-‐15 (FS)
3.4. Attendance and graduation
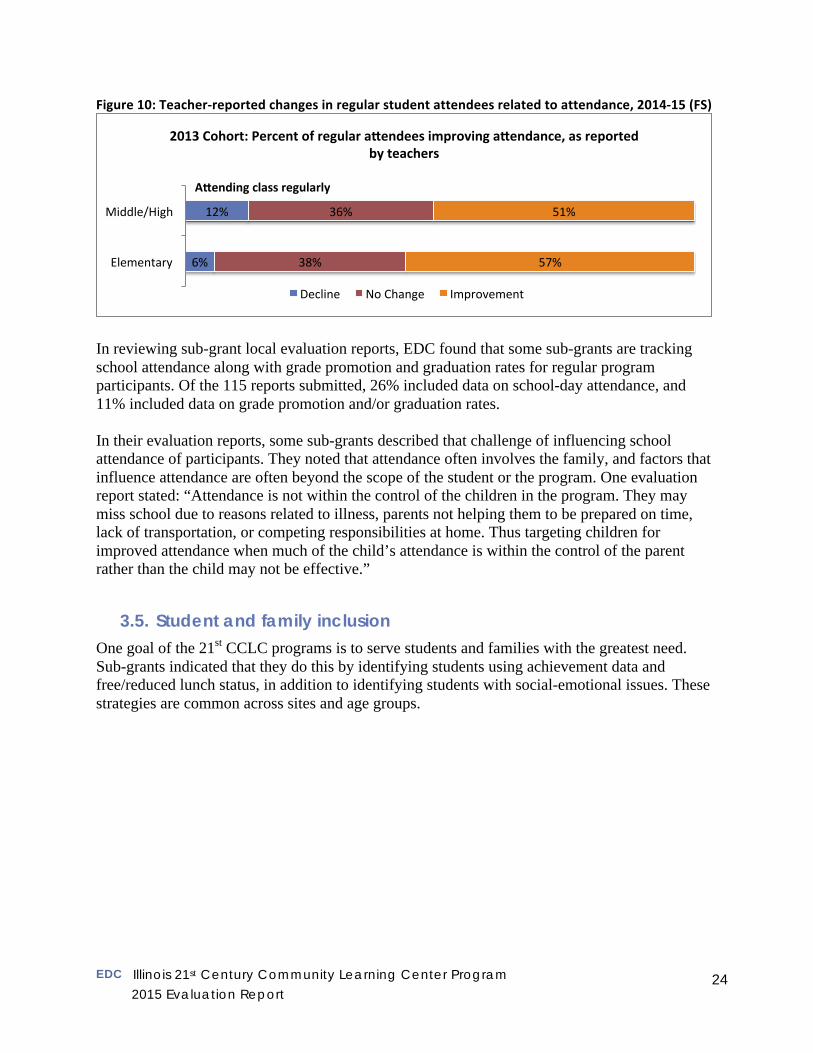
21st CCLC sub-grants were actively working to improve high school graduation rates, and to increase attendance in school at all levels. While outcome data on the success of these efforts—that is, data on changes in graduation and attendance rates—are not available, data do indicate that sub-grants made progress in supporting and contributing to these goals. According the data from the Teacher APR Survey, students demonstrated improvement with respect to attending class regularly; 57% elementary students in need of improvement in this area did so, and 51% of middle/high of students improved class attendance.
6%
15%
9%
16%
8%
15%
18%
24%
21%
24%
21%
23%
76%
61%
70%
59%
71%
61%
Elementary
Middle/High
Elementary
Middle/High
Elementary
Middle/High
2013 Cohort: Percent of regular a]endees improving in academics, as reported by teachers
Decline No Change Improvement
Academic performance
Turning in homework on Nme
CompleNng homework to teacher's saNsfacNon
EDC Illinois 21st Century Community Learning Center Program
2015 Evaluation Report 24
Figure 10: Teacher-‐reported changes in regular student attendees related to attendance, 2014-‐15 (FS)
In reviewing sub-grant local evaluation reports, EDC found that some sub-grants are tracking school attendance along with grade promotion and graduation rates for regular program participants. Of the 115 reports submitted, 26% included data on school-day attendance, and 11% included data on grade promotion and/or graduation rates. In their evaluation reports, some sub-grants described that challenge of influencing school attendance of participants. They noted that attendance often involves the family, and factors that influence attendance are often beyond the scope of the student or the program. One evaluation report stated: “Attendance is not within the control of the children in the program. They may miss school due to reasons related to illness, parents not helping them to be prepared on time, lack of transportation, or competing responsibilities at home. Thus targeting children for improved attendance when much of the child’s attendance is within the control of the parent rather than the child may not be effective.”
3.5. Student and family inclusion
One goal of the 21st CCLC programs is to serve students and families with the greatest need. Sub-grants indicated that they do this by identifying students using achievement data and free/reduced lunch status, in addition to identifying students with social-emotional issues. These strategies are common across sites and age groups.
6%
12%
38%
36%
57%
51%
Elementary
Middle/High
2013 Cohort: Percent of regular a]endees improving a]endance, as reported by teachers
Decline No Change Improvement
A]ending class regularly
EDC Illinois 21st Century Community Learning Center Program
2015 Evaluation Report 25
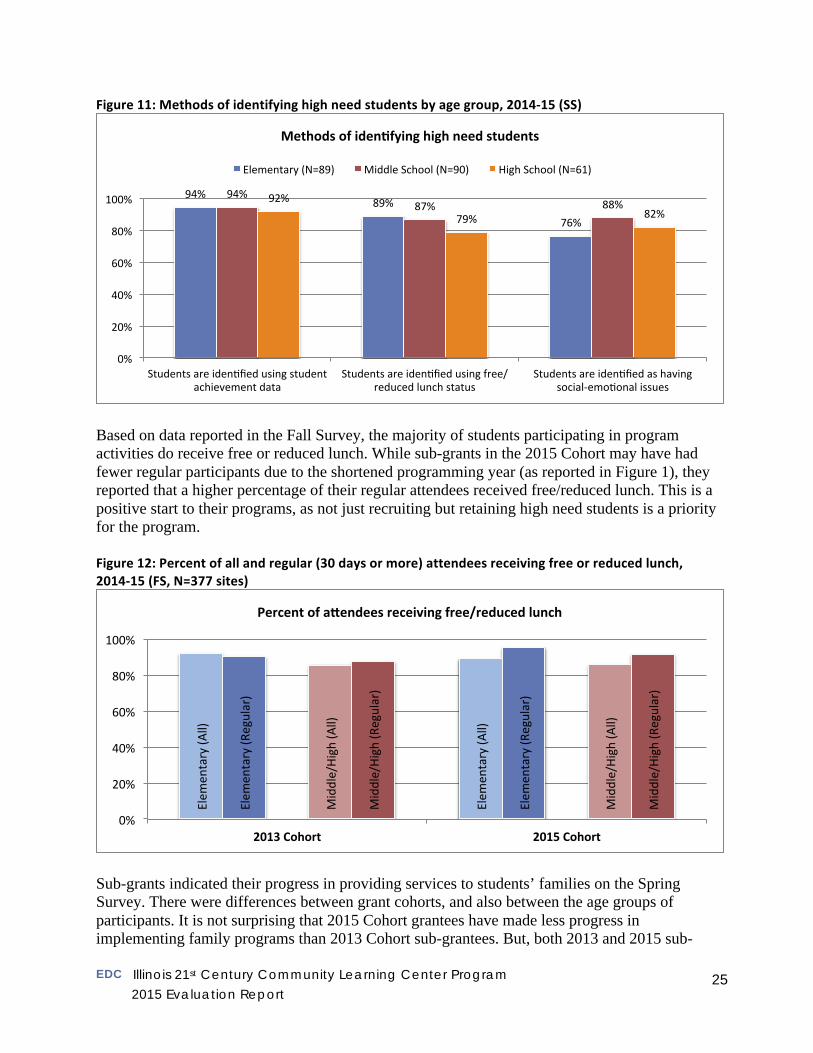
Figure 11: Methods of identifying high need students by age group, 2014-‐15 (SS)
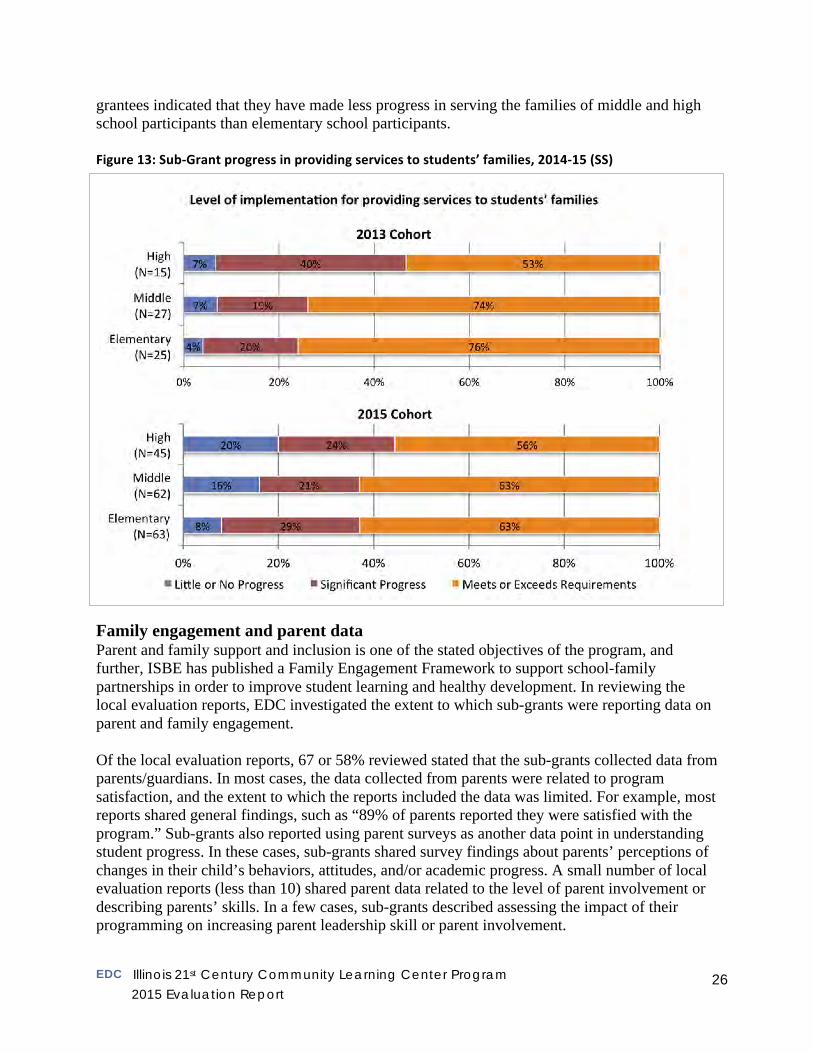
Based on data reported in the Fall Survey, the majority of students participating in program activities do receive free or reduced lunch. While sub-grants in the 2015 Cohort may have had fewer regular participants due to the shortened programming year (as reported in Figure 1), they reported that a higher percentage of their regular attendees received free/reduced lunch. This is a positive start to their programs, as not just recruiting but retaining high need students is a priority for the program. Figure 12: Percent of all and regular (30 days or more) attendees receiving free or reduced lunch, 2014-‐15 (FS, N=377 sites)
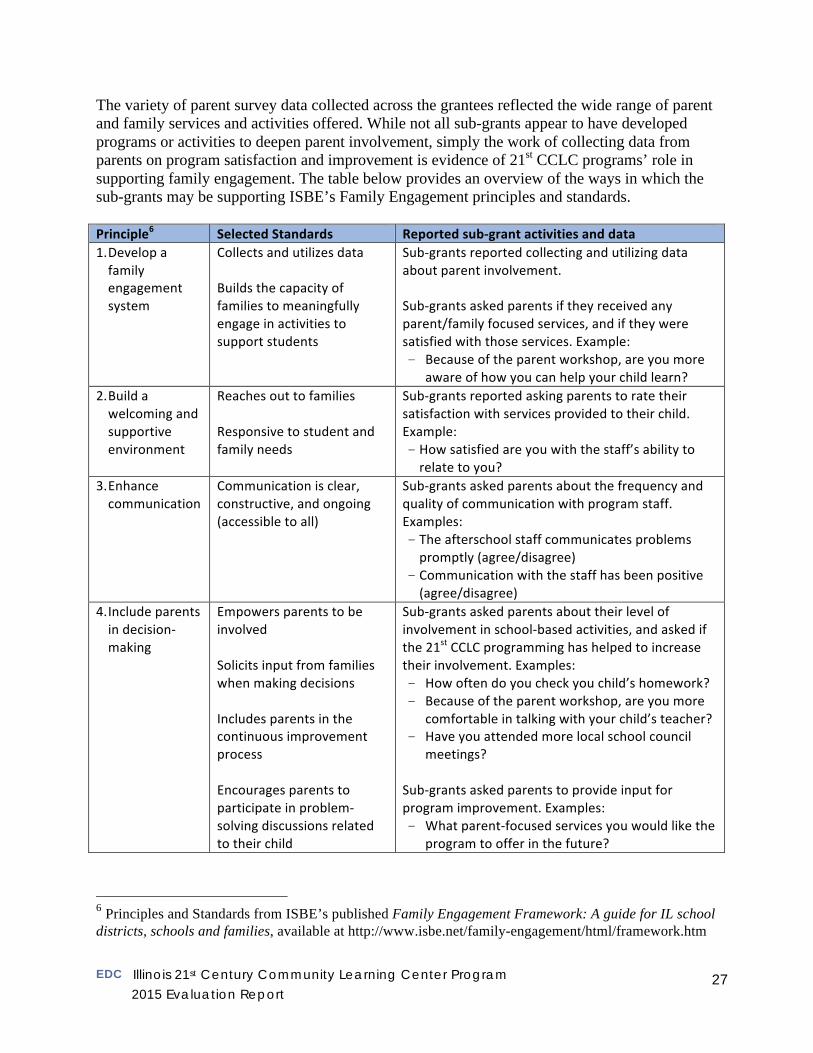
Sub-grants indicated their progress in providing services to students’ families on the Spring Survey. There were differences between grant cohorts, and also between the age groups of participants. It is not surprising that 2015 Cohort grantees have made less progress in implementing family programs than 2013 Cohort sub-grantees. But, both 2013 and 2015 sub-
94% 89%
76%
94% 87% 88% 92%
79% 82%
0%
20%
40%
60%
80%
100%
Students are idenWfied using student achievement data
Students are idenWfied using free/reduced lunch status
Students are idenWfied as having social-‐emoWonal issues
Methods of idenNfying high need students
Elementary (N=89) Middle School (N=90) High School (N=61)
Elem
entary (A
ll)
Elem
entary (A
ll)
Elem
entary (R
egular)
Elem
entary (R
egular)
Middle/High (A
ll)
Middle/High (A
ll)
Middle/High (R
egular)
Middle/High (R
egular)
0%
20%
40%
60%
80%
100%
2013 Cohort 2015 Cohort
Percent of a]endees receiving free/reduced lunch
EDC Illinois 21st Century Community Learning Center Program
2015 Evaluation Report 26
grantees indicated that they have made less progress in serving the families of middle and high school participants than elementary school participants. Figure 13: Sub-‐Grant progress in providing services to students’ families, 2014-‐15 (SS)
Family engagement and parent data Parent and family support and inclusion is one of the stated objectives of the program, and further, ISBE has published a Family Engagement Framework to support school-family partnerships in order to improve student learning and healthy development. In reviewing the local evaluation reports, EDC investigated the extent to which sub-grants were reporting data on parent and family engagement. Of the local evaluation reports, 67 or 58% reviewed stated that the sub-grants collected data from parents/guardians. In most cases, the data collected from parents were related to program satisfaction, and the extent to which the reports included the data was limited. For example, most reports shared general findings, such as “89% of parents reported they were satisfied with the program.” Sub-grants also reported using parent surveys as another data point in understanding student progress. In these cases, sub-grants shared survey findings about parents’ perceptions of changes in their child’s behaviors, attitudes, and/or academic progress. A small number of local evaluation reports (less than 10) shared parent data related to the level of parent involvement or describing parents’ skills. In a few cases, sub-grants described assessing the impact of their programming on increasing parent leadership skill or parent involvement.
EDC Illinois 21st Century Community Learning Center Program
2015 Evaluation Report 27
The variety of parent survey data collected across the grantees reflected the wide range of parent and family services and activities offered. While not all sub-grants appear to have developed programs or activities to deepen parent involvement, simply the work of collecting data from parents on program satisfaction and improvement is evidence of 21st CCLC programs’ role in supporting family engagement. The table below provides an overview of the ways in which the sub-grants may be supporting ISBE’s Family Engagement principles and standards. Principle6 Selected Standards Reported sub-‐grant activities and data 1. Develop a family engagement system
Collects and utilizes data Builds the capacity of families to meaningfully engage in activities to support students
Sub-‐grants reported collecting and utilizing data about parent involvement. Sub-‐grants asked parents if they received any parent/family focused services, and if they were satisfied with those services. Example: - Because of the parent workshop, are you more
aware of how you can help your child learn? 2. Build a welcoming and supportive environment
Reaches out to families Responsive to student and family needs
Sub-‐grants reported asking parents to rate their satisfaction with services provided to their child. Example: - How satisfied are you with the staff’s ability to relate to you?
3. Enhance communication
Communication is clear, constructive, and ongoing (accessible to all)
Sub-‐grants asked parents about the frequency and quality of communication with program staff. Examples: - The afterschool staff communicates problems promptly (agree/disagree)
- Communication with the staff has been positive (agree/disagree)
4. Include parents in decision-‐making
Empowers parents to be involved Solicits input from families when making decisions Includes parents in the continuous improvement process Encourages parents to participate in problem-‐solving discussions related to their child
Sub-‐grants asked parents about their level of involvement in school-‐based activities, and asked if the 21st CCLC programming has helped to increase their involvement. Examples: - How often do you check you child’s homework? - Because of the parent workshop, are you more
comfortable in talking with your child’s teacher? - Have you attended more local school council
meetings? Sub-‐grants asked parents to provide input for program improvement. Examples: - What parent-‐focused services you would like the
program to offer in the future?
6 Principles and Standards from ISBE’s published Family Engagement Framework: A guide for IL school districts, schools and families, available at http://www.isbe.net/family-engagement/html/framework.htm
EDC Illinois 21st Century Community Learning Center Program
2015 Evaluation Report 28
4. Organizational Capacity
4.1. Professional development and training
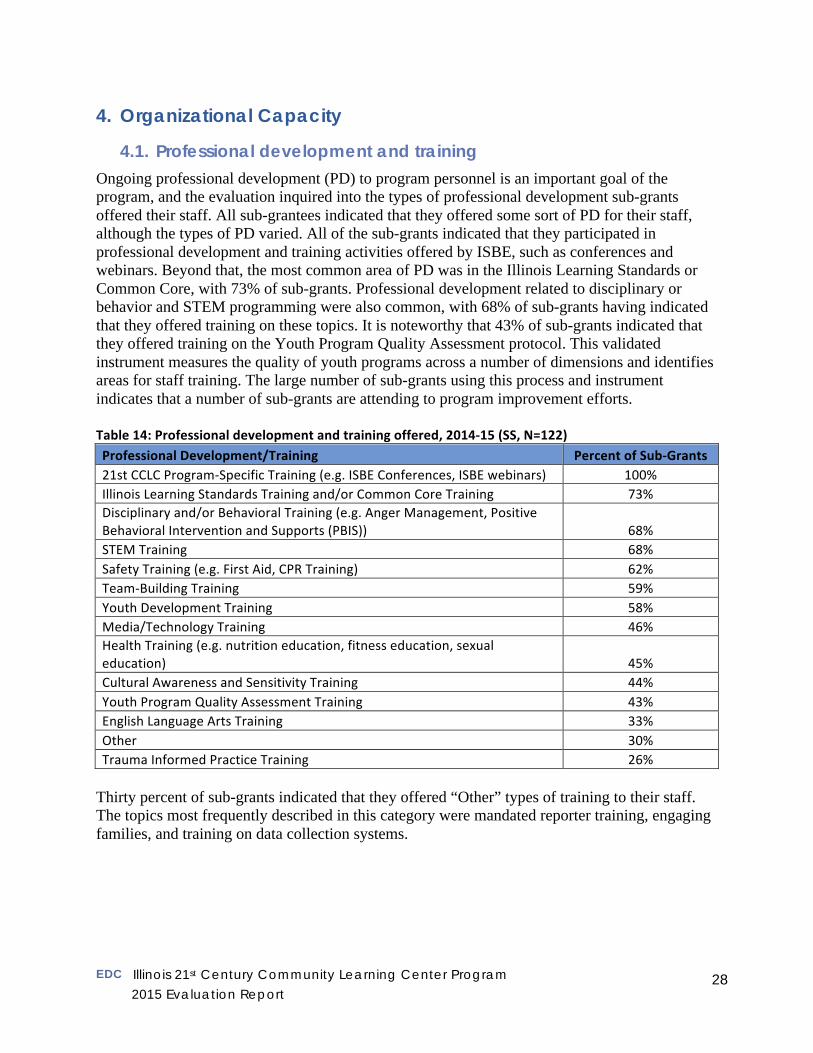
Ongoing professional development (PD) to program personnel is an important goal of the program, and the evaluation inquired into the types of professional development sub-grants offered their staff. All sub-grantees indicated that they offered some sort of PD for their staff, although the types of PD varied. All of the sub-grants indicated that they participated in professional development and training activities offered by ISBE, such as conferences and webinars. Beyond that, the most common area of PD was in the Illinois Learning Standards or Common Core, with 73% of sub-grants. Professional development related to disciplinary or behavior and STEM programming were also common, with 68% of sub-grants having indicated that they offered training on these topics. It is noteworthy that 43% of sub-grants indicated that they offered training on the Youth Program Quality Assessment protocol. This validated instrument measures the quality of youth programs across a number of dimensions and identifies areas for staff training. The large number of sub-grants using this process and instrument indicates that a number of sub-grants are attending to program improvement efforts. Table 14: Professional development and training offered, 2014-‐15 (SS, N=122) Professional Development/Training Percent of Sub-‐Grants 21st CCLC Program-‐Specific Training (e.g. ISBE Conferences, ISBE webinars) 100% Illinois Learning Standards Training and/or Common Core Training 73% Disciplinary and/or Behavioral Training (e.g. Anger Management, Positive Behavioral Intervention and Supports (PBIS)) 68% STEM Training 68% Safety Training (e.g. First Aid, CPR Training) 62% Team-‐Building Training 59% Youth Development Training 58% Media/Technology Training 46% Health Training (e.g. nutrition education, fitness education, sexual education) 45% Cultural Awareness and Sensitivity Training 44% Youth Program Quality Assessment Training 43% English Language Arts Training 33% Other 30% Trauma Informed Practice Training 26%
Thirty percent of sub-grants indicated that they offered “Other” types of training to their staff. The topics most frequently described in this category were mandated reporter training, engaging families, and training on data collection systems.
EDC Illinois 21st Century Community Learning Center Program
2015 Evaluation Report 29
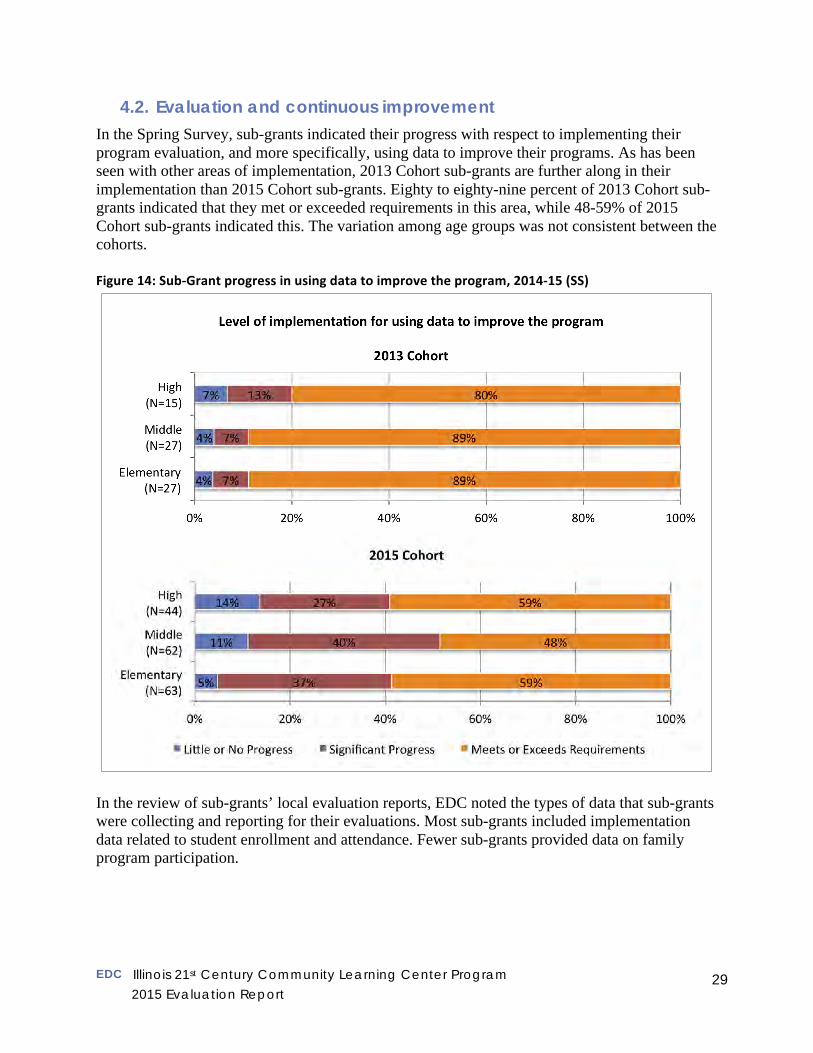
4.2. Evaluation and continuous improvement
In the Spring Survey, sub-grants indicated their progress with respect to implementing their program evaluation, and more specifically, using data to improve their programs. As has been seen with other areas of implementation, 2013 Cohort sub-grants are further along in their implementation than 2015 Cohort sub-grants. Eighty to eighty-nine percent of 2013 Cohort sub-grants indicated that they met or exceeded requirements in this area, while 48-59% of 2015 Cohort sub-grants indicated this. The variation among age groups was not consistent between the cohorts. Figure 14: Sub-‐Grant progress in using data to improve the program, 2014-‐15 (SS)
In the review of sub-grants’ local evaluation reports, EDC noted the types of data that sub-grants were collecting and reporting for their evaluations. Most sub-grants included implementation data related to student enrollment and attendance. Fewer sub-grants provided data on family program participation.
EDC Illinois 21st Century Community Learning Center Program
2015 Evaluation Report 30
Table 15: Types of implementation data reported (N=115)
Implementation data Sub-‐grants including this in report
Number Percent Recruitment, enrollment, and attendance 107 93% Student demographics 107 93% Family participation 70 61% Staff information and training 89 78%
Review of the reports found that, despite the lack of federal reporting system, the federal Teacher APR survey was the most frequently utilized source of outcome data; 87% of reports included findings based on these data. Seventy-one percent of reports included data on changes in participants’ grades and/or test scores. Other data collected included youth, parent, and staff surveys, as well as data on school attendance, disciplinary rates, grade promotion rates, and graduation rates. Table 16: Types of outcome data reported (N=115)
Outcome data Sub-‐grants including this in report
Number Percent Teacher APR survey 100 87% Student grades and/or test scores 82 71% Youth participant survey 75 65% Parent survey 67 58% School attendance rates 30 26% Program staff survey 17 15% Disciplinary rates 14 12% Grade promotion and/or graduation rates 13 11%
4.3. Funding and sustainability
Sustainability is an ongoing challenge for sub-grants and organizations. On the Spring Survey, sub-grants responded to multiple items that asked about the sustainability of their programs. With less than 6 months of program activity at the time of reporting, it is understandable that Cohort 2015 sub-grants were not as far along as Cohort sub-grants in this area. But, 2015 Cohort grants were not as far behind as one might expect. This may be due to the fact that many of these organizations were part of previous sub-grant cohorts and so had been working on these issues under previous funding cycles. Three percent of 2013 sub-grants indicated that “none” of their program components were sustainable, while 6% of 2015 sub-grants indicated this. However, 23% of 2015 sub-grants reported that “most” or “all” of their program components are sustainable, and 19% of 2013 sub-grants reported so.
EDC Illinois 21st Century Community Learning Center Program
2015 Evaluation Report 31
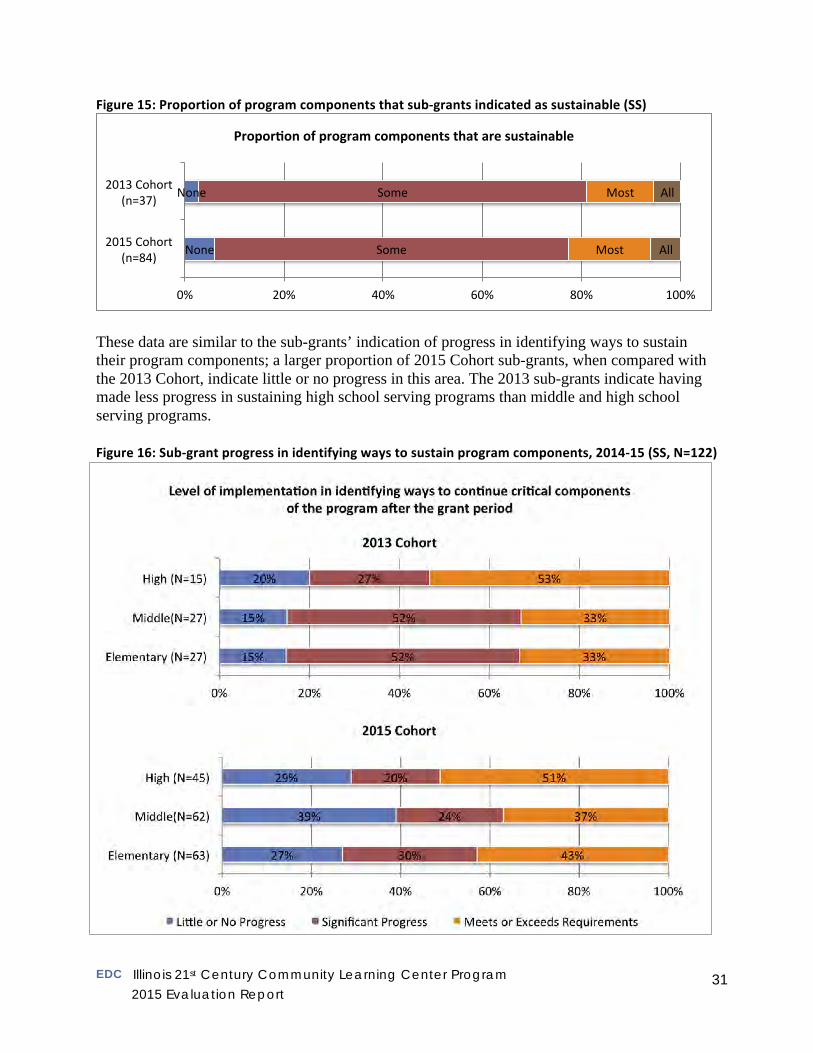
Figure 15: Proportion of program components that sub-‐grants indicated as sustainable (SS)
These data are similar to the sub-grants’ indication of progress in identifying ways to sustain their program components; a larger proportion of 2015 Cohort sub-grants, when compared with the 2013 Cohort, indicate little or no progress in this area. The 2013 sub-grants indicate having made less progress in sustaining high school serving programs than middle and high school serving programs. Figure 16: Sub-‐grant progress in identifying ways to sustain program components, 2014-‐15 (SS, N=122)
None
None
Some
Some
Most
Most
All
All
0% 20% 40% 60% 80% 100%
2015 Cohort (n=84)
2013 Cohort (n=37)
ProporNon of program components that are sustainable
EDC Illinois 21st Century Community Learning Center Program
2015 Evaluation Report 32
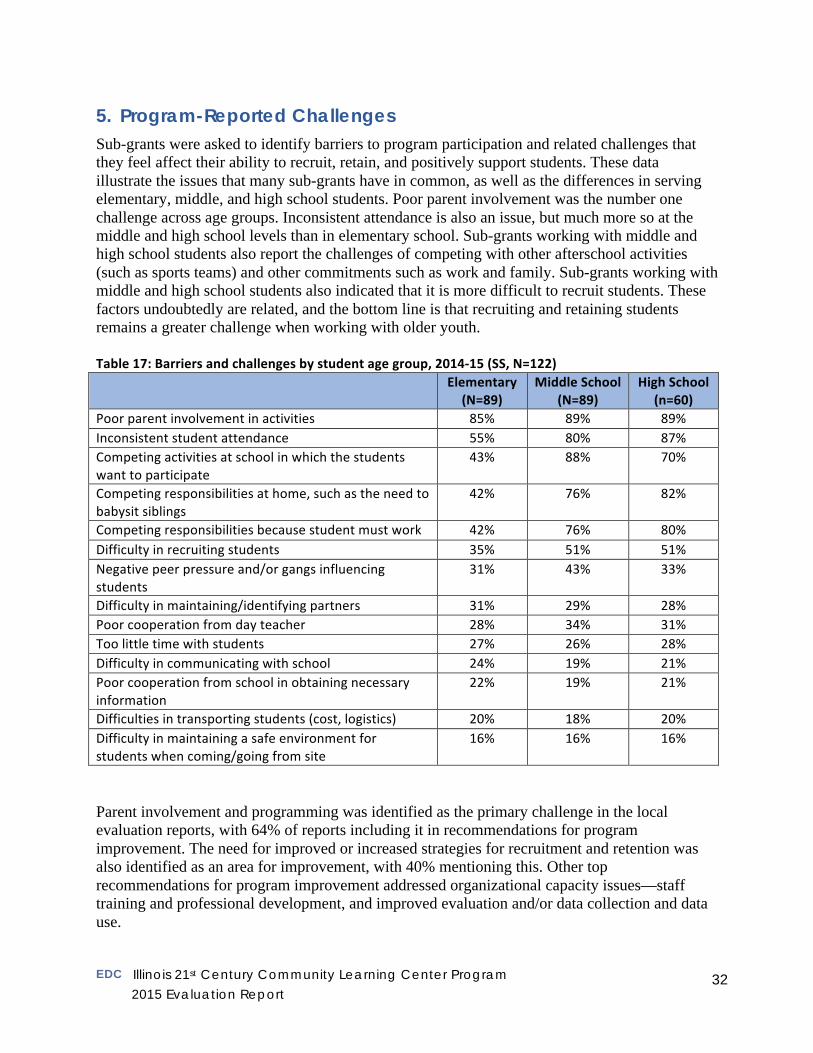
5. Program-Reported Challenges Sub-grants were asked to identify barriers to program participation and related challenges that they feel affect their ability to recruit, retain, and positively support students. These data illustrate the issues that many sub-grants have in common, as well as the differences in serving elementary, middle, and high school students. Poor parent involvement was the number one challenge across age groups. Inconsistent attendance is also an issue, but much more so at the middle and high school levels than in elementary school. Sub-grants working with middle and high school students also report the challenges of competing with other afterschool activities (such as sports teams) and other commitments such as work and family. Sub-grants working with middle and high school students also indicated that it is more difficult to recruit students. These factors undoubtedly are related, and the bottom line is that recruiting and retaining students remains a greater challenge when working with older youth. Table 17: Barriers and challenges by student age group, 2014-‐15 (SS, N=122) Elementary
(N=89) Middle School
(N=89) High School
(n=60) Poor parent involvement in activities 85% 89% 89% Inconsistent student attendance 55% 80% 87% Competing activities at school in which the students want to participate
43% 88% 70%
Competing responsibilities at home, such as the need to babysit siblings
42% 76% 82%
Competing responsibilities because student must work 42% 76% 80% Difficulty in recruiting students 35% 51% 51% Negative peer pressure and/or gangs influencing students
31% 43% 33%
Difficulty in maintaining/identifying partners 31% 29% 28% Poor cooperation from day teacher 28% 34% 31% Too little time with students 27% 26% 28% Difficulty in communicating with school 24% 19% 21% Poor cooperation from school in obtaining necessary information
22% 19% 21%
Difficulties in transporting students (cost, logistics) 20% 18% 20% Difficulty in maintaining a safe environment for students when coming/going from site
16% 16% 16%
Parent involvement and programming was identified as the primary challenge in the local evaluation reports, with 64% of reports including it in recommendations for program improvement. The need for improved or increased strategies for recruitment and retention was also identified as an area for improvement, with 40% mentioning this. Other top recommendations for program improvement addressed organizational capacity issues—staff training and professional development, and improved evaluation and/or data collection and data use.
EDC Illinois 21st Century Community Learning Center Program
2015 Evaluation Report 33
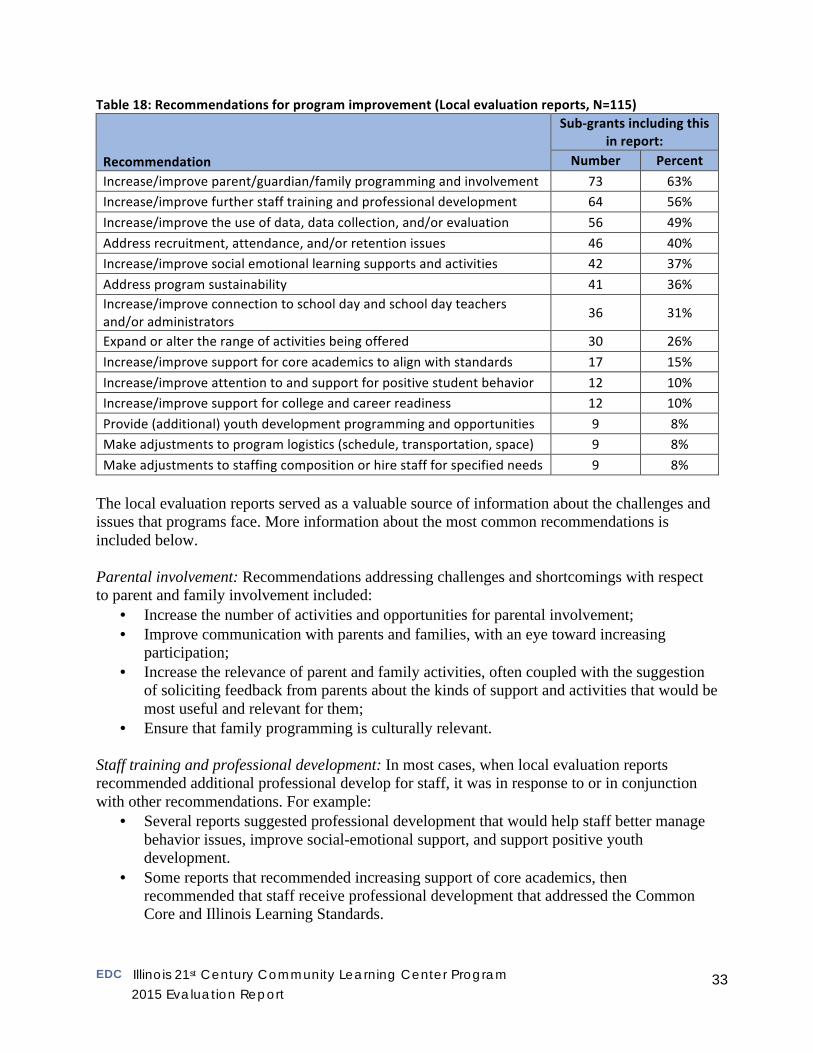
Table 18: Recommendations for program improvement (Local evaluation reports, N=115)
Recommendation
Sub-‐grants including this in report:
Number Percent Increase/improve parent/guardian/family programming and involvement 73 63% Increase/improve further staff training and professional development 64 56% Increase/improve the use of data, data collection, and/or evaluation 56 49% Address recruitment, attendance, and/or retention issues 46 40% Increase/improve social emotional learning supports and activities 42 37% Address program sustainability 41 36% Increase/improve connection to school day and school day teachers and/or administrators 36 31%
Expand or alter the range of activities being offered 30 26% Increase/improve support for core academics to align with standards 17 15% Increase/improve attention to and support for positive student behavior 12 10% Increase/improve support for college and career readiness 12 10% Provide (additional) youth development programming and opportunities 9 8% Make adjustments to program logistics (schedule, transportation, space) 9 8% Make adjustments to staffing composition or hire staff for specified needs 9 8%
The local evaluation reports served as a valuable source of information about the challenges and issues that programs face. More information about the most common recommendations is included below. Parental involvement: Recommendations addressing challenges and shortcomings with respect to parent and family involvement included:
• Increase the number of activities and opportunities for parental involvement; • Improve communication with parents and families, with an eye toward increasing
participation; • Increase the relevance of parent and family activities, often coupled with the suggestion
of soliciting feedback from parents about the kinds of support and activities that would be most useful and relevant for them;
• Ensure that family programming is culturally relevant. Staff training and professional development: In most cases, when local evaluation reports recommended additional professional develop for staff, it was in response to or in conjunction with other recommendations. For example:
• Several reports suggested professional development that would help staff better manage behavior issues, improve social-emotional support, and support positive youth development.
• Some reports that recommended increasing support of core academics, then recommended that staff receive professional development that addressed the Common Core and Illinois Learning Standards.
EDC Illinois 21st Century Community Learning Center Program
2015 Evaluation Report 34
• Many reports that identified the need for improved data collection, use, and evaluation also stated that staff should receive professional development on collecting and using data.
Data use, data collection, and evaluation: Many evaluation reports cited the need to improve the evaluation and/or improve the data collected and used by programs. In general, developing and using data in a systematic way persists as a challenge across the sub-grants. Specific recommendations included:
• Identify and address challenges to collecting data, including implementation data such as family participation, student outcome and achievement data, and surveys from parents and students;
• Review student data with staff at more regular intervals to monitor student progress and tailor student support;
• Collect baseline data about students to better understand student progress, and identify additional data sources to understand student progress beyond test scores.
Recruitment, attendance and retention: Many evaluation reports indicated in their recommendations that programs need to address issues with respect to recruitment, attendance, and retention. Specific suggestions included:
• Develop recruitment strategies, and focus recruitment on students with the greatest needs; • Work with staff, parents, and students to identify barriers to attendance as well as
incentives to increase attendance; • Solicit input from students on what activities might attract more students and increase
attendance. Social emotional learning: Many reports noted the need for enhanced or increased efforts to improve the social emotional learning of program participants, but few offered specific or concrete recommendations for program improvement. In many cases, this recommendation overlapped with recommendations for supporting more positive student behavior. Recommendations mostly noted general needs:
• Improve capacity to help students develop social emotional competencies; • Expand topics addressed in social emotional learning; • Provide additional activities and services to enhance social emotional learning, such as
groups and counseling services. Sustainability: Many local evaluations recommended that sub-grants engage in activities in support of program sustainability. Recommendations that addressed the issue of sustainability included:
• Develop or increase partnerships with community organizations within and around the school;
• Convene sustainability committee and/or develop a sustainability plan; • Modify programming to better align with long-term goals, needs, and funding streams.
Connection to school day and school day teachers: Many local evaluations recommended that sites develop or improve communication methods and strategies to help program staff and school
EDC Illinois 21st Century Community Learning Center Program
2015 Evaluation Report 35
day teachers and staff share information and update one another about progress and issues with specific students. Recommendations included:
• Improve overall communication about school day content and curriculum to help afterschool activities reinforce academic learning;
• Increase regular communication with school day teachers about individual student behavior issues or areas of need.
EDC Illinois 21st Century Community Learning Center Program
2015 Evaluation Report 36
6. Conclusion This report has provided data about ISBE’s 21st CCLC sub-grantees’ programs during the 2014-15 year, with information about program implementation, participant outcomes, organizational capacity, and challenges and recommendations. 21st CCLC programs provided access and opportunities to participate in a wide variety of programming and activities, including support for academic achievement, involvement in the arts and STEM, and enrichment and extra-curricular activities such as field trips, sports, and service learning. Achievement data indicate that some students who participated in programs increased their grades in math and reading/language arts. Similarly, the teachers of many of the student participants indicated they perceived improvements in classroom behavior, such as classroom participation, completing homework on time, and getting along with others. Sub-grantees worked toward being inclusive of families, and took steps to identify and enroll students who demonstrated the greatest needs as indicated by academic needs, free/reduced lunch status, and behavioral issues. Sub-grantee organizations made professional development and training opportunities available to their staff, engaged in program evaluation and continuous improvement efforts, and made progress addressing program sustainability. These data also offer directions for future technical assistance and program support. This evaluation identifies many of the same issues and challenges that have been noted in previous evaluations.
• Parent involvement remains a primary challenge for sub-grants. Sub-grants report having made less progress in implementing services for families. Parent involvement is the number one area in need of attention according to their local evaluations. Sub-grants describe the challenge of overcoming obstacles such as language, transportation, and time when trying to get parents to attend events and programming. The evaluation’s preliminary investigation into the ways that sub-grant parent activities and data align with ISBE’s Family Engagement Framework may also offer guidance into the ways that sub-grants could further support parent involvement. For example, sub-grants may want to move beyond asking parents for their level of satisfaction with programming, and work towards activities and efforts that build parents’ skills and capacity to be involved.
• Notable differences between elementary, middle, and high school students remain, particularly with respect to outcomes. In particular, there are challenges in realizing outcomes for middle/high school students with respect to academic achievement and behavior, according to the Teacher APR Survey data. To a certain extent, this may be a problem with the instrument. In their evaluation reports, some sub-grants expressed concern with identifying high school teachers who could adequately assess a student’s progress across a variety of classes. Even so, ISBE and sub-grants may want to continue to identify the particular strategies and activities that are more successful with older students.
• Data collection is a major challenge at the sub-grant and state level, and directly affects the ability of the statewide evaluation to understand program implementation and outcomes. This year, there were improvements in data quantity and consistency. EDC achieved near perfect response rates on the Spring and Fall Surveys, and received local
EDC Illinois 21st Century Community Learning Center Program
2015 Evaluation Report 37
evaluation reports from nearly every grantee, with the majority of those reports following a common report template. But, sub-grants reported major challenges in collecting their own data. Changes in the federal reporting system were compounded by changes in standardized testing, and sub-grants had little data to offer with respect to academic achievement. Sub-grants are also challenged when it comes to accessing other school-related data, such as attendance and graduation rates. ISBE should continue to work with sub-grants on identifying valid and reliable instruments and data sources that can further understanding of the program.
There is little doubt that across the state, sub-grants are implementing a variety of innovative programs and activities, employing dedicated staff who work to provide positive, supportive environments for learning and growth. Continued targeted technical assistance, capacity building and improved program infrastructure can further the work of these organizations, and the state, in service to Illinois youth.
EDC Illinois 21st Century Community Learning Center Program
2015 Evaluation Report 38
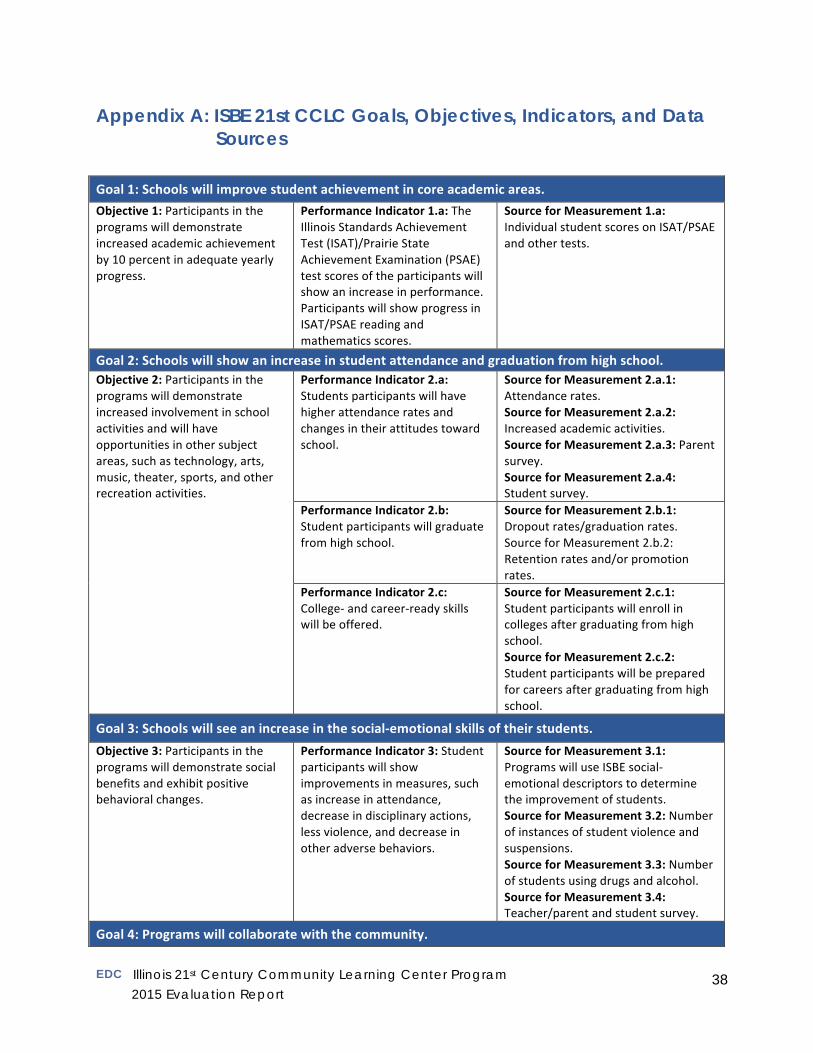
Appendix A: ISBE 21st CCLC Goals, Objectives, Indicators, and Data Sources
Goal 1: Schools will improve student achievement in core academic areas. Objective 1: Participants in the programs will demonstrate increased academic achievement by 10 percent in adequate yearly progress.
Performance Indicator 1.a: The Illinois Standards Achievement Test (ISAT)/Prairie State Achievement Examination (PSAE) test scores of the participants will show an increase in performance. Participants will show progress in ISAT/PSAE reading and mathematics scores.
Source for Measurement 1.a: Individual student scores on ISAT/PSAE and other tests.
Goal 2: Schools will show an increase in student attendance and graduation from high school. Objective 2: Participants in the programs will demonstrate increased involvement in school activities and will have opportunities in other subject areas, such as technology, arts, music, theater, sports, and other recreation activities.
Performance Indicator 2.a: Students participants will have higher attendance rates and changes in their attitudes toward school.
Source for Measurement 2.a.1: Attendance rates. Source for Measurement 2.a.2: Increased academic activities. Source for Measurement 2.a.3: Parent survey. Source for Measurement 2.a.4: Student survey.
Performance Indicator 2.b: Student participants will graduate from high school.
Source for Measurement 2.b.1: Dropout rates/graduation rates. Source for Measurement 2.b.2: Retention rates and/or promotion rates.
Performance Indicator 2.c: College-‐ and career-‐ready skills will be offered.
Source for Measurement 2.c.1: Student participants will enroll in colleges after graduating from high school. Source for Measurement 2.c.2: Student participants will be prepared for careers after graduating from high school.
Goal 3: Schools will see an increase in the social-‐emotional skills of their students. Objective 3: Participants in the programs will demonstrate social benefits and exhibit positive behavioral changes.
Performance Indicator 3: Student participants will show improvements in measures, such as increase in attendance, decrease in disciplinary actions, less violence, and decrease in other adverse behaviors.
Source for Measurement 3.1: Programs will use ISBE social-‐emotional descriptors to determine the improvement of students. Source for Measurement 3.2: Number of instances of student violence and suspensions. Source for Measurement 3.3: Number of students using drugs and alcohol. Source for Measurement 3.4: Teacher/parent and student survey.
Goal 4: Programs will collaborate with the community.
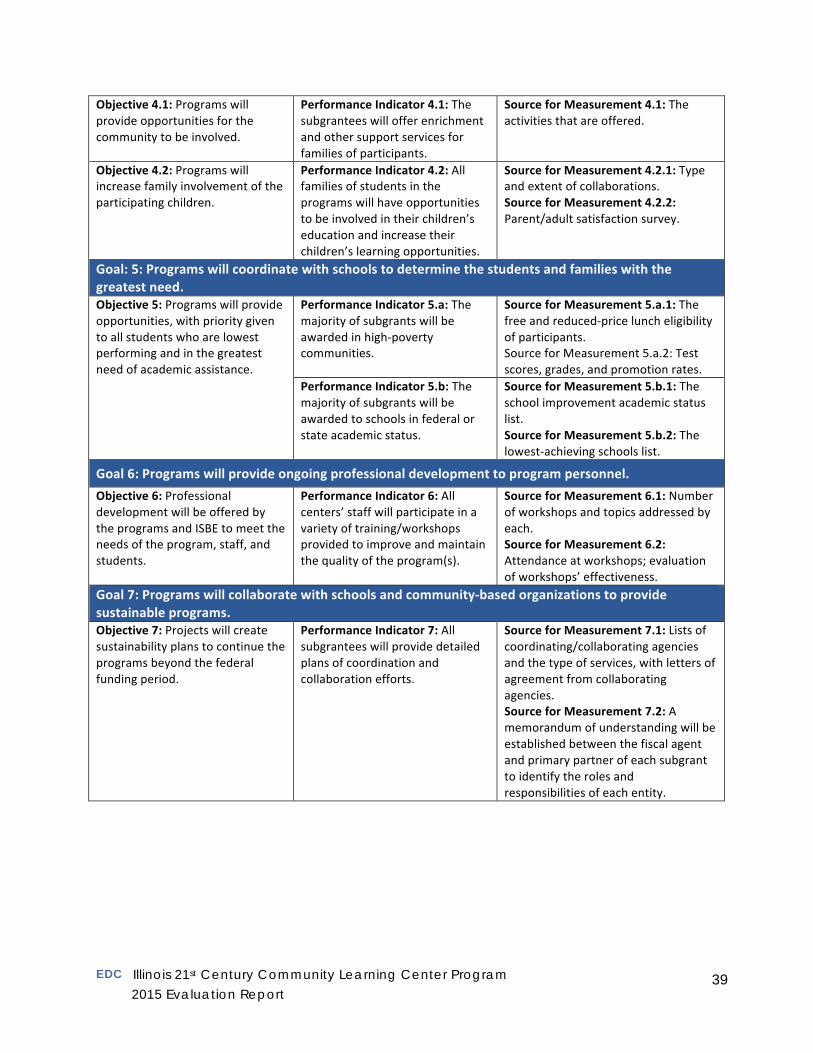
EDC Illinois 21st Century Community Learning Center Program
2015 Evaluation Report 39
Objective 4.1: Programs will provide opportunities for the community to be involved.
Performance Indicator 4.1: The subgrantees will offer enrichment and other support services for families of participants.
Source for Measurement 4.1: The activities that are offered.
Objective 4.2: Programs will increase family involvement of the participating children.
Performance Indicator 4.2: All families of students in the programs will have opportunities to be involved in their children’s education and increase their children’s learning opportunities.
Source for Measurement 4.2.1: Type and extent of collaborations. Source for Measurement 4.2.2: Parent/adult satisfaction survey.
Goal: 5: Programs will coordinate with schools to determine the students and families with the greatest need. Objective 5: Programs will provide opportunities, with priority given to all students who are lowest performing and in the greatest need of academic assistance.
Performance Indicator 5.a: The majority of subgrants will be awarded in high-‐poverty communities.
Source for Measurement 5.a.1: The free and reduced-‐price lunch eligibility of participants. Source for Measurement 5.a.2: Test scores, grades, and promotion rates.
Performance Indicator 5.b: The majority of subgrants will be awarded to schools in federal or state academic status.
Source for Measurement 5.b.1: The school improvement academic status list. Source for Measurement 5.b.2: The lowest-‐achieving schools list.
Goal 6: Programs will provide ongoing professional development to program personnel. Objective 6: Professional development will be offered by the programs and ISBE to meet the needs of the program, staff, and students.
Performance Indicator 6: All centers’ staff will participate in a variety of training/workshops provided to improve and maintain the quality of the program(s).
Source for Measurement 6.1: Number of workshops and topics addressed by each. Source for Measurement 6.2: Attendance at workshops; evaluation of workshops’ effectiveness.
Goal 7: Programs will collaborate with schools and community-‐based organizations to provide sustainable programs. Objective 7: Projects will create sustainability plans to continue the programs beyond the federal funding period.
Performance Indicator 7: All subgrantees will provide detailed plans of coordination and collaboration efforts.
Source for Measurement 7.1: Lists of coordinating/collaborating agencies and the type of services, with letters of agreement from collaborating agencies. Source for Measurement 7.2: A memorandum of understanding will be established between the fiscal agent and primary partner of each subgrant to identify the roles and responsibilities of each entity.
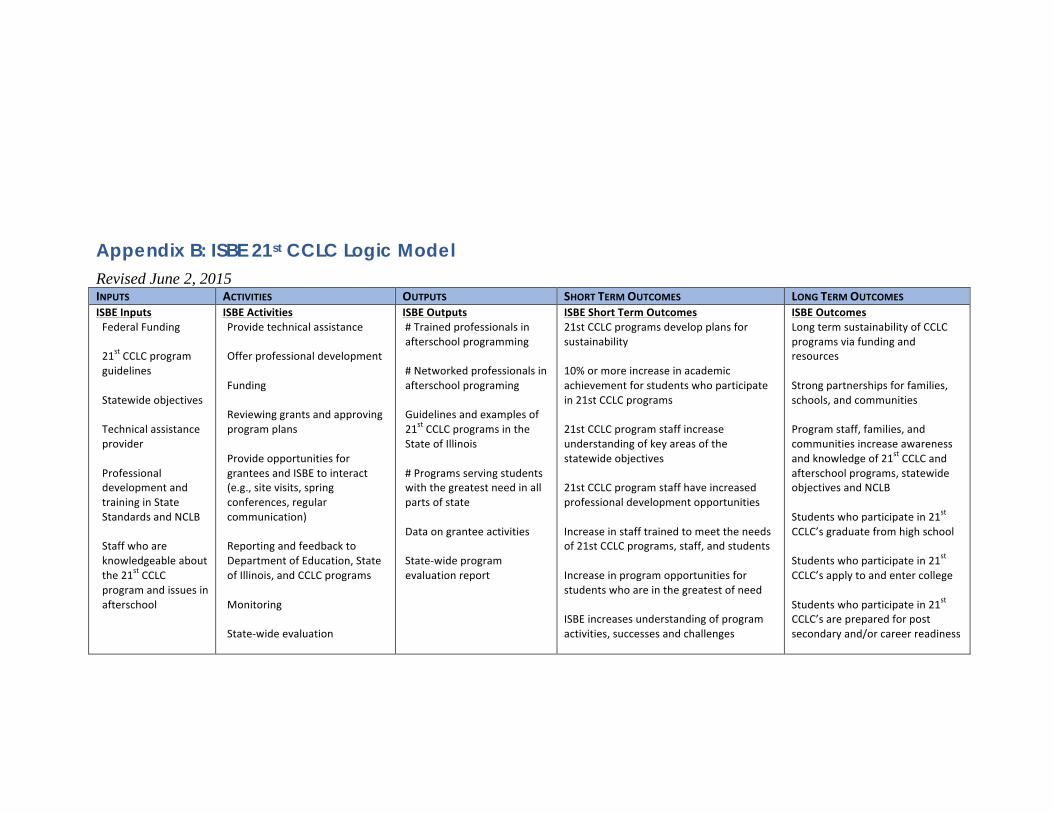
EDC Illinois 21st Century Community Learning Center Program
2015 Evaluation Report 40
Appendix B: ISBE 21st CCLC Logic Model Revised June 2, 2015 INPUTS ACTIVITIES OUTPUTS SHORT TERM OUTCOMES LONG TERM OUTCOMES ISBE Inputs Federal Funding 21st CCLC program guidelines Statewide objectives Technical assistance provider Professional development and training in State Standards and NCLB Staff who are knowledgeable about the 21st CCLC program and issues in afterschool
ISBE Activities Provide technical assistance Offer professional development Funding Reviewing grants and approving program plans Provide opportunities for grantees and ISBE to interact (e.g., site visits, spring conferences, regular communication) Reporting and feedback to Department of Education, State of Illinois, and CCLC programs Monitoring State-‐wide evaluation
ISBE Outputs # Trained professionals in afterschool programming # Networked professionals in afterschool programing Guidelines and examples of 21st CCLC programs in the State of Illinois # Programs serving students with the greatest need in all parts of state Data on grantee activities State-‐wide program evaluation report
ISBE Short Term Outcomes 21st CCLC programs develop plans for sustainability 10% or more increase in academic achievement for students who participate in 21st CCLC programs 21st CCLC program staff increase understanding of key areas of the statewide objectives 21st CCLC program staff have increased professional development opportunities Increase in staff trained to meet the needs of 21st CCLC programs, staff, and students Increase in program opportunities for students who are in the greatest of need ISBE increases understanding of program activities, successes and challenges
ISBE Outcomes Long term sustainability of CCLC programs via funding and resources Strong partnerships for families, schools, and communities Program staff, families, and communities increase awareness and knowledge of 21st CCLC and afterschool programs, statewide objectives and NCLB Students who participate in 21st CCLC’s graduate from high school Students who participate in 21st CCLC’s apply to and enter college Students who participate in 21st CCLC’s are prepared for post secondary and/or career readiness
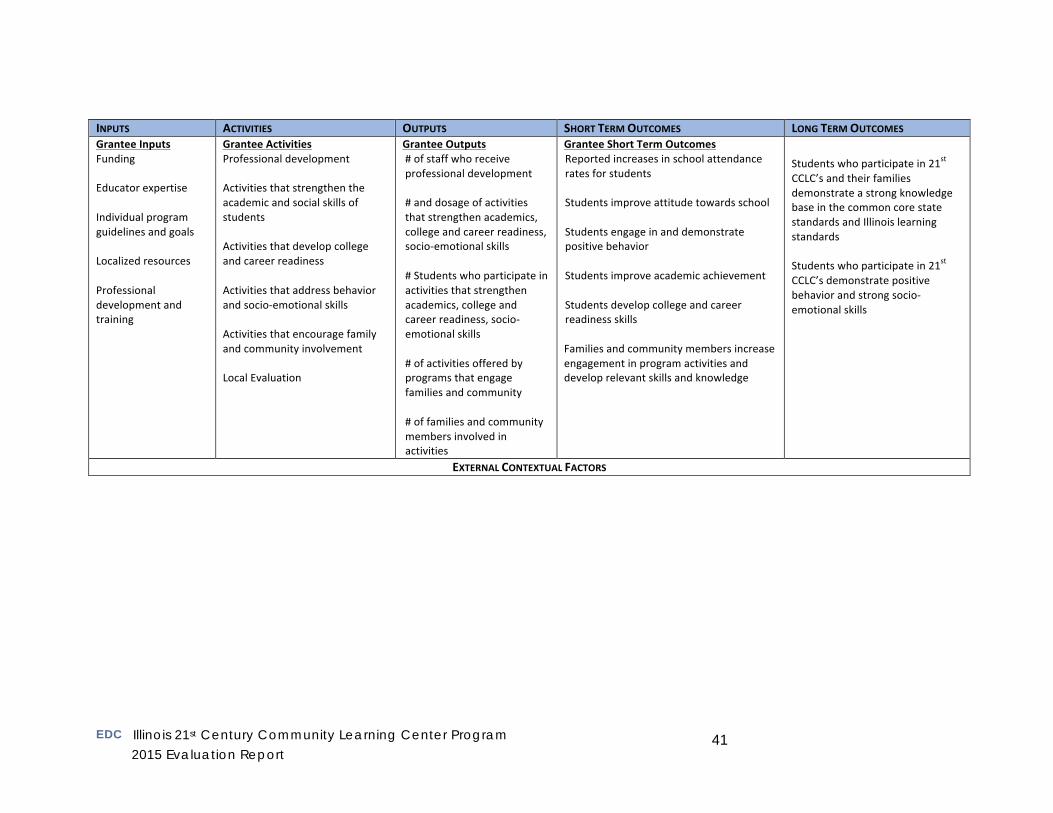
EDC Illinois 21st Century Community Learning Center Program
2015 Evaluation Report 41
INPUTS ACTIVITIES OUTPUTS SHORT TERM OUTCOMES LONG TERM OUTCOMES Grantee Inputs Funding Educator expertise Individual program guidelines and goals Localized resources Professional development and training
Grantee Activities Professional development Activities that strengthen the academic and social skills of students Activities that develop college and career readiness Activities that address behavior and socio-‐emotional skills Activities that encourage family and community involvement Local Evaluation
Grantee Outputs # of staff who receive professional development # and dosage of activities that strengthen academics, college and career readiness, socio-‐emotional skills # Students who participate in activities that strengthen academics, college and career readiness, socio-‐emotional skills # of activities offered by programs that engage families and community # of families and community members involved in activities
Grantee Short Term Outcomes Reported increases in school attendance rates for students Students improve attitude towards school Students engage in and demonstrate positive behavior Students improve academic achievement Students develop college and career readiness skills Families and community members increase engagement in program activities and develop relevant skills and knowledge
Students who participate in 21st CCLC’s and their families demonstrate a strong knowledge base in the common core state standards and Illinois learning standards
Students who participate in 21st CCLC’s demonstrate positive behavior and strong socio-‐emotional skills
EXTERNAL CONTEXTUAL FACTORS
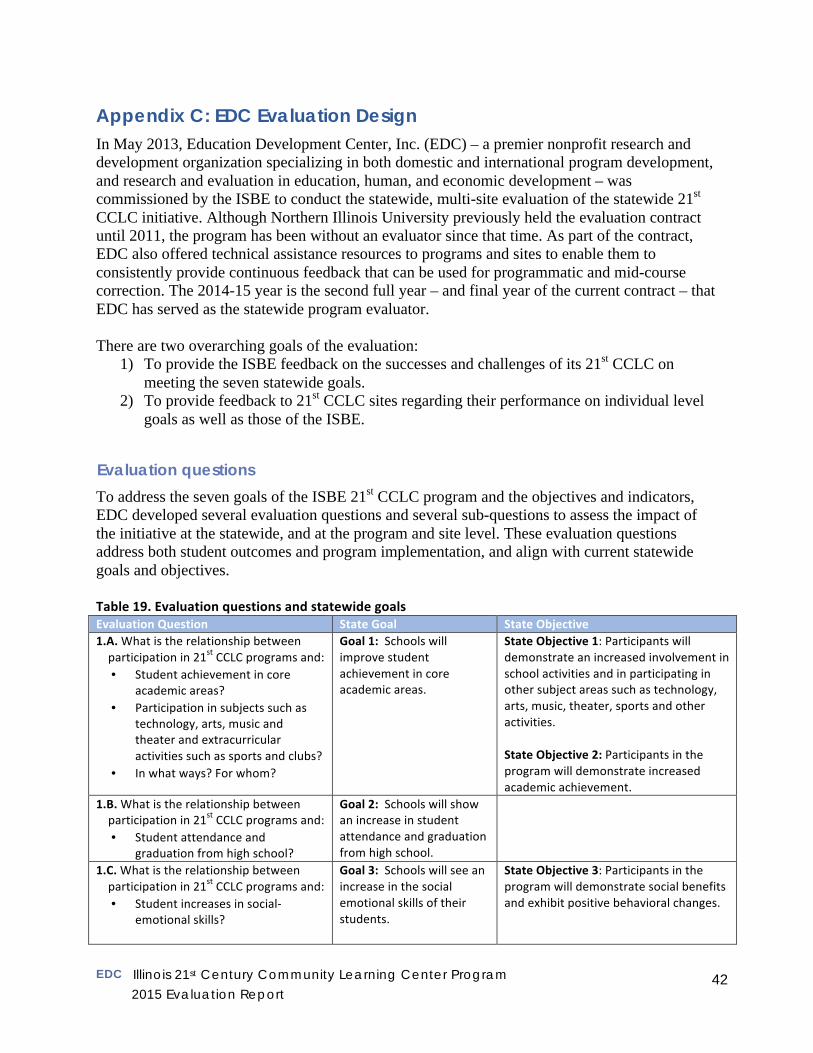
EDC Illinois 21st Century Community Learning Center Program
2015 Evaluation Report 42
Appendix C: EDC Evaluation Design In May 2013, Education Development Center, Inc. (EDC) – a premier nonprofit research and development organization specializing in both domestic and international program development, and research and evaluation in education, human, and economic development – was commissioned by the ISBE to conduct the statewide, multi-site evaluation of the statewide 21st CCLC initiative. Although Northern Illinois University previously held the evaluation contract until 2011, the program has been without an evaluator since that time. As part of the contract, EDC also offered technical assistance resources to programs and sites to enable them to consistently provide continuous feedback that can be used for programmatic and mid-course correction. The 2014-15 year is the second full year – and final year of the current contract – that EDC has served as the statewide program evaluator. There are two overarching goals of the evaluation:
1) To provide the ISBE feedback on the successes and challenges of its 21st CCLC on meeting the seven statewide goals.
2) To provide feedback to 21st CCLC sites regarding their performance on individual level goals as well as those of the ISBE.
Evaluation questions
To address the seven goals of the ISBE 21st CCLC program and the objectives and indicators, EDC developed several evaluation questions and several sub-questions to assess the impact of the initiative at the statewide, and at the program and site level. These evaluation questions address both student outcomes and program implementation, and align with current statewide goals and objectives. Table 19. Evaluation questions and statewide goals Evaluation Question State Goal State Objective 1.A. What is the relationship between participation in 21st CCLC programs and: • Student achievement in core
academic areas? • Participation in subjects such as
technology, arts, music and theater and extracurricular activities such as sports and clubs?
• In what ways? For whom?
Goal 1: Schools will improve student achievement in core academic areas.
State Objective 1: Participants will demonstrate an increased involvement in school activities and in participating in other subject areas such as technology, arts, music, theater, sports and other activities. State Objective 2: Participants in the program will demonstrate increased academic achievement.
1.B. What is the relationship between participation in 21st CCLC programs and: • Student attendance and
graduation from high school?
Goal 2: Schools will show an increase in student attendance and graduation from high school.
1.C. What is the relationship between participation in 21st CCLC programs and: • Student increases in social-‐
emotional skills?
Goal 3: Schools will see an increase in the social emotional skills of their students.
State Objective 3: Participants in the program will demonstrate social benefits and exhibit positive behavioral changes.
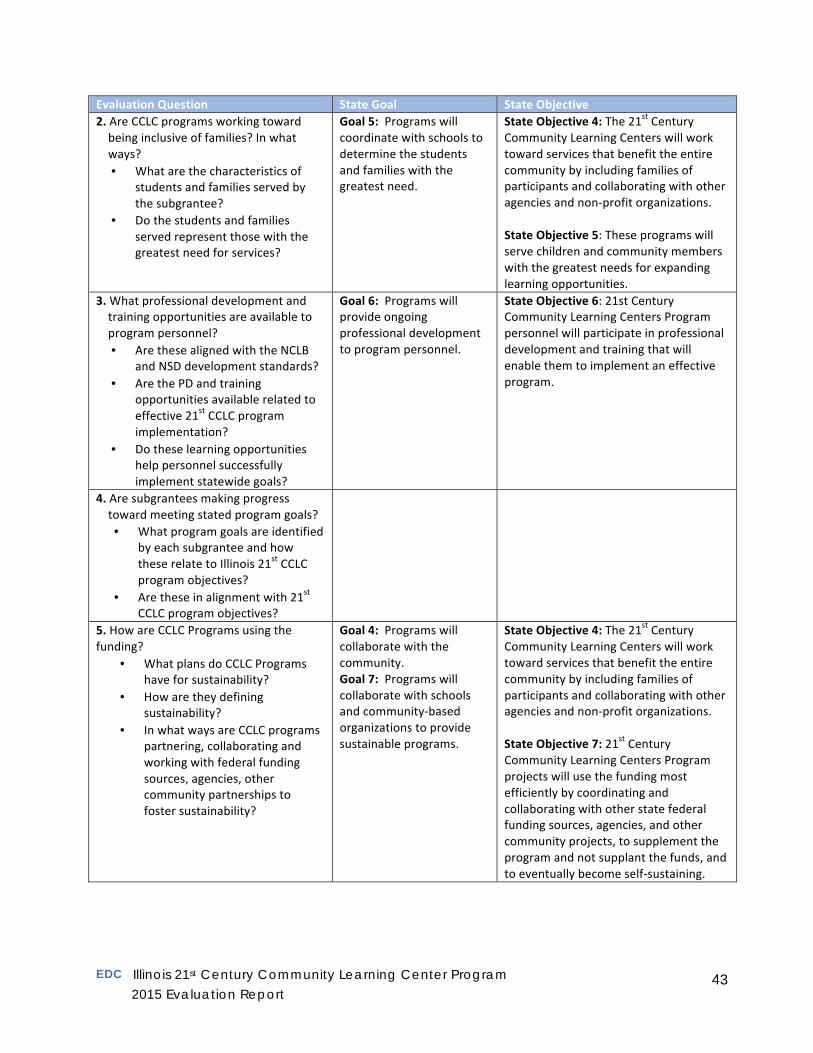
EDC Illinois 21st Century Community Learning Center Program
2015 Evaluation Report 43
Evaluation Question State Goal State Objective 2. Are CCLC programs working toward being inclusive of families? In what ways? • What are the characteristics of
students and families served by the subgrantee?
• Do the students and families served represent those with the greatest need for services?
Goal 5: Programs will coordinate with schools to determine the students and families with the greatest need.
State Objective 4: The 21st Century Community Learning Centers will work toward services that benefit the entire community by including families of participants and collaborating with other agencies and non-‐profit organizations. State Objective 5: These programs will serve children and community members with the greatest needs for expanding learning opportunities.
3. What professional development and training opportunities are available to program personnel? • Are these aligned with the NCLB
and NSD development standards? • Are the PD and training
opportunities available related to effective 21st CCLC program implementation?
• Do these learning opportunities help personnel successfully implement statewide goals?
Goal 6: Programs will provide ongoing professional development to program personnel.
State Objective 6: 21st Century Community Learning Centers Program personnel will participate in professional development and training that will enable them to implement an effective program.
4. Are subgrantees making progress toward meeting stated program goals? • What program goals are identified
by each subgrantee and how these relate to Illinois 21st CCLC program objectives?
• Are these in alignment with 21st CCLC program objectives?
5. How are CCLC Programs using the funding?
• What plans do CCLC Programs have for sustainability?
• How are they defining sustainability?
• In what ways are CCLC programs partnering, collaborating and working with federal funding sources, agencies, other community partnerships to foster sustainability?
Goal 4: Programs will collaborate with the community. Goal 7: Programs will collaborate with schools and community-‐based organizations to provide sustainable programs.
State Objective 4: The 21st Century Community Learning Centers will work toward services that benefit the entire community by including families of participants and collaborating with other agencies and non-‐profit organizations. State Objective 7: 21st Century Community Learning Centers Program projects will use the funding most efficiently by coordinating and collaborating with other state federal funding sources, agencies, and other community projects, to supplement the program and not supplant the funds, and to eventually become self-‐sustaining.
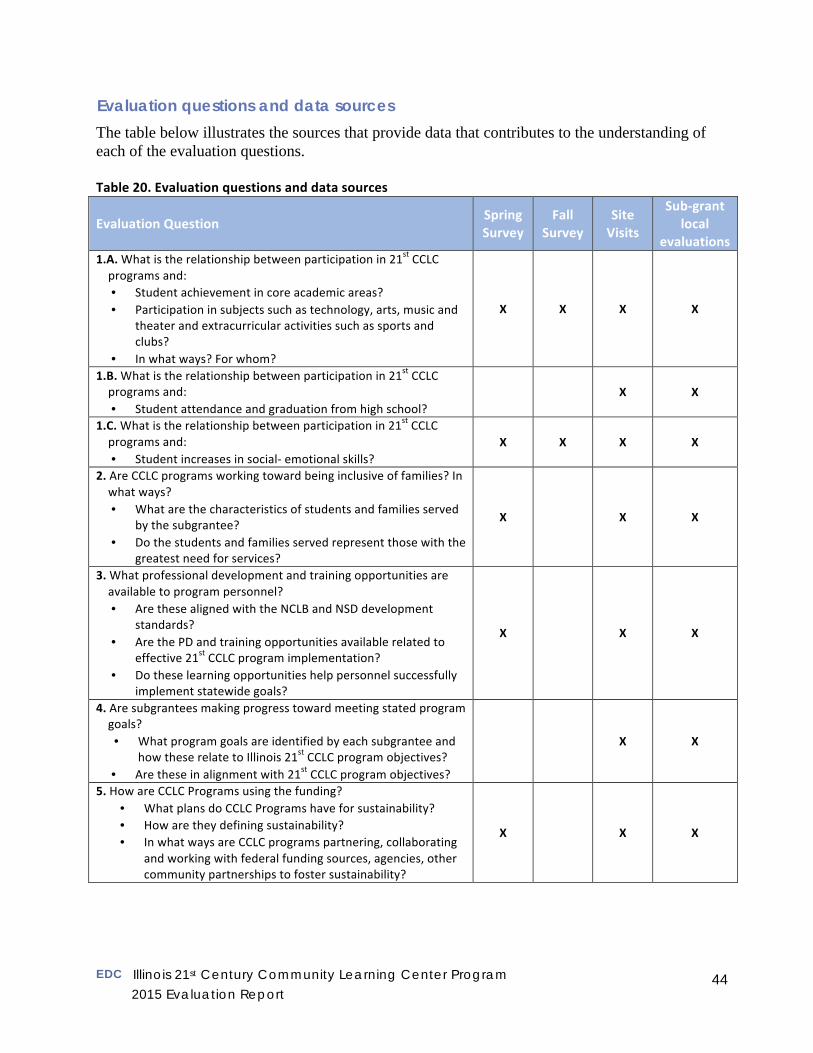
EDC Illinois 21st Century Community Learning Center Program
2015 Evaluation Report 44
Evaluation questions and data sources
The table below illustrates the sources that provide data that contributes to the understanding of each of the evaluation questions. Table 20. Evaluation questions and data sources
Evaluation Question Spring Survey
Fall Survey
Site Visits
Sub-‐grant local
evaluations 1.A. What is the relationship between participation in 21st CCLC programs and: • Student achievement in core academic areas? • Participation in subjects such as technology, arts, music and
theater and extracurricular activities such as sports and clubs?
• In what ways? For whom?
X X X X
1.B. What is the relationship between participation in 21st CCLC programs and: • Student attendance and graduation from high school?
X X
1.C. What is the relationship between participation in 21st CCLC programs and: • Student increases in social-‐ emotional skills?
X X X X
2. Are CCLC programs working toward being inclusive of families? In what ways? • What are the characteristics of students and families served
by the subgrantee? • Do the students and families served represent those with the
greatest need for services?
X X X
3. What professional development and training opportunities are available to program personnel? • Are these aligned with the NCLB and NSD development
standards? • Are the PD and training opportunities available related to
effective 21st CCLC program implementation? • Do these learning opportunities help personnel successfully
implement statewide goals?
X X X
4. Are subgrantees making progress toward meeting stated program goals? • What program goals are identified by each subgrantee and
how these relate to Illinois 21st CCLC program objectives? • Are these in alignment with 21st CCLC program objectives?
X X
5. How are CCLC Programs using the funding? • What plans do CCLC Programs have for sustainability? • How are they defining sustainability? • In what ways are CCLC programs partnering, collaborating
and working with federal funding sources, agencies, other community partnerships to foster sustainability?
X X X
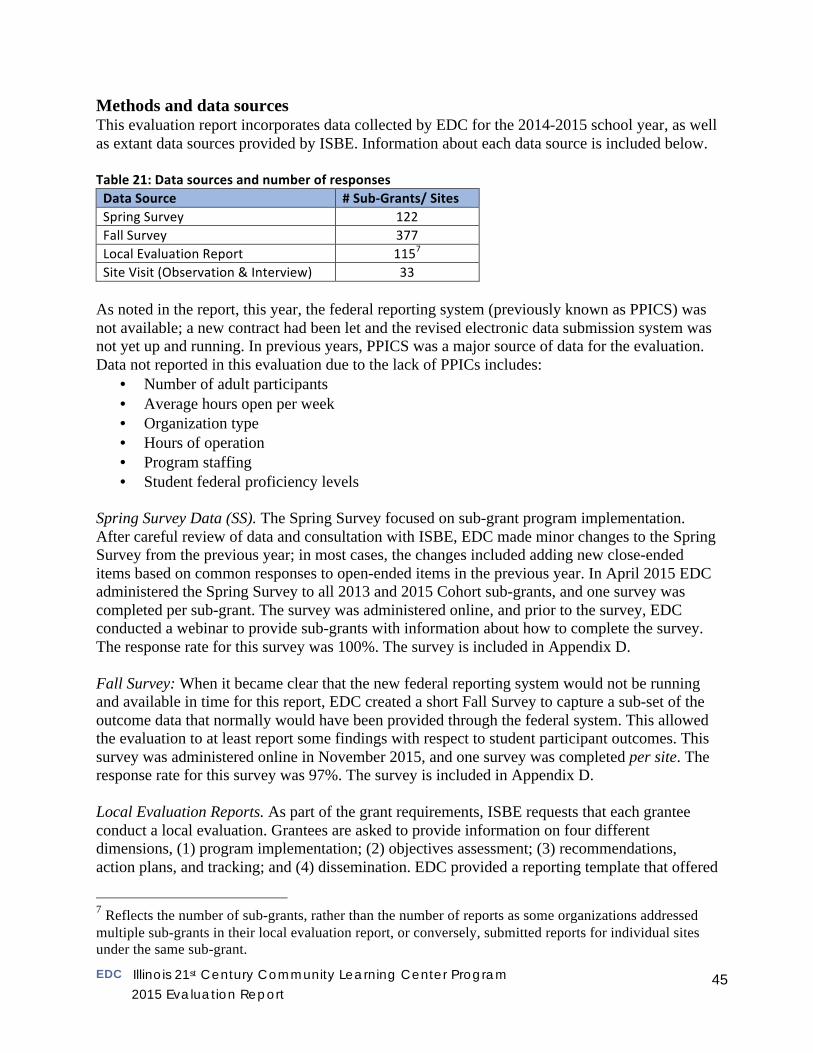
EDC Illinois 21st Century Community Learning Center Program
2015 Evaluation Report 45
Methods and data sources This evaluation report incorporates data collected by EDC for the 2014-2015 school year, as well as extant data sources provided by ISBE. Information about each data source is included below. Table 21: Data sources and number of responses Data Source # Sub-‐Grants/ Sites Spring Survey 122 Fall Survey 377 Local Evaluation Report 1157 Site Visit (Observation & Interview) 33
As noted in the report, this year, the federal reporting system (previously known as PPICS) was not available; a new contract had been let and the revised electronic data submission system was not yet up and running. In previous years, PPICS was a major source of data for the evaluation. Data not reported in this evaluation due to the lack of PPICs includes:
• Number of adult participants • Average hours open per week • Organization type • Hours of operation • Program staffing • Student federal proficiency levels
Spring Survey Data (SS). The Spring Survey focused on sub-grant program implementation. After careful review of data and consultation with ISBE, EDC made minor changes to the Spring Survey from the previous year; in most cases, the changes included adding new close-ended items based on common responses to open-ended items in the previous year. In April 2015 EDC administered the Spring Survey to all 2013 and 2015 Cohort sub-grants, and one survey was completed per sub-grant. The survey was administered online, and prior to the survey, EDC conducted a webinar to provide sub-grants with information about how to complete the survey. The response rate for this survey was 100%. The survey is included in Appendix D. Fall Survey: When it became clear that the new federal reporting system would not be running and available in time for this report, EDC created a short Fall Survey to capture a sub-set of the outcome data that normally would have been provided through the federal system. This allowed the evaluation to at least report some findings with respect to student participant outcomes. This survey was administered online in November 2015, and one survey was completed per site. The response rate for this survey was 97%. The survey is included in Appendix D. Local Evaluation Reports. As part of the grant requirements, ISBE requests that each grantee conduct a local evaluation. Grantees are asked to provide information on four different dimensions, (1) program implementation; (2) objectives assessment; (3) recommendations, action plans, and tracking; and (4) dissemination. EDC provided a reporting template that offered
7 Reflects the number of sub-grants, rather than the number of reports as some organizations addressed multiple sub-grants in their local evaluation report, or conversely, submitted reports for individual sites under the same sub-grant.
EDC Illinois 21st Century Community Learning Center Program
2015 Evaluation Report 46
an outline for the information and data to be included in the report, and conducted a webinar on the report template with sub-grants in April 2015. Reports were due to EDC and ISBE on November 30, 2015. EDC reviewed all of the reports, and summarized and coded them for several categories of information. The quality and substance of the local evaluations varied greatly. It was not possible to aggregate specific outcome findings, as sub-grants and sites were not asking the same questions, or collecting data in the same way. Instead, the review focused on the categories of data included. EDC coded for evaluation plans and methods, types of information about implementation, types of data addressing outcomes, and the recommendations offered for program improvement. In addition, EDC tracked whether the sub-grantee reported progress with respect to each of the statewide program objectives. Relevant findings are integrated into this report, and a summary of the analysis is also included in Appendix F. Sites Visit Observations and Interviews. Starting in the fall of 2014, EDC conducted site visits to nearly all of the 2013 Cohort sub-grants. Each site was visited for a single day by an EDC evaluator or sub-contractor who observed program activities, met with program staff, and conducted interviews. Interview participants included project directors, resource coordinators, teachers and other staff of the 21st CCLC program. The interview protocol included questions about the program, program offerings, program objectives, families and communities, and new developments in afterschool programming. All interviews were done in person, digitally recorded for accuracy, and subsequently transcribed, coded, and analyzed. Observations of program activities were completed at each site using a protocol developed by EDC. The observation protocol was designed to be qualitative in nature. The goal of conducting observations of program activities was to see how the program operates on a typical day. Site visitors documented as much of the program process as possible, giving program activities priority. Each activity was observed, keeping in mind the environment, culture of site and interactions (i.e., among staff, staff and students and staff and parents), operations (i.e., program management), program goals, and engagement of participants. The site visit protocol and interview guide are included in Appendix D. A summary of site visits and interviews is included in Appendix E.
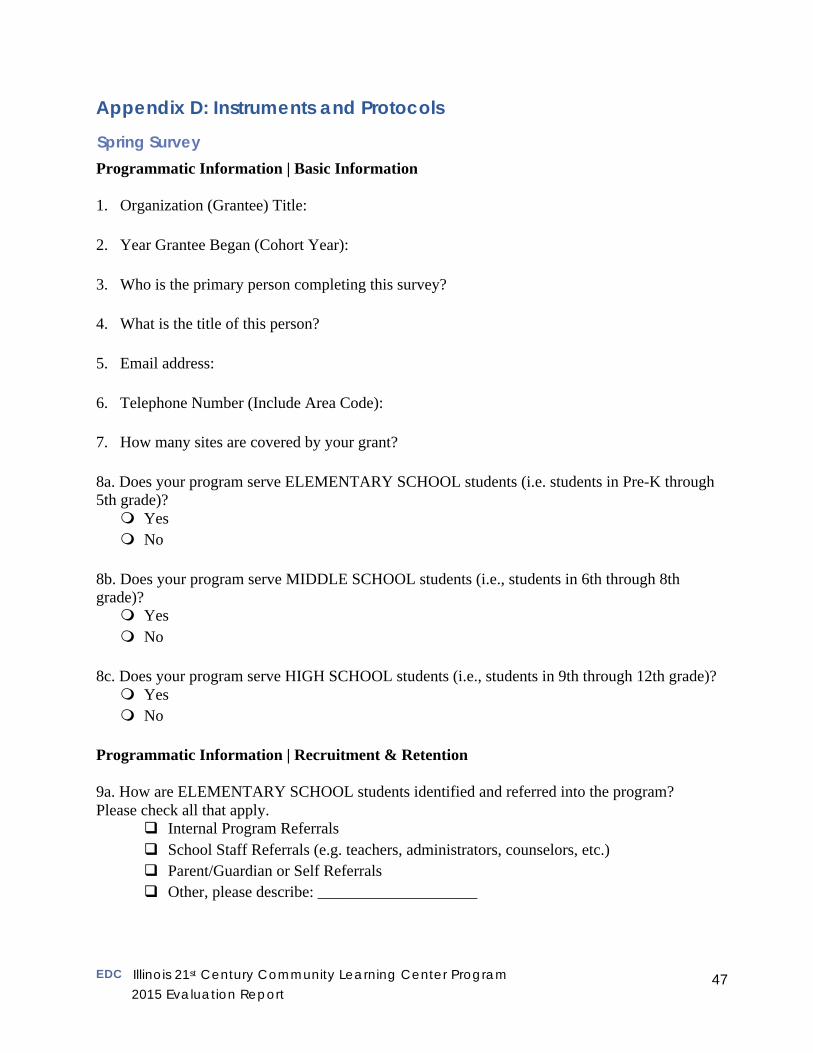
EDC Illinois 21st Century Community Learning Center Program
2015 Evaluation Report 47
Appendix D: Instruments and Protocols
Spring Survey
Programmatic Information | Basic Information 1. Organization (Grantee) Title:
2. Year Grantee Began (Cohort Year):
3. Who is the primary person completing this survey?
4. What is the title of this person?
5. Email address:
6. Telephone Number (Include Area Code):
7. How many sites are covered by your grant?
8a. Does your program serve ELEMENTARY SCHOOL students (i.e. students in Pre-K through 5th grade)?
Yes No
8b. Does your program serve MIDDLE SCHOOL students (i.e., students in 6th through 8th grade)?
Yes No
8c. Does your program serve HIGH SCHOOL students (i.e., students in 9th through 12th grade)? Yes No
Programmatic Information | Recruitment & Retention 9a. How are ELEMENTARY SCHOOL students identified and referred into the program? Please check all that apply.
Internal Program Referrals School Staff Referrals (e.g. teachers, administrators, counselors, etc.) Parent/Guardian or Self Referrals Other, please describe: ____________________
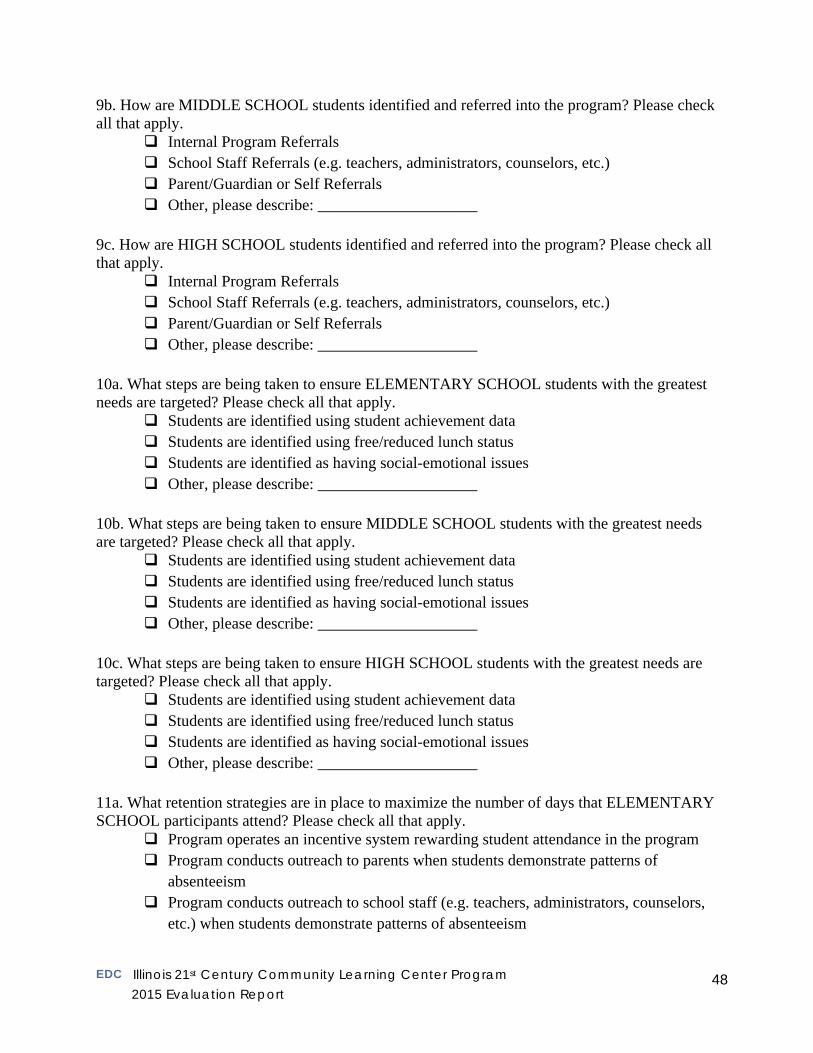
EDC Illinois 21st Century Community Learning Center Program
2015 Evaluation Report 48
9b. How are MIDDLE SCHOOL students identified and referred into the program? Please check all that apply.
Internal Program Referrals School Staff Referrals (e.g. teachers, administrators, counselors, etc.) Parent/Guardian or Self Referrals Other, please describe: ____________________
9c. How are HIGH SCHOOL students identified and referred into the program? Please check all that apply.
Internal Program Referrals School Staff Referrals (e.g. teachers, administrators, counselors, etc.) Parent/Guardian or Self Referrals Other, please describe: ____________________
10a. What steps are being taken to ensure ELEMENTARY SCHOOL students with the greatest needs are targeted? Please check all that apply.
Students are identified using student achievement data Students are identified using free/reduced lunch status Students are identified as having social-emotional issues Other, please describe: ____________________
10b. What steps are being taken to ensure MIDDLE SCHOOL students with the greatest needs are targeted? Please check all that apply.
Students are identified using student achievement data Students are identified using free/reduced lunch status Students are identified as having social-emotional issues Other, please describe: ____________________
10c. What steps are being taken to ensure HIGH SCHOOL students with the greatest needs are targeted? Please check all that apply.
Students are identified using student achievement data Students are identified using free/reduced lunch status Students are identified as having social-emotional issues Other, please describe: ____________________
11a. What retention strategies are in place to maximize the number of days that ELEMENTARY SCHOOL participants attend? Please check all that apply.
Program operates an incentive system rewarding student attendance in the program Program conducts outreach to parents when students demonstrate patterns of
absenteeism Program conducts outreach to school staff (e.g. teachers, administrators, counselors,
etc.) when students demonstrate patterns of absenteeism
EDC Illinois 21st Century Community Learning Center Program
2015 Evaluation Report 49
Program provides an inviting and inclusive environment that encourages student attendance
Program designs and delivers academic activities with a specific focus on encouraging attendance
Program designs and delivers non-academic activities with a specific focus on encouraging attendance
Other, please describe: ____________________ 11b. What retention strategies are in place to maximize the number of days that MIDDLE SCHOOL participants attend? Please check all that apply.
Program operates an incentive system rewarding student attendance in the program Program conducts outreach to parents when students demonstrate patterns of
absenteeism Program conducts outreach to school staff (e.g. teachers, administrators, counselors,
etc.) when students demonstrate patterns of absenteeism Program provides an inviting and inclusive environment that encourages student
attendance Program designs and delivers academic activities with a specific focus on
encouraging attendance Program designs and delivers non-academic activities with a specific focus on
encouraging attendance Other, please describe: ____________________
11c. What retention strategies are in place to maximize the number of days that HIGH SCHOOL participants attend? Please check all that apply.
Program operates an incentive system rewarding student attendance in the program Program conducts outreach to parents when students demonstrate patterns of
absenteeism Program conducts outreach to school staff (e.g. teachers, administrators, counselors,
etc.) when students demonstrate patterns of absenteeism Program provides an inviting and inclusive environment that encourages student
attendance Program designs and delivers academic activities with a specific focus on
encouraging attendance Program designs and delivers non-academic activities with a specific focus on
encouraging attendance Other, please describe: ____________________
12a. How are lines of communication kept open with parents/guardians of ELEMENTARY SCHOOL participants? Please check all that apply.
Newsletters Website
EDC Illinois 21st Century Community Learning Center Program
2015 Evaluation Report 50
Notes sent home Phone calls In-person meetings Other, please describe: ____________________
12b. How are lines of communication kept open with parents/guardians of MIDDLE SCHOOL participants? Please check all that apply.
Newsletters Website Notes sent home Phone calls In-person meetings Other, please describe: ____________________
12c. How are lines of communication kept open with parents/guardians of HIGH SCHOOL participants? Please check all that apply.
Newsletters Website Notes sent home Phone calls In-person meetings Other, please describe: ____________________
Programmatic Information | Academic Components 13a. For sites serving ELEMENTARY SCHOOL participants, please describe the reading component and the process used to align with English language arts standards. The standards and descriptors can be found at http:www.isbe.net/ils/ 13b. For sites serving MIDDLE SCHOOL participants, please describe the reading component and the process used to align with English language arts standards. The standards and descriptors can be found at http//:www.isbe.net/ils/ 13c. For sites serving HIGH SCHOOL participants, please describe the reading component and the process used to align with English language arts standards. The standards and descriptors can be found at http//:www.isbe.net/ils/ 14a. For sites serving ELEMENTARY SCHOOL participants, please describe the mathematics component and the process used to align with mathematics standards. The standards and descriptors can be found at http//:www.isbe.net/ils/ 14b. For sites serving MIDDLE SCHOOL participants, please describe the mathematics component and the process used to align with mathematics standards. The standards and descriptors can be found at http//:www.isbe.net/ils/
EDC Illinois 21st Century Community Learning Center Program
2015 Evaluation Report 51
14c. For sites serving HIGH SCHOOL participants, please describe the mathematics component and the process used to align with mathematics standards. The standards and descriptors can be found at http//:www.isbe.net/ils/ 15a. For sites serving ELEMENTARY SCHOOL participants, how are the other academic components aligned with statewide objectives? Please explain. 15b. For sites serving MIDDLE SCHOOL participants, how are the other academic components aligned with statewide objectives? Please explain. 15c. For sites serving HIGH SCHOOL participants, how are the other academic components aligned with statewide objectives? Please explain. Programmatic Information | Other Programs and Components 16. Please identify whether the following programs/components are available for each population listed below. Note: By checking a box, you’re indicating that the program component is available for the corresponding population.
For Elementary School Participants?
For Middle School Participants?
For High School Participants?
Arts Program Bilingual Program
Special Needs Program Entrepreneurial, career development, job skills
component
Youth development component
Mentoring component Credit recovery
component
Social-Emotional component
Science, technology, engineering, mathematics
(STEM) program
21st century skills component
EDC Illinois 21st Century Community Learning Center Program
2015 Evaluation Report 52
[Below, provide additional information about the program components that you have indicated are available] 17. Please indicate whether your arts programming includes one or more of the following. Check all that apply.
Performance Arts Music Visual Arts (photography, drawing, sculpture) Deocrative Arts (Ceramics, Jewelry) Applied Art (Architecture, Fashion design) Art History (Visiting art museums)
18a. Please describe the arts programming for ELEMENTARY SCHOOL participants. 18b. Please describe the arts programming for MIDDLE SCHOOL participants. 18c. Please describe the arts programming for HIGH SCHOOL participants. 19a. Please describe the bilingual programming for ELEMENTARY SCHOOL participants. 19b. Please describe the bilingual programming for MIDDLE SCHOOL participants. 19c. Please describe the bilingual programming for HIGH SCHOOL participants. 20a. Please describe the special needs programming for ELEMENTARY SCHOOL participants. 20b. Please describe the special needs programming for MIDDLE SCHOOL participants. 20c. Please describe the special needs programming for HIGH SCHOOL participants. 21. Please indicate whether your programs's entrepreneurial, career development, and/or job skills component includes one or more of the following. Check all that apply.
Entrepreneurship activities (business planning, school store) Junior Achievement program Financial literacy Career exploration (skills/interest inventories, guest speakers, job fairs, field trips) Online programs/resources (e.g. Career Launch, Career Cruising) Job seeking skills (e.g. resume writing, interview skills) Clubs/programs that explore careers and support skill development Career and technical student organization activities
EDC Illinois 21st Century Community Learning Center Program
2015 Evaluation Report 53
22a. Please describe the entrepreneurial, career development, and/or job skills component for ELEMENTARY SCHOOL participants. 22b. Please describe the entrepreneurial, career development, and/or job skills component for MIDDLE SCHOOL participants. 22c. Please describe the entrepreneurial, career development, and/or job skills component for HIGH SCHOOL participants. 23a. Please describe the youth development component for ELEMENTARY SCHOOL participants. 23b. Please describe the youth development component for MIDDLE SCHOOL participants. 23c. Please describe the youth development component for HIGH SCHOOL participants. 24a. Please describe the mentoring component for ELEMENTARY SCHOOL participants. 24b. Please describe the mentoring component for MIDDLE SCHOOL participants. 24c. Please describe the mentoring component for HIGH SCHOOL participants. 25a. Please describe the credit recovery component for ELEMENTARY SCHOOL participants. 25b. Please describe the credit recovery component for MIDDLE SCHOOL participants. 25c. Please describe the credit recovery component for HIGH SCHOOL participants. 26. Please indicate whether your program's social-emotional component utilizes one or more of the following. Check all that apply.
Aggression Replacement Training Botvin Life Skills Training Curriculum Lions Quest Curriculum Means and Measures of Human Achievement Labs (MHA) Tools Positive Behavioral Intervention and Supports (PBIS) Second Step Curriculum Stephen Covey's Seven Habits of Highly Effective People Program
27a. Please describe the social-emotional component for ELEMENTARY SCHOOL participants.
27b. Please describe the social-emotional component for MIDDLE SCHOOL participants.
EDC Illinois 21st Century Community Learning Center Program
2015 Evaluation Report 54
27c. Please describe the social-emotional component for HIGH SCHOOL participants. 28a. Please describe the science, technology, engineer, mathematics (STEM) programming for ELEMENTARY SCHOOL participants. 28b. Please describe the science, technology, engineer, mathematics (STEM) programming for MIDDLE SCHOOL participants. 28c. Please describe the science, technology, engineer, mathematics (STEM) programming for HIGH SCHOOL participants. 29a. Please describe the 21st century skills component for ELEMENTARY SCHOOL participants. 29b. Please describe the 21st century skills component for MIDDLE SCHOOL participants. 29c. Please describe the 21st century skills component for HIGH SCHOOL participants. 30a. Please identify whether the following enrichment and recreation components are available for ELEMENTARY SCHOOL participants. Please check all that apply.
College Preparation Activities Culinary Arts Activities Cultural Activities Field Trips Gardening Activities Games Sports Activities Other, please describe: ____________________
30b. Please identify whether the following enrichment and recreation components are available for MIDDLE SCHOOL participants. Please check all that apply.
College Preparation Activities Culinary Arts Activities Cultural Activities Field Trips Gardening Activities Games Sports Activities Other, please describe: ____________________
EDC Illinois 21st Century Community Learning Center Program
2015 Evaluation Report 55
30c. Please identify whether the following enrichment and recreation components are available for HIGH SCHOOL participants. Please check all that apply.
College Preparation Activities Culinary Arts Activities Cultural Activities Field Trips Gardening Activities Games Sports Activities Other, please describe: ____________________
31. Is there a service-learning component to the program? Yes No
32. How many of the program participants are involved in the service-learning component?
Total Number Elementary School Participants
Middle School Participants High School Particiants
33a. Please describe the service-learning components available at sites serving ELEMENTARY SCHOOL students. What do students do and whom do they serve? 33b. Please describe the service-learning components available at sites serving MIDDLE SCHOOL students. What do students do and whom do they serve? 33c. Please describe the service-learning components available at sites serving HIGH SCHOOL students. What do students do and whom do they serve? Programmatic Information | Technology Use 34a. Please indicate whether computers and/or other technologies (i.e. tablets, smartphones) are utilized by ELEMENTARY SCHOOL participants for any of the following activities. Check all that apply.
Academic remediation or computer-assisted instruction Homework support Credit recovery programs Media-making and/or digital arts Test preparation Research or finding information and resources
EDC Illinois 21st Century Community Learning Center Program
2015 Evaluation Report 56
Computer literacy or programming Games and/or free play time Other, please describe: ____________________
34b. Please indicate whether computers and/or other technologies (i.e. tablets, smartphones) are utilized by MIDDLE SCHOOL participants for any of the following activities. Check all that apply.
Academic remediation or computer-assisted instruction Homework support Credit recovery programs Media-making and/or digital arts Test preparation Research or finding information and resources Computer literacy or programming Games and/or free play time Other, please describe: ____________________
34c. Please indicate whether computers and/or other technologies (i.e. tablets, smartphones) are utilized by HIGH SCHOOL participants for any of the following activities. Check all that apply.
Academic remediation or computer-assisted instruction Homework support Credit recovery programs Media-making and/or digital arts Test preparation Research or finding information and resources Computer literacy or programming Games and/or free play time Other, please describe: ____________________
35a. For those computers and/or other technologies (i.e. tablets, smartphones) that are utilized by ELEMENTARY SCHOOL participants, which software/on-line sites are used most often? 35b. For those computers and/or other technologies (i.e. tablets, smartphones) that are utilized by MIDDLE SCHOOL participants, which software/on-line sites are used most often? 35c. For those computers and/or other technologies (i.e. tablets, smartphones) that are utilized by HIGH SCHOOL participants, which software/on-line sites are used most often? Programmatic Information | Transportation 36. Please identify whether your program (or one of your partners) offers transportation for the corresponding populations listed below. Check all that apply.
EDC Illinois 21st Century Community Learning Center Program
2015 Evaluation Report 57
Elementary School Middle School High School
37. In the previous question, you indicated that your program offers transportation for program participants. Please indicate how transportation is funded for your program.
21st CCLC funds In-kind funds Both 21st CCLC and in-kind funds
Programmatic Information | Professional Development 38. Please identify any professional development offered to staff this year and any planned for next year. Please check all that apply. Note that these professional development opportunities can be offered through your own organization, through partners, or other in-kind supports.
21st CCLC Program-Specific Training (e.g. ISBE conferences, ISBE webinars) Illinois Learning Standards Training and/or Common Core Training Cultural Awareness and Sensitivity Training Disciplinary and/or Behavioral Training (e.g. Anger Management, Positive Behavioral
Intervention and Supports (PBIS)) English Language Arts Training Health Training (e.g. nutrition education, fitness education, sexual education) Media/Technology Training Safety Training (e.g. First Aid, CPR training) STEM Training Team-Building Training Trauma Informed Practice Training Youth Development Training Youth Program Quality Assessment Training Other, please describe: ____________________
39. What recommendations do you have for future professional development activities and for which target audiences? Programmatic Information | Sustainability 40. Please describe what actions your program has taken to ensure sustainability. 41. Please describe any deviations from your approved plan for sustainability. 42. In your opinion, what critical components of the program are most sustainable?
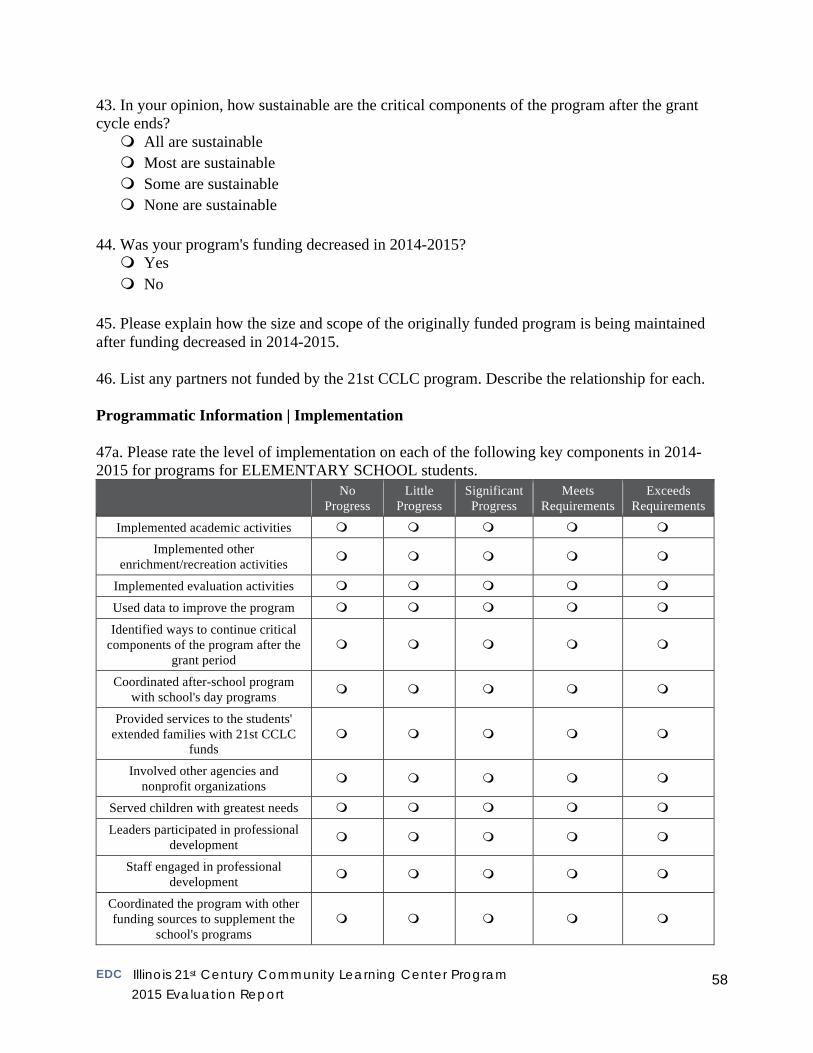
EDC Illinois 21st Century Community Learning Center Program
2015 Evaluation Report 58
43. In your opinion, how sustainable are the critical components of the program after the grant cycle ends?
All are sustainable Most are sustainable Some are sustainable None are sustainable
44. Was your program's funding decreased in 2014-2015?
Yes No
45. Please explain how the size and scope of the originally funded program is being maintained after funding decreased in 2014-2015. 46. List any partners not funded by the 21st CCLC program. Describe the relationship for each. Programmatic Information | Implementation 47a. Please rate the level of implementation on each of the following key components in 2014-2015 for programs for ELEMENTARY SCHOOL students.
No Progress
Little Progress
Significant Progress
Meets Requirements
Exceeds Requirements
Implemented academic activities Implemented other
enrichment/recreation activities
Implemented evaluation activities
Used data to improve the program
Identified ways to continue critical components of the program after the
grant period
Coordinated after-school program with school's day programs
Provided services to the students' extended families with 21st CCLC
funds
Involved other agencies and nonprofit organizations
Served children with greatest needs
Leaders participated in professional development
Staff engaged in professional development
Coordinated the program with other funding sources to supplement the
school's programs
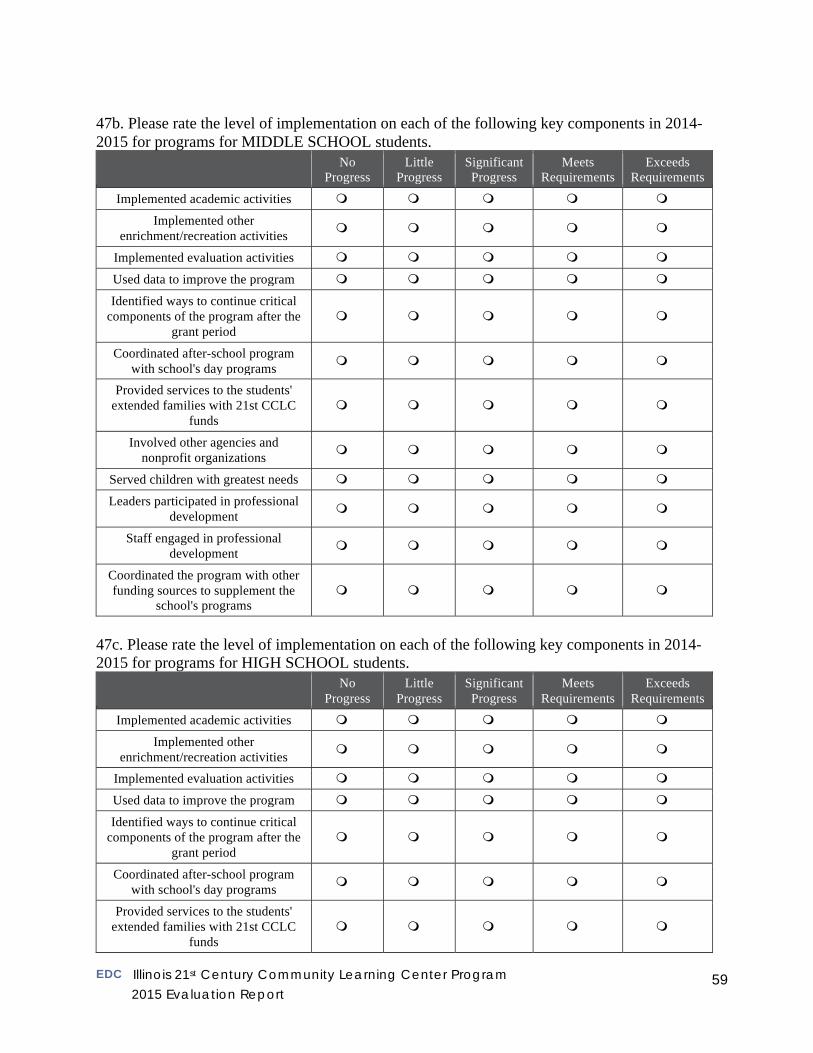
EDC Illinois 21st Century Community Learning Center Program
2015 Evaluation Report 59
47b. Please rate the level of implementation on each of the following key components in 2014-2015 for programs for MIDDLE SCHOOL students.
No Progress
Little Progress
Significant Progress
Meets Requirements
Exceeds Requirements
Implemented academic activities
Implemented other enrichment/recreation activities
Implemented evaluation activities
Used data to improve the program
Identified ways to continue critical components of the program after the
grant period
Coordinated after-school program with school's day programs
Provided services to the students' extended families with 21st CCLC
funds
Involved other agencies and nonprofit organizations
Served children with greatest needs
Leaders participated in professional development
Staff engaged in professional development
Coordinated the program with other funding sources to supplement the
school's programs
47c. Please rate the level of implementation on each of the following key components in 2014-2015 for programs for HIGH SCHOOL students.
No Progress
Little Progress
Significant Progress
Meets Requirements
Exceeds Requirements
Implemented academic activities
Implemented other enrichment/recreation activities
Implemented evaluation activities
Used data to improve the program
Identified ways to continue critical components of the program after the
grant period
Coordinated after-school program with school's day programs
Provided services to the students' extended families with 21st CCLC
funds
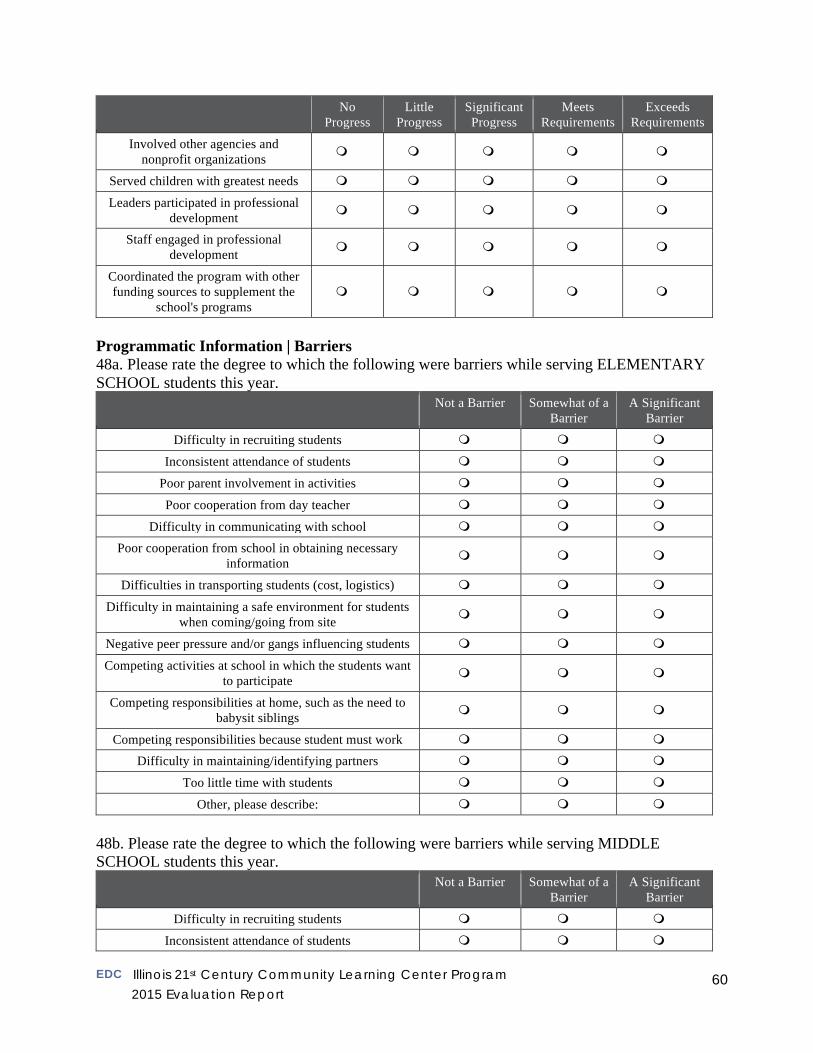
EDC Illinois 21st Century Community Learning Center Program
2015 Evaluation Report 60
No Progress
Little Progress
Significant Progress
Meets Requirements
Exceeds Requirements
Involved other agencies and nonprofit organizations
Served children with greatest needs
Leaders participated in professional development
Staff engaged in professional development
Coordinated the program with other funding sources to supplement the
school's programs
Programmatic Information | Barriers 48a. Please rate the degree to which the following were barriers while serving ELEMENTARY SCHOOL students this year.
Not a Barrier Somewhat of a Barrier
A Significant Barrier
Difficulty in recruiting students
Inconsistent attendance of students
Poor parent involvement in activities
Poor cooperation from day teacher
Difficulty in communicating with school Poor cooperation from school in obtaining necessary
information
Difficulties in transporting students (cost, logistics)
Difficulty in maintaining a safe environment for students when coming/going from site
Negative peer pressure and/or gangs influencing students
Competing activities at school in which the students want to participate
Competing responsibilities at home, such as the need to babysit siblings
Competing responsibilities because student must work Difficulty in maintaining/identifying partners
Too little time with students
Other, please describe: 48b. Please rate the degree to which the following were barriers while serving MIDDLE SCHOOL students this year.
Not a Barrier Somewhat of a Barrier
A Significant Barrier
Difficulty in recruiting students
Inconsistent attendance of students
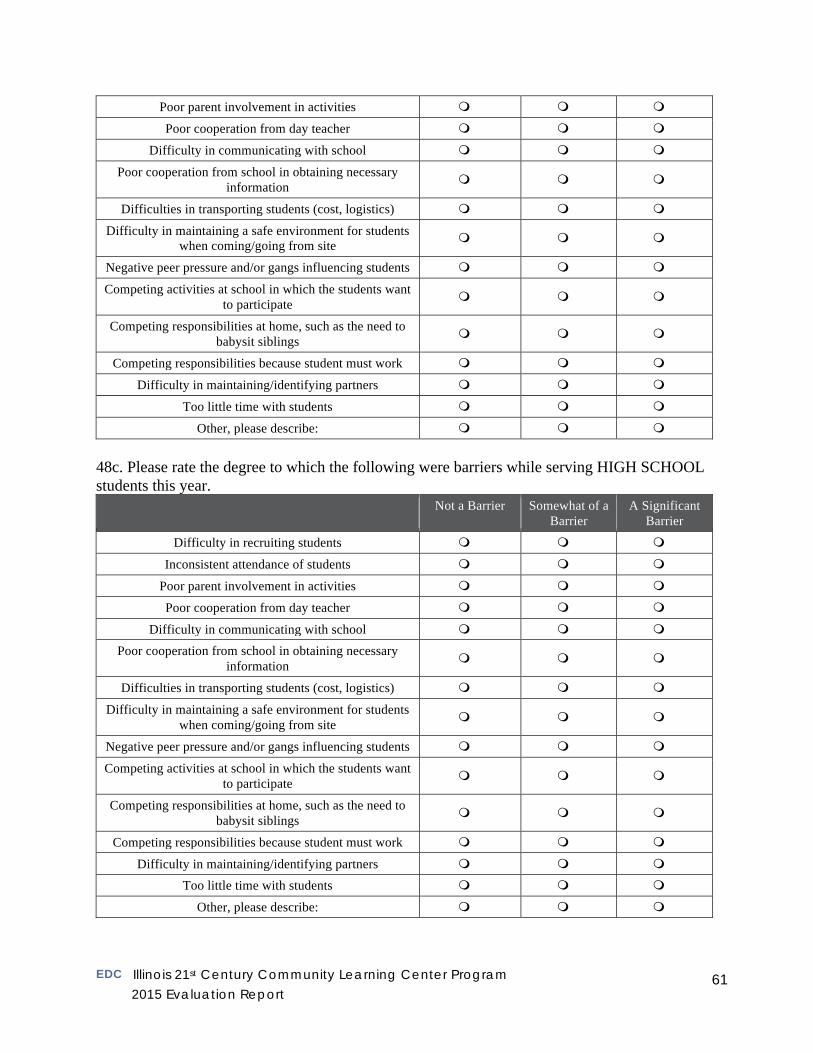
EDC Illinois 21st Century Community Learning Center Program
2015 Evaluation Report 61
Poor parent involvement in activities
Poor cooperation from day teacher
Difficulty in communicating with school
Poor cooperation from school in obtaining necessary information
Difficulties in transporting students (cost, logistics)
Difficulty in maintaining a safe environment for students when coming/going from site
Negative peer pressure and/or gangs influencing students
Competing activities at school in which the students want to participate
Competing responsibilities at home, such as the need to babysit siblings
Competing responsibilities because student must work
Difficulty in maintaining/identifying partners
Too little time with students
Other, please describe: 48c. Please rate the degree to which the following were barriers while serving HIGH SCHOOL students this year.
Not a Barrier Somewhat of a Barrier
A Significant Barrier
Difficulty in recruiting students
Inconsistent attendance of students
Poor parent involvement in activities
Poor cooperation from day teacher
Difficulty in communicating with school Poor cooperation from school in obtaining necessary
information
Difficulties in transporting students (cost, logistics)
Difficulty in maintaining a safe environment for students when coming/going from site
Negative peer pressure and/or gangs influencing students
Competing activities at school in which the students want to participate
Competing responsibilities at home, such as the need to babysit siblings
Competing responsibilities because student must work
Difficulty in maintaining/identifying partners Too little time with students
Other, please describe:
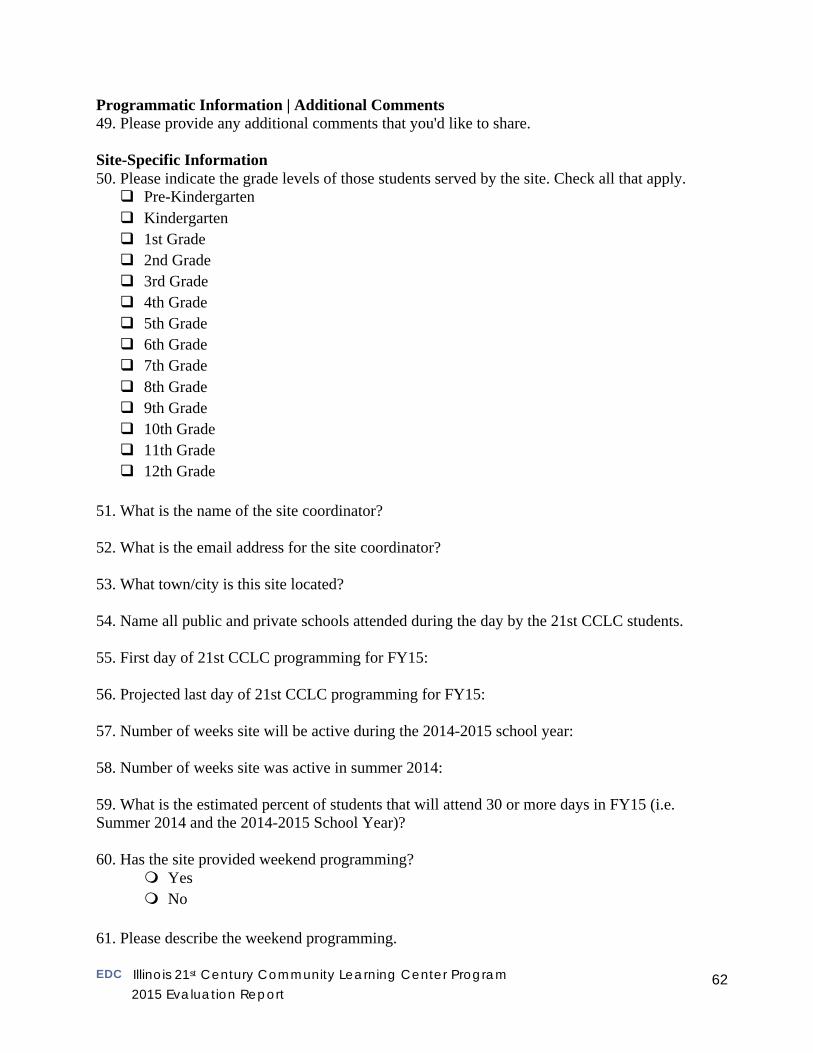
EDC Illinois 21st Century Community Learning Center Program
2015 Evaluation Report 62
Programmatic Information | Additional Comments 49. Please provide any additional comments that you'd like to share. Site-Specific Information 50. Please indicate the grade levels of those students served by the site. Check all that apply.
Pre-Kindergarten Kindergarten 1st Grade 2nd Grade 3rd Grade 4th Grade 5th Grade 6th Grade 7th Grade 8th Grade 9th Grade 10th Grade 11th Grade 12th Grade
51. What is the name of the site coordinator? 52. What is the email address for the site coordinator? 53. What town/city is this site located? 54. Name all public and private schools attended during the day by the 21st CCLC students. 55. First day of 21st CCLC programming for FY15: 56. Projected last day of 21st CCLC programming for FY15: 57. Number of weeks site will be active during the 2014-2015 school year: 58. Number of weeks site was active in summer 2014: 59. What is the estimated percent of students that will attend 30 or more days in FY15 (i.e. Summer 2014 and the 2014-2015 School Year)?
60. Has the site provided weekend programming?
Yes No
61. Please describe the weekend programming.
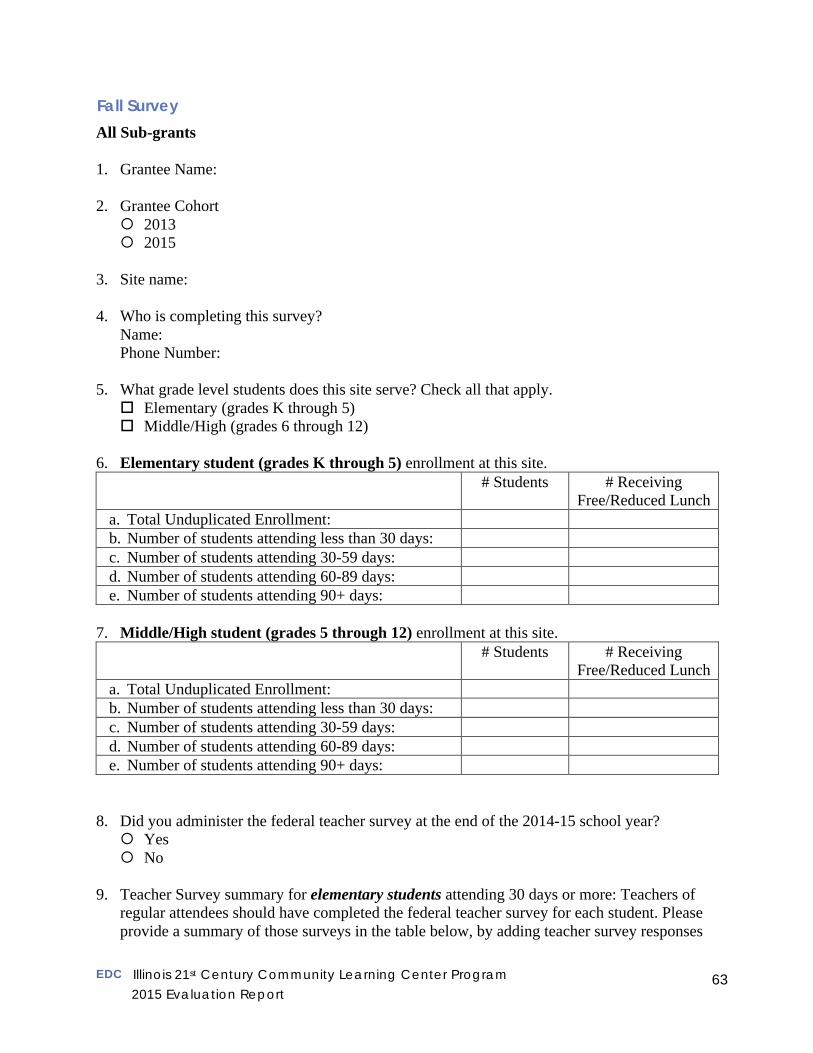
EDC Illinois 21st Century Community Learning Center Program
2015 Evaluation Report 63
Fall Survey
All Sub-grants 1. Grantee Name:
2. Grantee Cohort
2013 2015
3. Site name:
4. Who is completing this survey?
Name: Phone Number:
5. What grade level students does this site serve? Check all that apply.
Elementary (grades K through 5) Middle/High (grades 6 through 12)
6. Elementary student (grades K through 5) enrollment at this site. # Students # Receiving
Free/Reduced Lunch a. Total Unduplicated Enrollment: b. Number of students attending less than 30 days: c. Number of students attending 30-59 days: d. Number of students attending 60-89 days: e. Number of students attending 90+ days:
7. Middle/High student (grades 5 through 12) enrollment at this site. # Students # Receiving
Free/Reduced Lunch a. Total Unduplicated Enrollment: b. Number of students attending less than 30 days: c. Number of students attending 30-59 days: d. Number of students attending 60-89 days: e. Number of students attending 90+ days:
8. Did you administer the federal teacher survey at the end of the 2014-15 school year? Yes No
9. Teacher Survey summary for elementary students attending 30 days or more: Teachers of
regular attendees should have completed the federal teacher survey for each student. Please provide a summary of those surveys in the table below, by adding teacher survey responses
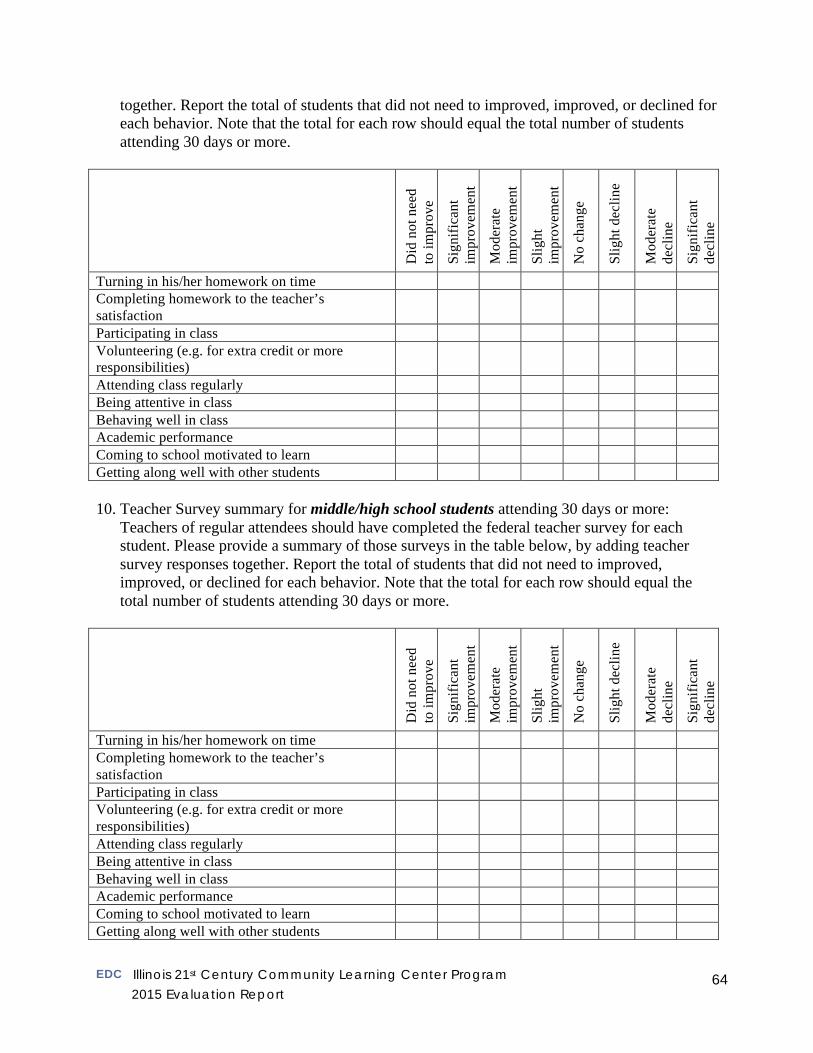
EDC Illinois 21st Century Community Learning Center Program
2015 Evaluation Report 64
together. Report the total of students that did not need to improved, improved, or declined for each behavior. Note that the total for each row should equal the total number of students attending 30 days or more.
Did
not
nee
d to
impr
ove
Sign
ifica
nt
impr
ovem
ent
Mod
erat
e im
prov
emen
t
Slig
ht
impr
ovem
ent
No
chan
ge
Slig
ht d
eclin
e
Mod
erat
e de
clin
e
Sign
ifica
nt
decl
ine
Turning in his/her homework on time Completing homework to the teacher’s satisfaction
Participating in class Volunteering (e.g. for extra credit or more responsibilities)
Attending class regularly Being attentive in class Behaving well in class Academic performance Coming to school motivated to learn Getting along well with other students
10. Teacher Survey summary for middle/high school students attending 30 days or more:
Teachers of regular attendees should have completed the federal teacher survey for each student. Please provide a summary of those surveys in the table below, by adding teacher survey responses together. Report the total of students that did not need to improved, improved, or declined for each behavior. Note that the total for each row should equal the total number of students attending 30 days or more.
Did
not
nee
d to
impr
ove
Sign
ifica
nt
impr
ovem
ent
Mod
erat
e im
prov
emen
t
Slig
ht
impr
ovem
ent
No
chan
ge
Slig
ht d
eclin
e
Mod
erat
e de
clin
e
Sign
ifica
nt
decl
ine
Turning in his/her homework on time Completing homework to the teacher’s satisfaction
Participating in class Volunteering (e.g. for extra credit or more responsibilities)
Attending class regularly Being attentive in class Behaving well in class Academic performance Coming to school motivated to learn Getting along well with other students
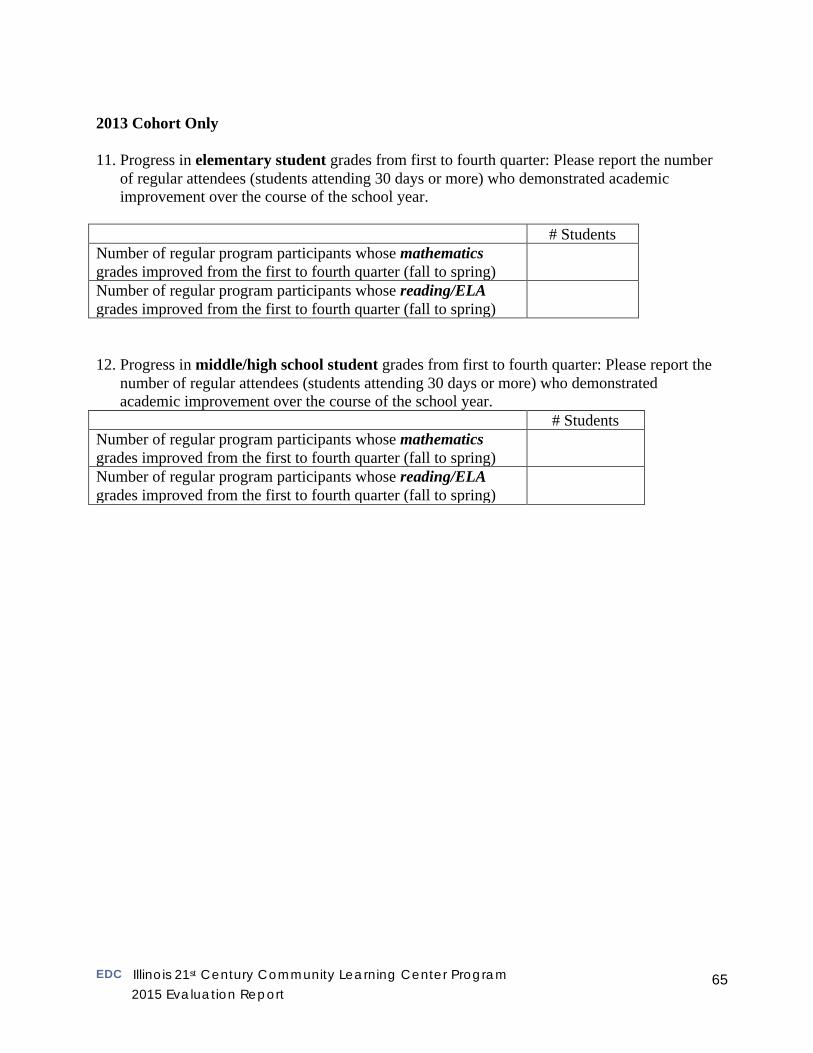
EDC Illinois 21st Century Community Learning Center Program
2015 Evaluation Report 65
2013 Cohort Only 11. Progress in elementary student grades from first to fourth quarter: Please report the number
of regular attendees (students attending 30 days or more) who demonstrated academic improvement over the course of the school year.
# Students Number of regular program participants whose mathematics grades improved from the first to fourth quarter (fall to spring)
Number of regular program participants whose reading/ELA grades improved from the first to fourth quarter (fall to spring)
12. Progress in middle/high school student grades from first to fourth quarter: Please report the
number of regular attendees (students attending 30 days or more) who demonstrated academic improvement over the course of the school year.
# Students Number of regular program participants whose mathematics grades improved from the first to fourth quarter (fall to spring)
Number of regular program participants whose reading/ELA grades improved from the first to fourth quarter (fall to spring)
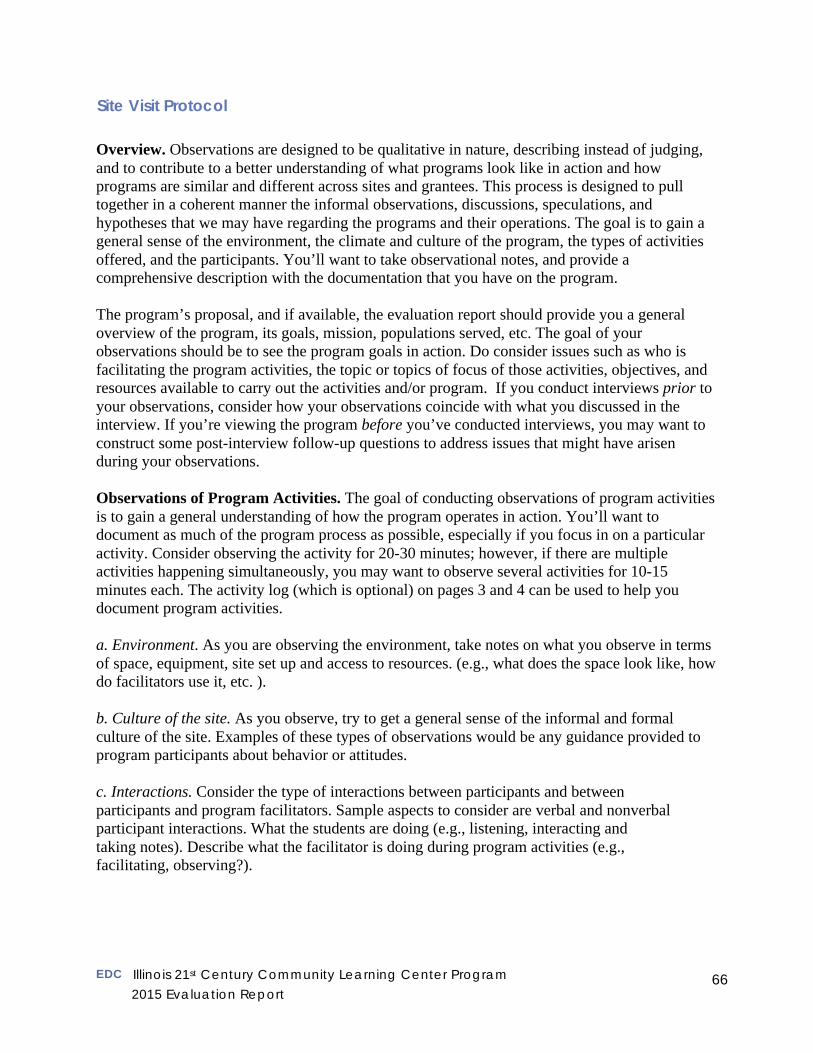
EDC Illinois 21st Century Community Learning Center Program
2015 Evaluation Report 66
Site Visit Protocol
Overview. Observations are designed to be qualitative in nature, describing instead of judging, and to contribute to a better understanding of what programs look like in action and how programs are similar and different across sites and grantees. This process is designed to pull together in a coherent manner the informal observations, discussions, speculations, and hypotheses that we may have regarding the programs and their operations. The goal is to gain a general sense of the environment, the climate and culture of the program, the types of activities offered, and the participants. You’ll want to take observational notes, and provide a comprehensive description with the documentation that you have on the program. The program’s proposal, and if available, the evaluation report should provide you a general overview of the program, its goals, mission, populations served, etc. The goal of your observations should be to see the program goals in action. Do consider issues such as who is facilitating the program activities, the topic or topics of focus of those activities, objectives, and resources available to carry out the activities and/or program. If you conduct interviews prior to your observations, consider how your observations coincide with what you discussed in the interview. If you’re viewing the program before you’ve conducted interviews, you may want to construct some post-interview follow-up questions to address issues that might have arisen during your observations. Observations of Program Activities. The goal of conducting observations of program activities is to gain a general understanding of how the program operates in action. You’ll want to document as much of the program process as possible, especially if you focus in on a particular activity. Consider observing the activity for 20-30 minutes; however, if there are multiple activities happening simultaneously, you may want to observe several activities for 10-15 minutes each. The activity log (which is optional) on pages 3 and 4 can be used to help you document program activities. a. Environment. As you are observing the environment, take notes on what you observe in terms of space, equipment, site set up and access to resources. (e.g., what does the space look like, how do facilitators use it, etc. ). b. Culture of the site. As you observe, try to get a general sense of the informal and formal culture of the site. Examples of these types of observations would be any guidance provided to program participants about behavior or attitudes. c. Interactions. Consider the type of interactions between participants and between participants and program facilitators. Sample aspects to consider are verbal and nonverbal participant interactions. What the students are doing (e.g., listening, interacting and taking notes). Describe what the facilitator is doing during program activities (e.g., facilitating, observing?).
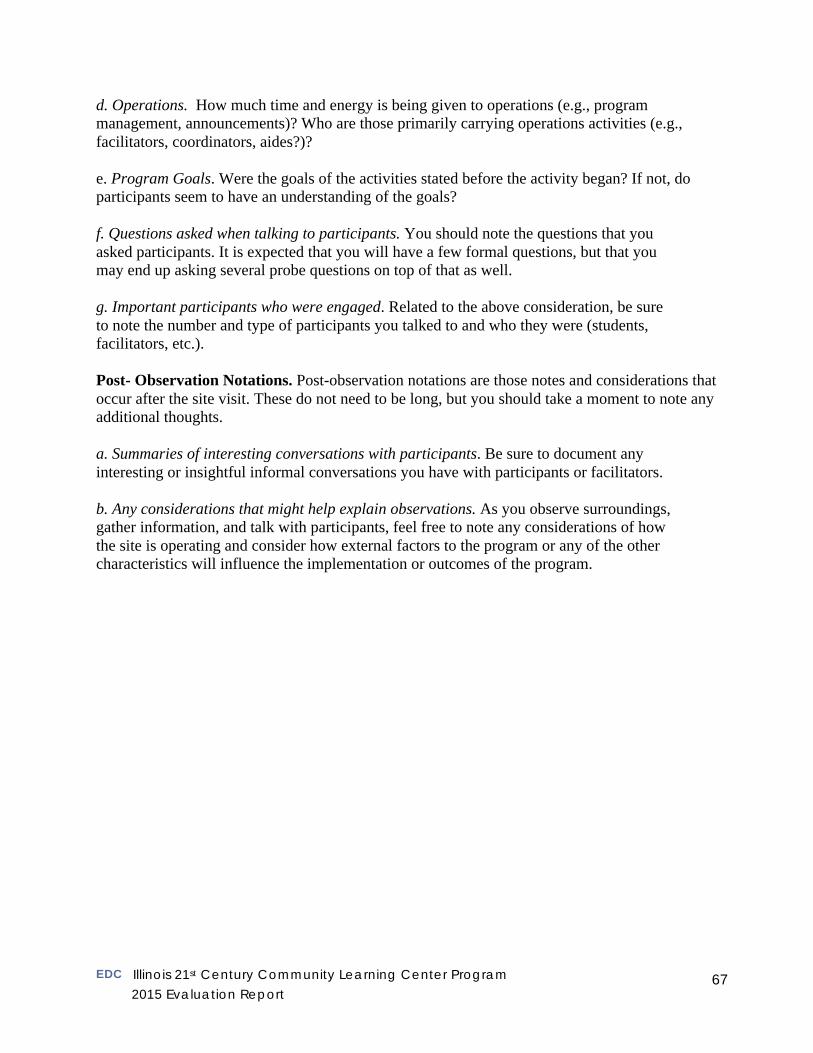
EDC Illinois 21st Century Community Learning Center Program
2015 Evaluation Report 67
d. Operations. How much time and energy is being given to operations (e.g., program management, announcements)? Who are those primarily carrying operations activities (e.g., facilitators, coordinators, aides?)? e. Program Goals. Were the goals of the activities stated before the activity began? If not, do participants seem to have an understanding of the goals? f. Questions asked when talking to participants. You should note the questions that you asked participants. It is expected that you will have a few formal questions, but that you may end up asking several probe questions on top of that as well. g. Important participants who were engaged. Related to the above consideration, be sure to note the number and type of participants you talked to and who they were (students, facilitators, etc.). Post- Observation Notations. Post-observation notations are those notes and considerations that occur after the site visit. These do not need to be long, but you should take a moment to note any additional thoughts. a. Summaries of interesting conversations with participants. Be sure to document any interesting or insightful informal conversations you have with participants or facilitators. b. Any considerations that might help explain observations. As you observe surroundings, gather information, and talk with participants, feel free to note any considerations of how the site is operating and consider how external factors to the program or any of the other characteristics will influence the implementation or outcomes of the program.
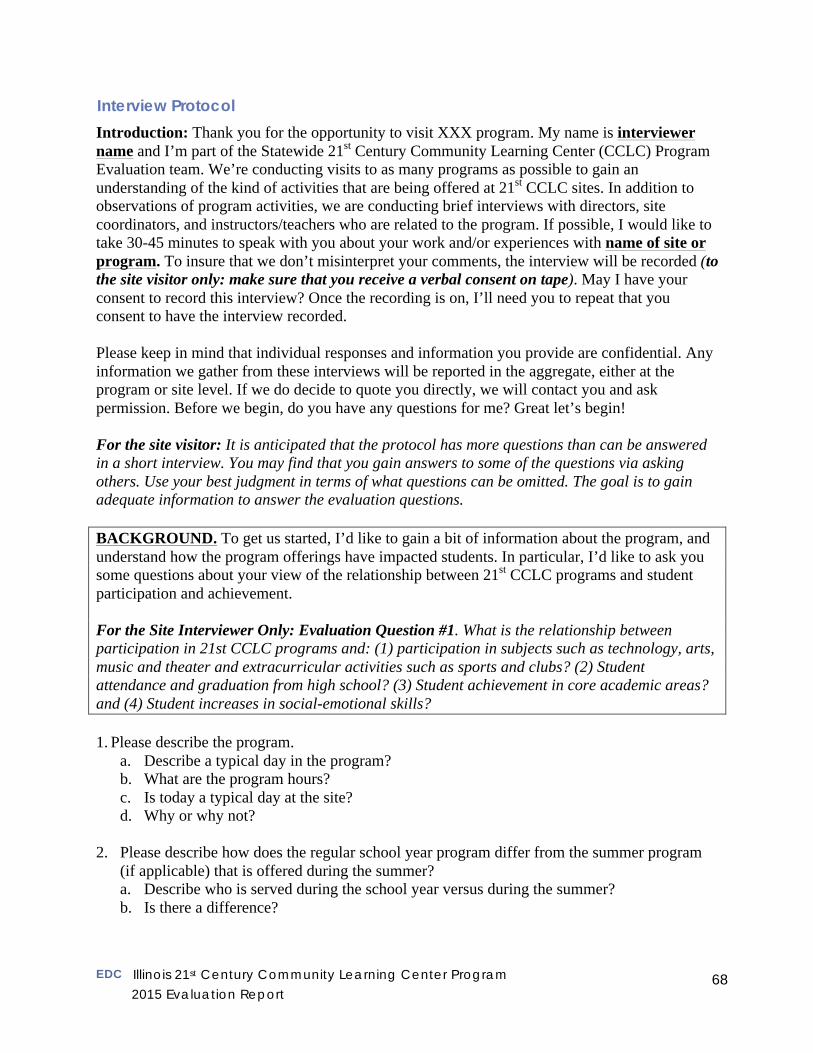
EDC Illinois 21st Century Community Learning Center Program
2015 Evaluation Report 68
Interview Protocol
Introduction: Thank you for the opportunity to visit XXX program. My name is interviewer name and I’m part of the Statewide 21st Century Community Learning Center (CCLC) Program Evaluation team. We’re conducting visits to as many programs as possible to gain an understanding of the kind of activities that are being offered at 21st CCLC sites. In addition to observations of program activities, we are conducting brief interviews with directors, site coordinators, and instructors/teachers who are related to the program. If possible, I would like to take 30-45 minutes to speak with you about your work and/or experiences with name of site or program. To insure that we don’t misinterpret your comments, the interview will be recorded (to the site visitor only: make sure that you receive a verbal consent on tape). May I have your consent to record this interview? Once the recording is on, I’ll need you to repeat that you consent to have the interview recorded. Please keep in mind that individual responses and information you provide are confidential. Any information we gather from these interviews will be reported in the aggregate, either at the program or site level. If we do decide to quote you directly, we will contact you and ask permission. Before we begin, do you have any questions for me? Great let’s begin! For the site visitor: It is anticipated that the protocol has more questions than can be answered in a short interview. You may find that you gain answers to some of the questions via asking others. Use your best judgment in terms of what questions can be omitted. The goal is to gain adequate information to answer the evaluation questions. BACKGROUND. To get us started, I’d like to gain a bit of information about the program, and understand how the program offerings have impacted students. In particular, I’d like to ask you some questions about your view of the relationship between 21st CCLC programs and student participation and achievement. For the Site Interviewer Only: Evaluation Question #1. What is the relationship between participation in 21st CCLC programs and: (1) participation in subjects such as technology, arts, music and theater and extracurricular activities such as sports and clubs? (2) Student attendance and graduation from high school? (3) Student achievement in core academic areas? and (4) Student increases in social-emotional skills? 1. Please describe the program.
a. Describe a typical day in the program? b. What are the program hours? c. Is today a typical day at the site? d. Why or why not?
2. Please describe how does the regular school year program differ from the summer program
(if applicable) that is offered during the summer? a. Describe who is served during the school year versus during the summer? b. Is there a difference?
EDC Illinois 21st Century Community Learning Center Program
2015 Evaluation Report 69
3. Please describe the students you serve. On average, how many students do you serve? 4. Please describe the ways the program integrates math, reading, and the state standards into
the program, if at all? 5. Is one of your goals to increase graduation rates? If so, please describe what types of data
you have for it? 6. In what ways does the program influence student performance and achievement in core
academic areas? How is this accomplished? 7. What kinds of academic changes have you noticed in students who attend the program? What
kinds of behavioral changes have you noticed? 8. Overall, in your opinion, are students benefitting from the program?
Probes • In what ways? Do you have an example or two? • Is the program addressing the needs of students? • And how do you assess the needs of the students? • What are the successes of the program? What are the challenges?
BACKGROUND. Thank you for your answers concerning the program! Now I’d like to gain information about the families and communities you serve. For the Site Interviewer Only: Evaluation Question #2 Are CCLC programs working toward being inclusive of families? In what ways? What are the characteristics of students and families served by the subgrantee? Do the students and families served represent those with the greatest need for services? 1. Please describe the communities and families you serve? 2. Please describe the types of services that are being offered by the program you sponsor? 3. Please describe how you involve parents and families in program activities? Are there
activities specifically designed to address the needs of parents and families? 4. Please describe how you interact with parents and in what ways? In general, how would you
describe the relationship between the program staff and families? 5. Please describe the successes and challenges of involving parents and families in the
program?
EDC Illinois 21st Century Community Learning Center Program
2015 Evaluation Report 70
BACKGROUND. Thank you for your answers to the previous questions! So now I’d like to find out about a little bit about how you keep up with new developments in afterschool programming. For the Site Interviewer Only: Evaluation Question #3. What professional development and training opportunities are available to program personnel? Are these aligned with the NCLB and NSD development standards? Are the PD and training opportunities available related to effective CCLC program implementation? Do these learning opportunities help personnel successfully implement statewide goals?
1. Please describe the staff of the program.
Probes: • How many staff are part of the program? • Do they all work during the program hours? • What are their backgrounds and roles? • What training do they receive?
2. Have professional development opportunities been offered for program staff? Please describe
these opportunities?
3. What else would you like to see in terms of PD that’s not offered now? Does the current staff training allow for this addition?
4. Please describe how familiar the staff is with the state standards? Please describe any specific training that has been developed to specifically address the standards?
5. Is the staff prepared to develop activities that match the needs of communities and students in which the program is operating? Please describe how the staff has been prepared?
BACKGROUND. Thank you for your answers, we’re almost done. I want to talk with you about the ability to meet the program’s unique objectives as well as the statewide objectives. For the Site Interviewer Only: Evaluation Question #4. Are subgrantees making progress toward meeting stated program goals? What program goals are identified by each subgrantee and how these relate to Illinois 21st CCLC program objectives? Are these in alignment with 21st CCLC program objectives?
1. Please describe the specific goals of the program? Probes: Are the goals in line with the goals and statewide objectives? Why or why not?
2. Please describe how you are measuring the impact of your program? a. Describe the program’s evaluation strategy. b. Are you working with an external evaluation professional?
EDC Illinois 21st Century Community Learning Center Program
2015 Evaluation Report 71
c. If yes, please describe how this is working out. 3. Has a sustainability plan been developed in regards to the program? 4. Please describe what could be changed about your program, if anything? 5. What have I not asked that you would like to share?
Final Comments. That’s it! Thank you for your time and consideration. The information you provide will help us gain a better understanding of the your Program. Please feel free to contact me if you have any additional questions (provide interviewee a business card and/or contact information).
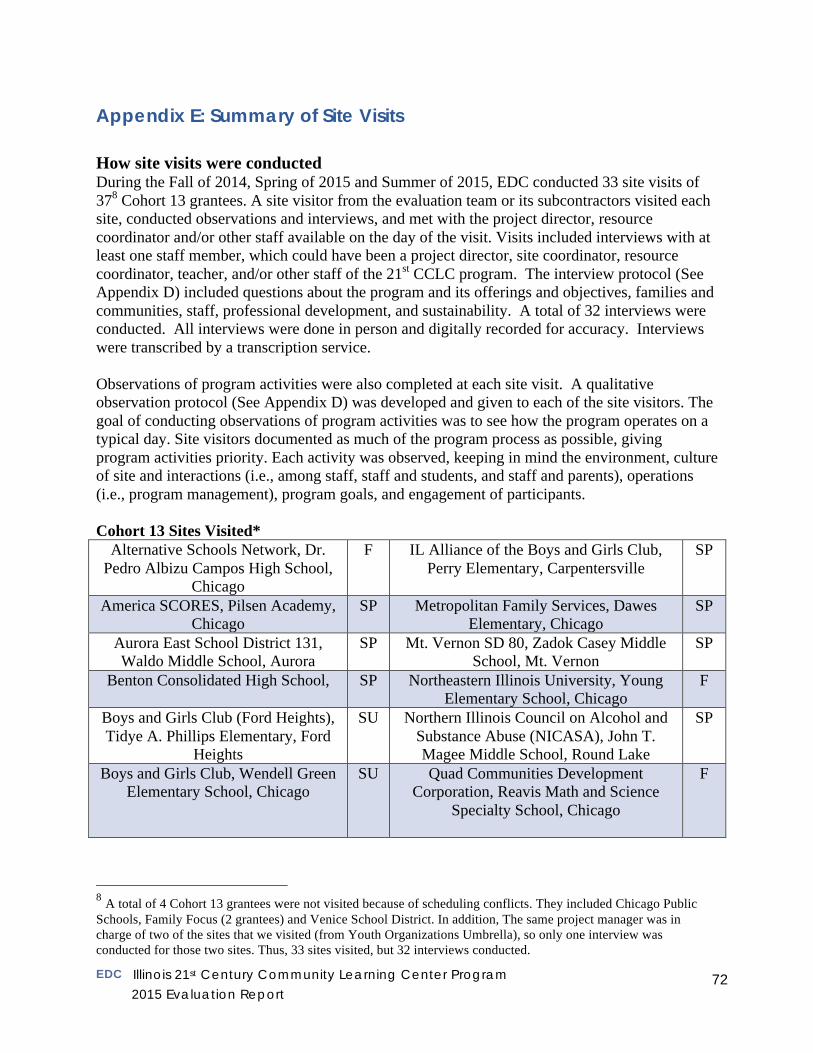
EDC Illinois 21st Century Community Learning Center Program
2015 Evaluation Report 72
Appendix E: Summary of Site Visits How site visits were conducted During the Fall of 2014, Spring of 2015 and Summer of 2015, EDC conducted 33 site visits of 378 Cohort 13 grantees. A site visitor from the evaluation team or its subcontractors visited each site, conducted observations and interviews, and met with the project director, resource coordinator and/or other staff available on the day of the visit. Visits included interviews with at least one staff member, which could have been a project director, site coordinator, resource coordinator, teacher, and/or other staff of the 21st CCLC program. The interview protocol (See Appendix D) included questions about the program and its offerings and objectives, families and communities, staff, professional development, and sustainability. A total of 32 interviews were conducted. All interviews were done in person and digitally recorded for accuracy. Interviews were transcribed by a transcription service. Observations of program activities were also completed at each site visit. A qualitative observation protocol (See Appendix D) was developed and given to each of the site visitors. The goal of conducting observations of program activities was to see how the program operates on a typical day. Site visitors documented as much of the program process as possible, giving program activities priority. Each activity was observed, keeping in mind the environment, culture of site and interactions (i.e., among staff, staff and students, and staff and parents), operations (i.e., program management), program goals, and engagement of participants. Cohort 13 Sites Visited*
Alternative Schools Network, Dr. Pedro Albizu Campos High School,
Chicago
F IL Alliance of the Boys and Girls Club, Perry Elementary, Carpentersville
SP
America SCORES, Pilsen Academy, Chicago
SP Metropolitan Family Services, Dawes Elementary, Chicago
SP
Aurora East School District 131, Waldo Middle School, Aurora
SP Mt. Vernon SD 80, Zadok Casey Middle School, Mt. Vernon
SP
Benton Consolidated High School, SP Northeastern Illinois University, Young Elementary School, Chicago
F
Boys and Girls Club (Ford Heights), Tidye A. Phillips Elementary, Ford
Heights
SU Northern Illinois Council on Alcohol and Substance Abuse (NICASA), John T. Magee Middle School, Round Lake
SP
Boys and Girls Club, Wendell Green Elementary School, Chicago
SU Quad Communities Development Corporation, Reavis Math and Science
Specialty School, Chicago
F
8 A total of 4 Cohort 13 grantees were not visited because of scheduling conflicts. They included Chicago Public Schools, Family Focus (2 grantees) and Venice School District. In addition, The same project manager was in charge of two of the sites that we visited (from Youth Organizations Umbrella), so only one interview was conducted for those two sites. Thus, 33 sites visited, but 32 interviews conducted.
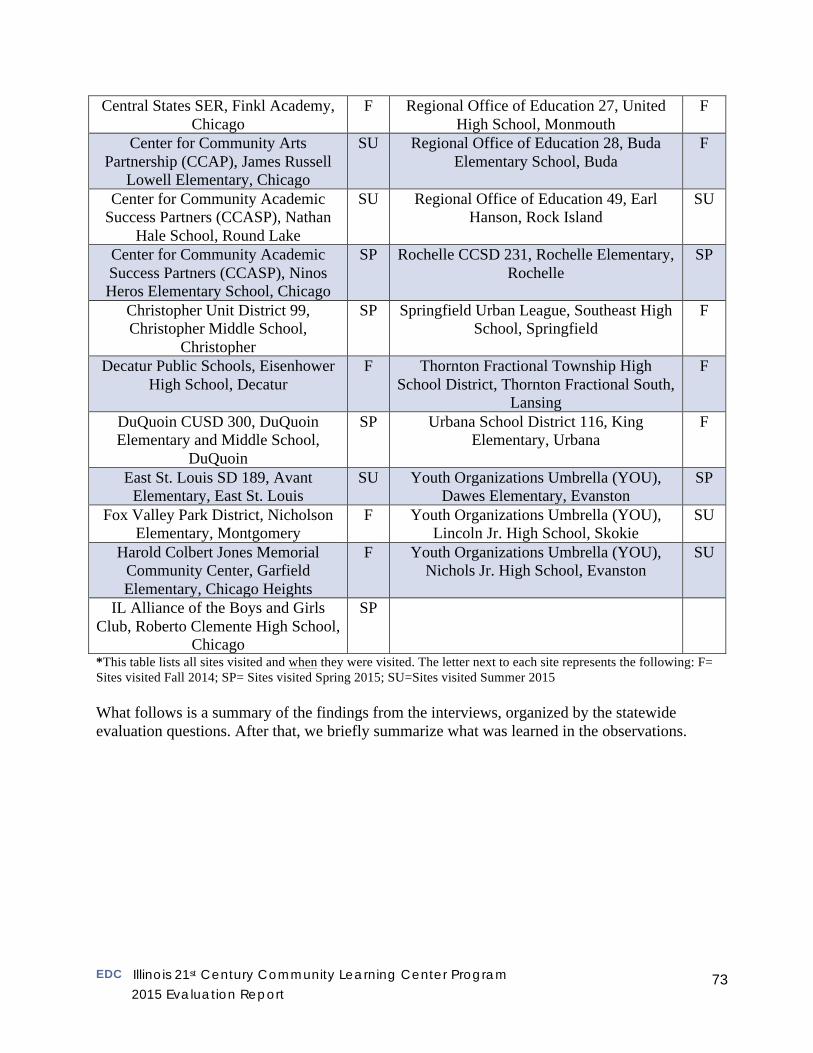
EDC Illinois 21st Century Community Learning Center Program
2015 Evaluation Report 73
Central States SER, Finkl Academy, Chicago
F Regional Office of Education 27, United High School, Monmouth
F
Center for Community Arts Partnership (CCAP), James Russell
Lowell Elementary, Chicago
SU Regional Office of Education 28, Buda Elementary School, Buda
F
Center for Community Academic Success Partners (CCASP), Nathan
Hale School, Round Lake
SU Regional Office of Education 49, Earl Hanson, Rock Island
SU
Center for Community Academic Success Partners (CCASP), Ninos Heros Elementary School, Chicago
SP Rochelle CCSD 231, Rochelle Elementary, Rochelle
SP
Christopher Unit District 99, Christopher Middle School,
Christopher
SP Springfield Urban League, Southeast High School, Springfield
F
Decatur Public Schools, Eisenhower High School, Decatur
F Thornton Fractional Township High School District, Thornton Fractional South,
Lansing
F
DuQuoin CUSD 300, DuQuoin Elementary and Middle School,
DuQuoin
SP Urbana School District 116, King Elementary, Urbana
F
East St. Louis SD 189, Avant Elementary, East St. Louis
SU Youth Organizations Umbrella (YOU), Dawes Elementary, Evanston
SP
Fox Valley Park District, Nicholson Elementary, Montgomery
F Youth Organizations Umbrella (YOU), Lincoln Jr. High School, Skokie
SU
Harold Colbert Jones Memorial Community Center, Garfield Elementary, Chicago Heights
F Youth Organizations Umbrella (YOU), Nichols Jr. High School, Evanston
SU
IL Alliance of the Boys and Girls Club, Roberto Clemente High School,
Chicago
SP
*This table lists all sites visited and when they were visited. The letter next to each site represents the following: F= Sites visited Fall 2014; SP= Sites visited Spring 2015; SU=Sites visited Summer 2015 What follows is a summary of the findings from the interviews, organized by the statewide evaluation questions. After that, we briefly summarize what was learned in the observations.
EDC Illinois 21st Century Community Learning Center Program
2015 Evaluation Report 74
Interviews EQ1: What is the relationship between participation in 21st CCLC programs and:
• Student achievement in core academic areas? • Participation in subjects such as technology, arts, music and theater and
extracurricular activities such as sports and clubs? • Student attendance and graduation from high school? • Student increases in social-emotional skills?
Student achievement Programs reported that they saw improvements in student achievement in core academic areas among the students that participated in the 21st CCLC program. Many mentioned that they saw gains in achievement, specifically in reading and math. They also suggested that their program helped students pass their classes. Some programs also reported that they aligned the academic component of their program to the Common Core standards and that the positive impact they saw was due to their academic programming. All programs reported that they offered some form of academic programming (e.g., homework help, tutoring, guided reading, academic math, creative writing). One site stated: “We focus on academic support. That includes remediation activities, homework help, individual/group tutoring. And we also provide students with high-yield learning activities or opportunities. “ In relation to student achievement specifically, there were reports of positive effects on student achievement: “He’s been here for probably four years now. He was a below average student. He went from bringing his grades up from F’s to becoming an A, B, C student by just finally sitting down during Power Hour and doing his school work, and asking for help. So that’s one thing that this year has really made me feel really well to see him improve that much with his grades.” “And in terms of grade gains… it was almost twice as much for math for students that stayed in the after-school program, like 1.2 years maybe over six months. So the non-attenders or those who attended less than thirty days were grouped together. And they had a 4. -- yeah, a 4.8 I guess it looks like. And those who attended thirty days or more had a 7.2 reading gain.” Participation in core subjects and other activities All of the sites visited offered enrichment activities, which provided participants with a wide range of activities from which to choose. For example, one site offered story telling, technology and martial arts as part of their afterschool programming. Many sites offered some form of STEM-related programming. One site had a partnership with a local university, which offered their students a robotics program. This activity was well attended and seen as successful. Another site focused their enrichment activities on health and wellness, offering a class on healthy habits in which students learned about healthy eating and how to cook healthy meals for their family. Another site also offered a gardening class where students actually worked on a
EDC Illinois 21st Century Community Learning Center Program
2015 Evaluation Report 75
garden on-site and learned how to plant different vegetables. “The enrichment classes that we have going on right now seems to me they have a strong emphasis in both science and technology with problem solving. But the elementary level, a smattering of fine arts, too. We have an art class, mind craft class, drama and Spanish. At the middle school we currently have creative writing, chess, mind craft, science club, art club, genius are, and arts and crafts. So like I said there is a pretty heavy emphasis on science, technology and problem solving.” Overall, every site offered some form of enrichment activities based on student interests. All sites had some form of fitness or physical activity classes, while some offered dance or culturally focused activities. Student attendance and graduation Through the interviews, sites were able to shed some light on how the 21st CCLC program may positively influence student attendance and graduation. One site mentioned that in order for students to participate in their program they have to come to school that day. This enhanced both the school’s attendance and the attendance for the afterschool program. Another site aligned their program goals with graduation rate, stating: “The goals of the program specifically are aligned around graduation rate. We're attempting to use attendance/behavior data, family engagement participation, and school day grades in order to ensure that the 21st Century students are on track to graduate. And after twelfth grade, in addition too, be successful in college.” All sites mentioned that their students were excited and enthusiastic about attending the afterschool program. One site mentioned that their attendance had grown in the last year. Another site suggested that they thought that the program was contributing to their 90% graduation rate and 94% attendance rate. All sites reported that they were striving to increase their attendance Social emotional skills In discussing social emotional skills and learning, many interviewees suggested that they were seeing changes in students’ behavior. For example, one site mentioned that they have seen more self-confidence and improvement in their students’ behaviors and attitudes. In addition, many sites offered activities that focused on social and emotional skills. For example, one site had a partnership with their local YMCA, which offered a weekly violence prevention class that taught students how to resolve conflict without resorting to violence. Another site offered a class that focused on meditation and conflict resolution. Sites also mentioned the positive relationships they saw between students and staff. One site stated: “The afterschool activities allow for those social relationships to be built and that translates into feeling safe and building friendships. So I think that’s a big part of it is the social aspect to the afterschool. They’re really benefiting from that.”
EDC Illinois 21st Century Community Learning Center Program
2015 Evaluation Report 76
One particular site offered a social emotional group, which focused on teaching students about appropriate social skills, identifying and managing anger and emotions, and it provided students with an on-site psychologist that works with the students in a group setting. Overall, all 21st CCLC sites reported high rates of participation from their students in core and non-core academic subjects, such as technology and the arts. According to those interviewed for the site visits, increased participation in their programs has shown to have positive affects on student achievement, attendance and graduation rates. All of the sites attributed student achievement in school to participation in 21st CCLC program activities. Sites were also starting to see the positive behavioral changes they hoped would come from implementing programs focused on social-emotional skills. EQ 2: Are CCLC programs working toward being inclusive of families? In what ways? What are the characteristics of students and families served by the subgrantee? Do the students and families served represent those with the greatest need for services? In terms of participant demographics, most sites reported that they served mostly African American and Latino students from low-income families. One site reported that they served Latino, African American, European, Nigerian and Arabic students. Most sites also reported that the majority of their students received free or reduced priced lunch. Therefore, many sites offered meals in addition to snacks as part of their afterschool program. To meet the needs of these students and their families, some sites offered specific programming. For example, sites offered programs to parents such as ESL and GED classes and classes to help parents learn about cyber bullying and dropout prevention. Other sites offered fitness and computer classes for parents. One site that served young parents offered a day care at their school so that students were able to attend school and the afterschool program. Sites reported that parent engagement or involvement was an important priority in their work. Most sites stated that getting parents involved in some way was a goal of the program. For example, some sites had monthly parent nights, which varied in content. One site mentioned that for their parent nights they partnered with a local family center that came in and recruited parents to become part of certification programs. Workshops and family reading nights, in which teachers came in and taught parents different reading skills that they can utilize at home with their children, were also popular. Overall, the majority of the sites offered some form of activity or programs to involve and engage parents. There were also challenges that sites reported in involving and engaging parents. One common challenge was in getting parents to attend activities and programs. One site mentioned that parents were busy with multiple jobs and they just didn’t have the time in their schedule to attend parent activities. Another site mentioned that due to the language barrier it became a challenge to communicate with parents on activities that would benefit them. A staff member from one of the sites described some of the challenges of involving parents: “The challenges, when I first started we tried to put on a program. It was in the winter. Parents,
EDC Illinois 21st Century Community Learning Center Program
2015 Evaluation Report 77
in the rural area, they have a hard time coming back out of their houses for something once they’re already home. So it’s been a challenge getting just them in the door.” In summary, all sites had some form of activities or programs that they offered to parents. Because many of the sites served Latino families from low-income homes they offered programming in both English and Spanish or even ESL classes. Other sites had parent engagement as part of their program goals and were working toward finding ways to involve and engage parents. Among the challenges expressed by sites in getting parents involved, scheduling and communication were the most commonly cited. EQ3: What professional development and training opportunities are available to program personnel? Professional development (PD) opportunities were offered in some capacity to program personnel at all of the sites that were visited. There were a variety of PD opportunities available to program personnel, ranging from those focused on Common Core to those focused on discipline. The quantity and type of PD offered to staff varied by site. Sites mentioned that they found the PD offered by the Illinois State Board of Education to be very useful. One site mentioned: “So we’ve had the professional development conferences with the 21st Century sites. Like three or four conferences with the 21st Century staff and webinars, the 21st Century program has done a good job I think with providing webinars to those project directors and the site coordinators.” Below is a list of examples of PD topic areas offered to staff and personnel:
• 21st CCLC PD offered by ISBE • Safety training • Policies and Procedures • Retention • Classroom Management Strategies • Bullying • Curriculum development • Social and emotional learning • Discipline training • Trainings on Common Core
One site stated that they were fortunate to have a professional development director who has monthly trainings on a variety of topics related to their program. Another site offered their teachers a three-day training with a LEGO educator from Texas. Another site offered PD related to bilingual and bicultural education to better serve their students. Many sites mentioned training on the Common Core standards. Other sites mentioned that they utilized the PD that is offered through their school district or their host organization. Sites were also asked about PD needs and opportunities that they would like to see offered. One site mentioned that they would like to see PD geared toward newcomer families. Another site
EDC Illinois 21st Century Community Learning Center Program
2015 Evaluation Report 78
suggested PD offered on how to better serve students who have mental illness. A few sites mentioned that there have been some challenges when it comes to PD offerings. One site mentioned that they wish that the PD offered was at a time (and pay rate) that encouraged staff to attend. Another site mentioned that funding has been an issue and that they didn’t have the funds to send their staff for PD opportunities. In summary, all of the sites offered some form of PD to their program staff. The PD offerings varied by site and by topic. Some of the PD offerings were specific to that site, such as service learning or youth development. There were also PD opportunities that were offered by the organization managing the grant. These opportunities focused on discipline, creative writing and retention of students. Other sites offered opportunities that were more academically focused, such as in reading and math. Overall, most sites mentioned that they attend the conferences given by ISBE. EQ 4: Are subgrantees making progress toward meeting stated program goals? During the interviews, sites pointed out that their program goals were aligned with the 21st CCLC program objectives. The most common goals mentioned were academic achievement, attendance and social emotional learning. Other goals mentioned included increasing students’ math and reading scores and developing creative problem solving and critical thinking skills. Parent involvement was an important goal for many sites. For example, one site mentioned that they were focusing on parent awareness and offering opportunities to inform parents on what is going on in school, which site staff felt was creating opportunities for their staff to know parents on a personal level. The program goals mentioned by sites included:
• Academic Achievement • Increase Graduation Rates • Communication • Increasing Test Scores • Critical Thinking Skills • Parent Involvement • Improve Behavior • Reduce Disciplinary Problems • Increase Attendance • Social-emotional Learning • Increase Community Partnerships • Sustainability
We also asked sites during the interviews if and how they were measuring impact. Most sites stated that they were measuring impact in some way. Those who did measure impact primarily used various types of surveys. For example, one site used surveys that were administered by their local evaluator. Another site used teacher, youth and parent surveys, along with grades, and standardized test scores, which were all analyzed together to inform the program. The sites that reported that they were measuring impact all stated that their goals were aligned with the state goals. One way they were tracking their impact was by tracking student test scores. EQ5: How are 21st CCLC Programs using the funding?
• What plans do 21st CCLC Programs have for sustainability? • How are they defining sustainability?
EDC Illinois 21st Century Community Learning Center Program
2015 Evaluation Report 79
• In what ways are 21st CCLC programs partnering, collaborating and working wit federal funding sources, agencies, and other community partnerships to foster sustainability?
When asked about funding, collaboration, and sustainability plans, most of the sites visited stated that they either have a sustainability plan in place or are working toward having one for their afterschool program. Some sites mentioned that one of their goals for sustainability was to develop stronger partnerships. For example, one site mentioned that part of their sustainability plan was to leverage their relationship with After School Matters to provide more instructors for their program. Another site mentioned that they had a sustainability plan in place that was supported by their administration and included strong partnerships with other organizations. Other sites mentioned that funding was a big part of their sustainability plan and that they were finding other sources of funding for their program. Partnerships were a common theme among those interviewed. One grantee stated that they had partnerships with community agencies which provided community service opportunities for both students and parents. A number of sites had also partnered with local colleges and universities, which increased the number of different programs they offered their students and parents. For example, one site partnered with a university that offered ESL and GED courses for parents. Another site had a partnership with a local college that provides a professor who taught a western civilization course in their afterschool program. Other types of partnerships that were mentioned by sites included partnerships with consulting firms, community based organizations, foundations, park districts, churches and heath clinics. For some sites, sustainability was a challenge. Some sites had meetings and discussions with program staff and leadership on ways they could create partnerships or raise funds to sustain the program after the grant funding ends. For example one site has a capital campaign in place in which they were seeking a lot of private funding as a way to sustain their program. While another site was looking at sustainability more broadly and focusing on community partners for the entire school district. In short, sites were thinking about sustainability. Although all sites mentioned that this was an area of challenge, many are hopeful that the partnerships they developed and the funds they raised would sustain their programs after the 21st CCLC grant funding ends. Observations Observations of program activities were completed during each site visit. Since some of the site visits were conducted in the Summer, much of what was observed were enrichment activities with some layers of academically-focused activities. The sites visited during the Fall and Spring offered both academically and enrichment activities for their students. There are limitations in these observations:
1. Sites were only visited once, and therefore there may have been activities that were not observed because they were not being offered on the day of the visit.
EDC Illinois 21st Century Community Learning Center Program
2015 Evaluation Report 80
2. Since we only observed activities (and not planning time or other meetings), we are only able to report on what was observed and cannot make inferences on the actual planning and preparation of these activities.
For the visits, a number of factors were observed (as per the observation guide): organizational structure and staff, description of the actual space, types of programming offered, activities observed, and culture and climate of the site. All of these factors in combination with the interviews encompassed one site visit and gave us a glimpse of a typical day at a 21st CCLC program. The sites that were visited served a range of students from as few as 30 students to as many as 1000 students. Organizational structure The organizational structure of the sites we visited had some similarities. All sites had a project director and site coordinator. We noticed the sites were fully staffed, with a variety of teachers, support staff and volunteers (which included both youth and parent volunteers, mostly during the summer programs). Some sites offered a hot meal as part of their program. All sites offered a variety of different activities for their students and many offered programs and activities specifically for parents. The management of the grant varied by site, which included being managed by school districts, other organizations (e.g., community based organizations, non-profits), but the majority of sites visited were being held at a public school. Types of program activities Program activities varied across all sites. The sites visited during the Summer mostly offered enrichment focused activities, while sites that were visited during the Fall and Spring incorporated an academic component into their afterschool program. Summer programs were offered for longer periods of time (i.e., for more hours in once session, and for more days per week) than a typical afterschool program that was being offered in the Fall and Spring. For example, the summer programs were offered all day 4-5 times a week for 5-6 weeks in length, whereas afterschool program offerings were offered anywhere from 2-3 hours after school. The enrichment and academic activities varied across sites we visited. For example, one site offered a videography class that had students watch and critique movies. Another site offered a technology course. All sites we visited during the Fall and Spring offered some form of homework help or tutoring component. One site offered a theatre program in which students learned how to do improvisation. Many sites offered some form of physical activity or fitness class, such as volleyball, basketball, dance, and martial arts. Others offered health and wellness activities that focused on healthy eating, cooking or gardening. Academic activities that were observed included homework/tutoring, ACT prep and STEM-related activities. Examples of activities observed included: • Technology class • Physical education • Storytelling • Art • Computer programming • Tutoring • Western civilization • Dance • Health • Academic Skill Testing • Community service club • Theatre • Cooking • Career Preparation • Writing Lab • Science exploration • Character development • Guitar Lessons
EDC Illinois 21st Century Community Learning Center Program
2015 Evaluation Report 81
• Track and field • Journalism • Social Studies • Math class • Spanish Club • Paper Mache • Latch Hook • Origami • Poetry Slam
Culture and climate of programs The culture and climate of these sites were reflective of the individual missions of the grantees. All of the site visitors described the culture and climate of the sites in a very positive manner. For example, one site was described as an environment in which students were able to be expressive and the activities flowed smoothly. Teachers and students were engaged in all of the activities that were observed. Students seemed comfortable and excited to be in the program and there were minimal disciplinary problems observed. Another example from a site visitor who stated that:
• “It appeared as if all team members of this grant are striving to provide the best for these students through enhanced academics and enrichment. Positive attitudes and dedication to the students is evident from all that I talked with including students, faculty, and staff.”
Overall, Site visitors described the learning environment in the sites as supportive and conducive to learning. The staff was described as very engaged with the activities and students seemed to have positive relationships with the teachers and other staff of the program. From our site visits we surmised that the 21st CCLC grantees were providing an environment that is safe and one that was focused on academics and on the interests of the students. Summary In summary the site visits that were conducted in Fall 2014, Spring 2015 and Summer 2015 gave us a clearer and better understanding of the 21st CCLC program, the types of activities offered and the students and families that were served. Many grantees reported seeing improvements not only in student achievement but also in their social and emotional growth. Sites also reported improvements in their relationship with and engagement of parents and families. All of the sites believed they were reaching students and families in need and activities offered were helping their students grow and succeed in school.
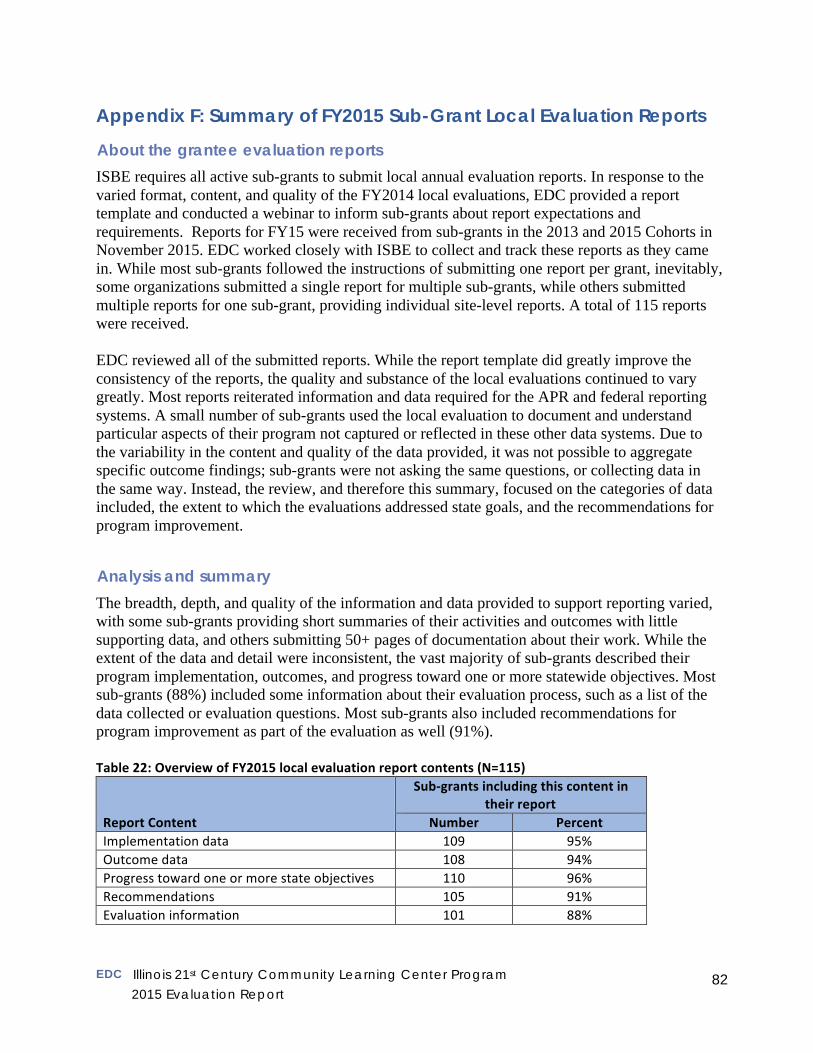
EDC Illinois 21st Century Community Learning Center Program
2015 Evaluation Report 82
Appendix F: Summary of FY2015 Sub-Grant Local Evaluation Reports
About the grantee evaluation reports
ISBE requires all active sub-grants to submit local annual evaluation reports. In response to the varied format, content, and quality of the FY2014 local evaluations, EDC provided a report template and conducted a webinar to inform sub-grants about report expectations and requirements. Reports for FY15 were received from sub-grants in the 2013 and 2015 Cohorts in November 2015. EDC worked closely with ISBE to collect and track these reports as they came in. While most sub-grants followed the instructions of submitting one report per grant, inevitably, some organizations submitted a single report for multiple sub-grants, while others submitted multiple reports for one sub-grant, providing individual site-level reports. A total of 115 reports were received. EDC reviewed all of the submitted reports. While the report template did greatly improve the consistency of the reports, the quality and substance of the local evaluations continued to vary greatly. Most reports reiterated information and data required for the APR and federal reporting systems. A small number of sub-grants used the local evaluation to document and understand particular aspects of their program not captured or reflected in these other data systems. Due to the variability in the content and quality of the data provided, it was not possible to aggregate specific outcome findings; sub-grants were not asking the same questions, or collecting data in the same way. Instead, the review, and therefore this summary, focused on the categories of data included, the extent to which the evaluations addressed state goals, and the recommendations for program improvement.
Analysis and summary
The breadth, depth, and quality of the information and data provided to support reporting varied, with some sub-grants providing short summaries of their activities and outcomes with little supporting data, and others submitting 50+ pages of documentation about their work. While the extent of the data and detail were inconsistent, the vast majority of sub-grants described their program implementation, outcomes, and progress toward one or more statewide objectives. Most sub-grants (88%) included some information about their evaluation process, such as a list of the data collected or evaluation questions. Most sub-grants also included recommendations for program improvement as part of the evaluation as well (91%). Table 22: Overview of FY2015 local evaluation report contents (N=115)
Report Content
Sub-‐grants including this content in their report
Number Percent Implementation data 109 95% Outcome data 108 94% Progress toward one or more state objectives 110 96% Recommendations 105 91% Evaluation information 101 88%
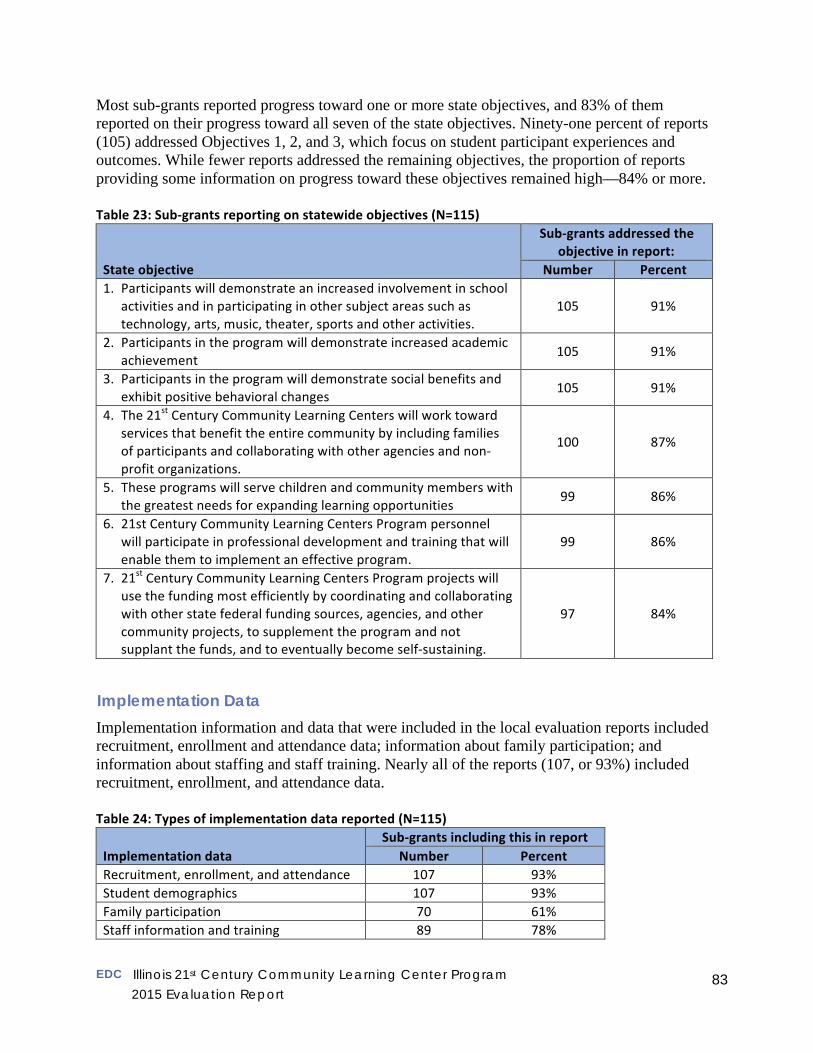
EDC Illinois 21st Century Community Learning Center Program
2015 Evaluation Report 83
Most sub-grants reported progress toward one or more state objectives, and 83% of them reported on their progress toward all seven of the state objectives. Ninety-one percent of reports (105) addressed Objectives 1, 2, and 3, which focus on student participant experiences and outcomes. While fewer reports addressed the remaining objectives, the proportion of reports providing some information on progress toward these objectives remained high—84% or more. Table 23: Sub-‐grants reporting on statewide objectives (N=115)
State objective
Sub-‐grants addressed the objective in report:
Number Percent 1. Participants will demonstrate an increased involvement in school
activities and in participating in other subject areas such as technology, arts, music, theater, sports and other activities.
105 91%
2. Participants in the program will demonstrate increased academic achievement 105 91%
3. Participants in the program will demonstrate social benefits and exhibit positive behavioral changes 105 91%
4. The 21st Century Community Learning Centers will work toward services that benefit the entire community by including families of participants and collaborating with other agencies and non-‐profit organizations.
100 87%
5. These programs will serve children and community members with the greatest needs for expanding learning opportunities 99 86%
6. 21st Century Community Learning Centers Program personnel will participate in professional development and training that will enable them to implement an effective program.
99 86%
7. 21st Century Community Learning Centers Program projects will use the funding most efficiently by coordinating and collaborating with other state federal funding sources, agencies, and other community projects, to supplement the program and not supplant the funds, and to eventually become self-‐sustaining.
97 84%
Implementation Data
Implementation information and data that were included in the local evaluation reports included recruitment, enrollment and attendance data; information about family participation; and information about staffing and staff training. Nearly all of the reports (107, or 93%) included recruitment, enrollment, and attendance data. Table 24: Types of implementation data reported (N=115)
Implementation data Sub-‐grants including this in report
Number Percent Recruitment, enrollment, and attendance 107 93% Student demographics 107 93% Family participation 70 61% Staff information and training 89 78%
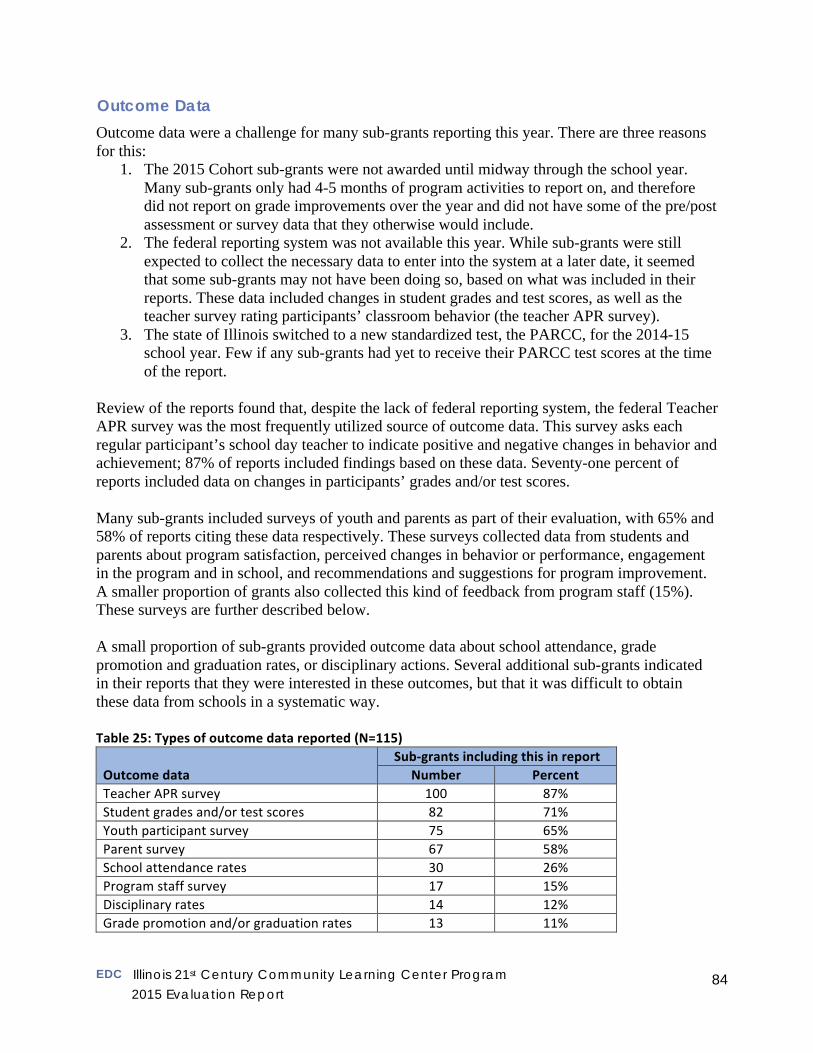
EDC Illinois 21st Century Community Learning Center Program
2015 Evaluation Report 84
Outcome Data
Outcome data were a challenge for many sub-grants reporting this year. There are three reasons for this:
1. The 2015 Cohort sub-grants were not awarded until midway through the school year. Many sub-grants only had 4-5 months of program activities to report on, and therefore did not report on grade improvements over the year and did not have some of the pre/post assessment or survey data that they otherwise would include.
2. The federal reporting system was not available this year. While sub-grants were still expected to collect the necessary data to enter into the system at a later date, it seemed that some sub-grants may not have been doing so, based on what was included in their reports. These data included changes in student grades and test scores, as well as the teacher survey rating participants’ classroom behavior (the teacher APR survey).
3. The state of Illinois switched to a new standardized test, the PARCC, for the 2014-15 school year. Few if any sub-grants had yet to receive their PARCC test scores at the time of the report.
Review of the reports found that, despite the lack of federal reporting system, the federal Teacher APR survey was the most frequently utilized source of outcome data. This survey asks each regular participant’s school day teacher to indicate positive and negative changes in behavior and achievement; 87% of reports included findings based on these data. Seventy-one percent of reports included data on changes in participants’ grades and/or test scores. Many sub-grants included surveys of youth and parents as part of their evaluation, with 65% and 58% of reports citing these data respectively. These surveys collected data from students and parents about program satisfaction, perceived changes in behavior or performance, engagement in the program and in school, and recommendations and suggestions for program improvement. A smaller proportion of grants also collected this kind of feedback from program staff (15%). These surveys are further described below. A small proportion of sub-grants provided outcome data about school attendance, grade promotion and graduation rates, or disciplinary actions. Several additional sub-grants indicated in their reports that they were interested in these outcomes, but that it was difficult to obtain these data from schools in a systematic way. Table 25: Types of outcome data reported (N=115)
Outcome data Sub-‐grants including this in report
Number Percent Teacher APR survey 100 87% Student grades and/or test scores 82 71% Youth participant survey 75 65% Parent survey 67 58% School attendance rates 30 26% Program staff survey 17 15% Disciplinary rates 14 12% Grade promotion and/or graduation rates 13 11%
EDC Illinois 21st Century Community Learning Center Program
2015 Evaluation Report 85
Student, Parent, and Staff Surveys Student surveys: Many evaluation reports (65%) included data from student surveys, contributing to findings with respect to one or more program outcomes/statewide objectives:
• Quality and satisfaction with respect to programming and activities. Example: The activities are interesting to me.
• Quality and satisfaction with respect to environment and staff. Example: I think there is someone available in the program to help me when I need it.
• Self-report on changes in behavior, attitudes, and achievement. Example: I have improved my reading skills.
• Some sites reported that they use the YPQA instrument. • Some sites reported that they surveyed students on health issues and risky behaviors (for
example, using the Youth Risk Behavior Analysis survey) Parent surveys: More than half of the evaluation reports (58%) included data from parent surveys contributing to findings with respect to one or more program outcomes/statewide objectives:
• Parent perception of changes in their child’s behavior, attitudes, and skills. Example: My child is better at completing homework.
• Quality and satisfaction with respect to programming and activities for their child. Example: Communication with the staff has been positive.
• Quality and satisfaction with respect to programming and activities for parents and families.
• Parent engagement in their child’s education. Example: I review my child’s homework regularly.
• Suggestions for program improvement. Staff surveys: A smaller number of evaluation reports (17%) included data from staff surveys contributing to findings with respect to one or more program outcomes/statewide objectives:
• Staff perception of student outcomes, such as behavior, communication skills, and engagement.
• Staff perception of program operations, resources, and support. • Suggestions for program improvement.
Reported Recommendations
As stated above, most evaluation reports (91%) included recommendations for program improvement and future work. Consistent with previous years, parental and family involvement was the most common issue addressed in recommendations, with 63% of the evaluation reports suggesting that sub-grants should focus attention on this. More information about the recommendations as they were described in the reports is included below.
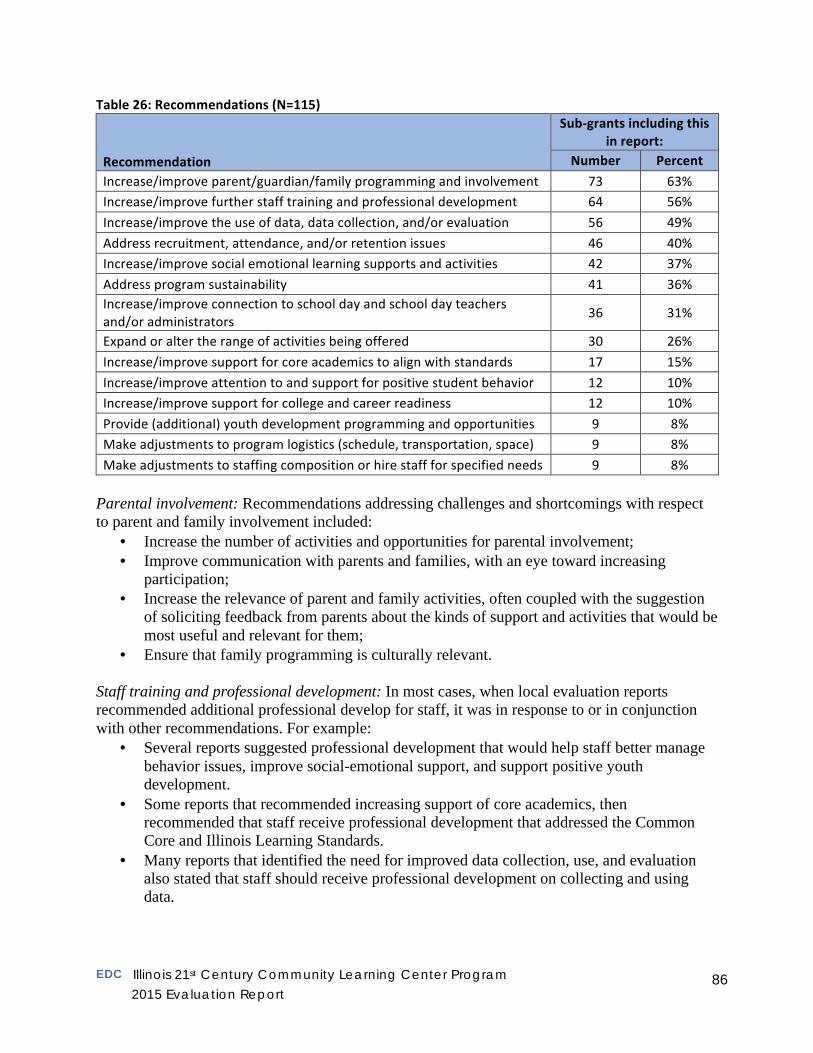
EDC Illinois 21st Century Community Learning Center Program
2015 Evaluation Report 86
Table 26: Recommendations (N=115)
Recommendation
Sub-‐grants including this in report:
Number Percent Increase/improve parent/guardian/family programming and involvement 73 63% Increase/improve further staff training and professional development 64 56% Increase/improve the use of data, data collection, and/or evaluation 56 49% Address recruitment, attendance, and/or retention issues 46 40% Increase/improve social emotional learning supports and activities 42 37% Address program sustainability 41 36% Increase/improve connection to school day and school day teachers and/or administrators 36 31%
Expand or alter the range of activities being offered 30 26% Increase/improve support for core academics to align with standards 17 15% Increase/improve attention to and support for positive student behavior 12 10% Increase/improve support for college and career readiness 12 10% Provide (additional) youth development programming and opportunities 9 8% Make adjustments to program logistics (schedule, transportation, space) 9 8% Make adjustments to staffing composition or hire staff for specified needs 9 8%
Parental involvement: Recommendations addressing challenges and shortcomings with respect to parent and family involvement included:
• Increase the number of activities and opportunities for parental involvement; • Improve communication with parents and families, with an eye toward increasing
participation; • Increase the relevance of parent and family activities, often coupled with the suggestion
of soliciting feedback from parents about the kinds of support and activities that would be most useful and relevant for them;
• Ensure that family programming is culturally relevant. Staff training and professional development: In most cases, when local evaluation reports recommended additional professional develop for staff, it was in response to or in conjunction with other recommendations. For example:
• Several reports suggested professional development that would help staff better manage behavior issues, improve social-emotional support, and support positive youth development.
• Some reports that recommended increasing support of core academics, then recommended that staff receive professional development that addressed the Common Core and Illinois Learning Standards.
• Many reports that identified the need for improved data collection, use, and evaluation also stated that staff should receive professional development on collecting and using data.
EDC Illinois 21st Century Community Learning Center Program
2015 Evaluation Report 87
Data use, data collection, and evaluation: Many evaluation reports cited the need to improve the evaluation and/or improve the data collected and used by programs. In general, developing and using data in a systematic way persists as a challenge across the sub-grants. Specific recommendations included:
• Identify and address challenges to collecting data, including implementation data such as family participation, student outcome and achievement data, and surveys from parents and students;
• Review student data with staff at more regular intervals to monitor student progress and tailor student support;
• Collect baseline data about students to better understand student progress, and identify additional data sources to understand student progress beyond test scores.
Recruitment, attendance and retention: Many evaluation reports indicated in their recommendations that programs need to address issues with respect to recruitment, attendance, and retention. Specific suggestions included:
• Develop recruitment strategies, and focus recruitment on students with the greatest needs; • Work with staff, parents, and students to identify barriers to attendance as well as
incentives to increase attendance; • Solicit input from students on what activities might attract more students and increase
attendance. Social emotional learning: Many reports noted the need for enhanced or increased efforts to improve the social emotional learning of program participants, but few offered specific or concrete recommendation for program improvement. In many cases, this recommendation overlapped with recommendations for supporting more positive student behavior. Recommendations mostly noted general needs:
• Improve capacity to help students develop social emotional competencies; • Expand topics addressed in social emotional learning; • Provide additional activities and services to enhance social emotional learning, such as
groups and counseling services. Sustainability: Many local evaluations recommended that sub-grants engage in activities in support of program sustainability. Recommendations that addressed the issue of sustainability included:
• Develop or increase partnerships with community organizations within and around the school;
• Convene sustainability committee and/or develop a sustainability plan; • Modify programming to better align with long-term goals, needs, and funding streams.
Connection to school day and school day teachers: Many local evaluations recommended that sites develop or improve communication methods and strategies to help program staff and school day teachers and staff share information and update one another about progress and issues with specific students. Recommendations included:
• Improve overall communication about school day content and curriculum to help afterschool activities reinforce academic learning;
EDC Illinois 21st Century Community Learning Center Program
2015 Evaluation Report 88
• Increase regular communication with school day teachers about individual student behavior issues or areas of need.
Expand program activities: Several of the local evaluations that suggested that programs offer additional activities and programming for participants made this recommendation in conjunction with or as a strategy to address other issues—mainly attendance and engagement. Some evaluations suggested that sites solicit input and feedback from students to better design activities that meet their needs and interests, thereby increasing engagement. Support of core academics: Some evaluations, citing limited gains in participants’ academic achievement, recommended that programs increase or improve their support of core academics. Specific suggestions included:
• Provide more time and/or support for homework; • Provide more time/and or support for academic remediation and test prep activities; • Increase alignment with Common Core State Standards;
Support for positive student behavior: Some local evaluation reports recommended that programs work toward improving the behavior of program participants. Specific issues and suggestions related to this included:
• Clarify, communicate, and enforce consistent expectations with respect to behavior; • Add specific activities to support positive behavior, such as team-building activities and
activities to develop communication skills; • Offer incentives for positive and good behaviors;
College and career readiness: A small number of evaluations recommended that sub-grants add or increase activities that address the topic of college and career readiness. Most of these recommendations cited this as a gap in programming, and suggested that sites provide new or additional opportunities for students to learn about and explore colleges and careers. Youth development: A small number of evaluations recommended that sub-grants specifically work to address youth development or incorporate positive youth development activities into their programming. Recommendations suggested youth leadership and mentoring activities along with finding ways to incorporate more youth voice into programming. Program logistics: A small number of evaluations identified specific program implementation issues related to the logistics of the program. These included issues with transportation, scheduling, and space. Staffing: A small number of evaluations identified the needs for additional staff, and recommended specific types of staff to improve program implementation. Examples of recommendations included hiring school day teachers to provide academic support during afterschool and hiring social workers to support social-emotional learning.
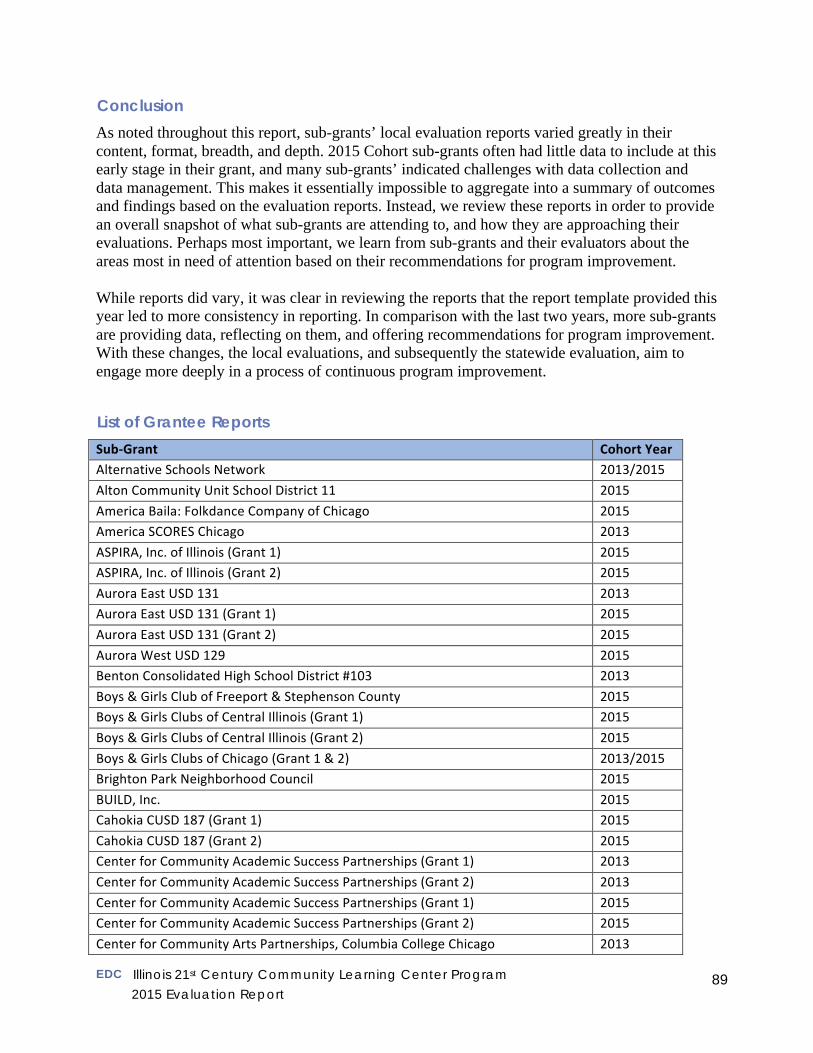
EDC Illinois 21st Century Community Learning Center Program
2015 Evaluation Report 89
Conclusion
As noted throughout this report, sub-grants’ local evaluation reports varied greatly in their content, format, breadth, and depth. 2015 Cohort sub-grants often had little data to include at this early stage in their grant, and many sub-grants’ indicated challenges with data collection and data management. This makes it essentially impossible to aggregate into a summary of outcomes and findings based on the evaluation reports. Instead, we review these reports in order to provide an overall snapshot of what sub-grants are attending to, and how they are approaching their evaluations. Perhaps most important, we learn from sub-grants and their evaluators about the areas most in need of attention based on their recommendations for program improvement. While reports did vary, it was clear in reviewing the reports that the report template provided this year led to more consistency in reporting. In comparison with the last two years, more sub-grants are providing data, reflecting on them, and offering recommendations for program improvement. With these changes, the local evaluations, and subsequently the statewide evaluation, aim to engage more deeply in a process of continuous program improvement.
List of Grantee Reports
Sub-‐Grant Cohort Year Alternative Schools Network 2013/2015 Alton Community Unit School District 11 2015 America Baila: Folkdance Company of Chicago 2015 America SCORES Chicago 2013 ASPIRA, Inc. of Illinois (Grant 1) 2015 ASPIRA, Inc. of Illinois (Grant 2) 2015 Aurora East USD 131 2013 Aurora East USD 131 (Grant 1) 2015 Aurora East USD 131 (Grant 2) 2015 Aurora West USD 129 2015 Benton Consolidated High School District #103 2013 Boys & Girls Club of Freeport & Stephenson County 2015 Boys & Girls Clubs of Central Illinois (Grant 1) 2015 Boys & Girls Clubs of Central Illinois (Grant 2) 2015 Boys & Girls Clubs of Chicago (Grant 1 & 2) 2013/2015 Brighton Park Neighborhood Council 2015 BUILD, Inc. 2015 Cahokia CUSD 187 (Grant 1) 2015 Cahokia CUSD 187 (Grant 2) 2015 Center for Community Academic Success Partnerships (Grant 1) 2013 Center for Community Academic Success Partnerships (Grant 2) 2013 Center for Community Academic Success Partnerships (Grant 1) 2015 Center for Community Academic Success Partnerships (Grant 2) 2015 Center for Community Arts Partnerships, Columbia College Chicago 2013
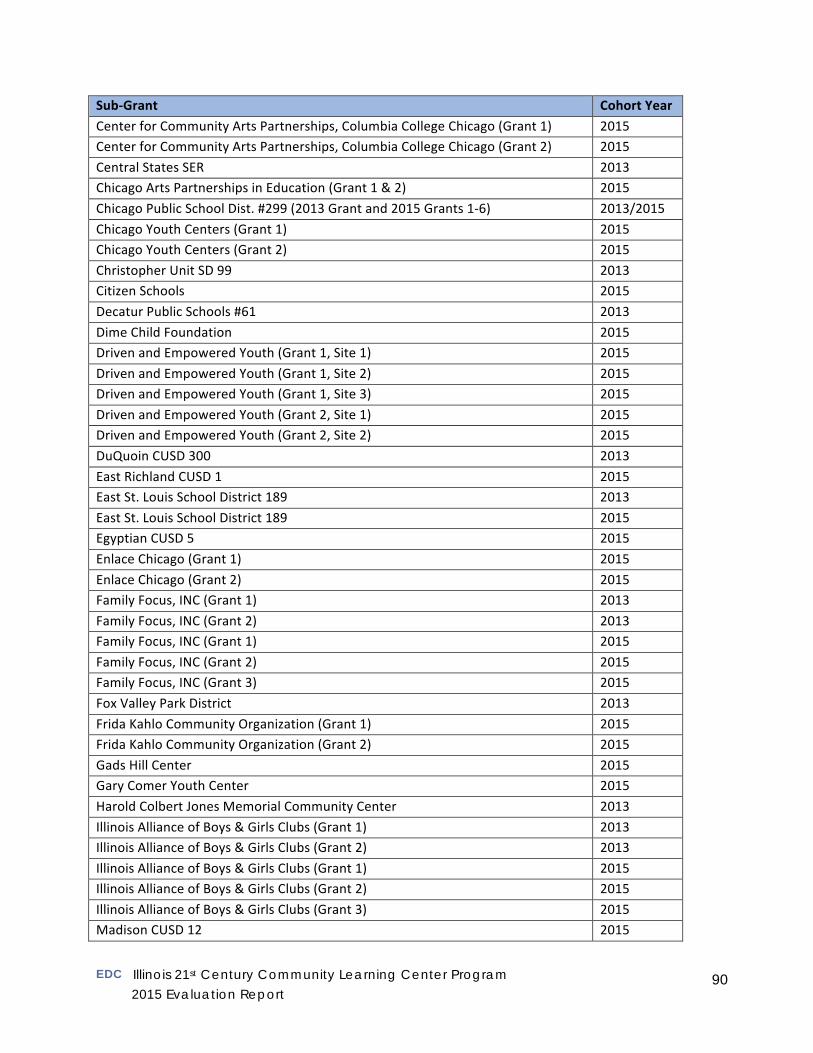
EDC Illinois 21st Century Community Learning Center Program
2015 Evaluation Report 90
Sub-‐Grant Cohort Year Center for Community Arts Partnerships, Columbia College Chicago (Grant 1) 2015 Center for Community Arts Partnerships, Columbia College Chicago (Grant 2) 2015 Central States SER 2013 Chicago Arts Partnerships in Education (Grant 1 & 2) 2015 Chicago Public School Dist. #299 (2013 Grant and 2015 Grants 1-‐6) 2013/2015 Chicago Youth Centers (Grant 1) 2015 Chicago Youth Centers (Grant 2) 2015 Christopher Unit SD 99 2013 Citizen Schools 2015 Decatur Public Schools #61 2013 Dime Child Foundation 2015 Driven and Empowered Youth (Grant 1, Site 1) 2015 Driven and Empowered Youth (Grant 1, Site 2) 2015 Driven and Empowered Youth (Grant 1, Site 3) 2015 Driven and Empowered Youth (Grant 2, Site 1) 2015 Driven and Empowered Youth (Grant 2, Site 2) 2015 DuQuoin CUSD 300 2013 East Richland CUSD 1 2015 East St. Louis School District 189 2013 East St. Louis School District 189 2015 Egyptian CUSD 5 2015 Enlace Chicago (Grant 1) 2015 Enlace Chicago (Grant 2) 2015 Family Focus, INC (Grant 1) 2013 Family Focus, INC (Grant 2) 2013 Family Focus, INC (Grant 1) 2015 Family Focus, INC (Grant 2) 2015 Family Focus, INC (Grant 3) 2015 Fox Valley Park District 2013 Frida Kahlo Community Organization (Grant 1) 2015 Frida Kahlo Community Organization (Grant 2) 2015 Gads Hill Center 2015 Gary Comer Youth Center 2015 Harold Colbert Jones Memorial Community Center 2013 Illinois Alliance of Boys & Girls Clubs (Grant 1) 2013 Illinois Alliance of Boys & Girls Clubs (Grant 2) 2013 Illinois Alliance of Boys & Girls Clubs (Grant 1) 2015 Illinois Alliance of Boys & Girls Clubs (Grant 2) 2015 Illinois Alliance of Boys & Girls Clubs (Grant 3) 2015 Madison CUSD 12 2015
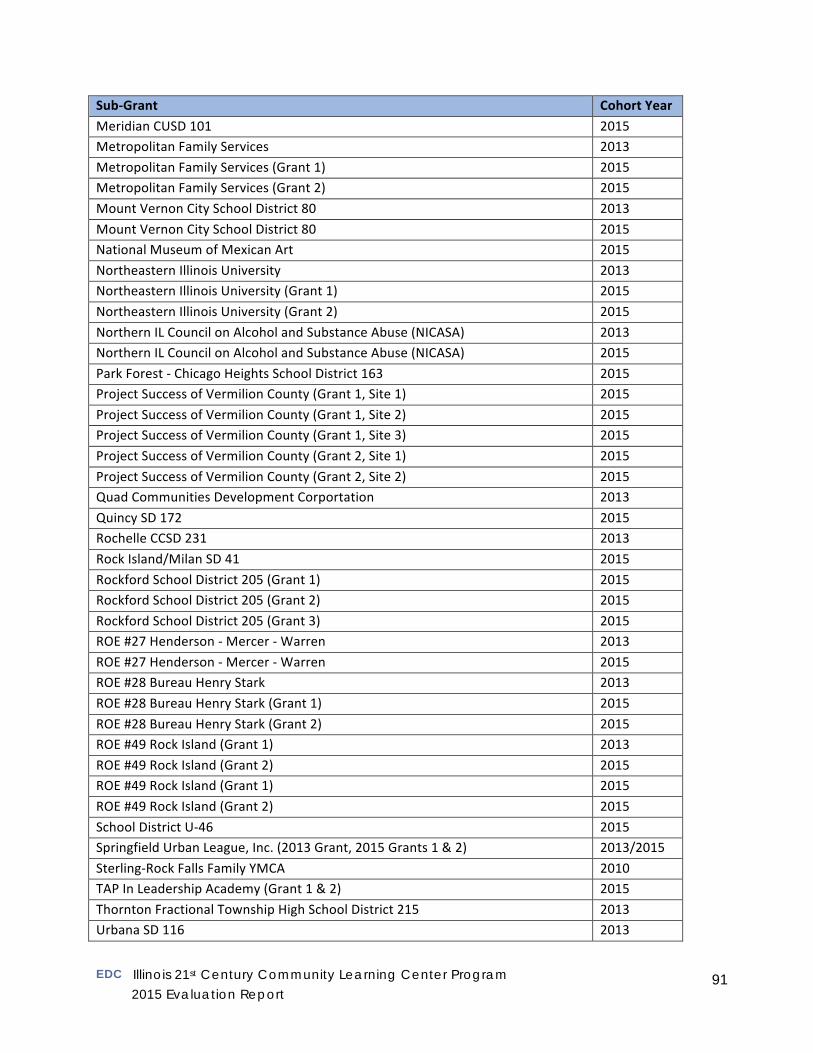
EDC Illinois 21st Century Community Learning Center Program
2015 Evaluation Report 91
Sub-‐Grant Cohort Year Meridian CUSD 101 2015 Metropolitan Family Services 2013 Metropolitan Family Services (Grant 1) 2015 Metropolitan Family Services (Grant 2) 2015 Mount Vernon City School District 80 2013 Mount Vernon City School District 80 2015 National Museum of Mexican Art 2015 Northeastern Illinois University 2013 Northeastern Illinois University (Grant 1) 2015 Northeastern Illinois University (Grant 2) 2015 Northern IL Council on Alcohol and Substance Abuse (NICASA) 2013 Northern IL Council on Alcohol and Substance Abuse (NICASA) 2015 Park Forest -‐ Chicago Heights School District 163 2015 Project Success of Vermilion County (Grant 1, Site 1) 2015 Project Success of Vermilion County (Grant 1, Site 2) 2015 Project Success of Vermilion County (Grant 1, Site 3) 2015 Project Success of Vermilion County (Grant 2, Site 1) 2015 Project Success of Vermilion County (Grant 2, Site 2) 2015 Quad Communities Development Corportation 2013 Quincy SD 172 2015 Rochelle CCSD 231 2013 Rock Island/Milan SD 41 2015 Rockford School District 205 (Grant 1) 2015 Rockford School District 205 (Grant 2) 2015 Rockford School District 205 (Grant 3) 2015 ROE #27 Henderson -‐ Mercer -‐ Warren 2013 ROE #27 Henderson -‐ Mercer -‐ Warren 2015 ROE #28 Bureau Henry Stark 2013 ROE #28 Bureau Henry Stark (Grant 1) 2015 ROE #28 Bureau Henry Stark (Grant 2) 2015 ROE #49 Rock Island (Grant 1) 2013 ROE #49 Rock Island (Grant 2) 2015 ROE #49 Rock Island (Grant 1) 2015 ROE #49 Rock Island (Grant 2) 2015 School District U-‐46 2015 Springfield Urban League, Inc. (2013 Grant, 2015 Grants 1 & 2) 2013/2015 Sterling-‐Rock Falls Family YMCA 2010 TAP In Leadership Academy (Grant 1 & 2) 2015 Thornton Fractional Township High School District 215 2013 Urbana SD 116 2013
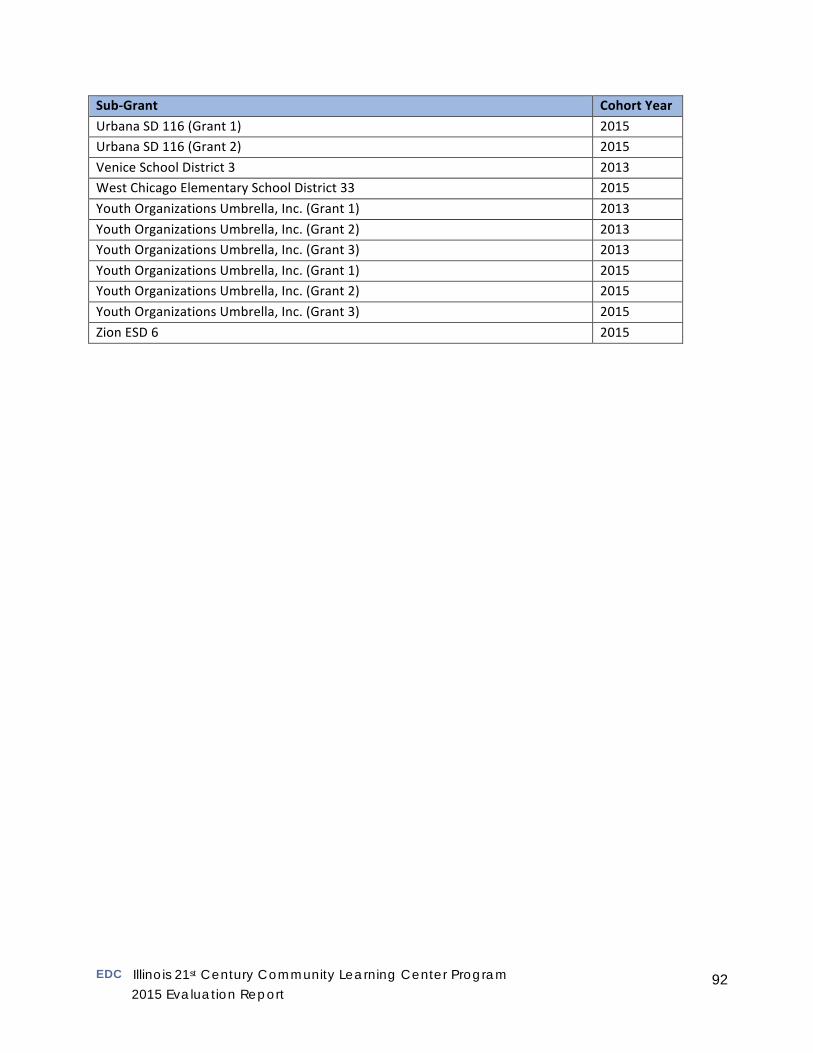
EDC Illinois 21st Century Community Learning Center Program
2015 Evaluation Report 92
Sub-‐Grant Cohort Year Urbana SD 116 (Grant 1) 2015 Urbana SD 116 (Grant 2) 2015 Venice School District 3 2013 West Chicago Elementary School District 33 2015 Youth Organizations Umbrella, Inc. (Grant 1) 2013 Youth Organizations Umbrella, Inc. (Grant 2) 2013 Youth Organizations Umbrella, Inc. (Grant 3) 2013 Youth Organizations Umbrella, Inc. (Grant 1) 2015 Youth Organizations Umbrella, Inc. (Grant 2) 2015 Youth Organizations Umbrella, Inc. (Grant 3) 2015 Zion ESD 6 2015
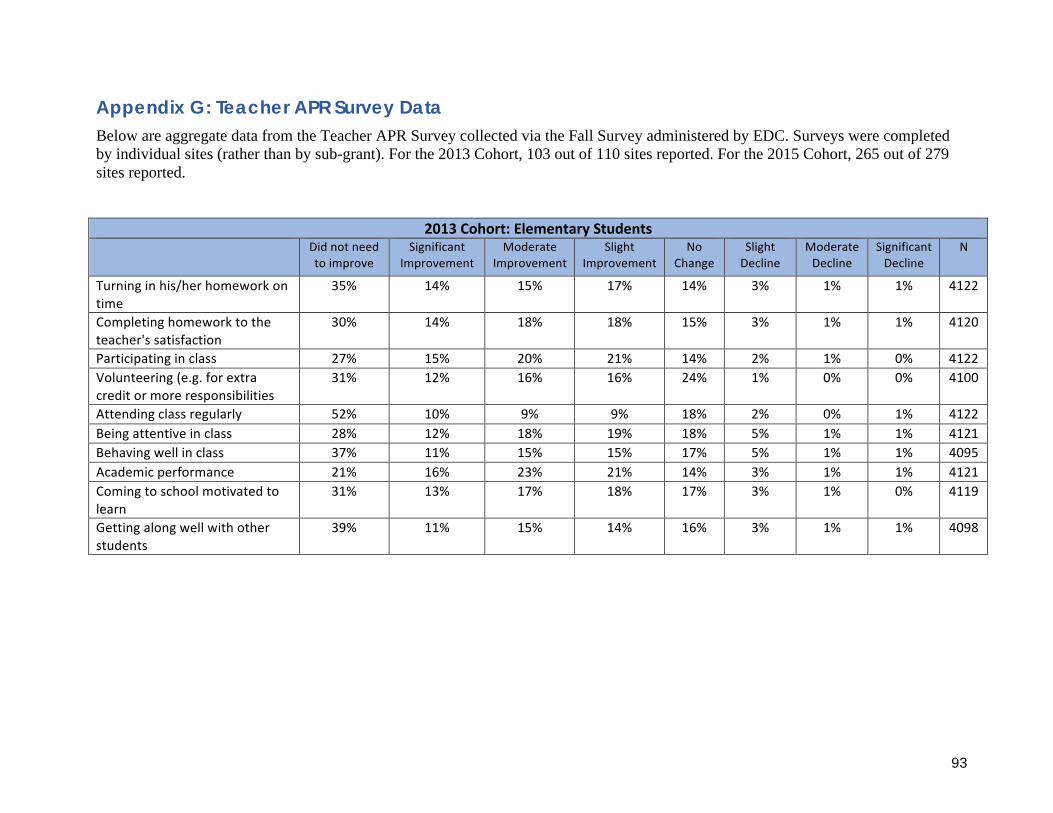
93
Appendix G: Teacher APR Survey Data Below are aggregate data from the Teacher APR Survey collected via the Fall Survey administered by EDC. Surveys were completed by individual sites (rather than by sub-grant). For the 2013 Cohort, 103 out of 110 sites reported. For the 2015 Cohort, 265 out of 279 sites reported.
2013 Cohort: Elementary Students Did not need
to improve Significant
Improvement Moderate
Improvement Slight
Improvement No
Change Slight Decline
Moderate Decline
Significant Decline
N
Turning in his/her homework on time
35% 14% 15% 17% 14% 3% 1% 1% 4122
Completing homework to the teacher's satisfaction
30% 14% 18% 18% 15% 3% 1% 1% 4120
Participating in class 27% 15% 20% 21% 14% 2% 1% 0% 4122 Volunteering (e.g. for extra credit or more responsibilities
31% 12% 16% 16% 24% 1% 0% 0% 4100
Attending class regularly 52% 10% 9% 9% 18% 2% 0% 1% 4122 Being attentive in class 28% 12% 18% 19% 18% 5% 1% 1% 4121 Behaving well in class 37% 11% 15% 15% 17% 5% 1% 1% 4095 Academic performance 21% 16% 23% 21% 14% 3% 1% 1% 4121 Coming to school motivated to learn
31% 13% 17% 18% 17% 3% 1% 0% 4119
Getting along well with other students
39% 11% 15% 14% 16% 3% 1% 1% 4098
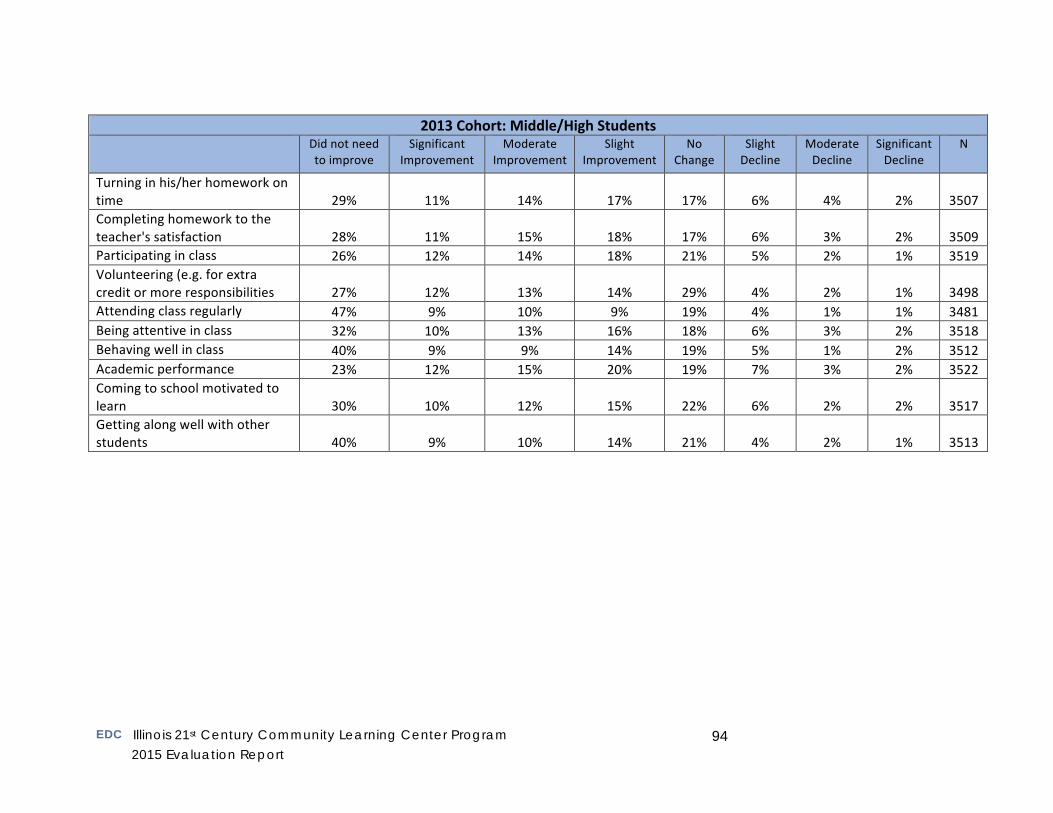
EDC Illinois 21st Century Community Learning Center Program
2015 Evaluation Report 94
2013 Cohort: Middle/High Students
Did not need to improve
Significant Improvement
Moderate Improvement
Slight Improvement
No Change
Slight Decline
Moderate Decline
Significant Decline
N
Turning in his/her homework on time 29% 11% 14% 17% 17% 6% 4% 2% 3507 Completing homework to the teacher's satisfaction 28% 11% 15% 18% 17% 6% 3% 2% 3509 Participating in class 26% 12% 14% 18% 21% 5% 2% 1% 3519 Volunteering (e.g. for extra credit or more responsibilities 27% 12% 13% 14% 29% 4% 2% 1% 3498 Attending class regularly 47% 9% 10% 9% 19% 4% 1% 1% 3481 Being attentive in class 32% 10% 13% 16% 18% 6% 3% 2% 3518 Behaving well in class 40% 9% 9% 14% 19% 5% 1% 2% 3512 Academic performance 23% 12% 15% 20% 19% 7% 3% 2% 3522 Coming to school motivated to learn 30% 10% 12% 15% 22% 6% 2% 2% 3517 Getting along well with other students 40% 9% 10% 14% 21% 4% 2% 1% 3513

EDC Illinois 21st Century Community Learning Center Program
2015 Evaluation Report 95
2015 Cohort: Elementary Students
Did not need to improve
Significant Improvement
Moderate Improvement
Slight Improvement
No Change
Slight Decline
Moderate Decline
Significant Decline
N
Turning in his/her homework on time 30% 15% 16% 18% 16% 3% 1% 1% 8726 Completing homework to the teacher's satisfaction 24% 38% 39% 41% 35% 6% 2% 1% 8716 Participating in class 24% 16% 19% 20% 19% 2% 0% 0% 8731 Volunteering (e.g. for extra credit or more responsibilities 27% 14% 14% 17% 28% 1% 0% 0% 8591 Attending class regularly 47% 12% 8% 10% 21% 2% 1% 0% 8727 Being attentive in class 25% 13% 16% 19% 20% 4% 1% 1% 8724 Behaving well in class 33% 12% 13% 15% 20% 5% 2% 1% 8711 Academic performance 19% 16% 21% 24% 17% 3% 1% 1% 8716 Coming to school motivated to learn 28% 15% 15% 18% 21% 2% 1% 0% 8726 Getting along well with other students 35% 12% 12% 15% 20% 4% 1% 1% 8719

EDC Illinois 21st Century Community Learning Center Program
2015 Evaluation Report 96
2015 Cohort: Middle/High Students
Did not need to improve
Significant Improvement
Moderate Improvement
Slight Improvement
No Change
Slight Decline
Moderate Decline
Significant Decline
N
Turning in his/her homework on time 24% 11% 15% 23% 18% 6% 2% 2% 5009 Completing homework to the teacher's satisfaction 21% 11% 17% 23% 19% 5% 2% 2% 5003 Participating in class 22% 12% 17% 22% 20% 4% 1% 1% 5012 Volunteering (e.g. for extra credit or more responsibilities 23% 11% 13% 19% 30% 2% 1% 1% 4975 Attending class regularly 41% 8% 9% 13% 20% 4% 1% 1% 5004 Being attentive in class 26% 10% 14% 21% 20% 6% 2% 1% 5002 Behaving well in class 36% 9% 11% 18% 18% 5% 2% 1% 5017 Academic performance 19% 12% 19% 23% 17% 6% 2% 2% 5008 Coming to school motivated to learn 25% 11% 15% 19% 23% 4% 2% 2% 5002 Getting along well with other students 38% 8% 11% 17% 20% 3% 1% 1% 4997