ilsi hesi / jrc / setac-eu workshop on...
TRANSCRIPT
ILSI HESI / JRC / SETAC-EUWorkshop on
Bioaccumulation AssessmentsMay 5-6, 2006
Dutch Congress CentreThe Hague, The Netherlands
Organized by:
ILSI Health and Environmental Sciences Institute (HESI)The Joint Research Centre (JRC)
SETAC-Europe

1. Workshop Program
2. Participant's List
3. Summary of HESI Bioaccumulation In Vivo Database Workshop
4. Summary of HESI In Vitro ADME Bioaccumulation Workshop
5. Reporting Formats
6. Thought-Starter Document on Tools for Conducting Tiered Bioaccumulation Assessments
7. ECETOC Report
8. Poster Abstracts
9. Bioaccumulation Poster
Table of Contents
INTERNATIONAL LIFE SCIENCES INSTITUTE (ILSI)
ANTITRUST STATEMENTThe Branches and Institutes of ILSI, including their respective Boards of Trustees, ScientificAdvisors, Scientific Directors, Members, Committees, Subcommittees, Task Forces, and WorkingGroups, meet to promote understanding and resolution of significant health, nutrition, and safetyissues that confront the public, industry, and government. With this goal in mind, ILSI meetingsshould be occasions where members’ representatives and other invited participants:
1. Discuss scientific solutions to problems affecting the health, nutrition, and safety of thepublic.
2. Develop means to contribute to proper analysis of public health, nutrition, and safetyissues by regulatory bodies.
3. Review industrial activities and problems with implications for public health, nutrition, andsafety, and review new scientific developments.
4. Support and promote research and educational programs to enhance public health,nutrition, and safety.
5. Develop objective and voluntary industry standards to promote health and safety andcompliance with regulatory requirements.
ILSI meetings shall not be occasions where members’ representatives and other invitedparticipants:
1. Discuss prices or pricing policies, or any marketing policy with a direct or indirect effecton pricing or any other terms of sale.
2. Confer about division or allocation of sales territories or customers.
3. Establish blacklists or boycotts of suppliers, purchasers, or competitors.
4. Coerce members to implement particular programs or policies.
5. Resolve problems unique to a single member or a small, select group of members.
6. Exchange or disseminate information relating to costs of production, distribution, ormarketing.
INTERNATIONAL LIFE SCIENCES INSTITUTE
One Thomas Circle, NW, Ninth FloorWashington, DC 20005-5802 USA
Tel: (202) 659-0074Fax: (202) 659-3859E-Mail: [email protected]
International Life Sciences Institute Code of Ethics and
Organizational Standards of Conduct Statement of Purpose The goal of the International Life Sciences Institute’s (ILSI) Code of Ethics and Organizational Standards of Conduct is to assure that ILSI members, scientific advisors, consultants, other key stakeholders in ILSI scientific activities, and users of ILSI’s scientific work products are aware of the ethical principles guiding the organization’s structure and the tenets behind the organization’s adherence to rigorous, peer-reviewed scientific investigation and scientifically balanced, evidence-based work products. Introduction The International Life Sciences Institute is an international organization that seeks to promote the public health through the advancement of peer-reviewed scientific investigation and application of evidence-based decision-making in the areas of nutrition, food safety, toxicology, risk assessment, and the environment. ILSI accomplishes its mission through support of scientific research, publications, and workshops and conferences. The principles listed below provide a framework to guide ethical decision-making. (Note: Reference below to policies applicable to “ILSI” includes ILSI, ILSI branches, the ILSI Research Foundation, and the ILSI Center for Health Promotion.) Principle 1. Scientific Integrity All ILSI projects must have a primary public purpose and benefit, and must address issues of broad public health interest. The ILSI and ILSI branch Boards of Trustees must be composed of at least 50% public sector members (primarily academic); the remaining trustees represent ILSI’s member companies. ILSI’s trustees serve in a voluntary capacity; they are not paid for their time. ILSI shall only support animal and human subject research that has been approved by the appropriate bodies responsible for ensuring humane and ethical treatment of the animals or human subjects (e.g., Institutional Review Boards, Ethical Clearance Committees, Animal Care and Use Assurance Committees, etc.). All ILSI-supported research shall be conducted to meet the highest standards as well as all applicable legal standards. ILSI encourages publication of all research results, regardless of outcome. ILSI entities shall not control the content of publications of research grantees or commissioned authors, but shall encourage academic freedom. All ILSI research grantees must include language in their grant-related publications identifying the sponsor and providing appropriate sponsor contact information. All ILSI committees and task forces must have scientific advisors from academia or government to ensure multi-sector input and balance, and ILSI will only undertake activities for which there is broad interest and support. Members of ILSI committees or task forces who are in attendance at meetings, symposia, or workshops must identify themselves on registration forms and materials by their primary affiliation (i.e., employer). ILSI will be transparent in the disclosure of its funding sources.
Principle 2. Conflict of Interest/Bias ILSI believes that ensuring balance of perspectives is the most appropriate way to ensure that the impact of any potential conflict of interest or bias is minimized and does not exert an undue influence on the scientific process. With respect to publications, grant reviews, and expert panels, ILSI asks the scientists with whom it works to disclose any potential conflicts of interest. ILSI may ask scientists to excuse themselves from an activity. Scientists who work with ILSI are expected to act in accordance with their own institution’s conflict of interest policies and with applicable laws, as well as to comply with the conflict of interest policies of any journal or organization with which they may work, including ILSI. Principle 3. Advocacy ILSI does not conduct lobbying activities. Advocacy of any kind is strictly limited to promotion of the use of evidence-based science as an aid in decision-making. Principle 4. Publications ILSI-sponsored manuscripts must undergo stringent peer-review by qualified reviewers. Editors and reviewers will treat manuscripts under review as confidential. Scientists will not serve as editors or reviewers of a manuscript if past or present connections with the author(s) preclude an objective evaluation of the work. All ILSI publications, including proceedings from workshops or symposia sponsored by ILSI branches or entities will utilize appropriate attribution language to denote funding sources and sponsors, and ILSI entities shall provide contact information in all publications they produce for anyone interested in obtaining additional information about the organization or the specific sponsors of a particular project.

Workshop Program
• •! "#•$%&
! "#
$%& '(! )*+(,-. /&&0 1 ! , 2'(3 4'' '(! )*+( ! "#$-5. 4/4 43 + % ---. 2'6( #7) &(--5. 8!64)'9 &8$ '-:-. '8;'! * ;0! 6(<4/4 < ! %&'(- $6 "&)= 7 !' "& $' = !4>=('$:-. $6 "*#7 !' " $' ! !0(!('$
)88 ("#*(4

! "#$-. (/('4)? 6) $& !4>=('$@)8
5 #86) =!& & $6)8
$%& '(! )*+(
+ % . 4 A&'8 B ) ! 08
)88 ("#*(4C , &06$/7 ! = !4>=('$
! "#
$%& '(! )*+(
#7) &(, '8A &'! * 6$B - 78' A&'' B ! %&'(- 4 4' 4 78'( ! "#$-. 4 4' 4 A(B 78'( 5 8?=7& 4 D E

Participants List
HESI ILSI Health and Environmental Sciences Institute
One Thomas Circle, Ninth Floor, NW, Washington, DC 20005-5802 • Phone: 202-659-3306 • Fax: 202-659-3617 • E-mail: [email protected]
ILSI HESI / JRC / SETAC-EU WORKSHOP ON
BIOACCUMULATION ASSESSMENTS MAY 5-6, 2006
THE HAGUE, THE NETHERLANDS
WORKSHOP PARTICIPANTS
Dr. Mark Bonnell New Chemicals Evaluation Division New Substances Branch Environment Canada Place Vincent Massey, 14th Floor 351 St. Joseph Boulevard Gatineau, Quebec K1A 0H3 Canada Tel: 819-994-5845 Email: [email protected] Dr. Sabcho Dimitrov Department of Computer & Information Technology University of Bourgas "Yakimov" St. #1 8010 Bourgas Bulgaria Tel: +359 56 858338 Email: [email protected] Dr. Steve Dungey Environment Agency Chemical Assessment Unit EA Science Group - Ecosystems and Human Health Red Kite House, Howbery Park, Wallingford, Oxfordshire OX10 8BD, UK Tel: +44 (0)1491 828559 E-mail: [email protected]
Dr. Uwe Ensenbach Clariant Produkte Deutschland GmbH Corporate Product Safety EcoToxicology 65840 Sulzbach/Germany Tel: +49 +6196 757 7302 Email: [email protected] Dr. Sue Erhardt The Dow Chemical Company Environmental Chemistry Group 1803 Building Midland, MI 48674 Tel: 989-638-8424 Email: [email protected] Dr. Beate Escher Eawag Environmental Toxicology Überlandstrasse 133 P.O. Box 611, 8600 Dübendorf Switzerland Phone: +41 (0)44 823 50 68 Email: [email protected] Dr. Sylvia Gimeno Procter & Gamble Eurocor Brussels Innovation Center Central Product Safety- environmental Temselaan, 100 1853 Strombeek-Bever Belgium Tel: +32-2-456 6010 Email: [email protected]
Bioaccumulation Assessments Workshop Participants List Page 2
Professor Frank Gobas Simon Fraser University The School of Resource and Environmental Management 8888 University Drive Burnaby, B.C., Canada, V5A 1S6 Tel: 604-291-5928 Email: [email protected] Dr. Marlies Halder European Commission DG Joint Research Centre Institute for Health & Consumer Protection ECVAM, TP 580 I-21020 Ispra (VA) Tel: +39-0332-785550 Email: [email protected] Dr. Joop Hermens Institute for Risk Assessment Sciences Toxicology Division Utrecht University PO Box 80176 3508 TD Utrecht The Netherlands Tel: +31.30.2535337 (or 2535400) Email: [email protected] Dr. Birgit Hoeger European Centre for the Validation of Alternative Methods (ECVAM) Institute for Health and Consumer Protection (IHCP) European Commission - Joint Research Centre Via E. Fermi 1, TP580 21020 Ispra (VA), Italy Tel: +39 0332 78 9984 Email: [email protected] Dr. Duane Huggett Pfizer Global Research and Development Eastern Point Rd. Mailstop 4071 Groton, CT 06340 Tel: 860-715-6561 Email: [email protected]
Dr. Rene Hunziker Toxicology & Environmental Research and Consulting (TERC) Dow Europe GmbH Bachtobelstrasse 3 CH-8810 Horgen, Switzerland Tel: +41-1 728 2296 Email: [email protected] Professor Tom Hutchinson AstraZeneca R&D Global Safety Assessment S -151 85 Sodertalje Sweden Tel: +46 (0)8-552-50291 (direct) Tel: +46 (0)8-553-26000 (switchboard) Email: [email protected] Dr. Volker Koch Clariant Produkte (Deutschland) GmbH Corporate Product Safety - Environmental Risk Assessment 65840 Sulzbach, Germany Tel.: +49-6196-757-7343 Email: [email protected] Dr. Peter Lepper EC Joint Research Centre Institute for Health and Consumer Protection / European Chemicals Bureau / TP 581 Via Enrico Fermi 1 21020 Ispra (VA) Italy Phone: +39 03 32 78 63 68 Email: [email protected] Dr. Lofty Lucas CEO Leadscope, Inc. Tel: 614-599-2700 Email: [email protected] Dr. Elsa Mendonca Instituto Nacional de Engenharia, Tecnologia e Inovação (INETI) Estrada do Paço do Lumiar, 22 1649-038 Lisboa Portugal Tel: +351217127222 Email: [email protected]

Bioaccumulation Assessments Workshop Participants List Page 3
Dr. Tatiana I. Netzeva European Chemicals Bureau, TP 582 Institute for Health and Consumer Protection Joint Research Centre European Commission 21020 Ispra (VA) ITALY Tel: +39 0332 78 5428 Email: [email protected] Dr. David E. Powell Environmental Sciences (C03101) Dow Corning Corporation 2200 West Salzburg Road Auburn, Michigan 48611 Tel: 989-496-8072 Email: [email protected] Dr. Peter Robinson Senior Evaluator Existing Substances Division Environment Canada Place Vincent Massey, 20th Floor 351 St Joseph Blvd Gatineau, Quebec, Canada K2A 1O3 Tel: 819-994-3714 Email: [email protected] Dr. José Tarazona Lafarga Director Departamento de Medio Ambiente INIA Carretera de LA Coruña km 7 28040 Madrid Email: [email protected] Mr. Karluss Thomas Senior Scientific Program Manager ILSI Health and Environmental Sciences Institute One Thomas Circle, NW Ninth Floor Washington, DC 20005 USA Tel.: 202.659.0074 E-mail: [email protected]
Dr. Paul Thomas Environmental Chemistry and Regulatory Affairs Akzo Nobel Chemicals b.v. Research Velperweg 76 P.O.Box 9300 6800 SB Arnhem The Netherlands Tel: +31 26 366 3046 Email: [email protected] Dr. Chrystele Tissier INERIS- DRC/ECOT Parc technologique Alata BP2 60550 Verneuil en Halatte Tel: +33 (0)3.44.55.63.46/+33 (0)6.24.5462.76 Email: [email protected] Dr. Theo P. Traas Chemical Substances Bureau Expert Centre for Substances National Inst. for Public Health & Environment (RIVM) P.O. Box 1, 3720 BA Bilthoven, The Netherlands Tel: +31 30 274 2965 Email: [email protected] Dr. Jay Tunkel Environmental Science Center Syracuse Research Corporation 301 Plainfield Road Suite 350 Syracuse, NY 13212 Tel: 315-452-8436 Email: [email protected] Dr. Eric Verbruggen Expert Centre for Substances (SEC) National Institute for Public Health and the Environment (RIVM) PO Box 1 3720 BA Bilthoven The Netherlands Tel: +31 302743657 E-mail: [email protected] Dr. Bram Versonnen EURAS Rijvisschestraat 118, Box 3 9052 Gent, Belgium Tel: 32 9 321 74 49 Email: [email protected]

Bioaccumulation Assessments Workshop Participants List Page 4
Dr. Annie Weisbrod Central Product Safety-Environmental The Procter & Gamble Company Miami Valley Innovation Center 11810 East Miami River Road Cincinnati, OH USA 45252 Tel: 513-698-6771 [email protected] Dr. Chihae Yang Vice President Toxicology and Predictive Modeling Leadscope, Inc. Tel: 1-614-340-3466 Email: [email protected]
Summary of HESI
Bioaccumulation In Vivo Database Workshop
HESI ILSI Health and Environmental Sciences Institute
DRAFT 4: April 11, 2006 Models Section from submission to Environmental Health Perspectives Title Workgroup Report: Review of Fish Bioaccumulation Databases used for Identifying Persistent, Bioaccumulative, Toxic Substances Authors Anne V. Weisbrod1*, Lawrence P. Burkhard2, Jon Arnot3, David Powell4, Ovanes Mekenyan5, Phil Howard6, Christine Russom2, Robert Boethling7, Yukimitsu Sakuratani8, Theo Traas9, Todd Bridges10, Charles Lutz10, Mark Bonnell11, Thomas Parkerton12, Kent Woodburn13
Affiliations 1Central Product Safety, The Procter & Gamble Company, Cincinnati, Ohio USA; 2National Health & Environmental Effects Laboratory, US Environmental Protection Agency, Duluth, Minnesota USA; 3Canadian Environmental Modelling Centre, Trent University, Peterborough, Ontario Canada; 4Dow Corning Corporation, Midland, Michigan USA; 5Laboratory of Mathematical Chemistry, Bourgas A. Zlatarov University, Bourgas, Bulgaria; 6Syracuse Research Corporation, Syracuse, New York USA; 7Office of Pollution Prevention & Pesticides, US Environmental Protection Agency, Washington DC USA; 8Chemical Management Center, National Institute of Technology and Evaluation (NITE), Japan; 9National Institute for Public Health and the Environment, Utrecht, the Netherlands; 10US Army Engineer Research and Development Center, Vicksburg, Mississippi USA; 11Environment Canada-New Substances, Ottawa, Ontario Canada; 12ExxonMobil Biomedical Sciences, Annandale, New Jersey USA; 13Toxicology, Environmental Research and Consulting, The Dow Chemical Company, Midland, Michigan USA. Models for Predicting Bioconcentration and Bioaccumulation Bioconcentration models In 1974, the first relationship based upon the Kow of the chemical was established for predicting BCFs of nonionic organic chemicals(Neely WB, Branson DR, Blau GE, 1974). This relationship was of the general form:
bKa ow += logBCFlog
where a and b are empirical constants derived by regression analysis of BCF-Kow data sets. Numerous regression equations have been developed since then with varying amounts of bioconcentration data (Bintein S, Devillers J, Karsher W, 1993;Schüürmann G and Klein W, 1988;Veith GD, Defoe DL, Bergstedt BV, 1979). Based upon the analyses of BCF data and underlying partitioning theory (de Wolf W, de Bruijn JHM, Seinen W, Hermens J, 1992), the slope of the regression equation should be close to one and the intercept should be approximately zero for BCF-Kow data sets of organic chemicals with these specific characteristics: nonionic, small molecular weight (< 1000 g/mol), very slowly or non-metabolized, and when BCF values are expressed by the chemical concentration in fish normalized to its lipid content and the bioavailable (or freely dissolved) concentration of the chemical in water. BCFWIN: This QSAR model is contained within the Estimation Programs Interface (EPI) Suite®, developed by the U.S.-Environmental Protection Agency's Office of Pollution Prevention and Toxics and the Syracuse Research Corporation (SRC). The suite of models is publicly available on the Internet (http://www.epa.gov/oppt/p2framework/docs/epiwin.htm). The EPI Suite contains eleven programs for estimating physical-chemical properties, rate constants, and partition coefficients for organic chemicals. One of these programs is BCFWIN, which estimates the chemical's bioconcentration factor based upon its Kow and structural features (e.g., functional groups and elemental composition) (Meylan WM, Howard PH, Boethling RS, Aronson D, Printup H, Gouchie S, 1999). The BCFWIN predictive algorithm is built upon a database of 694 chemicals; i.e., 610 nonionic organic compounds (which include 18 organometallics) and 84 ionic organic compounds (which include carboxylic acids, sulfonic acids and their salts, and quaternary nitrogen compounds). The BCFWIN predictive model is, in essence, a refinement of the regression equation approach presented by Neely et al. with a much larger database of BCFs that permitted the development of correction factors for specific chemical class and structure molecular arrangements (Neely WB, Branson DR, Blau GE, 1974). The model reasonably predicts BCF values for chemicals within the model’s domain of applicability; based upon comparison of estimated and measured BCFs in the BCFWIN training set (i.e., 694 chemicals), 50 percent, 82 percent, and 90 percent the estimated log BCFs are one half, three quarters, and one log unit of their measured values, respectively. As discussed previously, the BCF database assembly process did not evaluate the quality of individual studies incorporated into the database. Rules were developed for assigning a chemical's BCF value from the list of reported values assembled, and these assignments were made for the 694 chemicals. Any uncertainties incorporated into the list of 694 selected BCF values are directly translated into the predictive model. Uncertainties also arise from the quality of the Kow data for individual chemicals used in the BCF-Kow training set. CONCAWE: The algorithms used by the BCFWIN program were extended to hydrocarbons by developing a correction factor for the hydrocarbon chemical class
Page 2 of 7
(Stewart S, Aronson D, Meylan W, Howard P, 2005). The hydrocarbon correction factor was developed using the new set of recommended BCF values for 84 hydrocarbons. For the hydrocarbons, the mean absolute error and standard deviation for the log BCF was 0.43 ± 0.54. Base-line Model, a.k.a. “POPs”: The base-line concept for modeling the bioconcentration of chemicals is based on a reference curve delineating the empirically observed maximum bioconcentration driven by hydrophobicity of chemicals (Dimitrov S, Dimitrova N, Parkerton T, Comber M, Bonnell M, Mekenyan O, 2005). In fact, this is the highest log BCF (log BCFMax) which can be reached for a given log KOW value assuming that small sized, nonionized molecules exhibit maximal bioavailability and are not metabolized (Dimitrov S, Dimitrova N, Walker J, Veith G, Mekenyan OG, 2002;Dimitrov S, Dimitrova N, Walker J, Veith G, Mekenyan OG, 2003) . The base-line model was theoretically justified by the multi-compartment diffusion model:
( ) ⎟⎟⎠
⎞⎜⎜⎝
⎛+
+= Wn
OW
nOW
MAX FaK
KBCF 21
loglog (Equation 1)
where a and n are fitted model parameters, and Fw is the water content of the organism. Mitigating chemical properties (molecular size and flexibility, ionization, volatilization, and adsorption) and organism specific properties (biotransformation and permeability) are used as reducing factors of the maximum bioconcentration determined via the base-line model:
( )iiMAX FBCFBCF Π= loglog (Equation 2)
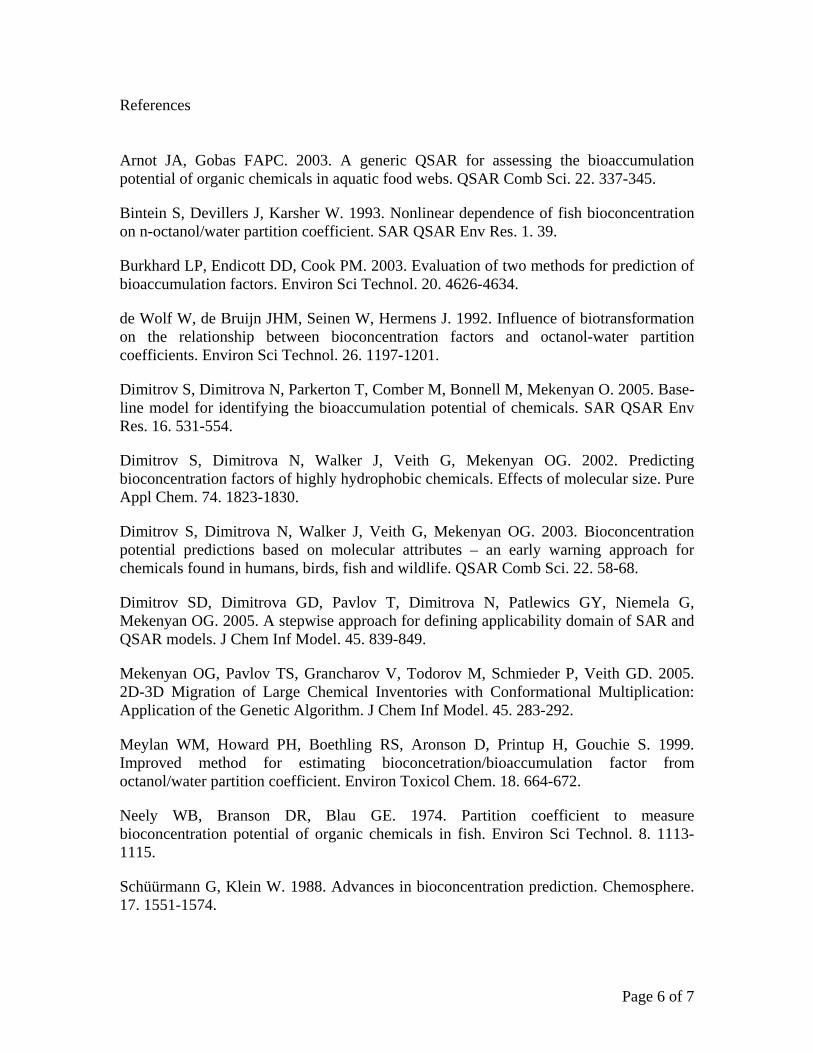
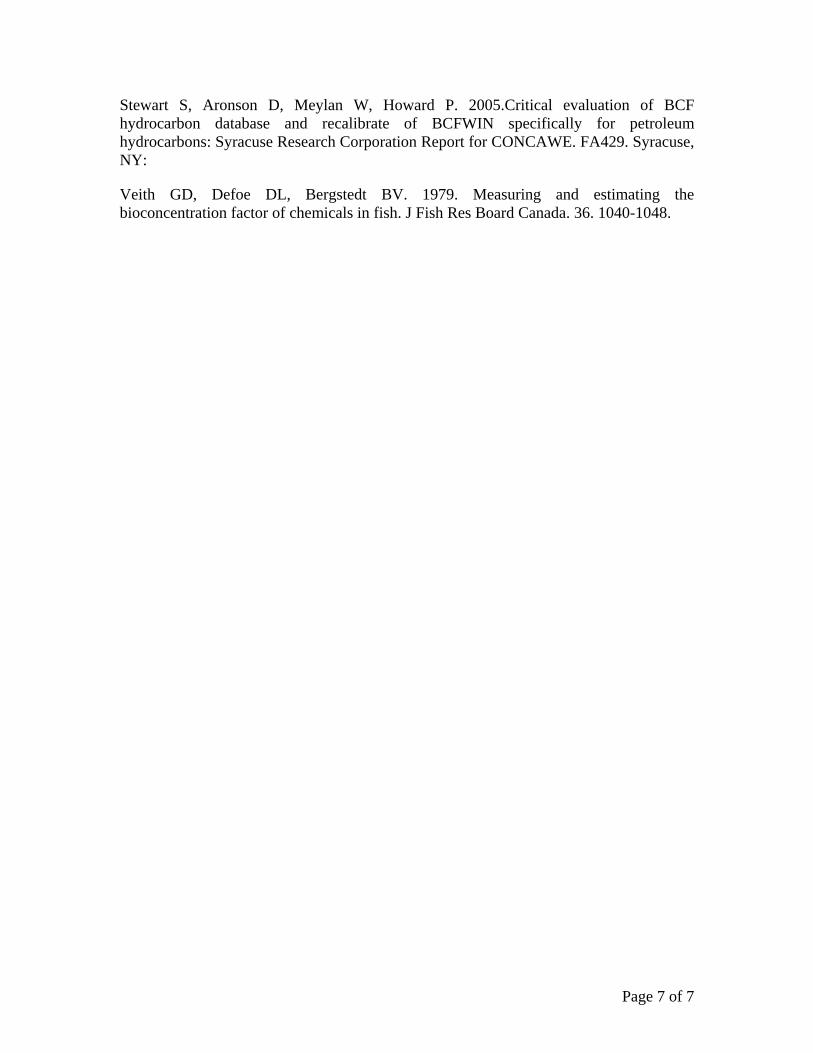
where Fi are the mitigating factors. Specific submodels have been developed for estimating FMetabolism, FIonization and FMolecular Size. An example of the effect of the different mitigating factors on the predicted BCF value is provided for octadecenylsuccinic acid in Figure 1. The model parameters were optimised by making use of the training set of experimental BCF values from 542 chemicals. The model performance for the training set showed a correlation coefficient of R2 = 0.84; residual sum of squares SSR = 139.8 and variance s2 = 0.294. For 88 percent of the training set chemicals, the difference between observed and calculated BCF values was found to be within 0.75 log unit. In an external validation exercise with 176 chemicals, the model demonstrated similar predictability of 80 percent, for chemicals belonging to model applicability domain (Dimitrov SD, Dimitrova GD, Pavlov T, Dimitrova N, Patlewics GY, Niemela G, Mekenyan OG, 2005;Mekenyan OG, Pavlov TS, Grancharov V, Todorov M, Schmieder P, Veith GD, 2005) . The analysis of the relative importance of the three mitigating factors showed that passive diffusion has a 69 percent contribution, metabolism 27 percent, whereas the rest of all mitigating factors was 4 percent. Unequivocally, these contributions show the primary importance of metabolism as compared to other mitigating factors. A screening exercise recently performed on the ~10,000 organic substances for Environment Canada DSL revealed that by including all mitigating factors, the number of chemicals identified as potentially B was reduced significantly, compared with the model using molecular size as
Page 3 of 7
only mitigating factor (Dimitrov S, Dimitrova N, Walker J, Veith G, Mekenyan OG, 2002;Dimitrov S, Dimitrova N, Walker J, Veith G, Mekenyan OG, 2003) . About 12.5 percent of the chemicals were identified as potentially B with only molecular size as a mitigating factor, versus 1.5 percent of the chemicals identified as potentially B with all the mitigating factors accounted for. Bioaccumulation models Food web models can predict BCFs, BAFs, and BSAFs for aquatic organisms, and are being used increasingly in regulatory-driven assessments because they incorporate dietary sources and other environmentally relevant processes that contribute to exposure. Since the 1970s, food web models have been created using data from persistent organic pollutants. Many of these chemicals are very slowly metabolized by aquatic species, which has enabled greater understandings of key bioavailability, uptake, and elimination mechanisms in the environment. For substances that are subject to metabolic biotransformation, BAF values may be over-predicted if this loss rate is not included in the model’s parameters(Burkhard LP, Endicott DD, Cook PM, 2003). Food web models have not been evaluated for all chemical classes, i.e., ionizing substances, as these field data are not available.
Application of food web models requires the specification of the food web, ecosystem conditions (e.g. sediment-water column disequilibria of the chemical, organic carbon content of the sediment, dissolved and particular organic carbon concentrations in water, average temperature), the biotransformation rates and other related factors for all organisms of the food web (e.g., weights, lipid and water contents, prey species). When properly constructed with high quality input data, predicted BAFs from food web models can be highly accurate. Based upon comparison of estimated and measured BAFs for three ecosystems, 60 percent and 96 percent of the estimated log BAFs were within 0.3 and one log unit of their measured values, respectively(Arnot JA and Gobas FAPC, 2003). Improving the accuracy of food web models beyond that obtained with current models will be difficult, because contaminant concentration vary widely among individual organisms in the environment. This variability is a key factor controlling the model accuracy when comparing estimated and measured BAFs (Arnot JA and Gobas FAPC, 2003). The application of typical food web models for screening large numbers of chemicals, such as for chemical management programs, is an arduous task because of the variability in site-specific ecosystem conditions and the input data required to simulate specific food webs. A semi-empirical mass balance bioaccumulation model was developed to address these limitations, providing a generic site assessment method (Arnot JA and Gobas FAPC, 2003) . The model circumvents many of the required site-specific input parameters by calibrating BAF predictions to measured BAF data. The model delivers a BAF prediction for a selected generic trophic level (e.g., lower, middle, upper) in a generic aquatic food web, requiring only a KOW value for the chemical. Calibrating the model to BAF data for poorly metabolized chemicals allows for estimates of food web bioaccumulation potential. If reliable metabolic biotransformation data and scaling
Page 4 of 7
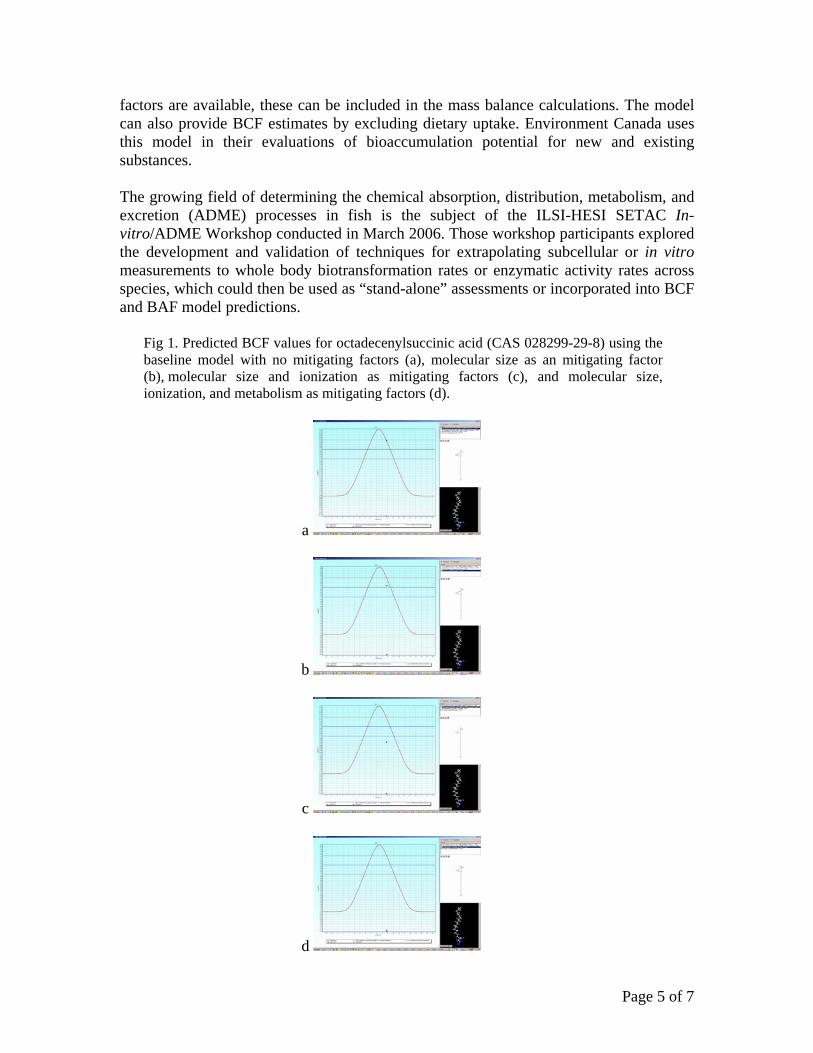
factors are available, these can be included in the mass balance calculations. The model can also provide BCF estimates by excluding dietary uptake. Environment Canada uses this model in their evaluations of bioaccumulation potential for new and existing substances. The growing field of determining the chemical absorption, distribution, metabolism, and excretion (ADME) processes in fish is the subject of the ILSI-HESI SETAC In-vitro/ADME Workshop conducted in March 2006. Those workshop participants explored the development and validation of techniques for extrapolating subcellular or in vitro measurements to whole body biotransformation rates or enzymatic activity rates across species, which could then be used as “stand-alone” assessments or incorporated into BCF and BAF model predictions.
Fig 1. Predicted BCF values for octadecenylsuccinic acid (CAS 028299-29-8) using the baseline model with no mitigating factors (a), molecular size as an mitigating factor (b), molecular size and ionization as mitigating factors (c), and molecular size, ionization, and metabolism as mitigating factors (d).
a
b
c
d
Page 5 of 7
References
Arnot JA, Gobas FAPC. 2003. A generic Q for assessing the bioaccumulation potential of organic chem b Sci. 22. 337-345.
Bintein S, Devillers J, Kars ration on n-octanol/water partition coefficient. SAR QSAR Env Res. 1. 39.
Burkhard LP, Endicott DD, Cook PM. 2003. Evaluation of two methods for prediction of bioaccumulation factors. Environ Sci Technol. 20. 4626-4634.
tion on the relationship between bioconcentration factors and octanol-water partition
Dimitrov S, Dimitrova N, Parkerton T, Comber M, Bonnell M, Mekenyan O. 2005. Base-
humans, birds, fish and wildlife. QSAR Comb Sci. 22. 58-68.
odel. 45. 839-849.
ol Chem. 18. 664-672.
SARicals in aquatic food webs. QSAR Com
her W. 1993. Nonlinear dependence of fish bioconcent
de Wolf W, de Bruijn JHM, Seinen W, Hermens J. 1992. Influence of biotransforma
coefficients. Environ Sci Technol. 26. 1197-1201.
line model for identifying the bioaccumulation potential of chemicals. SAR QSAR Env Res. 16. 531-554.
Dimitrov S, Dimitrova N, Walker J, Veith G, Mekenyan OG. 2002. Predicting bioconcentration factors of highly hydrophobic chemicals. Effects of molecular size. Pure Appl Chem. 74. 1823-1830.
Dimitrov S, Dimitrova N, Walker J, Veith G, Mekenyan OG. 2003. Bioconcentration potential predictions based on molecular attributes – an early warning approach for chemicals found in
Dimitrov SD, Dimitrova GD, Pavlov T, Dimitrova N, Patlewics GY, Niemela G, Mekenyan OG. 2005. A stepwise approach for defining applicability domain of SAR and QSAR models. J Chem Inf M
Mekenyan OG, Pavlov TS, Grancharov V, Todorov M, Schmieder P, Veith GD. 2005. 2D-3D Migration of Large Chemical Inventories with Conformational Multiplication: Application of the Genetic Algorithm. J Chem Inf Model. 45. 283-292.
Meylan WM, Howard PH, Boethling RS, Aronson D, Printup H, Gouchie S. 1999. Improved method for estimating bioconcetration/bioaccumulation factor from octanol/water partition coefficient. Environ Toxic
Neely WB, Branson DR, Blau GE. 1974. Partition coefficient to measure bioconcentration potential of organic chemicals in fish. Environ Sci Technol. 8. 1113-1115.
Schüürmann G, Klein W. 1988. Advances in bioconcentration prediction. Chemosphere. 17. 1551-1574.
Page 6 of 7
Stewart S, Aronson D, Meylan W, Howard P. 2005.Critical evaluation of BCF hydrocarbon database and recalibrate of BCFWIN specifically for petroleum hydrocarbons: Syracuse Research Corporation Report for CONCAWE. FA429. Syracuse, NY:
foe DL, Bergstedt BV. 1979. Measuring and estimating the bioconcentration factor of chemicals in fish. J Fish Res Board Canada. 36. 1040-1048. Veith GD, De
Page 7 of 7
Summary of HESI In Vitro ADME
Bioaccumulation Workshop
HESI ILSI Health and Environmental Sciences Institute
Team: C Cowan-Ellsberry (P&G), C Eickhoff (Vizon SciTec), D Huggett (Pfizer), P Landrum (US NOAA), K Plotzke (Dow Corning), I Schultz (US Pacific NW Labs), H Segner (Univ Bern), K Werner (3M). Ed: A Weisbrod.
Decision Tree for Evaluating Bioaccumulation Potential in Fish
Introduction Due to the limitations of computer models and in vivo fish bioconcentration data, a cross-sector HESI SETAC Working Group (March 4, 2006) was requested to design a decision tree that could be used to improve how the potential for bioaccumulation (“B”) of chemicals is assessed. The aim of the decision tree is to indicate how additional information about various properties of a chemical could be incorporated into current B assessment methods, and by doing so, improve both the understanding of a chemical’s environmental risk and categorization decisions for PBT programs. Further, this effort could help to focus and prioritize research and funding on what will most greatly influence the decision-making process concerning materials that have a potential for “B” in the environment. The “Decision Tree” provides a step-by-step guide to decisions on the next steps to take when determining the potential for “B” for any material. The specific goals are to:
1) Maximize our understanding of bioaccumulation potential while minimizing the use of animal testing.
2) Minimize testing requirements through the use physicochemical data and structure-activity relationships (SAR).
3) Reduce the time needed for xenobiotics to be evaluated.
4) Improve prioritization and identification of chemicals for further study.
5) Increase understanding of SAR. To accomplish these goals, “B” assessment is done in a tiered fashion. As described here: Tier 1 – Initial Screen for “B” Within the regulatory arenas where “B” categorization is mandated, they are deciding on a process that could include basic empirical bioconcentration data as well as computer models for estimating “B” potential. The results of these models or data are then compared to the pre-determined criteria for “B”. If the chemical is determined to be “B” based on this approach, the chemical should pass to further evaluation in the subsequent tiers of the “Overall “B” Decision Tree (Figure 1). Tier 2 – Paper Screening Exercise The first step in the subsequent evaluation process is to gather all the data on the chemical and conduct two types of paper screenings. The first screening is to determine if the substance is present in the aquatic environment and then if the substance is likely to remain in the aquatic environment; both indicate whether aquatic organisms can be exposed. Multi-compartment fate models, such as a Level III fugacity model, can provide a useful screen of the potential of a compound to occur in various compartments in the environment, including the aquatic environment. If this first screening identifies that organisms are unlikely to be exposed, further tiers of assessment are unnecessary. However, if exposure is possible, a second
DRAFT SUMMARY, 26 April 2006
screening is conducted to determine if absorption across biological membranes is impeded (e.g., chemical is not bioavailable, too large, etc.). If absorption is possible, do Tier 3. Tier 3- Absorption potential This part of the decision tree aims to provide estimates on two processes that govern the absorption potential of chemicals: - Environmental availability of the
compound for absorption by the organism.
- Ability of the compound to cross the biological membranes/epithelia to enter the organism.
Considering the currently available tools, a three-pronged approach appears feasible: - Physicochemical parameters to provide
baseline information (i.e., “Lipinski’s Rule of Five” adapted for use with fish).
- Biomimetics or passive samplers such as SPMD, SPME, EVA.
- Biological models. If a chemical appears to be bioavailable and absorbed, its metabolic lability is then considered. Tier 4 – Metabolism Assessment (Figure 2) The first step would be to use a simple in vitro screen for metabolic potential (e.g., in S9 liver fractions or hepatocytes). If no significant biotransformation of the compound is observed or greater certainty is needed, then some type of in vivo study (e.g., cannulated fish) or ex vivo study (e.g., liver perfusion) could be initiated to estimate the impact of low metabolism on bioaccumulation potential. If the revised “B” estimate is greater than the regional criteria of interest, then a risk assessment may be
performed. If the revised “B” value is less than the criteria of interest, consideration should be given to extrapolating the metabolic data across species (e.g., using PBPK modeling) and using these data as part of a “Weight of Evidence” approach to explain why the compound of interest is not bioaccumulative. If necessary, additional studies may be performed to examine the potential effects of major metabolites. Tier 5- Risk Assessment If a compound still meets criteria for “B” it will then be important to move on to a more formal risk assessment. The overall objectives will follow a risk-based approach to understand the true potential for “B” in the environment, and conducting an in vivo test (e.g., OECD 305) or field studies may be required. In this effort, the database of species “B” values may need to be expanded to include several levels in the food chain. It will be important to combine exposure, potential for absorption and metabolic clearance with relevant organism or population level data to evaluate the risk to organisms in the environment, especially predatory animals, based on the “B” evaluation.
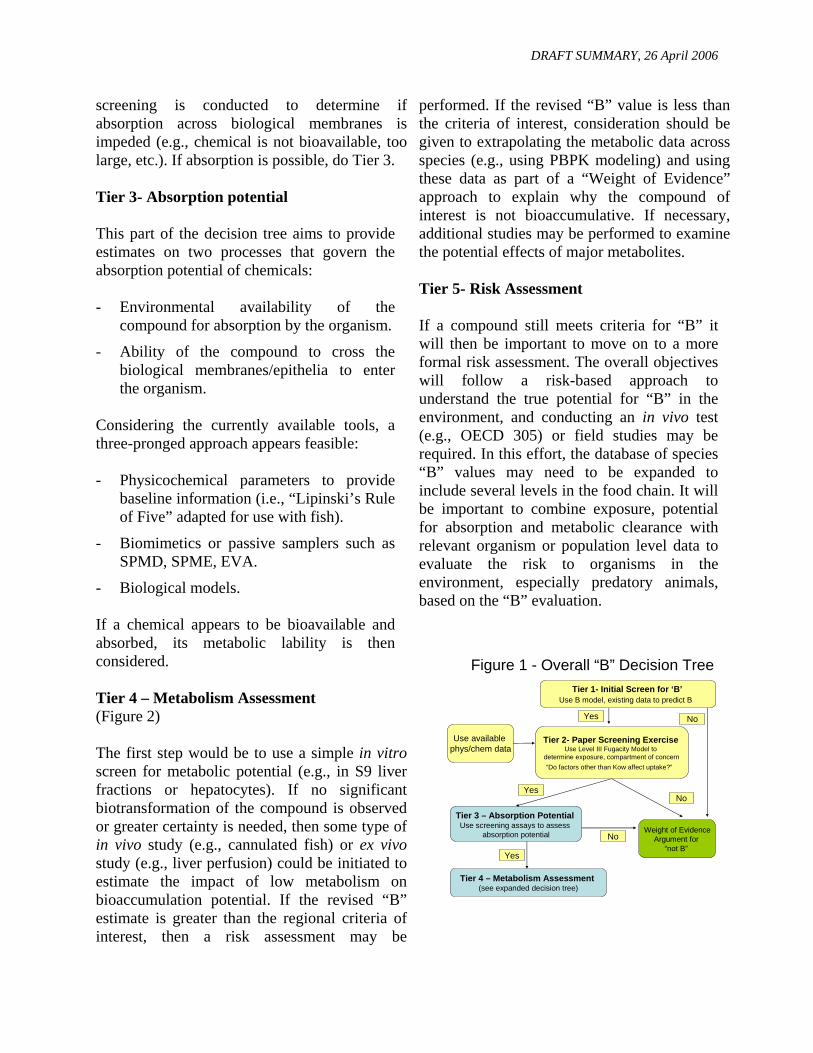
Figure 1 - Overall “B” Decision Tree
Tier 3 – Absorption Potential Use screening assays to assess
absorption potential
Tier 2- Paper Screening ExerciseUse Level III Fugacity Model to
determine exposure, compartment of concern“Do factors other than Kow affect uptake?”
Use available phys/chem data
Tier 4 – Metabolism Assessment (see expanded decision tree)
NoYes
Yes
Yes
NoWeight of Evidence
Argument for “not B”
Tier 1- Initial Screen for ‘B’Use B model, existing data to predict B
No
DRAFT SUMMARY, 26 April 2006
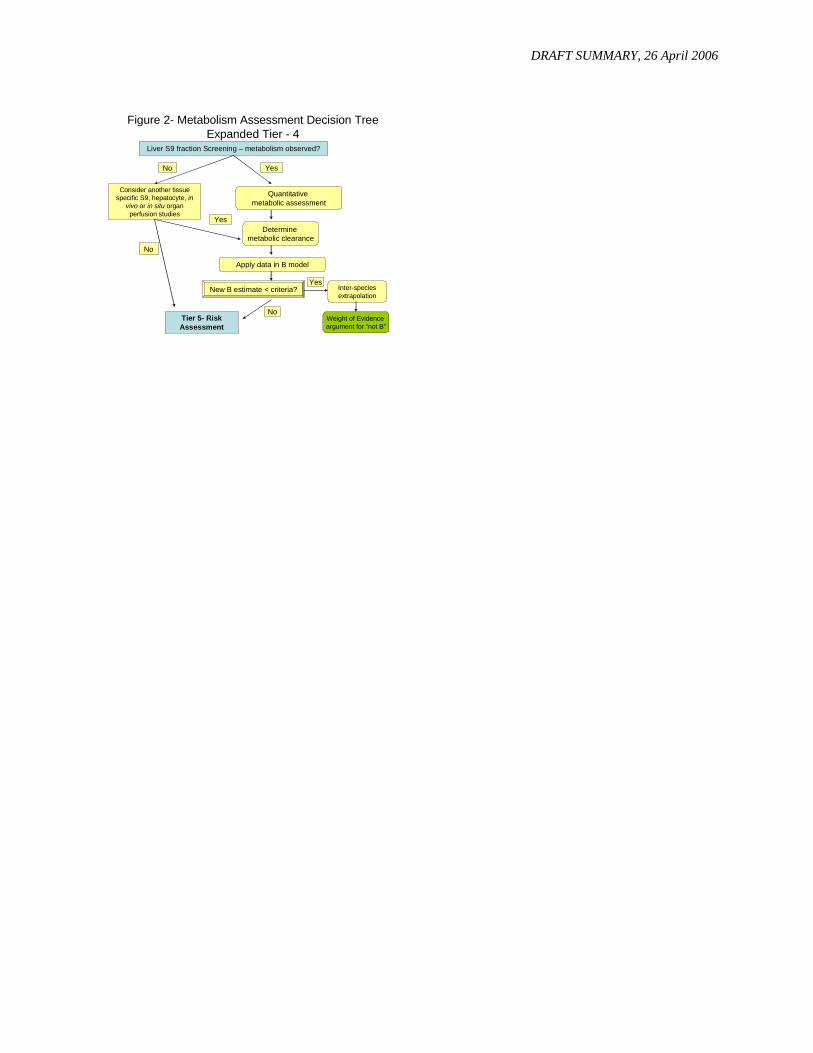
Figure 2- Metabolism Assessment Decision Tree
Expanded Tier - 4Liver S9 fraction Screening – metabolism observed?
YesNo
Apply data in B model
New B estimate < criteria?
Consider another tissue specific S9, hepatocyte, in
vivo or in situ organ perfusion studies
Inter-speciesextrapolation
NoWeight of Evidence argument for “not B”
No
Yes
Yes
Tier 5- Risk Assessment
Determine metabolic clearance
Quantitative metabolic assessment
HESI ILSI Health and Environmental Sciences Institute
Development of a Strategy to Assess the Potential of In Vitro Methods to Predict Bioaccumulation Participant Organization Participant Organization Scott Dyer Procter & Gamble John Nichols USEPA-Duluth Kevin Kleinow Louisiana State Univ., USA Margaret James Univ. Florida, USA Kanaan Krishnan Univ. Montreal, Canada Jean Domoradzki Dow Corning Paul Jean Dow Corning Jasminder Sahi CellzDirect Margo Moore Simon Fraser Univ, Canada Luba Vasiluk Simon Fraser Univ., Canada Roman Lanno Ohio State Univ., USA Birgit Hoeger ECVAM Helmut Segner Univ. Bern, Switzerland Irv Schultz Pacific NW Laboratories, Battelle Diane Nabb DuPont Xing Han DuPont Session Charge for HESI SETAC In vitro ADME Workshop (4 March 2006) Design a research strategy that will lead to the determination of how and when diverse in vitro methods may be used to predict bioaccumulation in fish. Results of this session were needed to provide background and status information for the upcoming HESI sponsored workshop in Den Haag, The Netherlands (conducted prior to SETAC-Europe, May, 2006) and as an outline for a future publication. Summary There was a consensus that while in vitro methods provide great potential to estimate physical/chemical properties important for ‘B’ estimations, they will require further evaluation to verify their ultimate usefulness. The group believed this was best done via demonstration projects. Demonstration projects involve testing selected chemicals in abiotic and biotic systems that produce partitioning, absorption, and metabolism data; these data are scaled up and put into a generic fish bioaccumulation model (Arnot and Gobas, 2003) to estimate BCF/BAF (‘B’). The ‘B’ model predictions incorporating the abiotic and biotic system data are ultimately compared to measured ‘B’ data. The following provide a brief description of the key tasks and methods that will be employed in conducting the demonstrations. Selection of Chemicals The potential success of any in vitro method can only be assessed in the context of the method choices available and type of chemical properties. Solubility, sorption, volatility, potential for biotransformation, metabolic pathways, availability of analytical methods and existence of reliable ‘B’ data (with species noted) are all factors that can affect the choice of chemicals to be evaluated. Table 1 provides a ‘read-across’ of the diverse factors that may be used to select chemicals to demonstrate how in vitro methods might be used in B assessments.
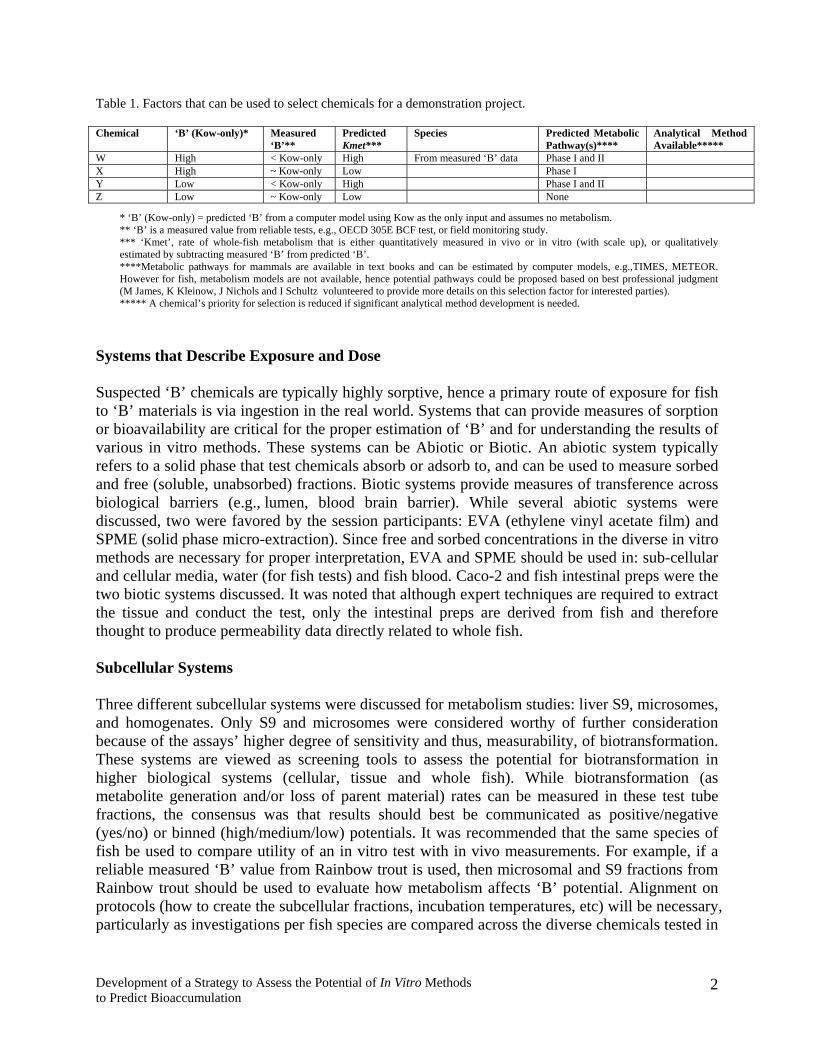
Table 1. Factors that can be used to select chemicals for a demonstration project. Chemical ‘B’ (Kow-only)* Measured
‘B’** Predicted Kmet***
Species Predicted Metabolic Pathway(s)****
Analytical Method Available*****
W High < Kow-only High From measured ‘B’ data Phase I and II X High ~ Kow-only Low Phase I Y Low < Kow-only High Phase I and II Z Low ~ Kow-only Low None
* ‘B’ (Kow-only) = predicted ‘B’ from a computer model using Kow as the only input and assumes no metabolism. ** ‘B’ is a measured value from reliable tests, e.g., OECD 305E BCF test, or field monitoring study. *** ‘Kmet’, rate of whole-fish metabolism that is either quantitatively measured in vivo or in vitro (with scale up), or qualitatively estimated by subtracting measured ‘B’ from predicted ‘B’. ****Metabolic pathways for mammals are available in text books and can be estimated by computer models, e.g.,TIMES, METEOR. However for fish, metabolism models are not available, hence potential pathways could be proposed based on best professional judgment (M James, K Kleinow, J Nichols and I Schultz volunteered to provide more details on this selection factor for interested parties). ***** A chemical’s priority for selection is reduced if significant analytical method development is needed.
Systems that Describe Exposure and Dose Suspected ‘B’ chemicals are typically highly sorptive, hence a primary route of exposure for fish to ‘B’ materials is via ingestion in the real world. Systems that can provide measures of sorption or bioavailability are critical for the proper estimation of ‘B’ and for understanding the results of various in vitro methods. These systems can be Abiotic or Biotic. An abiotic system typically refers to a solid phase that test chemicals absorb or adsorb to, and can be used to measure sorbed and free (soluble, unabsorbed) fractions. Biotic systems provide measures of transference across biological barriers (e.g., lumen, blood brain barrier). While several abiotic systems were discussed, two were favored by the session participants: EVA (ethylene vinyl acetate film) and SPME (solid phase micro-extraction). Since free and sorbed concentrations in the diverse in vitro methods are necessary for proper interpretation, EVA and SPME should be used in: sub-cellular and cellular media, water (for fish tests) and fish blood. Caco-2 and fish intestinal preps were the two biotic systems discussed. It was noted that although expert techniques are required to extract the tissue and conduct the test, only the intestinal preps are derived from fish and therefore thought to produce permeability data directly related to whole fish. Subcellular Systems Three different subcellular systems were discussed for metabolism studies: liver S9, microsomes, and homogenates. Only S9 and microsomes were considered worthy of further consideration because of the assays’ higher degree of sensitivity and thus, measurability, of biotransformation. These systems are viewed as screening tools to assess the potential for biotransformation in higher biological systems (cellular, tissue and whole fish). While biotransformation (as metabolite generation and/or loss of parent material) rates can be measured in these test tube fractions, the consensus was that results should best be communicated as positive/negative (yes/no) or binned (high/medium/low) potentials. It was recommended that the same species of fish be used to compare utility of an in vitro test with in vivo measurements. For example, if a reliable measured ‘B’ value from Rainbow trout is used, then microsomal and S9 fractions from Rainbow trout should be used to evaluate how metabolism affects ‘B’ potential. Alignment on protocols (how to create the subcellular fractions, incubation temperatures, etc) will be necessary, particularly as investigations per fish species are compared across the diverse chemicals tested in
Development of a Strategy to Assess the Potential of In Vitro Methods to Predict Bioaccumulation
2
different laboratories. Efforts should be made to measure free and sorbed fractions in media. Parent chemical loss rates should be based on total and free fractions. Cellular Since ‘B’ materials are likely to enter fish via the intestine, there is a long-term need to assess the importance of intestinal uptake and metabolism on ‘B’ in fish. However at this time, fish intestinal preps are less commonly used, requiring method development. On the other hand, the use of fish hepatocytes to assess biotransformation is growing rapidly. Primary hepatocytes have increased realism in estimating ‘B’ beyond subcellular liver based preps because they include membrane transport (active and passive mechanisms). Their use has been primarily limited to only a few labs and species (Common carp and Rainbow trout). A current limitation of using hepatocytes is the need to have fresh fish cultures and their small tissue yield. To facilitate method transfer, there is a need to investigate the development of cryopreserved fish hepatocytes. Presently, cryopreserved hepatocytes from lab mammals and humans are commercially available. Parent chemical loss rates (hepatic clearance) should be based on total and free fractions. In Situ Isolated Liver Preparations Isolated liver preps provide the greatest integrative measure of uptake, distribution and biotransformation of chemicals in the liver. These preps have only been developed for catfish and Rainbow trout, species that have encapsulated livers and clearly defined hepatic and portal blood vessels. To enable a ‘read-across’ of methods exposure should be based on free and total fractions as dosed via blood.
Ed. 26 April 2006, A Weisbrod
Development of a Strategy to Assess the Potential of In Vitro Methods to Predict Bioaccumulation
3

Reporting Formats
HESI ILSI Health and Environmental Sciences Institute
ILSI-HESI, ECB, JRC-ECB and JRC-ECVAM workshop, 5-6 May 2006 Reporting formats from the QSAR Experience project Theo Traas and Betty Hakkert, Chemical Substances Bureau RIVM Introduction The QSAR experience project is an initiative from regulators in the European Commission to gain experience with the use of QSARs in risk assessment of chemicals. The project is currently under the guidance of the European Chemicals Bureau (ECB) and a subcommittee of the EU technical committee for new and existing substances. In chemicals risk assessment, large-scale regulatory programs are underway such as the OECD HPVC program, the Canadian DSL program and the new European Chemicals legislation (REACH). It is expected that in the near future, alternatives for in vivo-testing such as in silico and in vitro methods will be used much more frequently in risk assessment. Both industry (as responsible entities or registrants) and regulators will need to deal with the question how the results of these alternative methods need to be interpreted, how these are reported and how they can be evaluated (and weighted). As part of the experience project, reporting formats were suggested to exchange experience between regulators on the use and interpretation of QSAR models in risk assessment. It became clear that reporting on the use and outcome of alternative methods but can be placed in a wider context. If the results of alternative methods are not reported consistently, it will be very difficult to evaluate if the methods used are valid for a specific risk assessment context, if they have been applied correctly and if they have been interpreted correctly. Therefore, we feel it is a joint interest for both industry and regulatory bodies to develop a system for reporting alternative methods, such that they can be easily interpreted and evaluated in the risk assessment. This should also be considered when designing a testing strategy. Considerations on the goal of formats The goal of the formats is to streamline how alternative methods are reported, and in no way tries to limit or fix which methods are used. The underlying (database of) methods that are described in some detail (see section on levels) can be easily expanded once new methods have been developed. For industry, it is vital that they can report findings of alternative methods in an accepted format and that the underlying models or methods used are described and stored somewhere to avoid duplication of effort.
For regulators, it is vital that they can see how a certain result is achieved, that results of different methods are reported and that the underlying methods or models can be traced and scrutinized. This is needed to evaluate whether the alternative methods provided in the risk assessment are adequate for the test endpoint in question and provide sufficient certainty for regulatory decision making. Levels of reporting formats The current reporting formats have three levels.
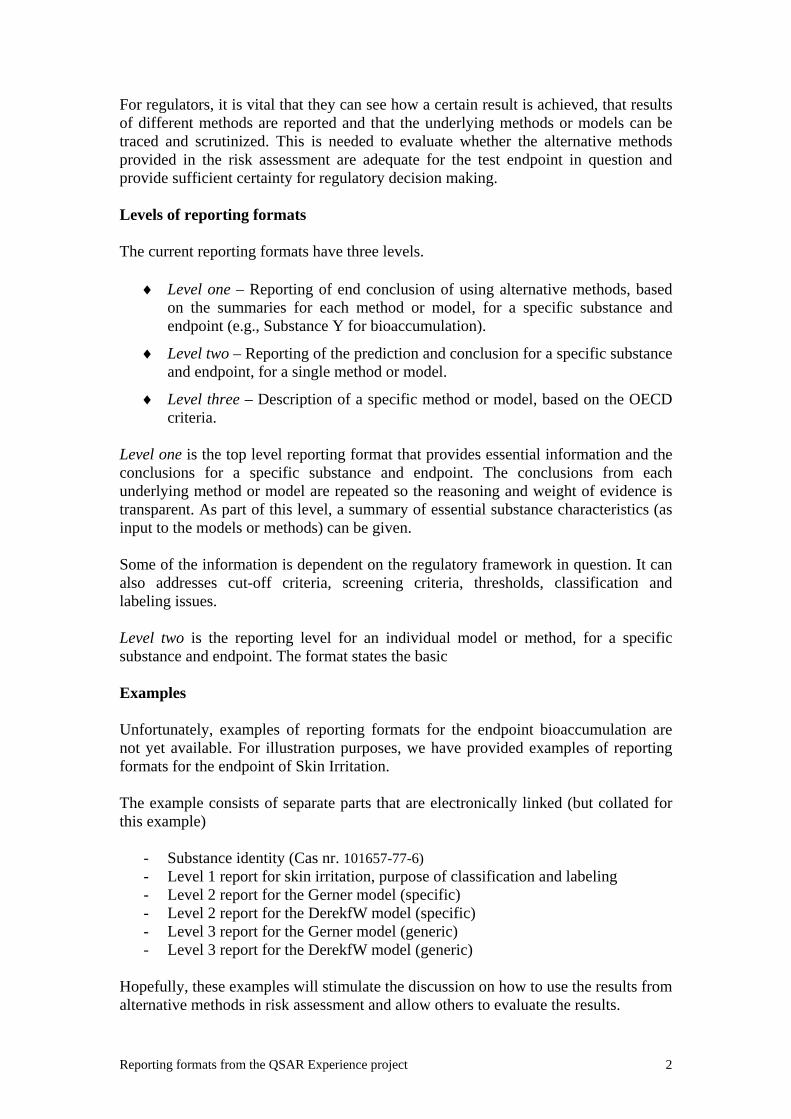
♦ Level one – Reporting of end conclusion of using alternative methods, based on the summaries for each method or model, for a specific substance and endpoint (e.g., Substance Y for bioaccumulation).
♦ Level two – Reporting of the prediction and conclusion for a specific substance and endpoint, for a single method or model.
♦ Level three – Description of a specific method or model, based on the OECD criteria.
Level one is the top level reporting format that provides essential information and the conclusions for a specific substance and endpoint. The conclusions from each underlying method or model are repeated so the reasoning and weight of evidence is transparent. As part of this level, a summary of essential substance characteristics (as input to the models or methods) can be given. Some of the information is dependent on the regulatory framework in question. It can also addresses cut-off criteria, screening criteria, thresholds, classification and labeling issues. Level two is the reporting level for an individual model or method, for a specific substance and endpoint. The format states the basic Examples Unfortunately, examples of reporting formats for the endpoint bioaccumulation are not yet available. For illustration purposes, we have provided examples of reporting formats for the endpoint of Skin Irritation. The example consists of separate parts that are electronically linked (but collated for this example)
- Substance identity (Cas nr. 101657-77-6) - Level 1 report for skin irritation, purpose of classification and labeling - Level 2 report for the Gerner model (specific) - Level 2 report for the DerekfW model (specific) - Level 3 report for the Gerner model (generic) - Level 3 report for the DerekfW model (generic)
Hopefully, these examples will stimulate the discussion on how to use the results from alternative methods in risk assessment and allow others to evaluate the results.
Reporting formats from the QSAR Experience project 2
Example 2
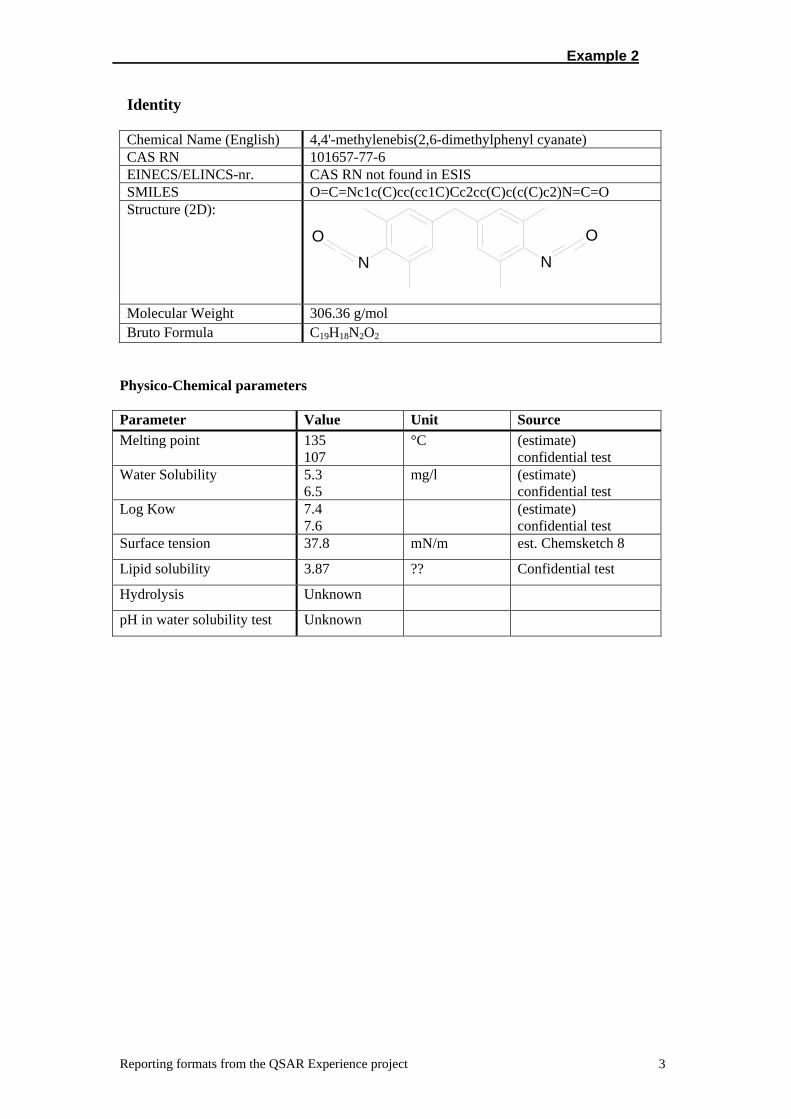
Identity Chemical Name (English) 4,4'-methylenebis(2,6-dimethylphenyl cyanate) CAS RN 101657-77-6 EINECS/ELINCS-nr. CAS RN not found in ESIS SMILES O=C=Nc1c(C)cc(cc1C)Cc2cc(C)c(c(C)c2)N=C=O Structure (2D):
NNO O
Molecular Weight 306.36 g/mol Bruto Formula C19H18N2O2
Physico-Chemical parameters Parameter Value Unit Source Melting point 135
107 °C (estimate)
confidential test Water Solubility 5.3
6.5 mg/l (estimate)
confidential test Log Kow 7.4
7.6 (estimate)
confidential test Surface tension 37.8 mN/m est. Chemsketch 8
Lipid solubility 3.87 ?? Confidential test
Hydrolysis Unknown
pH in water solubility test Unknown
Reporting formats from the QSAR Experience project 3
Example 2
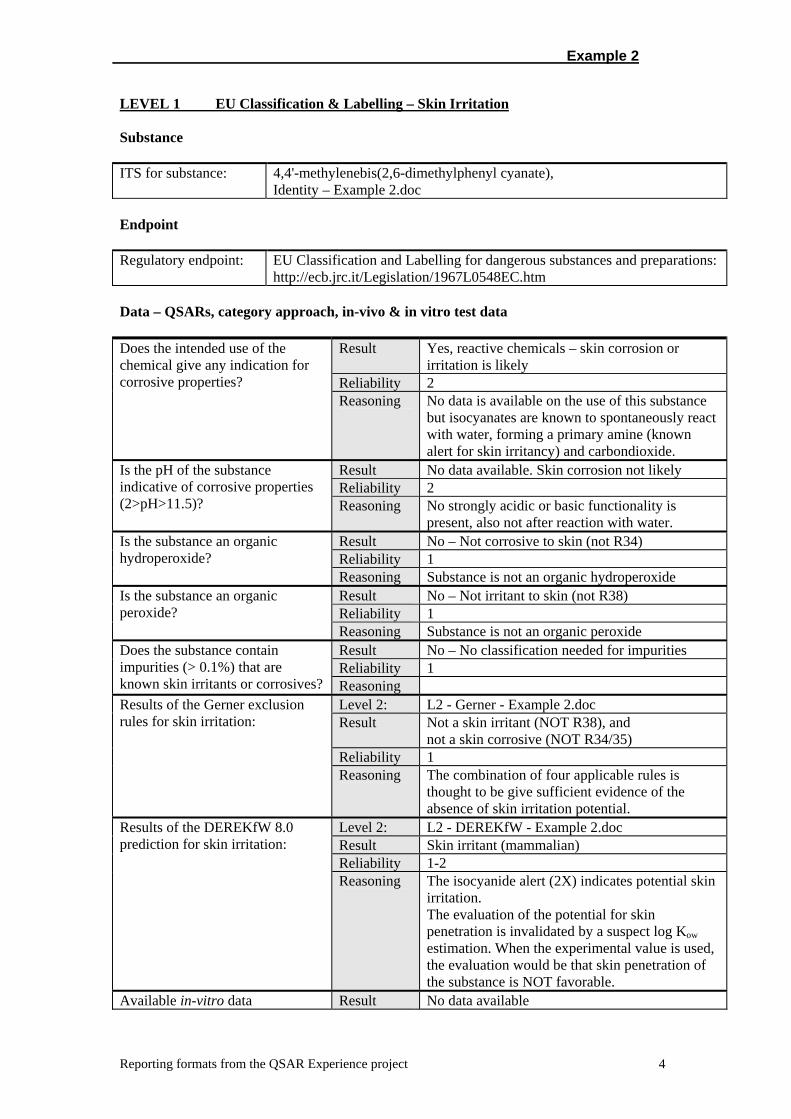
LEVEL 1 EU Classification & Labelling – Skin Irritation Substance ITS for substance: 4,4'-methylenebis(2,6-dimethylphenyl cyanate),
Identity – Example 2.doc Endpoint Regulatory endpoint: EU Classification and Labelling for dangerous substances and preparations:
http://ecb.jrc.it/Legislation/1967L0548EC.htm Data – QSARs, category approach, in-vivo & in vitro test data
Result Yes, reactive chemicals – skin corrosion or irritation is likely
Reliability 2
Does the intended use of the chemical give any indication for corrosive properties?
Reasoning No data is available on the use of this substance but isocyanates are known to spontaneously react with water, forming a primary amine (known alert for skin irritancy) and carbondioxide.
Result No data available. Skin corrosion not likely Reliability 2
Is the pH of the substance indicative of corrosive properties (2>pH>11.5)? Reasoning No strongly acidic or basic functionality is
present, also not after reaction with water. Result No – Not corrosive to skin (not R34) Reliability 1
Is the substance an organic hydroperoxide?
Reasoning Substance is not an organic hydroperoxide Result No – Not irritant to skin (not R38) Reliability 1
Is the substance an organic peroxide?
Reasoning Substance is not an organic peroxide Result No – No classification needed for impurities Reliability 1
Does the substance contain impurities (> 0.1%) that are known skin irritants or corrosives? Reasoning
Level 2: L2 - Gerner - Example 2.doc Result Not a skin irritant (NOT R38), and
not a skin corrosive (NOT R34/35) Reliability 1
Results of the Gerner exclusion rules for skin irritation:
Reasoning The combination of four applicable rules is thought to be give sufficient evidence of the absence of skin irritation potential.
Level 2: L2 - DEREKfW - Example 2.doc Result Skin irritant (mammalian) Reliability 1-2
Results of the DEREKfW 8.0 prediction for skin irritation:
Reasoning The isocyanide alert (2X) indicates potential skin irritation. The evaluation of the potential for skin penetration is invalidated by a suspect log Kow estimation. When the experimental value is used, the evaluation would be that skin penetration of the substance is NOT favorable.
Available in-vitro data Result No data available
Reporting formats from the QSAR Experience project 4

Example 2
Reliability Reasoning Result No data available Reliability
Available in-vivo data
Reasoning Conclusion
Result Not a skin irritant, NOT R38 or R34/35 Reliability 1
Weighted summary of the presented data
Reasoning pH, chemical class and purity of the substance do not require classification. Physico-chemical properties of the substance indicate absence of skin irritation potential (Gerner rules). The presence of a structural alert (isocyanide, DEREKfW) indicates potential for skin irritation, but this potential is diminished by the phys.chem. properties. DEREKfW also indicates the importance of physico-chemical properties favouring or hindering skin penetration in the interpretation of the validity of the alert. Overall the substance is evaluated as not requiring C&L for skin irritation or skin corrosion.
Need for further testing? > Physico-chemical or
related to model input > In vitro testing > In vivo testing
> >.
Reporting formats from the QSAR Experience project 5
Example 2
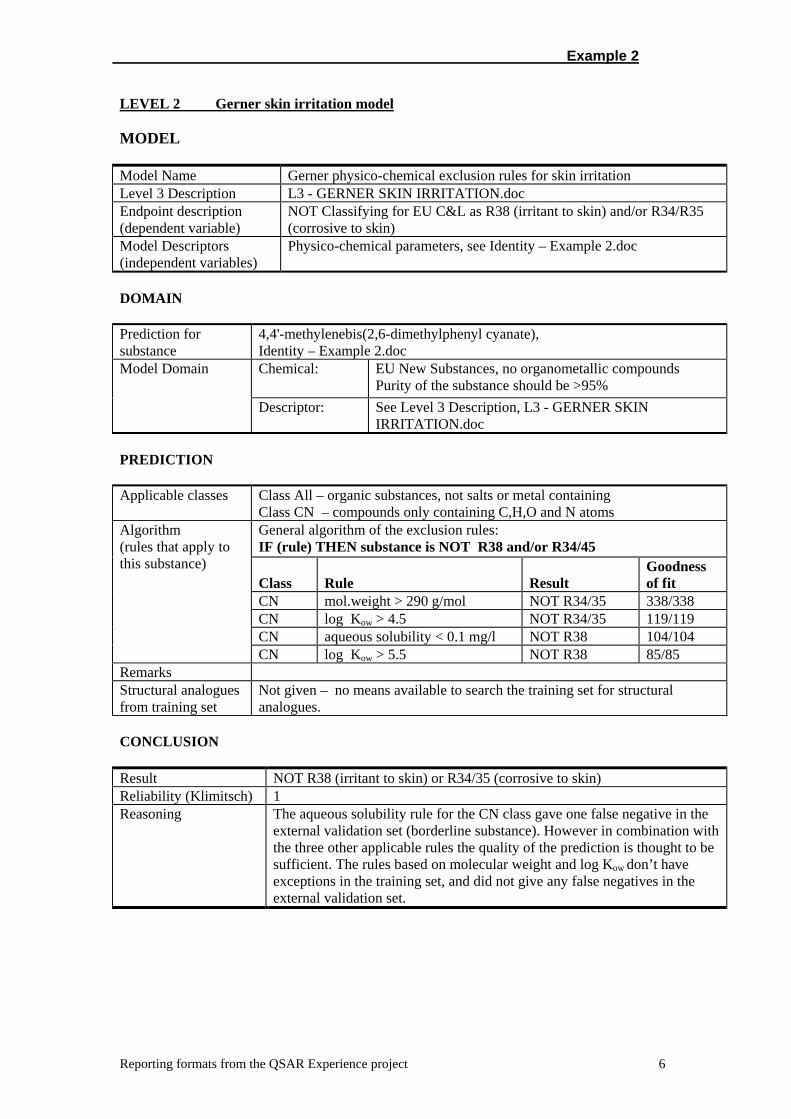
LEVEL 2 Gerner skin irritation model MODEL Model Name Gerner physico-chemical exclusion rules for skin irritation Level 3 Description L3 - GERNER SKIN IRRITATION.doc Endpoint description (dependent variable)
NOT Classifying for EU C&L as R38 (irritant to skin) and/or R34/R35 (corrosive to skin)
Model Descriptors (independent variables)
Physico-chemical parameters, see Identity – Example 2.doc
DOMAIN Prediction for substance
4,4'-methylenebis(2,6-dimethylphenyl cyanate), Identity – Example 2.doc Chemical: EU New Substances, no organometallic compounds
Purity of the substance should be >95% Model Domain
Descriptor: See Level 3 Description, L3 - GERNER SKIN IRRITATION.doc
PREDICTION Applicable classes Class All – organic substances, not salts or metal containing
Class CN – compounds only containing C,H,O and N atoms General algorithm of the exclusion rules: IF (rule) THEN substance is NOT R38 and/or R34/45 Class
Rule
Result
Goodness of fit
CN mol.weight > 290 g/mol NOT R34/35 338/338 CN log Kow > 4.5 NOT R34/35 119/119 CN aqueous solubility < 0.1 mg/l NOT R38 104/104
Algorithm (rules that apply to this substance)
CN log Kow > 5.5 NOT R38 85/85 Remarks Structural analogues from training set
Not given – no means available to search the training set for structural analogues.
CONCLUSION Result NOT R38 (irritant to skin) or R34/35 (corrosive to skin) Reliability (Klimitsch) 1 Reasoning The aqueous solubility rule for the CN class gave one false negative in the
external validation set (borderline substance). However in combination with the three other applicable rules the quality of the prediction is thought to be sufficient. The rules based on molecular weight and log Kow don’t have exceptions in the training set, and did not give any false negatives in the external validation set.
Reporting formats from the QSAR Experience project 6
Example 2
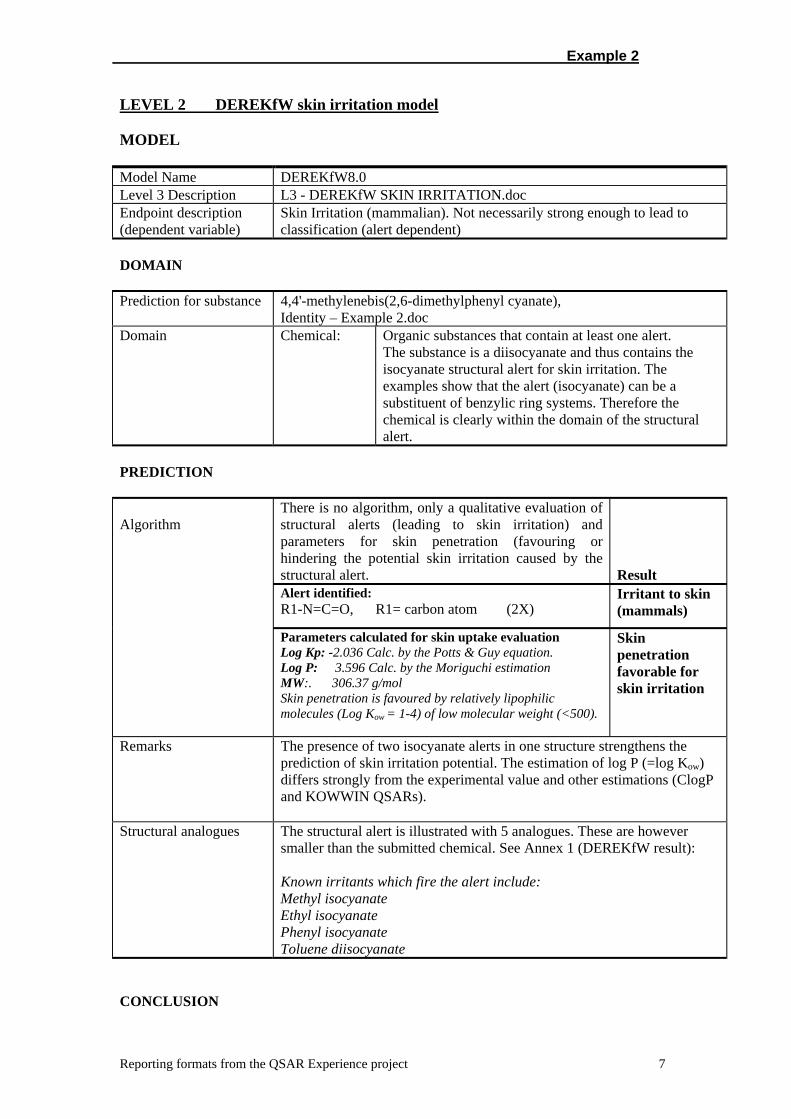
LEVEL 2 DEREKfW skin irritation model MODEL Model Name DEREKfW8.0 Level 3 Description L3 - DEREKfW SKIN IRRITATION.doc Endpoint description (dependent variable)
Skin Irritation (mammalian). Not necessarily strong enough to lead to classification (alert dependent)
DOMAIN Prediction for substance 4,4'-methylenebis(2,6-dimethylphenyl cyanate),
Identity – Example 2.doc Domain Chemical: Organic substances that contain at least one alert.
The substance is a diisocyanate and thus contains the isocyanate structural alert for skin irritation. The examples show that the alert (isocyanate) can be a substituent of benzylic ring systems. Therefore the chemical is clearly within the domain of the structural alert.
PREDICTION
There is no algorithm, only a qualitative evaluation of structural alerts (leading to skin irritation) and parameters for skin penetration (favouring or hindering the potential skin irritation caused by the structural alert.
Result
Alert identified: R1-N=C=O, R1= carbon atom (2X)
Irritant to skin (mammals)
Algorithm
Parameters calculated for skin uptake evaluation Log Kp: -2.036 Calc. by the Potts & Guy equation. Log P: 3.596 Calc. by the Moriguchi estimation MW:. 306.37 g/mol Skin penetration is favoured by relatively lipophilic molecules (Log Kow = 1-4) of low molecular weight (<500).
Skin penetration favorable for skin irritation
Remarks The presence of two isocyanate alerts in one structure strengthens the prediction of skin irritation potential. The estimation of log P (=log Kow) differs strongly from the experimental value and other estimations (ClogP and KOWWIN QSARs).
Structural analogues The structural alert is illustrated with 5 analogues. These are however smaller than the submitted chemical. See Annex 1 (DEREKfW result): Known irritants which fire the alert include: Methyl isocyanate Ethyl isocyanate Phenyl isocyanate Toluene diisocyanate
CONCLUSION
Reporting formats from the QSAR Experience project 7
Example 2
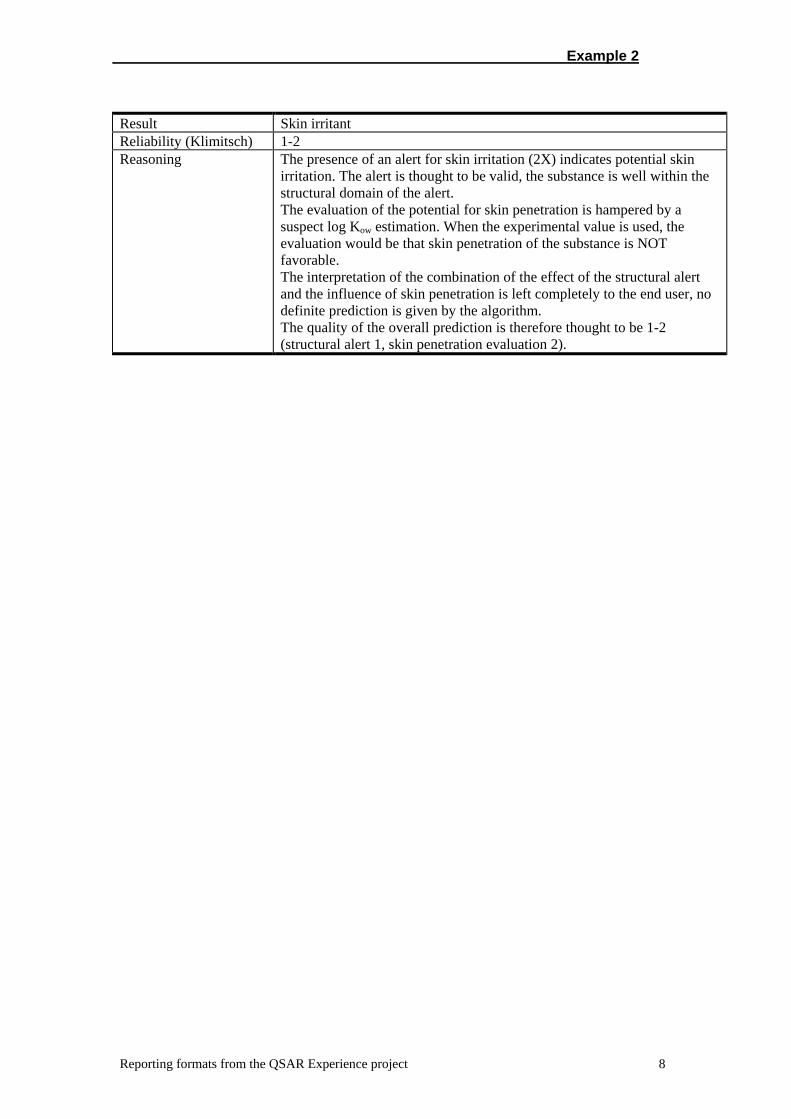
Result Skin irritant Reliability (Klimitsch) 1-2 Reasoning The presence of an alert for skin irritation (2X) indicates potential skin
irritation. The alert is thought to be valid, the substance is well within the structural domain of the alert. The evaluation of the potential for skin penetration is hampered by a suspect log Kow estimation. When the experimental value is used, the evaluation would be that skin penetration of the substance is NOT favorable. The interpretation of the combination of the effect of the structural alert and the influence of skin penetration is left completely to the end user, no definite prediction is given by the algorithm. The quality of the overall prediction is therefore thought to be 1-2 (structural alert 1, skin penetration evaluation 2).
Reporting formats from the QSAR Experience project 8
Example 2
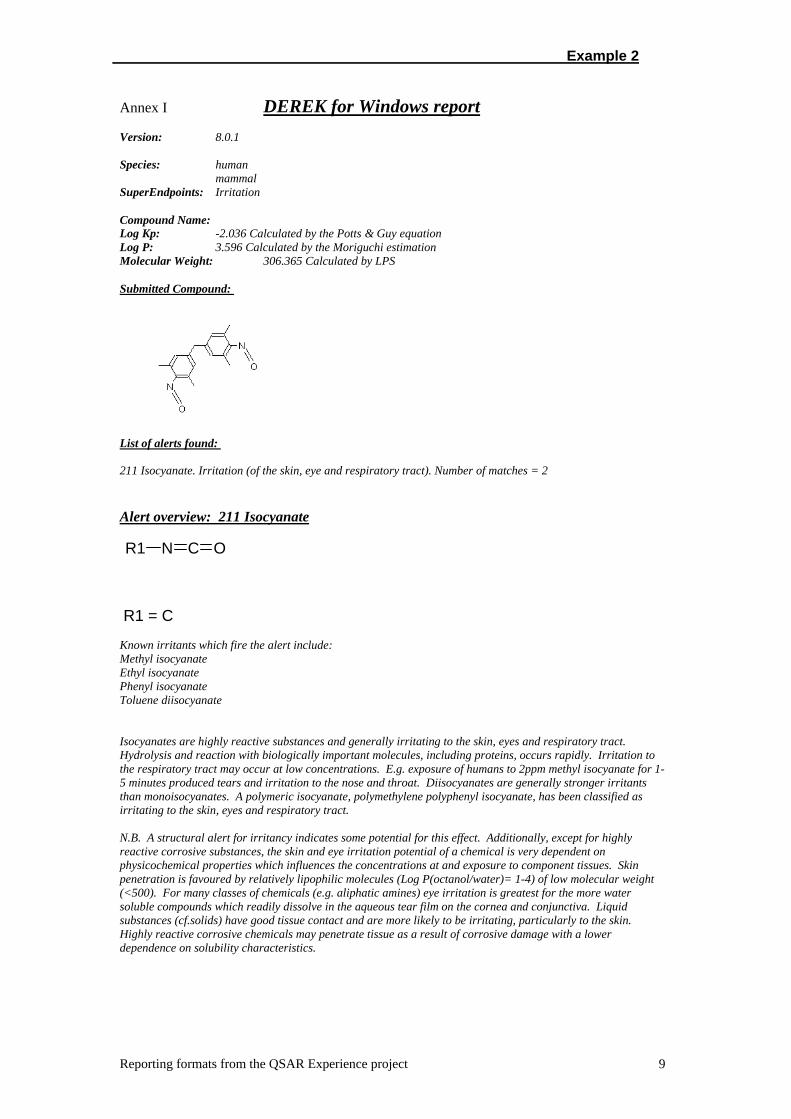
Annex I DEREK for Windows report Version: 8.0.1 Species: human mammal SuperEndpoints: Irritation Compound Name: Log Kp: -2.036 Calculated by the Potts & Guy equation Log P: 3.596 Calculated by the Moriguchi estimation Molecular Weight: 306.365 Calculated by LPS Submitted Compound:
List of alerts found: 211 Isocyanate. Irritation (of the skin, eye and respiratory tract). Number of matches = 2
Alert overview: 211 Isocyanate
N OR1 C
R1 = C Known irritants which fire the alert include: Methyl isocyanate Ethyl isocyanate Phenyl isocyanate Toluene diisocyanate Isocyanates are highly reactive substances and generally irritating to the skin, eyes and respiratory tract. Hydrolysis and reaction with biologically important molecules, including proteins, occurs rapidly. Irritation to the respiratory tract may occur at low concentrations. E.g. exposure of humans to 2ppm methyl isocyanate for 1-5 minutes produced tears and irritation to the nose and throat. Diisocyanates are generally stronger irritants than monoisocyanates. A polymeric isocyanate, polymethylene polyphenyl isocyanate, has been classified as irritating to the skin, eyes and respiratory tract. N.B. A structural alert for irritancy indicates some potential for this effect. Additionally, except for highly reactive corrosive substances, the skin and eye irritation potential of a chemical is very dependent on physicochemical properties which influences the concentrations at and exposure to component tissues. Skin penetration is favoured by relatively lipophilic molecules (Log P(octanol/water)= 1-4) of low molecular weight (<500). For many classes of chemicals (e.g. aliphatic amines) eye irritation is greatest for the more water soluble compounds which readily dissolve in the aqueous tear film on the cornea and conjunctiva. Liquid substances (cf.solids) have good tissue contact and are more likely to be irritating, particularly to the skin. Highly reactive corrosive chemicals may penetrate tissue as a result of corrosive damage with a lower dependence on solubility characteristics.
Reporting formats from the QSAR Experience project 9
Example 2
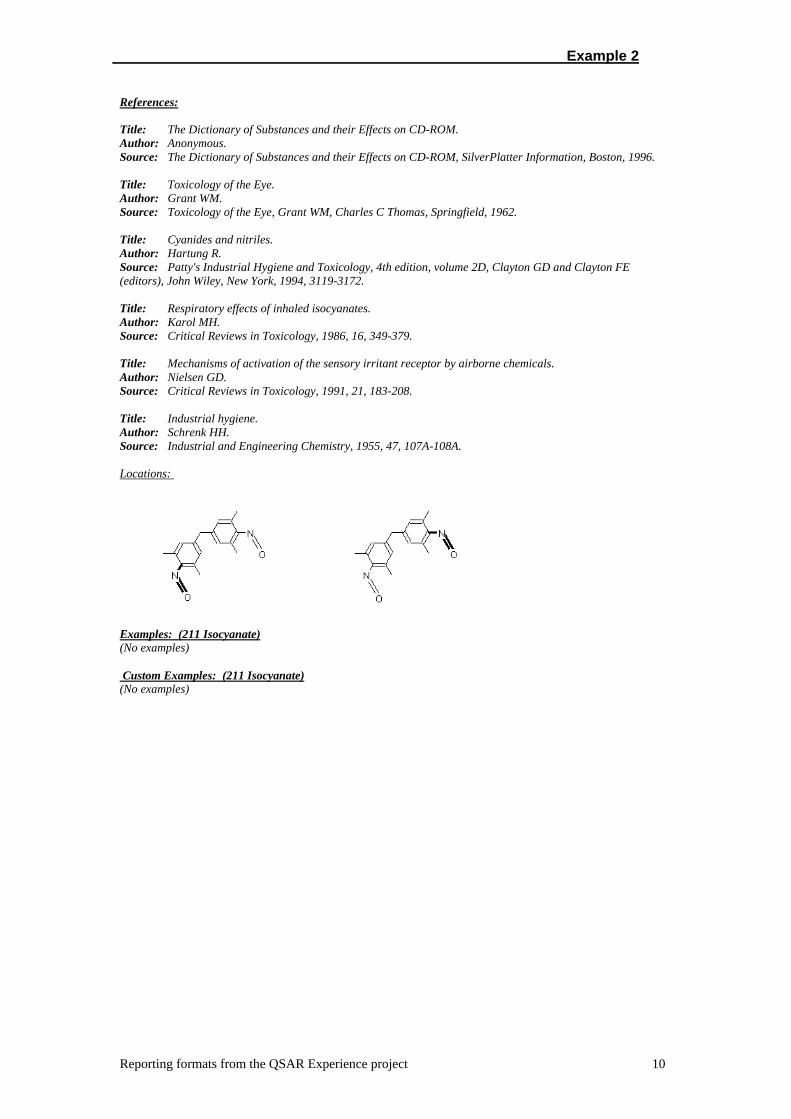
References: Title: The Dictionary of Substances and their Effects on CD-ROM. Author: Anonymous. Source: The Dictionary of Substances and their Effects on CD-ROM, SilverPlatter Information, Boston, 1996. Title: Toxicology of the Eye. Author: Grant WM. Source: Toxicology of the Eye, Grant WM, Charles C Thomas, Springfield, 1962. Title: Cyanides and nitriles. Author: Hartung R. Source: Patty's Industrial Hygiene and Toxicology, 4th edition, volume 2D, Clayton GD and Clayton FE (editors), John Wiley, New York, 1994, 3119-3172. Title: Respiratory effects of inhaled isocyanates. Author: Karol MH. Source: Critical Reviews in Toxicology, 1986, 16, 349-379. Title: Mechanisms of activation of the sensory irritant receptor by airborne chemicals. Author: Nielsen GD. Source: Critical Reviews in Toxicology, 1991, 21, 183-208. Title: Industrial hygiene. Author: Schrenk HH. Source: Industrial and Engineering Chemistry, 1955, 47, 107A-108A. Locations:
Examples: (211 Isocyanate)(No examples) Custom Examples: (211 Isocyanate)(No examples)
Reporting formats from the QSAR Experience project 10
Example 2
LEVEL 3 QSAR model of Gerner et al., 1. QSAR identifier
Literature model (2004/5) and software package DSS (2000), the latter is not evaluated
2. Source
The empirical rulebase model uses physical-chemical cut off values for specific empirical classes, that predicts the absence of skin corrosion or irritation. The model is developed by Gerner and co-workers at BfR in Berlin, Germany and was first reported in 2000 and updated in 2004 (Gerner et al. and Zinke et al.). More information and its potential use in testing strategies are described in (Walker et al, 2005).
2.1 Reference(s) to scientific papers and/or software packages Gerner, I., Graetschel, G., Kahl, J., Schlede, E. Development of a Decision Support System
for the Introduction of Alternative Methods into Local Irritation/Corrosion Testing Strategies: Development of a Relational Data Base. ATLA 2000, 28, 11-28.
Gerner, I., Zinke, S., Graetschel, G., Schlede, E. Development of a Decision Support System for the Introduction of Alternative Methods into Local Irritancy/Corrosivity Testing Strategies. Creation of Fundamental Rules for a Decision Support System. ATLA 2000, 28, 665-698.
Zinke, S., Gerner, I., Graetschel, G., Schlede, E. Local irritation/corrosion testing strategies: Development of a decision support system for the introduction of alternative methods. ATLA 1999, 28, 29-40.
Zinke, S. and Gerner, I. Local irritation/corrosion testing strategies: Extending a decision support system by applying self-learning classifiers. ATLA 2000, 28, 651-663.
Gerner, I., Walker J.D., Hulzebos, E., Schlegel, K., Use of physicochemical property limits to develop rules for identifying chemical substances with no skin irritation or corrosion potential, QSAR Comb. Sci., 23, 726-733 (2004).
Walker, J.D., Gerner I., Hulzebos, E., Schlegel, K. (Q)SARs for predicting skin irritation and corrosion: Mechanisms, transparency and applicability of predictions, QSAR Comb. Sci., 23, 721-725 (2004).
Walker, J.D., Gerner, I., Hulzebos, E.T., Schlegel, K. The skin irritation corrosion rules estimation tool (SICRET), QSAR Comb. Sci., 24, 378-384 (2005).
2.2 Date of publication
A number of publications are given though key dates are notably 1999/2000. 2.3 Identification of the model developer(s)/authors
Dr. I. Gerner and co-workers at BfR. Matthias Herzler is the (Q)SAR contact point. Dr. Matthias Herzler Bundesinstitut für Risikobewertung (BfR) Sicherheit von Stoffen und Zubereitungen Toxikologie der Pestizide Thielallee 88-92
Reporting formats from the QSAR Experience project 11
Example 2
14195 Berlin Fon 01888 412 4402 Fax 01888 412 3260 Mail [email protected]
2.4 Contact details of the model developer(s)/authors
The model can be derived from literature data. 2.5 Indication of whether the model is proprietary of non-proprietery
The model that predicts the chemicals is not proprietary, the details of the training set are.
3. Type of model 3.1 1-D (Q)SARs Empirical formulas
3.2 2-D (Q)SARs
3.3 3-D (Q)SARs
3.4 Battery of models Overall prediction depends on applicability of multiple models/rules
3.5 Expert system Overall prediction depends on application of multiple models/rules and use of data
in knowledge base
3.6 Empirical system
3.6 Neural network
3.7 Other 4. Definition of the model
The rabbit skin irritation test is the bases for the model (OECD404). The outcome of the test into a regulatory application is a two step process. The application of the chemical on the skin can result in erythema and oedema. The severeness and persistency of the effects is reflected in Draize irritation scores, that need to be reported in prescribed time intervals 1h, 24, 48 and 72h up to 21 days when effects are persisting. In the second step the scores are categorised using certain cut offs of the Draize scores, including persistency, for regulatory decision making in EU. The three categories are non-irritant, irritant, or corrosive. The classification and labelling of chemicals is used for risk reduction measures for workers and consumers that are exposed to these chemicals.
The endpoint that the model predicts is not the outcome of the skin irritation test, the effects reported as Draize scores, but it predicts the categorisation of the chemical. The model can therefore be directly used for regulatory EU classification and labelling purposes.
Reporting formats from the QSAR Experience project 12
Example 2
4.1 Defined endpoint
4.1.1. Species: The relevant test guideline determines the species being modelled though is typically a rabbit.
4.1.2 Endpoint: The endpoint is EU classification and labelling for skin irritation.
4.1.3 Units of measurement: The unit of measurement has to be interpreted as the chemical is corrosive, irritant and non-irritant.
4.1.4 Reference to a specific protocol: The reference to the experimental protocol is OECD 404
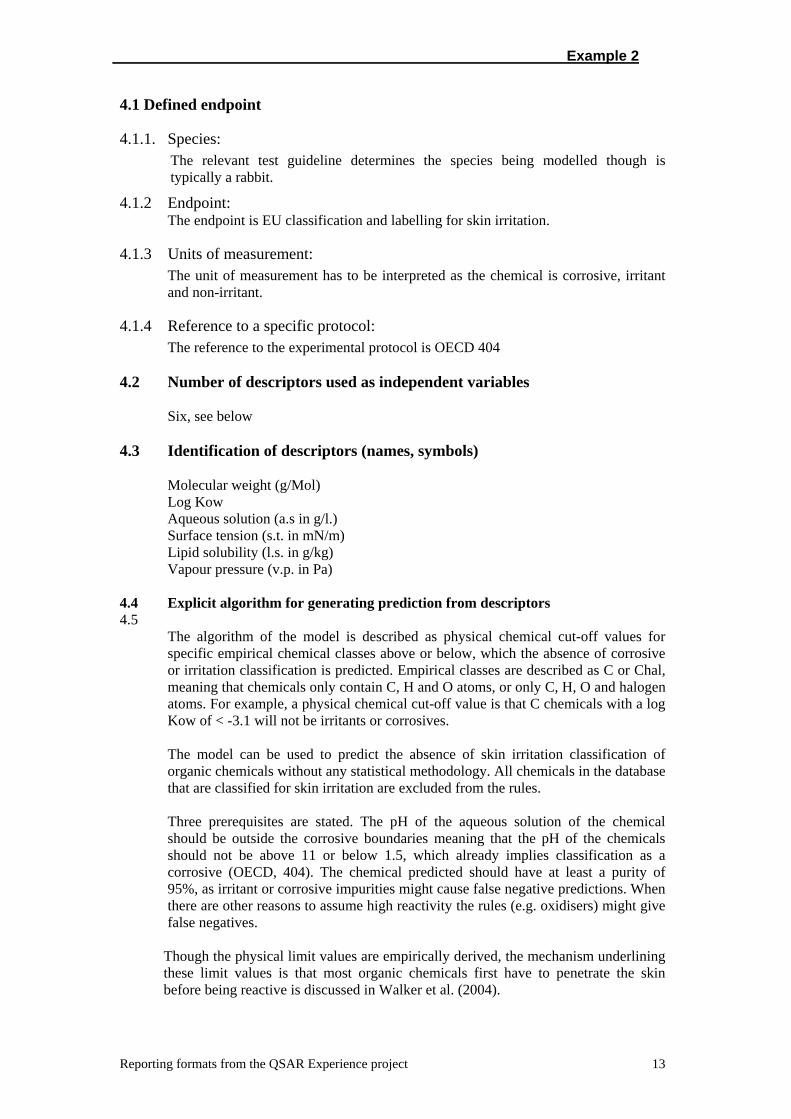
4.2 Number of descriptors used as independent variables Six, see below 4.3 Identification of descriptors (names, symbols)
Molecular weight (g/Mol) Log Kow Aqueous solution (a.s in g/l.) Surface tension (s.t. in mN/m) Lipid solubility (l.s. in g/kg) Vapour pressure (v.p. in Pa)
4.4 Explicit algorithm for generating prediction from descriptors 4.5
The algorithm of the model is described as physical chemical cut-off values for specific empirical chemical classes above or below, which the absence of corrosive or irritation classification is predicted. Empirical classes are described as C or Chal, meaning that chemicals only contain C, H and O atoms, or only C, H, O and halogen atoms. For example, a physical chemical cut-off value is that C chemicals with a log Kow of < -3.1 will not be irritants or corrosives.
The model can be used to predict the absence of skin irritation classification of organic chemicals without any statistical methodology. All chemicals in the database that are classified for skin irritation are excluded from the rules.
Three prerequisites are stated. The pH of the aqueous solution of the chemical should be outside the corrosive boundaries meaning that the pH of the chemicals should not be above 11 or below 1.5, which already implies classification as a corrosive (OECD, 404). The chemical predicted should have at least a purity of 95%, as irritant or corrosive impurities might cause false negative predictions. When there are other reasons to assume high reactivity the rules (e.g. oxidisers) might give false negatives.
Though the physical limit values are empirically derived, the mechanism underlining these limit values is that most organic chemicals first have to penetrate the skin before being reactive is discussed in Walker et al. (2004).
Reporting formats from the QSAR Experience project 13
Example 2
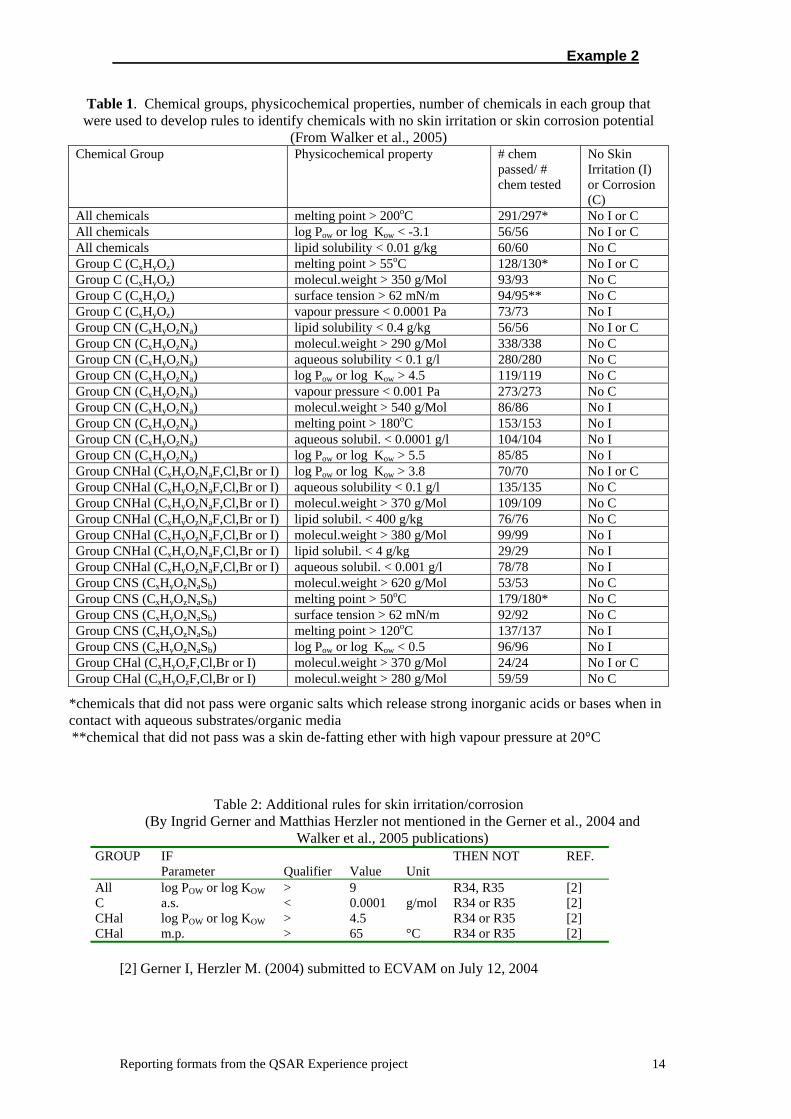
Table 1. Chemical groups, physicochemical properties, number of chemicals in each group that were used to develop rules to identify chemicals with no skin irritation or skin corrosion potential
(From Walker et al., 2005) Chemical Group Physicochemical property # chem
passed/ # chem tested
No Skin Irritation (I) or Corrosion (C)
All chemicals melting point > 200oC 291/297* No I or C All chemicals log Pow or log Kow < -3.1 56/56 No I or C All chemicals lipid solubility < 0.01 g/kg 60/60 No C Group C (CxHyOz) melting point > 55oC 128/130* No I or C Group C (CxHyOz) molecul.weight > 350 g/Mol 93/93 No C Group C (CxHyOz) surface tension > 62 mN/m 94/95** No C Group C (CxHyOz) vapour pressure < 0.0001 Pa 73/73 No I Group CN (CxHyOzNa) lipid solubility < 0.4 g/kg 56/56 No I or C Group CN (CxHyOzNa) molecul.weight > 290 g/Mol 338/338 No C Group CN (CxHyOzNa) aqueous solubility < 0.1 g/l 280/280 No C Group CN (CxHyOzNa) log Pow or log Kow > 4.5 119/119 No C Group CN (CxHyOzNa) vapour pressure < 0.001 Pa 273/273 No C Group CN (CxHyOzNa) molecul.weight > 540 g/Mol 86/86 No I Group CN (CxHyOzNa) melting point > 180oC 153/153 No I Group CN (CxHyOzNa) aqueous solubil. < 0.0001 g/l 104/104 No I Group CN (CxHyOzNa) log Pow or log Kow > 5.5 85/85 No I Group CNHal (CxHyOzNaF,Cl,Br or I) log Pow or log Kow > 3.8 70/70 No I or C Group CNHal (CxHyOzNaF,Cl,Br or I) aqueous solubility < 0.1 g/l 135/135 No C Group CNHal (CxHyOzNaF,Cl,Br or I) molecul.weight > 370 g/Mol 109/109 No C Group CNHal (CxHyOzNaF,Cl,Br or I) lipid solubil. < 400 g/kg 76/76 No C Group CNHal (CxHyOzNaF,Cl,Br or I) molecul.weight > 380 g/Mol 99/99 No I Group CNHal (CxHyOzNaF,Cl,Br or I) lipid solubil. < 4 g/kg 29/29 No I Group CNHal (CxHyOzNaF,Cl,Br or I) aqueous solubil. < 0.001 g/l 78/78 No I Group CNS (CxHyOzNaSb) molecul.weight > 620 g/Mol 53/53 No C Group CNS (CxHyOzNaSb) melting point > 50oC 179/180* No C Group CNS (CxHyOzNaSb) surface tension > 62 mN/m 92/92 No C Group CNS (CxHyOzNaSb) melting point > 120oC 137/137 No I Group CNS (CxHyOzNaSb) log Pow or log Kow < 0.5 96/96 No I Group CHal (CxHyOzF,Cl,Br or I) molecul.weight > 370 g/Mol 24/24 No I or C Group CHal (CxHyOzF,Cl,Br or I) molecul.weight > 280 g/Mol 59/59 No C
*chemicals that did not pass were organic salts which release strong inorganic acids or bases when in contact with aqueous substrates/organic media **chemical that did not pass was a skin de-fatting ether with high vapour pressure at 20°C
Table 2: Additional rules for skin irritation/corrosion (By Ingrid Gerner and Matthias Herzler not mentioned in the Gerner et al., 2004 and
Walker et al., 2005 publications) IF GROUP Parameter Qualifier Value Unit
THEN NOT REF.
All log POW or log KOW > 9 R34, R35 [2] C a.s. < 0.0001 g/mol R34 or R35 [2] CHal log POW or log KOW > 4.5 R34 or R35 [2] CHal m.p. > 65 °C R34 or R35 [2]
[2] Gerner I, Herzler M. (2004) submitted to ECVAM on July 12, 2004
Reporting formats from the QSAR Experience project 14
Example 2
4.6 Goodness-of-fit statistics The third column in table 1 shows the goodness-of-fit. 4.6 Information on the applicability domain of the model
4.6.1 Are full details of the training set given, including details of chemical names, structural formulae, CAS numbers (if available), and data for all descriptor and response variables.
Chemical names, structural formulae and CAS numbers are only available to the
Competent Authorities of the EU member states. The German BfR has put these data in a database and data are confidential. However, the excel file containing the empirical formulas and outcome of the tests are not confidential and could be made available.
The information on descriptor and response values is available in an excel file and could be made publicly available as no confidential data are included. However this excel file is not yet made publicly available.
4.6.2 If the data used to develop the model were based on the processing of raw data (e.g., the averaging of replicate values)
For each chemical(one notification) one test was performed. No averaging of replicate values has been done.
4.6.3 Is there an adequate description of the data processing? The data processing is adequately described.
4.6.4 Are the raw data provided? The raw data are available and provided to the evaluator for the purpose of external
validation by Rorije and Hulzebos (2005).
4.6.5 Does application of the appropriate statistical method(s) to the training set result in the same (Q)SAR model?
The results of the validation (Rorije and Hulzebos, 2005) show that application of the same method results in the same model.
The following remarks should be included: Melting point and Vapour Pressure have their cut-off values set non-conservative.
All rules based on melting point or vapour pressure have exceptions; sometimes a substantial part (44%) of the irritant/corrosive substances is not covered by the chosen cut-off value. It is suggested that the melting point rules are either removed, or that the cut-off values are set at more conservative values e.g., the values covering 100 percent or 100 percent. The rules using vapour pressure cannot be redefined using conservative cut-off values since these would in effect make the rules non-applicable to any substance (a cut-off value of 0 Pa would be needed). It is suggested that vapour pressure will be dismissed as a parameter to base exclusion rules for skin irritancy on. Surface Tension The two exclusion rules based on Surface Tension have not been evaluated because of the limited applicability of the exclusion rules. These rules
Reporting formats from the QSAR Experience project 15
Example 2
apply only to 10 / 201 substances in the validation set, and only 2 of these 10 substances were not covered by any other rules.
4.6.6 Is there a specification of the statistical method(s)used to develop the QSAR (including details of any software packages used)?
There is a specification of the method used. This is however not a statistical method. It is a visual/graphical method that shows at which descriptor value no classification is noticed. No algorithm to determine the cut-off values for specific parameters has been used.
4.7 External validation/Predictivity 4.7.1 An indication whether the model has been validated by using a test set that is
independent of the training set? This has been done twice. First time the external validation is described in the
publication of Zinke et al. [Zinke 1999] on the set of rules described in the same paper. The second external validation is presented in the present report by (Rorije and Hulzebos, 2005)
4.7.2.1 If an external validation has been performed, is the following information available Zinke et al:
In the first validation exercise the rule base, including the use of structural alerts was tested with 331 substances not used for the training the model, which contained 1000 chemicals (Zinke et al., 1999, tables VII and VIII). For skin corrosion a validation was carried out. For skin irritation no such validation was presented. a) number of test structures;
282 (already excluded the skin irritants (16) and the chemicals for which no experimental data was available (33)
b) the identity of the test structures;
c) the specific identity of the chemicals is not publicly available. More details are known to the CA’s of the EU member states;
d) the approach for selecting the test structures;
The next 331 chemicals submitted after deriving the rules were used;
e) the statistical analysis of the predictive performance of the model? (e.g., including sensitivity, specificity, and positive and negative predictivities for classification models);
As the model only predicts the absence of effects, the prediction performance can only be given as specificity and false negatives. The specificity is expressed as the number chemicals that are correctly predicted as not classified divided by the number of chemicals that are negative based on the experimental test. False negative is the fraction of chemicals that showed to be irritating/corrosive, while the absence of skin irritant effects was predicted by the model.
f) the results of the prediction? The results were that the specificity was 63.2% (163/258), was correctly predicted not corrosive. The percentage false negatives was 4.2 % (1/24).
Reporting formats from the QSAR Experience project 16
Example 2
4.7.2.1 In the second validation exercise reported in the present report the following information was available:
a) number of test structures was available: 201.
b) the identity: this was only known as empirical formulas in the excel datasheet. More details are known to the CA’s of the EU member states;
c) the approach for selecting the test structures;
the approach is known: the next 201 chemicals submitted after deriving the rules were used;
Definition of the applicability domain. The distribution of the test set among the empirical classes and descriptor values was compared with the training set. It was concluded that the test set was very similar to the training set and the test set can be considered a real external validation set.
e) The statistical analysis of the predictive performance of the model? (e.g. including sensitivity, specificity, and positive and negative predictivities for classification models);
See above, only specificity and false negatives can be derived
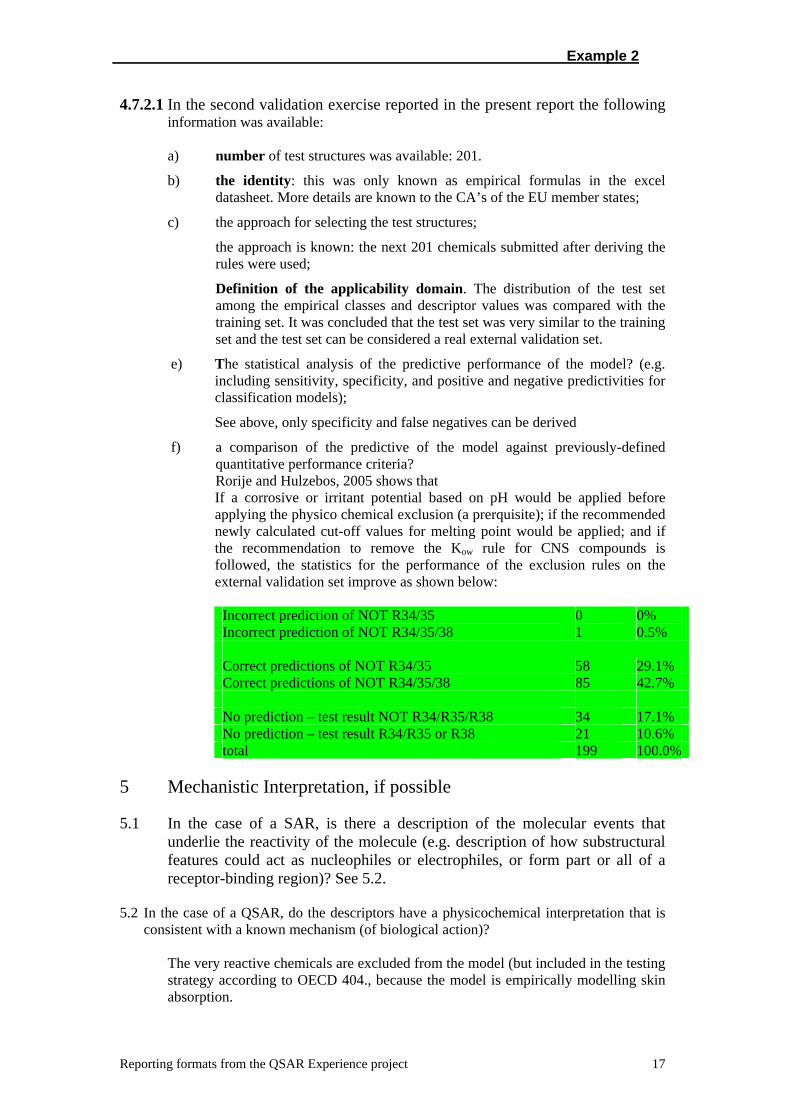
f) a comparison of the predictive of the model against previously-defined quantitative performance criteria? Rorije and Hulzebos, 2005 shows that
If a corrosive or irritant potential based on pH would be applied before applying the physico chemical exclusion (a prerquisite); if the recommended newly calculated cut-off values for melting point would be applied; and if the recommendation to remove the Kow rule for CNS compounds is followed, the statistics for the performance of the exclusion rules on the external validation set improve as shown below: Incorrect prediction of NOT R34/35 Incorrect prediction of NOT R34/35/38
0 1
0% 0.5%
Correct predictions of NOT R34/35 58 29.1% Correct predictions of NOT R34/35/38 85 42.7% No prediction – test result NOT R34/R35/R38 34 17.1% No prediction – test result R34/R35 or R38 21 10.6% total 199 100.0%
5 Mechanistic Interpretation, if possible 5.1 In the case of a SAR, is there a description of the molecular events that
underlie the reactivity of the molecule (e.g. description of how substructural features could act as nucleophiles or electrophiles, or form part or all of a receptor-binding region)? See 5.2.
5.2 In the case of a QSAR, do the descriptors have a physicochemical interpretation that is
consistent with a known mechanism (of biological action)? The very reactive chemicals are excluded from the model (but included in the testing
strategy according to OECD 404., because the model is empirically modelling skin absorption.
Reporting formats from the QSAR Experience project 17
Example 2
5.3 Are any literature references cited in support of the proposed mechanistic basis of the (Q)SAR?
In other related publications literature references are supporting the empirical/mechanistic bases (e.g. Walker et al. 2004) and Hulzebos et al. 2005).
6. Applications of the model Suggestions for possible applications for the model. Skin irritation is predicted in terms of EU classification, chemicals are predicted as non-corrosives, non-irritants. The model can be applied to organic chemicals including the prerequisites on high reactivity, pH and purity for accepting negative predictions. Those chemicals that are predicted non-irritants are neither corrosives and need not be classified for skin irritation. The potential mechanism is often reactivity. Example chemicals are provided, which can possibly be used as analogues or categories, including EU classification if known. 7. Miscellaneous information No additional information 9. References OECD (Organisation for Economic Cooperation and Development). Guideline for Testing
Chemicals No 404, Skin irritation, Paris, (2002). (http://www.oecd.org/dataoecd/45/25/2741642.doc).
Anon, Council Directive 67/548/EEC of 27 June 1967 on the approximation of laws, regulations and administrative provisions relating to the classification, packaging and labelling of dangerous substances, Official Journal of the European Communities 196, 16.8.1967, 1-98 (1967).
EC. Commission Directive 2001/59/EC of 6 August 2001 adapting to technical progress for the 28th time Council Directive 67/548/EEC on the approximation of the laws, regulations and administrative provisions relating to the classification, packaging and labelling of dangerous substances Official Journal L 225 , 21/08/2001 P. 0001 – 0333,Office for Official Publications of the European Communities, Luxembourg, 2001.
OECD, Harmonised integrated classification system for human health and environmental hazards of chemical substances and mixtures, http://www.oecd.org/ehs/ 2001.
Rorije E. and Hulzebos, E. (2005), Evaluation of (Q)SARs for the prediction of skin irritation/corrosion potential. SEC report, publicatie in prep. Available at the ECB website: http://ecb.jrc.it/QSAR/ Documents/Evaluation of skin irritation QSARs
Reporting formats from the QSAR Experience project 18
Example 2
LEVEL 3: DEREK FOR WINDOWS MODEL FOR SKIN IRRITATION
(copied from ECB proposal for sensitization , developed in consultation with LHASA Ltd)
Content DEREK FOR WINDOWS MODEL FOR SKIN IRRITATION ..................................... 19 Content.............................................................................................................................. 19
1. QSAR identifier ........................................................................................................ 19 2. Source ....................................................................................................................... 19 3. Type of model ........................................................................................................... 20 4. Definition of the model............................................................................................. 20
4.1.1 Species ...................................................................................................... 20 4.1.2 Endpoint (including exposure time).......................................................... 20 4.1.4 Reference to specific experimental protocol(s): ....................................... 21
4.2 Number of descriptors used as independent variables:..................................... 21 5. Development of the model........................................................................................ 22
5.2.1 Indication of initial number of descriptors screened................................. 22 6. Validation of the model ............................................................................................ 23 7. Applications of the model................................................................................. 23 8. Miscellaneous information........................................................................................ 23 9. References................................................................................................................. 24
1. QSAR identifier Derek for Windows skin irritation rulebase. Version No 8. 2. Source 2.1 Reference(s) to scientific papers and/or software package:
• Greene, N., Judson, N.P., Langowski, J.J., Marchant, C.A. (1999). Knowledge-based expert systems for toxicity and metabolism prediction: DEREKfW, StAR and METEOR. SAR and QSAR in Environmental Research 10, 299-314.
• Sanderson, D.M., Earnshaw, C.G. (1991). Computer prediction of possible toxic action from chemical structure; The DEREK system. Human & Experimental Toxicology 10, 261-273.
• Zinke, S., Gerner, I., Schlede, E. (2002). Evaluation of a rule base for identifying contact allergens by using a regulatory database: Comparison of data on chemicals notified in the European Union with ‘structural alerts’ used in the DEREKFW Expert System. ATLA 30, 285-298.
• Greene, N. (2002). Computer systems for the prediction of toxicity: an update. Advanced Drug Delivery Reviews 54, 417-431.
2.2 Date of publication: A number of publications though key dates are notably 1986 when the first DEREK system was created at Schering Agrochemicals in the UK and 1989 when LHASA Ltd adopted the DEREK system and began coordinating the main development of the structure-toxicity knowledge base.
Reporting formats from the QSAR Experience project 19
Example 2
2.3 Identification of the model developer(s)/authors: Lhasa Limited LHASA is the acronym for Logic and Heuristics Applied to Synthetic Analysis) 2.4 Contact details of the model developer(s)/authors: 22-23 Blenheim Terrace, Woodhouse Lane, Leeds LS2 9HD, UK Tel: +44 (0)113 394 6020 Fax: +44 (0)113 394 6099 Email: [email protected] Web: www.lhasalimited.org
2.5 Indication of whether the model is proprietary or non-proprietary: Proprietary 3. Type of model 3.1 2D SAR
3.2 3D SAR (e.g. pharmacophore)
3.3 Regression-based QSAR
3.4 3D QSAR
3.3 Battery of (Q)SARs
(overall prediction depends on application of multiple models/rules)
3.4 Expert system
(overall prediction depends on application of multiple models/rules and use of data in a knowledge base)
3.5 Neural network
3.6 Other 4. Definition of the model 4.1 Dependent variable being modeled:
4.1.1 Species The relevant test guideline (OECD404) determines the species being modeled though is typically rabbit
4.1.2 Endpoint (including exposure time) The endpoint is defined as reactivity (acid, bases, oxidisers, reductors, surfactants) and for similar chemicals EU classification for irritation and corrosion is added. The model can be used as an indicator for reactivity and/or a supplier of analogues. 4.1.3 Units of measurement Qualitative predictions are made which do not incorporate any specific unit of measurement.
Reporting formats from the QSAR Experience project 20
Example 2
4.1.4 Reference to specific experimental protocol(s): The skin irritation knowledge encoded within Derek includes both public and proprietary data. Information about the experimental conditions is only given in the references associated with a given alert. Since only a subset of these are fully referenced, the quality of the data used in the derivation of an alert cannot be fully verified.
4.2 Number of descriptors used as independent variables: Not applicable 4.3 Identification of descriptors (names, symbols): Not applicable 4.4 Explicit algorithm for generating predictions from the descriptors: DerekfW8.0 provides an explicit description of the substructure and substituents. When a query structure is processed, the alerts that match are displayed in a hierarchy called the prediction tree and are highlighted in bold in the query structure. The prediction tree includes the endpoint, and reasoning outcome, the number and name of the alert, and the example from the knowledge base if it exactly matches the query structure. The alert description provides a description depicting the structural requirement for the toxicophore detected and a reference to show the bibliographic references used. Some rules are extremely general with substructures only taking into account the immediate environment of a functional group. In other cases, the descriptions are much more specific. This means that remote fragments that may modulate skin irritation are not always taken into consideration in the assessment. DEREKfW contains 25 structural alerts for skin irritation: These alerts include some examples and the algorithms for the SAR are described including possible attachments. 4.5 Goodness-of-fit statistics DEREKfW does not provide the full details of the training data used to develop an alert. Only a subset of the references and example chemicals used to develop the alert are provided for illustrative purposes. 4.6 Information on the applicability domain of the model DEREKfW includes some inclusion/exclusion rules associated with an alert. These are documented in the alert description as particular substituents. For some skin irritation rules there are very clear descriptions of what is covered by a specific substructure. In other cases the rules are extremely general. Physical properties (Log P and MW) are used to limit the domain for skin irritation, by accounting for skin permeability (where dermal absorption is relevant). DEREKfW has limited means of flagging which chemistries are covered in the rulebase and which are not. The program is not suitable for polymers.
4.7 Information on the mechanistic basis/interpretation of the model All the rules in Derek are based on either hypotheses relating to mechanisms of action of a chemical class or observed empirical relationships, the ideas for which come from a variety of sources, including published data or suggestions from the DEREK collaborative group.
Reporting formats from the QSAR Experience project 21
Example 2
This group consists of toxicologists who represent Lhasa Ltd and members who meet at regular intervals to give advice and guidance on the rule development work and predictions made by the program. The hypotheses underpinning each alert are documented in the alert descriptions as comments. These comments often include descriptions of features acting as electrophiles or nucleophiles. However, the detail depends on the specific alert. Some alerts contain no comments, aside from the modulating factors of skin penetration. 5. Development of the model 5.1 Explanation of the method (approach) used to generate each descriptor Any information would be found in the comments section of the alert but this is not systemically provided. 5.2 Selection of descriptors
5.2.1 Indication of initial number of descriptors screened Not applicable 5.2.2 Explanation of the method (approach) used to select the descriptors and develop the
model from them Not applicable 5.2.3 Indication of final number of descriptors included in the model: Not applicable 5.3 Information on experimental design for data splitting into training and
validation sets. Not applicable 5.4 Availability of the training set
5.5.1 Chemical names (common names and/or IUPAC names) 5.5.2 CAS numbers 5.5.3 1D representation of chemical structure (e.g. SMILES) 5.5.4 2D representation of chemical structure (e.g. ISIS sketch file) 5.5.5 3D representation of chemical structure (e.g. MOL file) 5.5.6 Data for each descriptor variable 5.5.7 Data for the dependent variable
DEREK rules describe generalised structure-activity relationships and do not record internally the specific chemical structures on which they are based. Derek is a knowledge base as opposed to a database. This does mean it is possible to use data from confidential sources as a basis for new rules without revealing exact chemicals to end-users. This provides a means by which proprietary data can be used without revealing potentially sensitive information. This is a clear advantage for the purposes of securing business confidentially, but reduces the transparency of the system. The training set information available is limited to a few key example compounds to illustrate the scope of the alert.
Reporting formats from the QSAR Experience project 22
Example 2
6. Validation of the model 6.1 Statistics obtained by leave-one-out cross-validation
None
6.2 Statistics obtained by leave-many-out cross-validation None
6.3 Statistics obtained by Y-scrambling None
6.4 Statistics obtained by external validation None
6.5 Definition of the applicability domain of the model Evaluation exercise was performed by Hulzebos and Posthumus (2005) for DEREKfW 5.0, however the evaluation set of circa 50 chemicals were not detected, as the two alerts for skin irritation of that DEREKfW version were not present in the chemicals 6.6 Availability of the external validation set
6.6.1 Chemical names (common names and/or IUPAC names) 6.6.2 CAS numbers 6.6.3 1D representation of chemical structure (e.g. SMILES) 6.6.4 2D representation of chemical structure (e.g. ISIS sketch file) 6.6.5 3D representation of chemical structure (e.g. MOL file) 6.6.6 Data for each descriptor variable 6.6.7 Data for the dependent variable
Not applicable for DEREKfW 8.0
7. Applications of the model Suggestions for possible applications for the model. Skin irritation is predicted as a potential hazard. The potential mechanism is often reactivity. Example chemicals are provided, which can possibly be used as analogues or categories, including EU classification if known. 8. Miscellaneous information Needed?
• DerekfW is essentially a knowledge archive of structure-toxicity relationships.
• DerekfW is limited in that it identifies only ‘activating’ fragments, meaning the negative prediction is based solely on the lack of structural alerts. Only qualitative outcomes are provided, no measure of potency is provided. Training sets of chemicals containing these structural alerts are not provided. DerekfW does not provide a comprehensive list of references used in the development of each alert. Insufficient information is provided about the quality of the data used in the development of each alert.
• No clear explanation of the domain of applicability is provided that would alert the user as to when a query structure was within or outside the chemical domain of Derek.
Reporting formats from the QSAR Experience project 23
Example 2
• Some of the alerts within DerekfW are very general, explaining the high number of false positives in the external validation studies.
• DerekfW covers a small subset of chemical space, a huge number of rules would need to be developed in order to account for each chemical class. Development of DerekfW is incremental, focusing on each chemical class in turn. DerekfW would improve from adding more information about the modulating factors in the environment of an alert such as remote groups or by calculation of other physiochemical descriptors.
9. References OECD (Organisation for Economic Cooperation and Development). Guideline for Testing
Chemicals No 404, Skin irritation, Paris, (2002). http://www.oecd.org/dataoecd/45/25/2741642.doc).
Anon, Council Directive 67/548/EEC of 27 June 1967 on the approximation of laws, regulations and administrative provisions relating to the classification, packaging and labelling of dangerous substances, Official Journal of the European Communities 196, 16.8.1967, 1-98 (1967).
EC. Commission Directive 2001/59/EC of 6 August 2001 adapting to technical progress for the 28th time Council Directive 67/548/EEC on the approximation of the laws, regulations and administrative provisions relating to the classification, packaging and labelling of dangerous substances Official Journal L 225 , 21/08/2001 P. 0001 – 0333,Office for Official Publications of the European Communities, Luxembourg, 2001.
OECD, Harmonised integrated classification system for human health and environmental hazards of chemical substances and mixtures, http://www.oecd.org/ehs/ 2001.
Reporting formats from the QSAR Experience project 24

Thought-Starter Document on Tools for Conducting Tiered
Bioaccumulation Assessments
HESI ILSI Health and Environmental Sciences Institute
Thought starter for Integrated Testing Strategies related to Bioaccumulation (B) Based on ILSI-HESI and SETAC-NA / -Europe presentations (2004-2006)
These are the basic HESI-SETAC 'B' network messages: 1. We experts can help most by identifying a) what tools (e.g., cut-off values, models,
tests) and qualifiers are helpful for assessors to use today to produce accurate B assessments and b) areas where flexibility in implementation is advisable to account for current concepts and new tools that should become available in 1-5 years as this field grows (e.g., in alternative testing methods).
2. Assessment processes need to be practical: conducting hundreds of OECD 305 BCF tests in 10 years is very unlikely due to the small number of contract labs doing these tests, the high cost of these tests, and pressure from animal welfare groups to reduce in vivo testing. Multiple computer models and test alternatives (e.g., in vitro) need to be allowed in some way so regulatory timings and valid information demands can be met. This is the case globally.
3. Bioaccumulation is not a simple hydrophobicity driven process; it results from ADME processes which should be considered in assessments of diverse chemical classes.
Below is a running list of models and assays that could be considered in tiered approach schemes for B assessment that the HESI-SETAC participants have used or are developing. References are generally available, but not included in the thought starter for simplicity: Lowest Tier: We know nothing about the chemical
a) Cut-off values for chemicals with very high or very low Kow, large mol size, highly charged, highly metabolized by mammals & fish (Mekenyan et. al., De Wolf et. al.)
b) BCF, BAF, BSAF data for analogs within the chemical class (HESI B data sources manuscript, Weisbrod et. al.)
c) phys-chem analyses for Kow; use measured not predicted Kow in B models
d) BCF, BAF, BSAF models predictions for chemical
use weight of evidence from several models to estimate B - not just one model - and models are appropriately used within chemical applicability domain (e.g., SRC BCFWIN, Mekenyan POPs, Gobas BCF, 2 TGD equations, Bonnell food web, Tarazona BAF, Nichols PBPK B model)
Thought starter for Integrated Testing Strategies related to Bioaccumulation (B) Annie Weisbrod (P&G) for ILSI-HESI; 11 April 2006
2
e) ADME information to evaluate the reliability of B model predictions, especially if they must be used for chemicals outside domain of applicability
literature searches for existing fish & mammal data on membrane permeability and biotransformation within the chemical class
predictions by ADME models developed for mammals and used for high through-put screening of these properties by pharmaceutical industry (e.g., ADMET for permeability potential, METEOR for metabolism potential)
Mid tier: Low tier indicates chemical could be absorbed and stored Integrate HESI in vitro research tools, gaps & decision tree manuscript (Erhardt, Nichols, Plotzke, et. al.)
a) in vitro methods to evaluate absorption/bioavailability
Caco2, PLHC-1, and other cell line assays to indicate permeability in specific tissues (e.g., ME Dowty et. al., M Moore & L Vasiluk)
Semi-permeable membrane devices (SPMD) to indicate uptake potential (e.g., JH Kwon et. al., R Heltsley et. al.)
bioaccumulation tests with aquatic invertebrates to indicate uptake potential for vertebrates (L Schuler et. al., Gunnarsson et. al.)
b) in vitro methods to evaluate metabolism
fish or mammal liver S9, microsome, homogenate subcellular fractions to assess low or high metabolic capability (S Erhardt et. al., L Burkhard et. al.)
fish perfused liver & GI (K Kleinow & M James)
c) in vitro methods to evaluate cell accumulation
fish hepatocyte or other cellular cultures to examine accumulation and result in cells (S Dyer & JP Cravedi)
d) techniques to translate in vitro results into in vivo B predictions (J Nichols et. al., Cowan-Ellsberry et. al.)
High tier: Low and mid tier indicate chemical might be 'B'
a) Modified in vivo methods - Less slow, less resource intensive (<$70,000)
cannulated fish to measure ADME rates (D Huggett et. al.)
modified OECD 305 test, single concentration for exposure (not 2) (Woodburn et. al.)
modified OECD 305 test, uptake OR depuration measurements only to calculate BCF (Woodburn & Springer),
Thought starter for Integrated Testing Strategies related to Bioaccumulation (B) Annie Weisbrod (P&G) for ILSI-HESI; 11 April 2006
3
modified OECD 305 test, with shorter duration of uptake & depuration for biotransformable organics - kinetic measurements to calculate BCF (W Bishop & A Maki)
BAF via exposure through food, and ability to test mixtures (Parkerton et. al.)
Uptake & depuration rates for invertebrates (Schuler et. al.)
Critical body burden limit test (Clairant paper?)
b) Standard in vivo methods - Slow, resource intensive (~$125,000)
OECD 305 Bioconcentration in Fish (1995)
o HESI BCF study quality criteria manuscript (Parkerton et. al.)
METI Bioconcentration Study with Medaka (1974, amended 1998)
ASTM E1688-00 Bioaccumulation by Benthic Invertebrates (2000) - produces BSAF
There are no standard tests for BAF to account for exposure through food (Parkerton et. al. could fill that gap)
Highest Tier: Field monitoring (little HESI-SETAC work in this area, so far) D Muir & L Burkhard

ECETOC Report
Revised: 13 March 2006
Integrated Testing Bioconcentration Page 1
Animal Use Replacement, Reduction and Refinement: Development of an 1
Integrated Testing Strategy for Bioconcentration of Chemicals in Fish@ 2
3
Watze de Wolf*,†, Mike Comber‡, Peter Douben§, Sylvia Gimeno||, Martin Holt#, 4
Marc Léonard††, Adam Lillicrap‡‡, Dick Sijm§§, Roger van Egmond|||| , Anne 5
Weisbrod##, and Graham Whale†††. 6
7
Running Header: Integrated Testing Bioconcentration 8
9
† DuPont Coordination Center, Antoon Spinoystraat 6, 2800 Mechelen, Belgium 10
‡ ExxonMobil, Hermeslaan 2, 1831 Machelen, Belgium 11
§ Unilever Colworth, Sharnbrook MK44 1LQ, United Kingdom 12
|| Procter & Gamble, Temselaan 100, 1853 Brussels, Belgium 13
# ECETOC, Av. Van Nieuwenhuyse 4/6, 1160 Brussels, Belgium 14
†† L'Oréal, 1 Av. Eugene Schueller, BP22, 93601 Aulnay-sous-Bois, France 15
‡‡ AstraZeneca, Freshwater Quarry, Brixham TQ5 8BA, United Kingdom 16
§§ RIVM, PO Box 1, 3720 BA Bilthoven, the Netherlands 17
|||| Unilever Colworth, Sharnbrook MK44 1LQ, United Kingdom 18
## The Procter & Gamble Company, 11810 East Miami River Road, Cincinnati, OH 19 45253, USA 20
††† Shell Global Solutions, Cheshire Innovation Park, PO Box 1, Chester CH1 3SH, 21 United Kingdom 22
23
*** Pre-publication, do not cite or distribute per instructions of the authors! ***
*** Pre-publication, do not cite or distribute per instructions of the authors! ***
Revised: 13 March 2006
Integrated Testing Bioconcentration Page 2
* To whom correspondence may be addressed at DuPont Coordination Center, A. 24
Spinoystraat 6, 2800 Mechelen, Belgium, Tel: +32-15-288-731, Fax: +32-15-288-754, 25
Email: [email protected] 26
27
@ This paper is dedicated to Tom C.J. Feijtel (1959 – 2005), who inspired many of 28
us.29
Revised: 13 March 2006
Integrated Testing Bioconcentration Page 3
ABSTRACT 30
When addressing the use of fish for the environmental safety of chemicals and 31
effluents there are many opportunities for applying the principles of the 3Rs: Reduce, 32
Refine and Replace. The current environmental regulatory testing strategy for 33
bioconcentration and secondary poisoning has been reviewed and alternative approaches 34
that provide useful information are described. 35
Several approaches can be used to reduce the number of fish used in the OECD 36
Test Guideline 305, including alternative in vivo test methods such as the dietary 37
accumulation test and the static exposure approach. The best replacement approach 38
would seem to utilise read-across, chemical grouping, and (Q)SARs, with an assessment 39
of the key processes in bioconcentration: adsorption, distribution, metabolism and 40
excretion (ADME). Biomimetic extraction has particular usefulness in addressing 41
bioavailable chemicals and is in some circumstances capable of predicting uptake. Use of 42
alternative organisms such as invertebrates should also be considered. A single cut-off 43
value for molecular weight and size beyond which no absorption will take place cannot 44
be identified. Recommendations for their use in B-categorisation schemes are provided. 45
Assessment of biotransformation with in vitro assays and in silico approaches hold 46
significant promise. Further research is needed to identify their variability, confidence 47
limits, and ways to use this as a basis to estimate BCFs. 48
A tiered bioconcentration testing strategy has been developed taking account of 49
the alternatives discussed. 50
Revised: 13 March 2006
Integrated Testing Bioconcentration Page 4
Keywords: Integrated testing strategy, Bioconcentration, Animal testing, 3Rs, 51
OECD 305 52
53
INTRODUCTION 54
Using animals for safety testing represents a dilemma about balancing the need to 55
ensure chemicals can be handled and used safely, against legitimate and widely felt 56
societal concerns about animal testing. A range of testing is required to provide data for 57
product hazard assessments by the chemicals industry. Tests are based on regulations and 58
voluntary industrial initiatives designed to protect human and wildlife health as well as 59
the surrounding environment. Testing for environmental effects includes assessment of 60
bioconcentration, notably with fish. 61
European legislation requires that non-animal, alternative approaches of testing 62
should be used in the place of animal procedures wherever possible (EEC 1986) states 63
that ‘an experiment shall not be performed if another scientifically satisfactory method of 64
obtaining the result sought, not entailing the use of an animal, is reasonably practically 65
available’. 66
Russell and Burch (1959) originally defined the Replace, Reduce and Refine 67
principles (3Rs). ‘Replacement’ means the substitution for conscious living higher 68
animals of insentient material. ‘Reduction’ means reduction in the numbers of animals 69
used to obtain information of given amount and precision. ‘Refinement’ means any 70
decrease in the incidence or severity of inhumane procedures applied to those animals 71
which still have to be used. 72
Revised: 13 March 2006
Integrated Testing Bioconcentration Page 5
An additional ‘3Rs’ known as the ‘Solna principles’ (OECD 1996a) have been 73
identified. These 3Rs state that tests for regulatory purposes need to reflect the following: 74
biological Relevance (meaningfulness and usefulness of a test for a particular purpose), 75
Reliability (reproducibility of results within and between laboratories), and Regulatory 76
acceptability (suitability of a test for risk assessment purposes (human health / 77
environment). 78
Fish are typically secondary consumers or predators, therefore considered to 79
represent a high trophic level, and organisms of choice for assessing the bioconcentration 80
potential of chemicals in aquatic organisms. Since fish are an important part of the diet of 81
humans, they also represent a potential route of exposure of chemicals to humans. 82
The usual procedure in a regulatory context for determining a bioconcentration 83
factor (BCF) is to apply the OECD 305 (Bioaccumulation: flow-through fish test) (OECD 84
1996b). However, many of the existing chemical legislative frameworks around the 85
world, except in Japan, do not require experimental determination of bioconcentration at 86
basic tiers of the risk assessment; they rely on extrapolation using the organic chemical’s 87
physico-chemical properties (log Kow). This screening procedure assumes no substantial 88
bioconcentration for compounds with a log Kow < 3. Above a log Kow of 6, non-linear 89
relationships can be applied and in most of these cases a chemical by chemical evaluation 90
is more appropriate (Nendza 1991). The log Kow based QSAR approach is not reliable for 91
all chemical classes, e.g. surface active agents, organic colorants (ECETOC 1998) or 92
lipophilic chemicals that are biotransformed (de Wolf et al. 1992). 93
Revised: 13 March 2006
Integrated Testing Bioconcentration Page 6
Bioconcentration factors are used in classification of substances dangerous for the 94
aquatic environment (UN 2003) and in regulatory B-assessments and prioritization 95
schemes (EC 2003; DGEE 2003; CEPA 1999). For example in Europe, if a substance has 96
a BCF > 2,000, it fulfils the criterion for being bioaccumulative (B). If it has a BCF 97
> 5,000, it fulfils the criterion for being very bioaccumulative (vB). 98
The European Commission has recently adopted a draft legislative text, describing the 99
Registration, Evaluation, Authorisation and Restrictions of Chemicals (REACH) (DGEE 100
2003). Chemicals produced at above 1 tonne per year will be subjected to a registration 101
procedure, and information relevant to health and environmental safety should be 102
provided. This could mean approximately 12-13 million animals being used for the 103
assessment of approximately 30,000 chemicals by 2012 (IEH 2001). Non animal testing 104
is promoted in REACH, although strategies for using alternative information 105
methodologies have not been spelt out. However, such strategies are needed not only to 106
achieve the 3Rs, but also to keep the REACH testing costs at manageable levels. 107
The main objective of this paper is to present a bioconcentration testing strategy 108
based on the work of an ECETOC Task Force (ECETOC 2005) that can be applied in a 109
regulatory context taking account of alternative information methodologies. 110
111
BACKGROUND AND CURRENT APPROACHES 112
In the context of animal testing in Europe, the definition used for an animal is that 113
contained in the UK Guidance on the Operation of the Animals (Scientific Procedures) 114
Act, 1986 (UK 1986). This act defines a ‘protected animal’ as any living vertebrate, other 115
Revised: 13 March 2006
Integrated Testing Bioconcentration Page 7
than man [Section 1(1) of the Act]. This was extended to the invertebrate species Octopus 116
vulgaris via an amendment (UK 1993). The protection also extends to certain immature 117
forms of development of mammals, birds and reptiles - from halfway through the 118
gestation or incubation period; and for fish, amphibians and Octopus vulgaris - from the 119
time at which they become capable of independent feeding. Several other definitions for 120
an animal do exist (e.g. EEC 1986; USA 1966) but will not be used here. 121
It is more important that the spirit of the 3Rs is applied, as opposed to which 122
specific category an alternative approach fits. For instance, the use of fish for harvesting 123
of organs or cells is an area for possible confusion as to whether the test is a replacement 124
or a refinement. Fish held in an aquarium and humanely sacrificed are not counted as 125
animals used in an experimental procedure (UK 1986). As a consequence, the use of the 126
organs/cells would constitute a replacement. 127
Accumulation of a chemical is the result of a mix of physiological and physical 128
processes - absorption, distribution, metabolism, and excretion (ADME). The processes 129
are described, based on Hodgeson et al. (1994). Absorption occurs after the introduction 130
of a chemical through food, water, air, sediment, or soil, and it is the transport across a 131
biological membrane into systemic circulation e.g. across fish gills, intestine, skin. After 132
absorption, a chemical may bind to plasma proteins for circulation throughout the body, 133
as well as to tissue components like fat or bone. This is called distribution. The chemical 134
may be distributed to a tissue and elicit a toxic response; other tissues may serve as 135
permanent sinks (e.g. fat), or as temporary depots allowing for slow release into 136
circulation. After reaching a tissue, enzymes may biotransform the chemical. During 137
phase I biotransformation reactions a polar group is introduced into the molecule, which 138
Revised: 13 March 2006
Integrated Testing Bioconcentration Page 8
increases its water solubility and renders it a suitable substrate for phase II reactions. In 139
phase II biotransformation reactions the (parent or altered) molecule combines with an 140
endogenous substrate and can be readily excreted. Biotransformation is generally a 141
detoxification mechanism. Excretion refers to the process by which a chemical gets 142
eliminated from the body through endogenous waste. Chemicals may be exhaled directly 143
through the gills, or may be broken down (biotransformed) and ultimately exhaled as 144
CO2. Polar molecules that are freely soluble in plasma can be removed through renal 145
filtration and passed into urine. Lipophilic (fat soluble) chemicals may be conjugated and 146
excreted in bile (faeces). In addition to excretion, growth of the organism may also be 147
relevant affecting the chemical concentration in the organism, in the case when the rate of 148
other excretion processes is in the same order of magnitude as the growth (dilution) rate. 149
Furthermore, other “excretion” processes could be the transfer of lipophilic chemicals to 150
the offspring via the eggs. 151
For the experimental determination of bioconcentration factors (BCF) in fish, a 152
number of test guidelines have been documented; the most generally applied being 153
OECD 305 (OECD 1996b). OECD 305 is conducted in 2 phases: an exposure phase 154
followed by a depuration phase. In the exposure phase, a sufficient number of fish is 155
exposed to 2 sublethal concentrations of the test substance. During exposure both fish and 156
water are sampled at regular time-intervals and the concentration of (parent) test 157
substance measured. During the first phase the concentration of test substance in the 158
water should be kept constant within narrow limits (± 20%). Hence, the guideline 159
recommends the use of a flow-through system. After having reached an apparent steady-160
state (or after 28 d), the remaining fish are transferred to clean water and the depuration is 161
Revised: 13 March 2006
Integrated Testing Bioconcentration Page 9
followed. The BCF is expressed as a function of total wet weight of the fish and may also 162
be expressed as a function of total lipid weight. Specific chemical analysis and 163
radiotracer techniques may be used as analytical methods. If the latter technique is 164
applied, a specific chemical analysis (or a selective cleaning-up procedure) of the parent 165
compound should be used at the end of the exposure period. 166
OECD 305 requires 3 groups of fish, 2 exposure groups and a control group held 167
under identical conditions. A minimum of 4 fish are sampled on at least 5 occasions 168
during the uptake phase, and at least on 4 occasions during the elimination phase. 169
(Table 1) 170
The guideline does not specify whether it is acceptable to reduce fish sampling in 171
the control group, hence it has to be assumed that the sampling protocol for the control 172
group is similar to that of the 2 exposure groups. 173
Assuming that aquatic organisms can be mathematically represented as a 174
homogenously mixed one-compartment then bioconcentration can be described with a 175
simple first-order kinetic model: 176
Cf = Cw * ku/kd * (1-e-t*kd) 177
where Cf is the substance concentration in fish (mg/g wet fish), Cw the substance 178
concentration in water (mg/l), ku the uptake clearance (ml/g wet fish/day), kd the 179
elimination rate constant (1/day), and t the exposure time (day). In this model, ku and kd 180
are independent of Cw and t, but dependent on the properties of the chemical being 181
bioconcentrated. Usually, first order one compartment kinetics have been found to 182
adequately describe bioconcentration (Sijm 1991; Kristensen et al. 1991). 183
Revised: 13 March 2006
Integrated Testing Bioconcentration Page 10
Hence, there are 2 different methods to evaluate BCF. The first is to calculate it 184
from the concentration of a chemical in fish divided by the concentration in water (under 185
steady-state conditions). The second method uses kinetic data, i.e. uptake clearance and 186
elimination rate. 187
BCF = ku/kd = Cf/Cw 188
Experience from a ring test of the former OECD 305E between European 189
laboratories showed that the variations in BCF estimates between the 2 methods was less 190
than the inter-laboratory variation (Kristensen et al. 1991). This is further improved when 191
a correction for the bioavailable fraction in water is made (Schrap et al. 1990), (e.g. for 192
sorption to suspended or dissolved organic materials). 193
Most of the earlier studies to determine the BCF of highly hydrophobic 194
substances did not always follow the OECD 305 test protocol possibly introducing 195
artefacts in the testing and in the interpretation of the BCFs from these studies. These 196
artefacts may include difficulties in measuring the ‘true’ aqueous concentration due to 197
sorption of the substances to particulate and dissolved (organic) matter; adsorption 198
processes to glass walls or other materials; volatilisation; etc. (Anonymous 2004). 199
For less hydrophobic compounds (log Kow < 3) passive diffusion of freely 200
dissolved, bioavailable material through the cell membrane (i.e. the hydrophobic phase) 201
is considered to be the rate limiting step for uptake. For more hydrophobic compounds 202
diffusion is limited by the aqueous boundary layers between the fish membrane and the 203
bulk water (Gobas et al. 1987). 204
Revised: 13 March 2006
Integrated Testing Bioconcentration Page 11
The uptake clearance (ku; ml/g wet fish/day) is relatively constant between log 205
Kow of 3 and 6 but varies as a function of fish weight (Sijm et al. 1995). For nonionic 206
organic chemicals with log Kow > 6, there is some evidence to suggest that the uptake 207
clearance may decline with increasing hydrophobicity. 208
An estimate of the rate of depuration kd may be obtained from empirical 209
relationships between kd and log Kow. These relationships apply only to chemicals with 210
log Kow values between 2 and 6.5 (Hawker et al. 1988). An important elimination factor 211
in bioconcentration is the possible biotransformation of substances (Sijm et al. 1997) 212
which is ignored when estimating kd via empirical relationships with Kow (de Wolf et al. 213
1992). In such cases kd = ke + km where, ke represents excretion of the parent molecule 214
and km elimination by biotransformation. 215
Since many substances that bioconcentrate distribute themselves within the 216
organism’s body into the fat or lipids, the first estimation that may be carried out for a 217
BCF is of a chemical’s potential to partition between octanol and water. QSARs and 218
experimental techniques for measuring this parameter are available (ECETOC 1998, 219
2003; EC 2003). The recommended model for log Kow up to 6 is Veith et al. (1979), 220
while for chemicals with log Kow > 6, a parabolic equation, re-calculated from that 221
described by Connell et al. (1988), is recommended. In general (Q)SAR-models should 222
only be used for those chemicals which fall within the domain of the model and for which 223
the descriptors are suitable (EC 2003; ECETOC 2003). Surfactants are clear examples of 224
organic materials outside the scope of (Q)SAR models which use log Kow as this is not an 225
appropriate physico-chemical descriptor for such materials. Metals also fall outside most 226
QSAR-models as active uptake and sequestration can occur in biological systems. In 227
Revised: 13 March 2006
Integrated Testing Bioconcentration Page 12
cases where uptake is hindered or elimination via biotransformation is increased EU-228
accepted QSAR-models will overestimate bioconcentration. 229
230
REVIEW OF ALTERNATIVE APPROACHES 231
As part of REACH, it is possible that many chemicals in the tonnage level of 232
more than 100 tonne per annum will need to be tested for their potential to 233
bioconcentrate. Pedersen et al. (2003) estimated that 5,500 chemicals in Europe are 234
manufactured or imported at this tonnage level. Taking into account the 55% percent of 235
HPV-chemicals with a log Kow > 2.7 (Beek 1991), the number of chemicals for BCF-236
testing can be calculated as 3,025. With a minimum number of fish for an OECD 305 237
study estimated at 108 (Table 1), the minimum required number of fish for REACH 238
bioconcentration testing is 326,700. The following sections will review reduction and 239
replacement approaches to assess the bioconcentration potential of chemicals in fish. So 240
far, no refinement strategy has been identified. 241
Reduction of animal use 242
This can be achieved by exposing less fish per replicate/concentration to the 243
minimum that can be statistically justified, or by limiting the numbers of concentration 244
exposures to 1. If the latter is applied, the number of fish used for testing can immediately 245
be reduced by 33% (Table 1). 246
Alternatively, the number of sampling points can be reduced to a number 247
sufficient for estimating the kinetic parameters from the slopes of the uptake and 248
depuration curves (Hinderleiter 2004). Unlike the standard OECD test, steady state does 249
Revised: 13 March 2006
Integrated Testing Bioconcentration Page 13
not need to be achieved. This design can lower the animal usage by approximately 55% 250
(Table 1). Benefits would further include lower cost, faster execution, less waste, and less 251
chemical usage. 252
Another approach to reducing the number of animals used in OECD 305 depends 253
upon the purpose for which the test is being conducted. In some regulatory schemes all 254
that is necessary is to know whether the BCF is greater than a particular trigger value. In 255
such circumstances conducting a depuration phase may not be necessary, reducing the 256
animal usage by approximately 45%. 257
Static exposure procedures allow for determination of uptake clearance and 258
depuration rate constants during bioconcentration of stable substances (Banerjee et 259
al.1984; de Wolf et al. 1998). It requires the exposure of fish to an aqueous solution of 260
the substance under static conditions, and measurement of loss of substance from the 261
exposure system as a function of time. The rate constants are obtained from fitting the 262
time-concentration profile to a simple mathematical model describing the exchange of 263
substance between fish and water. The original approach by Banerjee et al. (1984) 264
measured the substance in water and assumed removal processes such as 265
biotransformation, sorption and volatilisation are not likely to occur. De Wolf et al. 266
(1998) adapted this approach to study volatile materials by exposing fish to an aqueous 267
solution in a fully closed system while measuring loss of substance from the air as a 268
function of time. These approaches use less than 20% of the number of animals as 269
compared to the OECD 305 study (Table 1). 270
Revised: 13 March 2006
Integrated Testing Bioconcentration Page 14
A mathematical analysis of the robustness of static exposure systems (de Wolf et 271
al. 1995) showed reasonably accurate estimates of uptake clearance and elimination rate 272
constants are obtained when the substance concentration in fish is determined at the end 273
of the exposure period, even in cases where (limited) loss occurs due to sorption and 274
biotransformation. Further research comparing empirical data for metabolised substances 275
from both static and flow-through experiments is required to assess the full applicability 276
of the static exposure method. 277
The elimination rate constants measured in a dietary bioaccumulation study takes 278
account of possible biotransformation reactions and may provide information helpful for 279
estimation of the bioconcentration factor. In combination with a conservative estimate of 280
the uptake clearance a reasonable estimate of the BCF can be obtained. 281
In a dietary bioaccumulation study fish are fed chemical-spiked food at a fixed 282
concentration over a specified period of time depending on the expected half-life (T½) 283
(Parkerton et al. 2001). At the end of this dietary exposure period some fish are analysed 284
for parent substance (time = 0 of the depuration phase). The remaining fish are 285
transferred to clean diet, and sequentially sampled and analysed over time so that a 286
depuration curve can be established. From these data the half-life, dietary assimilation 287
efficiency and BAF, defined as the steady-state ratio of the concentration in fish to that in 288
the diet, can be readily derived. 289
Dietary bioaccumulation tests are, in practice, much easier to conduct for poorly 290
water-soluble substances than the OECD 305 test, because a higher and more constant 291
exposure to the substance can be administered via the diet than via water. A pitfall could 292
Revised: 13 March 2006
Integrated Testing Bioconcentration Page 15
be the possibility for overestimation of the BCF in cases where gill uptake clearance rate 293
is reduced. These experiments require approximately 40% of the number of animals used 294
in the OECD 305 (Table 1). 295
Replacement of animals 296
A replacement strategy can be achieved by considering information from other 297
species, or from related chemicals, (Q)SAR modelling, biomimetic or surrogate 298
approaches, in vitro and embryos assays. These approaches are acceptable when 299
validated and fit for the regulatory purpose. 300
Read-across/analogue and chemical grouping/category approaches typically 301
involve using information on one chemical or a group of chemicals, respectively, and 302
making some assessment about the relevance of that information for the unknown value 303
of the non-tested chemical. QSARs for predicting BCF have been extensively evaluated 304
and are mainly based on correlations with Kow (ECETOC 1995, 1998, 2003). Eighty 305
percent of chemicals to be registered under REACH can be covered using a combination 306
of these techniques for estimating bioconcentration (Pedersen et al. 2003). 307
Based on a review of all available BCF data in the literature a computer program 308
that allows for the estimation of BCF-values for a wide range of organic chemicals has 309
been developed (BCFWIN by Meylan et al. 1999). This program estimates the BCF using 310
the substance's log Kow and correction factors to take into account certain structural and 311
molecular factors that influence bioaccumulation by hindering uptake, and other factors 312
that consider biotransformation (www.epa.gov/oppt/p2framework/docs/envfate.htm#Sub4). 313
The approach adopted was to group chemicals and derive relationships for each group. It 314
Revised: 13 March 2006
Integrated Testing Bioconcentration Page 16
was reported that some of these factors could be rationalised on the basis that they were 315
related to some degree of reactivity or known biotransformation behaviour. 316
Arnot and Gobas (2003) have developed a bioaccumulation QSAR based on a 317
mass-balance approach for assessing the bioaccumulation potential of organic chemicals 318
in aquatic food webs. Processes of chemical absorption, distribution, biotransformation 319
and egestion can be accounted for using values representative of a so called “generic 320
fish”. As a result, the QSAR can be adapted to include the effect of metabolic 321
transformation and trophic dilution on the calculated BCF and BAF. The model has been 322
used by Environment Canada to categorize discrete organic substances on the Canadian 323
Domestic Substances List (DSL) for bioaccumulation potential (Environment Canada 324
2003). 325
Another approach aims to address biotransformation starting from first principles 326
(Dimitrov, Dimitrova et al. 2002; Dimitrov, Mekenyan et al. 2002; Dimitrov et al. 2006). 327
Here, BCF is first modelled as a maximum value, ignoring any mitigating factors and 328
based only on log Kow as an indicator of partitioning behaviour. Then the other factors 329
are included, thus size, maximum diameter of 1.5 nm (Dimitrov, Dimitrova et al. 2002) 330
and potential metabolism by fish (Dimitrov et al. 2006) are used to reduce the predicted 331
BCF (www.oasis-lmc.org/software.php). 332
Södergren (1987) described a system based on a semi-permeable membrane 333
device (SPMD) composed of a dialysis bag filled with hexane which has been further 334
developed based on low density polyethylene bags which contain natural lipids or the 335
model lipid triolein (1,2,3-tri[cis-9-octadecenoyl]glycerol) (see Huckins et al. 1997) to 336
mimic the way organisms extract chemicals from water (i.e. biomimetic extraction). 337
Revised: 13 March 2006
Integrated Testing Bioconcentration Page 17
SPMDs are relatively easy to use and will extract only bioavailable chemicals from the 338
water in proportion to their partitioning coefficients simulating the potential for aquatic 339
organisms to bioconcentrate chemicals. However, the equilibration time can be very long 340
thus it has been suggested that results from SPMDs exposed for less than 2 months 341
should be treated with caution (Booij et al. 1998). 342
Arthur et al. (1990) described another biometic extraction approach in which they 343
constructed a Solid Phase Micro Extractor (SPME), composed of a thin polymer coating 344
on a fused silica fibre. This fibre accumulation (and kinetics) is analogous to the 345
bioconcentration of chemicals observed in aquatic organisms (Leslie et al. 2002). The 346
process is very fast, due to the high surface area to volume ratio and generally easy to set 347
up and use (Arthur et al. 1990; Vaes et al. 1996, 1997; Mayer et al. 2003). 348
A general disadvantage of biomimetic extractions is that the ability of fish to 349
metabolise chemicals is not simulated, thus the bioconcentration of chemicals will be 350
over-estimated. Furthermore, the potential for chemicals to be actively taken up via the 351
gut is not addressed. 352
The physiological processes that govern bioconcentration in invertebrates may 353
differ greatly from those in fish (e.g. the biotransformation systems are less developed in 354
most invertebrates). Therefore, the use of invertebrates to assess bioconcentration 355
potential of chemicals in fish cannot be routinely recommended. However, if there is only 356
a need to demonstrate that the BCF in fish is below a certain value, then it may be 357
possible to utilise BCFs from invertebrates as conservative estimations of the BCF in 358
fish. Analogues for risk assessment, the BCF derived from an invertebrate could also be 359
Revised: 13 March 2006
Integrated Testing Bioconcentration Page 18
used as a maximal value, and if the risk assessment indicated no concern then the use of 360
fish to derive a BCF for fish would be difficult to justify. 361
Reduced absorption. Lipinski et al. (1997) first identified 5 physical chemical 362
characteristics that influence solubility and absorption across the intestinal lumen using 363
more than 2,200 drug development tests. These characteristics have been rigorously 364
reviewed (Wenlock et al. 2003; Proudfoot 2005), used to develop commercial models to 365
estimate absorption in mammals, and are commonly used by the human and veterinary 366
pharmaceutical industry. Although less research has been conducted in fish, data indicate 367
significant similarity among all vertebrates, as described below. 368
“Lipinksi’s Rule of 5” allowed the prediction of poor solubility, and poor 369
absorption from chemical structure. A chemical is not likely to cross a biological 370
membrane in quantities sufficient to exert a pharmacological or toxic response when it 371
has more than 5 Hydrogen (H)-bond donors, 10 H-bond acceptors, molecular weight 372
greater than 500, and has a Log Kow value greater than 5 (Lipinksi et al. 1997). Wenlock 373
et al. (2003) studied about 600 additional chemicals and found that 90% of the absorbed 374
compounds had fewer than 4 Hydrogen (H)-bond donors, < 7 H-bond acceptors, 375
molecular weight less than 473, and had a Log D value less than 4.3. More recent work 376
by Vieth et al. (2004) and Proudfoot (2005) supports the lower numbers. Molecular 377
charge and the number of rotational bonds will also affect absorption by passive diffusion 378
across a membrane or diffusion between cells. 379
The “leakiness” of a tissue, or its ability to allow a chemical to passively diffuse 380
through it, is measured using trans-epithelial electrical resistance (TEER) and can be used 381
Revised: 13 March 2006
Integrated Testing Bioconcentration Page 19
to compare tissue capabilities. A low TEER value indicates the tissue has greater 382
absorption potential. Although the studies by Lipinski et al. (1997), Wenlock et al. 383
(2003), Vieth et al. (2004) and Produdfoot (2005) focussed on absorption across the 384
intestinal lumen, the more restrictive TEER for fish gills (Table 2) implies that the 385
equations and concepts can be reapplied to conservatively estimate absorption in fish. 386
Molecular weight. Several values have been suggested for the molecular weight 387
(MW) cut-off for absorption across fish tissues. The EU TGD (EC 2003) indicates that 388
molecules with a MW greater than 700 g/mol are less likely to be absorbed and 389
bioconcentrate, whereas the US EPA, exempts chemicals with a molecular weight of 390
above 1,100 g/mol in the PBT assessment conducted under the Toxic Substances Control 391
Act (US EPA 1999). Anliker et al. (1988) suggested that a pigment could be excluded 392
from a fish bioaccumulation test if it has both a molecular weight of greater than 450 and 393
a cross section of over 1.05 nm (as the second smallest van der Waals diameter or Ceff). 394
Rekker et al. (1992) suggested that a calculated log Kow of > 8 can be used on its own, or 395
in combination with a molecular weight of > 700-1,000 to conclude (with confidence) 396
that the compound is unlikely to bioaccumulate. While there has been limited 397
experimental evidence for a molecular weight cut-off, Burreau et al. (2004) did 398
demonstrate reduced bioconcentration and no biomagnification for high molecular weight 399
polybrominated diphenyl ethers, with 6 or more bromines, molecular weight 644-959. 400
Considering that molecular size and shape vary versus MW, molecular weight alone is 401
insufficient to allow absorption predictions. However, it does suggest that once the 402
molecular weight is in the region of 700 - 1,100, depending on other factors, a reduced 403
BCF may be expected. Hence, while recognising the uncertainties in the interpretation of 404
Revised: 13 March 2006
Integrated Testing Bioconcentration Page 20
experimental results, we recommend that to demonstrate a reduced BCF a substance 405
should have either: 406
• a molecular weight in excess of 1,100 g/mol, or 407
• a molecular weight of 700 – 1,100 g/mol with other indicators (see later 408
discussion). 409
Molecular size. Molecular size may be considered as a more refined approach, 410
taking into account molecular shape and flexibility explicitly rather than molecular 411
weight alone. Opperhuizen et al. (1985) suggested a limiting cross sectional diameter for 412
gill membrane permeation of 0.95 nm. in their study on polychlorinated naphthalenes 413
(PCNs) bioconcentration Loonen et al. (1994) studied the bioconcentration of 414
polychlorinated dibenzo-p-dioxins and polychlorinated dibenzofurans and found that the 415
laterally substituted (2,3,7,8 substituted) were bioconcentrated while the non-laterally 416
substituted were not. The main reason for this was attributed to metabolism (previously 417
reported by Opperhuizen et al. 1990; Sijm et al. 1993), however, lower lipid solubility 418
and lower membrane permeability were also considered to have played a role in the 419
reduced BCFs observed. The non-accumulating structures would all have exceeded the 420
effective cross-sectional diameter of 0.95 nm. 421
Anliker et al. (1987) studied the limits of bioconcentration of azo pigments in fish 422
and their relation to the partition coefficient and the solubility in water and octanol. 423
Despite a high calculated log Kow for 2 pigments, the experimentally determined log 424
BCFs were low. The explanation for this apparent inconsistency is the very limited fat 425
(lipid) storage potential of these pigments, indicated by their low solubility in n-octanol 426
Revised: 13 March 2006
Integrated Testing Bioconcentration Page 21
(< 1 and < 0.1 mg/L; see below) and their large molecular size (i.e. cross sectional 427
diameters of 0.97 and 1.68 nm). 428
Anliker et al. (1988) assessed 23 disperse dyestuffs, 2 organic pigments and a 429
fluorescent whitening agent, for which the experimental BCFs in fish were known. 430
Sixteen halogenated aromatic hydrocarbons were included for comparison. None of the 431
disperse dyestuffs, even the highly lipophilic ones with log Kow > 3, accumulated 432
significantly in fish. Their large molecular size was suggested to prevent their effective 433
permeation through biological membranes and thus limit their uptake during the time of 434
exposure. Anliker proposed that a second largest cross section of over 1.05 nm with 435
molecular weight of greater than 450 would suggest a lack of bioconcentration for 436
organic colourants. 437
Although lack of bioconcentration of some chemicals with a cross section of 438
> 0.95 nm has been explained by limited membrane permeability, other studies have 439
demonstrated uptake by fish and other species of substances with large cross sections 440
(e.g. some dioxin and PBDE congeners) (Opperhuizen et al. 1987; Morris et al. 2004). 441
Therefore a simple parameter may not be sufficient to explain when reduced BCF/BAF 442
occurs. Dimitrov, Dimitrova et al. (2002) have tried to develop a more mechanistic 443
approach to address this concept, using of molecular weight, size, and flexibility in their 444
BCF estimates. 445
Dimitrov, Mekenyan et al. (2002) found that for compounds with a log Kow > 5.0, 446
a threshold value of 1.5 nm for the maximum cross-sectional diameter (i.e. molecular 447
length) could discriminate between chemicals with BCF > 2,000 from those with BCF 448
Revised: 13 March 2006
Integrated Testing Bioconcentration Page 22
< 2,000. This critical value was found to be comparable with the architecture of the cell 449
membrane, i.e. half the thickness of the lipid bilayer of a cell membrane. This is 450
consistent with a possible switch in uptake mechanism from passive diffusion through the 451
bilayer to facilitated diffusion or active transport. In a later paper, Dimitrov et al. (2003) 452
used this parameter to assess experimental data on a wide range of chemicals. The 453
conclusion was that a chemical with maximum cross-sectional diameter larger than 1.5 454
nm would not have a BCF > 5,000, i.e. would not meet the EU PBT criteria for vB 455
chemicals (EC 2003). In unpublished work, following further assessment of their data set, 456
they have changed this value to 1.74 nm (Dimitrov et al. 2004). 457
Earlier Opperhuizen et al. (1987) proposed that a substance with an effective 458
molecular length > 4.3 nm would not pass membranes, either in the gills or in the gut, at 459
all, based on a series of bioaccumulation and bioconcentration studies with linear and 460
cyclic polydimethylsiloxanes (silicones) varying in chain length. Membrane crossing is 461
very unlikely since such large molecules would disturb the entire interior strucuture of 462
the lipid membrane. Molecular weight did not explain reduced uptake, since 1 of the 463
substances with a molecular weight of 1,050 was detected in fish. The cross sectional 464
diameter of silicones could in itself not explain the reduced uptake since these diameters 465
were smaller or equal to those of PCBs that did bioaccumulate strongly. 466
Opperhuizen et al. (1987) also referred to a study by Hardy et al. (1974) where 467
uptake in codlings of long chain alkanes was disturbed for alkanes with corresponding 468
molecular lengths of > 4.3 nm. Tolls et al. (2000) observed uptake in fish of some 469
nonionic surfactants with an apparent equal length to long chain alkanes which seems 470
contradictory to the earlier proposed cut-off molecular length by Opperhuizen et al. 471
Revised: 13 March 2006
Integrated Testing Bioconcentration Page 23
(1987). However, the uptake of the long nonioinc surfactants may be explained by 472
internal molecular flexibility reducing the effective molecular length below 4.3 nm. 473
In conclusion there would appear to be no clear cut-off value for molecular size 474
beyond which no absorption will take place. While recognising the uncertainties in the 475
interpretation of experimental results, it is recommended: 476
• a maximum effective molecular length of 4.3 nm indicates no uptake and indicates a 477
chemical is not bioconcentrating; 478
• a maximum cross-sectional diameter of 1.74 nm indicates a chemical would not have 479
a BCF > 5,000; 480
• a maximum cross-sectional diameter of 1.74 nm plus a molecular weight of 700 – 481
1,100 would suggest a chemical would not have a BCF > 2,000. 482
Other indicators. There are other indicators for low uptake that could also be used 483
to suggest that a chemical, despite having a log Kow in excess of 4.5, has a low 484
bioconcentration potential such as lack of experimentally observed gill or skin 485
permeability, and low or reduced uptake in mammalian studies e.g. OECD 420, 423, 425 486
and 435 (OECD 2001a, 2001b, 2001c, 2004). Cell culture models offer many 487
advantageous features for the analysis of chemical transport across membranes and can 488
be used to expedite identification of compounds with less favourable uptake properties, 489
and to evaluate structure-absorption relationships. 490
Wood et al. (1997) developed a method for the primary culture of gill epithelial cells 491
from freshwater rainbow trout. Application in quantitative analysis of chemical transport 492
Revised: 13 March 2006
Integrated Testing Bioconcentration Page 24
across membranes is currently limited since primary epithelial cells are used, which 493
increases the possibility of high inter-experimental variability (Wood et al. 2002). 494
One in vitro model system that has proven useful in chemical gastro-intestinal 495
absorption studies is the Caco-2 cell line (Hidalgo et al. 1996). Caco-2 cells are human in 496
origin, and can be manipulated in culture so that they exhibit many characteristics of the 497
human small intestinal epithelium. Caco-2 monolayers have been extensively used in the 498
prediction of intestinal absorption in vivo (Bailey et al. 1996), and have been found 499
specifically useful in identification of pharmaceuticals with potential absorption problems 500
(Artursson et al. 1996). 501
Use of Caco-2 monolayers for prediction of fish gill absorption in vivo may 502
overestimate potential absorption of a chemical though the gill (Table 2). Use of these 503
cellular models can decrease the number of animals needed for bioconcentration studies 504
by identifying those chemicals which have limited uptake. An additional advantage of 505
this cell culture model is that multiple studies can be performed with a relatively small 506
amount of radiolabelled test chemical. 507
Pärt (1990) developed a perfused gill preparation from rainbow trout 508
(Oncorhynchus mykiss) as an alternative for studies in vivo. The perfused gill allows 509
direct measurements of in vivo absorption rates of chemicals across the gill epithelium 510
(Pärt et al. 1992). Uptake rate constants of different classes of hydrophobic organic 511
chemicals determined in isolated perfused gills of rainbow trout (O. mykiss) are higher 512
than those determined in guppy (Poecilia reticulata) in vivo (Sijm et al. 1995). Both 513
systems show relatively high variation, however this can be significantly reduced and the 514
Revised: 13 March 2006
Integrated Testing Bioconcentration Page 25
uptake rate constants determined once they are normalised with a reference chemical. 515
Subsequent extrapolation to fish of different sizes can be through use of allometric 516
relationships (Sijm et al. 1995; Sijm et al. 1999; Hendriks et al. 2001; Hendriks and 517
Heikens 2001). 518
Reduced distribution. The concept of having a value relating a chemical's solubility in 519
octanol to reduced BCF/BAF is derived from 2 considerations. Firstly, that octanol is a 520
reasonable surrogate for fish lipids, and secondly, that if a substance has a reduced 521
solubility in octanol this may result in a reduced BCF/BAF (and reduced or no effect to 522
the animal). The former forms the basis of the majority of models for predicting BCF 523
using log Kow. When a substance has a low solubility in octanol (Soct) as well as a low 524
solubility in water (Sw), the resulting ratio Soct/Sw could range from very low to very high, 525
with no clear idea on how this would affect the magnitude of the BCF/BAF. Still, it could 526
be argued that a very low solubility in octanol could be used as an indication that only 527
low body burdens build up in an aquatic organism. 528
Chessells et al. (1992) demonstrated a decrease in lipid solubility with increasing 529
Kow values for highly hydrophobic compounds (log Kow > 6). It was suggested that this 530
led to reduced BCFs. Banerjee et al. (1991) demonstrated that by introducing a term for 531
lowered octanol/lipid solubility into the calculated log Kow BCF relationship, they could 532
significantly improve the prediction of bioconcentration for highly hydrophobic 533
chemicals. Experimental Kow values already reflect the lower octanol solubility. 534
The meaningful implication of bioaccumulation is to identify the maximum 535
concentration(s) in organisms that would give rise to concern. The concept of critical 536
Revised: 13 March 2006
Integrated Testing Bioconcentration Page 26
body burdens (CBB) for acute effects is reasonably well-established (McCarty et al. 537
1993; McCarty 1986) especially for chemicals that act via a narcosis mode of action. 538
Recent reviews of this concept (Barron et al. 1997, 2002; Sijm et al. 1999; Thompson et 539
al. 2003) can be summarised as follows: 540
• There are, still, very little data available, especially for specifically acting 541
chemicals and for chronic effects, upon which to make decisions relating to 542
generic CBBs; 543
• It is likely that much of the variability in CBBs can be explained by species 544
sensitivities, biotransformation, lipid content, the measurement of organ 545
versus whole body measurements and whether the chemical is correctly 546
assigned to a mode of action category; 547
• It is possible to identify ranges of CBB values for specific modes of action. 548
This is easier for narcosis type mode of actions, and becomes increasingly 549
prone to error moving towards more specifically acting chemicals. 550
Table 3 summarises 4 sources of information for CBBs, and when comparing the 551
expert judgement of Sijm to the ranges indicated and to the figures in the respective 552
publications, it is clear that the values chosen are in the median values of the ranges/data. 553
However, there is a lot of variability and therefore uncertainty in deciding on the actual 554
CBB value to use. Choosing the value of 0.001 mmol/kg ww (mid-point for respiratory 555
inhibitors) allows for approximate protection for all the modes of action with the 556
exception of the most toxic chemicals. The rationale for this would be that chemicals that 557
act by the lowest and most specific mode of action are very likely to be toxic (T) and 558
Revised: 13 March 2006
Integrated Testing Bioconcentration Page 27
hence sufficiently bioaccumulative to be of immediate concern. The choice is therefore 559
pragmatic but protective. 560
Lipid normalising the chosen CBB of 0.001 mmol/kg ww, and assuming a lipid 561
content of 5%, gives a lipid normalised CBB of 0.02 mmol/kg lipid or 0.02 * Molecular 562
weight mg/l lipid. However, given the uncertainty involved it is suggested to introduce an 563
application factor of 10to account for species differences and organ versus body 564
differences. 565
Based on the above it is proposed that where a chemical has a solubility of less 566
than (0.002 * Molecular weight) mg/l in octanol it should be assumed that the compound 567
has only a limited potential to establish high body burdens and to bioaccumulate. If it 568
does bioaccumulate, it would be unlikely to give rise to levels in biota that would cause 569
significant effects. 570
Increased elimination/depuration. De Wolf et al. (1992) demonstrated a 571
significant reduction in the bioconcentration of chlorinated anilines compared to log Kow-572
based predictions which was attributed to increased elimination via biotransformation. In 573
vitro assays can provide information on both the range of metabolites as well as their 574
relative importance, and provide data useful for input into fish-specific physiologically 575
based pharmacokinetic (PBPK) modelling efforts. Several types of studies are available 576
that assess the influence of biotransformation on the BCF in fish such as measuring the 577
decrease of parent compound (mass balance approach) (e.g. Opperhuizen 1986), 578
comparison of total elimination of biotransformable and non-biotransformable chemicals 579
Revised: 13 March 2006
Integrated Testing Bioconcentration Page 28
with a similar Kow (de Wolf et al. 1993a), and estimation of the in vivo biotransformation 580
rates from in vitro assays. 581
Biotransformation activity has been measured in fish liver, intestine, gill, kidney 582
and brain (Lindström-Seppä et al. 1981; Miller et al. 1989; Van Veld et al. 1990; 583
Hegelund et al. 2003). Since metabolism processes take place primarily in the liver, this 584
is the organ of choice to study the biotransformation of chemicals. 585
In vitro estimation of biotransformation potential. Biotransformation potential of 586
fish has been investigated in liver slices (Schmieder et al. 2000), whole liver 587
homogenates (de Wolf et al. 1993b), liver subfractions (Kolanczyk et al. 1999; Dyer et al. 588
2003; Perdu-Durand et al. 2004), isolated hepatocytes and cell lines (Cravedi et al. 2001; 589
Segner 1998; Segner et al. 2001; Dyer et al. 2004). The xenobiotic metabolite pattern 590
produced by fish hepatocytes in vitro is generally similar to that observed in vivo (Segner 591
et al. 2001). 592
Biotransformation is strongly taxa- and species-specific which may be due to 593
endogenous or exogenous factors (Sijm et al. 1997).. Negligible biotransformation higher 594
up in the food chain implies a potential risk of biomagnification (Sijm et al. 1997). The 595
following types of compounds can be distinguished: a) compounds which are poorly 596
biotransformed as a general rule, b) compounds which are poorly biotransformed by 597
specific organisms/groups e.g. PAH in mussels, c) compounds which are easily 598
biotransformed across phyla. 599
The rate of biotransformation of chemicals through enzymatic reactions can be 600
monitored either by an increase in the activity of enzymes involved, by the decrease in 601
Revised: 13 March 2006
Integrated Testing Bioconcentration Page 29
the amount of substrate (parent compound), or by an increase in products. The faster the 602
rate of parent biotransformation the less likely it is that the chemical will bioaccumulate, 603
with the influence of biotransformation on the overall elimination and BCF value more 604
pronounced for hydrophobic chemicals (de Wolf et al. 1992). However, because of the 605
lack of data there are no generally accepted approaches to use the in vitro rates to 606
estimate potential BCFs. This is an area for further research. 607
Dyer et al. (2003) applied an approach to derive a BCFcell for various surfactants 608
using carp primary hepatocytes, and cultured hepatocytes (PLHC-1 cells). The rates of 609
uptake and loss of the test chemical from the cellular systems were estimated assuming 610
first order kinetics and the BCF in the cells determined by a ratio of uptake rate to the rate 611
of loss. For LAS the calculated BCFcell were approximately 4-fold less than the BCFfish 612
measured by Tolls et al. (1997) in vivo in fathead minnow. For the linear alcohol 613
ethoxylate (C13EO8) the corresponding BCFcell were 2 to 30-fold less compared to the 614
fathead minnow results generated by Tolls et al. (2000). 615
An advantage of in vitro methodologies for assessing biotransformation is that 616
they are rapid and less expensive than in vivo tests. A compromise between conducting in 617
vivo BCF testing and exposing liver systems would be to measure the same parameters in 618
livers extracted from exposed fish. This may allow for a reduction in the number of fish 619
used in assessing bioconcentration of a chemical, however this has not yet been 620
investigated. 621
622
Revised: 13 March 2006
Integrated Testing Bioconcentration Page 30
INTEGRATED BIOCONCENTRATION TESTING STRATEGY 623
We reviewed the current environmental regulatory testing strategies for 624
bioaccumulation and the alternative approaches that could provide (elements of) the 625
required information on bioconcentration. Based on this an integrated bioconcentration 626
testing strategy can be developed taking account of alternative approaches including 627
existing data (e.g. read-across and extrapolation), QSARs, in vitro and other techniques 628
for implementing the 3Rs (Figure 1). The testing strategy developed is a tiered process; 629
Tier 1 uses estimation models and Tier 2 using non-animal experimental systems. 630
Depending upon the quality of the prediction, these tiers can lead to a replacement of 631
animals used for assessing bioconcentration within environmental assessment. Tier 3 632
makes use of experimental systems but with a reduced number of animals. The full BCF 633
test performed according to OECD 305 is Tier 4 (the final step in the strategy). 634
Validation of alternative approaches from Tiers 1, 2 and 3 should include a comparison 635
of performance against results for the Tier 4 test. 636
Central to the strategy is the question “Is (refined) BCF suitable for purpose” 637
(Figure 2). The purpose of this question is to ensure that the BCF being generated is 638
either sufficiently accurate that an assessment of indirect exposure can be conducted or 639
that regulatory decisions can be made with sufficient confidence. Clearly the closer a 640
BCF estimate or measured value is to a boundary, either a regulatory defined criterion 641
(e.g. BCF > 5,000) or an indicator of risk (e.g. the predicted environmental concentration 642
to the no effect concentration (PEC/PNEC) = 1), the more confidence is needed that the 643
BCF is reasonably accurate. In making this judgement the variability that occurs even 644
with OECD 305 should be considered. 645
Revised: 13 March 2006
Integrated Testing Bioconcentration Page 31
Tier 1 646
A. The first part of the assessment addresses whether the substance has a potential for 647
restricted absorption. If unlikely to bioconcentrate, a surrogate or null BCF is 648
estimated. The assessor then moves to the central question regards suitability of the 649
estimate for its intended purpose. 650
If absorption does not seem to be restricted and biotransformation appears unlikely then 651
the second question asked is whether log Kow is an appropriate model or surrogate for 652
describing the water-fish distribution process. In the case of metals and surfactants log 653
Kow is not an appropriate model and one should immediately move to C. If log Kow is 654
suitable, a measure of the octanol-water partition coefficient needs to be obtained. This 655
can be done by model estimation (ECETOC 2003) or measurement methods (ECETOC 656
1998). Next is to evaluate whether there is an applicable (Q)SAR that includes the 657
chemical in its domain. If yes, the log Kow value can be used as input into the (Q)SAR to 658
estimate the fish bioconcentration factor. 659
C. If log Kow is not a suitable surrogate, but other approaches are (e.g. SPME), then 660
they should be used at this stage. Other options include SPMD, dialysis bags, and biotic 661
measurement systems (i.e. invertebrates). From this measurement an estimation of a fish 662
bioconcentration factor is obtained. The confidence in the information is again addressed 663
in the central question regards suitability of the estimate for its intended purpose. If there 664
are no good alternatives it is suggested that a screening BCF study be conducted (move to 665
Tier 3). 666
Revised: 13 March 2006
Integrated Testing Bioconcentration Page 32
Tier 2 667
When a BCF has been estimated but there is significant uncertainty or not 668
sufficient precision for the assessment, then go to point D below. However, in case there 669
are no arguments for restricted uptake and no viable surrogates for partitioning behaviour 670
then go to Tier 3. 671
D. The assessment at this point addresses to what extent biotransformation would 672
impact the elimination of the substance from fish and thus reduce an estimated 673
(maximum) BCF value. This can be approached by asking whether biotransformation 674
occurs in other species with potential similarity in biotransformation pattern, or whether 675
other, structurally related substances are known to be biotransformed. If so, a measure of 676
biotransformation could be obtained either through the use of model estimations or in 677
vitro measurements. In this way a refined BCF is obtained and the suitability of the new 678
value assessed. 679
Tier 3 680
When there are no arguments for restricted uptake and no viable surrogates for 681
partitioning behaviour available then testing is required. It is suggested that a fish BCF is 682
estimated using in vivo screening tests before moving to a BCF measurement using the 683
OECD 305 test guideline (Tier 4). If the estimate from the in vivo screening assays is 684
suitable for purpose then one can exit the bioconcentration testing strategy. If not, the 685
OECD 305 test will need to be performed before the testing strategy can be exited. 686
Tier 4 687
Conduct the OECD 305 study. 688
Revised: 13 March 2006
Integrated Testing Bioconcentration Page 33
689
CONCLUSIONS AND RECOMMENDATIONS 690
The European Union Technical Committee for New and Existing Substances (TC 691
NES) working group addressing persistent, bioaccumulative and toxic (PBT) substances 692
considered the recommendations on molecular properties leading to reduced absorption 693
and the influence of octanol solubility on distribution. They agreed to use them as part of 694
their strategy of determining whether a chemical should be placed on a screening list 695
and/or should be tested to determine whether it is B/vB. The criteria should be considered 696
in a weight of evidence approach with other information, e.g. data derived from 697
mammalian studies. 698
Several research needs can be identified upon further examination of the decision-699
tree proposed as a possible bioconcentration testing strategy (Figure 2). The use of 700
relevant existing information on biotransformation can be considered a viable alternative 701
replacing animals. Reduction measures, while still making use of a limited number of 702
fish, can already be applied or may need rapid development for short-term application. In 703
the mid to longer term, research programmes will be needed to enable the replacement 704
tests to be fully accepted and implemented. 705
The domain of application of the standard in vivo bioconcentration test (OECD 706
305) should be more clearly defined. The uncertainties in the measurements obtained 707
after conducting a standard in vivo bioconcentration test should be better assessed, 708
without which the successful validation of alternatives methods to the fish 709
bioconcentration test would be compromised. A database holding peer reviewed high 710
quality BCF data, a “BCF Gold Standard Database” is under development and will 711
Revised: 13 March 2006
Integrated Testing Bioconcentration Page 34
become a valuable resource for future development of alternative tests. The use of only 1 712
concentration or limited uptake/depuration phases should be evaluated and implemented 713
for relevant chemical classes. 714
Other in vivo experimental approaches, e.g. the dietary accumulation protocol and 715
abbreviated OECD 305 need to be investigated further to define their limits of 716
applicability and eventually extend their domain. In addition, the assumptions regarding 717
rates of uptake need to be confirmed and their limitations understood. 718
To better address the value of in vitro assays and their suitability for amending 719
BCFs, additional research is needed to identify their variability and confidence limits. 720
Research into the use of decision theory methods may also help by allowing for a better 721
assessment of the uncertainty inherent in these techniques. Also some technical issues 722
need to be addressed to better understand the use of in vitro methods. For the purpose of 723
standardising protocols, recommended procedures for the isolation of fish cells, culture 724
and exposure should be agreed and should be in compliance with the Good Cell Culture 725
Practices. The development of in vitro assays, expert systems and models capable of 726
incorporating ADME concepts should receive priority. 727
Absorption. The parameters governing physical restriction of cellular absorption 728
of chemicals should be better described and the assumed constant rate of uptake, up to 729
log Kow 6, needs to be further investigated. Furthermore the applicability of using in vitro 730
systems to assess absorption should be studied. The first step could be to evaluate 731
whether the mammalian intestinal cells (Caco-2 cells) are representative of fish for 732
understanding gill absorption, uptake from food and deriving assimilation factors. Future 733
Revised: 13 March 2006
Integrated Testing Bioconcentration Page 35
research is needed to further assess the impact of gill biotransformation in the absorption 734
process. In addition, generation of information that provides more insight into the validity 735
of extrapolation from existing approaches to fish and/or the development of fish specific 736
absorption models is required. 737
Distribution and partitioning. The applicability domain of (Q)SARs for log 738
Kow/BCF predictions should be better defined. Research into the conditions of use of 739
SPMD/SPME, within the context of the strategy outlined above, should be performed. 740
Their limitations and potential, for assessing poorly metabolisable chemicals and in 741
whole effluent assesment/environmental monitoring, should be explored. 742
Biotransformation. The use of available biodegradation data and 743
metabolism/biotransformation data from mammalian studies should be considered before 744
conducting any fish bioconcentration test. In order to ensure that extrapolation can be 745
done, a literature research study should capture differences and similarities between the 746
various classes. Bacteria, invertebrates and vertebrates are capable of chemical 747
biotransformation, but to various extents, and may be using various metabolic pathways. 748
The knowledge of biotransformation patterns and extent in diverse phyla may help 749
understand bioconcentration processes in fish (Sijm et al. 1997). 750
The existing (Q)SARs which address biotransformation in fish need to be 751
improved or further developed. The available in vitro biotransformation assays with 752
sub/cellular fish liver systems to address metabolism should be further investigated. In 753
order to allow the use of relevant information, the level of biotransformation potential in 754
the different in vitro systems, using different fish species or classes of organisms, should 755
Revised: 13 March 2006
Integrated Testing Bioconcentration Page 36
be compared. The level of biotransformation potential in vitro should be compared to the 756
level of biotransformation in vivo. 757
There are a number of issues in relation to the extrapolation from in vitro to in 758
vivo for deriving a BCF. Ultimately it should be possible to relate, for example, the level 759
of parent disappearance in microsomes with a factor that would refine the estimated 760
BCFfish, or a BCFcell to BCFfish. It is not yet obvious how absorption and metabolism in 761
mammals relate to absorption and metabolism in fish. Another inherent difficulty of in 762
vitro studies is the relation between responses in single cells to responses/effects in whole 763
organisms. This is true for toxicological responses as well as for biotransformation 764
processes. The acceptability of in vitro data could be enhanced provided that parallel 765
studies are conducted in vivo, for example by comparing the level of enzymatic activity 766
in the livers of exposed fish to that in exposed liver cells. This could also be used as a 767
refinement and reduction of the number of fish used to assess fish bioconcentration. 768
In summary, it is clear when addressing the use of fish for the environmental 769
safety of chemical products there are many opportunities for applying the principles of 770
the 3Rs: Reduce, Refine and Replace. The current environmental regulatory testing 771
strategy for bioconcentration and secondary poisoning can be significantly improved by 772
use of alternative approaches that provide (elements of) the required information. We 773
developed an Integrated Testing Strategy for bioconcentration assessment that can be 774
applied in a regulatory context and takes into account these alternative information 775
methodologies. 776
Revised: 13 March 2006
Integrated Testing Bioconcentration Page 37
Acknowledgements. The authors would like to thank the members of the EU 777
Technical Committee Working Group on PBT-substances, specifically Steve Robertson. 778
779
REFERENCES 780
Anliker R, Moser P. 1987. The limits of bioaccumulation of organic pigments in 781
fish: Their relation to the partition coefficient and the solubility in water and octanol. 782
Ecotox Environ Saf 13:43-52. 783
Anliker R, Moser P, Poppinger D. 1988. Bioaccumulation of dyestuffs and 784
organic pigments in fish. Relationships to hydrophobicity and steric factors. 785
Chemosphere 17:1631-1644. 786
Anonymous. 2004. Fish, dietary bioaccumulation study protocol, based on a 787
version adapted by the TC NES subgroup on PBTs of the original protocol developed for 788
and used by ExxonMobil Biomedical Sciences, Inc (EMBSI). 789
Arnot J, Gobas FAPC. 2003. A generic QSAR for assessing the bioaccumulation 790
potential of organic chemicals in aquatic food webs. Quant. Struct.-Act. Realt. 22: 1-9. 791
Arthur CL, Pawliszyn J. 1990, Solid phase microextraction with thermal 792
desorption using fused silica optical fibers. Anal Chem 62:2145-2148. 793
Artursson P, Palm K, Luthman K. 1996. Caco-2 monolayers in experimental and 794
theoretical predictions of drug transport. Advanced Drug Delivery Reviews 22:67-84. 795
Revised: 13 March 2006
Integrated Testing Bioconcentration Page 38
Bailey CA, Bryla P, Malick AW. 1996. The use of the intestinal epithelial cell 796
culture model, Caco-2, in pharmaceutical development. Advanced Drug Delivery Reviews 797
22:85-103. 798
Banerjee S, Baughman GL. 1991. Bioconcentration factors and lipid solubility. 799
Environ Sci Technol 25:536-539. 800
Banerjee S, Sugatt RH, O’Grady DP. 1984. A simple method for determining 801
bioconcentration parameters of hydrophobic compounds. Environ Sci Technol 18:79-81. 802
Barron MG, Anderson MJ, Lipton J, Dixon DG. 1997. Evaluation of critical body 803
residue QSARs for predicting organic chemical toxicity to aquatic organisms. SAR QSAR 804
Environ Res 6:47-62. 805
Barron MG, Hansen JA, Lipton J. 2002. Association between contaminant tissue 806
residues and effects in aquatic organisms. Reviews of Environmental Contamination and 807
Toxicology 173:1-37. 808
Beek B. 1991. Welcome address and introduction. In: Nagel R, Loskill R, editors, 809
Bioaccumulation in aquatic systems. Weinheim, Germany: VCH Verlagsgesellschaft 810
mbH, p 1-6. 811
Booij K, Sleiderink HM, Smedes F. 1998. Calibrating the uptake kinetics of 812
semipermeable membrane devices using the exposure standards. Environ Toxicol Chem 813
17:1236-1245. 814
Borchardt RT, Smith PL, Wilson G, editors. 1996. Models for assessing drug 815
absorption and metabolism. New York (NY), USA: Plenum Press. 816
Revised: 13 March 2006
Integrated Testing Bioconcentration Page 39
Burreau S, Zebuhr Y, Broman D, Ishaq R. 2004. Biomagnification of 817
polychlorinated biphenyls (PCBs) and polybrominated diphenyl ethers (PBDEs) studies 818
in pike (Esox lucius), perch (Perca fluviatilis) and roach (Rutilus rutilus) from the Baltic 819
Sea. Chemosphere 55:1043-1052. 820
CEPA. 1999. Persistence and Bioaccumulation Regulations (SOR/2000-107). 821
Canada Gazette134:607-612. 822
Chessells M, Hawker DW, Connell DW. 1992. Influence of solubility in lipid on 823
bioconcentration of hydrophobic compounds. Ecotox Environ Saf 23:260-273. 824
Connell DW, Hawker DW. 1988. Use of polynomial expressions to describe the 825
bioconcentration of hydrophobic chemicals by fish. Ecotox Environ Saf 16:242-257. 826
Cravedi JP, Boudry G, Baradat M, Rao D, Debrauwer L. 2001. Metabolic fate of 827
2,4-dichloroaniline, prochloraz and nonylphenol diethoxylate in rainbow trout: a 828
comparative in vivo / in vitro approach. Aquat Toxicol 53:159-172. 829
de Wolf W, Lieder PH. 1995. Analysis of the static exposure system to study 830
biotransformation and bioconcentration kinetics in aquatic organisms. Toxicology 831
Modeling 1:99-110. 832
de Wolf W, Lieder PH. 1998. A novel method to determine uptake and 833
elimination kinetics in fish of volatile chemicals. Chemosphere 36:1713-1724. 834
de Wolf W, de Bruijn JHM, Seinen W, Hermens JLM. 1992. Influence of 835
biotransformation on the relationship between bioconcentration factors and octanol-water 836
partition coefficients. Environ Sci Technol 26:1197-1201. 837
Revised: 13 March 2006
Integrated Testing Bioconcentration Page 40
de Wolf W, Seinen W, Hermens JLM. 1993a. Biotransformation and 838
toxicokinetics of trichloroanilines in fish in relation to their hydrophobicity. Arch Environ 839
Contam Toxicol 25:110-117. 840
de Wolf W, Seinen W, Hermens JLM. 1993b. N-acetyltransferase activity in 841
rainbow trout liver and the in vitro biotransformation of chlorinated anilines and 842
benzenes in fish. Xenobiotica 23:1045-1056. 843
DGEE. 2003. Directorates General Enterprise and Environment. The new EU 844
chemicals legislation REACH. DG Enterprise, Brussels, Belgium. 845
(www.europa.eu.int/comm/enterprise/reach/index_en.htm). 846
Dimitrov SD, Dimitrova NC, Walker JD, Veith GD, Mekenyan OG. 2002. 847
Predicting bioconcentration factors of highly hydrophobic chemicals. Effects of 848
molecular size. Pure Appl Chem 74:1823-1830. 849
Dimitrov SD, Mekenyan OG, Walker JD. 2002. Non-linear modeling of 850
bioconcentration using partition coefficients for narcotic chemicals. SAR QSAR Environ 851
Res 13:177-184. 852
Dimitrov SD, Dimitrova NC, Walker JD, Veith GD, Mekenyan OG. 2003. 853
Bioconcentration potential predictions based on molecular attributes - an early warning 854
approach for chemicals found in humans, birds, fish and wildlife. QSAR Comb Sci 22:58-855
68. 856
Revised: 13 March 2006
Integrated Testing Bioconcentration Page 41
Dimitrov SD, Dimitrova NC, Parkerton T, Comber MHI, Bonnell M, Mekenyan 857
OG. 2006. Baseline model for identifying the bioaccumulation potential of chemicals. 858
SAR QSAR Environ Res Accepted for publication. 859
Dyer SD, Bernhard M. 2004. Follow up to feasibility study on in vitro 860
biotransformations systems: Determination of uptake, loss and bioconcentration of two 861
surfactants. ERASM report, 35 p. www.erasm.org/study.htm 862
Dyer SD, Bernhard MJ, Versteeg DJ. 2003. Identification of an in vitro method 863
for estimating the bioconcentration of surfactants in fish. In ERASM final report. 864
Brussels, Belgium, p 1-66. www.erasm.org/study.htm 865
EC. 2003. 2nd edition of the Technical Guidance Document in support of 866
Commission Directive 93/67/EEC on Risk Assessment for new notified substances, 867
Commission Regulation (EC) No 1488/94 on Risk Assessment for existing substances 868
and Directive 98/8/EC of the European Parliament and of the Council concerning the 869
placing of biocidal products on the market. Office for Official Publications of the 870
European Communities, Luxembourg. 871
ECETOC. 1995. The role of bioaccumulation in environmental risk assessment: 872
the aquatic environment and related foodwebs. Technical Report No 67. European Centre 873
for Ecotoxicology and Toxicology of Chemicals, Brussels, Belgium. 874
ECETOC. 1998. QSARs in the assessment of the environmental fate and effects 875
of chemicals. Technical Report No 74. European Centre for Ecotoxicology and 876
Toxicology of Chemicals, Brussels, Belgium. 877
Revised: 13 March 2006
Integrated Testing Bioconcentration Page 42
ECETOC. 2003. QSARs: evaluation of the commercially available software for 878
human health and environmental endpoints with respect to chemical management 879
applications. Technical Report No 89. European Centre for Ecotoxicology and 880
Toxicology of Chemicals, Brussels, Belgium. 881
ECETOC. 2005. Alternative testing approaches in environmental safety 882
assessment. Technical Report No. 97. European Centre for Ecotoxicology and 883
Toxicology of Chemicals, Brussels, Belgium. 884
EEC. 1986. Council Directive 86/609/EEC of 24 November 1986 on the 885
approximation of laws, regulations and administrative provisions of the Member States 886
regarding the protection of animals used for experimental and other scientific purposes. 887
Official Journal of the European Communities L 358. 888
Environment Canada. 2003. Guidance manual for the categorization of organic 889
and inorganic substances on Canada’s Domestic Substances List: Determining 890
persistence, bioaccumulation potential, and inherent toxicity to non-human organisms. 891
Existing Substances Branch. June. (http://www.ec.gc.ca/substances/ese/eng/dsl/cat_index.cfm) 892
Gobas FAPC, Mackay D. 1987. Dynamics of hydrophobic organic chemical 893
bioconcentration in fish. Environ Toxicol Chem 6:495-504. 894
Hardy R, Mackie PR, Whittle KJ, McIntyre AD. 1974. Discrimination in the 895
assimilation of n-alkanes in fish. Nature 252:577-578. 896
Hawker DW, Connell DW. 1988. Influence of partition coefficient of lipophilic 897
compounds on bioconcentration kinetics with fish. Wat Res 22:701-707. 898
Revised: 13 March 2006
Integrated Testing Bioconcentration Page 43
Hegelund T, Celander MC. 2003. Hepatic versus extrahepatic expression of 899
CYP3A30 and CYP3A56 in adult killifish (Fundulus heteroclitus). Aquat Toxicol 64:277-900
291. 901
Hendriks JA, Heikens A. 2001. The power of size. 2. Rate constants and 902
equilibrium ratios for accumulation of inorganic substances related to species weight. 903
Environ Toxicol Chem 20:1421-1437. 904
Hendriks JA, van der Linde A, Cornelissen G, Sijm DTHM. 2001. The power of 905
size. 1. Rate constants and equilibrium ratios for accumulation of organic substances 906
related to octanol-water partition ratio and species weight. Environ Toxicol Chem 907
20:1399-1420. 908
Hidalgo IJ, Li J. 1996. Carrier-mediated transport and efflux mechanisms in 909
Caco-2 cells. Advanced Drug Delivery Reviews 22:53-66. 910
Hinderleiter P. 2004. Haskell Laboratories (DE), USA. Personal communication. 911
Hodgeson E, Levi PE. 1994. Introduction to biochemical toxicology. Norwalk, 912
(CT), USA: Appleton and Lange, p 11-48; 75-131; 177-192. 913
Huckins JN, Petty JD, Thomas J. 1997. Bioaccumulation: How chemicals move 914
from the water into fish and other aquatic organisms. Health and Sciences Dept., API 915
Publication Number 4656. API, Washington (DC), USA. 916
IEH. 2001. Testing requirements for proposals under the EC white paper Strategy 917
for a future chemicals policy (Web report W6). Institute for Environment and Health, 918
Leicester, UK. www.le.ac.uk/ieh/webpub/webpub.html (posted July 2001). 919
Revised: 13 March 2006
Integrated Testing Bioconcentration Page 44
Kolanczyk R, Schmieder P, Bradbury S, Spizzo T. 1999. Biotransformation of 4-920
methoxyphenol in rainbow trout (Oncorhynchus mykiss) hepatic microsomes. Aquat 921
Toxicol 45:47-61. 922
Kristensen P, Tyle H. 1991. The assessment of bioaccumulation. In: Nagel R, 923
Loskill R, editors, Bioaccumulation in aquatic systems. Weinheim, Germany: VCH 924
Verlagsgesellschaft mbH, p 189-227. 925
Leslie HA, Ter Laak TL, Busser FJM, Kraak MHS, Hermens JLM. 2002. 926
Bioconcentration of organic chemicals: Is a solid-phase microextraction fiber a good 927
surrogate for biota? Environ Sci Technol 36:5399-5404. 928
Lindström-Seppä P, Koivusaari U, Hanninen O. 1981. Extrahepatic xenobiotic 929
metabolism in North-European freshwater fish. Comp Biochem Physiol 69C:259-263. 930
Lipinski CA, Lombardo F, Dominy BW, Feeney PJ. 1997. Experimental and 931
computational approaches to estimate solubility and permeability in drug discovery and 932
development settings. Advanced Drug Delivery Reviews 23:3-25. 933
Loonen H, Tonkes M, Parsons JR, Govers HAJ. 1994. Bioconcentration of 934
polychlorinated dibenzo-p-dioxins and polychlorinated dibenzofurans in guppies after 935
aqueous exposure to a complex PCDD/PCDF mixture: Relationship with molecular 936
structure. Aquat Toxicol 30:153-169. 937
Mayer P, Tolls J, Hermens JLM, Mackay D. 2003. Equilibrium sampling devices. 938
Environ Sci Technol 37:184A-191A 939
Revised: 13 March 2006
Integrated Testing Bioconcentration Page 45
McCarty LS. 1986. The relationship between aquatic toxicity QSARs and 940
bioconcentration for some organic chemicals. Environ Toxicol Chem 5:1071-1080. 941
McCarty LS, Mackay D. 1993. Enhancing ecotoxicological modeling and 942
assessment. Environ Sci Technol 27:1719-1728. 943
Meylan WM, Howard PH, Boethling RS, Aronson D, Printup H, Gouchie S. 944
1999. Improved method for estimating bioconcentration/bioaccumulation factor from 945
octanol/water partition coefficient. Environ Toxicol Chem 18:664-672. 946
Miller MR, Hinton DE, Stegeman JJ. 1989. Cytochrome P-450 induction and 947
localization in gill pillar (endothelial) cells of scup and rainbow trout. Aquat Toxicol 948
14:307-322. 949
Morris S, Allchin CR, Zegers BN, Haftka JJH, Boon JP, Belpaire C, Leonards 950
PEG, Van Leeuwen SPJ, De Boer J. 2004. Distribution and fate of HBCD and TBBPA 951
brominated flame retardants in North Sea estuaries and aquatic food webs. Environ Sci 952
Technol 38:5497-5504. 953
Nendza M. 1991. QSARs of bioconcentration: validity assessment of 954
log Pow/log BCF correlations. In: Nagel R, Loskill R, editors, Bioaccumulation in aquatic 955
systems. Weinheim, Germany: VCH-Verlagsgesellschaft. 956
OECD. 1996a. Final report of the OECD workshop on harmonization of 957
validation and acceptance criteria for alternative toxicological test methods. Organisation 958
for Economic Co-operation and Development, Paris, France. 959
Revised: 13 March 2006
Integrated Testing Bioconcentration Page 46
OECD. 1996b. OECD guidelines for testing of chemicals. 305. Bioconcentration: 960
Flow-through fish test, last updated 14th June 1996. Organisation for Economic Co-961
operation and Development, Paris, France. 962
OECD. 2001a. OECD guidelines for testing of chemicals. 420. Acute oral toxicity 963
- fixed dose procedure, last updated 17th December 2001. Organisation for Economic Co-964
operation and Development, Paris, France. 965
OECD. 2001b. OECD guidelines for testing of chemicals. 423. Acute oral toxicity 966
- acute toxic class method, last updated 17th December 2001. Organisation for Economic 967
Co-operation and Development, Paris, France. 968
OECD. 2001c. OECD guidelines for testing of chemicals. 425. Acute oral 969
toxicity: Up and down procedure, last updated 17th December 2001. Organisation for 970
Economic Co-operation and Development, Paris, France. 971
OECD. 2004. OECD guideline for the testing of chemicals, draft proposal for a 972
new guideline (No. 435, 1st Version), in vitro membrane barrier test method for skin 973
corrosion. Organisation for Economic Co-operation and Development, Paris, France. 974
Okada Y, Irimajiri A, Inouye A. 1977. Electrical properties and active solute 975
transport in rat small intestine. II. Conductive properties of transepithelial routes. J 976
Membr Biol 31:221-232. 977
Opperhuizen A. 1986. Bioconcentration of hydrophobic chemicals in fish. In: 978
Poston TM, Purdy R, editors, Aquatic toxicology and environmental fate, Vol 9, 979
Revised: 13 March 2006
Integrated Testing Bioconcentration Page 47
STP 921. Philadelphia, USA: American Society for Testing and Materials (ASTM), 980
p 304-315. 981
Opperhuizen A, Sijm DTHM. 1990. Bioaccumulation and biotransformation of 982
polychlorinated dibenzo-p-dioxins and dibenzofurans in fish. Environ Toxicol Chem 983
9:175-186. 984
Opperhuizen A, Van der Velde EW, Gobas FAPC, Liem DAK, Van der Steen 985
JMD. 1985. Relationship between bioconcentration in fish and steric factors of 986
hydrophobic chemicals. Chemosphere 14:1871-1896. 987
Opperhuizen A, Damen HWJ, Asyee GM, van der Steen JMD, Hutzinger O. 988
1987. Uptake and elimination by fish of polydimethylsiloxanes (silicones) after dietary 989
and aqueous exposure. Toxicol Environ Chem 13:265-285. 990
Parkerton T, Letinski D, Febbo E, Davi R, Dzamba C, Connelly M, Christensen 991
K, Peterson D. 2001. A practical testing approach for assessing bioaccumulation potential 992
of poorly water soluble organic chemicals. Presentation at SETAC Europe, May 7-10, 993
2001, Madrid, Spain. 994
Pärt P. 1990. The perfused fish gill preparation in studies of the bioavailability of 995
chemicals. Ecotox Environ Saf 19:106-115. 996
Pärt P, Saarikoski J, Tuurala H, Havaste K. 1992. The absorption of hydrophobic 997
chemicals across perfused rainbow trout gills: methodological aspects. Ecotox Environ 998
Saf 24:275-286. 999
Revised: 13 March 2006
Integrated Testing Bioconcentration Page 48
Pedersen F, de Bruijn J, Munn S, van Leeuwen CJ. 2003. Assessment of 1000
additional testing needs under REACH: Effects of (Q)SARs, risk based testing and 1001
voluntary initiatives. IHCP, DG JRC, Ispra, Italy, 33 p. 1002
Perdu-Durand E, Demmerle S, Cravedi JP. 2004. In vitro biotransformation rates 1003
of surfactants in carp and rainbow trout liver subcellular fractions. ERASM report, 28 p. 1004
www.erasm.org 1005
Potts RO, Guy RH, eds. 1997. Mechanisms of transdermal drug delivery. Marcel 1006
Dekker, New York, NY, USA. 1007
Proudfoot JR. 2005. The evolution of synthetic oral drug properties. Bioorganic 1008
and Medicinal Chemistry Letters 15:1087-1090. 1009
Rekker RF, Mannhold R. 1992. Calculation of drug lipophilicity. Weinheim, 1010
Germany: VCH. (Cited at www.voeding.tno.nl/ProductSheet.cfm?PNR=037e) 1011
Russell WMS, Burch RL. 1959. The principles of humane experimental 1012
technique. London, UK: Methuen. 1013
Schmieder P, Tapper M, Linnum A, Denny J, Kolanczyk R, Johnson R. 2000. 1014
Optimization of a precision-cut trout liver tissue slice assay as a screen for vitellogenin 1015
induction: comparison of slice incubation techniques. Aquat Toxicol 49:251-268. 1016
Schrap SM, Opperhuizen A. 1990. Relationship between bioavailability and 1017
hydrophobicity: Reduction of the uptake of organic chemicals by fish due to the sorption 1018
on particles. Env Toxicol Chem 9:715-724. 1019
Revised: 13 March 2006
Integrated Testing Bioconcentration Page 49
Segner H, Cravedi J. 2001. Metabolic activity in primary cultures of fish 1020
hepatocytes. ATLA 29:251-257. 1021
Segner H. 1998. Isolation and primary culture of teleosts hepatocytes. Comp 1022
Biochem Physiol Part A 120:71-81. 1023
Sijm DTHM. 2004. Personal communication to some members of the TCNES 1024
sub-group on PBTs. 1025
Sijm DTHM, Hermens JLM. 1999. Internal effect concentrations: Link between 1026
bioaccumulation and ecotoxicity for organic chemicals. In: Beek B, editor, The handbook 1027
of environmental chemistry, Vol 2-J. Bioaccumulation: new aspects and developments. 1028
Berlin, Germany: Springer-Verlag, p 167-199. 1029
Sijm DTHM, Wever H, Opperhuizen A. 1993. Congener-specific 1030
biotransformations and bioaccumulation of PCDDs and PCDFs from fly ash in fish. 1031
Environ Toxicol Chem 12:1895-1907. 1032
Sijm DTHM, Verberne ME, de Jonge WJ, Pärt P, Opperhuizen A. 1995. 1033
Allometry in the uptake of hydrophobic chemicals determined in vivo and in isolated 1034
perfused gills. Toxicol Appl Pharmacol 131:130-135. 1035
Sijm DTHM, de Bruijn J, de Voogt P, de Wolf W, eds. 1997. Biotransformation 1036
in environmental risk assessment. SETAC Europe, Brussels, Belgium. 1037
Sijm DTHM. 1991. Extrapolating the laboratory results to environmental 1038
conditions. In: Nagel R, Loskill R, editors, Bioaccumulation in aquatic systems. 1039
Weinheim, Germany: VCH Verlagsgesellschaft, p 151-160. 1040
Revised: 13 March 2006
Integrated Testing Bioconcentration Page 50
Sinko PJ, Lee YH, Makhey V, Leesman GD, Sutyak JP, Yu H, Perry B, Smith 1041
CL, Hu P, Wagner EJ, Falzone LM, McWhorter LT, Gilligan JP, Stern W. 1999. 1042
Biopharmaceutical approaches for developing and assessing oral peptide delivery 1043
strategies and systems: in vitro permeability and in vivo oral absorption of salmon 1044
calcitonin (sCT). Pharm Res 16:527-533. 1045
Södergren A. 1987. Solvent-filled dialysis membranes simulate uptake of 1046
pollutants by aquatic organisms. Environ Sci Technol 21:855-859. 1047
Thompson RS, Stewart KM. 2003. Critical Body Burdens: A review of the 1048
literature and identification of experimental data requirements. BL7549/B, Brixham 1049
Environmental Laboratory, AstraZeneca Ltd, Brixham (Devon), UK. 1050
Tolls J, de Graaf I, Thijssen MATC, Haller M, Sijm DTHM. 1997. 1051
Bioconcentration of LAS: Experimental determination and extrapolation to 1052
environmental mixtures. Environ Sci Technol 31:3426-3431. 1053
Tolls J, Haller M, Labee E, Verweij M, Sijm DTHM. 2000. Experimental 1054
determination of bioconcentration of the nonionic surfactant alcohol ethoxylated. Environ 1055
Toxicol Chem 19:646-653. 1056
Trischitta F, Denaro MG, Faggio C. 1999. Effects of acetylcholine, serotonin and 1057
noradrenalin on ion transport in the middle and posterior part of Anguilla anguilla 1058
intestine. J Comp Physiol B 169:370-376. 1059
UK. 1986. Guidance on the Operation of the Animals (Scientific Procedures) Act 1060
1986, Presented to Parliament by the Secretary of State for the Home Department 1061
Revised: 13 March 2006
Integrated Testing Bioconcentration Page 51
pursuant to Act Eliz. II 1986, C.14 Section 21, (Animals (Scientific Procedures) Act 1062
1986). Ordered to be printed by the House of Commons, 23 March 2000. 1063
UK. 1993. Statutory Instrument 1993 No. 2103, The Animals (Scientific 1064
Procedures) Act (Amendment) Order 1993. London, UK: The Stationery Office Limited. 1065
UN. 2003. The globally harmonized system of classification and labelling of 1066
chemicals. UNECE (United Nations Economic Commission for Europe), Geneva, 1067
Switzerland. Available at www.unece.org/trans/danger/publi/ghs/ghs_rev00/00files_e.html 1068
USA. 1966. Animal Welfare Act, Public Law 89-544 Act of August 24, 1966, 1069
89th Congress, H. R. 13881, Act enabled 1966 and updated 1970, 1976, 1985, 1990. 1070
Annual updates available at www.aphis.usda.gov/ac/publications.html 1071
US EPA. 1999. Category for persistent, bioaccumulative and toxic new chemical 1072
substances. Feb Reg 64:60194-60204. United States Environment Protection Agency, 1073
Office of Research and Development, Washington (DC), USA. 1074
Vaes WHJ, Hamwijk C, Urrestarazu Ramos E, Verhaar HJM, Hermens JLM. 1075
1996. Partitioning of organic chemicals to polyacrylate-coated solid phase 1076
microextraction fibers: Kinetic behavior and quantitative structure-property relationships. 1077
Anal Chem 68:4458-4462. 1078
Vaes WHJ, Urrestarazu Ramos E, Hamwijk C, van Holsteijn I, Blaauboer BJ, 1079
Seinen W, Verhaar HJM, Hermens JLM. 1997. Solid phase microextraction as a tool to 1080
determine membrane/water partition coefficients and bioavailable concentrations in in 1081
vitro systems. Chem Res Toxicol 10:1067-1072. 1082
Revised: 13 March 2006
Integrated Testing Bioconcentration Page 52
Van Veld PA, Westbrook DJ, Woodin BR, Hale RC, Smith CL, Huggett RJ, 1083
Stegeman JJ. 1990. Induced cytochrome P-450 in intestine and liver of spot (Leiostomus 1084
xanthurus) from a polycyclic aromatic hydrocarbon contaminated environment. Aquat 1085
Toxicol 17:119-132. 1086
Van Wezel AP, Opperhuizen A. 1995. Narcosis due to environmental pollutants 1087
in aquatic organisms: residue-based toxicity mechanisms and membrane burdens. Critical 1088
Reviews in Toxicology 25:255-279. 1089
Veith GD, DeFoe DL, Bergstedt BV. 1979. Measuring and estimating the 1090
bioconcentration factor of chemicals in fish. J Fish Res Board Can 36:1040-1048. 1091
Vieth M, Siegel MG, Higgs RE, Watson IA, Robertson DH, Savin KA, Durst GL, 1092
Hipskind PA. 2004. Characteristic physical properties and structural fragments of 1093
marketed oral drugs. J Med Chem 47:224-232. 1094
Wenlock MC, Austin RP, Barton P, Davis AM, Leeson PD. 2003. A comparison 1095
of physiochemical property profiles of development and marketed oral drugs. J Med 1096
Chem 46:1250-1256. 1097
Wood C, Pärt P. 1997. Cultured branchial epithelia from freshwater fish gills. J 1098
Exp Biol 200:1047-1059. 1099
Wood CM, Kelly SP, Zhou B, Fletcher M, O’Donnell M, Eletti B, Pärt P. 2002. 1100
Cultured gill epithelia as models for the freshwater fish gill. Biochim Biophys Acta - 1101
Biomembranes 1566:72-83. 1102
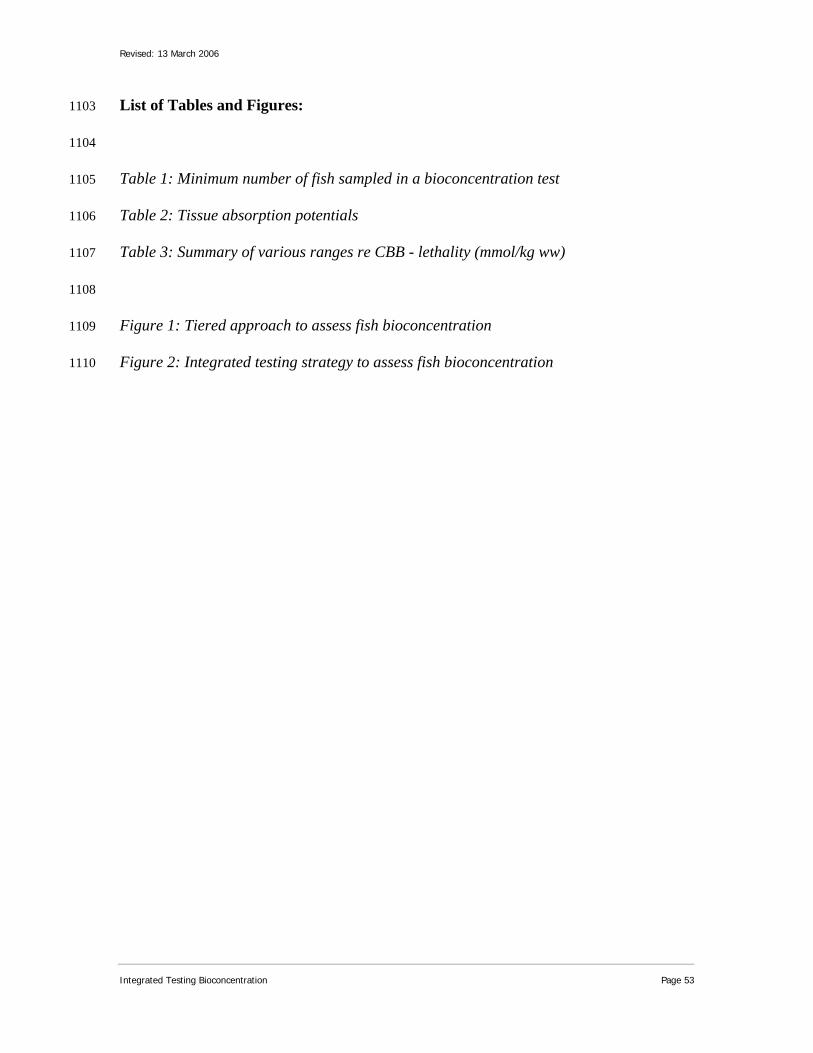
Revised: 13 March 2006
Integrated Testing Bioconcentration Page 53
List of Tables and Figures: 1103
1104
Table 1: Minimum number of fish sampled in a bioconcentration test 1105
Table 2: Tissue absorption potentials 1106
Table 3: Summary of various ranges re CBB - lethality (mmol/kg ww) 1107
1108
Figure 1: Tiered approach to assess fish bioconcentration 1109
Figure 2: Integrated testing strategy to assess fish bioconcentration 1110
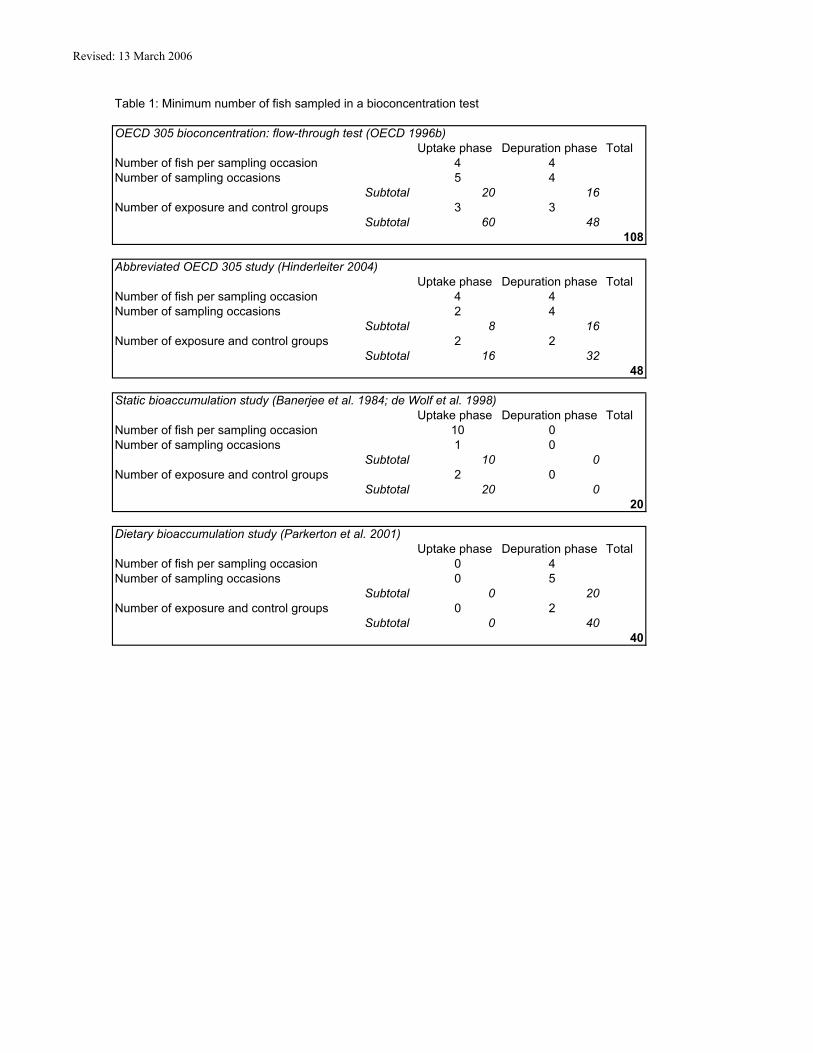
Revised: 13 March 2006
Table 1: Minimum number of fish sampled in a bioconcentration test
OECD 305 bioconcentration: flow-through test (OECD 1996b)Uptake phase Depuration phase Total
Number of fish per sampling occasion 4 4Number of sampling occasions 5 4
Subtotal 20 16Number of exposure and control groups 3 3
Subtotal 60 48108
Abbreviated OECD 305 study (Hinderleiter 2004)Uptake phase Depuration phase Total
Number of fish per sampling occasion 4 4Number of sampling occasions 2 4
Subtotal 8 16Number of exposure and control groups 2 2
Subtotal 16 3248
Static bioaccumulation study (Banerjee et al. 1984; de Wolf et al. 1998)Uptake phase Depuration phase Total
Number of fish per sampling occasion 10 0Number of sampling occasions 1 0
Subtotal 10 0Number of exposure and control groups 2 0
Subtotal 20 020
Dietary bioaccumulation study (Parkerton et al. 2001)Uptake phase Depuration phase Total
Number of fish per sampling occasion 0 4Number of sampling occasions 0 5
Subtotal 0 20Number of exposure and control groups 0 2
Subtotal 0 4040

Revised: 13 March 2006
Table 2: Tissue absorption potentials
Tissue TEER in Ω cm2 ReferencesFish intestine 25-50 Trischitta et al. (1999)Mammal intestine 20-100 Okada et al. (1977); Sinko et al. (1999)Blood-brain barrier 400-2000 Borchardt et al. (1996)Fish gill 3500 Wood et al. (1997)Human skin 20,000 Potts et al. (1997)

Revised: 13 March 2006
Table 3: Summary of various ranges re CBB - lethality (mmol/kg ww)
Mode of action and source Narcosis AChE inhibitors Respiratory inhibitorsSijm (2004) 2 0.01 0.001Thompson et al. (2003) 2 - 8 0.000001 - 10 0.000001 - 10Barron et al. (2002) 0.03 - 450 0.00004 - 29 0.00002 - 1.1 (CNS seizure agents)McCarty et al. (1993) 1.7 - 8 0.05 - 2.7 0.00005 - 0.02 (CNS seizure agents)
Barron et al. (2002) - based on Fig. 10 of Barron et al. (2002).
Sijm (2004) - an expert judgement view to arrive at an approximate single value based on 3 references(McCartyet al. 1993; Van Wezel et al. 1995; Sijm et al. 2000).
Thompson et al. (2003) - based on a literature review, the data range, beyond the narcosis mode of action, has been drawn from this report.
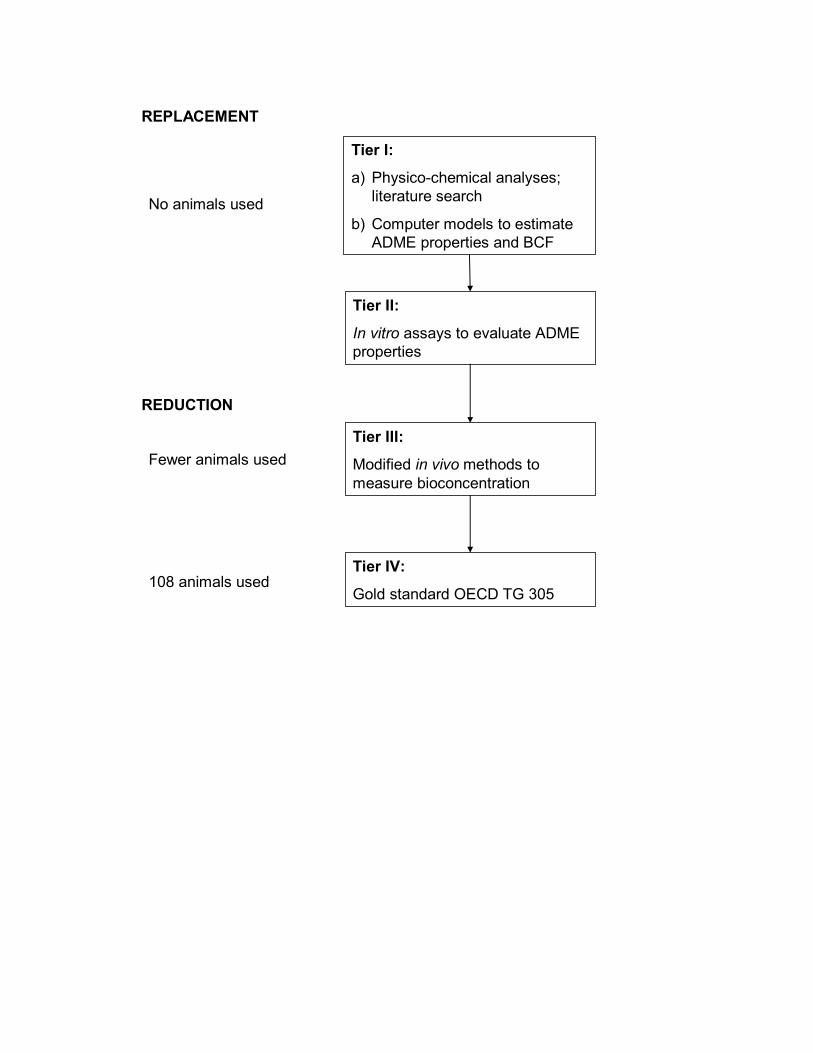
REPLACEMENT
Tier I:
a) Physico-chemical analyses;literature search
b) Computer models to estimate ADME properties and BCF
Tier II:
In vitro assays to evaluate ADME properties
Tier III:
Modified in vivo methods to measure bioconcentration
Tier IV:
Gold standard OECD TG 305
No animals used
REDUCTION
Fewer animals used
108 animals used
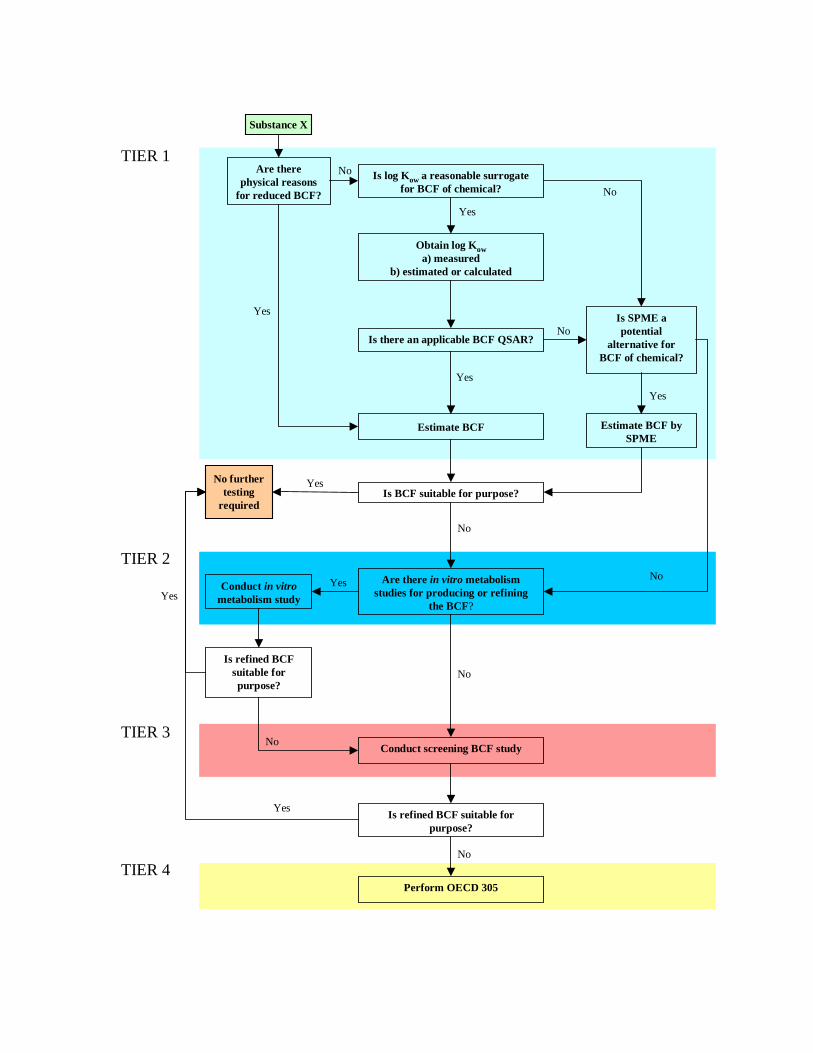
Substance X
Are there physical reasons
for reduced BCF?
Is log Kow a reasonable surrogate for BCF of chemical?
Obtain log Kowa) measured
b) estimated or calculated
Is there an applicable BCF QSAR?
Is SPME a potential
alternative for BCF of chemical?
Estimate BCF Estimate BCF bySPME
Is BCF suitable for purpose?No further
testing required
Are there in vitro metabolism studies for producing or refining
the BCF?
Conduct in vitrometabolism study
Conduct screening BCF study
Perform OECD 305
Yes
No
No
Yes
Yes
No
Yes
Yes
YesYes
No
TIER 1
TIER 2
TIER 3
TIER 4
No
Is refined BCF suitable for purpose?
Is refined BCF suitable for purpose?
No
No
No
Yes

Poster Abstracts
HESI ILSI Health and Environmental Sciences Institute
Overview of an International Workshop on In Vivo Fish Bioaccumulation Databases AV Weisbrod , TF Parkerton , KB Woodburn1 2 3
1Procter & Gamble, Cincinnati, OH, USA, ExxonMobil Biomedical Sciences, Annandale, NJ, USA, The Dow Chemical Company, Midland, MI.
2
3 Assessing the bioaccumulation (B) potential of chemicals is an important current and future regulatory consideration in chemical management policies across the globe. A dataset of reliable in vivo B data is needed as a reference to support consistent regulatory assessments of specific chemicals, to serve as the basis for developing and/or validating models and alternative methods that are faster, cheaper and avoid animal use, and to give insights into inter-species and lab-field extrapolation of B data. To progress the development of a B in vivo database, a workshop sponsored by ILSI-HESI and involving B experts from industry, academia, and government, was conducted in November 2005. Workshop participants reviewed the availability and content of existing B databases worldwide, developed guidance for study quality criteria that should be considered when conducting B tests or judging their reliability, produced recommendations ! for the OECD on their BCF data template, and proposed steps to implement improved data sharing across government databases owners and modelers. Overview of a Workshop Examining the Use and Development of In vitro Techniques for the Assessment of Bioaccumulation in Fish S. Erhardt1, J. Nichols2, AV Weisbrod3
1The Dow Chemical Company, Midland, MI, 2US EPA/ORD/NHEERL/MED, Duluth, Minnesota, USA, 3Procter & Gamble, Cincinnati, OH, USA. The bioaccumulation (B) of a chemical can be evaluated by exposing fish via water or food. Such an OECD 305 test can exceed $100,000, due to the need to provide consistent exposures, measure chemical concentrations, and observe >100 fish. The paucity of in vivo data on the large universe of chemicals that are lipophilic is driving development of reliable lower-cost approaches. Several approaches involve in vitro techniques to estimate the absorption, distribution, metabolism and excretion (ADME) of chemicals which are used to predict chemical behaviors that impact B. To progress the development of in vitro techniques for application to B assessments, a workshop sponsored by ILSI-HESI was conducted in March 2006. This presentation reviews the workshop presentations and guidance on the development and application of in vitro techniques for the assessment of bioaccumulation. Participants were from academia, industry, government research and
regulatory, representing a range of global perspectives. Over the course of two days, workshop participants reviewed existing in vitro techniques for mammals and fish, identified gaps in techniques and applications, and developed guidance to address gaps. Topic: ER13 Keywords: PBT, bioaccumulation, fish Lessons learned from the Evaluation of Bioconcentration and Bioaccumulation Factors of Commercial Chemicals F.A.P.C. Gobas and J.A. Arnot The School of Resource and Environmental Management, 8888 University Drive, Simon Fraser University, Burnaby, B.C., Canada, V5A 1S6; Canadian Environmental Modelling Centre, 1600 West Bank Drive, Trent University, Peterborough, ON, K9J 7B8
The recently ratified UNEP protocol on Long Range Transport of Atmospheric Pollutants is causing various countries around the world to evaluate, categorize and prioritize thousands of commercial substances for their persistence, ability to bioaccumulate and toxicity. To assess the bioaccumulative properties, most jurisdictions make use of the octanol-water partition coefficient (Kow), the bioconcentration factor (BCF) and the bioaccumulation factor (BAF) and apply comparable criteria. This poster presentation summarizes a set of lessons learned from the evaluation of 5,317 bioconcentration factor (BCF) and 1,656 bioaccumulation factor (BAF) values in 219 aquatic species for 842 organic chemicals from 392 scientific literature and public database sources. The analysis indicates that there are empirical data available for less 3.7% of the chemicals in commerce in Canada, illustrating the importance of the selection of appropriate criteria and methods to evaluate the bioaccumulation behavior of the remaining chemicals. This poster summarizes several lessons we learned from the evaluation of bioaccumulation data and proposes a set of recommendations with regards to definitions, objectives, criteria values, data quality criteria, alternative experimental methods and the application of models and computational techniques that may be useful to regulators, industry and scientists interested in bioaccumulation. Relevance of free concentration measurements in bioaccumulation and toxicity studies Joop LM Hermens Institute for Risk Assessment Sciences, Utrecht University, Utrecht, The Netherlands Concentration measurements form the basis for the generation of numerous experimental parameters and many decisions are based on reported measured concentrations. Bioconcentration factors of highly hydrophobic compounds for example use aqueous
Poster Abstracts 2
concentrations in the denominator, although it is known that concentration measurements in aqueous solutions of hydrophobic chemicals are extremely difficult to perform and are often subject to systematic errors. Total concentrations in soil and sediment are still often used by regulatory agencies in risk assessment decisions, while differences in bioavailability may strongly affect a site-specific risk. Also in vitro systems often report a dose or a concentration at a certain biological effect. However, as the precise exposure in these systems is often not investigated, such data and also the conclusions based on these data are often highly uncertain. This is one of the reasons why quantitative in vitro assays are poor in predicting quantitative in vivo effects. In this presentation we advocate the use of measured freely dissolved concentrations as a more intrinsic concentration parameter. Experimental data show that bioconcentration factors in soil and sediment organisms, calculated via freely dissolved concentration, do not show the often observed non-linearity with octanol-water partition coefficients. We will show that effect concentrations based on freely dissolved concentrations represent the more intrinsic potency of chemicals in in vitro assays. These data provide unbiased input for computational methods, and can shed an entirely different light on the activity of chemicals. Finally, examples will be presented on measured free concentrations in relation to bioavailability in soil. Besides the focus on examples, also techniques for measuring freely dissolved concentrations will be briefly discussed with an emphasis on solid phase micro-extraction Name: Joop Hermens Address: Institute for Risk Assessment Sciences, Utrecht University PO Box 80176, Utrecht The Netherlands NL 3508 TD Email: [email protected] Phone: +31-30-2535337 Phone 2: Fax: +31-30-2535077
Bioconcentration of primary amines in fish – too B or not too B?
P.C. Thomas1, T. Jelink3, KE Stensio4, B. Kluskens1, M. Geurts1 & J. Rosenblom2
1Environmental Chemistry and Regulatory Affairs, SHERA, Akzo Nobel Technology & Engineering, Arnhem, The Netherlands 2Akzo Nobel Surfactants Europe, Stenungsund, Sweden 3CAP – Analytics and Physics, Chemicals Research Arnhem, The Netherlands 4Analyscentrum, AkzoNobel, Nacka, Sweden
Key words: Cationic surfactant, adsorption, bioaccumulation, bioconcentration
Hexadecylamine (C16PA) is a component of a group of cationic surfactants currently under scrutiny in the EU existing substances (793/93) risk assessment process. Technical problems are associated with measuring the lipophilicity and bioaccumulation potential of these molecules. Laboratory measurements and off-the-shelf models do not provide accurate values of log Kow and no bioconcentration data exist. A modified OECD 305 bioconcentration test, reducing the number of fish, was performed to determine bioconcentration of C16PA in Cyprinus carpio. Plateau levels of C16PA were reached
Poster Abstracts 3
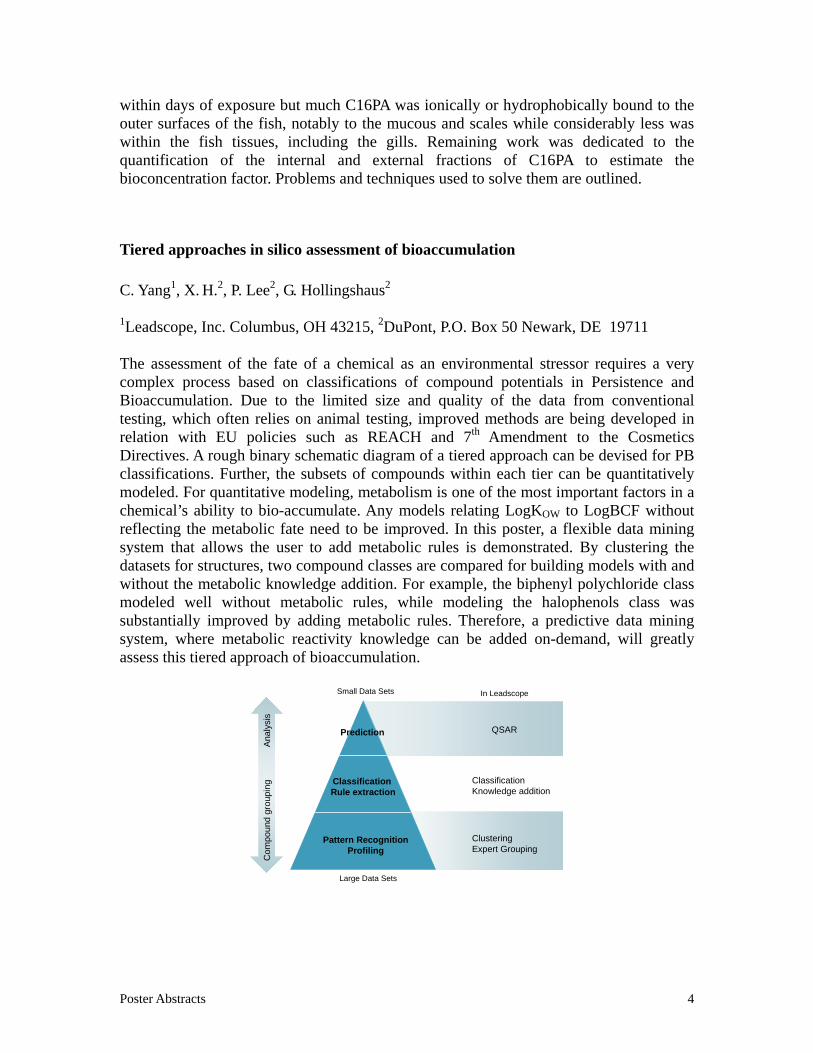
within days of exposure but much C16PA was ionically or hydrophobically bound to the outer surfaces of the fish, notably to the mucous and scales while considerably less was within the fish tissues, including the gills. Remaining work was dedicated to the quantification of the internal and external fractions of C16PA to estimate the bioconcentration factor. Problems and techniques used to solve them are outlined.
Tiered approaches in silico assessment of bioaccumulation C. Yang1, X. H.2, P. Lee2, G. Hollingshaus2 1Leadscope, Inc. Columbus, OH 43215, 2DuPont, P.O. Box 50 Newark, DE 19711 The assessment of the fate of a chemical as an environmental stressor requires a very complex process based on classifications of compound potentials in Persistence and Bioaccumulation. Due to the limited size and quality of the data from conventional testing, which often relies on animal testing, improved methods are being developed in relation with EU policies such as REACH and 7th Amendment to the Cosmetics Directives. A rough binary schematic diagram of a tiered approach can be devised for PB classifications. Further, the subsets of compounds within each tier can be quantitatively modeled. For quantitative modeling, metabolism is one of the most important factors in a chemical’s ability to bio-accumulate. Any models relating LogKOW to LogBCF without reflecting the metabolic fate need to be improved. In this poster, a flexible data mining system that allows the user to add metabolic rules is demonstrated. By clustering the datasets for structures, two compound classes are compared for building models with and without the metabolic knowledge addition. For example, the biphenyl polychloride class modeled well without metabolic rules, while modeling the halophenols class was substantially improved by adding metabolic rules. Therefore, a predictive data mining system, where metabolic reactivity knowledge can be added on-demand, will greatly assess this tiered approach of bioaccumulation.
Small Data Sets
Large Data Sets
Pattern RecognitionProfiling
Classification Rule extraction
Prediction
ClusteringExpert Grouping
ClassificationKnowledge addition
QSAR
Com
poun
d gr
oupi
ng
A
naly
sis
In Leadscope
Poster Abstracts 4
A Pragmatic Approach to Reduce the Workload in B Assessments
Volker Koch Clariant Products (Germany) GmbH, 65840 Sulzbach, Germany Key words: B Cutoff value based on Kow, REACH PBT & vPvB Assessment Article 13 of the REACH legislation (Council Draft December 2005) requires notifiers to carry out a PBT & vPvB Assessment. As REACH covers a huge amount of substances it is crucial for notifiers to have assessment guidance available preventing that substances have to be assessed on B which are in fact not bioaccumulative. In the EU the B Criteria is related to BCF (e.g. 2000 for PBT or 5000 for vPvB substances). As for very many substances BCFs are not available Kow is used as B criteria (potential B with Kow > 4.5 for PBT or > 5 for vPvB Substances). From available data is known that at higher Kow bioconcentration, bioaccumulation and biomagnification drops again. In the framework of the EU REACH Implementation Project RIP 3.2-2 ‘Commission Working Group on PBT & vPvB Guidance’ a first draft proposal was delevoped for a Cutoff for B Assessment for substances with calculated Kow > 9.5. In addition if a substance fulfills this cutoff criteria it has to be checked if potential metabolites are not PBT or vPvB substances. This approach was tested with five substances from the EU PBT & vPvB List (originally 93 substances) and was found applicable. Another 10 substances from this list with calculated Kow > 9.5 are currently under investigation to check applicability. Use of a Parallel Artificial Membrane System to Evaluate Passive Absorption and Elimination in Small Fish J.H. Kwon, H.M. Liljestrand and L.E. Katz Department of Civil, Architectural and Environmental Engineering, The University of Texas at Austin, 1 University Station C1786, Austin, Texas, 78712-0273 Evaluating bioconcentration has been of critical issue for decades. There are needs for developing alternative screening methods in a tiered approach due to the large number of synthetic chemicals that need to be evaluated and high cost of existing test methods using aquatic animals. For this reason, a parallel artificial lipid membrane permeability assay (PAMPA) that is a well established tool in pharmacokinetic research was explored and evaluated for its potential to mimic passive mass transfer of hydrophobic organic chemicals in fish. In this model system, a membrane filter-supported lipid bilayer separates two aqueous phases that represent the external and internal aqueous environments of fish. To predict bioconcentration kinetics in small fish using this system, literature absorption and elimination rates were analyzed using an allometric diffusion model to quantify the mass transfer resistances in the aqueous and lipid phases of fish. The impact of the aqueous phase mass transfer resistance was controlled by adjusting stirring intensity to mimic bioconcentration rates in small fish. Twenty three simple
Poster Abstracts 5

aromatic hydrocarbons were chosen as model compounds the evaluation. For most of the selected chemicals, literature absorption/elimination rates fall into the range predicted from measured membrane permeabilities and elimination rates of the selected chemicals determined using the diffusion model system. After further refinement, this in-vitro system may be a valuable tool for bioconcentration assessment and prioritization of bioaccumulation testing.
Poster Abstracts 6

Bioaccumulation Poster
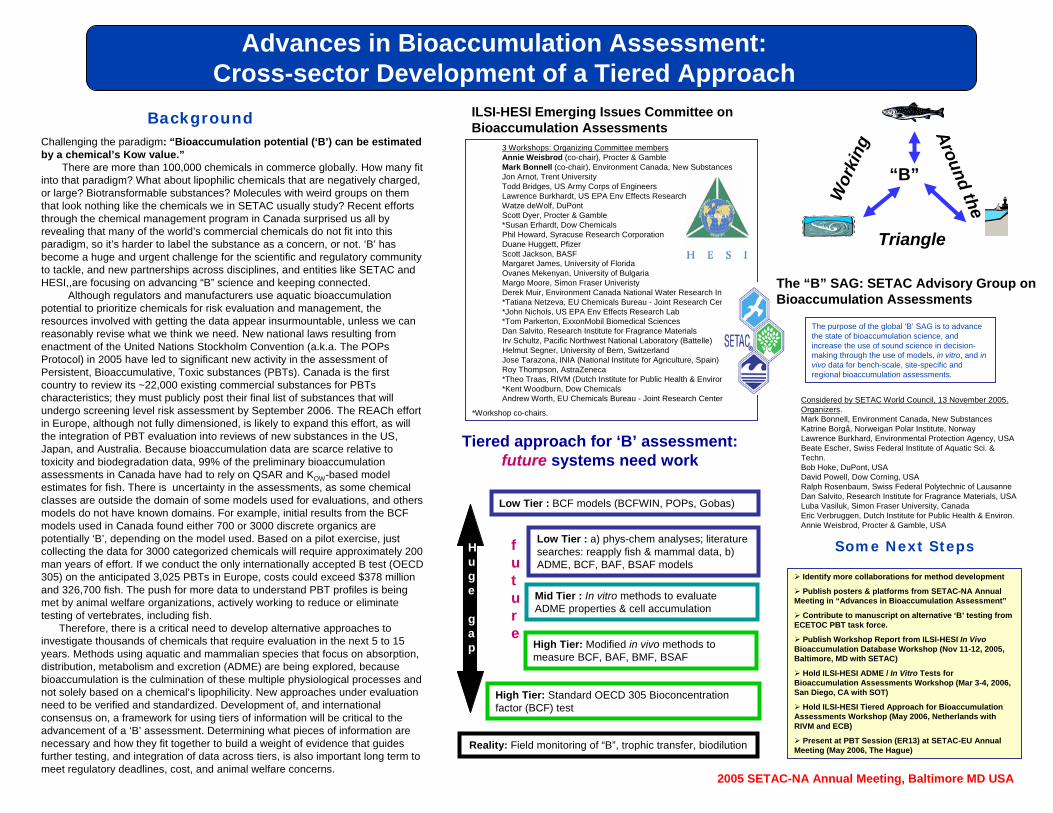
3 Workshops: Organizing Committee membersAnnie Weisbrod (co-chair), Procter & GambleMark Bonnell (co-chair), Environment Canada, New SubstancesJon Arnot, Trent UniversityTodd Bridges, US Army Corps of EngineersLawrence Burkhardt, US EPA Env Effects Research LabWatze deWolf, DuPontScott Dyer, Procter & Gamble*Susan Erhardt, Dow ChemicalsPhil Howard, Syracuse Research CorporationDuane Huggett, PfizerScott Jackson, BASFMargaret James, University of FloridaOvanes Mekenyan, University of BulgariaMargo Moore, Simon Fraser UniveristyDerek Muir, Environment Canada National Water Research Institute*Tatiana Netzeva, EU Chemicals Bureau - Joint Research Center*John Nichols, US EPA Env Effects Research Lab*Tom Parkerton, ExxonMobil Biomedical SciencesDan Salvito, Research Institute for Fragrance MaterialsIrv Schultz, Pacific Northwest National Laboratory (Battelle)Helmut Segner, University of Bern, SwitzerlandJose Tarazona, INIA (National Institute for Agriculture, Spain)Roy Thompson, AstraZeneca*Theo Traas, RIVM (Dutch Institute for Public Health & Environment)*Kent Woodburn, Dow ChemicalsAndrew Worth, EU Chemicals Bureau - Joint Research Center
*Workshop co-chairs.
Advances in Bioaccumulation Assessment: Cross-sector Development of a Tiered Approach
Background
Some Next Steps
ILSI-HESI Emerging Issues Committee on Bioaccumulation Assessments
The “B” SAG: SETAC Advisory Group on Bioaccumulation Assessments
Considered by SETAC World Council, 13 November 2005. Organizers.Mark Bonnell, Environment Canada, New SubstancesKatrine Borgå, Norweigan Polar Institute, NorwayLawrence Burkhard, Environmental Protection Agency, USABeate Escher, Swiss Federal Institute of Aquatic Sci. & Techn.Bob Hoke, DuPont, USADavid Powell, Dow Corning, USARalph Rosenbaum, Swiss Federal Polytechnic of LausanneDan Salvito, Research Institute for Fragrance Materials, USALuba Vasiluk, Simon Fraser University, CanadaEric Verbruggen, Dutch Institute for Public Health & Environ.Annie Weisbrod, Procter & Gamble, USA
“B”
Triangle
Wor
king
Around the
Tiered approach for ‘B’ assessment:future systems need work
Low Tier : BCF models (BCFWIN, POPs, Gobas)
Mid Tier : In vitro methods to evaluate ADME properties & cell accumulation
High Tier: Modified in vivo methods to measure BCF, BAF, BMF, BSAF
High Tier: Standard OECD 305 Bioconcentrationfactor (BCF) test
Reality: Field monitoring of “B”, trophic transfer, biodilution
Low Tier : a) phys-chem analyses; literature searches: reapply fish & mammal data, b) ADME, BCF, BAF, BSAF models
future
Huge
gap
The purpose of the global ‘B’ SAG is to advance the state of bioaccumulation science, and increase the use of sound science in decision-making through the use of models, in vitro, and in vivo data for bench-scale, site-specific and regional bioaccumulation assessments.
Identify more collaborations for method development
Publish posters & platforms from SETAC-NA Annual Meeting in “Advances in Bioaccumulation Assessment”
Contribute to manuscript on alternative ‘B’ testing from ECETOC PBT task force.
Publish Workshop Report from ILSI-HESI In VivoBioaccumulation Database Workshop (Nov 11-12, 2005, Baltimore, MD with SETAC)
Hold ILSI-HESI ADME / In Vitro Tests for Bioaccumulation Assessments Workshop (Mar 3-4, 2006, San Diego, CA with SOT)
Hold ILSI-HESI Tiered Approach for Bioaccumulation Assessments Workshop (May 2006, Netherlands with RIVM and ECB)
Present at PBT Session (ER13) at SETAC-EU Annual Meeting (May 2006, The Hague)
2005 SETAC-NA Annual Meeting, Baltimore MD USA
Challenging the paradigm: “Bioaccumulation potential (‘B’) can be estimated by a chemical’s Kow value.”
There are more than 100,000 chemicals in commerce globally. How many fit into that paradigm? What about lipophilic chemicals that are negatively charged, or large? Biotransformable substances? Molecules with weird groups on them that look nothing like the chemicals we in SETAC usually study? Recent efforts through the chemical management program in Canada surprised us all by revealing that many of the world’s commercial chemicals do not fit into this paradigm, so it’s harder to label the substance as a concern, or not. ‘B’ has become a huge and urgent challenge for the scientific and regulatory community to tackle, and new partnerships across disciplines, and entities like SETAC and HESI,,are focusing on advancing “B” science and keeping connected.
Although regulators and manufacturers use aquatic bioaccumulation potential to prioritize chemicals for risk evaluation and management, the resources involved with getting the data appear insurmountable, unless we can reasonably revise what we think we need. New national laws resulting from enactment of the United Nations Stockholm Convention (a.k.a. The POPsProtocol) in 2005 have led to significant new activity in the assessment of Persistent, Bioaccumulative, Toxic substances (PBTs). Canada is the first country to review its ~22,000 existing commercial substances for PBTscharacteristics; they must publicly post their final list of substances that will undergo screening level risk assessment by September 2006. The REACh effort in Europe, although not fully dimensioned, is likely to expand this effort, as will the integration of PBT evaluation into reviews of new substances in the US, Japan, and Australia. Because bioaccumulation data are scarce relative to toxicity and biodegradation data, 99% of the preliminary bioaccumulation assessments in Canada have had to rely on QSAR and KOW-based model estimates for fish. There is uncertainty in the assessments, as some chemical classes are outside the domain of some models used for evaluations, and others models do not have known domains. For example, initial results from the BCF models used in Canada found either 700 or 3000 discrete organics are potentially ‘B’, depending on the model used. Based on a pilot exercise, just collecting the data for 3000 categorized chemicals will require approximately 200 man years of effort. If we conduct the only internationally accepted B test (OECD 305) on the anticipated 3,025 PBTs in Europe, costs could exceed $378 million and 326,700 fish. The push for more data to understand PBT profiles is being met by animal welfare organizations, actively working to reduce or eliminate testing of vertebrates, including fish.
Therefore, there is a critical need to develop alternative approaches to investigate thousands of chemicals that require evaluation in the next 5 to 15 years. Methods using aquatic and mammalian species that focus on absorption, distribution, metabolism and excretion (ADME) are being explored, because bioaccumulation is the culmination of these multiple physiological processes and not solely based on a chemical’s lipophilicity. New approaches under evaluation need to be verified and standardized. Development of, and international consensus on, a framework for using tiers of information will be critical to the advancement of a ‘B’ assessment. Determining what pieces of information are necessary and how they fit together to build a weight of evidence that guides further testing, and integration of data across tiers, is also important long term to meet regulatory deadlines, cost, and animal welfare concerns.