image analysis of archaeological ceramics and its
TRANSCRIPT

P R O C E E D I N G S • I N T E R N A T I O N A L S C I E N T I F I C C O N F E R E N C E • M E T H O D O L O G Y & A R C H A E O M E T R Y 0 6 75
Ki Suk Park, Ralf MilkeInstitut für Geologische Wissenschaften
Freie Universität BerlinMalteserstraße 74-100,
D – 12249 [email protected]
Erik RybackiDeutsches GeoForschungsZentrum GFZ, Section 4.2
TelegrafenbergD – 14473 Potsdam
Sabine ReinholdDeutsches Archäologisches Institut
Im Dol 2-6, Haus II D – 14195 Berlin
Image analysis of Archaeological Ceramics and its Application to the Identification of Prehistoric Production Technologies
Ki Suk ParkRalf Milke
Erik RybackiSabine Reinhold
https://doi.org/10.17234/METARH.2019.5
Recent advances in microscopy, scanning techniques and digital data processing have allowed image analysis of ar-chaeological objects. In this study, 2D/3D image analysis will be applied for the main topics of ceramic pottery produc-tion: resource gathering, firing degree and shaping techniques. The basic images were acquired by the polarized light microscope, SEM and 3D µ-CT. The segmentation and parametrization of structural elements were performed by Mat-lab. In order to characterize ceramic pastes, shape parameters such as size distribution, circularity and sphericity of coarse sand grains provided quantitative information. Pore topology dominated by the clay/ceramic sintering can give qualitative and quantitative data for the pyrometamorphic degree of the ceramics. Sphericity, surface area, volume, Euler characteristic and curvature of open and closed pores are the possible parameters describing the topology and topological changes. They allow us to estimate the existence of various firing states. Shaping techniques of the ceramic body were identified by three-dimensional alignments of segmented pores and sand grains. A continuous and separate building of the structural part, hand shaping or wheel-shaping/thrown can be suggested by this method. Despite the heterogeneity in mineralogical and chemical composition, grain size distribution and firing state of most archaeologi-cal ceramics, it is expected that the direct measurement of the visual element and its parametrization enable us to identify various techniques employed for the prehistoric ceramic production. This method will contribute to recon-structing technological styles of prehistoric material production with easier and faster availability and accessibility.
Keywords: pottery production, shape parameters, pore topology, shaping techniques, image analysis, 3D µ-CT
M E T H O D O L O G Y & A R C H A E O M E T R Y 0 6 • I N T E R N A T I O N A L S C I E N T I F I C C O N F E R E N C E • P R O C E E D I N G S 76
Introduction
In the past twenty years, there have been rapid advanc-es in microscopy, scanning and image processing tech-niques (Ketcham and Carlson 2001; Cnudde and Boone 2013). Above all, the application of high resolution X-ray computed tomography (CT) clarified the internal struc-ture of fossils, meteorites, and textural differences in magmatic, metamorphic and sedimentary rocks and soils related to sintering (Dierick et al. 2007; Brun et al. 2010; Voltolini et al. 2011; Yin et al. 2016; Bauer et al. 2017; Selden and Penney 2017). This technique is sup-ported by mass data processing accompanied by pro-gress in the central processing unit (CPU) and graphics processing unit (GPU) and the data transport system. This allows image visualization and segmentation as well as the complex calculation of the geometry of the studied objects. Advanced image acquisition and analy-sis have huge research potential in archaeology and ar-chaeological sciences. Thanks to the mobility of digital data, researchers can perform the analysis in relatively boundary-free conditions without the necessity to trans-port the fragile archaeological objects over long distance and time.
In previous studies, polarized light microscopic images or scanned images of cross sections or thin sections of ceramics were used for the identification of forming and shaping techniques of ceramics (Lindahl and Pikirary 2010). Alignments of grains or pores provide visual evi-dence for the shaping methods such as coiling, mould-
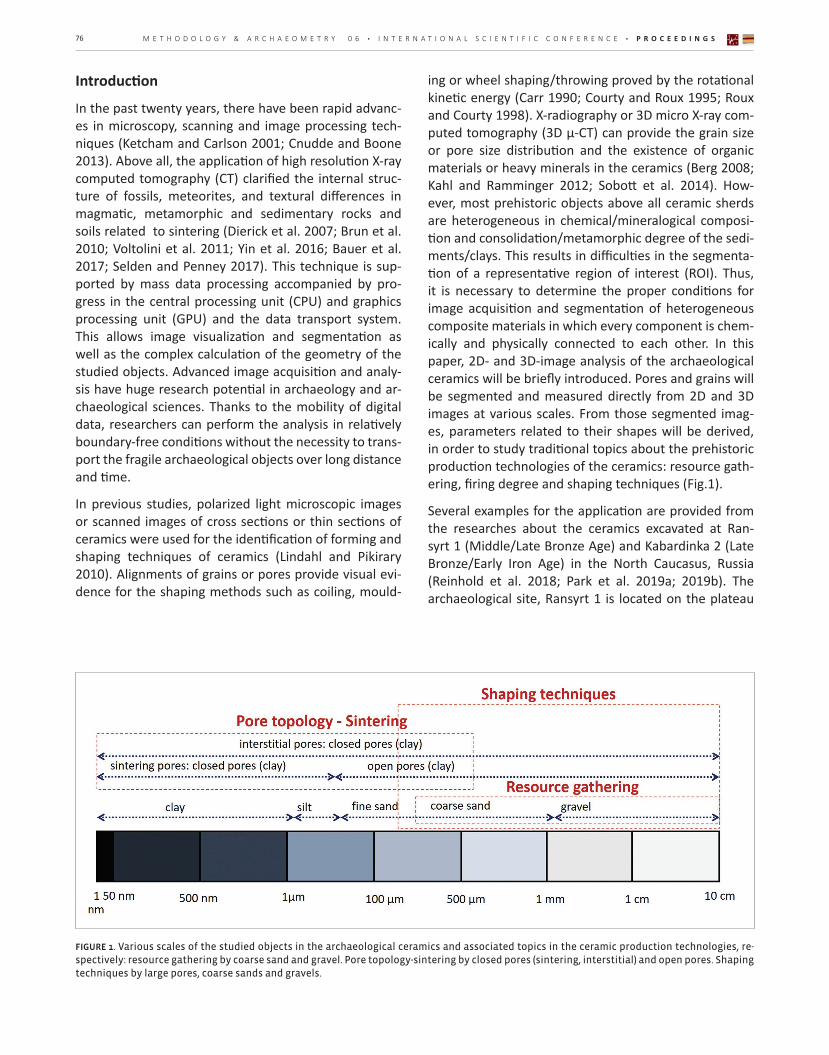
ing or wheel shaping/throwing proved by the rotational kinetic energy (Carr 1990; Courty and Roux 1995; Roux and Courty 1998). X-radiography or 3D micro X-ray com-puted tomography (3D µ-CT) can provide the grain size or pore size distribution and the existence of organic materials or heavy minerals in the ceramics (Berg 2008; Kahl and Ramminger 2012; Sobott et al. 2014). How-ever, most prehistoric objects above all ceramic sherds are heterogeneous in chemical/mineralogical composi-tion and consolidation/metamorphic degree of the sedi-ments/clays. This results in difficulties in the segmenta-tion of a representative region of interest (ROI). Thus, it is necessary to determine the proper conditions for image acquisition and segmentation of heterogeneous composite materials in which every component is chem-ically and physically connected to each other. In this paper, 2D- and 3D-image analysis of the archaeological ceramics will be briefly introduced. Pores and grains will be segmented and measured directly from 2D and 3D images at various scales. From those segmented imag-es, parameters related to their shapes will be derived, in order to study traditional topics about the prehistoric production technologies of the ceramics: resource gath-ering, firing degree and shaping techniques (Fig.1).
Several examples for the application are provided from the researches about the ceramics excavated at Ran-syrt 1 (Middle/Late Bronze Age) and Kabardinka 2 (Late Bronze/Early Iron Age) in the North Caucasus, Russia (Reinhold et al. 2018; Park et al. 2019a; 2019b). The archaeological site, Ransyrt 1 is located on the plateau
FIGURE 1. Various scales of the studied objects in the archaeological ceramics and associated topics in the ceramic production technologies, re-spectively: resource gathering by coarse sand and gravel. Pore topology-sintering by closed pores (sintering, interstitial) and open pores. Shaping techniques by large pores, coarse sands and gravels.

P R O C E E D I N G S • I N T E R N A T I O N A L S C I E N T I F I C C O N F E R E N C E • M E T H O D O L O G Y & A R C H A E O M E T R Y 0 6 77
with the height of 1850 m above sea level, while an-other site, Kabardinka 2 lies on the lower plateau with 1400 m a.s.l. (Reinhold et al. 2018). Ransyrt 1 ceram-ics contain four groups of mineralogical composition of the grains: 1) quartz and K-feldspar, mica-chlorite inter-growths with traces of albite and kaolinite; 2) quartz and K-feldspar, mica-chlorite intergrowths and plagioclase and alteration products; 3) Plagioclase and clinopyrox-ene; 4) quartz, K-feldspar and calcite. In many samples, quartz and K-feldspar build a fine mixture in grains. In the meanwhile, ceramics from Kabardinka 2 have differ-ent mineralogical combinations: 1) quartz and K-feldspar often accompanied by kaolinizing phases; 2) quartz, K-feldspar, mica-chlorite intergrowths and plagioclase, mostly Ca-plagioclase from anorthite to labradorite in a subhedral or euhedral form located in the altered vol-canic glass and kaolinizing phases; 3) quartz, K-feldspar, calcite; 4) quartz, K-feldspar, calcite and mica-chlorite intergrowth; 5) random combinations of quartz, K-feld-spar, plagioclase, mica-chlorite intergrowths, calcite, kaolinizing phases, alteration product similar to olivine or amphibole, clinopyroxene, and SiO2-rich porous and vitreous grains. The dominant chemical composition of the ceramic matrix composed of all grains smaller than 50 µm for both sites is different from each other. In Ran-syrt 1 ceramics, there are Ca/Mg-rich objects, while Kab-ardinka 2 samples have Fe-rich sherds. Despite these dif-ferences, illite is identified as the dominant clay mineral for the whole ceramic samples.
Image processing: Image acquisition, reconstruction and segmentation
Images of the ceramics were acquired at different scales and with different spatial resolutions. In order to char-acterize the ceramic pastes in terms of the morphology, sand grains in the ceramics are analyzed. In this study, 2D digital images were acquired by polarized light mi-croscopy with a pixel size of 3.272 and 102 µm2. For the 3D image processing, samples were scanned by 3D µ-CT (nanotom 180NF, GE phoenixIx-ray) with tube voltage and current of 140 kV and 96 µA, respectively. In total, 1080 images at angular steps of 0.33 degree were taken with an acquisition time of 1000 msec/image. The voxel size was 9.49 µm3, to compare to the 2D image analysis using 102 µm2 per pixel. The whole area and volume of the sample were ROI because most prehistoric ceram-ics contain a huge grain size distribution. The selected magnification of the sample, as well as pixel/voxel size, were enough to represent the corresponding sample. The acquired images were reconstructed as a volume file using the phoenix datos|x reconstruction software with a beam hardening correction (BHC) factor of 8. An edge enhancement filter was applied for the reconstruction.
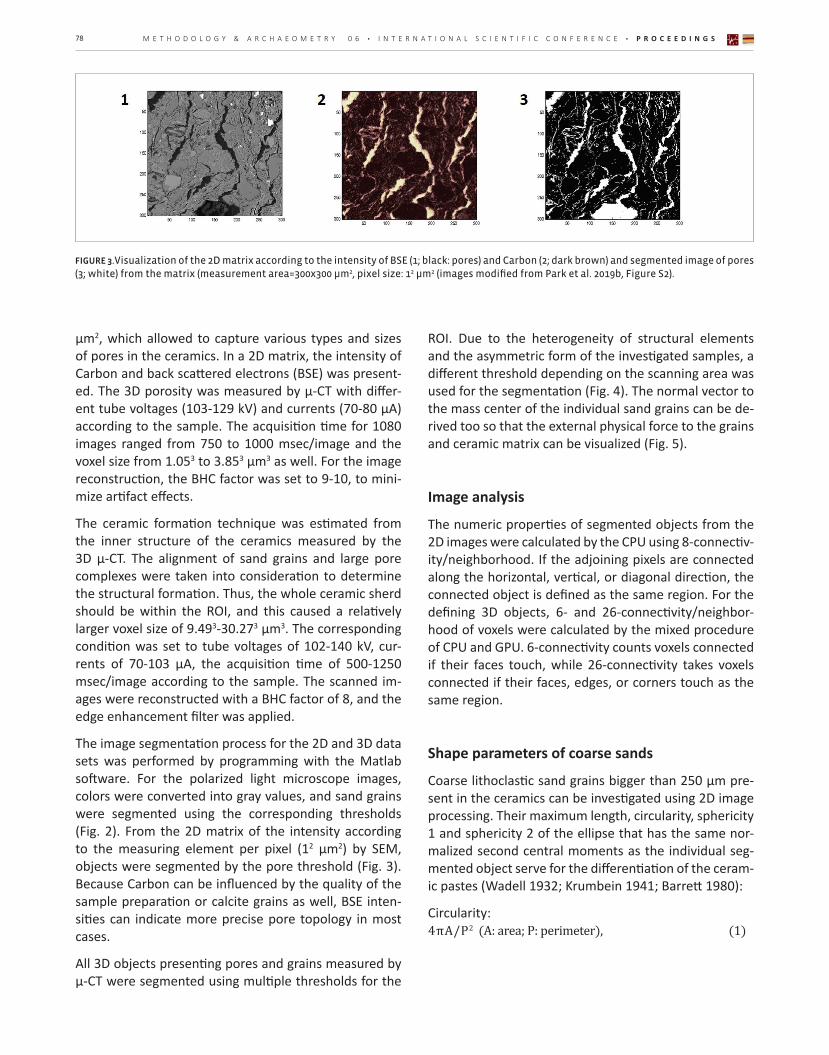
The second topic, pore topology in 2D was measured by scanning electron microscopy (SEM), JEOL JXA 8200 Superprobe with an acceleration voltage of 15 kV. The scanned area was 300 x 300 µm2 with a pixel size of 12
FIGURE 2. 1. Polarized light microscopic images (cross and plane polarized light) of the cross section (pixel size: 3.272 µm2); 2. Segmented image of sand grains (white) from a BSE image (pixel size: 102 µm2).
M E T H O D O L O G Y & A R C H A E O M E T R Y 0 6 • I N T E R N A T I O N A L S C I E N T I F I C C O N F E R E N C E • P R O C E E D I N G S 78
µm2, which allowed to capture various types and sizes of pores in the ceramics. In a 2D matrix, the intensity of Carbon and back scattered electrons (BSE) was present-ed. The 3D porosity was measured by µ-CT with differ-ent tube voltages (103-129 kV) and currents (70-80 µA) according to the sample. The acquisition time for 1080 images ranged from 750 to 1000 msec/image and the voxel size from 1.053 to 3.853 µm3 as well. For the image reconstruction, the BHC factor was set to 9-10, to mini-mize artifact effects.
The ceramic formation technique was estimated from the inner structure of the ceramics measured by the 3D µ-CT. The alignment of sand grains and large pore complexes were taken into consideration to determine the structural formation. Thus, the whole ceramic sherd should be within the ROI, and this caused a relatively larger voxel size of 9.493-30.273 µm3. The corresponding condition was set to tube voltages of 102-140 kV, cur-rents of 70-103 µA, the acquisition time of 500-1250 msec/image according to the sample. The scanned im-ages were reconstructed with a BHC factor of 8, and the edge enhancement filter was applied.
The image segmentation process for the 2D and 3D data sets was performed by programming with the Matlab software. For the polarized light microscope images, colors were converted into gray values, and sand grains were segmented using the corresponding thresholds (Fig. 2). From the 2D matrix of the intensity according to the measuring element per pixel (12 µm2) by SEM, objects were segmented by the pore threshold (Fig. 3). Because Carbon can be influenced by the quality of the sample preparation or calcite grains as well, BSE inten-sities can indicate more precise pore topology in most cases.
All 3D objects presenting pores and grains measured by µ-CT were segmented using multiple thresholds for the
ROI. Due to the heterogeneity of structural elements and the asymmetric form of the investigated samples, a different threshold depending on the scanning area was used for the segmentation (Fig. 4). The normal vector to the mass center of the individual sand grains can be de-rived too so that the external physical force to the grains and ceramic matrix can be visualized (Fig. 5).
Image analysis
The numeric properties of segmented objects from the 2D images were calculated by the CPU using 8-connectiv-ity/neighborhood. If the adjoining pixels are connected along the horizontal, vertical, or diagonal direction, the connected object is defined as the same region. For the defining 3D objects, 6- and 26-connectivity/neighbor-hood of voxels were calculated by the mixed procedure of CPU and GPU. 6-connectivity counts voxels connected if their faces touch, while 26-connectivity takes voxels connected if their faces, edges, or corners touch as the same region.
Shape parameters of coarse sands
Coarse lithoclastic sand grains bigger than 250 µm pre-sent in the ceramics can be investigated using 2D image processing. Their maximum length, circularity, sphericity 1 and sphericity 2 of the ellipse that has the same nor-malized second central moments as the individual seg-mented object serve for the differentiation of the ceram-ic pastes (Wadell 1932; Krumbein 1941; Barrett 1980):
Circularity: 4πA/P2 (A: area; P: perimeter), (1)
FIGURE 3.Visualization of the 2D matrix according to the intensity of BSE (1; black: pores) and Carbon (2; dark brown) and segmented image of pores (3; white) from the matrix (measurement area=300x300 µm2, pixel size: 12 µm2 (images modified from Park et al. 2019b, Figure S2).

P R O C E E D I N G S • I N T E R N A T I O N A L S C I E N T I F I C C O N F E R E N C E • M E T H O D O L O G Y & A R C H A E O M E T R Y 0 6 79
Sphericity 1 (elongation): DF , max) / DF , min (DF: Feret diameter), (2)
Sphericity 2 (elongation): a / b (a : major axis, b : minor axis). (3)
These parameters were illustrated in Figure 6. Because most sand grains are composed of various mineralogical phases, the shape parameters derived from each grain are more representative for geological conditions of the origin of ceramic pastes than parameters derived from each single mineral phase. The shape parameters de-
FIGURE 4.1. Original ceramic sherd (Ran1_554_4) and its ROI in the box of the white dashed line; 2. Isosurface of the sample with Isocaps of the exposed cross section derived from the reconstructed 3D image; 3. Segmentation of sand/silt grains (red) and pores (blue) from the reconstructed 3D image; 4. Segmentation of sand grains bigger than 0.044 mm3 (red) and pores bigger than 0.022 mm3 (blue) in the ceramic body (transparent light grey). (geometric magnification, voxel size: 24.313 µm3).
FIGURE 5. 1. Original ceramic sherd (Ran1_441_31); 2. Segmented sand and silt grains (red) in the ceramic body (transparent grey) from the recon-structed 3D image; 3. Segmented sand grains bigger than 0.044 mm3 (red) and pores bigger than 0.022 mm3 (blue) in the ceramic body (transparent grey) from the reconstructed 3D image; 4. Normal vector (small arrows in light blue) of mass center of grains in the black dashed lines of 5.2. This indicates the direction of force to the grains. (geometric magnification, voxel size: 28.213 µm3).

M E T H O D O L O G Y & A R C H A E O M E T R Y 0 6 • I N T E R N A T I O N A L S C I E N T I F I C C O N F E R E N C E • P R O C E E D I N G S 80
rived from 3D images may give more precise value, espe-cially the length of grains because the two-dimensional measurement cannot due to the sand alignment.
Pore topology
Pore topology ranging from submicron to a few hundred micrometer scale could indicate the pyrometamorphic degree of the ceramics because it is influenced by the clay sintering according to the firing temperature (Okuma et al. 2017). In the case of the solid sintering in the homo-geneous shape and composition, its topological changes provide thresholds of each sintering stage: (i) contact between neighboring solid particles; (ii) interconnected channels with cylindrical pores; (iii) formation of closed pores (Coble 1961; Okuma et al. 2017). The procedure of clay sintering can be described by similar steps, too (De Jonghe and Rahaman 2003). The initial stage can be described by the formation of sharply concave necks between the individual solid particles, while the inter-mediate stage forms a 3D interpenetrating network of solid particles and continuous, channel-like pores with high curvatures. The final stage of sintered clay shows isolated and closed pores accompanied by the extensive removal of pore volumes.
However, most archaeological ceramics are composed of heterogeneous components such as clay mineral, qu-ratz and other rock-forming minerals. This influeces pore topology in the initial and pyrometamorphic state. The sintering of those composites occurs as a mixed process of the densification process by the grain boundary diffu-
sion, lattice diffusion from the grain boundary and plastic flow and the coarsening process by the surface diffusion, lattice diffusion from the surface and vapor transport (De Jonghe and Rahaman 2003). Despite these difficulties in the morphological description, the pore space formation was classified into several simplified steps related to the ceramic firing: (i) drying and shrinking of the clay paste; (ii) dehydration in the low temperature firing interval between 100 and 200°C, creating interstitial pores; (iii) continuous increase in porosity by chemical reactions such as dehydroxylation of clay minerals, dissociation of carbonates, reactions between other constituent min-eral phases between 400 and 800°C; (iv) liquid phase sintering with interconnected pores of irregular shape and partial melts; and (v) final state of the ceramic fabric varying from non-vitrified to completely vitrified (Ferrer et al. 2015). Direct measurements of the heterogene-ous archaological ceramics in 2D and 3D proved that the general topological changes in micrometer scale are led by the clay sintering process (Park et al. 2019b). This is related to the earlier beginning of the clay sintering, in comparison to the other mineralogical components such as quartz. However, another abundant mineral in ceram-ics, calcite or organic phases such as plants rests are ex-ceptional case, because their contribution to the pore topology is not related to the sintering of solids. Those features should be separately evaluated.
According to the morphological changes led by clay sin-tering, 2D and 3D representations of the complex pore geometry can be employed for the pore topology de-scription of archaeological ceramics (Vogel 1997; Vogel
FIGURE 6.Shape parameters for the sand grains in archaeological ceramics. 1. Size distribution based on the maximum length of the grain; 2. Circu-larity calculated from the area and perimeter; 3. Sphericity 1 calculated from max. and min. Feret diameter. Indicator of an elongated degree; 4. Sphericity 2 calculated from major and minor axis of the weight centered sphere of the grain. Another formula for an elongated degree.

P R O C E E D I N G S • I N T E R N A T I O N A L S C I E N T I F I C C O N F E R E N C E • M E T H O D O L O G Y & A R C H A E O M E T R Y 0 6 81
et al. 2010). Euler characteristic can provide an unbiased estimation of pore topology, possible for a 3D cutout of arbitrary shape and volume V (Vogel and Roth 2001). Figure 7 shows the parameters which describe the pore topology. The Euler characteristic (χ) was calculated from 2D and 3D images using the following formula:
χ2D = n(objects) – n(pores), (4)
χ3D = n(objects) – n(pores) + n(cavities). (5)
n(objects), n(pores) and n(cavities) mean the total num-bers of objects, pores and cavities, respectively. Because the 3D micro-tomographic data were reconstructed with voxels in a cube form, Euler characteristic was acquired by the Euler-Poincaré Formula (Vogel and Roth 2001; Legland et al. 2007):
χ3D = n(vertices) – n(edges) + n(surfaces) – n(volumes). (6)
Due to the very heterogeneous shapes existing in the samples, the calculation used the 6-connectivity of pix-els. The orientation of the pores can provide additional evidence of the sintering stage. In 2D image analysis, the angle between the x-axis and the major axis of the el-lipse that has the same second-moments as the region referred to as θ was used. It ranges from -90 degrees to +90 degrees. In 3D processing, Euler angles for the x- (ϕ), y- (θ) and z-axis (ψ), returned as a 1-by-3 vector were considered. These angles were calculated with Matlab based on the right-hand rule (Shoemake 1994; Lehmann and Legland 2012). Figure 8 shows the comparison be-tween the 2D- and 3D porosity according to the pyro-metamorphic degree (Park et al. 2019a; 2019b).
Additionally, curvatures of the pore space can describe local bending of the pore surface representing local sin-tering degree (Fig. 9) (Cohen-Steiner and Morvan 2003; Meyer et al. 2003). For example, one of the algorithms
FIGURE 7. Shape parameters for the pore topology. 1. Size distribution based on the maximum length of the grain; 2. Surface area and volume of pores; 3. Sphericity 1 calculated from max. and min. Feret diameter. Indicator of an elongated degree of the closed pore; 4. Sphericity 2 calculated from major and minor axis of the weight centered sphere of the grain of pores; 5. Orientation around y- (θ) and z-axis (ψ) of pores; 6. Euler charac-teristic for 2D and 3D. For 3D images reconstructed by the hexagonal voxel (digitalized 3D images), Euler-Poncaré Formula can be employed for this characteristic.

M E T H O D O L O G Y & A R C H A E O M E T R Y 0 6 • I N T E R N A T I O N A L S C I E N T I F I C C O N F E R E N C E • P R O C E E D I N G S 82
for the mean curvature operator using triangulation of the 3D object can be another parametrization of this sur-face was suggested by Meyer et al. (2003):
K(xi)= ∑j∈N1(i)(cotαij + cotβij)(xi - xj), K=1-3 (7)
Alignment and formation
Using the alignment of macropores and sand grains, the inner structure of bottom and wall fragments were in-vestigated. This does not focus on the finishing and dec-oration of the ceramics expressed at the surface. For the clearer and more compact visualization of the pores and grains, 26-connectivity is used for the segmentation. Fig-ure 10 shows an example of the pore alignment indicat-ing the separate formation of the bottom and wall part and flattening of the bottom plate (Park et al. 2019b).
FIGURE 8. Comparison of the pore topology between 2D (pixel size of 12 µm2, unit area of 3002 µm2 for the sample A,B,C) and 3D images (voxel size of 3.853 µm3 for A; 3.443 µm3 for B; 3.673 µm3 for C) of three samples varying in the degree of pyrometamorphic degree/sintering (estimated by Park et al. 2019a). Estimated firing temperature for A: 700-850 °C, B: 700-850 °C and C: 950-1050 °C. The segmented pores in the samples presented different colors according to the volume size (blue for the relatively small pores, green for the mid-small ones, red for the mid-big ones and yellow for the relatively big pores) become smaller and less interconnected from A to C. (Park et al. 2019b).
FIGURE 9. 1. Segmentation of an individual closed pore (red) in a ceramic object; 2. trimesh (various colors) of the segmented pore in 9.1; 3. normal vector (small red arrows) to each triangular surface (transparent blue) derived from 9.2 indicating a microscale force to each area.

P R O C E E D I N G S • I N T E R N A T I O N A L S C I E N T I F I C C O N F E R E N C E • M E T H O D O L O G Y & A R C H A E O M E T R Y 0 6 83
Using these segmented pore images, other examples of this study could identify various inner structures indicat-ing continuous construction from the bottom to the the wall part by pulling or double layers for the bottom part. The direction of the large pores present in these sam-ples was vertical or horizontal with relatively high de-viations. These traces would be caused by hand-shaping process. Sharp and shallow edges from the surface were identified in some samples, which can be interpreted as surface flattening by potters. Besides of these objects, other studies proved various shaping techniques such as pinching, slab-building, coiling, drawing, moulding and wheel-throwing can be identified (Carr 1990; Berg 2008).
If the grain size distribution or its standard deviation is small, it will be easier to identify the shaping method.
Conclusion
According to the rapid signs of progress in digital pro-cessing for microscopy and scanning techniques, re-search on the direct measurements of the structural ele-ments of archaeological ceramics is growing fast. As a consequence, this methodology is becoming more and more important in archaeology and archaeological sci-ences. Advanced parametrization of segmented objects can provide quantitative information for the various top-ics in archaeological ceramic studies. Despite heteroge-neous structural and mineralogical/chemical elements in archaeological ceramics, shape parameters and align-
ments of the sand grains and pores can provide possible tools contributing to classification of ceramics accord-ing to resource gathering, pyrotechnology and shap-ing techniques. The development history of sediments reflect the shape parameters of grains which can indi-cate the geological/geographical locations. Topological changes of pores in the ceramic matrix generally led by clay sintering will provide qualitative information about the firing degree of the samples. In the meanwhile, pore complex in macroscale is mainly caused by the human force during shaping. In the low fired ceramics, this pore complex still remains, so that the formation methods of the ceramics can be reconstructed.
Like the other analytical instruments, it is clear that the image analysis alone cannot solve the whole questions related to heterogeneous ceramics. However, if appro-priate scales of measurement areas, spatial resolutions, shape parameters and connectivity for the calculations are employed according to the purpose, the 2D- and 3D-image analysis will provide main or supporting evidence to distinguish the heterogeneous objects from each oth-er. Furthermore, it will contribute to the identification of technological styles in prehistoric material production.
Acknowledgement
This research was funded by the state of Berlin’s Elsa-Neumann scholarship (NaFöG).
FIGURE 10. Alignment of the large pore complex (blue) of the ceramic object (Ran1_601_7; transparent grey) discovered at Ransyrt 1. Region of inter-est (ROI) in the box of the white dashed line. The large pores are concentrated in the wall and the bottom part, seperately and there is no clear pore complex connecting both parts. This example shows a separate formation of the bottom and wall part (wall on the bottom) and oriented parallel pressure/stress from the surface. (Park et al. 2019b, modified).

M E T H O D O L O G Y & A R C H A E O M E T R Y 0 6 • I N T E R N A T I O N A L S C I E N T I F I C C O N F E R E N C E • P R O C E E D I N G S 84
References
Barrett, P. J. 1980. The shape of rock particles: a critical review, Sedimentology 27 (3), 291-303.Bauer, B., Cai, X., Peth, S., Schladitz, K. and Steidl, G. 2017. Variational-based segmentation of bio-pores in tomo-graphic images, Computers & Geosciences 98, 1-8.Berg, I. 2008. Looking through pots: recent advances in ceramic X-radiography, Journal of Archaeological Science 35, 1177-1188.Brun, F., Mancini, L., Kasae, P., Favretto, S., Dreossia, D. and Tromba, G. 2010. Pore3D: A software library for quan-titative analysis of porous media, Nuclear Instruments and Methods in Physics Research Section A 615 (3), 326-332.Carr, C. 1990. Advances in Ceramic Radiography and Anal-ysis: Applications and Potentials, Journal of Archaeological Science 17, 13-34.Cnudde, V., and Boone, M. B. 2013. High-resolution X-ray computed tomography in geosciences: A review of the current technology and applications, Earth-Science Re-views 123, 1-17.Coble, R. L. 1961. Sintering crystalline solids. I. Interme-diate and final state diffusion models, Journal of Applied Physics 32, 787-792. Cohen-Steiner, D. and Morvan, J. M. 2003. Restrict-ed Delaunay triangulation and normal cycle, Sym-posium on Computational Geometry, 312-321. (DOI:10.1145/777792.777839)Courty, M. A. and Roux, V. 1995. Identification of Wheel Throwing on the basis of Ceramic Surface Features and Microfabrics, Journal of Archaeological Science 22, 17-50.De Jonghe, L. C. and Rahaman, M. N. 2003. Sintering of Ceramics, in: S. Sōmiya (ed.), Handbook of Advanced Ce-ramics: Materials, Applications, Processing and Properties 1-2, Elsevier Inc., Waltham, Oxford, Amsterdam, 187-264. (https://doi.org/10.1016/B978-012654640-8/50006-7) Dierick, M., Cnudde, V., Masschaele, B., Vlassenbroeck, J., van Hoorebeke, L. and Jacobs, P. 2007. Micro-CT of fossils preserved in amber, Nuclear Instruments and Methods in Physics Research Section A 580 (1), 641-643.Ferrer, S., Mezquita, A., Gomez-Tena, M. P., Machi, C. and Monfort, E. 2015. Estimation of the heat of reaction in tra-ditional ceramic compositions, Applied Clay Science 108, 28-39.Kahl, W. A. and Ramminger, B. 2012. Non-destructive fab-ric analysis of prehistoric pottery using high-resolution X-ray microtomography: a pilot study on the late Mseolithic to Neolithic site Hamburg-Boberg, Journal of Archaeologi-cal Science 39, 2206-2219.
Ketcham, R. A. and Carlson, W. D. 2001. Acquisition, op-timization and interpretation of X-ray computed tomo-graphic imagery: applications to the geosciences, Comput-ers & Geosciences 27, 381-400.Krumbein, W. C. 1941. The effects of abrasion on the size, shape, and roundness of rock fragments, The Journal of Geology 49 (5), 482-520.Legland, D., Kiêu, K. and Devaux, M. F. 2007. Computation of Minkowski measures on 2D and 3D binary images, Im-age Analysis & Stereology 26, 83-92.Lehmann, G. and Legland, D. 2012. Efficient N-Dimension-al surface estimation using Crofton formula and run-length encoding, Insight Journal January-December. (https://hdl.handle.net/10380/3342)Lindahl, A. and Pikirary, I. 2010. Ceramics and change: an overview of pottery production techniques in northern South Africa and eastern Zimbabwe during the first and second millennium AD, Archaeological and Anthropologi-cal Sciences 2, 133-149.Meyer, M., Desbrun, M., Schröder, P. and Barr, A. H. 2003. Discrete Differential-Geometry Operators for Triangu-lated 2-Manifolds, In: H. C. Hege and K. Polthier (eds.), Visualization and Mathematics III. Mathematics and Visualization, Springer, Berlin, Heidelberg. (https://doi.org/10.1007/978-3-662-05105-4_2)Okuma, G., Kadowaki, D., Hondo, T., Tanaka, S. and Wakai, F. 2017. Interface topology for distinguishing stag-es of sintering, Scientific Reports 7:11106. (https://doi.org/10.1038/s41598-017-11667-2)Park, K. S., Milke, R., Efthimiopoulos, I., Pausewein, R. R. and Reinhold, S. 2019a. Pyrometamorphic process of ce-ramic composite materials in the pottery production in the Bronze/Iron Age of the Northern Caucasus, Scientific Reports 9: 10725. (https://doi.org/10.1038/s41598-019-47228-y).Park, K. S., Milke, R., Rybacki, E. and Reinhold, S. 2019b. Application of image analysis for the identification of pre-historic ceramic production technologies in the North Caucasus (Russia, Bronze/Iron Age), Heritage 2, 2327-2342. (https://doi.org/10.3390/heritage2030143).Reinhold, S., Korobov, D. S. and Belinskij, A. B. 2018. Land-schaftsarchäologie im Nordkaukasus, Habelt. R., Bonn.Roux, V. and Courty, M. A. 1998. Identification of Wheel-fashining Methods: Technological Analysis of 4th- 3rd Mil-lennium BC Oriental Ceramics, Journal of Archaeological Science 25, 747-763.Selden, P. A. and Penney, D. 2017. Imaging techniques in the study of fossil spiders, Earth-Sci. Rev. 166, 111-131.

P R O C E E D I N G S • I N T E R N A T I O N A L S C I E N T I F I C C O N F E R E N C E • M E T H O D O L O G Y & A R C H A E O M E T R Y 0 6 85
Shoemake, K. 1994. III.5. - Euler Angle Conversion, In: P. S. Heckbert (ed.), Graphics Gems IV, Elsevier Inc., London, 222-229. (https://doi.org/10.1016/B978-0-12-336156-1.50030-6)Sobott, R., Bente, K. and Kittel, M. 2014. Comparative po-rosity measurements on ceramic materials, The Old Pot-ter’s Almanack 19 (1), 18-25. (https://doi.org/10.11588/opa.2014.1.14853) Vogel, H. J. 1997. Morphological determination of pore connectivity as a function of pore size using serial sec-tions, European Journal of Soil Science 48, 365-377.Vogel, H. J. and Roth, K. 2001. Quantitative morphology and network representation of soil pore structure, Ad-vances in Water Resources 24, 233-242.Vogel, H. J., Weller, U. and Schlüter, S. 2010. Quantification of soil structure based on Minkowski functions, Comput-ers & Geosciences 36, 1236-1245.
Voltolini, M., Zandomeneghi, D., Mancini, L. and Polacci, M. 2011. Texture analysis of volcanic rock samples: Quan-titative study of crystals and vesicles shape preferred ori-entation from X-ray microtomography data, Journal of Vol-canology and Geothermal Research 202 (1-2), 83-95.Wadell, H. 1932. Volume, shape, and roundness of quartz particles, The Journal of Geology 43 (3), 250-280.Yin, X. Z., Wu, L., Li, Y., Guo, T., Li, H. Y., Xiao, T. Q., York, P., Nangia, A., Gui, S. Y. and Zhang, J. W. 2016. Visualization and quantification of deformation behavior of clopidogrel bisulfate polymorphs during tableting, Scientific Reports 6: 21770. (https://doi.org/10.1038/srep21770)