image processing with - biop -homepagebiop.epfl.ch/pdf/image processing with imagej.pdf3. binary...
TRANSCRIPT

Biology Imaging
Image Processing withImageJ
Biology Imaging
Outlines1.
Spatial filters
background correctionimage denoisingedges detection
2.
Fourier domain filteringcorrection of periodic artefacts
3.
Binary operationsmasksmorphological operators
5.
ImageJ pluginsplugins installationsome examples
4.
Particles analysis
Biology Imaging
ImageJ -
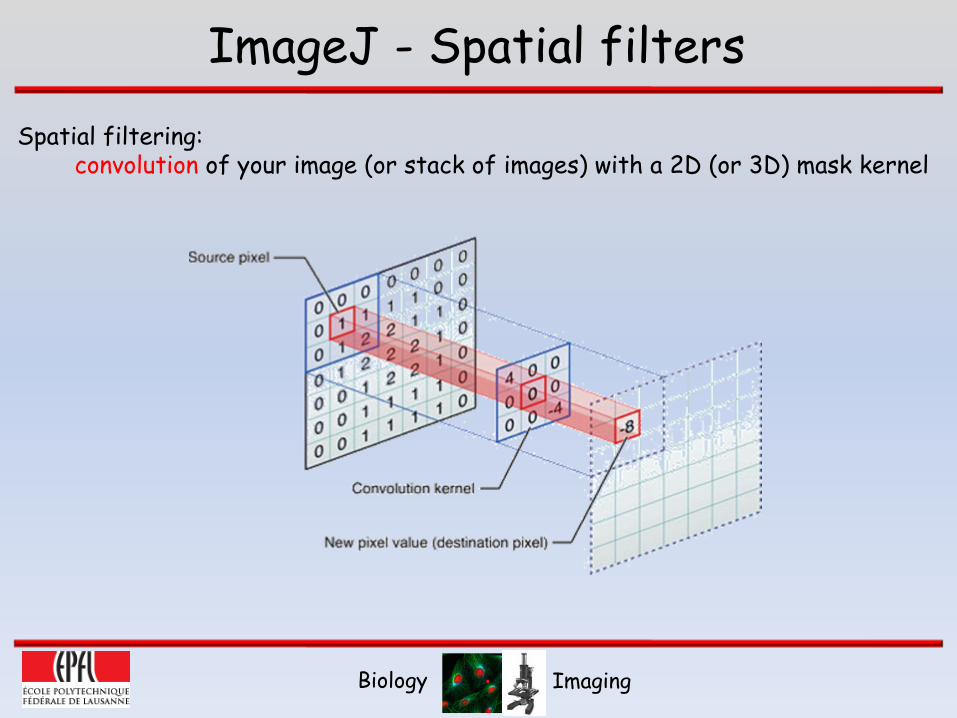
Spatial filtersSpatial filtering:
convolution
of your image (or stack of images) with a 2D (or 3D) mask kernel
Biology Imaging
ImageJ -
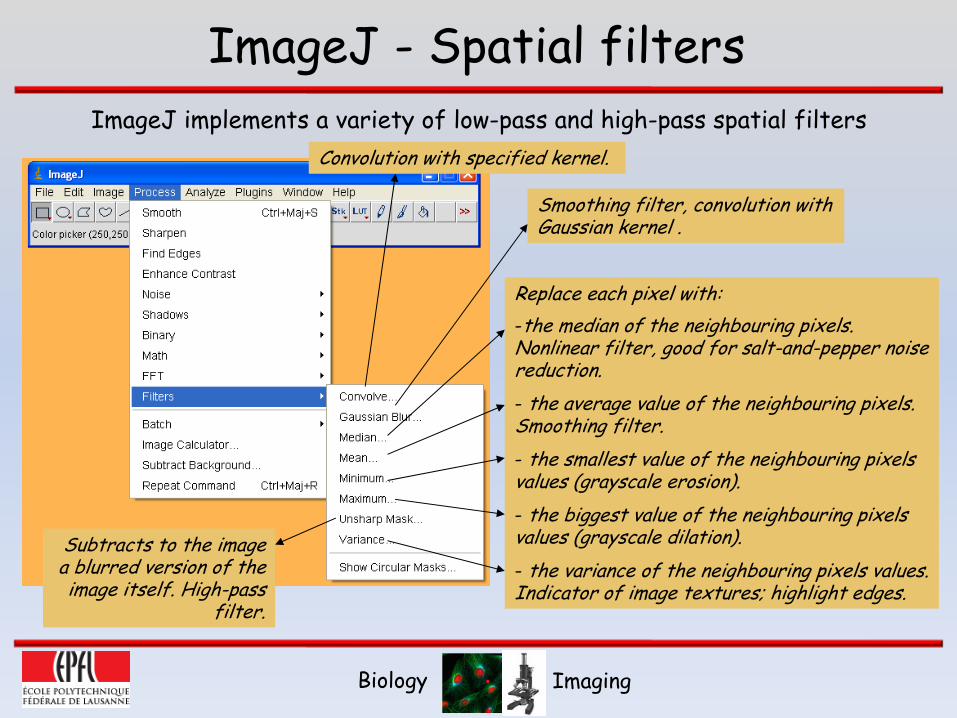
Spatial filtersImageJ implements a variety of low-pass and high-pass spatial filters
Smoothing filter, convolution with Gaussian kernel .
-the median of the neighbouring pixels. Nonlinear filter, good for salt-and-pepper noise reduction.-
the average value of the neighbouring pixels. Smoothing filter.-
the smallest value of the neighbouring pixels values (grayscale erosion).-
the biggest value of the neighbouring pixels values (grayscale dilation).-
the variance of the neighbouring pixels values. Indicator of image textures; highlight edges.
Replace each pixel with:
Convolution with specified kernel.
Subtracts to the image a blurred version of the image itself. High-pass
filter.
Biology Imaging
ImageJ -
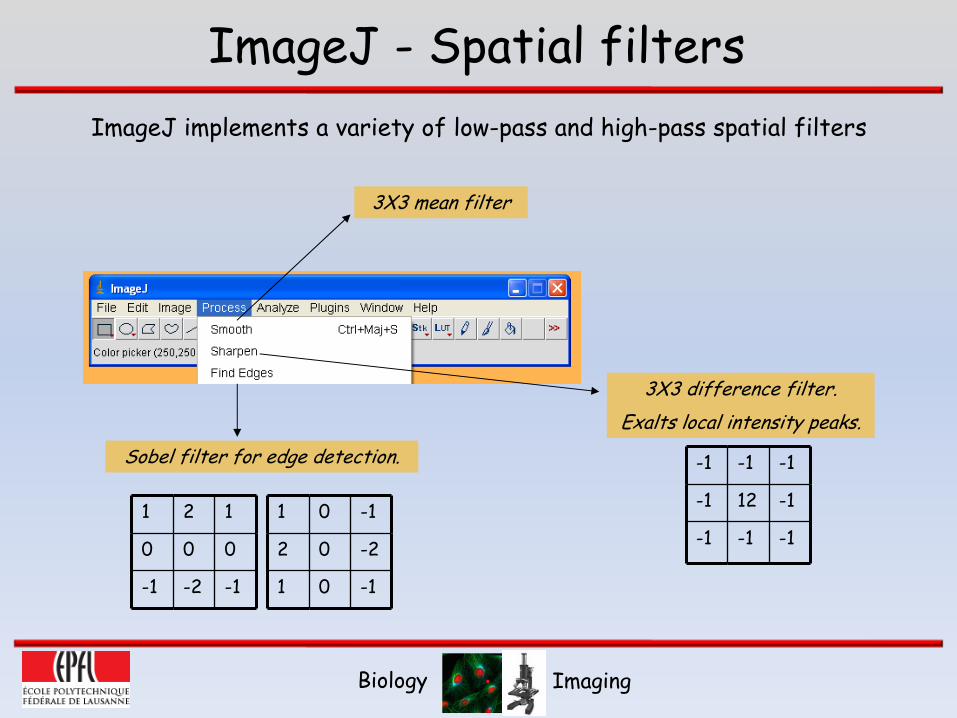
Spatial filtersImageJ implements a variety of low-pass and high-pass spatial filters
-1 -1 -1
-1 12 -1
-1 -1 -11 2 1
0 0 0
-1 -2 -1
1 0 -1
2 0 -2
1 0 -1
3X3 difference filter. Exalts local intensity peaks.
Sobel filter for edge detection.
3X3 mean filter
Biology Imaging
ImageJ -
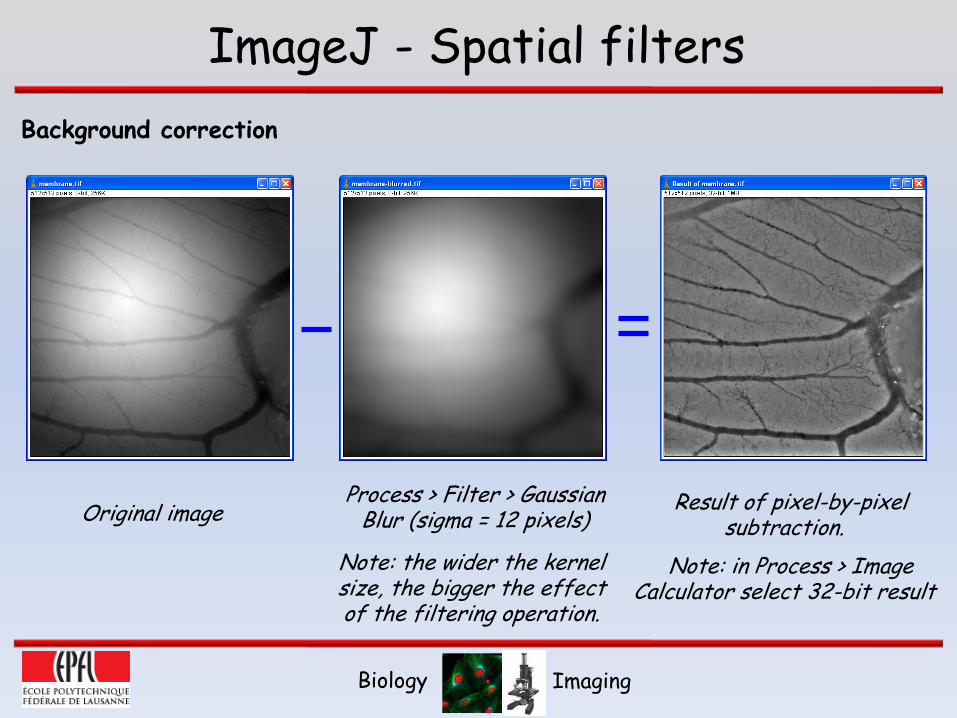
Spatial filtersBackground correction
Original imageProcess > Filter > Gaussian
Blur (sigma = 12 pixels)Result of pixel-by-pixel
subtraction.Note: in Process > Image
Calculator select 32-bit resultNote: the wider the kernel size, the bigger the effect of the filtering operation.
Biology Imaging
ImageJ -
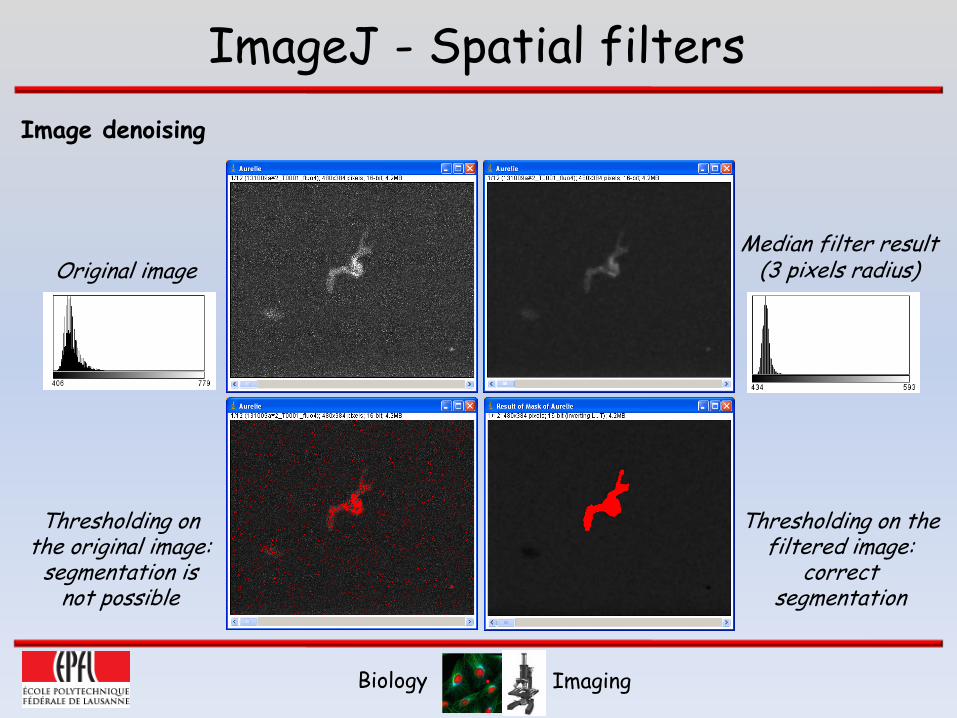
Spatial filtersImage denoising
Original image
Thresholding on the original image:
segmentation is not possible
Median filter result (3 pixels radius)
Thresholding on the filtered image:
correct segmentation
Biology Imaging
ImageJ -
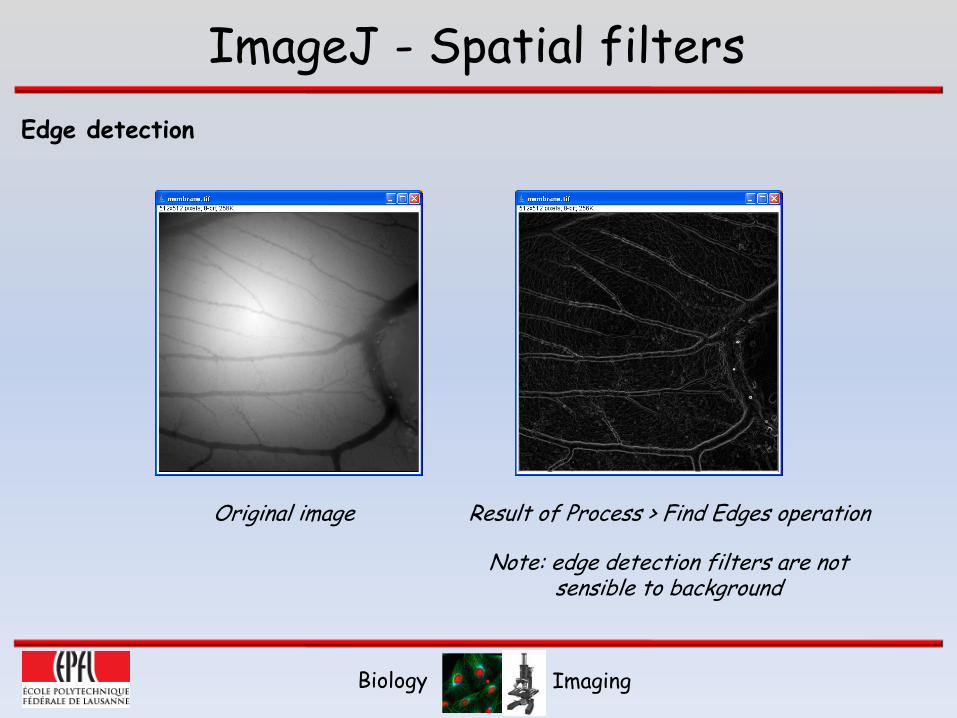
Spatial filtersEdge detection
Original image Result of Process > Find Edges operation
Note: edge detection filters are not sensible to background
Biology Imaging
ImageJ –
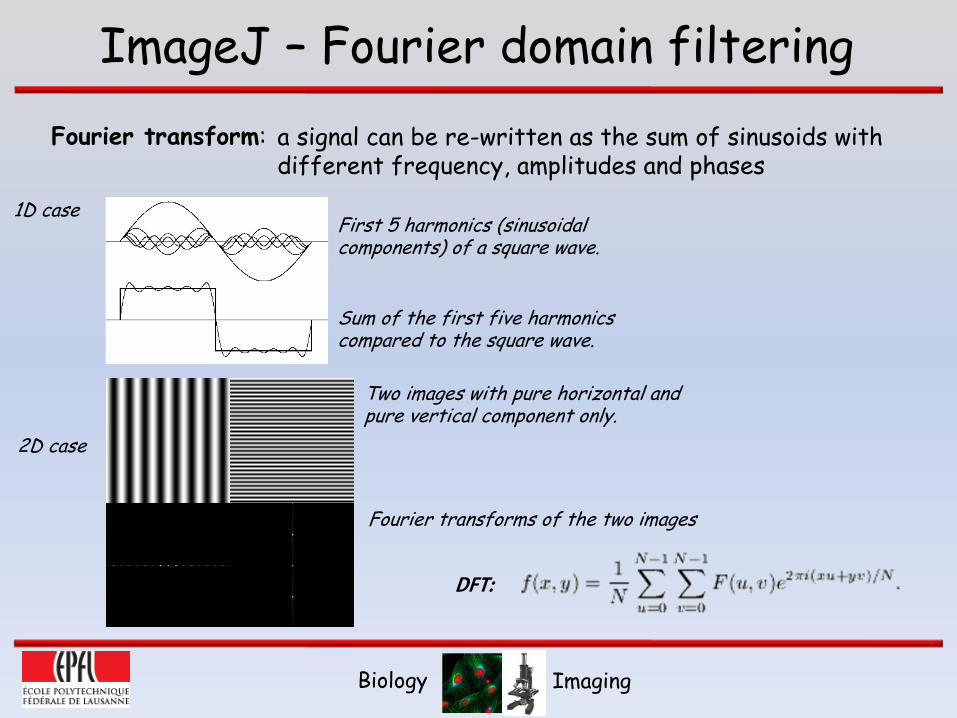
Fourier domain filteringFourier transform: a signal can be re-written as the sum of sinusoids with
different frequency, amplitudes and phases
First 5 harmonics (sinusoidal components) of a square wave.
Sum of the first five harmonics compared to the square wave.
Two images with pure horizontal and pure vertical component only.
Fourier transforms of the two images
1D case
2D case
DFT:
Biology Imaging
ImageJ –
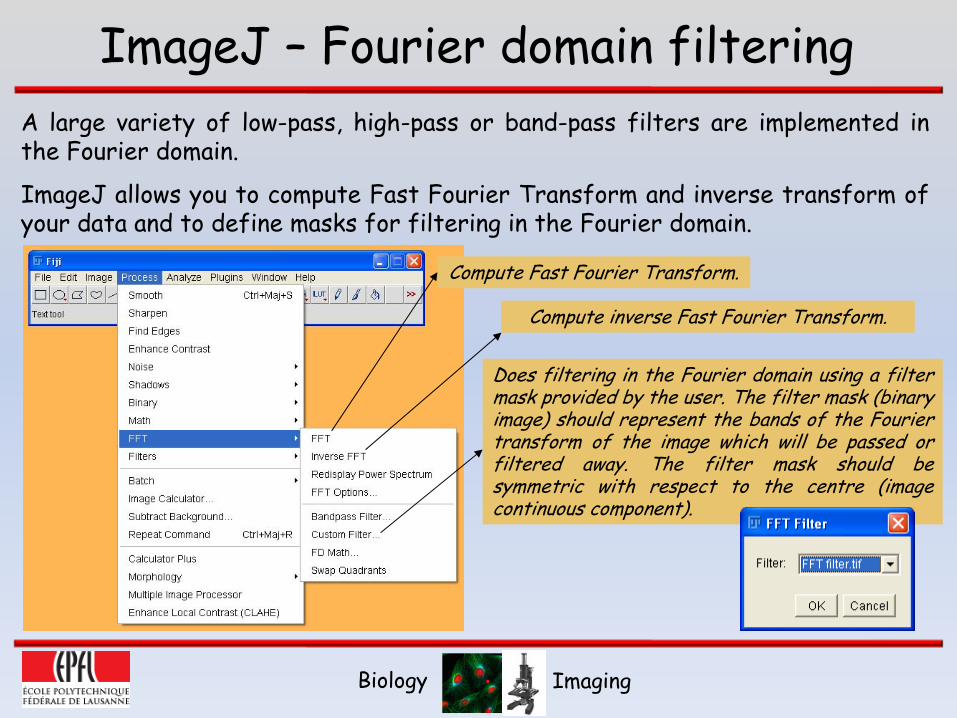
Fourier domain filteringA large variety of low-pass, high-pass or band-pass filters are implemented in the Fourier domain.
ImageJ allows you to compute Fast Fourier Transform and inverse transform of your data and to define masks for filtering in the Fourier domain.
Compute Fast Fourier Transform.
Compute inverse Fast Fourier Transform.
Does filtering in the Fourier domain using a filter mask provided by the user. The filter mask (binary image) should represent the bands of the Fourier transform of the image which will be passed or filtered away. The filter mask should be
symmetric with respect to the centre (image
continuous component).
Biology Imaging
ImageJ –
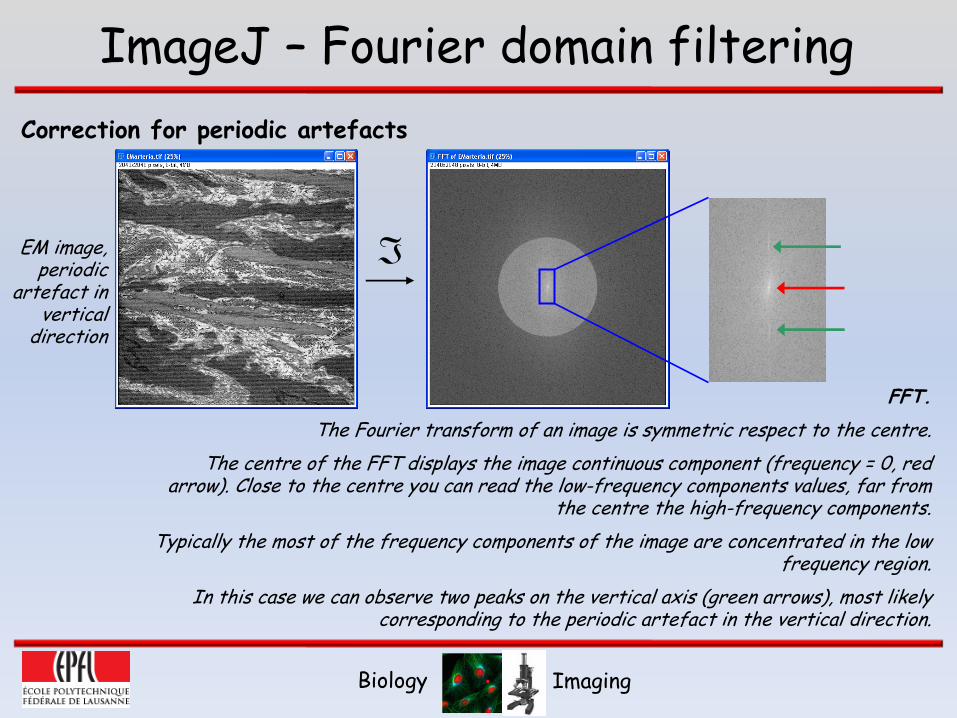
Fourier domain filteringCorrection for periodic artefacts
EM image, periodic
artefact in vertical
direction
FFT. The Fourier transform of an image is symmetric respect to the centre.
The centre of the FFT displays the image continuous component (frequency = 0, red arrow). Close to the centre you can read the low-frequency components values, far from
the centre the high-frequency components.Typically the most of the frequency components of the image are concentrated in the low
frequency region.In this case we can observe two peaks on the vertical axis (green arrows), most likely
corresponding to the periodic artefact in the vertical direction.
ℑ
Biology Imaging
ImageJ –
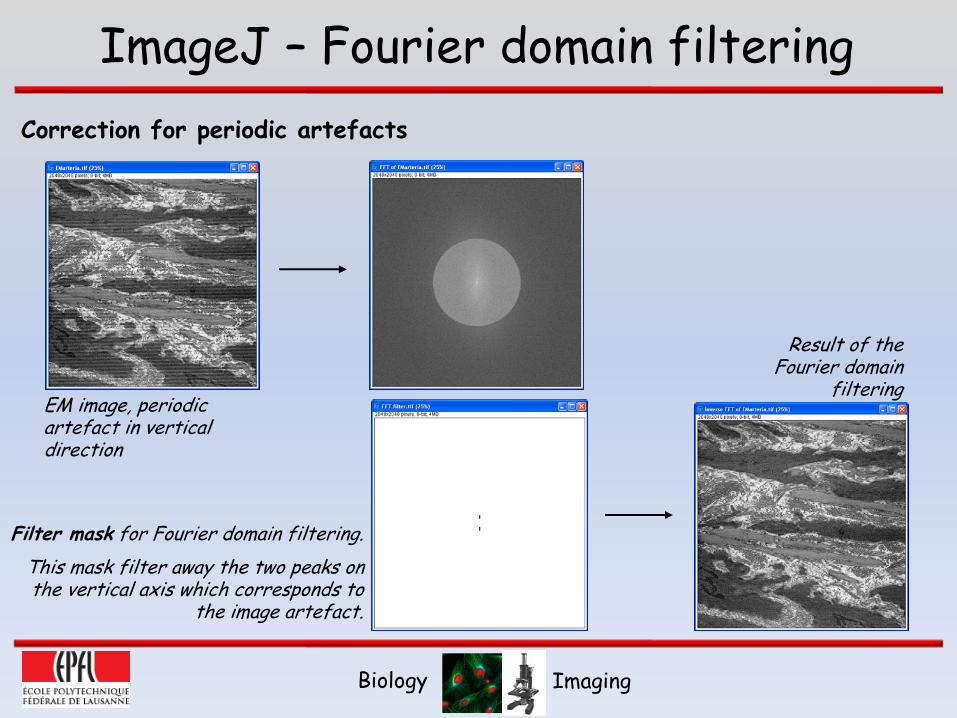
Fourier domain filteringCorrection for periodic artefacts
EM image, periodic artefact in vertical direction
Filter mask for Fourier domain filtering.This mask filter away the two peaks on
the vertical axis which corresponds to
the image artefact.
Result of the Fourier domain
filtering
Biology Imaging
ImageJ –
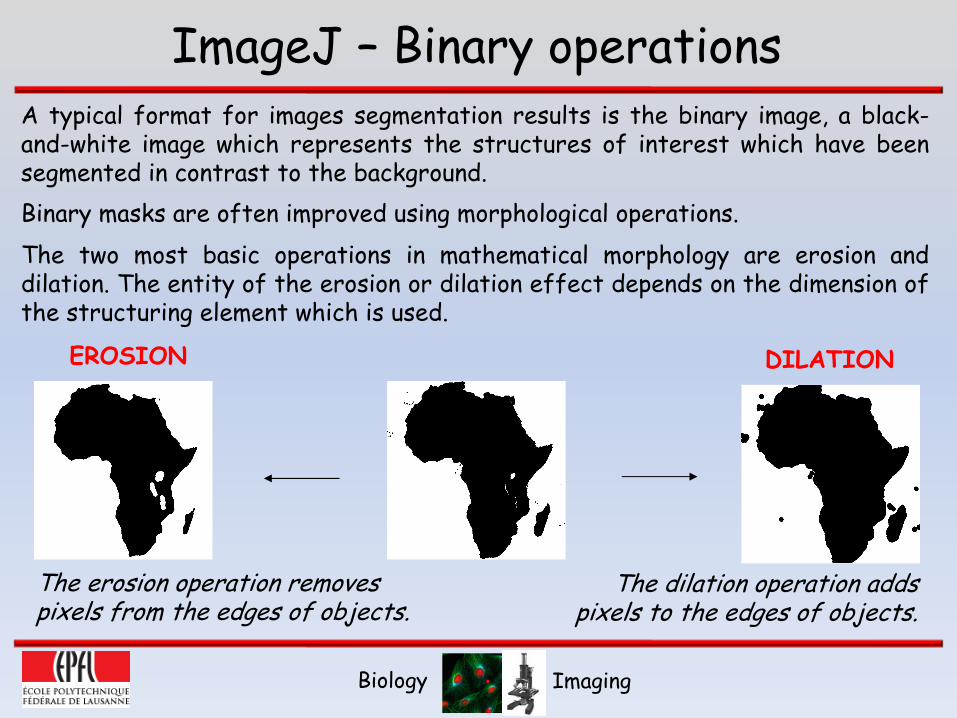
Binary operationsA typical format for images segmentation results is the binary image, a black-
and-white image which represents the structures of interest which have been segmented in contrast to the background. Binary masks are often improved using morphological operations. The two most basic operations in mathematical morphology are erosion and dilation. The entity of the erosion or dilation effect depends on the dimension of the structuring element which is used.
EROSION DILATION
The erosion operation removes pixels from the edges of objects.
The dilation operation adds pixels to the edges of objects.
Biology Imaging
ImageJ –
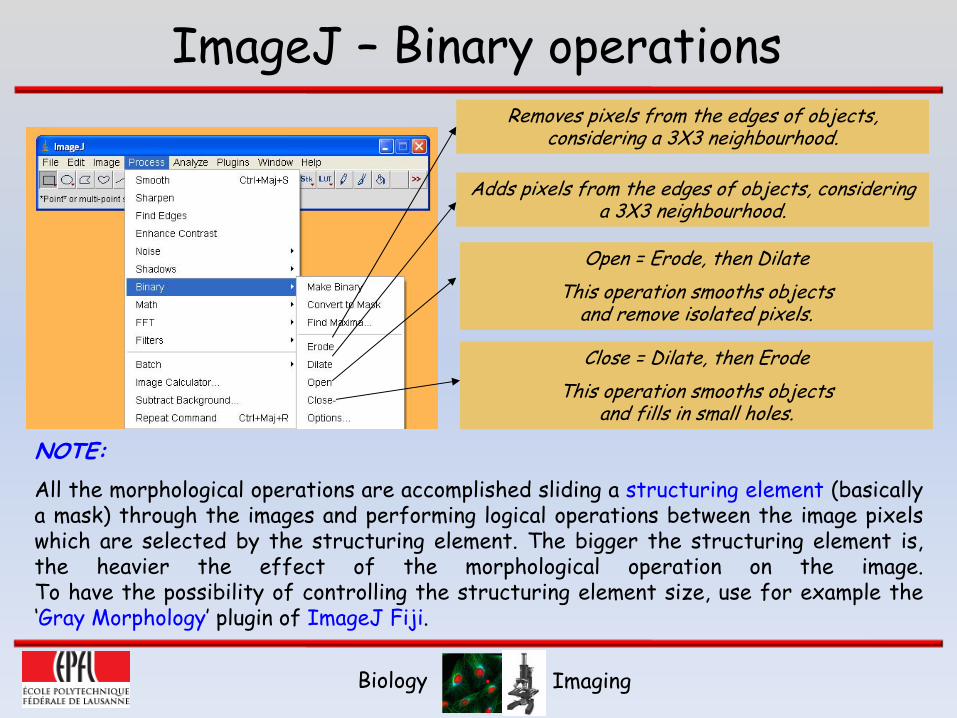
Binary operationsRemoves pixels from the edges of objects,
considering a 3X3 neighbourhood.
Adds pixels from the edges of objects, considering a 3X3 neighbourhood.
Open = Erode, then DilateThis operation smooths objects
and remove isolated pixels.
Close = Dilate, then ErodeThis operation smooths objects
and fills in small holes.
NOTE:All the morphological operations are accomplished sliding a structuring element
(basically a mask) through the images and performing logical operations between the image pixels which are selected by the structuring element. The bigger the structuring element is, the heavier the effect of the morphological operation on the image. To have the possibility of controlling the structuring element size, use for example the ‘Gray Morphology’ plugin of ImageJ Fiji.
Biology Imaging
ImageJ –
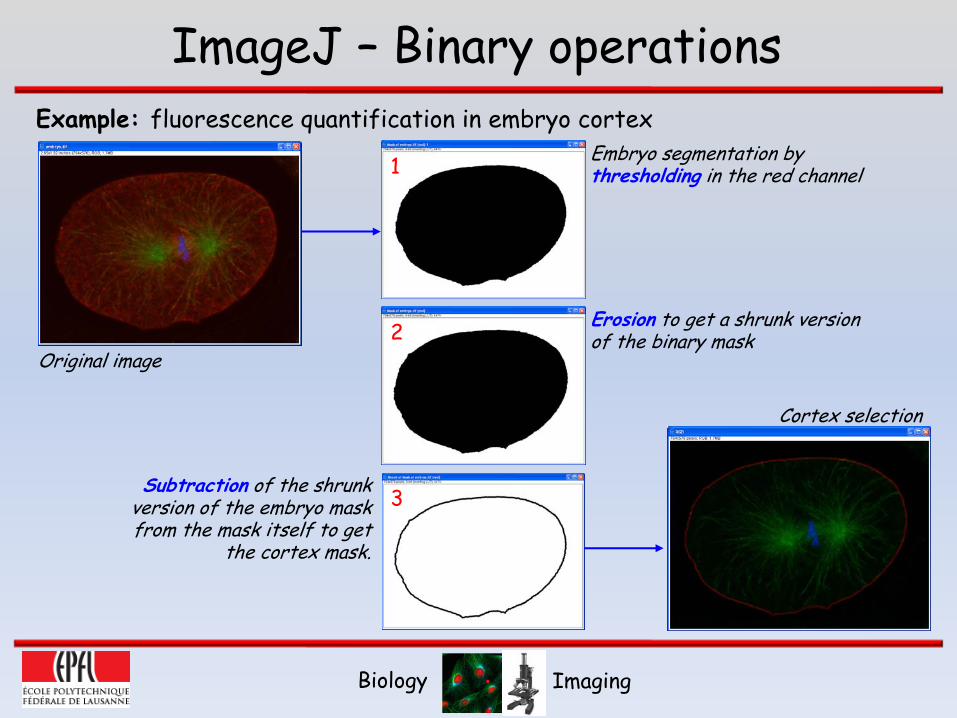
Binary operationsExample: fluorescence quantification in embryo cortex
Original image
Embryo segmentation by thresholding in the red channel
Erosion to get a shrunk version of the binary mask
Subtraction of the shrunk version of the embryo mask from the mask itself to get
the cortex mask.
1
2
3
Cortex selection

Biology Imaging
ImageJ –
Binary operationsExample: cells segmentation using watershed
transformation
Original image,
DAPI staining.
Nuclei segmentation through image thresholding. It is not possible to separate touching nuclei!
Watershed on the thresholded image. The watershed transformation allows to separate touching objects.
Biology Imaging
ImageJ –
Binary operations
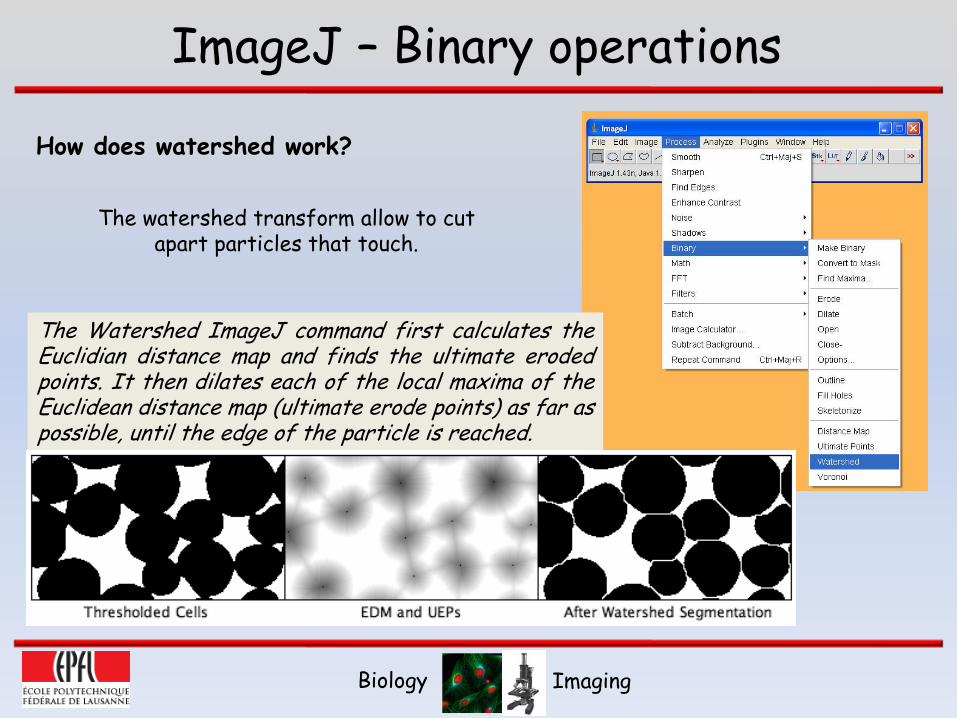
How does watershed work?
The watershed transform allow to cut apart particles that touch.
The Watershed ImageJ command first calculates the Euclidian distance map and finds the ultimate eroded
points. It then dilates each of the local maxima of the Euclidean distance map (ultimate erode points) as far as possible, until the edge of the particle is reached.
Biology Imaging
ImageJ –
Particles
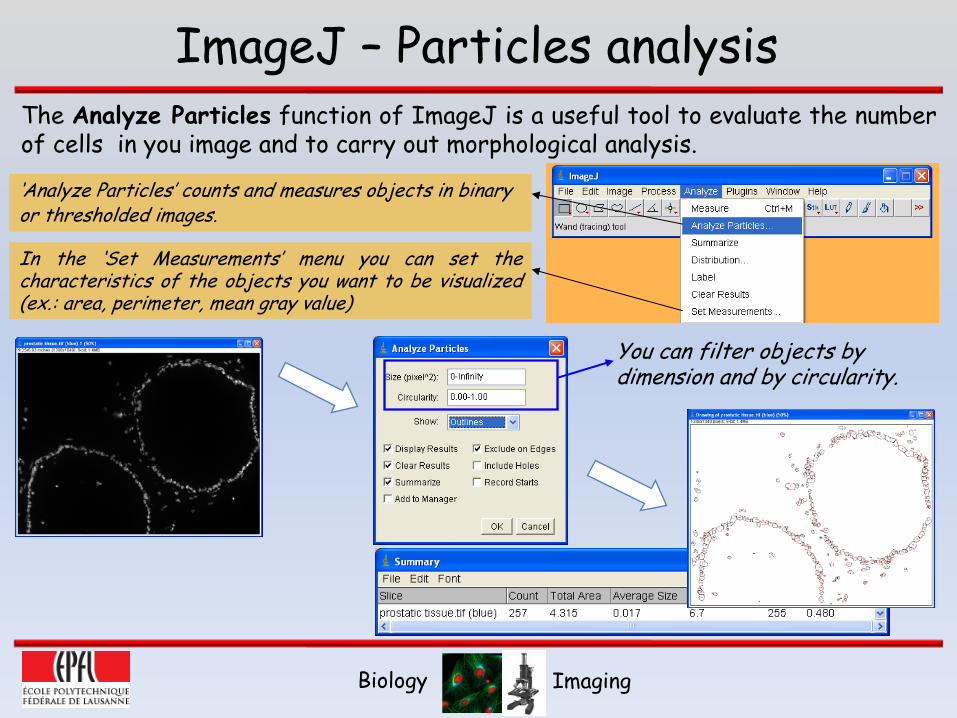
analysisThe Analyze Particles
function of ImageJ is a useful tool to evaluate the number
of cells in you image and to carry out morphological analysis.
‘Analyze Particles’ counts and measures objects in binary or thresholded images.
In the ‘Set Measurements’
menu you can set the characteristics of the objects you want to be visualized (ex.: area, perimeter, mean gray value)
You can filter objects by dimension and by circularity.

Biology Imaging
ImageJ –
PluginsThe functionalities of ImageJ can be extended by writing additional programs in Java language
(the so-called plugins).
A wide collection of ImageJ plugins
is available on the web.
You can easily find out solutions for general or really specific image processing problems.
Installation
Download the .jar or .class file in the ImageJ/plugins folder (note that by default ImageJ is installed in the Program Files folder).
Then start ImageJ: you will find the new plugin command under the Plugins menu.
http://rsbweb.nih.gov/ij/plugins/
Biology Imaging
ImageJ –
PluginsSome examples
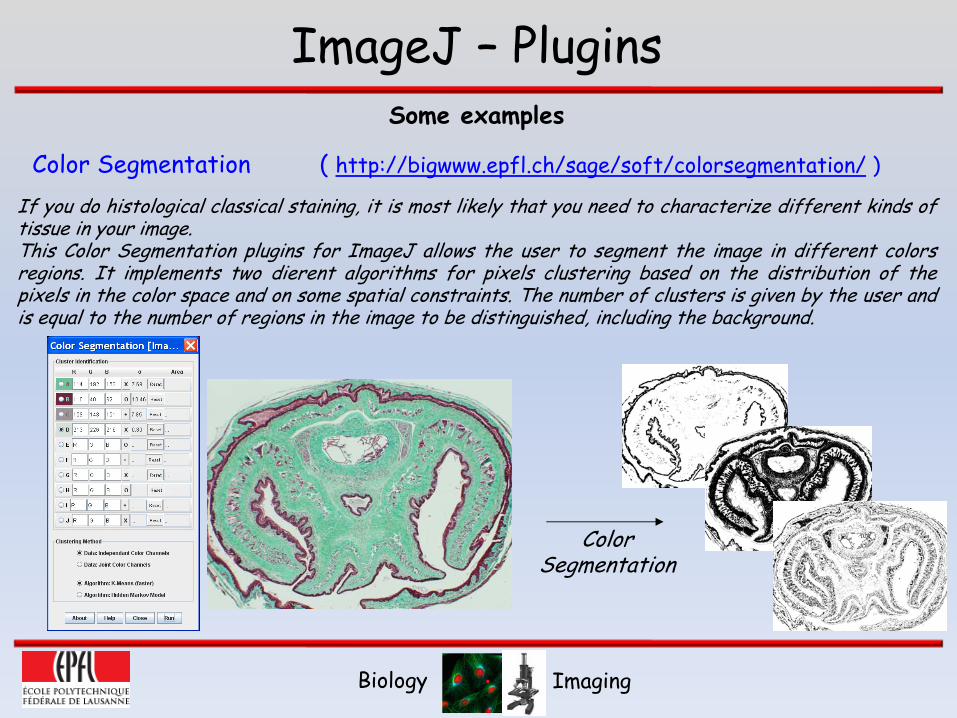
Color Segmentation
( http://bigwww.epfl.ch/sage/soft/colorsegmentation/
)
If you do histological classical staining, it is most likely that you need to characterize different kinds of tissue in your image.This Color Segmentation plugins for ImageJ allows the user to segment the image in different colors
regions. It implements two dierent algorithms for pixels clustering based on the distribution of the pixels in the color space and on some spatial constraints. The number of clusters is given by the user and is equal to the number of regions in the image to be distinguished, including the background.
Color Segmentation
Biology Imaging
ImageJ –
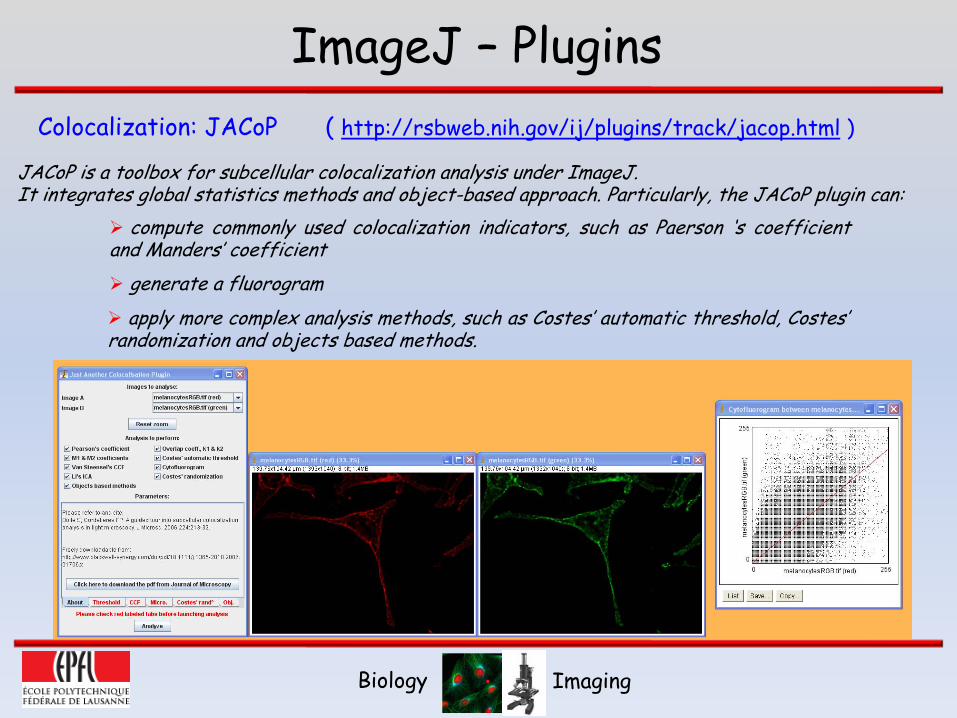
PluginsColocalization: JACoP
(
http://rsbweb.nih.gov/ij/plugins/track/jacop.html
)
JACoP is a toolbox for subcellular colocalization analysis under ImageJ. It integrates global statistics methods and object-based approach. Particularly, the JACoP plugin can:
compute commonly used colocalization indicators, such as Paerson ‘s coefficient and Manders’ coefficient
generate a fluorogramapply more complex analysis methods, such as Costes’ automatic threshold, Costes’
randomization and objects based methods.
Biology Imaging
ImageJ –
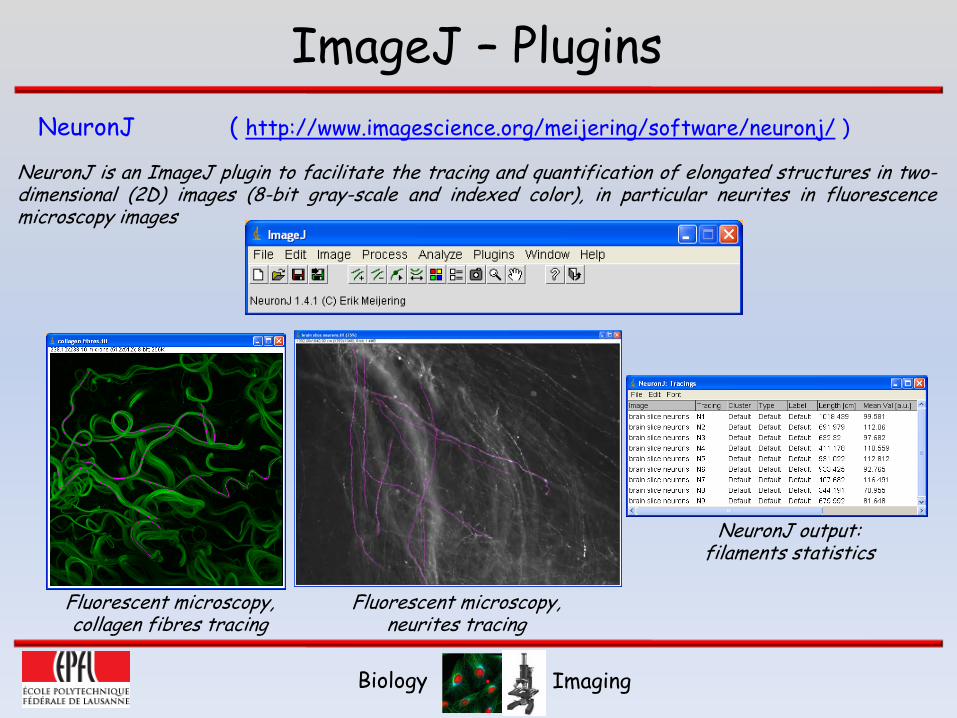
PluginsNeuronJ
( http://www.imagescience.org/meijering/software/neuronj/
)
NeuronJ is an ImageJ plugin to facilitate the tracing and quantification of elongated structures in two-
dimensional (2D) images (8-bit gray-scale and indexed color), in particular neurites in fluorescence
microscopy images
Fluorescent microscopy, collagen fibres tracing
Fluorescent microscopy, neurites tracing
NeuronJ output: filaments statistics