images: nrg the potential role of flexible ccs in deep. final_jenkins_2019-07-30 - arpa-e... · 11...
TRANSCRIPT

The potential role of flexible CCS in deep decarbonization of the electricity sector
Jesse D. Jenkins Assistant Professor, Princeton University | Department of Mechanical & Aerospace Engineering and the Andlinger Center for Energy and Environment“Flexible Carbon Capture Technologies for a Renewable-Heavy Grid,” ARPA-E Workshop| July 30, 2019
Images: NRG

2
Electricity: the Linchpin
0
2,000
4,000
6,000
8,000
10,000
2020 2030 2040 2050
Natural gas Coal Oil & other fossil Existing zero CO2
Data source: Iyer et al. 2017, GGCAM USA Analysis of U.S. Electric Power Sector Transitions (performed for the United States Mid-Century Strategy for Deep Decarbonization), Pacific Northwest National Laboratory; 2020 zero-carbon electricity supply from EIA Annual Energy Outlook 2019.
Tera
wat
t-h
ours
TWIN CHALLENGES: ZERO CARBON, DOUBLE DEMAND
+120%
+80%
+50%
2
Electrification Scenarios

0
1,000
2,000
3,000
4,000
5,000
6,000
7,000
8,000
2020 2025 2030 2035 2040 2045 2050
Low Mid High
3
Electricity: the Linchpin
Data source: Difference between projected electricity demand in Iyer et al. 2017 and 2020 zero-carbon electricity supply from EIA Annual Energy Outlook 2019. Assumes all 2020 generation can be sustained through 2050. Retirements of existing capacity would increase new zero-carbon generation needed.
Tera
wat
t-h
ours
THE RAPID SWITCH: NEW ZERO CARBON ELECTRICITY NEEDED
+30 avg GW/yr
+23 avg GW/yr
+18 avg GW/yrTotal 2020 U.S. electricity generation
Electrification Scenarios
3
Clean energy additions

Electricity: the Linchpin
Data source: Historical per capita deployment rates from MIT 2018, The Future of Nuclear in a Carbon Constrained World, scaled to based on projected 2035 U.S. population of 364 million from U.S. Census Bureau.
Ave
rage
GW
ad
dit
ion
s p
er y
ear
HISTORICAL PRECEDENTS (SCALED TO U.S. POPULATION)
4
Sweden, Nuclear 1974-1983
U.S. Deep Decarb. - High
France, Nuclear 1979-1988U.S. Deep Decarb -
MidU.S., Natural Gas
2001-2010
U.S. Deep Decarb - Low
China, Coal 2005-2014
U.S., Nuclear 1981-1990
0
5
10
15
20
25
30
35

55
http://bit.ly/FirmLowCarbon

“Fast burst”
balancing resources
“Firm” low-carbon resources
“Fuel saving” variable
renewables
6“Flexible base” “Firm cyclers”
Long-duration

“Firm”
“Fuel Saving”
“FastBurst”
CO2 emissions limit (g/kWh)
Data source: Sepulveda, N., Jenkins, J.D., et al. (2018), “The role of firm low-carbon resources in deep decarbonization of electric power systems,” Joule 2(11).
“Fuel Saving”
“FastBurst”
Ave
rage c
ost of ele
ctr
icity (
$/M
Wh)
7
050100150200 050100150200
Wind, solar, battery costs
LowMid-rangeConservative
Northern System

“Firm”
“Fuel Saving”
“FastBurst”
CO2 emissions limit (g/kWh)
Data source: Sepulveda, N., Jenkins, J.D., et al. (2018), “The role of firm low-carbon resources in deep decarbonization of electric power systems,” Joule 2(11).
“Fuel Saving”
“FastBurst”
Ave
rage c
ost of ele
ctr
icity (
$/M
Wh)
8
Wind, solar, battery costs
LowMid-rangeConservative
Southern System
050100150200 050100150200

NATURAL GAS WITH CCS MAY PLAY SIGNIFICANT ROLE
No CCS, Costly Nuclear NGCC+PCC (90%), Mid Nuclear Allam Cycle (100%), Low Nuclear
9
Ener
gy s
har
e [%
]

NATURAL GAS WITH CCS IS OPERATED FLEXIBLY
No CCS, Costly Nuclear NGCC+PCC (90%), Mid Nuclear Allam Cycle (100%), Low Nuclear
10
Ener
gy s
har
e [%
]
Mid
-ran
ge V
RE
an
d st
ora
geV
ery
low
VR
E a
nd
sto
rage

AN EXAMPLE OF FLEXIBLE CCS IN A ZERO CARBON ELECTRICITY SYSTEM
11
17
4
0.2
38
14
34
0
5
10
15
20
25
30
35
40
45
Natural gasw/CCS
Biogas CT Wind Solar Batterystorage
Peakdemand
Installed Capacity (GW)
Natural gas
w/CCS54%
Wind
0%
Solar
45%
Biogas CT
1%
Annual Generation (%)
Detailed case results for Northern system, very low cost scenario for all resources

ANNUAL GENERATION DURATION CURVE
Average Fleet-wide NG+CCS Capacity Factor: 66%
12Hours
0 8760
0%
20%
40%
60%
80%
100%
Pe
rce
nt
of
inst
alle
d c
apa
city

UNIT COMMITMENT DISTRIBUTION
13
Average Fleet-wide NG+CCS Commitment Factor: 80%
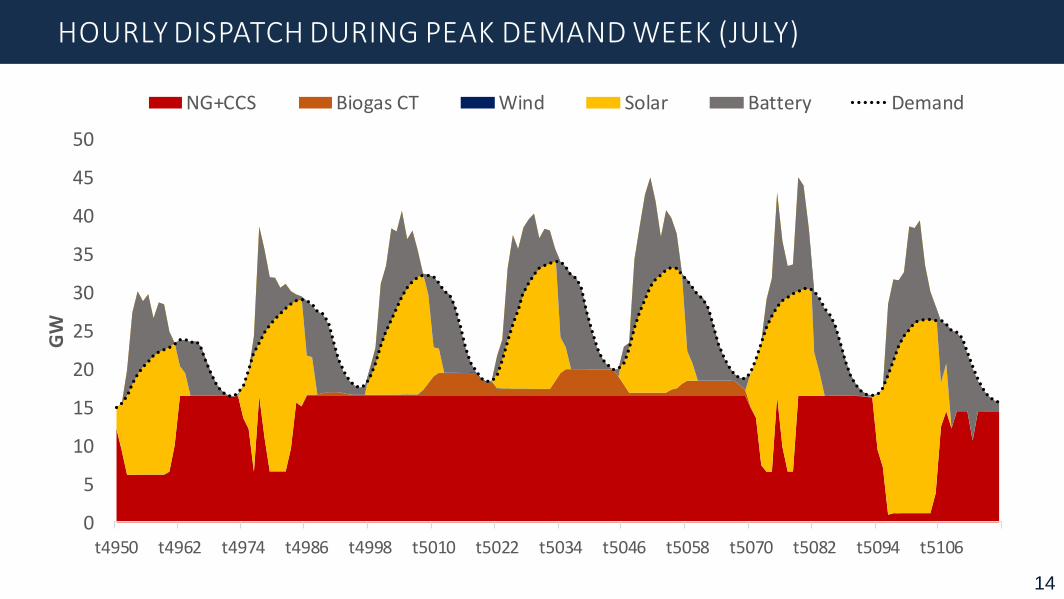
HOURLY DISPATCH DURING PEAK DEMAND WEEK (JULY)
14
0
5
10
15
20
25
30
35
40
45
50
t4950 t4962 t4974 t4986 t4998 t5010 t5022 t5034 t5046 t5058 t5070 t5082 t5094 t5106
GW
NG+CCS Biogas CT Wind Solar Battery Demand
AN EXAMPLE OF FLEXIBLE CCS IN A ZERO CARBON ELECTRICITY SYSTEM
15
2721
27
114
63
94
0
20
40
60
80
100
120
Natural gasw/CCS
Biogas CT Wind Solar Batterystorage
Peakdemand
Installed Capacity (GW)
Natural gas
w/CCS21%
Wind
17%Solar
61%
Biogas CT
1%
Annual Generation (%)
Detailed case results for Southern system, very low cost scenario for all resources

0%
20%
40%
60%
80%
100%
Pe
rce
nt
of
inst
alle
d c
apa
city
ANNUAL GENERATION DURATION CURVE
Average Fleet-wide NG+CCS Capacity Factor: 46%
16Hours
0 8760

UNIT COMMITMENT DISTRIBUTION
Average Fleet-wide NG+CCS Commitment Factor: 46%
17

HOURLY DISPATCH DURING PEAK DEMAND WEEK (AUGUST)
18
0
20
40
60
80
100
120
140
t5598 t5610 t5622 t5634 t5646 t5658 t5670 t5682 t5694 t5706 t5718 t5730 t5742 t5754
GW
NG+CCS Biogas CT Wind Solar Battery Demand

SOME OPEN QUESTIONS
19
• What is the ideal “design space” for CCS from the electricity system perspective? What set of cost and performance characteristics are most attractive/make CCS most competitive?
• Capital and fixed O&M costs; Capture efficiency; Heat rate; Ramping rates;Minimum turndown / stable output; Cycling costs; Cycling time
• How does availability of other competing or complementary resources (e.g. nuclear, storage, flexible demand, wind vs. solar heavy systems) affect the ideal design space for CCS?
• How valuable is it to de-couple parasitic loads for the capture process to enhance flexibility (e.g. storing oxygen for oxyfuel combustion, storing saturated amines for later CO2 removal)
• Is it valuable to have a variable capture rate (with tradeoffs in heat rate)? – Is it worth achieving a lower turndown level by increasing capture rate at a greater efficiency penalty vs. cycling off the plant?
• Are there cost-effective/competitive opportunities for coupling thermal or electrical storage?

Jesse D. JenkinsAssistant Professor
Department of Mechanical & Aerospace Engineering and Andlinger Center for Energy & Environment
Princeton University
Twitter: @JesseJenkins
Linkedin.com/in/jessedjenkins
Google scholar: http://bit.ly/ScholarJenkins