imf country report no. 14/120 united republic of tanzania · imf country report no. 14/120 united...
TRANSCRIPT

©2014 International Monetary Fund
IMF Country Report No. 14/120
UNITED REPUBLIC OF TANZANIA 2014 ARTICLE IV CONSULTATION, THIRD REVIEW UNDER THE STANDBY CREDIT FACILITY ARRANGEMENT, REQUEST FOR A WAIVER FOR NONOBSERVANCE OF A PERFORMANCE CRITERION, AND FINANCING ASSURANCES REVIEW—STAFF REPORT; PRESS RELEASES; AND STATEMENT BY THE EXECUTIVE DIRECTOR FOR THE UNITED REPUBLIC OF TANZANIA In the context of the 2014 Article IV Consultation, the Third Review Under the Standby Credit Facility Arrangement, Request for a Waiver for Nonobservance of a Performance Criterion, and Financing Assurances Review, the following documents have been released and are included in this package: The Staff Report prepared by a staff team of the IMF for the Executive Board’s consideration on
April 25, 2014, following discussions that ended on February 25, 2014, with the officials of the United Republic of Tanzania on economic developments and policies. Based on information available at the time of these discussions, the staff report was completed on April 10, 2014.
An Informational Annex prepared by the IMF.
A Debt Sustainability Analysis prepared by the staffs of the IMF and the World Bank.
Press Releases including a statement by the Chair of the Executive Board, and summarizing the views of the Executive Board as expressed during its April 25, 2014 consideration of the staff report on issues related to the Article IV Consultation and the IMF arrangement.
A Statement by the Executive Director for the United Republic of Tanzania.
The following documents have been or will be separately released.
Letter of Intent sent to the IMF by the authorities of the United Republic of Tanzania* Selected Issues
*Also included in Staff Report
The publication policy for staff reports and other documents allows for the deletion of market-sensitive information.
Copies of this report are available to the public from
International Monetary Fund Publication Services PO Box 92780 Washington, D.C. 20090
Telephone: (202) 623-7430 Fax: (202) 623-7201 E-mail: [email protected] Web: http://www.imf.org
Price: $18.00 per printed copy International Monetary Fund
Washington, D.C.
May 2014

UNITED REPUBLIC OF TANZANIA
STAFF REPORT ON THE 2014 ARTICLE IV CONSULTATION, THE THIRD REVIEW UNDER THE STANDBY CREDIT FACILTY ARRANGEMENT, REQUEST FOR A WAIVER FOR NONOBSERVANCE OF A PERFORMANCE CRITERION, AND FINANCING ASSURANCES REVIEW
KEY ISSUES Background, outlook, and risks. Economic growth is projected to remain strong at 7 percent next year and in the medium term. Inflation is at 6 percent, gradually converging to the authorities’ 5 percent medium term objective. The external current account deficit remains among the largest in the region, at 14 percent of GDP this year. Fiscal revenue shortfalls and overruns in domestically-financed spending led the deficit to rise to 6.8 percent of GDP in 2012/13. Revenue shortfalls in 2013/14 compared to the budget approved by parliament have prompted the authorities to undertake expenditure cuts during the fiscal year in an effort to meet their 5 percent of GDP target. Based on the debt sustainability analysis, Tanzania remains at low risk of debt distress. A major upside risk for the long term, not yet incorporated in the baseline projections, relates to sizable finds of offshore natural gas that, if confirmed as commercially viable, could bring in large revenues during the next decade. Program implementation. All performance criteria under the program were met, except a sizable breach of the performance criterion on net domestic financing at end-June 2013. The structural benchmark on submission to parliament of the VAT reform for November 2013 was missed. The authorities have taken corrective measures. Macroeconomic and structural policies. Preparations for the draft 2014/15 budget are under way. A VAT reform aimed at improving efficiency and reducing exemptions is ready for submission to parliament prior to the beginning of the new fiscal year. A priority in the next few years is to establish the institutional and policy framework to ensure that, if natural gas revenues materialize, they will bring benefits to all Tanzanians. Staff recommends completion of the third (and final) review under the SCF arrangement and approval of the authorities’ requests for a waiver for nonobservance of a performance criterion and for completion of the financing assurances review.
April 10, 2014
UNITED REPUBLIC OF TANZANIA
2 INTERNATIONAL MONETARY FUND
Approved By Roger Nord (AFR) and Dhaneshwar Ghura (SPR)
A staff team consisting of P. Mauro (head), N. Gigineishvili, N. Raman (all AFR), S. Kaendera (FAD), and G. Ho (SPR) visited Dar es Salaam, Dodoma and Zanzibar during August 26–30, October 23–November 5, and February 12–25. Mr. Baunsgaard, IMF Resident Representative, assisted the mission. The mission met with the late Minister of Finance Mgimwa and his successor, Minister Saada Salum; Governor Ndulu of the Bank of Tanzania; Permanent Secretary of the Treasury, Mr. Likwelile; other senior officials; members of Parliament; representatives of the private sector and academia; and development partners. Mr. Tucker and Mr. Yamuremye (OED) participated in the discussions.
CONTENTS
CONTEXT___________________________________________________________________________________________4
RECENT DEVELOPMENT, OUTLOOK, AND RISKS________________________________________________ 5
POLICY DISCUSSIONS____________________________________________________________________________11
A. Monetary and Exchange Rate Policies__________________________________________________ 12
B. Fiscal Policy_____________________________________________________________________________ 12
C. The Financial Sector____________________________________________________________________ 14
D. Managing Natural Gas Reserves_______________________________________________________ 16
E. Structural Reforms______________________________________________________________________ 18
STAFF APPRAISAL________________________________________________________________________________18 BOXES 1. Response to the 2011 Article IV Consultation’s Key Recommendations_________________________ 7 2. Fiscal Obligations Stemming from the Pension System_________________________________________ _9 3. Macroeconomic Convergence Criteria under the EAC Monetary Union Protocol______________ 11 4. Monitoring and Managing Fiscal Risks in Tanzania_____________________________________________ 14 5. Status of Recommendations from the June 2010 FSSA Update________________________________ 17

UNITED REPUBLIC OF TANZANIA
INTERNATIONAL MONETARY FUND 3
FIGURES 1. Real Sector and External Developments _______________________________________________________ 21 2. Fiscal Developments ___________________________________________________________________________ 22 3. Inflation, Exchange Rate and Monetary Developments ________________________________________ 23 4. EAC: Financial Soundness Indicators, 2009–2012 ______________________________________________ 24 5. International Comparison of Macroeconomic Fundamentals __________________________________ 25 TABLES 1. Selected Economic and Financial Indicators, 2010/11–2017/18 _______________________________ 26 2a. Central Government Operations, 2010/2011–2017/18 _______________________________________ 27 2b. Central Government Operations, 2010/11–2017/18 __________________________________________ 28 3. Monetary Accounts, 2012–2015 _______________________________________________________________ 29 4. Balance of Payments, 2010/11–2017/18 _______________________________________________________ 30 5. Financial Soundness Indicators, 2010–2013 ___________________________________________________ 31 6. Risk Assessment Matrix ________________________________________________________________________ 34 ANNEXES I. Economic Diversification and Growth: Tanzania’s Experience __________________________________ 34 II. Exchange Rate Assessment ____________________________________________________________________ 41 APPENDIX I. Letter of Intent _________________________________________________________________________________ 46

UNITED REPUBLIC OF TANZANIA
4 INTERNATIONAL MONETARY FUND
CONTEXT 1. Prudent policies and macroeconomic stabilization have underpinned the strength and resilience of Tanzania’s economic performance over the past decade. Despite the global financial crisis of 2008-09, the food and fuel price shocks of 2007–08 and 2011–12, and the energy crisis of 2011, real GDP growth has proved resilient, averaging 7 percent over the past decade. The poverty headcount in mainland Tanzania declined from 33.6 percent of the population in 2007 to 28.2 percent in 2011/12, but remained relatively high in rural areas, where job creation was insufficient to absorb a young and growing labor force.1 Macroeconomic performance under the three-year Policy Support Instrument (PSI, July 2010–June 2013) and the Standby Credit Facility (SCF, July 2012–April 2014) has been broadly satisfactory. Box 1 presents a summary of Tanzania’s policy response to the key recommendations in the 2011 Article IV consultation.
2. During the next few years, policymakers will need to manage and meet expectations stemming from three main sources, while preserving fiscal and debt sustainability:
a. Public investment in infrastructure is seen as key to strengthening competitiveness and removing growth bottlenecks. The authorities’ “Big Results Now” (BRN) initiative envisages ambitious infrastructure investment that, after further prioritization, needs to be fully integrated into the budget process, while safeguarding critical social expenditures.
b. Over the next decade, Tanzania has good prospects of becoming a major producer and exporter of natural gas. This is beginning to generate expectations that greater spending is warranted by likely future revenues. However, a final decision on whether to develop a large-scale liquefied natural gas (LNG) project using offshore gas resources may not be made by the natural gas companies until 2016, with production to begin no earlier than 2020. Beyond keeping expectations in check until such uncertainty is resolved, decisions made in the next few years on the contracts and the framework for the management of natural resources revenues will have long-term implications for whether the ensuing benefits will accrue to all citizens.
c. Political factors may engender additional spending pressures. Uncertainties stem from the ongoing review of the constitution, including the relationship between mainland Tanzania and Zanzibar, which might have significant economic and fiscal implications. General elections will be held in October 2015, when President Kikwete’s second and last term in office expires. Against this background, undertaking reforms will likely require even greater resolve.
1 In the 2011/12 Household Budget Survey, poverty was estimated at 33.6 percent in rural areas, 4.2 percent in Dar es Salaam, and 21.7 percent in other urban areas. The results of the 2007 and 2011/12 surveys are not fully comparable, owing to methodological changes.

UNITED REPUBLIC OF TANZANIA
INTERNATIONAL MONETARY FUND 5
RECENT DEVELOPMENT, OUTLOOK, AND RISKS 3. The broad-based nature of economic growth has contributed to its resilience. Growth has been driven by services, construction and low-technology manufacturing (Figure 1); labor-intensive agriculture has lagged resulting in a persistently high unemployment and underemployment. In 2011 real growth declined to 6.4 percent partly because of significant power shortages caused by a slump in hydro generation. As the authorities quickly restored power supply by procuring thermal generation capacity from the private sector, growth recovered in 2012 and has remained at about 7 percent since then.
4. Tanzania has experienced significant economic transformation since the 1990s. The share of agriculture in output declined from 32 percent in 1998 to 23 percent in 2012, giving way to higher value-added manufacturing and services. The decline in the share of agriculture in non-gold exports of goods and services was even more marked, from 49 percent to 13 percent over the same period. This diversification of the economy was facilitated by subsequent waves of reforms from the mid-1980s to the mid-2000s aimed at reducing the role of the state in the economy, market liberalization, and policy modernization (Annex I). The pace of reforms, however, seems to have abated in recent years.
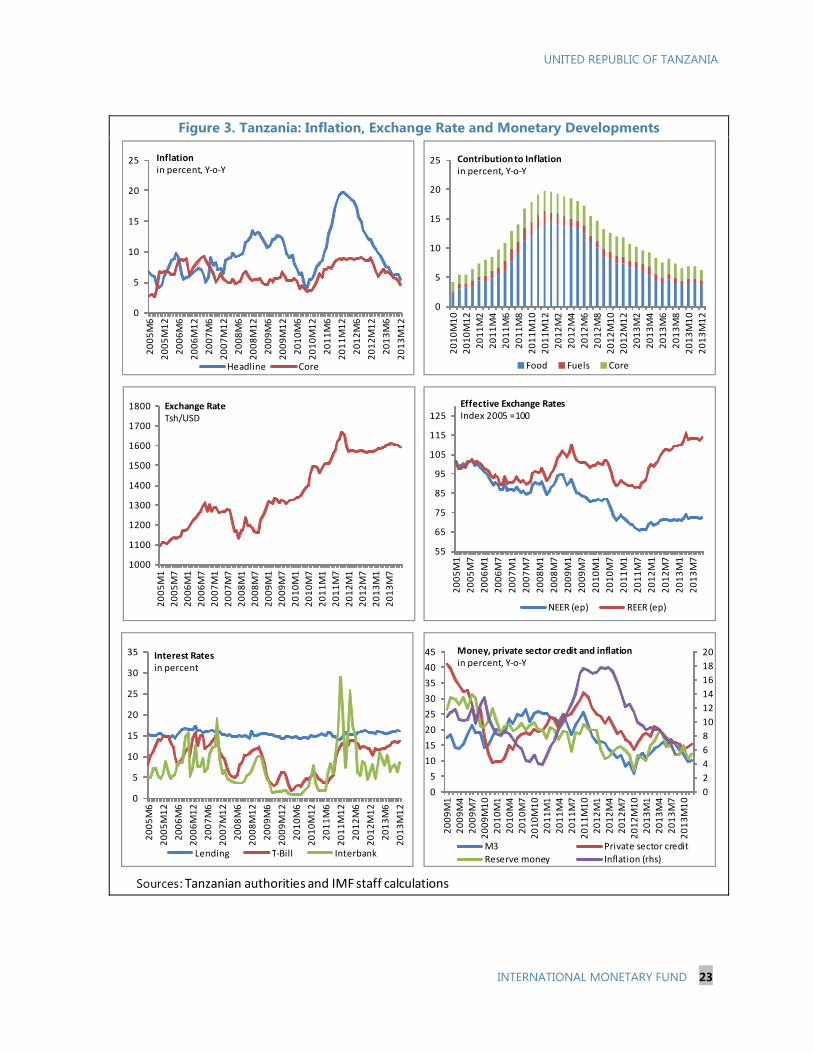
5. Inflation has returned to the mid-single digits. With the reversal of the 2011 surge in global food and fuel prices, headline inflation fell steadily from its peak of 20 percent in December 2011 to 5.6 percent in December 2013 (Figure 2). In January and February 2014, headline inflation picked up slightly to about 6 percent, in part reflecting a direct one-off impact of the near 40 percent average increase in power tariffs starting January 1 (see ¶13). Going forward, supply-side risks to inflation seem to be limited, in view of a strong harvest and stable global oil prices; the monetary stance is projected to contain demand pressures.
6. A deliberate slowdown in the key monetary aggregates has contributed to gradual disinflation. Consistent with a tightening of reserve money targets, both broad money (M3) and private sector credit growth declined from more than 20 percent in 2010 and 2011 to 10 and 15 percent, respectively, by end-2013. Interbank, Treasury bill, and other key interest rates have not displayed clear trends (or provided clear guidance) in nominal terms over the past year or so, but they have risen substantially in real terms as inflation has declined. The disinflation has also benefitted from the broad stability of the nominal exchange rate against the U.S. dollar, which hovered within a narrow range during 2012 and depreciated by 3 percent between January 2013 and February 2014.

UNITED REPUBLIC OF TANZANIA
6 INTERNATIONAL MONETARY FUND
‐25
-20
-15
-10
-5
0
Bu
run
di
Tan
zan
ia
Uga
nd
a
Ke
nya
Rw
and
a
DR
C
Eth
iop
ia
Mal
awi
Current Account Balance, 2013(percent of GDP)
SSA median
60
70
80
90
100
110
120
130
Jan
-05
Jul-
05
Jan
-06
Jul-
06
Jan
-07
Jul-
07
Jan
-08
Jul-
08
Jan
-09
Jul-
09
Jan
-10
Jul-
10
Jan
-11
Jul-
11
Jan
-12
Jul-
12
Jan
-13
Jul-
13
Jan
-14
Nominal and Real Effective Exchange Rates(December 2005 =100)
NEERREER
33%
7. The current account deficit has been among the largest in the region for several years. It widened from about 9 percent of GDP in 2009/10 and 2010/11 to 18 percent of GDP in 2011/12, owing to a significant surge in FDI, higher fuel prices, and one-off imports of thermal power generation equipment to offset the drought-induced drop in hydro power capacity. 2 In 2012/13, the current account deficit is estimated to have narrowed to 14 percent of GDP as these shocks waned and weaker gold export receipts were more than offset by a reduction in imports of goods and services. The trade balance deteriorated again during the first half of 2013/14, driven by a decline in the price of gold and large demand for oil imports for power generation. Gross international reserves amounted to US$4.67 billion at end-December 2013, equivalent to almost 4 months of current year imports of goods and services for 2013/14.
8. The real effective exchange rate (REER) appreciated by 33 percent as of January 2014 from August 2011, when it reached its lowest level since 2000. The appreciation stemmed from a positive inflation differential relative to trade partner countries. The central estimate obtained by staff using a variety of econometric approaches suggests that the shilling is somewhat overvalued, though these findings need to be interpreted with caution in light of the rapid transformation of the economy, including large current and prospective flows of FDI and possible large natural gas exports in the future (Annex II).
2 The authorities’ efforts to more fully capture repatriated profits by FDI companies in the income balance resulted in upward revisions to the current account deficits in 2011/12 and 2012/13, by 2 percent of GDP and 0.5 percent of GDP respectively.

UNITED REPUBLIC OF TANZANIA
INTERNATIONAL MONETARY FUND 7
9. Fiscal pressures re-emerged in 2012/13 and 2013/14, leading to program slippages. Data yet to be finalized indicate that the deficit (measured from the financing side) in 2012/13 amounted to 6.8 percent of GDP compared to the 5.5 percent envisaged under the program.3 Domestic revenues turned out below expectations, by 0.7 percent of GDP, mostly owing to underperforming VAT. Domestically financed spending was 0.4 percent of GDP higher than envisaged under the program. As a result, the performance criterion on net domestic financing was breached by 1.2 percent of GDP. Meanwhile total public debt rose to 40.8 percent of GDP at end-June 2013.
10. Optimistic revenue projections are posing challenges in the execution of the FY2013/14 budget. The budget approved by Parliament for 2013/14 envisages a 5 percent of GDP deficit, but assumes revenues (and expenditures) that are 1 percent of GDP higher than indicated in the May 2013 staff report (IMF Country Report No. 13/166). Updated projections
3 The deficit target had been revised to 5.8 percent of GDP to permit a transfer to TANESCO, which was facilitated by an IDA budget support operation (First Power and Gas Sector DPO). While the World Bank disbursed the funds before the end of FY2012/13, the transfer to TANESCO occurred in early FY2013/14.
Box 1. Response to the 2011 Article IV Consultation’s Key Recommendations Mobilize domestic resources. Tax revenues as a share of GDP are projected at 16.2 percent in 2013/14 compared with 15.2 percent in 2010/11, continuing an upward trend experienced for the past few years. The increase has stemmed primarily from strong growth, improved compliance, and tax measures in the 2013/14 budget. Going forward, reductions in tax exemptions are expected via the upcoming VAT reform.
Reduce overall expenditure while safeguarding priority spending. The budget deficit was lower than programmed in 2011/12, but expenditure overruns led to a higher-than-programmed deficit and a breach of the net domestic financing performance criterion at end-June 2013. Expenditure pressures also pose a risk for executing the 2013/14 budget. Priority spending has been preserved.
Improve public financial management. Domestic arrears have been a recurring issue. Stricter enforcement of spending commitment controls and better tracking of multi-year contractual obligations would be warranted.
Enhance prioritization of public investment. The “Big Results Now” initiative has identified key strategic priorities. Further prioritization will be needed as this initiative is integrated into the budget process.
Strengthen debt management processes. The debt management office is not yet operational. The Ministry of Finance published an updated Medium Term Debt Management Strategy in November 2013 (available at www.mof.go.tz).
In monetary policy, be vigilant to the impact of rising food and energy prices. Following the 2011 Article IV Consultation, a major shock materialized, leading to higher inflation in the region. Monetary policy tightening and the unwinding of the shock have led to a gradual decline in inflation; the authorities’ medium term target of 5 percent is within reach.
Follow up on the 2010 FSAP Update recommendations. See Section C.

UNITED REPUBLIC OF TANZANIA
8 INTERNATIONAL MONETARY FUND
suggest a likely shortfall in total revenues by 2 percent of GDP compared with the budget, partly because of delays in introducing new taxes on SIM cards and bank transfers, lower gold prices, and weaker revenue buoyancy than previously assumed. Parliament in December replaced the SIM card tax with a further increase in excise duty on airtime by 2.5 percent. To achieve the original deficit target in the wake of revenue shortfalls, the authorities restricted spending for “other charges” in August, October and November, and introduced deeper spending cuts in the context of the mid-year budget review undertaken in mid-March.
11. Weaknesses in public financial management undermine the quality and timeliness of fiscal data available to policymakers. The three main problems are: (i) recurrence of large domestic unpaid claims (with duration above 90 days); these increased to 1.6 percent of GDP at end-December 2013 from 0.5 percent of GDP in June 2012; (ii) growing expenditure “floats” (estimated at 6 percent of domestically financed spending or 1.3 percent of GDP in 2012/13);4 and considerable delay in coming close to reconciling the discrepancies between “above the line” deficit figures and the financing data. These issues point to weaknesses in budget formulation, execution and monitoring, including difficulties in aligning expenditures with available financing resources during the year.
12. Additional firm and contingent obligations have built up in the pension system. Firm obligations relate to the benefits of participants in the non contributory, pre-1999-reform system (Box 2). Contingent obligations stem from loans provided by several pension funds to finance activities by government entities, a practice that presents fiscal transparency challenges.
13. Significant progress was achieved in addressing financial difficulties of the energy sector. The independent energy regulator, EWURA, announced an electricity tariff increase by about 40 percent (on average) effective January 1, 2014. Analytical work done by the World Bank suggests that this is a significant step toward restoring the financial viability of TANESCO (the national power utility), and will substantially strengthen the company’s financial situation in 2014. To cover the losses for the current fiscal year and to clear the stock of the past arrears, TANESCO borrowed an amount equivalent to US$250 million commercially (with a sizable government guarantee) and received a direct budget transfer of about US$220 million (which was facilitated by budget financing from the World Bank and African Development Bank). TANESCO is also undertaking measures to improve collections and recovery of arrears and to minimize losses due to power theft. TANESCO’s financial situation is expected to further improve in 2015, with completion of a new natural gas pipeline and gas-fueled power plants leading to a decline in power generation costs. Realizing the benefits of the increased pipeline capacity will also require that the Tanzania Petroleum Development Corporation and the investors in the existing gas fields come to a final agreement on new gas supply contracts.
4 The expenditure “float” measures payment orders that were issued in a given fiscal year, but were drawn from the banking system in the following fiscal year.

UNITED REPUBLIC OF TANZANIA
INTERNATIONAL MONETARY FUND 9
Box 2. Fiscal Obligations Stemming from the Pension System Prior to July 1999, the pension scheme for civil servants was non-contributory and pension benefits were all paid from the budget. The system was transformed to a contributory Public Service Pension Fund (PSPF) in July 1999. During a five- year transition period (July 1999–June 2004), the budget paid all pension benefits. Although the government was expected to cover benefits associated with the pre-July 1999 scheme beyond the transition period, the PSPF has been paying retirees on behalf of the Government. Based on World Bank estimates, by December 2012, the government owed TSh 1.2 trillion (about 2 percent of GDP) to the PSPF. A 2010 actuarial valuation estimates the full pre-1999 public sector liabilities at TSh 4 trillion (about 7 percent of GDP). In addition, the financial position of the PSPF is fragile, in part reflecting delayed reimbursements from the government. Ultimately, the central government is responsible for the pension obligations to civil servants. Further, the actuarial deficit arising from the broader pension sector, including several other public and private sector pensions also gives rise to substantial contingent liabilities.
14. Credit to the private sector continues to expand in an environment of financial system stability. The rate of growth of credit to the private sector in nominal terms has declined compared with its peak in 2010, but remains strong at 15.3 percent y-o-y through December 2013, broadly in line with nominal GDP growth. Credit to the private sector as a share of GDP stood at 17.6 percent in 2013, having almost converged to the median share for a group of comparator countries selected on the basis of level of development and other characteristics (see chart below). Strong credit growth has not come at the expense of financial stability. In its March 2013 Financial Stability Report, the BoT concluded that the banking system remains well capitalized: the ratio of capital to total risk-weighted assets was 18.2 percent in December 2013 (December 2012: 17.5 percent; statutory minimum: 10 percent). Risks are receding: non-performing loans declined to 6.5 percent of total loans in December 2013 from 8.1 percent the previous year, though this remains above the regulators’ comfort level of 5 percent. To further mitigate risks, the BoT has increased the number of supervisors, enhanced banks’ framework for financial reporting, and implemented more updated stress-testing methodologies.
15. Performance under the SCF arrangement has been mixed. All of the end-June quantitative performance criteria were met except for the ceiling on net domestic financing, breached by 1.2 percent of GDP. The indicative target on tax revenue collection was missed by 0.4 percent of GDP in June and September and by 0.8 percent of GDP in December. The end-December indicative target on reserve money was missed by a small margin (0.1 percent of GDP). The structural benchmark on the submission of the VAT reform bill to Parliament was further delayed from end-November to May 2014, to allow broader consultation with stakeholders. At the request of the authorities, the program was extended to April 30, 2014 (from its original expiration date of January 5, 2014). This allowed them sufficient time to implement measures envisaged under the program for completion of the third SCF review. The authorities are requesting a waiver for the nonobservance of the performance criterion on NDF at end-June 2013 on the basis that they have: (i) instituted revisions to the 2013/14 budget in the context of the mid-year budget review, including downward adjustments to the revenue projections and expenditure cuts of almost 2 percent of GDP to goods and services compared to the initial

UNITED REPUBLIC OF TANZANIA
10 INTERNATIONAL MONETARY FUND
2013/14 budget; (ii) obtained Cabinet approval for the main features of a reform to the VAT reform, which the government plans to submit to Parliament in May 2014; and (iii) as noted in ¶13, implemented increases in electricity tariffs on January 1, 2014 to improve the financial position of TANESCO and to reduce the need for the budget subsidies. The NDF target was met at end-December 2013.
Credit to the private sector (percent of GDP)
1/ Statistical estimate of the expected median value of credit to the private sector as a share of GDP generated by the FinStats tool created by the World Bank. The tool selects a peer group based on the level of economic development, population, demographic characteristics, the global cycle and other special characteristics (e.g., whether the country is an oil exporter or an offshore financial center) and provides the median values of each indicator for the peer group.
Sources: Tanzania authorities, World Bank, IMF staff estimates.
16. The macroeconomic outlook remains favorable. Economic growth is projected at about 7 percent in the medium term. Absent major external price shocks, inflation is expected to reach the authorities’ 5 percent target by mid-2014 provided that the BoT maintains its prudent monetary policy stance. Under the baseline assumption that the construction of a natural gas pipeline and gas-fired power plants is completed in 2014/15, the availability of cheaper energy would have a beneficial impact on economic growth and the current account. Nevertheless, with continued strong domestic demand and sizable foreign direct investment, the current account deficit is projected above 10 percent of GDP in the medium term.
17. The economy faces several risks (see Risk Assessment Matrix, Table 6). Possible shocks to food and fuel prices would further weaken the current account, exert pressure on consumer prices and may necessitate additional social outlays. A sharp slowdown in China, on the other hand, would reduce prospective FDI and credit flows to Tanzania undermining key infrastructure investments and thereby future growth. This said, the most significant sources of risk relate to domestic policy implementation and include: potential fiscal slippages because of the intensification of pre-election spending; delays in the construction of the gas pipeline and the power plants; and the fiscal risks described below (see Box 4 in particular).
0
2
4
6
8
10
12
14
16
18
20
2003 2004 2005 2006 2007 2008 2009 2010 2011 2012 2013
TZA
Estimated median 1/
0
5
10
15
20
25
30
35
2003 2004 2005 2006 2007 2008 2009 2010 2011 2012 2013
TZA KEN UGA

UNITED REPUBLIC OF TANZANIA
INTERNATIONAL MONETARY FUND 11
18. The long-term outlook will be influenced by the business climate and its impact on investment. There seems to be considerable room for improvement through structural and institutional reforms. In the 2013 survey of the World Bank Group’s ‘Doing Business’ indicators, Tanzania ranks 134 out of 185 countries (for the average across all indicators) and lags behind several of its peers in the region (including Kenya, Rwanda, and Uganda). In particular, speeding up the resolution of commercial disputes and rendering tax policy more predictable are perceived as priorities by several entrepreneurs and financial market participants. In response, the authorities have set up a “BRN laboratory” focused on improving the business climate.
19. East African Community (EAC) integration is progressing, although significant challenges remain.5 On November 30, 2013, the Heads of States of all five EAC countries signed a joint protocol outlining the process toward EAC Monetary Union, with the introduction of the common currency envisaged for 2024. Convergence criteria were agreed for inflation, foreign exchange reserves, and fiscal variables (Box 3). Implementation of the protocols for customs union (signed in 2005) and the common market (2010), including the elimination of remaining non-trade barriers, is crucial to reap the full benefits of monetary union.
Box 3. Macroeconomic Convergence Criteria under the EAC Monetary Union Protocol The EAC single currency is expected to be introduced by 2024 by member states that comply with four primary convergence criteria, complemented by three non-binding, indicative convergence criteria that will serve as early warning indicators:
Primary convergence criteria
(i) ceiling on headline inflation of 8 percent (ii) fiscal deficit (including grants) ceiling of 3 percent of GDP (iii) ceiling on gross public debt of 50 percent of GDP in NPV terms (iv) reserve cover of 4.5 months of imports Indicative criteria:
(i) core inflation ceiling of 5 percent (ii) fiscal deficit (excluding grants) ceiling of 6 percent of GDP (iii) tax- to-GDP ratio of 25 percent
POLICY DISCUSSIONS 20. The discussions focused on informing a macroeconomic policy framework for the next few years. The analysis of macroeconomic economic developments and of policies undertaken in the context of the Fund-supported program was aimed at shaping a set of policies whereby the authorities would continue to aim at fostering growth while maintaining macroeconomic stability and debt sustainability.
5 The East African Community comprises Burundi, Kenya, Rwanda, Tanzania and Uganda.

UNITED REPUBLIC OF TANZANIA
12 INTERNATIONAL MONETARY FUND
A. Monetary and Exchange Rate Policies
21. The stance of monetary policy is consistent with the authorities’ objective to keep inflation at around 5 percent in the medium term. The authorities indicated that they would aim at entrenching actual and expected inflation at their medium-term objective. To that end, the authorities envisage reserve money growth around that of nominal GDP. This, in turn, is projected to result in a moderate increase in broad money (M3), given the expectation that financial development and inclusion would be mirrored in a gradual reduction in the velocity of M3. At the same time, they saw financial deepening, with greater availability of credit to the private sector, as an important factor to support economic growth (see section C below).
22. The BoT intends to gradually modernize its monetary policy framework. Although the authorities believe that the existing reserve money targeting framework has served the country well, they are contemplating a gradual transition to a more forward-looking monetary policy with more flexible operational targets and greater reliance on interest rates. The authorities consider that an interest rate-based monetary framework may be better aligned with a deeper financial system with greater private sector involvement, and may convey the stance of monetary policy more clearly. The BoT is reviewing the functioning of key financial markets, including the interbank market, and exploring ways to strengthen the transmission mechanism from policy interest rates to the real economy. Among its initial steps, the BoT is analyzing the existing links between market interest rates and key monetary aggregates.
23. The BoT reiterated its commitment to a flexible exchange rate regime. The authorities pointed to the enhanced flexibility observed over the past year. In view of the large amounts of official aid and capital inflows being channeled through the BoT and the ensuing necessary FX sales to sterilize them, the discussions focused on the relative merits of the existing system, where the BoT announces the price at which it will transact on the existing interbank foreign exchange market (IFEM) platform, and an auction mechanism (if feasible, building on the IFEM infrastructure). There was agreement that interventions should be for liquidity management purposes and to smooth out short-term fluctuations in the exchange rate. The authorities also noted that the relative importance of the organized market should not be overestimated, in view of the even larger volume of foreign exchange transactions that occur outside of the market, including sizeable banks’ dealings with their customers. The BoT indicated its intention to gradually increase reserves as a share of imports.
B. Fiscal Policy
24. The authorities aim at balancing the debt stabilization objective with the need to invest in infrastructure and ensure adequate priority social spending. The debt sustainability analysis (DSA) shows that Tanzania remains at low risk of external debt distress and that the public debt outlook is sustainable, assuming that economic growth remains strong and that the fiscal deficit gradually declines to 4–4½ percent of GDP over the medium term. The authorities noted the difficult choices to be made in prioritizing expenditures and mobilizing additional

UNITED REPUBLIC OF TANZANIA
INTERNATIONAL MONETARY FUND 13
revenues to attain the deficit reduction objective, in light of a gradual decline in grants. They emphasized that the budget is the sole and appropriate mechanism to make priorities operational, including those outlined in the recent Big Results Now initiative.
25. Budget preparations for 2014/15 are under way. The authorities indicated that they would persevere in their efforts to mobilize domestic revenues, including through the upcoming VAT reform. Thus, despite the decline in grants, the budget would aim at a moderate reduction in the deficit compared with the 2013/14 target, while allocating resources for a modest increase in infrastructure investment as a share of GDP and at least maintaining the share of spending on priority social services. The authorities noted that, in view of recent experience, they would strive to maintain revenue projections at realistic levels, so as to avoid the need for expenditure compression during budget execution. They also indicated that the budget would include modest allocations for the benefits of pensioners covered by the pre-1999 reform non-contributory system and for the clearance of longstanding domestic arrears through a centralized process of verification and payment. The discussions also addressed the merits of allocating potential one-off revenues (such as capital gains tax revenues arising from a sale of participation rights in offshore production sharing agreements between two companies) to clearing existing arrears.
26. Consistent with the favorable debt outlook, the authorities planned external non-concessional borrowing to finance infrastructure projects. Under the current SCF arrangement, the ENCB ceiling of US$3,388 million (cumulative from July 2010) was set to permit contracting of US$700 million this fiscal year, consistent with the budget. Out of the allocated amount, US$84 million have been contracted as of February 2014 (the foreign currency portion of a commercial loan contracted by TANESCO). The authorities indicated that they plan to use the remaining amount under the ceiling to finance infrastructure projects, including a gas-based power plant and an airport terminal—both would be implemented over a number of years. The financing contracts for these loans are close to being finalized. More generally, the authorities intend to explore a greater role for the private sector, including PPPs, to finance and undertake infrastructure investment. The authorities also noted the importance of being able to contract additional non-concessional financing—potentially including a sizable upfront bond issuance— during the two months prior to the beginning of the next fiscal year, to avoid delays in executing infrastructure projects. Staff concurred, in view of the positive DSA results, while noting the carry costs involved in pre-financing.
27. The authorities are making progress in debt restructuring discussions with external creditors. Since the last review, staff was made aware of an existing stock of arrears to private external creditors stemming from the lease of planes by Air Tanzania several years ago, whose size is estimated well below 0.1 percent of GDP. In line with the Fund’s Lending into Arrears (LIA) policy, the authorities have demonstrated and intend to continue good faith efforts, through frequent bilateral communication and working out a repayment plan, to reach collaborative agreement with their creditors.

UNITED REPUBLIC OF TANZANIA
14 INTERNATIONAL MONETARY FUND
28. Disclosure and management of fiscal risks is limited, despite their macroeconomic relevance. Fiscal risks are generally defined as the possibility of deviations of fiscal outcomes from baseline projections. Information regarding some of the most macro-economically relevant fiscal risks is not yet readily available to policymakers or the public (Box 4).
C. The Financial Sector
29. Financial sector development and economic growth have been mutually reinforcing. Indicators of financial development show that Tanzania’s experience is similar to other countries in the region, though there is scope for further progress given the country’s level
Box 4. Monitoring and Managing Fiscal Risks in Tanzania Key fiscal risks in Tanzania stem from the following sources.
Macroeconomic shocks. The fiscal implications of potential changes in macroeconomic variables could be significant: in particular, a prolonged decline in the currently high rate of economic growth would considerably worsen debt dynamics. Nevertheless, the debt sustainability analysis suggests that the magnitude of the impact is manageable and is not much different from peers. The DSA prepared and published by the authorities is a helpful start in informing the public about the fiscal implications of macroeconomic shocks.
Offshore natural gas. If the presence of commercial quantities of off-shore natural gas is confirmed, large revenues could start accruing to the budget by the end of the decade. On the other hand, the fiscal position would deteriorate if government expenditures were to increase substantially in the expectation of higher revenues from natural gas, and these later turned out to be short of expectations.
Public enterprises. Despite major privatization waves during the past two decades, PEs still play a major role. The government has ownership in 215 PEs (including regulatory and policy making bodies) and its shareholdings are valued at US$8.6 billion (TSh 14 trillion). At end June 2013, total outstanding government loans to PEs amounted to 1 percent of GDP and total guarantees were another 1 percent of GDP. Annually parliament receives a comprehensive list of public enterprises and other government agencies, and information on state ownership, guaranteed loans, budget transfers to and dividend payments by PEs. More detailed financial data (balance sheets and income statements) are being collected by the Treasury Registrar but not shared with parliament or the public. Disclosure of more comprehensive information on PEs would allow policy makers to gauge (i) the importance of PEs in achieving public policy objectives; (ii) the need for subsidies, and (iii) the extent to which dividends paid by the PEs are commensurate with their profits and operations. As natural resources gain importance, the financial situation of PEs involved in the sector will merit even further disclosure of information.
Public-private partnerships and guarantees. In recent years, guarantees issued by the central government have been relatively limited and have been generally disclosed. Public-private partnerships have also seen little activity, though prospectively this could be an important area as new projects emerge.
Government obligations that may not be captured in the fiscal accounts. This includes, for example, off-budget spending by Ministries, Departments and Agencies (MDAs) financed by pension funds to construct hospitals, universities, and other projects which were not funded within the budget framework; in several instances, the MDAs are not servicing the debt obligations. This weakens transparency; moreover, the ensuing obligations will eventually need to be recognized as central government debt.

UNITED REPUBLIC OF TANZANIA
INTERNATIONAL MONETARY FUND 15
of development. In response, the authorities have focused on fostering financial stability to engender confidence in the system, allowing the private sector to leverage on innovations such as mobile banking that enhance financial inclusion. Indeed, indicators of credit availability and financial inclusion display an upward trend. The growth in mobile banking transactions has been especially rapid, rising from TSh 25.2 billion in 2008 to TSh28.9 trillion in 2013. The authorities and private sector agents see these developments as supporting investment, economic efficiency, and output growth. In order to support the prudent expansion of mobile banking and money platforms, the authorities are working on regulations to ensure financial stability. A new Payments System Act has been drafted to make the BoT’s supervisory role over mobile payment platforms more explicit, and is expected to be tabled at the next parliamentary session.
Indicators of Financial Development
1/ Statistical estimates of the expected median value of the financial development indicators are generated by the FinStats tool created by the World Bank. The tool selects a peer group based on the level of economic development, population, demographic characteristics, the global cycle and other special characteristics (e.g., whether the country is an oil exporter or an offshore financial center) and provides the median values of each indicator for the peer group.
Note: The data refer to 2012.
Sources: Tanzanian authorities, World Bank.
30. The authorities have made progress in regulatory and supervisory reform. The Financial System Stability Assessment (FSSA) update of June 2010 recommended several actions, such as addressing data gaps to strengthen the oversight of banks, developing credit information tools to mitigate systemic credit risk, and improving the framework for dealing with banking crises. Progress to date includes collaboration committees of relevant supervisors and
ActualExpected
median1/
AccessAccounts per thousand adults, commercial banks
186.7 165.6 662.3 194.4
Number of branches per 100,000 adults, commercial banks
2.2 3.2 5.5 2.6
Depth/Size
Domestic bank deposits (percent of GDP) 27.1 25.0 39.0 20.1
Private credit (percent of GDP) 17.7 19.0 31.1 16.4
External position
Consolidated foreign claims of BIS-reporting banks (percent of GDP)
11.3 6.4 11.2 7.9
Stability
Private credit to deposits (percent) 65.5 69.8 79.6 81.7
Liquid assets (percent of deposits and short-term funding)
27.4 32.6 - 35.4
Tanzania
Kenya Uganda

UNITED REPUBLIC OF TANZANIA
16 INTERNATIONAL MONETARY FUND
policymakers for effective surveillance and crisis management/resolution, as well as the establishment of a credit reference database and bureaus. Further reforms are under way (Box 5).
31. Tanzania has substantially addressed its Action Plan agreed with FATF to address weaknesses in its AML/CFT framework. The last action item under the plan agreed with the Financial Action Task Force (FATF)—a set of amendments to legal provisions to strengthen provisions to seize terrorist assets—received its final parliamentary reading in November 2013 and was duly enacted in mid-December.6 Regulations to make the revisions operational were issued soon thereafter. Tanzania may be removed from the list of jurisdictions that are subject to FATF’s monitoring process after an on-site visit by FATF to confirm implementation of the reforms.7 To make the AML/CFT framework more efficient, the authorities are also undertaking a national assessment to identify the key risks. Ultimately, this will make it possible to adopt a more flexible set of measures, in order to target resources more effectively and apply preventive measures that are commensurate to the nature of risks.
D. Managing Natural Gas Reserves
32. Tanzania is likely to become a major producer and exporter of natural gas in the medium term. Significant offshore discoveries have been made over the last 2–3 years, and further exploration is underway. Although gas resources have not yet been declared commercially viable, estimates of discoveries indicate recoverable offshore gas resources of at least 24-26 trillion cubic feet, potentially sufficient for a four-train LNG plant (possibly as a common facility for several upstream gas fields). A final investment decision is expected at the earliest in late 2015 or 2016. Total investment during the development phase could amount to US$20-40 billion, the largest investment ever in Tanzania, with gas production starting after 2020.
33. Potentially significant revenue from natural gas could play a transformative role for the development of Tanzania, if well managed. The authorities and the mission discussed the importance of putting in place a sound policy, legal and regulatory framework well before natural gas exploration reaches an advanced stage. These will be reflected in the authorities’ revised gas policy framework, which is expected to address the inter-generational policy question of natural resource wealth management, ensure integration of resource revenue in the budget framework and institutionalize transparency and accountability of spending. Decisions made in the next few years on the contracts and the general fiscal framework will have long term implications for whether the benefits of likely revenues from newly discovered offshore natural gas will accrue to all citizens. Removing policy uncertainty about the fiscal regime would facilitate the final investment decision (see Selected Issues Paper).
6 The Action Plan can be found at http://www.esaamlg.org/userfiles/NATIONAL_AML_STRATEGY_TANZANIA.pdf. 7 The latest FATF statement on Improving Global AML/CFT Compliance: on-going process – 14 February 2014 can be found at http://www.fatf-gafi.org/media/fatf/documents/statements/Public-Statement-14-February-2014.pdf

UNITED REPUBLIC OF TANZANIA
INTERNATIONAL MONETARY FUND 17
Box 5. Status of Recommendations from the June 2010 FSSA Update The June 2010 FSSA Update recommendations, covering both bank and non-bank financial sector participants, include proposals to strengthen capital standards in banks; improve credit information systems; create a crisis management framework; develop avenues for long-term financing, including capital markets; and improve international cooperation with financial regulators, both in the region and elsewhere. The authorities have made progress in all these areas.
A high-level group, known as the Tanzania Financial Stability Forum (FSF), comprising all financial regulators and other key official stakeholders was established in March 2013 to monitor developments in the financial sector with a view to preserving financial stability. Meeting at least once every quarter, the group will guide the implementation of macro and microprudential measures in response to risks, and formulate and implement crisis management measures. The FSF had its first meeting in November 2013, at which members discussed possible options for a stress testing and crisis management framework for non-banks.
Other key developments in regulatory and supervisory policy:
The BoT set up a credit reference database and licensed two firms to act as credit reference bureaus, with a third application pending.
The Social Security Regulatory Authority was established in March 2011 and is now the primary regulator of pension funds.
Minimum capital requirements for commercial banks were raised to TSh 25 billion in February 2014 (TSh 5 billion previously), which most banks have met. The capital adequacy ratios will be further raised from March 2014 by 2.5 percentage points to 12.5 percent for Tier-1 capital and 14.5 percent for total capital.
The BoT has entered into information sharing and other cooperative arrangements with financial regulators in members of the EAC, Comoros, Cyprus, Nigeria, South Africa and Zimbabwe, with ongoing discussions with additional countries.
The authorities are setting out a framework for consolidated supervision of more complex financial firms, including amendments to the legal provisions that allow regulators to increase oversight of bank holding companies. Draft regulations to support this have been prepared and the authorities envisage being able to submit them for gazetting by June 2014.
In line with EAC agreements, further opening of the capital account to investors from other EAC members is envisaged by end-June 2014, extending this to the rest of the world by December 2015.
The main operational improvements include:
To improve transparency and communication, the BoT has started publishing semi-annual financial stability reports. As part of this, it is improving data collection, including through surveys of credit officers, households and corporates.
To address capacity and organizational challenges in banking supervision, the BoT has hired 15 new supervisors since 2010, and training has been stepped up.
To further improve the supervision process, greater use of technology, including automated submission of reports by banks to the BoT, has started.
Further work is needed to:
Improve the frequency and timeliness of data. The BoT’s financial stability reports are issued with some delay (March 2013 is the latest issue available, with September currently in preparation). The publication schedule is being aligned with that of FSF meetings, thereby enhancing timeliness.
Improve the stress-testing framework. Fund TA, including to expand stress-testing to pension funds, is being provided.
Bolster the deposit insurance fund. Efforts to enhance the operational independence of the Deposit Insurance Board by transforming it into a full-fledged Deposit Insurance Corporation are underway.

UNITED REPUBLIC OF TANZANIA
18 INTERNATIONAL MONETARY FUND
E. Structural Reforms
34. The authorities have prepared a draft new VAT law that would improve efficiency and help to mobilize revenues. Beyond modernizing the VAT, the reform is aimed at broadening the tax base by significantly reducing exemptions. A policy document outlining the main features of the law has been approved by Cabinet. The authorities indicated that the draft law, which incorporates initial rounds of stakeholders’ comments, would likely be submitted to Parliament in May 2014, in the proximity of parliamentary debate on the 2013/14 budget, which it is designed to support. They agreed that effective implementation of the new VAT regime would require strengthening the existing VAT administration, especially the refund mechanism.
35. The authorities noted their determination to stem and ultimately reverse the increase in domestic expenditure arrears. They noted that a high-level committee has already identified measures to prevent the emergence of new arrears (such as a halt in new multi-year projects in some ministries) and a framework for central verification and payment of old arrears. Further steps being explored included: more conservative revenue projections; enhanced cash flow planning; more timely and frequent validation of arrears; and greater enforcement of sanctions against officers incurring government obligations in the absence of budgetary resources.
36. The discussions on the pension system focused on the central government’s obligations to the Public Service Pension Fund (PSPF) and broader pension reform. A government task force recently completed a report assessing the magnitude of the obligations to the Public Service Pension Fund (PSPF). The discussions began exploring potential modalities for addressing the outstanding liabilities. The authorities were also exploring potential parametric reforms to enhance the sustainability of the broader pension system, which consists of several funds. An option under consideration is to harmonize the parameters by implementing the same changes recently applied to one of the funds; this would make a substantial dent in the actuarial deficit of the system.
STAFF APPRAISAL 37. Preserving macroeconomic stability is essential for continued strong growth. Tanzania’s buoyant economic growth and its recent return to moderate inflation are to be attributed, in no small part, to generally prudent macroeconomic policies. Yet, vulnerabilities may be building up, with mounting pressures for additional fiscal expenditures and a large current account deficit. Moreover, following the successful reforms of the mid-1990s to mid-2000s, the appetite for further reform seems to have abated somewhat, perhaps with the rapid growth itself instilling a sense that the current situation is adequate to deliver strong economic performance. In the years ahead, to support continued rapid growth and to ensure that its benefits are widely shared, leading to poverty reduction, policymakers will need to address both longstanding and new challenges.

UNITED REPUBLIC OF TANZANIA
INTERNATIONAL MONETARY FUND 19
38. In the fiscal area, policy action will be needed to preserve fiscal sustainability. Pressures to increase spending reflect genuine needs in areas that may be expected to foster inclusive growth. Priority areas identified by the authorities include infrastructure, education, health, and essential social services. Meanwhile, a declining trend in grants has made deficit reduction more challenging. The need to finance additional spending while reducing the fiscal deficit has occasionally led to optimistic revenue assumptions, as evidenced during the current fiscal year. The near term priority for 2013/14 is to contain expenditures within the limits set in the mid-year review and to make further efforts in revenue administration in order to contain the deficit at about 5 percent of GDP. In 2014/15 and subsequent fiscal years, efforts will be needed to mobilize additional revenues, beginning with the VAT reform, while ensuring that revenue assumptions are realistic, so as to eschew the accumulation of new arrears and to avoid abrupt expenditure cuts during budget execution.
39. Improving public financial management remains a priority. In particular, guidelines to prevent arrears accumulation need to be implemented and a plan is required for the gradual reduction of the existing stock, with appropriate verification and safeguards. More generally, the accuracy and timeliness of fiscal data is necessary for better informed policymaking. Priority areas include: a net reduction in the stock of arrears; diminished use of expenditure floats at the end of the fiscal year; and more timely compilation of fiscal outturn data consistent with financing data.
40. A key challenge will be to set up appropriate institutional arrangements to ensure that any gains from natural resources accrue to the benefit of all citizens. In the next few years, this will involve establishing a clear taxation framework that retains good revenues for citizens while providing reassurance to natural gas companies that their investments will remain worthwhile; transparency in the contracts signed with private companies; a fiscal framework that smoothes the use of natural resources and aims at intergenerational equity; ensuring that all spending financed by natural resource revenues (including those collected by public enterprises involved in the sector) is determined and undertaken through the general budget process and is subject to the same degree of public scrutiny as that financed by other revenues.
41. More generally, there is a need to improve the monitoring and management of fiscal risks. Although the baseline trajectory of public debt remains sustainable, significant fiscal risks may not be captured in the current headline central government deficit and debt data. Some sources of fiscal risks relate to possible macroeconomic shocks, such as a halt in the exceptional economic growth performance experienced during the past decade. Other risk sources stem from the need to improve the quality and timeliness of information on the fiscal accounts for both the central government and other public sector entities. In particular, more timely compilation and disclosure of improved information on the public enterprises’ profit and loss accounts would be warranted. Some public enterprises are profitable and carry implicit guarantees, yet they contribute little central government revenues; others are loss-making and periodically require transfers. It is also important to ensure that the central government settles its obligations vis-à-vis the pension funds in a timely manner, and that pension funds are not used

UNITED REPUBLIC OF TANZANIA
20 INTERNATIONAL MONETARY FUND
to finance government activities. Disclosure and management of fiscal risks will become even more important as member countries prepare to enter the East African monetary union, to reduce vulnerabilities for both individual countries and the union as a whole.
42. Greater focus on international competitiveness may be warranted. As the economy becomes ever more integrated in international markets—with further opening up of the financial account and increasing foreign direct investment—more powerful external shocks and the need to foster the creation of a more diversified export sector call for enhanced attention to preserve international competitiveness. This reinforces the need for the exchange rate to fully reflect market conditions; for non-tariff barriers to be reduced, so as to exploit economies of scale in a larger economic area; for deregulation to curb any remaining impediments to export-oriented businesses; and for an improved business climate to attract both domestic and international investors. Indeed, the fuller establishment of export-oriented businesses in a wide range of economic sectors before offshore natural gas comes on stream would facilitate public discourse and economic policy choices that reflect a more diversified set of interests in the years ahead.
43. The frameworks for monetary policy and financial supervision will need to keep pace with the economy’s modernization and its growing international integration. Initial steps toward a monetary policy framework centered on a greater role for interest rates appropriately include the analysis of the relationship between interest rates and the monetary aggregates, and enhanced focus on developments in interest rates as an indication of the current stance of monetary policy. The authorities are also encouraged to review the functioning of the foreign exchange market and to consider moving to a more modern auction system. In the financial sector, technological innovations and international integration are creating new opportunities for financial deepening and inclusion, but also call for speedy implementation of reforms of the financial supervision framework to reduce or manage any ensuing vulnerabilities. A priority is to ensure effective collaboration among regulators, both domestically and with international counterparts.
44. The authorities’ resolve to meet these challenges has been evident in their policy actions. Indeed, the authorities have addressed previous slippages in the program (¶15 and Appendix 1). On the basis of actions taken, staff supports the authorities’ requests for a waiver for nonobservance of a performance criterion and completion of the last review under the SCF and for completion of the financing assurances review.
45. It is recommended that the next Article IV consultation with Tanzania be held on a 12-month cycle.

UNITED REPUBLIC OF TANZANIA
INTERNATIONAL MONETARY FUND 21
Figure 1. Tanzania: Real Sector and External Developments
Sources: Tanzanian authorities and IMF staff calculations.
0
2
4
6
8
10
122
00
2
20
03
20
04
20
05
20
06
20
07
20
08
20
09
20
10
20
11
20
12
20
13
Real GDP growth has remained robust with strong performance in manufacturing and services...
GDP Manufacturing Services
percent
-2
0
2
4
6
8
10
12
20
02
20
03
20
04
20
05
20
06
20
07
20
08
20
09
20
10
20
11
20
12
20
13
… and a recent recovery in power generation.
Power generationpercent change
0
500
1,000
1,500
2,000
2,500
3,000
3,500
4,000
4,500
5,000
0
1
2
3
4
5
6
7
8
9 Gross reserves cover of imports recovered slightly
USD million (rhs)
Month of Imports
0
2
4
6
8
10
12
14
16 ...partly reflecting lower capital inflows
FDI Foreign assistance
percent of GDP
2
7
12
17
22
27 Despite the decline in the value of exports during the past year…
Exports of goods Gold exports
percent of GDP
0
5
10
15
20
25
30...lower imports helped improve the external current
account
Oil imports Non-oil imports CA deficit (-)
percent of GDP

UNITED REPUBLIC OF TANZANIA
22 INTERNATIONAL MONETARY FUND
Figure 2. Tanzania: Fiscal Developments
Sources: : Tanzanian authorities and IMF staff calculations.
0
2
4
6
8
10
12
14
16
18 Tax RevenuesPercent of GDP
Import duties VAT Excises Income taxes Other
0
5
10
15
20
25
30 ExpenditurePercent of GDP
Wages and salaries Interest payments
Goods, services, transfers Development expenditure
-12
-10
-8
-6
-4
-2
0
Fiscal BalancePercent of GDP
SR projections Actual
-5
5
15
25
35
45
55
65 Public DebtPercent of GDP
Domestic External
5
10
15
20
25
30 EAC Tax RevenuePercent of GDP
Burundi Kenya Rwanda
Tanzania Uganda
BDI
KEN
RWA
TZA
UGA
0
5
10
15
20
25
30
35
40
45
5 6 7 8 9
Tax-
to-G
DP
rat
io (%
)
Log of GDP per capita (US$)
Tax Revenue and GDP per Capita, 2012
UNITED REPUBLIC OF TANZANIA
INTERNATIONAL MONETARY FUND 23
Figure 3. Tanzania: Inflation, Exchange Rate and Monetary Developments
Sources: Tanzanian authorities and IMF staff calculations
0
5
10
15
20
252
00
5M
6
20
05
M1
2
20
06
M6
20
06
M1
2
20
07
M6
20
07
M1
2
20
08
M6
20
08
M1
2
20
09
M6
20
09
M1
2
20
10
M6
20
10
M1
2
20
11
M6
20
11
M1
2
20
12
M6
20
12
M1
2
20
13
M6
20
13
M1
2
Inflationin percent, Y-o-Y
Headline Core
0
5
10
15
20
25
20
10
M1
0
20
10
M1
2
20
11
M2
20
11
M4
20
11
M6
20
11
M8
20
11
M1
0
20
11
M1
2
20
12
M2
20
12
M4
20
12
M6
20
12
M8
20
12
M1
0
20
12
M1
2
20
13
M2
20
13
M4
20
13
M6
20
13
M8
20
13
M1
0
20
13
M1
2
Contribution to Inflationin percent, Y-o-Y
Food Fuels Core
1000
1100
1200
1300
1400
1500
1600
1700
1800
20
05
M1
20
05
M7
20
06
M1
20
06
M7
20
07
M1
20
07
M7
20
08
M1
20
08
M7
20
09
M1
20
09
M7
20
10
M1
20
10
M7
20
11
M1
20
11
M7
20
12
M1
20
12
M7
20
13
M1
20
13
M7
Exchange RateTsh/USD
55
65
75
85
95
105
115
125
20
05
M1
20
05
M7
20
06
M1
20
06
M7
20
07
M1
20
07
M7
20
08
M1
20
08
M7
20
09
M1
20
09
M7
20
10
M1
20
10
M7
20
11
M1
20
11
M7
20
12
M1
20
12
M7
20
13
M1
20
13
M7
Effective Exchange RatesIndex 2005 =100
NEER (ep) REER (ep)
0
5
10
15
20
25
30
35
20
05
M6
20
05
M1
2
20
06
M6
20
06
M1
2
20
07
M6
20
07
M1
2
20
08
M6
20
08
M1
2
20
09
M6
20
09
M1
2
20
10
M6
20
10
M1
2
20
11
M6
20
11
M1
2
20
12
M6
20
12
M1
2
20
13
M6
20
13
M1
2
Interest Ratesin percent
Lending T-Bill Interbank
0
2
4
6
8
10
12
14
16
18
20
0
5
10
15
20
25
30
35
40
45
20
09
M1
20
09
M4
20
09
M7
20
09
M1
02
01
0M
12
01
0M
42
01
0M
72
01
0M
10
20
11
M1
20
11
M4
20
11
M7
20
11
M1
02
01
2M
12
01
2M
42
01
2M
72
01
2M
10
20
13
M1
20
13
M4
20
13
M7
20
13
M1
0
Money, private sector credit and inflationin percent, Y-o-Y
M3 Private sector credit
Reserve money Inflation (rhs)

UNITED REPUBLIC OF TANZANIA
24 INTERNATIONAL MONETARY FUND
Figure 4. EAC: Financial Soundness Indicators, 2009–2012 (in percent)
Source: Tanzanian authorities.
p
15
16
17
18
19
20
21
22
23
24
25
2009 2010 2011 2012
Capital Adequacy BurundiKenyaRwandaTanzaniaUgandaCapital to risk-weighted
0.0
0.5
1.0
1.5
2.0
2.5
3.0
3.5
4.0
4.5
2009 2010 2011 2012
Return on AssetsBurundiKenyaRwandaTanzaniaUganda
0
10
20
30
40
50
60
70
80
90
100
2009 2010 2011 2012
Liquid Assets to Total AssetsBurundi
Kenya
Tanzania
0
2
4
6
8
10
12
14
2009 2010 2011 2012
NPLs to Gross Loans BurundiKenyaRwandaTanzaniaUganda

UNITED REPUBLIC OF TANZANIA
INTERNATIONAL MONETARY FUND 25
Figure 5. International Comparison of Macroeconomic Fundamentals1
1 The EAC averages exclude Tanzania.Sources: World Economic Outlook database and Fund staff calculations.
0
1
2
3
4
5
6
7
8
Tanzania EAC average SSA median LIC median
GDP Growth: Average for 2004-13 (percent)
0
1
2
3
4
5
6
7
8
9
Tanzania EAC average SSA median LIC median
Average CPI Inflation, 2013(percent)
-16
-14
-12
-10
-8
-6
-4
-2
0
Tanzania EAC average SSA median LIC median
Current Account Balance, 2013(percent of GDP)
3.0
3.2
3.4
3.6
3.8
4.0
4.2
Tanzania EAC average SSA median LIC median
International Reserves, 2013(months of prospective imports of goods and services)
-7
-6
-5
-4
-3
-2
-1
0
Tanzania EAC average SSA median LIC median
Fiscal Deficit, 2013(percent of GDP)
20
25
30
35
40
45
Tanzania EAC average SSA median LIC median
Public Debt, 2013(percent of GDP)

UNITED REPUBLIC OF TANZANIA
26 INTERNATIONAL MONETARY FUND
Table 1. Tanzania: Selected Economic and Financial Indicators, 2010/11–2017/18
2010/11 2011/12 2014/15 2015/16 2016/17 2017/18
Prog.1 Prel. Prog.1 Proj. Proj. Proj. Proj. Proj.
National income and prices Nominal GDP (in billions of TSh) 34,913 41,125 48,264 48,348 55,228 55,559 63,263 71,718 80,801 90,810
Real GDP growth (calendar year) 2 6.4 6.9 7.0 7.0 7.2 7.2 7.0 7.1 7.0 6.8Real GDP growth 6.7 6.7 7.0 6.9 7.1 7.1 7.1 7.1 7.0 6.9Consumer prices (period average) 7.0 17.8 11.6 11.3 7.2 5.8 5.1 5.0 5.0 5.0Consumer prices (end of period) 10.9 17.4 9.5 7.6 6.0 5.0 5.0 5.0 5.0 5.0GDP deflator (period average) 8.1 10.3 … 10.0 … 7.4 6.3 5.9 5.3 5.1
External sector Exports, f.o.b (in billions of U.S. dollars) 4.9 5.6 5.9 5.4 6.5 5.5 6.1 6.6 7.3 7.9Imports, f.o.b. (in billions of U.S. dollars) 8.0 10.6 11.0 10.5 12.3 11.5 12.4 13.3 14.3 15.6Export volume 10.9 8.9 2.0 -2.2 12.6 9.7 12.7 10.7 10.6 9.1Import volume 6.2 28.8 3.2 -2.0 10.2 10.1 9.1 8.7 8.0 8.9Terms of trade 1.2 1.6 3.4 -1.5 -2.5 -6.9 -1.3 0.2 -0.5 0.3
Nominal effective exchange rate (end of period; depreciation= -)3 -17.7 6.4 0.6 1.2 ... ... ... ... ... ...
Real effective exchange rate (end of period; depreciation= -)3 -13.6 21.5 6.0 6.1 ... ... ... ... ... ...
Money and creditBroad money (M3) 22.0 10.9 14.5 14.9 13.0 14.5 15.5 14.8 14.1 13.8Average reserve money 19.3 14.2 15.7 14.5 11.9 14.9 13.9 13.4 12.7 12.4Credit to nongovernment sector 24.3 18.6 17.4 17.1 13.9 16.6 14.4 14.6 13.5 16.3Velocity of money (GDP/M3; average) 3.2 3.2 3.3 3.3 3.4 3.4 3.3 3.3 3.3 3.2Treasury bill interest rate (in percent; end of period) 4.8 13.8 … 13.9 … … … … … …
Public FinanceRevenue (excluding grants) 16.4 17.6 18.1 17.5 19.9 18.6 19.3 19.5 19.5 19.5Total grants 4.7 4.5 3.7 3.4 4.2 3.4 3.2 3.5 3.0 3.0Expenditure4 27.0 26.2 27.6 27.8 29.1 27.2 27.4 27.1 26.5 26.6Overall balance (excluding grants)5 -11.4 -8.6 -9.5 -10.3 -9.2 -8.7 -8.1 -7.5 -7.0 -7.0Overall balance (including grants)5 -6.6 -5.0 -5.8 -6.8 -5.0 -5.2 -4.9 -4.0 -4.0 -4.0Domestic financing (excluding gas pipeline financing) 3.6 0.8 1.0 2.2 1.0 1.1 1.0 0.5 0.7 0.7Domestic debt stock (end of period)6 9.6 11.1 10.4 11.6 10.1 10.1 9.8 9.2 8.9 8.5
Total public debt6,7 39.4 39.8 41.6 40.8 43.3 41.2 42.2 41.9 42.2 42.3
Savings and investmentResource gap (net exports of goods and services) -15.3 -17.6 -16.7 -15.6 -15.6 -14.8 -14.0 -12.9 -12.0 -11.4Investment 34.5 35.5 39.2 34.4 38.3 33.4 32.1 31.5 31.5 31.6
Government 8.5 8.7 9.1 8.6 8.9 8.5 8.5 8.4 8.3 8.3
Nongovernment8 26.0 26.8 30.2 25.8 29.4 24.9 23.6 23.1 23.2 23.3Gross domestic savings 19.3 18.0 22.6 18.8 22.7 18.6 18.2 18.6 19.5 20.2
External sectorCurrent account balance (excluding current transfers) -12.5 -20.8 -16.0 -15.7 -17.0 -15.7 -14.5 -13.3 -12.7 -12.2Current account balance (including current transfers) -9.4 -18.4 -14.3 -14.0 -15.2 -14.5 -13.3 -12.3 -11.7 -11.3
Balance of payments Current account balance (excluding current transfers; deficit= -) -3.0 -5.4 -4.8 -4.8 -5.7 -5.4 -5.6 -5.7 -6.0 -6.3Gross official reserves (end of period) 3.6 3.8 4.2 4.4 4.5 4.6 5.2 5.6 6.2 6.8
In months of imports of goods and services (current year) 4.3 3.5 3.8 4.1 3.6 3.9 4.0 4.1 4.2 4.3Total external debt stock (end of period; percent of GDP)7 33.1 34.4 35.0 35.7 36.8 36.9 37.8 37.5 37.6 37.8
Sources: Tanzanian authorities and IMF staff estimates and projections.1 From the sixth review under the PSI and the second review under the SCF arrangement. 2 E.g. Calendar year corresponding to 2011/12 is 2012.3 The figure for 2012/13 reflects the change from July 2012 through June 2013.4 Including unidentified fiscal measures.5 Actual and preliminary data include adjustment to cash basis. 6 Net of Treasury bills issued for liquidity management.7 Excludes external debt under negotiation for relief, and domestic unpaid claims (reported in Table 2b). 8 Including change in stocks.
(Billions of U.S. dollars, unless otherwise indicated)
(Percent of GDP)
(Annual percentage change, unless otherwise indicated)
2012/13 2013/14

UNITED REPUBLIC OF TANZANIA
INTERNATIONAL MONETARY FUND 27
Table 2a. Tanzania: Central Government Operations, 2010/2011–2017/181 (Billions of Tanzanian Shillings)
2014/15 2015/16 2016/17 2017/18
Prog.6 Prel. Prog.6 Budget Proj. Proj. Proj. Proj. Proj.
Total revenue 5,739 7,221 8,758 8,443 10,999 11,538 10,197 12,200 14,009 15,784 17739
Tax revenue 5,296 6,480 7,937 7,730 9,885 10,395 9,410 11,099 12,762 14,378 16159
Import duties 449 498 648 584 876 852 782 850 964 1,086 1220
Value-added tax 1,531 1,975 2,309 2,146 2,722 2,590 2,366 3,119 3,715 4,185 4703
Excises 1,052 1,029 1,287 1,258 1,696 1,909 1,609 1,832 2,076 2,339 2629
Income taxes 1,660 2,247 2,835 3,034 3,351 3,657 3,399 3,870 4,388 4,943 5556
Other taxes 604 732 858 707 1,240 1,388 1,254 1,428 1,619 1,824 2050
Nontax revenue2 443 741 822 713 1,114 1,142 787 1,101 1,248 1,406 1580
LGA 158 196 284 221 373 383 268 378 428 483 542
Other 285 545 537 492 741 759 519 723 819 923 1037
Total expenditure 9,439 10,765 13,341 13,543 16,053 16,708 14,926 17,463 19,410 21,456 24124
Recurrent expenditure 6,690 6,990 9,035 9,444 10,958 11,063 10,267 11,951 13,362 15,070 16889
Wages and salaries 2,346 2,722 3,326 3,350 4,246 4,246 4,336 4,871 5,522 6,222 6992
Interest payments 353 436 667 767 995 995 1,052 1,066 1,071 1,134 1327
Domestic 285 345 478 590 617 617 788 726 706 706 721
Foreign3 68 91 189 177 377 377 264 340 365 428 606
Goods and services and transfers2 3,991 3,831 5,042 5,328 5,718 5,822 4,879 6,015 6,768 7,714 8570
Of which : Transfers to TANESCO … … 564 401 173 273 353 … … … …
Development expenditure 2,749 3,775 4,306 4,099 5,095 5,645 4,659 5,511 6,048 6,386 7234
Domestically financed 985 1,872 2,113 1,914 2,471 2,953 2,600 2,887 3,095 3,476 3919
Foreign (concessionally) financed 1,764 1,902 2,193 2,185 2,624 2,692 2,059 2,624 2,953 2,910 3316
Overall balance before grants -3,701 -3,543 -4,582 -5,101 -5,054 -5,170 -4,729 -5,263 -5,400 -5,672 -6385
Grants 1,627 1,855 1,777 1,728 2,320 2,390 1,832 2,133 2,510 2,424 2724
Program (including basket grants)4 1,062 1,021 825 818 973 1,043 830 821 1,076 1,212 1362
Of which: basket grants 335 301 285 281 196 266 266 279 359 404 454
Project 566 834 952 910 1,347 1,347 1,002 1,312 1,434 1,212 1362
Net expenditure float5 -297 168 0 259 0 … 0 0 0 0 0
Statistical discrepancy 49 -550 0 -168 0 … 0 0 0 0 0
Overall balance after grants (cash basis) -2,321 -2,070 -2,805 -3,282 -2,734 -2,780 -2,896 -3,130 -2,890 -3,248 -3,660
Financing 2,321 2,070 2,805 3,282 2,734 2,780 2,896 3,130 2,890 3,248 3660
Foreign (net) 1,077 1,735 2,689 2,579 3,331 2,808 3,247 2,870 2,515 2,671 3066
Foreign loans 1,119 1,816 2,906 2,706 3,722 3,198 3,441 3,249 3,043 3,394 3950
Program (including basket loans)4 394 419 628 544 625 621 624 533 574 606 681
Of which: basket loans 221 172 264 186 236 234 199 179 192 203 228
Project 643 595 692 734 844 844 591 855 968 1,091 1271
Nonconcessional borrowing 82 801 1,586 1,428 2,252 1,733 2,226 1,861 1,501 1,697 1998
Of which : gas pipeline … … 368 365 1,149 577 1,144 389 … … …
Amortization -43 -80 -217 -127 -390 -390 -194 -380 -529 -723 -884
Domestic (net) 1,244 335 116 703 -597 -28 -351 260 375 578 594
Of which : excluding gas pipeline 1244 335 484 1068 552 549 793 649 375 578 594
Bank financing 1,259 10 99 668 398 497 556 357 207 318 327
Nonbank financing -15 324 17 35 -995 -525 238 292 169 260 267
Of which : credit to TPDC (gas pipeline) … … -368 -365 -1,149 -577 -1,144 -389 … … …
Memorandum items:
Nominal GDP 34,913 41,125 48,264 48,348 55,228 55,559 55,559 63,263 71,718 80,801 90,810
Sources: Ministry of Finance; Bank of Tanzania; and IMF staff projections.
1 Fiscal year: July–June.
3 Excludes interest payments on external debt obligations that are under negotiation for relief with a number of creditors.4 Basket funds are sector-specific accounts established by the government to channel donor support to fund-specific activities.
6 From the sixth review under the PSI and the second review under the SCF arrangement.
5 The gross expenditure float for a fiscal year Y relates to expenditures that are recorded in Y, but for which the payment is made—and thus the financing is recorded—in the following fiscal year, Y+1. The net expenditure float for fiscal year Y is the difference between the gross expenditure float for Y and the gross expenditure float for the previous fiscal year, Y-1; in other words, the net expenditure float for Y relates to expenditures recorded in Y whose financing was recorded in Y+1, minus the additional financing that occurred in Y for expenditures that were recorded in Y-1.
2 Local Government Authorities' own revenues and the equal amount of transfers, are included starting from FY2009/10.
2010/11 2012/132011/12 2013/14

UNITED REPUBLIC OF TANZANIA
28 INTERNATIONAL MONETARY FUND
Table 2b. Tanzania: Central Government Operations, 2010/11–2017/181 (Percent of GDP)
2014/15 2015/16 2016/17 2017/18
Prog.6 Prel. Prog.6 Budget Proj. Proj. Proj. Proj. Proj.
Total revenue 16.4 17.6 18.1 17.5 19.9 20.8 18.4 19.3 19.5 19.5 19.5
Tax revenue 15.2 15.8 16.4 16.0 17.9 18.7 16.9 17.5 17.8 17.8 17.8
Import duties 1.3 1.2 1.3 1.2 1.6 1.5 1.4 1.3 1.3 1.3 1.3
Value-added tax 4.4 4.8 4.8 4.4 4.9 4.7 4.3 4.9 5.2 5.2 5.2
Excises 3.0 2.5 2.7 2.6 3.1 3.4 2.9 2.9 2.9 2.9 2.9
Income taxes 4.8 5.5 5.9 6.3 6.1 6.6 6.1 6.1 6.1 6.1 6.1
Other taxes 1.7 1.8 1.8 1.5 2.2 2.5 2.3 2.3 2.3 2.3 2.3
Nontax revenue2 1.3 1.8 1.7 1.5 2.0 2.1 1.4 1.7 1.7 1.7 1.7
LGA 0.5 0.5 0.6 0.5 0.7 0.7 0.5 0.6 0.6 0.6 0.6
Other 0.8 1.3 1.1 1.0 1.3 1.4 0.9 1.1 1.1 1.1 1.1
Total expenditure 27.0 26.2 27.6 28.0 29.1 30.1 26.9 27.6 27.1 26.6 26.6
Recurrent expenditure 19.2 17.0 18.7 19.5 19.8 19.9 18.5 18.9 18.6 18.7 18.6
Wages and salaries 6.7 6.6 6.9 6.9 7.7 7.6 7.8 7.7 7.7 7.7 7.7
Interest payments 1.0 1.1 1.4 1.6 1.8 1.8 1.9 1.7 1.5 1.4 1.5
Domestic 0.8 0.8 1.0 1.2 1.1 1.1 1.4 1.1 1.0 0.9 0.8
Foreign3 0.2 0.2 0.4 0.4 0.7 0.7 0.5 0.5 0.5 0.5 0.7
Goods and services and transfers2 11.4 9.3 10.4 11.0 10.4 10.5 8.8 9.5 9.4 9.5 9.4Of which : Transfers to TANESCO … … 1.2 0.8 0.3 0.5 0.6 … … … …
Development expenditure 7.9 9.2 8.9 8.5 9.2 10.2 8.4 8.7 8.4 7.9 8.0
Domestically financed 2.8 4.6 4.4 4.0 4.5 5.3 4.7 4.6 4.3 4.3 4.3
Foreign (concessionally) financed 5.1 4.6 4.5 4.5 4.8 4.8 3.7 4.1 4.1 3.6 3.7
Overall balance before grants -10.6 -8.6 -9.5 -10.5 -9.2 -9.3 -8.5 -8.3 -7.5 -7.0 -7.0
Grants 5.2 5.0 3.7 3.6 4.2 4.3 3.3 3.4 3.5 3.0 3.0
Program (including basket grants)4 3.0 2.5 1.7 1.7 1.8 1.9 1.5 1.3 1.5 1.5 1.5
Of which: basket grants 1.0 0.7 0.6 0.6 0.4 0.5 0.5 0.4 0.5 0.5 0.5
Project 1.6 2.0 2.0 1.9 2.4 2.4 1.8 2.1 2.0 1.5 1.5
Net expenditure float5 -0.8 0.4 0.0 0.5 0.0 … 0.0 0.0 0.0 0.0 0.0
Statistical discrepancy 0.1 -1.3 0.0 -0.3 0.0 … 0.0 0.0 0.0 0.0 0.0
Overall balance after grants (cash basis) -6.6 -5.0 -5.8 -6.8 -5.0 -5.0 -5.2 -4.9 -4.0 -4.0 -4.0
Financing 6.6 5.0 5.8 6.8 5.0 5.0 5.2 4.9 4.0 4.0 4.0
Foreign (net) 3.1 4.2 5.6 5.3 6.0 5.1 5.8 4.5 3.5 3.3 3.4
Foreign loans 3.2 4.4 6.0 5.6 6.7 5.8 6.2 5.1 4.2 4.2 4.4
Program (including basket loans)4 1.1 1.0 1.3 1.1 1.1 1.1 1.1 0.8 0.8 0.8 0.8
Of which: basket loans 0.6 0.4 0.5 0.4 0.4 0.4 0.4 0.3 0.3 0.3 0.3
Project 1.8 1.4 1.4 1.5 1.5 1.5 1.1 1.4 1.4 1.4 1.4
Nonconcessional borrowing 0.2 1.9 3.3 3.0 4.1 3.1 4.0 2.9 2.1 2.1 2.2
Of which : gas pipeline … … 0.8 0.8 2.1 1.0 2.1 0.6 … … …
Amortization -0.1 -0.2 -0.4 -0.3 -0.7 -0.7 -0.3 -0.6 -0.7 -0.9 -1.0
Domestic (net) 3.6 0.8 0.2 1.5 -1.1 -0.1 -0.6 0.4 0.5 0.7 0.7
Of which : excluding gas pipeline … … 1.0 2.2 1.0 1.0 1.4 1.0 0.5 0.7 0.7
Bank financing 3.6 0.0 0.2 1.4 0.7 0.9 1.0 0.6 0.3 0.4 0.4
Nonbank financing 0.0 0.8 0.0 0.1 -1.8 -0.9 0.4 0.5 0.2 0.3 0.3
Of which : credit to TPDC (gas pipeline) … … -0.8 -0.8 -2.1 -1.0 -2.1 -0.6 … … …
Memorandum items:
Domestic unpaid claims (end-period, in percent of GDP)7 1.1 0.5 … 1.0 … … 1.6 … … … …
Recurrent expenditures (percent of recurrent resources) 103 88 97 105 93 90 95 94 91 91 91
Sources: Ministry of Finance; Bank of Tanzania; and IMF staff projections.
1 Fiscal year: July–June.
3 Excludes interest payments on external debt obligations that are under negotiation for relief with a number of creditors.4 Basket funds are sector-specific accounts established by the government to channel donor support to fund-specific activities.
6 From the sixth review under the PSI and the second review under the SCF arrangement. 7 Payment claims owed by the government outstanding more than 90 days.
2 Local Government Authorities' own revenues and the equal amount of transfers, are included starting from FY2009/10.
2013/14
5 The gross expenditure float for a fiscal year Y relates to expenditures that are recorded in Y, but for which the payment is made—and thus the financing is recorded—in the following fiscal year, Y+1. The net expenditure float for fiscal year Y is the difference between the gross expenditure float for Y and the gross expenditure float for the previous fiscal year, Y-1; in other words, the net expenditure float for Y relates to expenditures recorded in Y whose financing was recorded in Y+1, minus the additional financing that occurred in Y for expenditures that were recorded in Y-1.
2010/11 2011/12 2012/13

UNITED REPUBLIC OF TANZANIA
INTERNATIONAL MONETARY FUND 29
Table 3. Tanzania: Monetary Accounts, 2012–2015 (Billions of Tanzania Shillings, unless otherwise indicated; end of period)
March June Sept Dec March June
Act. Prog.1 Act. Prog.1 Act. Prog.1 Prel. Proj. Proj. Proj. Proj. Proj. Proj.
Bank of Tanzania
Net foreign assets 5,385 5,856 5,691 5,797 5,840 6,159 6,092 6,187 6,298 6,306 6,456 6,862 7,186 7,364Net international reserves 5,847 6,312 6,154 6,259 6,306 6,632 6,560 6,656 6,773 6,774 6,936 7,344 7,673 7,840
(Millions of U.S. dollars) 3,720 3,968 3,776 3,905 3,840 4,132 3,976 4,216 4,231 4,174 4,256 4,489 4,671 4,754Net non-reserve foreign assets -461 -456 -463 -462 -466 -473 -469 -468 -475 -468 -480 -482 -487 -476
Net domestic assets -860 -1,141 -764 -879 -688 -1,068 -891 -1,160 -899 -622 -593 -864 -992 -907Credit to government -196 -581 -350 -268 -450 -489 -577 -500 -534 -511 -532 -552 -573 -593
Of which: Excluding counterpart of liquidity paper 723 612 768 1,089 668 673 541 1,000 966 989 969 948 928 907
Other items (net) -664 -560 -414 -611 -237 -578 -314 -660 -365 -111 -61 -312 -419 -314REPOs 0 0 -20 -48 -20 -25 -20 -20 -20 -20 -20 -20 -20 -20Other items, excluding REPOs (net) -664 -560 -394 -563 -217 -553 -294 -640 -345 -91 -41 -292 -399 -294
Of which: Credit to nongovernment sector 56 53 51 52 51 52 51 57 57 57 57 57 57 57
Reserve money 4,526 4,716 4,927 4,918 5,152 5,091 5,200 5,028 5,399 5,683 5,862 5,998 6,194 6,457Currency outside banks 2,415 2,393 2,667 2,611 2,758 2,703 2,843 2,764 2,660 2,767 2,858 2,905 2,982 3,086Bank reserves 2,111 2,323 2,260 2,307 2,394 2,388 2,357 2,264 2,738 2,916 3,005 3,093 3,212 3,370
Currency in banks 495 415 587 420 607 483 625 561 496 516 533 542 557 576Deposits 1,616 1,907 1,673 1,887 1,787 1,905 1,732 1,703 2,242 2,400 2,472 2,551 2,656 2,795
Required reserves (calculated) 1,561 1,635 1,435 1,716 1,532 1,753 1,485 1,750 2,063 2,208 2,274 2,348 2,443 2,571Excess reserves (calculated) 54 272 239 171 255 152 247 -47 179 192 197 204 212 223
Memorandum items:Stock of liquidity paper 919 1,192 1,119 1,357 1,119 1,162 1,119 1,500 1,500 1,500 1,500 1,500 1,500 1,500Average reserve money 4,685 4,669 4,884 4,898 5,144 5,137 5,192 5,250 5,366 5,629 5,845 5,973 6,158 6,409
Monetary Survey
Net foreign assets 6,396 6,811 6,739 6,216 6,896 6,692 7,153 6,576 6,693 6,706 6,857 7,265 7,591 7,770Bank of Tanzania 5,385 5,856 5,691 5,797 5,840 6,159 6,092 6,187 6,298 6,306 6,456 6,862 7,186 7,364Commercial banks 1,011 955 1,048 419 1,056 533 1,061 389 394 400 401 403 405 406
Net domestic assets 8,251 8,013 8,568 9,025 8,933 9,241 9,163 9,530 9,948 10,752 11,329 11,379 11,723 12,397Domestic credit 11,030 11,154 11,339 11,786 11,680 12,254 12,098 12,947 13,638 13,917 14,416 14,988 15,545 15,904
Credit to government (net) 2,019 1,818 1,795 2,264 1,795 2,360 1,718 2,555 2,799 2,820 2,909 2,998 3,087 3,177Credit to nongovernment sector 9,010 9,336 9,544 9,522 9,885 9,894 10,380 10,393 10,839 11,097 11,507 11,990 12,458 12,727
Other items (net) -2,779 -3,141 -2,771 -2,761 -2,747 -3,013 -2,935 -3,417 -3,689 -3,164 -3,086 -3,609 -3,822 -3,507
M3 14,647 14,823 15,307 15,241 15,828 15,933 16,316 16,107 16,641 17,458 18,186 18,644 19,314 20,167Foreign currency deposits 3,923 3,892 4,286 3,990 4,432 4,187 4,568 4,216 4,348 4,552 4,733 4,843 5,007 5,218M2 10,725 10,932 11,021 11,251 11,396 11,746 11,747 11,891 12,293 12,905 13,453 13,801 14,306 14,948
Currency in circulation 2,415 2,393 2,667 2,611 2,758 2,703 2,843 2,764 2,660 2,767 2,858 2,905 2,982 3,086Deposits (TSh) 8,310 8,539 8,354 8,640 8,639 9,042 8,905 9,127 9,633 10,138 10,595 10,896 11,324 11,862
Memorandum items:
M3 growth 12.5 14.0 14.5 14.9 12.3 13.6 10.8 10.0 12.3 14.5 14.1 15.8 16.1 15.5M3 (as percent of GDP) 35.6 30.7 29.5 27.4 30.6 28.7 31.5 29.0 30.0 31.4 28.7 29.5 30.5 31.9Private sector credit growth 18.2 21.1 17.4 17.1 15.2 15.3 15.2 15.3 16.1 16.5 16.3 15.4 14.9 14.7Average reserve money growth 11.0 16.3 14.2 14.5 12.2 12.1 10.8 12.1 14.9 14.9 13.8 13.8 14.8 13.9Reserve money multiplier (M3/average reserve money) 3.13 3.17 3.13 3.11 3.08 3.10 3.14 3.07 3.10 3.10 3.11 3.12 3.14 3.15
Nonbank financing of the government (net) 2 27 265 385 401 100 3 227 92 437 238 73 146 219 292
Bank financing of the government (net) 2 424 222 99 668 0 96 -77 291 536 556 89 179 268 357
Bank and nonbank financing of the government (net) 2 450 487 484 1069 100 99 150 382 973 793 162 324 487 649
Sources: Bank of Tanzania and IMF staff estimates and projections.
2 Cumulative from the beginning of the fiscal year (July 1).
1 From the sixth review under the PSI and the second review u
June Sept Dec
(12-month percent change, unless otherwise indicated)
March2012 2013 2014 2015

UNITED REPUBLIC OF TANZANIA
30 INTERNATIONAL MONETARY FUND
Table 4. Tanzania: Balance of Payments, 2010/11–2017/18
(Millions of U.S. dollars, unless otherwise indicated)
2015/16 2016/17 2017/18
Prog.4 Prel. Prog.4 Proj. Prog.4 Proj. Proj. Proj. Proj.
Current account -2,215 -4,736 -4,319 -4,290 -5,085 -5,010 -4,704 -5,161 -5,278 -5,532 -5,822
Trade balance -3,115 -5,047 -5,112 -5,091 -5,717 -6,024 -5,517 -6,371 -6,688 -7,050 -7,621 Exports, f.o.b. 4,896 5,562 5,888 5,391 6,539 5,517 7,244 6,069 6,625 7,260 7,933
Traditional agricultural products 697 785 925 818 1,117 933 1,247 1,037 1,111 1,144 1,178Gold 1,787 2,288 2,206 1,899 2,260 1,688 2,408 1,679 1,741 1,829 1,961Other 2,412 2,489 2,758 2,674 3,163 2,895 3,589 3,353 3,773 4,287 4,794
Imports, f.o.b -8,012 -10,609 -11,000 -10,482 -12,256 -11,541 -12,761 -12,440 -13,313 -14,310 -15,555Of which: Oil -2,155 -3,586 -3,534 -3,923 -3,464 -4,493 -3,328 -4,404 -4,203 -4,129 -4,057
Services (net) 171 88 316 548 176 781 534 960 1,124 1,439 1,758Of which: Travel receipts 1,315 1,431 1,643 1,757 1,831 1,945 2,090 2,191 2,397 2,639 2,910
Income (net) -265 -703 -352 -535 -504 -519 -526 -561 -542 -735 -797Of which : Interest on public debt -46 -64 -119 -113 -228 -139 -259 -148 -219 -250 -280
Current transfers (net) 995 926 829 787 960 752 805 811 828 814 840 Of which : Official transfers 737 625 518 523 589 431 462 429 438 446 455
Capital account 563 778 730 739 963 690 705 868 927 780 850
Of which : Project grants1 499 715 665 676 893 625 631 802 860 708 772
Financial account 2,282 3,414 3,913 4,142 4,394 4,588 4,523 4,873 4,908 5,344 5,667Foreign Direct Investment 1,009 1,574 1,721 1,836 2,279 2,074 2,592 2,575 2,881 3,303 3,501Public Sector, net 730 1,092 1,707 1,701 2,016 2,133 1,343 1,754 1,507 1,660 1,739
Program loans 267 264 394 365 378 512 308 326 344 354 386Non-concessional borrowing 55 505 1,016 920 1,363 1,374 750 1,138 900 1,091 1,133Project loans 436 374 434 465 511 369 543 523 580 637 721
Scheduled amortization2 -29 -51 -136 -49 -236 -121 -259 -232 -317 -422 -501
Commercial Banks, net 371 0 -36 377 0 119 0 129 176 59 59
SDR allocation3 0 0 0 0 0 0 0 0 0 0 0Other private inflows 172 749 521 229 99 263 588 414 344 323 369
Errors and omissions -530 842 0 -134 0 0 0 0 0 0 0
Overall balance 101 298 324 457 272 268 524 580 558 592 695
Financing -101 -298 -324 -457 -272 -268 -524 -580 -558 -592 -695Change in BoT reserve assets (increase= -) -128 -275 -436 -569 -268 -266 -465 -522 -488 -523 -626Use of Fund credit 27 -23 112 112 -3 -2 -59 -59 -70 -70 -70Financing gap 0 0 0 0 0 0 0 0 0 0 0
Memorandum items:Gross official reserves (BoT) 3,610 3,797 4,233 4,357 4,501 4,632 4,810 5,153 5,641 6,164 6,789
Months of imports of goods and services (current year) 4.3 3.5 3.8 4.1 3.6 3.9 3.7 4.0 4.1 4.2 4.3Exports (percent of GDP) 20.7 21.6 19.4 17.6 19.6 15.9 20.0 15.7 15.4 15.4 15.4Exports excl. gold (percent of GDP) 13.1 12.7 12.2 11.4 12.8 11.0 13.3 11.4 11.4 11.5 11.6Imports (percent of GDP) -33.8 -41.1 -36.3 -34.3 -36.7 -33.3 -35.2 -32.2 -31.0 -30.3 -30.2Imports excl. oil (percent of GDP) -24.7 -27.2 -24.7 -21.4 -26.3 -20.3 -26.0 -20.8 -21.2 -21.6 -22.3Current account deficit (percent of GDP) -9.4 -18.4 -14.3 -14.0 -15.2 -14.5 -13.0 -13.3 -12.3 -11.7 -11.3Foreign program and project assistance (percent of GDP) 8.2 7.7 6.6 6.6 7.1 5.6 5.4 5.4 5.2 4.5 4.5
Nominal GDP 23,669 25,805 30,281 30,592 33,426 34,656 36,230 38,666 42,993 47,183 51,492
Sources: Tanzanian authorities and IMF staff estimates and projections.
1 An adjustment to the estimated outturn is made by BoT to reflect unreported project grants. 2 Relief on some projected external debt obligations is being negotiated with a number of creditors.3 In 2009, Tanzania received SDR 147.4 million on August 28 and SDR 11.7 million on September 9 (US$249 million in total).4 From the sixth review under the PSI and the second review under the SCF arrangement.
2010/11 2011/12 2012/13 2013/14 2014/15

UNITED REPUBLIC OF TANZANIA
INTERNATIONAL MONETARY FUND 31
Table 5. Tanzania: Financial Soundness Indicators, 2010–2013
(percent, end of period)
2010 2011 Mar Jun Sep Dec Mar Jun Sep Dec
Access to bank lending
Claims on the non-government sector to GDP 1 18.0 19.9 17.2 18.1 18.9 18.5 20.5 21.2 21.9 23.0
Claims on the private sector to GDP 1 17.2 18.9 16.3 17.0 18.0 17.3 19.3 20.1 21.0 21.9
Capital adequacy Capital to risk-weighted assets 18.5 17.6 18.4 18.0 17.6 17.5 19.5 18.1 18.3 18.2 Capital to assets 10.7 10.5 11.4 11.1 10.8 10.5 11.4 10.8 10.8 11.1
Asset composition and quality Net loans and advances to total assets 44.2 49.2 50.0 50.4 50.0 49.7 48.6 49.0 49.2 50.9
Sectoral distribution of loans Trade 17.5 20.0 19.5 21.3 20.8 20.9 21.4 21.2 20.3 21.0 Mining and manufacturing 14.1 12.6 12.3 11.4 11.4 11.9 12.3 12.3 12.3 12.0 Agricultural production 13.0 13.5 12.7 11.3 12.9 11.2 11.5 11.1 11.1 9.9 Building and construction 6.1 8.2 8.6 8.9 8.9 9.0 9.1 9.2 9.3 9.7 Transport and communication 9.2 7.3 7.8 7.1 7.0 6.9 7.3 7.0 7.4 7.1
Foreign exchange loans to total loans 32.0 33.0 32.8 33.7 33.6 33.5 34.0 34.8 35.6 35.6Gross nonperforming loans (NPLs) to gross loans 9.8 6.7 7.5 8.2 7.5 8.1 7.7 8.1 7.1 6.5NPLs net of provisions to capital 25.9 18.8 19.1 22.7 20.1 22.5 18.0 19.1 16.8 14.3Large exposures to total capital 108.5 141.0 117.6 118.4 113.8 143.7 125.9 139.3 135.9 137.5
Earnings and profitability Return on assets 2.2 2.5 3.0 2.5 2.7 2.6 2.9 2.7 2.6 2.6 Return on equity 12.1 14.5 17.0 13.4 14.4 13.9 16.0 15.1 13.9 13.1 Net interest margin 8.5 8.4 9.9 9.6 9.3 … … … … … Noninterest expenses to gross income 54.5 66.7 64.8 67.9 67.0 67.8 63.5 65.4 66.2 66.9 Personnel expenses to noninterest expenses 40.5 41.6 45.0 43.0 43.0 42.4 45.9 45.5 45.1 43.4
Liquidity Liquid assets to total assets 39.5 36.3 35.1 34.6 34.5 34.0 35.0 34.3 33.3 31.6 Liquid assets to total short term liabilities 45.3 40.1 39.0 39.3 39.1 38.4 40.2 38.4 37.0 36.5 Total loans to customer deposits 58.9 65.2 66.8 68.5 68.3 68.6 68.8 67.9 67.7 71.4 Foreign exchange liabilities to total liabilities 31.9 37.0 33.9 33.6 33.9 34.4 35.2 35.2 35.3 35.1
Source: Bank of Tanzania
1 Calendar year; end of period claims relative to annual GDP.
2012 2013

UNITED REPUBLIC OF TANZANIA
32 INTERNATIONAL MONETARY FUND
Table 6. Tanzania: Risk Assessment Matrix1
Likelihood Shock Vulnerabilities Potential Impact Policy Response Medium Intensification of
pre-election spending pressures.
Lack of fiscal restraint ahead of 2015 elections.
Medium: Fiscal slippages would result in higher deficit and borrowing that could weaken fiscal consolidation efforts and undermine debt sustainability. It could also crowd out critical infrastructure and social spending.
Budget spending should be closely monitored and fiscal slippages addressed promptly.
Medium Delays in construction of the natural gas pipeline and the gas power plants.
Power outages would likely resume; need to subsidize TANESCO further.
Medium: The energy infrastructure projects are critical for reducing cost of power generation and ensuring uninterrupted power supply. Power outages would weaken growth and the subsidies to TANESCO would crowd out critical social and capital expenditures.
Electricity tariffs should be raised to cost recovery levels and adjusted periodically to reflect changing prices of inputs. Alternatively, lower priority spending should be identified in the budget to make room for temporary subsidies and allow gradual tariff adjustment.
Medium Sharp slowdown in growth in China
Decline in Chinese FDI and loans, which have become an important source of financing for infrastructure projects.
Medium: As infrastructure investment is seen as key to removing bottlenecks to growth, delays in funding would weaken growth potential.
The fiscal priorities would have to be revisited to ensure that critical infrastructure projects, especially in the energy sector, are implemented.
Medium Sustained decline in commodity prices triggered by deceleration of global demand and coming-on-stream excess capacity (medium-term)
A considerable decline in natural gas prices could reduce incentives for investment in the natural gas exploration.
Low: The exchange rate and international reserves would come under moderate pressure. Lower FDI would partly be offset by lower imports.
Greater exchange rate flexibility would help maintain external stability and limit reserve losses.
Low Prolonged border tensions with neighbors and/or terrorist attacks
Instability would affect investment and growth.
Medium: Growth prospects could be dampened by a loss of confidence and a slump in investment, budget revenues decline, and balance of payments pressures emerge from lost exports and tourism.
Greater exchange rate flexibility would reduce external pressures, complemented by monetary tightening to limit pressures on reserves and the exchange rate. Automatic fiscal stabilizers should be allowed to operate; cuts in lower priority spending would help to preserve fiscal sustainability.
Low Food price increase caused by supply shocks in the region
With food accounting for almost half of the consumption basket, the shock would cause inflation and hit the poor.
Medium: Pressures on inflation and demands for higher subsidies may emerge.
Careful monitoring of second-round effects on inflation and readiness to tighten monetary policy to counter pressures on core inflation. Targeted social assistance would cushion the impact on poor, but administrative capacity would be a challenge.

UNITED REPUBLIC OF TANZANIA
INTERNATIONAL MONETARY FUND 33
Likelihood Shock Vulnerabilities Potential Impact Policy Response High Side-effects from
global financial conditions: surges in global financial market volatility (related to UMP exit), leading to economic and fiscal stress, and constraints on country policy settings.
While Tanzania’s financial system is relatively closed, it is integrating rapidly into the global system, particularly as EAC integration deepens.
Low: Banks’ loss of access to foreign exchange could lead to disruptive effects on FX liquidity and the ability to cover external obligations, including the current account deficit.
Ensure reserves remain adequate, and where feasible, to gradually raise them. The BoT could also consider loosening banks’ net open positions to allow them to build their own FX reserves.
1The Risk Assessment Matrix (RAM) shows events that could materially alter the baseline path (the scenario most likely to materialize in the view of IMF staff). The relative likelihood of risks listed is the staff's subjective assessment of the risks surrounding the baseline baseline (“low” is meant to indicate a probability below 10 percent, ”medium” a probability between 10 and 30 percent, and “high” a probability of 30 percent or more). The RAM reflects staff views on the source of risks and overall level of concern as of the time of discussions with the authorities. Non mutually exclusive risks may interact and materialize jointly.

UNITED REPUBLIC OF TANZANIA
34 INTERNATIONAL MONETARY FUND
Annex I. Economic Diversification and Growth: Tanzania’s Experience1
1. From the turn of the millennium, economic performance in Tanzania has improved significantly (Figure 1). Growth accelerated markedly, from an average of 3 percent during the 1990s to an average of 6.9 percent during 2001–2012, with per-capita GDP more than doubling since 2000. The economy stabilized, as inflation fell from double to single digits, international reserves increased, and the public debt burden declined substantially (partly thanks to increased foreign aid and debt relief under the HIPC initiative and MDRI in the mid-2000s). Average labor productivity increased by 50 percent in the last decade, 2 and the productivity growth was among the fastest in the region in 2005–11.
Figure 1. Macroeconomic Stabilization
2. Tanzania experienced a significant economic transformation since the 1990s. Its successful diversification away from low value-added agriculture to higher value-added manufacturing and services was likely fostered by macroeconomic stabilization and waves of comprehensive policy and structural reforms that began in the mid-1980s, and accelerated from the mid-1990s to the mid-2000s. These reforms reduced the role of the state in the 1 Prepared by Nikoloz Gigineishvili. 2 Growth in labor productivity is measured as the percentage change in output per worker (in constant prices). The results should be interpreted with particular caution given the weak quality of labor market statistics.
Source: Country authorities and IMF staff estimates.
0
1
2
3
4
5
6
7
8
9
19
95
19
97
19
99
20
01
20
03
20
05
20
07
20
09
20
11
20
13
GDP Growth(percent)
0
5
10
15
20
25
301
99
5
19
97
19
99
20
01
20
03
20
05
20
07
20
09
20
11
20
13
Inflation (percent)
0
5
10
15
20
25
19
95
19
97
19
99
20
01
20
03
20
05
20
07
20
09
20
11
20
13
International Reserves(percent of GDP)
0
2
4
6
8
10
12
19
95
19
97
19
99
20
01
20
03
20
05
20
07
20
09
20
11
20
13
Public Investment(percent of GDP)
Domestically financedForeign financned
0
10
20
30
40
50
60
70
20
01
20
02
20
03
20
04
20
05
20
06
20
07
20
08
20
09
20
10
20
11
20
12
20
13
Public Debt(percent of GDP)
Domestic
External
4
13
24 25 26
0
5
10
15
20
25
30
35
40
45
50
Burundi Kenya Rwanda Uganda Tanzania
Labor Productivity Growth 2005-11 (output per worker, percent change)

UNITED REPUBLIC OF TANZANIA
INTERNATIONAL MONETARY FUND 35
economy and offered fertile grounds for the private sector development, especially in gold mining, manufacturing, tourism, and the financial sector, attracting significant FDI. They covered a broad range of areas including exchange, price and trade liberalization, tax and public finance reforms, introduction of a modern monetary policy and the liberalization of the financial sector, reforms of the public sector and privatization of SOEs, and the onset of regional integration (Box 1). In response, donor support was also scaled up, which helped increase public investment and alleviate poverty.
3. Tanzania’s output concentration decreased steadily over the past decade. Using the Theil index3 to measure output concentration, Tanzanian economy appears more diversified than its peers in the EAC and the SSA (the higher value of the Theil index implies more concentration). Among the EAC countries, only Uganda was more diversified than Tanzania in 2011; Apart from Uganda, in the whole sample of twenty five SSA countries, Tanzania fell behind of only middle-income countries - Lesotho, Mauritius, Namibia, and Zambia.
4. The share of agriculture in total output declined from 30 percent in 2000 to 23 percent in 2011 (Figure 2). Even as the share of agriculture in output and exports declined, the sector itself diversified. Output of high-volume cash crops, such as cotton and coffee, continued to grow, but smaller-volume crops such as cashew nuts, tobacco, and tea grew faster. In addition, agricultural production reoriented toward the domestic market to meet the demands of a rapidly growing population.
3 The Theil index is calculated as T= ∑ , where ∑ and is the share of the sector k in total output. The calculation is based on new IMF in-house database, compiled using information on the sectoral composition of GDP provided by the country authorities to IMF country desks. The dataset contains value added series in constant prices for 12 economy-wide sectors in Africa for the period of 2000–2011. The 12 sectors include agriculture (including forestry and fishing), mining and quarrying, manufacturing, utilities (electricity and water), construction, trade and repairs, hotels and restaurants, transportation and communication, financial intermediation, real estate and business activities, public administration, and other. FISIM and net taxes are excluded. The share of each sector is calculated as a ratio of the value added of a given sector to the sum of all 12 sectors. For some countries, data were not available for all 12 sectors.
0.10
0.15
0.20
0.25
0.30
0.35
0.40
0.45
0.50
0.55
0.60
20
00
20
01
20
02
20
03
20
04
20
05
20
06
20
07
20
08
20
09
20
10
20
11
Output Concentration: Theil Index
SSA (24 countries)
EAC (excl. Tanzania)
Tanzania

UNITED REPUBLIC OF TANZANIA
36 INTERNATIONAL MONETARY FUND
Box 1. Overview of Tanzania’s Policy and Structural Reforms
Reforms of the socialist economy began in the mid-1980s in response to weak growth, high inflation, and a balance of payments crisis (Edwards, 2012; Nord et al, 2009). With the launch of the Economic Recovery Program in 1986, the exchange regime was gradually liberalized to eliminate overvaluation that penalized exporters, first by the introduction of a crawling peg in 1986 and subsequently by full exchange rate unification in 1993, eliminating restrictions on current account transactions and on holdings of foreign currency. In parallel, export and import procedures were simplified, and tariff and non-tariff trade barriers reduced. By 1991 domestic price controls had also been lifted on almost all products (more than 400 prices were regulated in 1990), except for petroleum and public utilities. Further, the private sector was allowed to replace state owned marketing boards (state monopolies), some of underperforming parastatals restructured, and a comprehensive privatization program launched in 1993.
However, reform efforts were derailed in the early 1990s, leading to another episode of weak performance (as well as declining donor support). Eventually, beginning in 1996, the market reform efforts resumed with stronger national ownership. By 2003 most of manufacturing and commercial parastatals have been restructured, liquidated or transferred to private ownership, while non-commercial entities merged into government bodies. To strengthen the business environment, since 2002 business licensing and registration were simplified, labor policies reformed, and property rights strengthened. In the financial sector foreign banks were allowed to enter Tanzanian market from 1992, while state-owned banks were restructured and privatized, or liquidated. Management of public finances was also strengthened through tax policy reforms, including the introduction of VAT in 1998, and improved tax administration. In addition, increased public investment in infrastructure including in the energy sector, has provided a platform for productivity growth in the private sector and expansion of exports.
5. During the same period, manufacturing, construction and services have increased their shares in the economy (Figure 2). Growth in manufacturing was driven primarily by small-scale production aimed at the domestic and regional markets.4 Growth was even faster in construction and non-tradable services such as domestic trade and transport. This reflects partly the liberalization of food crop marketing and subsequent replacement of the underdeveloped distribution system of the previous planned economy by private traders, but also spillover effects from tourism and manufacturing.
4 The Annual Survey of Industrial Production 2008, conducted by Tanzania’s National Bureau of Statistics, reports that 88 percent of manufacturing enterprises employ less than 5 workers, and 97 percent employ less than 10 workers.

UNITED REPUBLIC OF TANZANIA
INTERNATIONAL MONETARY FUND 37
Figure 2. Output Composition 2000–11 (percent)
6. The mining sector—which consists mainly of gold mining—also has grown rapidly, though it remained small. Supported by FDI, its volume expanded from 1.6 percent of output in 2000 to 2.7 percent in 2007 and declined again slightly to 2.3 percent by 2012. On the other hand, in value terms gold has become the single largest export commodity, growing from zero in 2000 to nearly 9 percent of GDP and 40 percent of total exports of goods in 2012, making Tanzania the fourth largest gold exporter in Africa. Growing investments in the sector and the expansion of gold export receipts, however, was largely driven by rapidly rising gold prices, which rose by over 450 percent.
7. With rapid output growth, exports have also expanded and diversified. Overall exports of goods and nonfactor services (GNFS) excluding gold have grown from 12 percent of GDP in 1998 to 20 percent in 2012. Manufacturing exports have grown rapidly, from 3 percent of non-gold GNFS exports to 19 percent (and rose by 3 percentage points of GDP), while traditional exports (coffee, tea, cotton, cashew nuts, tobacco, sisal, cloves) declined from 31 percent to 17 percent of non-gold GNFS exports.
8. The sheer number of export products has increased substantially. The number of distinct products exported by Tanzania rose from about two hundred in 1990 to more than five hundred in 2009. 5 Of these, the number of manufacturing products increased from about 130
5 The product disaggregation is at the 4-digit level of Standard International Trade Classification (SITC) Revision 1.
Agriculture, 29.7
Mining, 1.7Manufact., 9.4
Utilities, 2.9
Construction, 5.8
Wholesale trade, 14.4
Hotels/restaur., 3.1
Transp/communic., 7.4
Fin. Services, 1.7
RE/other serv., 11.7
Public admin., 7.3
other, 4.7
Agriculture, 22.6
Mining, 2.6
Manufact., 10.5
Utilities, 2.7
Construction, 7.9
Wholesale trade, 15.9Hotels/restaur
., 2.4
Transp/communic., 9.1
Fin. Services, 2.3
RE/other serv., 11.2
Public admin., 8.5
other, 4.2
2.0
1.7
1.5
1.2
1.1
0.8
0.5
-0.2
-0.5
-0.5
-0.7
-7.1
-8.0 -6.0 -4.0 -2.0 0.0 2.0 4.0
Construction
Transp/communic.
Wholesale trade
Public admin.
Manufact.
Mining
Fin. Services
Utilities
RE/other serv.
other
Hotels/restaur.
Agriculture
Change 2000-11
(percentage points of GDP)
Tanzania
Agriculture, 36.5
Mining, 0.5Manufact.,
9.3
Utilities, 2.1Construction,
6.1
Wholesale trade, 10.4
Hotels/restaur., 5.8
Transp/communic., 5.3
Fin. Services, 2.7
RE/other serv., 6.0
Public admin., 5.4 other,
10.0
Agriculture, 27.7
Mining, 0.5Manufact.,
8.8
Utilities, 1.8
Construction, 9.0
Wholesale trade, 11.7
Hotels/restaur., 5.3
Transp/communic., 9.0
Fin. Services, 4.2
RE/other serv., 5.5
Public admin., 6.3 other,
10.3
3.6
3.0
1.5
1.3
0.9
0.4
0.0
-0.3
-0.4
-0.5
-0.6
-8.9
-10.0 -8.0 -6.0 -4.0 -2.0 0.0 2.0 4.0 6.0
Transp/communic.
Construction
Fin. Services
Wholesale trade
Public admin.
other
Mining
Utilities
Hotels/restaur.
Manufact.
RE/other serv.
Agriculture
Change 2000-11
(percentage points of GDP)
EAC (excl Tanzania)2000 2011

UNITED REPUBLIC OF TANZANIA
38 INTERNATIONAL MONETARY FUND
to more than three hundred. The picture remains broadly unchanged even when the analysis is restricted to the distinct products with export revenues exceeding US$1 million.
9. With the changing product structure of exports, the geography of Tanzania’s trade has also changed. The share of the EU as a main trade partner declined considerably and new partners emerged. Most importantly this reflects the emergence of gold as a significant source of exports, accounting for a large share of trade with Switzerland and China. At the same time, Tanzania’s regional trade also increased, especially with the EAC and South Africa.
Figure 3. Export of Goods and Services
Lessons and Challenges
10. The Tanzanian economy has diversified noticeably in the past decade. The broad economic liberalization over the past two decades has yielded significant benefits in terms of growth and diversification. External factors, such as rising commodity prices, have also supported investment in new industries and the expansion of output and exports.
Source: Country authorities, WEO, and Fund staff estimates.
0
5
10
15
20
25
30
35
19
98
19
99
20
00
20
01
20
02
20
03
20
04
20
05
20
06
20
07
20
08
20
09
20
10
20
11
20
12
Exports of Goods and Services (percent of GDP)
ServicesOther goodsMinerals (gold)ManufacturingTraditional
0%
20%
40%
60%
80%
100%
19
98
19
99
20
00
20
01
20
02
20
03
20
04
20
05
20
06
20
07
20
08
20
09
20
10
20
11
20
12
Composition of Exports of Goods and Services (excluding gold, share of exports of non-gold GNFS)
Traditional Manufacturing Services Other goods
0
10
20
30
40
50
60
70
80
0
500
1,000
1,500
2,000
2,500
19
98
19
99
20
00
20
01
20
02
20
03
20
04
20
05
20
06
20
07
20
08
20
09
20
10
20
11
20
12
Export of Gold
Export value in US$ million
Gold prices (US$/troy ounce)
Export volume in tons (rhs)
0
100
200
300
400
500
600
700
19
90
19
91
19
92
19
93
19
94
19
95
19
96
19
97
19
98
19
99
20
00
20
01
20
02
20
03
20
04
20
05
20
06
20
07
20
08
20
09
Number of Export Products
Burundi KenyaRwanda TanzaniaUganda

UNITED REPUBLIC OF TANZANIA
INTERNATIONAL MONETARY FUND 39
11. Nevertheless, Tanzania is a low income country with high unemployment and large productivity gap compared with more advanced peers. To achieve a higher level of development, it will therefore need to sustain its recent growth rates, while increasing the share of manufacturing in output, and further broadening of trade. This will require significant upgrading of physical infrastructure, investments in human capital, and improving the business environment, where Tanzania ranks poorly.6 In particular, speeding up the resolution of commercial disputes and rendering tax policy more predictable are perceived as priorities by several entrepreneurs and financial market participants.
12. However, Tanzania’s economy may experience another commodity boom. If the presence of commercial quantities of off-shore gas is confirmed in the near future, the country is likely to receive multi-billion dollar foreign investments in the coming years and become one of the largest exporters of natural gas in the region by 2020. Such a development might quickly lift output, but would also make production and exports dominated by commodities. Tanzania will then face significant policy challenges that are common to many resource-rich countries.7 To avoid loss of competitiveness in other tradables and sustain growth of the manufacturing sector, which is a key ingredient to achieving a middle-income status, additional reforms are needed to strengthen the business environment, remove the remaining non-tariff barriers, and harmonize regional norms and investment rules to develop and fully exploit comparative advantages within and outside the region.
6 The World Bank Group’s Doing Business Survey ranks Tanzania 134 out of 185 economies in 2013, behind Kenya and Uganda and considerably behind Rwanda. 7 For detailed discussions of macroeconomic and policy implications of the natural gas sector see Selected Issues Paper ‘Tanzania: Fiscal Implications of Offshore Natural Gas and Options for Macro-Fiscal Management’.
UNITED REPUBLIC OF TANZANIA
40 INTERNATIONAL MONETARY FUND
REFERENCES
Edwards, S., 2012, “Is Tanzania a Success Story? A Long Term Analysis,” NBER Working Paper 17764, Cambridge MA.
Nord, R., Sobolev, Y., Dunn, D., Hijdenberg, A., Hobdari, N., Maziad, S. and Roudet, S. 2009, “Tanzania: The Story of African Transition”, International Monetary Fund.
Robinson, D., Gaertner, M. and Papageorgiou, C., 2011, “Tanzania: Growth Acceleration and Increased Public Spending with Macroeconomic Stability” in Yes Africa Can: Success Stories from a Dynamic Continent, World Bank, Washington DC.

UNITED REPUBLIC OF TANZANIA
INTERNATIONAL MONETARY FUND 41
Annex II. Tanzania: Exchange Rate Assessment1 1. The real effective exchange rate (REER) appreciated by 33 percent as of January 2014 from August 2011, when it reached its lowest level since 2000. The nominal effective rate (NEER) remained fairly stable over the same period. Real appreciation stemmed from a large positive inflation differential relative to trade partner countries. Meanwhile, the terms of trade remained broadly unchanged. The improvement in relative productivity by 3-4 percent was insufficient to offset the loss of competitiveness from the exchange rate appreciation.
2. Model-based analysis suggests that the shilling is somewhat overvalued compared to what is implied by fundamentals (Table 1). The results are based on several complementary methodologies, similar to those proposed by the IMF’s Consultative Group on Exchange Rate Issues (CGER)2, extended to emerging and developing economies (Vitek, 2013).3 These include macroeconomic balance (MB), external sustainability (ES), purchasing power parity (PPP), and equilibrium real exchange rate (ERER) approaches. In addition, staff estimated an alternative specification of the macroeconomic balance approach by adding foreign direct investments to the list of explanatory variables.
3. The MB and the ES approaches calculate the exchange rate misalignment as the percent change in the real exchange rate that is needed to close a gap between the current account ‘norm’ and the underlying current account. In both cases, the ‘norm’ is determined by economic fundamentals, and is assumed not to be a direct function of the
1 Prepared by Nikoloz Gigineishvili 2 Lee, J, et al., 2008, “Exchange Rate Assessments: CGER Methodologies”, IMF Occasional paper 261. 3 Francis Vitek, 2013, “Exchange Rate Assessment Tools for Advanced, Emerging and Developing Economies”, unpublished. This toolkit includes a database from 1973 to present for 184 countries, including LICs covered by WEO, and panel regression models estimated using generalized method of moments.

UNITED REPUBLIC OF TANZANIA
42 INTERNATIONAL MONETARY FUND
real exchange rate.4 The underlying current account, on the other hand, is defined as a medium-term equilibrium level of the current account (stripped of the temporary and cyclical factors). It is assumed to be driven by external trade (exports and imports), which in turn is a direct function of the real exchange rate. The exchange rate adjustment that is required to bring the underlying current account to its norm is then calculated using trade balance elasticities.
4. The underlying current account for Tanzania is equated to its medium term projection in 2017/18. In 2011/12 the current account deficit widened to about 18 percent of GDP mainly because of a surge in FDI and the increased imports of oil and thermal power generation equipment to offset the drought-related hydro capacity shortages. With the completion of the gas pipeline and new gas-fueled power plants, imports of capital goods are projected to decline. Demand for oil imports is also expected to moderate once cheaper natural gas from domestic fields becomes the major source of power generation. Subsequently, the current account deficit is expected to gradually narrow to 11½ percent of GDP in 2017/18, when all the above temporary factors are phased out. The current account deficit projection for 2017/18 is assumed to be its medium-term equilibrium.5
5. The elasticity of the trade balance with respect to the real effective exchange rate is obtained from two alternative sources - the CGER and Tokarick (2010).6 Assuming that gold exports, which in 2012/13 accounted for about 35 percent of total goods exports and is priced in US dollars, has unit elasticity to the exchange rate, the CGER yields the trade balance elasticity of 0.16.7 The Tokarick estimate of the trade balance elasticity for Tanzania is slightly higher at 0.22. 6. The results of the MB approach are presented in Table 2. The current account norms were calculated using two specifications—the benchmark model, which uses coefficients obtained by Vitek (2013), and an alternative model estimated by staff, which also includes FDI as an explanatory variable to capture the impact of FDI-related imports on the
4 In the MB approach, the current account norm is determined by steady state levels of savings and investments in the medium term, whereas in the ES it is obtained as the current account balance that stabilizes the country’s net foreign assets at a desired level. 5 Until commercial viability of potentially large off-shore natural gas deposits is confirmed, the projections do not incorporate the impact of related foreign direct investments.

UNITED REPUBLIC OF TANZANIA
INTERNATIONAL MONETARY FUND 43
current account. The models imply current account norms of -5.8 and -8.2 percent of GDP respectively compared to the underlying current account balance of -11.6 percent of GDP. These gaps, combined with the elasticities above, suggest overvaluation of the shilling in the range of 15.7–36.2 percent.
6 Tokarick, Stephen, 2010, “A Method for Calculating Export Supply and Import Demand Elasticities”, IMF Working paper WP/10/180. 7 The elasticity of the trade balance with respect to the real effective exchange rate is obtained as follows:
1 , where export elasticity 0.71, import elasticity = 0.92, X and M are exports and imports of goods and services respectively, and Xg is export of gold. By dropping the assumption about unit elasticity of gold exports, the trade balance elasticity becomes 0.15.

UNITED REPUBLIC OF TANZANIA
44 INTERNATIONAL MONETARY FUND
7. The ES approach yields similar overvaluation.8 With nominal GDP growth projected at 12 percent and net foreign assets9 at -64 percent of GDP in 2017/18, the ES methodology yields an estimated current account norm of -7.1 percent of GDP and overvaluation of the shilling by 21–28 percent.
8. The PPP approach suggests an overvaluation of the shilling by about 17 percent. This approach assumes long-term stationarity of the real effective exchange rate and calculates misalignment as a percentage deviation of the real effective exchange rate from its long-term average. The long-term average was calculated from monthly data for the last 10 years (January 2004-December 2013).
9. Finally, the ERER approach implies overvaluation of the shilling by almost 2 percent (Table 4). Unlike the MB and the ES, the ERER models the medium-term equilibrium real exchange rate as a direct function of a set of economic fundamentals. The
8 The current account that stabilizes net foreign assets can be expressed as: , where can is the current account norm, g is nominal GDP growth in steady state, and nfa is the steady state level of net foreign assets. (see Vitek, 2013; or Lee, J, and others., 2008). 9 Net foreign assets are obtained from the External Wealth of Nations database (Lane, P. and Milesi-Ferretti, G.M 2011), and extended through 2017/18 using flow projections for foreign assets and liabilities.

UNITED REPUBLIC OF TANZANIA
INTERNATIONAL MONETARY FUND 45
panel regression is estimated using country-specific fixed effects, and the misalignment is then obtained as a percent deviation of the actual REER from its estimated equilibrium level. The country-specific intercept is derived by equating average ERER (i.e. fitted values from the regression) with the actual average REER for the last 10 years, which implicitly assumes that the average misalignment over the sample period is zero. As can be seen from the regression output below, by far the largest determinant of the equilibrium real exchange rate is relative productivity, a variable that is particularly prone to measurement error, especially for developing countries with relatively weak statistics regarding labor market variables.

UNITED REPUBLIC OF TANZANIA
46 INTERNATIONAL MONETARY FUND
Appendix I. Letter of Intent
Dar es Salaam Tanzania
March 27, 2014
Ms. Christine Lagarde Managing Director International Monetary Fund Washington, D.C. 20431 U.S.A. Dear Madam Lagarde:
The Government of Tanzania requests completion of the last review under the SCF arrangement based on overall performance under the program. In doing so, we request a waiver for the nonobservance of the end-June 2013 performance criterion on net domestic financing, which was breached by 1.2 percent of GDP primarily to offset the revenue shortfalls.
All quantitative indicative targets for September and December 2013 were met with the exception of the floor on tax revenues (addressed through the mid-year budget review), and a marginal breach of the reserve money ceiling in December. A structural benchmark for end-November 2013on VAT reform was also missed.
In order to meet our deficit target of about 5 percent of GDP for 2013/14; the Government took the following corrective measures: (i) on March 20, 2014, in the context of the mid-year budget review, Cabinet approved revisions to the 2013/14 budget, including downward adjustment to the revenue projections and expenditure cuts; (ii) the Cabinet also approved a policy document outlining the main features of the VAT reform, which the Government plans to submit to Parliament in May 2014; and (iii) to improve TANESCO’s financial position and reduce the need for the budget subsidies, electricity tariffs were raised by 40 percent on average starting January 1, 2014.
The Government intends to treat the remaining tranches of the SCF arrangement on a precautionary basis. The Government will continue to maintain close policy dialogue with the Fund. It intends to disseminate this letter and the related Fund staff report, and hereby authorizes the IMF to publish the same on its website after consideration by the Executive Board. Yours Sincerely, /s/ /s/ Hon. Saada Mkuya Salum (MP) Prof. Benno Ndulu MINISTER FOR FINANCE GOVERNOR, BANK OF TANZANIA UNITED REPUBLIC OF TANZANIA UNITED REPUBLIC OF TANZANIA

Table 1. Quantitative Performance Criteria (PC) and Indicative Targets Under the Stand-by Credit Facility Arrangement June–December 2013
Prog 5 Adjusted Preliminary Met? Prog 6Adjusted Preliminary Met? Prog 6
Adjusted Preliminary Met?
Criteria Criteria Criteria
Net domestic financing of the government of Tanzania 484 484 1,069 X 100 400 99 ✓ 150 450 382 ✓(cumulative, ceiling) 1, 2
Average reserve money (upper bound) 3 4,947 4,947 4,898 ✓ 5,195 5,195 5,137 ✓ 5,244 5,244 5,250 XAverage reserve money target 3 4,898 5,144 5,192
Average reserve money (lower bound) 3 4,849 5,093 5,140
Tax revenues (floor; indicative target)1 8,001 8,001 7,785 X 2,369 2,369 2,166 X 4,909 4,909 4,486 X
Priority social spending (floor; indicative target)1 2,066 2,066 2,273 ✓ 570 570 708 ✓ 1,138 1,138 1,321 ✓
273 309 597 ✓ 64 -125 223 ✓ 200 11 310 ✓
Accumulation of external payment arrears (continuous PC ceiling) 0 0 0 ✓ 0 0 0 ✓ 0 0 0 ✓
Contracting or guaranteeing of external debt on
nonconcessional terms (continuous PC ceiling) 7,8 2,688 2,688 2,614 ✓ 3,388 3,388 2,688 ✓ 3,388 3,388 2,768 ✓
Memorandum item:
Foreign program assistance (cumulative grants and loans) 1 785 785 878 406 406 283 602 602 539
External nonconcessional borrowing (ENCB) disbursements to the budget 1 737 737 679 167 167 78 334 334 78
Note: For precise definitions of the aggregates shown and details of the adjustment clauses, see the Technical Memorandum of Understanding (TMU).
1
2
3
4
5
6
7 The ceiling through December 2013 is cumulative from July 1, 2010.8 The cumulative ENCB ceiling of US$3,388 million through December 2013 applies from July 1, 2013.
Standby Credit Facility
June September December
Indicative Target
Cumulative from the beginning of the fiscal year (July 1).
2013 2013
Indicative Target
(Billions of Tanzania Shillings; end of period, unless otherwise indicated)
(Millions of U.S. dollars; end of period)
Change in net international reserves of the Bank of Tanzania (floor) 1, 4
2013
Performance Criteria
To be adjusted upward by up to TSh 300 billion for the U.S. dollar equivalent of a shortfall in the combined total of foreign program assistance and ENCB from the amounts shown in the memorandum item. To be adjusted downward by any ENCB disbursed for budget financing above programmed amount for the year as a whole
Assessment/performance criteria and indicative targets apply to upper bound only.Floor will be adjusted downward by the amount in U.S. dollars of any shortfall in foreign program assistance and ENCB financing of the government up to the equivalent of TSh 300 billion.
From the fifth review under the PSI and the first review under the SCF arrangement.
From the sixth review under the PSI and the second review under the SCF arrangement.
UN
ITEDREPU
BLICO
FTAN
ZANIA
INTERN
ATION
AL MO
NETARY FU
ND
47

UNITED REPUBLIC OF TANZANIA
48 INTERNATIONAL MONETARY FUND
Table 2. Structural Benchmarks under the SCF Arrangement
Benchmark Macroeconomic rationale
Date ¶ Status
1) The Ministry of Finance, Planning Commission, and TRA will prepare a report identifying steps to be taken to prepare Tanzania’s macroeconomic management for the new gas economy, and identifying the nature of any corresponding technical assistance needs.
Supports early preparation for major macroeconomic challenges in the years ahead.
End-April 2013
MEFP for 3rd
PSI review
Not Met
2) Establish a new Debt Management Office (DMO) in the Ministry of Finance to consolidate public debt management functions.
Seeks to ensure strong, consolidated monitoring of debt liabilities to underpin sound public debt management.
End-December 2012
36 Not Met
3) Compile and publish full preliminary balance of payments data on a quarterly basis within 3 months of the end of the relevant quarter.
Seeks to strengthen macroeconomic and policy analysis
End-December 2012 (for data through end-Sept. 2012)
67 Met with delay
4) Prepare an action plan to restore Tanesco’s financial sustainability.
Addresses contingent fiscal liabilities by ensuring financial viability of TANESCO
End-January 2013
42 Met with delay
5) Submit a new VAT Bill to Parliament
Improves economic efficiency and increase revenue-to-GDP ratio
End-November 2013
23 Not Met Measure
Delayed to May 2014

UNITED REPUBLIC OF TANZANIA
STAFF REPORT ON THE 2014 ARTICLE IV CONSULTATION, THE THIRD
REVIEW UNDER THE STANDBY CREDIT FACILTY ARRANGEMENT,
REQUEST FOR A WAIVER FOR NONOBSERVANCE OF A PERFORMANCE
CRITERION, AND FINANCING ASSURANCES REVIEW —
INFORMATIONAL ANNEX
Prepared By
The African Department
(In consultation with other departments)
RELATIONS WITH THE FUND________________________________________________________________2
STATISTICAL ISSUES APPENDIX_____________________________________________________________6
JOINT WORLD BANK–FUND WORK PROGRAM, 2014______________________________________11
CONTENTS
April 11, 2014

UNITED REPUBLIC OF TANZANIA
2 INTERNATIONAL MONETARY FUND
RELATIONS WITH THE FUND
(As of February 28, 2014)
Membership Status: Joined: September 10, 1962; Article VIII
General Resources Account: SDR Million %Quota
Quota 198.90 100.00
Fund holdings of currency 188.90 94.97
Reserve Tranche Position 10.00 5.03
Lending to the Fund
Notes Issuance
Holdings Exchange Rate
SDR Department: SDR Million %Allocation
Net cumulative allocation 190.51 100.00
Holdings 151.62 79.59
Outstanding Purchases and Loans: SDR Million %Quota
ESF Arrangements 218.79 110.00
ECF Arrangements 4.48 2.25
SCF Arrangements 74.60 37.51
Latest Financial Arrangements:
Date of Expiration Amount Approved Amount Drawn
Type Arrangement Date (SDR Million) (SDR Million)
SCF Jul 06, 2012 Apr 30, 2014 149.18 74.60
ESF May 29, 2009 June 14, 2010 218.79 218.79
ECF1 Aug 16, 2003 Feb 26, 2007 19.60 19.60
1 Formerly PRGF.
Projected Payments to Fund1
(SDR Million; based on existing use of resources and present holdings of SDRs):
Forthcoming
2014 2015 2016 2017 2018
Principal 17.31 43.73 44.60 60.62 60.34
Charges/Interest 0.04 0.90 0.79 0.63 0.44
Total 17.35 44.63 45.39 61.24 60.77
1 When a member has overdue financial obligations outstanding for more than three months, the amount of such
arrears will be shown in this section.

UNITED REPUBLIC OF TANZANIA
INTERNATIONAL MONETARY FUND 3
Implementation of HIPC Initiative:
Enhanced
I. Commitment of HIPC assistance Framework
Decision point date April 2000
Assistance committed
by all creditors (US$ Million)1 2,026.00
Of which: IMF assistance (US$ million) 119.80
(SDR equivalent in millions) 88.95
Completion point date November 2001
II. Disbursement of IMF assistance (SDR Million)
Assistance disbursed to the member 88.95
Interim assistance 26.68
Completion point balance 62.27
Additional disbursement of interest income2 7.45
Total disbursements 96.40
1 Assistance committed under the original framework is expressed in net present value (NPV) terms at the
completion point, and assistance committed under the enhanced framework is expressed in NPV terms at the
decision point. Hence these two amounts can not be added.
2 Under the enhanced framework, an additional disbursement is made at the completion point corresponding to
interest income earned on the amount committed at the decision point but not disbursed during the interim period.
Implementation of Multilateral Debt Relief Initiative (MDRI):
I. MDRI-eligible debt (SDR Million)1 234.03
Financed by: MDRI Trust 207.00
Remaining HIPC resources 27.03
II. Debt Relief by Facility (SDR Million)
Eligible Debt
Delivery
Date
GRA
PRGF
Total
January 2006 N/A 234.03 234.03
1 The MDRI provides 100 percent debt relief to eligible member countries that qualified for the assistance. Grant
assistance from the MDRI Trust and HIPC resources provide debt relief to cover the full stock of debt owed to the
Fund as of end-2004 that remains outstanding at the time the member qualifies for such debt relief.

UNITED REPUBLIC OF TANZANIA
4 INTERNATIONAL MONETARY FUND
Safeguards Assessments:
Safeguards assessments of the Bank of Tanzania (BoT) were completed in December 2003, August
2008, November 2009, and November 2012. The 2012 assessment found that governance and
safeguards framework at the BoT had been strengthened. The BoT’s Audit Committee continued to
provide an active oversight of audit, financial reporting and control systems, and that BoT’s financial
statements are prepared in accordance with international standards and published. Key areas for
improvement identified in the assessment include strengthening the BoT Board’s oversight role in
decisions to provide credit to the government, and reducing the BoT’s involvement non-core
activities such as the provision of credit guarantees.
Exchange Rate Arrangement:
The currency of Tanzania is the Tanzania shilling. Tanzania de jure exchange rate arrangement is free
floating and its de facto exchange rate arrangement is classified as floating. The official exchange
rate is determined in relation to the rate established in the interbank market for foreign exchange.
The weighted average rate in the interbank market was TSh 1,638.27 per U.S. dollar as of March 20,
2014. The exchange system is free of restrictions on the making of payments and transfers for
current international transactions.
Tanzania accepted the obligations of Article VIII, Sections 2, 3, and 4 of the IMF Articles of
Agreement with effect from July 15, 1996.
Article IV Consultation:
The most recent Article IV consultation was concluded on March 16, 2011 (Country Report
No. 11/105).
Technical Assistance:
Tanzania assistance activities provided to Tanzania since 2012 are listed below.
Year of delivery
Fiscal Affairs Department (FAD)
Improving the Management and Payment of VAT Refunds 2014
Natural Gas: An Agenda of Fiscal Issues 2013
Advancing Public Financial Management Reforms 2012
Improving the Effectiveness of Tax Administration 2012
Mining and Gas Fiscal Regimes and VAT Reform 2012

UNITED REPUBLIC OF TANZANIA
INTERNATIONAL MONETARY FUND 5
Monetary and Capital Markets Department (MCM)
Developing a Transitional Monetary Framework and 2014
Introducing Sukuk
Medium-Term Debt Management Strategy (jointly with 2013
The World Bank)
Supervisory Review of IFRS Compliance 2013
Strengthening Crisis Management Framework 2013
Legal Department (LEG)
Fiscal Law 2013
Statistics Department (STA)
Price Statistics 2013
National Accounts 2013
Government Finance Statistics 2012
External Sector Statistics 2012
Resident Representative:
Mr. Thomas Baunsgaard has been the Resident Representative since May 2012.

UNITED REPUBLIC OF TANZANIA
6 INTERNATIONAL MONETARY FUND
STATISTICAL ISSUES APPENDIX
(as at March 31, 2014)
I. Assessment of Data Adequacy for Surveillance
General: Data provision is adequate for surveillance and program monitoring purposes. The
authorities – led by the National Bureau of Statistics (NBS) for the mainland and the Office of the
Chief General Statistician (OCGS) for Zanzibar – have articulated a 5-year strategy under the
Tanzania Statistical Master Plan. The Plan – a multipronged approach to improve collection and
dissemination of statistics – is operationalized through a series of Annual Work Plans. For FY13/14,
the authorities will be focusing on carrying forward a number of ongoing initiatives, including
ongoing efforts to update the legal framework governing statistical collection in Tanzania; improving
the quality of national accounts data, especially from Zanzibar; rebasing the producer price index;
and improving indicators of industrial production.
National Accounts: National accounts statistics for mainland Tanzania are prepared by the NBS.
Separate accounts are compiled for Zanzibar by the OCGS. The data sources for estimating national
accounts by expenditure category and the indicators used to extrapolate benchmark production
levels suffer from deficiencies that complicate estimation of saving-investment. The accounts are
based on the 1993 System of National Accounts (1993 SNA) and are published at current and
constant (2001) prices.
East AFRITAC has been providing training and assistance in the compilation of quarterly national
accounts (QNA), a key element for subscribing to SDDS. QNA at current prices since 2001 have been
compiled, and were released in the publication for the first quarter of 2009.
Price Statistics: The NBS compiles a monthly consumer price index (CPI) for mainland Tanzania
based on consumer expenditure in 21 urban centers. A separate price index is compiled for Zanzibar.
The mainland CPI uses weights based on the 2007 HBS data and with 2010 as the base year. While
the CPI basket has become more comprehensive, the geographical coverage of the index remains
fairly narrow, focused on urban centers, whereas bulk of population live in rural areas. The producer
price index (PPI) is compiled monthly and published quarterly and draws from surveys of business
establishments with over 50 workers, with the basket based on the results of the 1999 Annual Survey
of Industrial Production (ASIP). The NBS will be working on improving the PPI, including by providing
data for 2000-2006 and moving from the ISIC Rev. 2 classification to the newer ISIC Rev. 3.1. One key
concern is the representativeness of the basket as it is based on a very old vintage of the ASIP.
Government Finance Statistics: The authorities provide Fund missions with monthly data on central
government revenue, expenditure, and financing on a timely basis. Although the underlying
concepts broadly follow the Government Finance Statistics Manual 1986, the reporting differs from
international standards in coverage and the treatment of lending minus repayments, and transfer
payments. Coverage of data on the operations of the central government refers to Tanzania

UNITED REPUBLIC OF TANZANIA
INTERNATIONAL MONETARY FUND 7
mainland only –the Ministry of Finance of Zanzibar established a unit tasked with developing a fiscal
reporting framework for Zanzibar. The data also exclude the operations of extra-budgetary units and
funds. Data for general government are not available as no information is yet provided on the
financial position of local governments, although the authorities have stated their intention to
produce such reports.
Despite improvements in the recording of government transactions, discrepancies remain between
revenue and expenditure data, on the one hand, and financing data. The discrepancies are related to
the lack of a fully integrated set of accounts and the delineation of the public sector and its sub-
sectors, differing source data, and timing differences. In addition, there appear to be gaps in the
IFMIS that allow exchequers to be issued for work without corresponding entries in the Accountant
General’s system, leading to arrears. This primarily affects multi-year development projects, including
in road construction.
The Ministry of Finance created a database of donor-funded projects in FY2001/02, the Aid
Management Platform (AMP) with donor assistance. Since then, the number of foreign-financed
projects reported by and channeled through the budget has increased significantly. The integrity of
AMP data can be affected by late entry of data by major donors, which can give rise to discrepancies.
The government has completed the computerization of its accounting system for budgetary units.
Although the authorities indicated that it would allow resumption of reporting in the Government
Finance Statistics Yearbook (GFSY), no data were reported for the 2007 GFSY. The computerized
accounting system does not yet provide details about donor funded development expenditure and
has not yet been extended to cover the extra-budgetary units. The authorities regularly report fiscal
data for inclusion in the IFS.
Monetary Statistics: The monetary statistics are broadly adequate for policy and analytical
purposes. In addition to monthly compilation of the Standard Report Forms (SRFs), which the BoT
shares with the Fund, the authorities have also been sharing daily developments in reserve money
through the program period. Key improvements going forward would be to complement the SRFs
with more timely compilation of statistics for non-banks and Islamic banking. The authorities have
been publishing quarterly data on financial stability, though with a lag, coinciding with the
publication of the Financial Stability Report. These data are made available on a more timely basis to
Fund staff.
Balance of Payments: The BoP data, compiled by the Bank of Tanzania, are broadly adequate for
surveillance. Data for merchandise exports and imports are recorded on the basis of Customs returns
and supplemented by data from mining companies and crop boards. For services transactions, the
chief data sources are the financial records of depository corporations and foreign exchange
bureaus, supplemented with information on merchandise trade (freight and insurance), revenue
data from the TRA (other insurance), and other international service providers. Data on travel
receipts are obtained from International Visitors’ Exit Surveys. Current transfers, capital transfers and
official financial flows are provided by donors and the Ministry of Finance. Data for direct investment

UNITED REPUBLIC OF TANZANIA
8 INTERNATIONAL MONETARY FUND
income are estimated based on information obtained from the Private Capital Flow Survey (PSFS).
East AFRITAC has provided assistance in international investment position statistics, and developing
price and volume indices for international trade.
II. Data Standards and Quality
Tanzania subscribes to the General Data
Dissemination Standard (GDDS). GDDS metadata
were posted on the IMF’s Dissemination
Standards Bulletin Board (DSBB) in July 2001 and
were updated in January 2014. Tanzania is
participating in the successor project to the
Fund’s GDDS Project for Anglophone Africa
(funded by the U.K. Department for International
Development (DFID)).
A mission to prepare the data module for the
Report on the Observance of Standards and
Codes (ROSC) was completed in October 2002.
The report was published in March 2004.
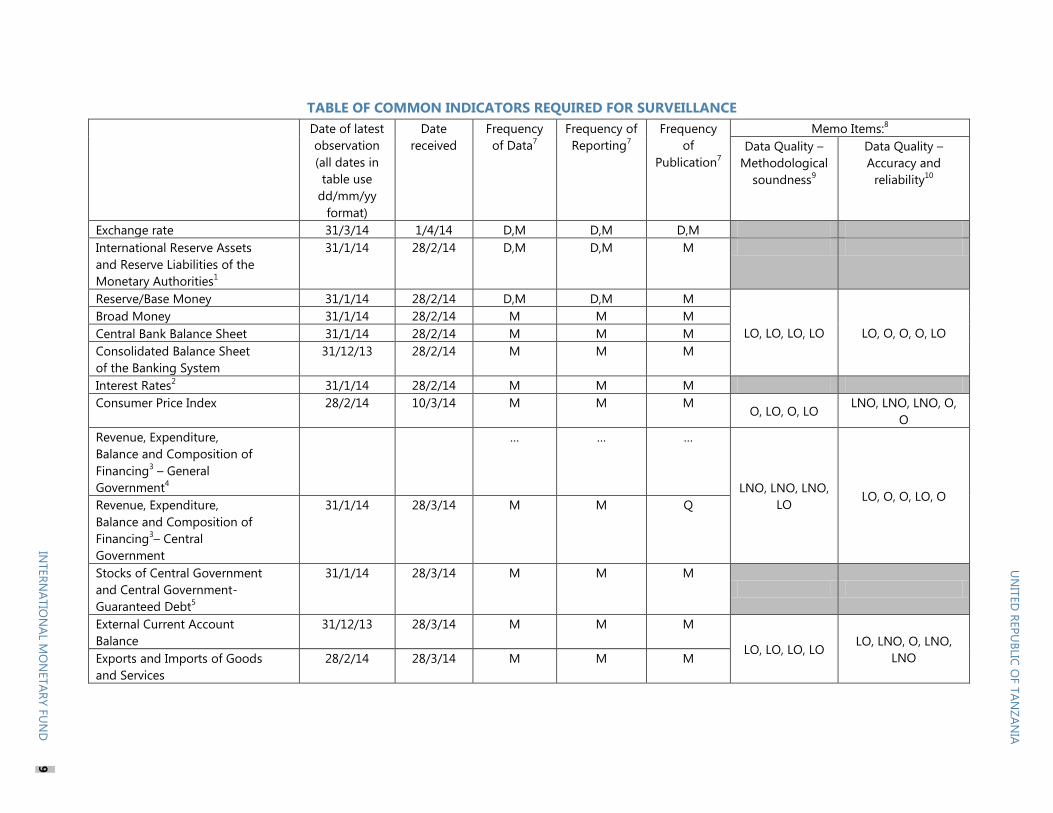
TABLE OF COMMON INDICATORS REQUIRED FOR SURVEILLANCE
Date of latest
observation
(all dates in
table use
dd/mm/yy
format)
Date
received
Frequency
of Data7
Frequency of
Reporting7
Frequency
of
Publication7
Memo Items:8
Data Quality –
Methodological
soundness9
Data Quality –
Accuracy and
reliability10
Exchange rate 31/3/14 1/4/14 D,M D,M D,M
International Reserve Assets
and Reserve Liabilities of the
Monetary Authorities1
31/1/14 28/2/14 D,M D,M M
Reserve/Base Money 31/1/14 28/2/14 D,M D,M M
LO, LO, LO, LO LO, O, O, O, LO
Broad Money 31/1/14 28/2/14 M M M
Central Bank Balance Sheet 31/1/14 28/2/14 M M M
Consolidated Balance Sheet
of the Banking System
31/12/13 28/2/14 M M M
Interest Rates2 31/1/14 28/2/14 M M M
Consumer Price Index 28/2/14 10/3/14 M M M O, LO, O, LO
LNO, LNO, LNO, O,
O
Revenue, Expenditure,
Balance and Composition of
Financing3 – General
Government4
… … …
LNO, LNO, LNO,
LO LO, O, O, LO, O
Revenue, Expenditure,
Balance and Composition of
Financing3– Central
Government
31/1/14 28/3/14 M M Q
Stocks of Central Government
and Central Government-
Guaranteed Debt5
31/1/14 28/3/14 M M M
External Current Account
Balance
31/12/13 28/3/14 M M M
LO, LO, LO, LO LO, LNO, O, LNO,
LNO Exports and Imports of Goods
and Services
28/2/14 28/3/14 M M M
UN
ITED
REP
UB
LIC O
F T
AN
ZA
NIA
INTER
NA
TIO
NA
L MO
NETA
RY F
UN
D
9

GDP/GNP 31/12/12 (A)
31/3/13 (Q)
31/10/13
31/8/13
Q,A Q,A Q,A LO, LO, LO, LO LNO, LNO, O, LO, LO
Gross External Debt 31/12/13 28/3/14 M M M
International Investment
Position6
31/12/12 … A A A
1 Any reserve assets that are pledged or otherwise encumbered should be specified separately. Also, data should comprise short-term liabilities linked to a foreign
currency but settled by other means as well as the notional values of financial derivatives to pay and to receive foreign currency, including those linked to a foreign
currency but settled by other means.
2 Both market-based and officially-determined, including discount rates, money market rates, rates on treasury bills, notes and bonds.
3 Foreign, domestic bank, and domestic nonbank financing.
4 The general government consists of the central government (budgetary funds, extra budgetary funds, and social security funds) and state and local governments.
5 Including currency and maturity composition.
6 Includes external gross financial asset and liability positions vis-à-vis nonresidents.
7 Daily (D); weekly (W); monthly (M); quarterly (Q); annually (A); irregular (I); and not available (NA).
8 These columns should only be included for countries for which Data ROSC (or a Substantive Update) has been published.
9 This reflects the assessment provided in the data ROSC or the Substantive Update (published on March 12, 2004 and based on the findings of the mission that
took place during October 8-22, 2002) for the dataset corresponding to the variable in each row. The assessment indicates whether international standards
concerning concepts and definitions, scope, classification/sectorization, and basis for recording are fully observed (O); largely observed (LO); largely not observed
(LNO); not observed (NO); and not available (NA).
10 Same as footnote 7, except referring to international standards concerning (respectively) source data, assessment of source data, statistical techniques,
assessment and validation of intermediate data and statistical outputs, and revision studies.
UN
ITED
REP
UB
LIC O
F T
AN
ZA
NIA
10
INTER
NA
TIO
NA
MO
NETA
RY F
UN
D

UNITED REPUBLIC OF TANZANIA
INTERNATIONAL MONETARY FUND 11
JOINT WORLD BANK–FUND WORK PROGRAM, 2014
Title Products Provisional
timing of
missions
(if relevant)
Expected delivery
date
A. Mutual information on relevant work programs
Key elements of
World Bank work
program in next
12 months
The progress report of the current WBG Country
Assistance Strategy (CAS) is under preparation and
is expected to be discussed at the Board in
May/June 2014.
May/June 2014
The work program will continue to concentrate on
areas within the existing and new lending portfolio:
agriculture; agribusiness development; regional
fishery; power and gas (various); private sector
development; urban; education; higher education
and science and technology; health sector
development; productive safety net; minerals;
water; open government and public financial
management.
Continuous
The World Bank continues to lead and facilitate the
Public Expenditure Review (PER) process in
Tanzania with government and six other
development partners. The focus for FY2015 will
be on rapid budget analysis (RBA) as well as
specific studies on non-tax revenue and retention
schemes; tax incentives; PPPs; analysis of arrears;
and contingent liabilities and pensions.
April 2014 (tax
incentives study)
July 2014 (non-tax
revenues, arrears,
contingent liabilities,
pensions),
November 2014(RBA,
PPPs)
Tanzania Pension Reform (non-lending TA,
conducted in conjunction with the PER contingent
liabilities work) will involve follow-up analysis
relating to the PER pension liabilities modeling;
formulation of proposed action plan for the reform
of the sector; a technical note on the structure,
harmonization and merger of social security funds
in Tanzania.
July 2014

UNITED REPUBLIC OF TANZANIA
12 INTERNATIONAL MONETARY FUND
The first operation of the new open
government/public financial management DPO
series is expected to cover PFM issues such as cash
management, public investment management and
procurement, from a perspective of improving
value for money in service delivery.
By December 2014
The Third Power and Gas Sector Development
Operation (last operation of the series)
March 2015 or before
Country Economic Memorandum (CEM) with the
main theme on productive jobs.
2014
IMF work program
in next 12 months
Third SCF Review and Article IV Consultation February 2014 April 2014
First PSI Review September 2014 November/ December
2014
B. Requests for work program inputs
Fund requests to
Bank
1. Assessment of key infrastructure projects and
sectoral programs.
Continuous
2. Assessment of financial health of pension funds.
Continuous
3. Assessment of the financial viability of the
electricity utility.
Continuous.
4. Inputs on the design of a social protection
framework.
Continuous
5. Inputs on sources of growth for private sector
development and job creation.
Continuous
Bank requests to
Fund
1. Monitoring of government contracting of non-
concessional borrowing.
Continuous
2. Monitoring of steps to strengthen corporate
governance of the BoT
Continuous
3. Sharing macro-framework updates. Continuous
4. Statement of fiscal risk and contingent liabilities. Continuous

UNITED REPUBLIC OF TANZANIA
INTERNATIONAL MONETARY FUND 13
C. Agreement on joint products and missions
Joint products in
next 12 months
1. Collaborate on a joint DSA February 2014 March 2014
2. Jointly with other development partners,
collaborate on the annual review of general budget
support (GBS AR 2014).
Early 2014 Early 2014
3. Collaborate on PFM reform program
in the context of multi-donor support of the Public
Financial Management Reform Program.
Continuous
4. Collaborate on a joint Bank-Fund TA project on
enhancing the implementation of a medium-term
debt management strategy.
November 2013 2014
5. Collaborate on supporting the government in its
implementation of its Roadmap for Natural Gas
Development in Tanzania (adopted in October
2013), which builds on the report of the Gas Sector
Scoping Mission undertaken by the Bank, Fund,
African Development Bank and bilateral donors in
2012, including collaboration in the areas related to
fiscal regime and public investment management in
the gas sector.
Continuous
UNITED REPUBLIC OF TANZANIA STAFF REPORT ON THE 2014 ARTICLE IV CONSULTATION, THE THIRD REVIEW UNDER THE STANDBY CREDIT FACILTY ARRANGEMENT, REQUEST FOR A WAIVER FOR NONOBSERVANCE OF A PERFORMANCE CRITERION, AND FINANCING ASSURANCES REVIEW—DEBT SUSTAINABILITY ANALYSIS
Risk of external debt distress: Low Augmented by significant risks stemming from domestic public and/or private external debt?
No
Tanzania continues to face a low risk of debt distress based on the external debt sustainability analysis (DSA). The external debt outlook improves as a result of an increase in the discount rate, but this is partly offset by (i) a slower pace of fiscal deficit reduction and (ii) a shift in the long-term composition of external financing towards more non-concessional loans. While the baseline public debt outlook remains favorable, continued fiscal consolidation is critical. In addition, recognizing the outstanding pension and other liabilities has an impact on the level of public debt. The baseline numerical analysis in this DSA does not take into account prospects related to natural gas resources whose scale, while potentially favorable, remains uncertain. These results highlight the need for Tanzania to sustain fiscal consolidation efforts, to adopt a conservative approach to non-concessional borrowing, to promptly address pension-related liabilities, and to further improve its debt management capacity.1
1 This DSA replaces the previous one prepared in June 2012. Tables and figures are in fiscal years (July-June). For example, 2013 refers to fiscal year 2012/13. Under the Country Policy and Institutional Assessment (CPIA), Tanzania is rated as a strong performer, with an average rating of 3.73 during 2010-12. Although the average CPIA score is slightly below the boundary for strong performance category (3.75), the performance rating remains strong since this is the first year of breaching the boundary and the breach is less than 0.5.
Approved By Roger Nord and Dhaneshwar Ghura (IMF) and Marcelo Giugale and Jeffrey D. Lewis (World Bank)
Prepared by the staffs of the International Monetary Fund and the International Development Association
April 11, 2014

UNITED REPUBLIC OF TANZANIA
2 INTERNATIONAL MONETARY FUND
BACKGROUND 1. Tanzania’s public and publicly guaranteed (PPG) external debt as a share of GDP has steadily crept upwards in recent years (text figure, left panel). Since the Multilateral Debt Relief Initiative (MDRI) in 2006/07, which reduced the external debt-to-GDP ratio from 47 percent to 19 percent, PPG external debt (excluding arrears under negotiation for relief) has increased to about 29 percent of GDP at end-June 2013, or 17 percent of GDP in present value terms using a 5 percent discount rate2. Total public sector debt (external plus domestic) stood at about US$12.4 billion or 40.9 percent of GDP at end-June 2013, rising from a low of 27.5 percent at end-June 2008.
2. The majority of Tanzania’s PPG external debt is still concessional, but borrowing on non-concessional terms has increased in recent years (text figure, right panel). At end-June 2013, more than two-thirds of total public external debt was owed to multilateral institutions, of which the International Development Association (IDA) and the African Development Bank (AfDB) constitute the largest creditors. Government borrowing from commercial sources amounted to about 20 percent of the total stock at end-June 2013, having risen rapidly from about 2 percent at end-June 2010. In February 2013, Tanzania raised US$600 million from international capital markets in a private placement transaction.3 Tanzania is currently in the process of obtaining its sovereign risk rating, which would facilitate future Eurobond issuance.
3. Domestic public debt stood at 12 percent of GDP at end-June 2013, and mostly consisted of Treasury bonds. Domestic public debt is held primarily by commercial banks (39 percent), the Bank of Tanzania (35 percent), and pension funds and insurance companies (23 percent). Private external debt has risen in recent years to about 5 percent of GDP in 2012/13, though there is considerable uncertainty regarding private external debt data.
2 The discount rate was increased to 5 percent as of October 2013. See “Staff Guidance Note on the Application of the Joint Bank-Fund Debt Sustainability Framework for Low-Income Countries” (SM/13/292). 3 This is an amortizing bond with a maturity of seven years, and was priced at 600 basis points over 6-month LIBOR at the time of issuance. The amortizing feature helps reduce rollover risks, whereas the floating interest rate on the bond implies increased exposure to changing interest rates.
0
10
20
30
40
50
60
2004/05 2005/06 2006/07 2007/08 2008/09 2009/10 2010/11 2011/12 2012/13 2013/14 proj
Tanzania: Public Debt (percent of GDP)
Domestic
External
Sources: Ministry of Finance, Bank of Tanzania, and IMF staff calculations.Note: 2013/14 projection of domestic debt includes a one-off adjustment for recognizing outstanding domestic liabilities, including past-due pension obligations,
guarantees for public enterprises, and domestic expenditure arrears.
Bilateral -Paris Club
7%
Bilateral - non Paris Club4%
IDA47%AfDB
11%
Other multilaterals9%
Commercial20%
Export credit2%
Composition of PPG External Debt, June 2013
Sources: Ministry of Finance, Bank of Tanzania, and IMF staff calculations.Note: Excludes arrears to non-Paris Club creditors under negotiation for relief.

UNITED REPUBLIC OF TANZANIA
INTERNATIONAL MONETARY FUND 3
4. The current DSA only covers central government debt. Owing to data limitations, borrowing by local governments and most public enterprises is excluded, thus potentially understating the total debt level. The external public debt stock includes the foreign currency portion of commercial loans contracted by the state-owned power utility TANESCO4. For the purpose of the current DSA, the domestic public debt stock incorporates starting in 2013/14 several outstanding government liabilities that have yet to be formally recognized as debt (but that were included in the DSA published by the MoF), amounting to about Tsh4 trillion or 7 percent of GDP. These include outstanding liabilities to the Public Service Pension Fund (Tsh1160 billion)5, outstanding unpaid domestic claims (Tsh892 billion)6, government guarantees for public enterprises (Tsh912 billion), and other actual liabilities arising from past PPP transactions, court orders, and explicit government guarantees.7
5. Stock-flow adjustments have accounted for a sizeable portion of the rise in Tanzania’s public debt in recent years. A decomposition of annual change in gross public debt shows that stock-flow residuals averaged 2.4 percent of GDP over 2008-13, peaking at 5.2 percent of GDP in 2011. The primary fiscal deficit also made a sizable contribution to the debt ratio increase. The interest-growth differential (i.e., the difference between effective interest rates8 and output growth rates) was considerably negative, reflecting the still-high concessionality of the debt stock, thereby slowing the pace of the debt ratio increase.
6. The authorities continue to make progress in upgrading their debt management capacity. With technical support from the World Bank and the East African MEFMI, the MoF conducted a debt sustainability assessment in September 2013. The authorities’ medium-term debt strategy (MTDS) was also updated in November 2013 with support from a joint IMF-World Bank technical assistance mission. Both the DSA and the MTDS report have been published on the MoF’s web site, and are expected to serve as key inputs that will guide the government’s borrowing policy going forward. There is an ongoing process to put into operation a centralized debt management office (DMO), housed at the MoF, that will bring together the fragmented debt management functions.
4 TANESCO borrowing in foreign currency amounts to about US$20 million in 2012/13 and US$84 million in 2013/14. 5 Estimate from the government’s verification exercise, and consistent with estimates by the World Bank and the Genesis Report. Contingent liabilities arising from financial weakness of the broader pension sector can be substantially higher. 6 Unpaid claims of duration above 90 days, estimated as of end-December 2013. Ministries with large claims include Works, Health, Education, Agriculture, Home Affairs, and Defense. 7 In addition, the government has significant multi-year commitments arising from existing contracts, especially in the road sector, which are not included in the DSA. 8 Effective interest rates are computed by dividing total interest payments by last period’s debt stock.
-6-4-202468
1012
2008 2009 2010 2011 2012 2013
Stock Flow Adjustments(percent of GDP)
Stock flow adjustment
Primary deficit
Interest growth differential
Change in public debt stock
Sources: IMF staff calculations.

UNITED REPUBLIC OF TANZANIA
4 INTERNATIONAL MONETARY FUND
UNDERLYING ASSUMPTIONS 7. Compared with the previous DSA, the current assessment is based on a somewhat slower pace of fiscal deficit reduction (text table). This reflects Tanzania’s need to increase growth-supporting infrastructure investments while maintaining a sustainable debt outlook. The deficit is projected to narrow gradually to 4 percent of GDP by 2015/16, and to further decline to 3 percent of GDP in 2020/21 and thereafter in line with the convergence criteria agreed under the East African Monetary Union (EAMU) protocol. Domestic revenues (excluding grants) are projected to grow from 18 percent of GDP in 2012/13 to over 23 percent of GDP by 2033/34, consistent with economic development and Tanzania’s tax potential. External grants are assumed to decline gradually, from 3.4 percent of GDP in 2013/14 to 2 percent of GDP in the long term.
8. The composition of external borrowing is assumed to gradually shift toward non-concessional debt, consistent with a reduction in aid dependency as the economy matures. External non-concessional borrowing (ENCB) is expected to pick up in 2013/14, due in part to a US$558 million projected disbursement of the gas pipeline loan9, and in part to debt contracted to finance new infrastructure projects.10 Beyond 2013/14, the assumption is that total gross foreign financing would consist of about half ENCB and half concessional (program and project) loans in the medium term. Thereafter, 9 This is part of a US$920 million loan from China EXIM Bank, contracted in 2012/13, to build a new gas pipeline that would bring low-cost natural gas from shallow water offshore reserves to the Dar es Salaam area. 10 Contracted ENCB is projected at US$700 million in 2013/14, consistent with the second review under the SCF arrangement.
0
1
2
3
4
5
6
7
2013
/14
2014
/15
2015
/16
2016
/17
2017
/18
2018
/19
2019
/20
2020
/21
2021
/22
2022
/23
2023
/24
2024
/25
2025
/26
2026
/27
2027
/28
2028
/29
2029
/30
2029
/31
2031
/32
2032
/33
2033
/34
Foreign Financing Assumptions(percent of GDP)
Non-concessional Concessional
2014 2015 2016 Long term 1/
Real GDP growth (percent)
Current DSA 7.1 7.1 7.1 7.0
Previous DSA 6.9 7.1 7.1 7.5
Fiscal balance (% GDP)
Current DSA -5.2 -4.9 -4.0 -3.0
Previous DSA -4.5 -3.9 -3.4 -2.6
Current account balance (% GDP)
Current DSA -14.5 -13.8 -12.9 -10.2
Previous DSA -12.5 -12.2 -11.9 -9.8
Net FDI (% GDP)
Current DSA 6.0 6.7 6.7 6.1
Previous DSA 6.1 6.0 5.9 5.8
Selected Macroeconomic Indicators, Current vs. Previous DSA
1/ Defined as the last 15 years of the projection period. For the current DSA, the long term covers the period 2020-34, whereas for the previous DSA it covered 2018-32.

UNITED REPUBLIC OF TANZANIA
INTERNATIONAL MONETARY FUND 5
ENCB would gradually become the more prominent financing source, reaching about 70 percent of total foreign financing requirements by 2033/34.
9. Other macroeconomic assumptions remain broadly similar to the previous DSA (see Box 1 for detail). Real GDP is assumed to keep growing by 7 percent annually over the projection period, with continued strong capital accumulation. The external current account (CA) is projected to gradually improve over the medium term as the availability of gas-based power generation reduces the need for oil imports, and to stabilize at a still-large deficit of 10 percent of GDP.
Box 1. Key DSA Assumptions
Growth, inflation, exchange rate. Real GDP growth is projected to remain at 7 percent over the medium and long term. Inflation would converge to the Bank of Tanzania’s medium-term target of 5 percent, yielding a nominal growth rate of about 12 percent per annum. The Tanzanian shilling is projected to depreciate against the USD by 3 percent annually in the medium and long run, due to the inflation differential between Tanzania and the US.
Exports and imports. Export and import values are assumed to grow at 11 and 10 percent annually in the long term, respectively.
Fiscal deficit. The fiscal deficit is projected to decline to 4 percent of GDP by 2015/16, and further to 3 percent of GDP from 2020/21 onwards. Revenues excluding grants are assumed to grow from 18 percent of GDP to 23 percent of GDP by 2033/34.
Aid and FDI flows. External grants are assumed to gradually decline to 2 percent of GDP by 2033/34. Foreign concessional loans (program and project loans) would slowly decline to 1 percent of GDP in the long term. Concessional loans are assumed to continue to come primarily from multilateral creditors (IDA, AfDB, etc.) in the medium term, but would then be increasingly provided by bilateral – particularly non-Paris Club – creditors, whose financing terms are not as favorable. After a slight increase due to further offshore natural gas explorations, net FDI inflows would stabilize at an average of 6.1 percent of GDP in the long term.
Domestic borrowing. Net domestic financing is kept at a maximum of about 1 percent of GDP throughout the projection period. New domestic debt is assumed to carry a real interest rate of 10 percent with average maturity of seven years, consistent with recent experience.
External non-concessional borrowing. ENCB is assumed to finance about half of the gross foreign financing requirement up to 2019/20 before gradually gaining importance over concessional sources, reaching 2.5 percent of GDP by 2033/34. The grant element of new borrowing is projected to decline considerably over the long run. New external commercial borrowing is assumed to be provided by a combination of export credit agencies (ECA) and commercial banks (syndicated loans), with the latter source becoming more prominent in the long run. Consistent with prevailing market conditions, ECA loans have an average interest rate of 4 percent with a 15-year maturity, whereas syndicated loans carry a higher average interest rate (7 percent) and shorter maturity (7 years).

UNITED REPUBLIC OF TANZANIA
6 INTERNATIONAL MONETARY FUND
10. The current DSA includes a government pension liability in the 2013/14 domestic public debt stock. The government currently has Tsh1.16 trillion (about 2.1 percent of GDP) of past-due payment liabilities it owes to PSPF for pension benefits related to the pre-1999 noncontributory scheme.11 Although the authorities have acknowledged the outstanding liability and budget for partial repayment each year, the liability has not been formally recorded in the fiscal accounts and thus was not part of the domestic debt stock. This DSA assumes that recognition of this liability (and several other actual liabilities) occurs in 2013/14, resulting in a one-off increase in the 2013/14 public debt stock.12 Moreover, in interpreting the fiscal deficit assumptions that underlie this DSA (and the related policy effort to meet such assumptions), it is important to keep in mind the flow of future expenditure obligations (estimated at 0.5 percent of GDP per year in the medium term, gradually slowing down thereafter) to cover the pension benefits of pensioners in the pre-1999 system as a part of the deficit.
11. The current DSA incorporates better-refined projections of debt service on existing external debts. The assessment uses individual loan information provided by the authorities, reflecting their process of upgrading the debt database and debt monitoring capacity. Future debt service obligations are projected for each loan, then aggregated into several representative instruments (e.g., by creditor type and lending terms).
12. The discount rate is currently set at 5 percent, compared to 4 percent used in the previous DSA.
EXTERNAL DSA 13. All PPG external debt burden indicators remain comfortably below indicative thresholds in the baseline scenario (Figure 1 and Table 1). Under the baseline assumptions, the present value (PV) of public external debt expressed as a share of GDP increases slightly from 20 percent in 2014 to a peak of 23 percent in 2019, before gradually declining to about 19 percent by the end of the projection period. Debt service indicators are projected to rise gradually over time, reflecting the long-maturity nature of concessional loans which make up the majority of the existing external debt stock, as well as the increasing weight placed on new commercial borrowing.
14. The outlook for the external debt ratios remains favorable under standard stress tests (Figure 1 and Tables 3a-b). All debt burden indicators remain safely below their respective risk thresholds. However, stress tests show that external debt dynamics would be adversely affected in the event of a one-time 30 percent depreciation in the nominal exchange rate. The PV of external debt expressed as a share of exports is sensitive to a shock to financing terms, in which the interest rate on new public sector borrowing
11 The figure is based on the government’s estimation. Until June 30, 1999, the PSPF was a noncontributory pension scheme, with all benefits paid from the budget. The PSPF was transformed into a contributory defined benefit scheme on July 1, 1999, but benefits continued to be paid from the budget during a 5-year transition period (until June 30, 2004). From July 1, 2004 onwards, the PSPF has been paying pension benefits related to the pre-1999 scheme on behalf of the government, for which it has not been reimbursed. 12 Correspondingly, for the purpose of this DSA, the fiscal accounts show an increase in domestic financing (below the line). As a result of this one-off stock adjustment, domestic debt reported in the DSA is higher than in staff projections.

UNITED REPUBLIC OF TANZANIA
INTERNATIONAL MONETARY FUND 7
increases by 200bps. In addition, the external debt outlook would become less favorable in the event of a permanent growth shock, whereby real GDP growth is lower at 5 percent (2 percentage points below the baseline).
15. Compared to the previous DSA, the favorable impact of the higher discount rate prevails over the adverse effects of changes to the projected fiscal deficit and financing assumptions. Slower fiscal consolidation leads to more debt accumulation, assumed to be financed with increasingly non-concessional external debt. (The assumed concessionality of new external borrowing continues to decline over the projection period, as can be seen by the declining grant element—Figure 1, top left panel). However, the increase in the discount rate to 5 percent reduces the present value of external PPG debt by about 2 percent of GDP on average.
PUBLIC DSA 16. Indicators of overall public debt (external plus domestic) and debt service do not point to significant vulnerabilities related to the level of domestic debt (Figure 2 and Table 2). In the baseline scenario, the PV of total public debt expressed as a share of GDP and revenues is expected to decline gradually over time. The PV of public debt peaks at about 36.3 percent of GDP in 2014, when various outstanding government liabilities are recognized, but remains well below the benchmark level of about 75 percent associated with heightened public debt vulnerabilities for strong performers.13 The path of public debt is also consistent with the authorities’ objective under the EAMU protocol of keeping the public debt-to-GDP ratio (in PV terms) below 50 percent.
17. Stress tests indicate that the sustainable public debt path hinges on continued fiscal consolidation. In a scenario assuming that the primary deficit (as a percent of GDP) remains at the projected 2014 level over the entire projection period, the PV of public debt would keep growing to 51.5 percent of GDP by 2034. This scenario highlights the critical importance of reducing fiscal deficits to prevent excessive debt buildup. Fiscal consolidation in the medium term may present challenges for the authorities in light of infrastructure needs and expenditure pressures to facilitate growth in key sectors (e.g., energy, transportation, and agriculture), as well as growing pension obligations and the upcoming general election in 2015. The most extreme shock corresponds to a 10 percent of GDP increase in debt-creating flows in 2015, which would capture some of the government implicit contingent liabilities and/or non-central government borrowing that is not included in the DSA. The amount of known contingent liabilities arising from pension obligations and government guarantees (about 9 percent of GDP) is broadly in line with the magnitude of shock assumed by the standardized stress test.
18. Growing pension obligations present a challenge to be met in order to preserve public debt sustainability. The DSA shows that recognizing the outstanding liability to PSPF has a noticeable impact on the public debt ratio. In the absence of a reimbursement for past benefit payments, PSPF is now in a
13 See Revisiting the Debt Sustainability Framework for Low-Income Countries for a discussion of public debt benchmarks. Tanzania is still considered a strong performer as their CPIA score of 3.73 breaches the 3.75 threshold slightly for the first time. The public debt benchmark for medium performers is 56 percent of GDP.

UNITED REPUBLIC OF TANZANIA
8 INTERNATIONAL MONETARY FUND
fragile financial position. Moreover, pension obligations related to the pre-1999 scheme will continue to accrue and are ultimately a spending obligation of the government. More broadly, the actuarial deficit across the pension sector (consisting of several pension funds) gives rise to further liabilities. This highlights the need for the government to address its outstanding pension liabilities, budget for future payments related to the pre-1999 scheme, and undertake parametric pension reforms to improve the funds’ financial positions.
POTENTIAL IMPACT OF NATURAL GAS RESOURCES 19. The baseline macroeconomic framework underlying the current DSA does not yet factor in the potential impact of possible future natural gas production from emerging offshore large-scale projects. Recent deep water exploration by major petroleum companies has confirmed large natural gas deposits. Public information released by the companies exploring for natural gas indicates that there are recoverable gas resources of at least 23-26 trillion cubic feet (TCF), although there remains significant uncertainty about exact reserve estimates. There is potential for the reserve estimates to increase further given the substantial exploration activities underway (although gas reserves are likely to remain significantly smaller than those of neighboring Mozambique). While exploration and appraisal are well underway, the final investment decisions to construct liquefied natural gas (LNG) terminals have not yet been made. (Such decisions are currently expected to be made in 2016.) Thereafter, the development phase would start, and it would take several years before commercial production and exports of LNG could begin. Similarly, significant fiscal revenues would not materialize for at least a decade from today.
20. If natural gas prospects were to materialize, the impact on debt sustainability would depend on a variety of factors. The development phase (until about 2020/21) would see a significant deterioration of the external current account, given the import-intensive nature of LNG projects. The extent of the deterioration depends on the scale of the projects, e.g., whether it would be a two-train or four-train LNG plant. The larger CA deficit would be financed by a combination of FDI inflows and public sector external borrowing depending on the government’s decision on how to manage natural gas resources, i.e., whether gas-related investments would be led by the private or public sector.14 A temporary increase in the fiscal deficit and public debt buildup is therefore possible in the medium term. Once LNG commercial production comes online (possibly in the early 2020s), natural gas exports would pick up significantly, alleviating pressures on the current account (by how much depends on the commercially viable amount, the portion earmarked for domestic consumption, and prevailing global natural gas prices— which are particularly volatile). The fiscal impact would build up gradually, with tax yields initially mitigated by deductions on investments. The overall long-term impact would likely be highly beneficial, with potentially large fiscal receipts from gas revenues (Box 2), thereby reducing public sector borrowing needs and enhancing debt sustainability. A more precise DSA scenario incorporating LNG developments will be
14 The government’s natural gas policy, which was adopted in October 2013, envisaged a more central role for the national oil and gas company, TPDC (Tanzania Petroleum Development Corporation), across the upstream, midstream, and downstream sectors. Tanzania is working to finalize gas-related policies and regulations, which will be encompassed in a new Gas Master Plan, the downstream-focused Natural Gas Act, and a new petroleum policy which will cover the upstream sector.

UNITED REPUBLIC OF TANZANIA
INTERNATIONAL MONETARY FUND 9
developed when commercially viable natural gas resources are known with greater confidence and when there is reasonable certainty that the development of a large scale gas project will go ahead.
Box 2. Offshore Natural Gas: Resources, Investment, and Fiscal Impact
Tanzania has made significant offshore gas discoveries during the last two years. The resource discoveries have been made by two groups of international petroleum companies that are still conducting exploration and appraisal; neither has yet declared the gas discoveries to be commercial. A final investment decision is expected at the earliest in late 2016, with production potentially commencing after 2020. The latest estimates indicate that there are total recoverable gas resources amounting to 23-26 trillion cubic feet (tcf). A rule of thumb is that 10-12 tcf of gas reserves is the minimum required for a two-train liquefied natural gas (LNG) plant.
This box presents estimates of the possible investment and fiscal impact of an LNG project applying a model developed for Tanzania by the IMF’s Fiscal Affairs Department (FAD). With uncertainty about gas reserves, project cost and gas prices, the fiscal regime, and potential government equity participation, these are illustrative estimates, not forecasts.
Investment impact
The investment impact of an LNG project will be significant, ranging from US$20-40 billion depending on the scale of the project.1 Two-thirds of the development cost relate to pipelines and liquefaction facilities. During the development phase (possibly from 2018 to 2021), the sizeable investment will widen the current account deficit and temporarily boost growth. The fiscal impact during the development phase will depend on policy decisions regarding state participation in a project. As an illustration, if the government were to take a 15 percent equity share in the downstream of a large LNG project, the government’s contribution to total development cost could be close to US$4.5 billion.
Fiscal revenue impact
Given the project uncertainty, and that the fiscal regime likely will evolve further, through either contractual negotiations or general reforms, it is only possible to simulate the fiscal impact under specific assumptions rather than make firm projections. The fiscal revenue impact would be highly beneficial. At full production, annual revenue collections by the government reach between US$3 billion and US$6 billion in the two different project simulations. These would have a transformational impact on the debt outlook, as by way of comparison today’s public debt stock amounts to $12.4 billion. Most of the fiscal revenues would originate from the upstream, reflecting the higher effective tax rate and the assumption that the downstream will be regulated as a public utility. The fiscal regime is a hybrid combining royalty and income tax with production sharing. The largest revenue stream comes from production sharing, highlighting the importance of treating production sharing as any other source of fiscal revenue which should be paid to the Treasury and not retained by the national oil company. ____________________________________________ 1 Simulations have been done for two project sizes: a two-train liquefaction plant with capacity for annual
production of 10 million metric tons of LNG and a four-train plant producing 20 million metric tons per year.

UNITED REPUBLIC OF TANZANIA
10 INTERNATIONAL MONETARY FUND
Box Figure. Tanzania: LNG Gas Fiscal Simulations1/
Source: IMF staff estimates
1/ Simulations of a four-train LNG plant with annual capacity of 20 mmt using total gas resources of
24 tcf over the life of the project.
0
2,000
4,000
6,000
8,000
10,000
12,000
14,000
16,000
18,000
2012 2013 2014 2015 2016 2017 2018 2019 2020 2021
(i) Total Project Exploration and Development Cost
LNG capex Pipeline capex
Upstream drilling Upstream capital
Exploration costs
0
1,000
2,000
3,000
4,000
5,000
6,000
7,000
20
18
20
19
20
20
20
21
20
22
20
23
20
24
20
25
20
26
20
27
20
28
20
29
20
30
20
31
20
32
20
33
20
34
20
35
20
36
20
37
20
38
20
39
20
40
20
41
20
42
20
43
20
44
20
45
20
46
20
47
20
48
20
49
20
50
20
51
20
52
20
53
20
54
20
55
20
56
(ii) Upstream Government Revenues Income tax
Dividend WHT
Interest WHT
Equity Participation
Profit petroleum
Royalty
-3,000
-2,000
-1,000
0
1,000
2,000
3,000
4,000
20
18
20
19
20
20
20
21
20
22
20
23
20
24
20
25
20
26
20
27
20
28
20
29
20
30
20
31
20
32
20
33
20
34
20
35
20
36
20
37
20
38
20
39
20
40
20
41
20
42
20
43
20
44
20
45
20
46
20
47
20
48
20
49
20
50
20
51
20
52
20
53
20
54
20
55
20
56
(iii) Downstream Government Revenues
Income tax Divident WHT
Interest WHT Equity Participation
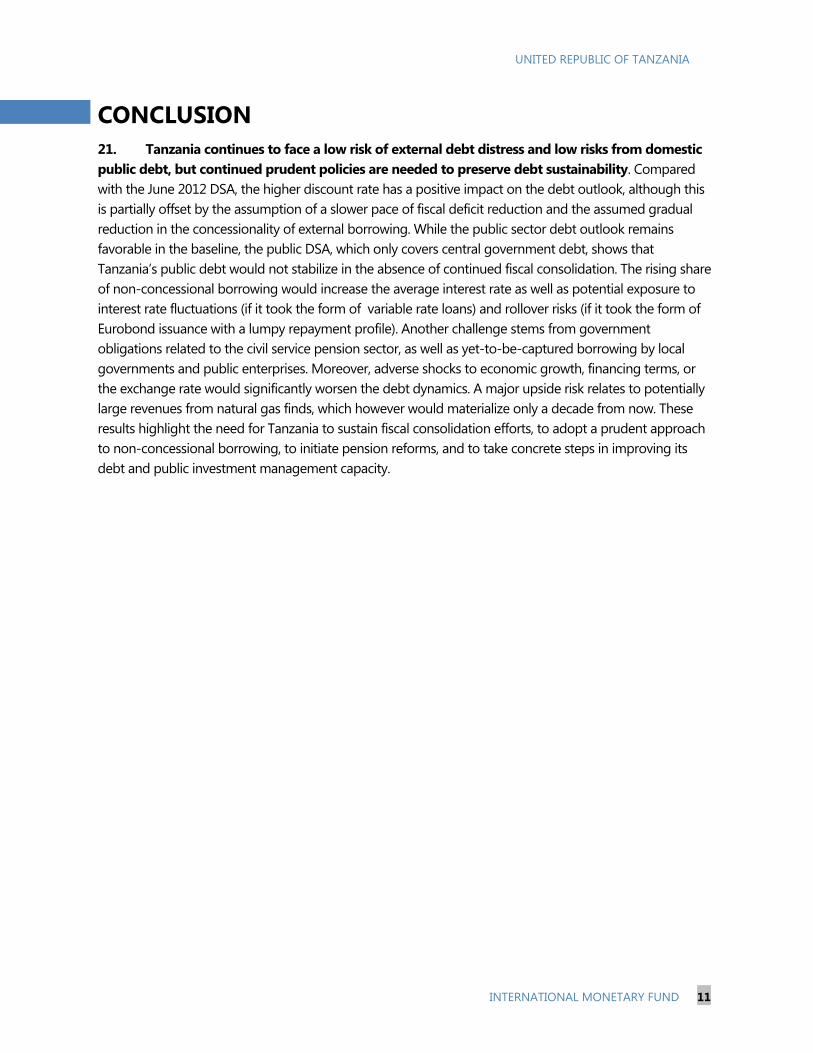
UNITED REPUBLIC OF TANZANIA
INTERNATIONAL MONETARY FUND 11
CONCLUSION 21. Tanzania continues to face a low risk of external debt distress and low risks from domestic public debt, but continued prudent policies are needed to preserve debt sustainability. Compared with the June 2012 DSA, the higher discount rate has a positive impact on the debt outlook, although this is partially offset by the assumption of a slower pace of fiscal deficit reduction and the assumed gradual reduction in the concessionality of external borrowing. While the public sector debt outlook remains favorable in the baseline, the public DSA, which only covers central government debt, shows that Tanzania’s public debt would not stabilize in the absence of continued fiscal consolidation. The rising share of non-concessional borrowing would increase the average interest rate as well as potential exposure to interest rate fluctuations (if it took the form of variable rate loans) and rollover risks (if it took the form of Eurobond issuance with a lumpy repayment profile). Another challenge stems from government obligations related to the civil service pension sector, as well as yet-to-be-captured borrowing by local governments and public enterprises. Moreover, adverse shocks to economic growth, financing terms, or the exchange rate would significantly worsen the debt dynamics. A major upside risk relates to potentially large revenues from natural gas finds, which however would materialize only a decade from now. These results highlight the need for Tanzania to sustain fiscal consolidation efforts, to adopt a prudent approach to non-concessional borrowing, to initiate pension reforms, and to take concrete steps in improving its debt and public investment management capacity.

UNITED REPUBLIC OF TANZANIA
12 INTERNATIONAL MONETARY FUND
Figure 1. Tanzania: Indicators of Public and Publicly Guaranteed External Debt Under Alternative Scenarios, 2014–20341/
Sources: Tanzanian authorities; and IMF staff estimates and projections.1/ The most extreme stress test is the test that yields the highest ratio on or before 2024. In figure b. it corresponds to a One-time depreciation shock; in c. to a Terms shock; in d. to a One-time depreciation shock; in e. to a Exports shock and in figure f. to a One-time depreciation
Baseline Historical scenario Most extreme shock 1/ Threshold Low growth
0
5
10
15
20
25
2014 2019 2024 2029 2034
f .Debt service-to-revenue ratio
0
5
10
15
20
25
30
35
0
1
2
3
4
5
6
2014 2019 2024 2029 2034
Rate of Debt AccumulationGrant-equivalent financing (% of GDP)Grant element of new borrowing (% right scale)
a. Debt Accumulation
0
50
100
150
200
250
2014 2019 2024 2029 2034
c.PV of debt-to-exports ratio
0
10
20
30
40
50
60
2014 2019 2024 2029 2034
b.PV of debt-to GDP ratio
0
50
100
150
200
250
300
350
2014 2019 2024 2029 2034
d.PV of debt-to-revenue ratio
0
5
10
15
20
25
30
2014 2019 2024 2029 2034
e.Debt service-to-exports ratio

UNITED REPUBLIC OF TANZANIA
INTERNATIONAL MONETARY FUND 13
Figure 2. Tanzania: Indicators of Public Debt Under Alternative Scenarios, 2014-20341
Sources: Tanzanian authorities; and IMF staff estimates and projections.1/ The most extreme stress test is the test that yields the highest ratio on or before 2024. 2/ Revenues are defined inclusive of grants.3/ The volatile profile of debt service is due to the projected armotization for public domesti
BaselinePublic debt benchmark
Most extreme shock 1/Historical scenario
Fix Primary Balance
0
50
100
150
200
250
2014 2016 2018 2020 2022 2024 2026 2028 2030 2032 2034
PV of Debt-to-Revenue Ratio 2/
0
10
20
30
40
50
60
70
80
2014 2016 2018 2020 2022 2024 2026 2028 2030 2032 2034
PV of Debt-to-GDP Ratio
EAC benchmark
0
5
10
15
20
25
30
2014 2016 2018 2020 2022 2024 2026 2028 2030 2032 2034
Debt Service-to-Revenue Ratio 2/ 3/

Table 1. Tanzania: External Debt Sustainability Framework, Baseline Scenario, 2011–20341
Historical 6/ Standard 6/
Average Deviation 2014-2019 2020-20342011 2012 2013 2014 2015 2016 2017 2018 2019 Average 2024 2034 Average
External debt (nominal) 1/ 35.1 34.0 34.3 36.8 37.8 38.0 38.3 38.5 38.7 35.7 31.0of which: public and publicly guaranteed (PPG) 29.8 28.8 29.2 32.0 33.0 33.3 33.6 33.7 33.9 30.7 25.6
Change in external debt 5.6 -1.1 0.2 2.6 0.9 0.2 0.3 0.2 0.2 -0.7 -0.2Identified net debt-creating flows 4.1 9.4 2.7 6.3 4.4 3.3 2.4 2.2 1.8 2.2 1.1
Non-interest current account deficit 9.1 18.1 13.7 9.5 4.4 13.9 12.8 11.7 11.1 10.6 10.1 9.8 8.2 9.3Deficit in balance of goods and services 12.4 19.2 14.8 15.1 14.0 12.9 11.9 11.4 10.8 10.0 8.0
Exports 29.8 31.0 27.2 25.6 25.5 25.1 25.4 25.7 25.4 27.7 32.8Imports 42.2 50.2 42.1 40.8 39.5 38.0 37.3 37.1 36.2 37.7 40.8
Net current transfers (negative = inflow) -4.2 -3.6 -2.6 -3.9 0.6 -2.2 -2.0 -1.9 -1.7 -1.6 -1.5 -1.1 -0.5 -0.9of which: official -3.1 -2.4 -1.7 -1.2 -1.0 -0.9 -0.9 -0.8 -0.8 -0.5 -0.2
Other current account flows (negative = net inflow) 0.9 2.5 1.4 1.0 0.8 0.6 0.8 0.8 0.8 0.8 0.7Net FDI (negative = inflow) -4.3 -6.1 -6.0 -4.7 1.0 -6.0 -6.7 -6.7 -7.0 -6.8 -6.7 -6.0 -6.0 -6.1Endogenous debt dynamics 2/ -0.8 -2.6 -5.0 -1.6 -1.7 -1.7 -1.7 -1.7 -1.6 -1.5 -1.2
Contribution from nominal interest rate 0.2 0.3 0.4 0.5 0.6 0.7 0.7 0.8 0.8 0.8 0.8Contribution from real GDP growth -1.9 -2.2 -2.0 -2.1 -2.3 -2.4 -2.4 -2.4 -2.4 -2.3 -2.0Contribution from price and exchange rate changes 0.9 -0.7 -3.3 … … … … … … … …
Residual (3-4) 3/ 1.5 -10.5 -2.5 -3.7 -3.5 -3.0 -2.1 -2.0 -1.5 -2.9 -1.2of which: exceptional financing 0.0 0.0 0.0 0.0 0.0 0.0 0.0 0.0 0.0 0.0 0.0
PV of external debt 4/ ... ... 22.2 24.7 25.9 26.4 26.8 27.1 27.4 25.8 24.2In percent of exports ... ... 81.7 96.2 101.5 105.2 105.7 105.3 108.1 93.3 73.8
PV of PPG external debt ... ... 17.2 19.9 21.2 21.7 22.1 22.4 22.6 20.9 18.8In percent of exports ... ... 63.2 77.5 83.0 86.5 87.2 86.9 89.3 75.4 57.4In percent of government revenues ... ... 98.5 107.1 109.7 111.1 113.2 114.4 115.9 102.8 81.8
Debt service-to-exports ratio (in percent) 4.0 2.4 3.0 4.6 6.3 7.2 8.6 9.2 9.6 8.6 8.6PPG debt service-to-exports ratio (in percent) 1.0 1.3 1.9 3.0 4.7 5.6 7.0 7.6 7.9 7.1 7.2PPG debt service-to-revenue ratio (in percent) 1.9 2.3 3.0 4.1 6.2 7.2 9.0 10.0 10.3 9.6 10.2Total gross financing need (Billions of U.S. dollars) 1.4 3.3 2.6 3.2 3.0 2.9 2.9 3.2 3.3 5.3 10.4Non-interest current account deficit that stabilizes debt ratio 3.5 19.2 13.4 11.4 11.9 11.4 10.8 10.4 9.9 10.5 8.4
Key macroeconomic assumptions
Real GDP growth (in percent) 6.7 6.7 6.9 7.0 0.3 7.1 7.1 7.1 7.0 6.9 6.9 7.0 6.9 7.0 6.9GDP deflator in US dollar terms (change in percent) -3.0 2.2 10.8 3.4 6.2 5.8 4.2 3.9 2.5 2.1 2.1 3.4 2.1 2.0 2.1Effective interest rate (percent) 5/ 0.9 0.9 1.3 0.9 0.2 1.7 1.9 2.0 2.1 2.2 2.2 2.0 2.3 3.0 2.5Growth of exports of G&S (US dollar terms, in percent) 22.8 13.3 4.3 15.4 7.8 6.7 11.0 9.3 10.9 10.7 7.5 9.4 11.0 11.0 11.0Growth of imports of G&S (US dollar terms, in percent) 19.5 29.5 -0.6 19.5 12.1 9.8 8.1 7.0 7.5 8.7 6.3 7.9 10.0 10.0 10.0Grant element of new public sector borrowing (in percent) ... ... ... ... ... 29.9 26.6 28.4 28.0 28.4 27.1 28.1 23.9 14.8 21.0Government revenues (excluding grants, in percent of GDP) 16.4 17.6 17.5 18.6 19.3 19.5 19.5 19.5 19.5 20.3 23.0 21.0Aid flows (in Billions of US dollars) 7/ 1.1 1.2 1.0 1.9 1.8 2.2 2.2 2.4 2.6 3.5 7.6
of which: Grants 1.1 1.2 1.0 1.2 1.2 1.5 1.4 1.5 1.7 2.6 6.2of which: Concessional loans 0.0 0.0 0.0 0.7 0.6 0.7 0.7 0.8 0.9 0.9 1.4
Grant-equivalent financing (in percent of GDP) 8/ ... ... ... 5.4 4.5 4.7 4.2 4.2 4.2 3.7 3.5 3.7Grant-equivalent financing (in percent of external financing) 8/ ... ... ... 54.1 54.5 60.8 58.0 58.1 57.1 60.9 53.8 58.6
Memorandum items:Nominal GDP (Billions of US dollars) 23.7 25.8 30.6 34.7 38.7 43.0 47.2 51.5 56.2 86.7 207.8Nominal dollar GDP growth 3.6 9.0 18.6 13.3 11.6 11.2 9.7 9.1 9.1 10.7 9.1 9.1 9.1PV of PPG external debt (in Billions of US dollars) 5.2 6.8 8.1 9.2 10.3 11.3 12.5 17.8 38.5(PVt-PVt-1)/GDPt-1 (in percent) 5.3 3.8 2.9 2.5 2.3 2.3 3.2 1.5 1.6 1.6Gross workers' remittances (Billions of US dollars) 0.0 0.1 0.0 0.0 0.0 0.0 0.0 0.0 0.0 0.1 0.1PV of PPG external debt (in percent of GDP + remittances) ... ... 17.2 19.9 21.1 21.7 22.1 22.3 22.6 20.8 18.8PV of PPG external debt (in percent of exports + remittances) ... ... 62.9 77.2 82.7 86.2 86.9 86.6 89.0 75.2 57.3Debt service of PPG external debt (in percent of exports + remittance ... ... 1.9 3.0 4.7 5.6 6.9 7.6 7.9 7.0 7.1
Sources: Tanzanian authorities; and staff estimates and projections.
1/ Includes both public and private sector external debt.2/ Derived as [r - g - ρ(1+g)]/(1+g+ρ+gρ) times previous period debt ratio, with r = nominal interest rate; g = real GDP growth rate, and ρ = growth rate of GDP deflator in U.S. dollar terms. 3/ Includes exceptional financing (i.e., changes in arrears and debt relief); changes in gross foreign assets; and valuation adjustments. For projections also includes contribution from price and exchange rate changes.4/ Assumes that PV of private sector debt is equivalent to its face value.5/ Current-year interest payments divided by previous period debt stock. 6/ Historical averages and standard deviations are generally derived over the past 10 years, subject to data availability. 7/ Defined as grants, concessional loans, and debt relief.8/ Grant-equivalent financing includes grants provided directly to the government and through new borrowing (difference between the face value and the PV of new debt).
Actual Projections
UN
ITEDREPU
BLICO
FTAN
ZANIA
14IN
TERNATIO
NAL
MO
NETARY
FUN
D

Table 2. Tanzania: Public Sector Debt Sustainability Framework, Baseline Scenario, 2011–2034 (In percent of GDP, unless otherwise indicated)
Estimate
2011 2012 2013 Average5/ Standard
Deviation
5/
2014 2015 2016 2017 2018 20192014-19 Average 2024 2034
2020-34 Average
Public sector debt 1/ 40.4 39.8 41.3 48.7 47.9 47.0 46.5 46.0 45.8 41.2 35.3of which: foreign-currency denominated 29.8 28.8 29.2 32.0 33.0 33.3 33.6 33.7 33.9 30.7 25.6
Change in public sector debt 6.6 -0.6 1.4 7.4 -0.8 -1.0 -0.5 -0.5 -0.1 -0.9 -0.1Identified debt-creating flows 5.1 -1.1 1.9 7.3 -0.1 -1.0 -0.4 -0.2 -0.1 -0.8 -0.2
Primary deficit 5.6 4.0 5.2 3.7 1.6 3.6 3.2 2.4 2.5 2.6 2.6 2.8 1.7 1.6 1.7Revenue and grants 21.1 22.1 20.8 22.0 22.4 23.0 22.5 22.5 22.5 23.3 26.0
of which: grants 4.7 4.5 3.4 3.4 3.1 3.5 3.0 3.0 3.0 3.0 3.0Primary (noninterest) expenditure 26.7 26.0 26.0 25.6 25.6 25.5 25.0 25.1 25.1 25.0 27.5
Automatic debt dynamics -0.5 -5.1 -3.8 -3.4 -3.8 -3.4 -2.9 -2.8 -2.7 -2.5 -1.8Contribution from interest rate/growth differential -2.2 -2.9 -2.3 -2.3 -3.0 -3.0 -2.8 -2.8 -2.7 -2.5 -1.8
of which: contribution from average real interest rate -0.1 -0.4 0.3 0.5 0.2 0.2 0.2 0.2 0.2 0.3 0.5of which: contribution from real GDP growth -2.1 -2.5 -2.6 -2.7 -3.2 -3.2 -3.1 -3.0 -3.0 -2.7 -2.3
Contribution from real exchange rate depreciation 1.7 -2.2 -1.5 -1.1 -0.8 -0.4 0.0 0.0 0.0 ... ...Other identified debt-creating flows 0.0 0.0 0.6 7.1 0.5 0.0 0.0 0.0 0.0 0.0 0.0
Privatization receipts (negative) 0.0 0.0 0.0 0.0 0.0 0.0 0.0 0.0 0.0 0.0 0.0Recognition of implicit or contingent liabilities 0.0 0.0 0.0 5.5 0.0 0.0 0.0 0.0 0.0 0.0 0.0Debt relief (HIPC and other) 0.0 0.0 0.0 0.0 0.0 0.0 0.0 0.0 0.0 0.0 0.0Other (specify, e.g. bank recapitalization) 0.0 0.0 0.6 1.6 0.5 0.0 0.0 0.0 0.0 0.0 0.0
Residual, including asset changes 1.5 0.6 -0.5 0.2 -0.7 0.0 -0.1 -0.2 0.0 -0.1 0.1
Other Sustainability IndicatorsPV of public sector debt ... ... 29.2 36.5 36.1 35.4 35.0 34.6 34.6 31.4 28.6
of which: foreign-currency denominated ... ... 17.2 19.9 21.2 21.7 22.1 22.4 22.6 20.9 18.8of which: external ... ... 17.2 19.9 21.2 21.7 22.1 22.4 22.6 20.9 18.8
PV of contingent liabilities (not included in public sector debt) ... ... ... ... ... ... ... ... ... ... ...Gross financing need 2/ 7.1 6.5 7.5 6.4 6.8 5.7 6.4 6.4 6.3 4.9 5.3PV of public sector debt-to-revenue and grants ratio (in percent) … … 140.3 166.0 161.0 153.6 155.3 153.6 153.3 134.7 110.0PV of public sector debt-to-revenue ratio (in percent) … … 167.5 196.8 186.9 181.1 179.1 177.1 176.9 154.5 124.2
of which: external 3/ … … 98.5 107.1 109.7 111.1 113.2 114.4 115.9 102.8 81.8Debt service-to-revenue and grants ratio (in percent) 4/ 6.9 11.3 10.9 13.0 16.1 14.2 17.1 17.0 16.4 13.8 14.3Debt service-to-revenue ratio (in percent) 4/ 8.9 14.2 13.0 15.4 18.7 16.7 19.7 19.6 18.9 15.8 16.2Primary deficit that stabilizes the debt-to-GDP ratio -1.0 4.5 3.8 -3.9 4.0 3.4 3.0 3.0 2.7 2.6 1.6
Key macroeconomic and fiscal assumptionsReal GDP growth (in percent) 6.7 6.7 6.9 7.0 0.3 7.1 7.1 7.1 7.0 6.9 6.9 7.0 6.9 7.0 6.9Average nominal interest rate on forex debt (in percent) 0.9 0.9 1.5 0.8 0.3 1.7 1.9 2.1 2.2 2.2 2.3 2.0 2.3 3.2 2.6Average real interest rate on domestic debt (in percent) 2.1 -1.0 2.8 2.6 2.2 4.0 1.4 1.4 1.7 1.6 1.5 1.9 1.8 3.0 2.2Real exchange rate depreciation (in percent, + indicates depreciation 7.7 -8.0 -5.7 -1.2 6.7 -4.1 ... ... ... ... ... ... ... ... ...Inflation rate (GDP deflator, in percent) 8.1 10.4 9.9 8.1 1.5 7.3 6.3 5.9 5.3 5.1 5.1 5.8 5.1 5.0 5.1Growth of real primary spending (deflated by GDP deflator, in percen 0.1 0.0 0.1 0.1 0.1 0.1 0.1 0.1 0.1 0.1 0.1 0.1 0.1 0.1 0.1Grant element of new external borrowing (in percent) ... ... ... … … 29.9 26.6 28.4 28.0 28.4 27.1 28.1 23.9 14.8 ...
Sources: Tanzanian authorities; and IMF staff estimates and projections.1/ [Indicate coverage of public sector, e.g., general government or nonfinancial public sector. Also whether net or gross debt is used.]2/ Gross financing need is defined as the primary deficit plus debt service plus the stock of short-term debt at the end of the last period. 3/ Revenues excluding grants.4/ Debt service is defined as the sum of interest and amortization of medium and long-term debt.5/ Historical averages and standard deviations are generally derived over the past 10 years, subject to data availability.
Actual Projections
UN
ITEDREPU
BLICO
FTAN
ZAIA
INTERN
ATION
ALM
ON
ETARYG
UN
D15

UNITED REPUBLIC OF TANZANIA
16 INTERNATIONAL MONETARY FUND
Table 3a. Tanzania: Sensitivity Analysis for Key Indicators of Public and Publicly
Guaranteed External Debt, 2014-2034 (In percent)
2014 2015 2016 2017 2018 2019 2024 2034
Baseline 20 21 22 22 22 23 21 19
A. Alternative Scenarios
A1. Key variables at their historical averages in 2014-2034 1/ 20 20 21 22 23 24 25 31A2. New public sector loans on less favorable terms in 2014-2034 2 20 22 24 25 27 28 30 32A3. Alternative Scenario : Low growth 20 22 24 25 26 27 28 26
B. Bound Tests
B1. Real GDP growth at historical average minus one standard deviation in 2015-2016 20 21 22 22 22 22 21 19B2. Export value growth at historical average minus one standard deviation in 2015-2016 3/ 20 22 23 23 24 24 21 19B3. US dollar GDP deflator at historical average minus one standard deviation in 2015-2016 20 22 25 25 25 26 23 21B4. Net non-debt creating flows at historical average minus one standard deviation in 2015-2016 4/ 20 23 24 24 25 25 22 19B5. Combination of B1-B4 using one-half standard deviation shocks 20 23 25 25 25 26 23 20B6. One-time 30 percent nominal depreciation relative to the baseline in 2015 5/ 20 29 30 31 31 31 29 26
Baseline 78 83 87 87 87 89 75 57
A. Alternative Scenarios
A1. Key variables at their historical averages in 2014-2034 1/ 78 79 83 85 88 94 89 93A2. New public sector loans on less favorable terms in 2014-2034 2 78 87 95 100 103 110 107 97A3. Alternative Scenario : Low growth 77 87 95 99 102 108 101 79
B. Bound Tests
B1. Real GDP growth at historical average minus one standard deviation in 2015-2016 78 82 86 86 86 88 74 56B2. Export value growth at historical average minus one standard deviation in 2015-2016 3/ 78 88 97 97 96 98 81 60B3. US dollar GDP deflator at historical average minus one standard deviation in 2015-2016 78 82 86 86 86 88 74 56B4. Net non-debt creating flows at historical average minus one standard deviation in 2015-2016 4/ 78 88 97 97 96 98 80 57B5. Combination of B1-B4 using one-half standard deviation shocks 78 86 90 90 89 91 75 56B6. One-time 30 percent nominal depreciation relative to the baseline in 2015 5/ 78 82 86 86 86 88 74 56
Baseline 107 110 111 113 114 116 103 82
A. Alternative Scenarios
A1. Key variables at their historical averages in 2014-2034 1/ 107 104 106 111 115 121 122 133A2. New public sector loans on less favorable terms in 2014-2034 2 107 115 122 129 136 143 146 139A3. Alternative Scenario : Low growth 106 115 122 129 135 140 138 113
B. Bound Tests
B1. Real GDP growth at historical average minus one standard deviation in 2015-2016 107 109 111 112 114 115 102 81B2. Export value growth at historical average minus one standard deviation in 2015-2016 3/ 107 112 118 120 120 122 105 81B3. US dollar GDP deflator at historical average minus one standard deviation in 2015-2016 107 117 126 128 129 131 116 92B4. Net non-debt creating flows at historical average minus one standard deviation in 2015-2016 4/ 107 117 124 125 126 127 109 82B5. Combination of B1-B4 using one-half standard deviation shocks 107 119 128 129 130 131 114 88B6. One-time 30 percent nominal depreciation relative to the baseline in 2015 5/ 107 153 154 157 158 160 142 113
PV of debt-to-exports ratio
PV of debt-to-revenue ratio
PV of debt-to GDP ratio
Projections

UNITED REPUBLIC OF TANZANIA
INTERNATIONAL MONETARY FUND 17
Table 3b. Tanzania: Sensitivity Analysis for Key Indicators of Public and Publicly
Guaranteed External Debt, 2014-2034 (concluded) (In percent)
2014 2015 2016 2017 2018 2019 2014 2034
Baseline 3 5 6 7 8 8 7 7
A. Alternative Scenarios
A1. Key variables at their historical averages in 2014-2034 1/ 3 5 5 7 7 8 7 8A2. New public sector loans on less favorable terms in 2014-2034 2 3 5 5 6 6 6 7 9A3. Alternative Scenario : Low growth 3 5 6 8 9 9 9 11
B. Bound Tests
B1. Real GDP growth at historical average minus one standard deviation in 2015-2016 3 5 6 7 8 8 7 7B2. Export value growth at historical average minus one standard deviation in 2015-2016 3/ 3 5 6 8 8 9 8 8B3. US dollar GDP deflator at historical average minus one standard deviation in 2015-2016 3 5 6 7 8 8 7 7B4. Net non-debt creating flows at historical average minus one standard deviation in 2015-2016 4/ 3 5 6 7 8 8 8 7B5. Combination of B1-B4 using one-half standard deviation shocks 3 5 6 7 8 8 7 7B6. One-time 30 percent nominal depreciation relative to the baseline in 2015 5/ 3 5 6 7 8 8 7 7
Baseline 4 6 7 9 10 10 10 10
A. Alternative Scenarios
A1. Key variables at their historical averages in 2014-2034 1/ 4 6 7 9 10 10 10 12A2. New public sector loans on less favorable terms in 2014-2034 2 4 6 6 8 8 8 9 13A3. Alternative Scenario : Low growth 4 6 8 10 11 12 13 15
B. Bound Tests
B1. Real GDP growth at historical average minus one standard deviation in 2015-2016 4 6 7 9 10 10 10 10B2. Export value growth at historical average minus one standard deviation in 2015-2016 3/ 4 6 7 9 10 11 10 10B3. US dollar GDP deflator at historical average minus one standard deviation in 2015-2016 4 7 8 10 11 12 11 12B4. Net non-debt creating flows at historical average minus one standard deviation in 2015-2016 4/ 4 6 7 10 11 11 10 10B5. Combination of B1-B4 using one-half standard deviation shocks 4 6 8 10 11 11 11 11B6. One-time 30 percent nominal depreciation relative to the baseline in 2015 5/ 4 9 10 13 14 14 13 14
Memorandum item:Grant element assumed on residual financing (i.e., financing required above baseline) 6/ 13 13 13 13 13 13 13 13
Sources: Tanzania authorities; and IMF staff estimates and projections.
1/ Variables include real GDP growth, growth of GDP deflator (in U.S. dollar terms), non-interest current account in percent of GDP, and non-debt creating flows. 2/ Assumes that the interest rate on new borrowing is by 2 percentage points higher than in the baseline., while grace and maturity periods are the same as in the baseline.3/ Exports values are assumed to remain permanently at the lower level, but the current account as a share of GDP is assumed to return to its baseline level after the shock (implicitly assumingan offsetting adjustment in import levels). 4/ Includes official and private transfers and FDI.5/ Depreciation is defined as percentage decline in dollar/local currency rate, such that it never exceeds 100 percent.6/ Applies to all stress scenarios except for A2 (less favorable financing) in which the terms on all new financing are as specified in footnote 2.
Debt service-to-revenue ratio
Projectins
Debt service-to-exports ratio

UNITED REPUBLIC OF TANZANIA
18 INTERNATIONAL MONETARY FUND
Table 4. Tanzania: Sensitivity Analysis for Key Indicators of Public Debt 2014-2034
2014 2015 2016 2017 2018 2019 2024 2034
Baseline 37 36 35 35 35 35 31 29
A. Alternative scenarios
A1. Real GDP growth and primary balance are at historical averages 37 37 37 38 38 39 44 53A2. Primary balance is unchanged from 2014 37 36 37 37 38 38 42 51A3. Permanently lower GDP growth 1/ 37 36 35 35 35 35 32 31
B. Bound tests
B1. Real GDP growth is at historical average minus one standard deviations in 2015-20 37 36 36 36 35 35 33 31B2. Primary balance is at historical average minus one standard deviations in 2015-201 37 38 40 39 39 39 35 31B3. Combination of B1-B2 using one half standard deviation shocks 37 37 39 38 38 38 34 31B4. One-time 30 percent real depreciation in 2015 37 44 42 41 40 40 37 36B5. 10 percent of GDP increase in other debt-creating flows in 2015 37 45 44 43 43 43 38 33
Baseline 166 161 154 155 154 153 135 110
A. Alternative scenarios
A1. Real GDP growth and primary balance are at historical averages 166 163 161 167 170 174 187 206A2. Primary balance is unchanged from 2014 166 162 159 165 167 170 182 197A3. Permanently lower GDP growth 1/ 166 161 154 156 154 155 138 120
B. Bound tests
B1. Real GDP growth is at historical average minus one standard deviations in 2015-20 166 162 156 158 157 157 141 119B2. Primary balance is at historical average minus one standard deviations in 2015-201 166 170 173 175 172 171 149 119B3. Combination of B1-B2 using one half standard deviation shocks 166 167 167 169 168 167 148 121B4. One-time 30 percent real depreciation in 2015 166 195 183 183 179 177 157 139B5. 10 percent of GDP increase in other debt-creating flows in 2015 166 201 191 193 190 189 163 127
Baseline 13 16 14 17 17 16 14 14
A. Alternative scenarios
A1. Real GDP growth and primary balance are at historical averages 13 16 14 18 18 18 19 25A2. Primary balance is unchanged from 2014 13 16 14 18 18 18 18 24A3. Permanently lower GDP growth 1/ 13 16 14 17 17 16 14 15
B. Bound tests
B1. Real GDP growth is at historical average minus one standard deviations in 2015-20 13 16 14 17 17 17 14 15B2. Primary balance is at historical average minus one standard deviations in 2015-201 13 16 15 19 19 18 15 15B3. Combination of B1-B2 using one half standard deviation shocks 13 16 15 18 19 18 15 16B4. One-time 30 percent real depreciation in 2015 13 17 17 21 21 21 20 23B5. 10 percent of GDP increase in other debt-creating flows in 2015 13 16 17 22 21 20 17 17
Sources: Tanzanian authorities; and IMF staff estimates and projections.1/ Assumes that real GDP growth is at baseline minus one standard deviation divided by the square root of the length of the projection period.2/ Revenues are defined inclusive of grants.
PV of Debt-to-GDP Ratio
Projections
PV of Debt-to-Revenue Ratio 2/
Debt Service-to-Revenue Ratio 2/

Press Release No. 14/182
FOR IMMEDIATE RELEASE
April, 25, 2014
IMF Executive Board Concludes Third Review of an Arrangement Under the Standby
Credit Facility with Tanzania
The Executive Board of the International Monetary Fund (IMF) today concluded the third and
final review of an arrangement under the Standby Credit Facility (SCF)1 with Tanzania. The SCF
was approved in July 2012 (see Press Release No. 12/252). In February 2013, the authorities
drew the full accumulated amount of US$114 million under the SCF arrangement through that
date. No drawings have been made since then, and the authorities have indicated that they do not
intend to make further drawings on the arrangement, which expires on April 30, 2014.
The Board also concluded the 2014 Article IV consultation; a press release will be issued
separately.
Following the Executive Board discussion, Mr. Min Zhu, Deputy Managing Director and Acting
Chair, said:
“The Tanzanian authorities are to be commended for the broadly satisfactory implementation of
their economic program supported by the Fund’s Standby Credit Facility. Prudent
macroeconomic policies have delivered buoyant economic growth and successful disinflation.
1 The SCF supports low-income countries that have reached broadly sustainable macroeconomic positions, but may
experience episodic, short-term financing and adjustment needs, including those caused by shocks. The SCF
supports countries’ economic programs aimed at restoring a stable and sustainable macroeconomic position
consistent with strong and durable growth and poverty reduction. It also provides policy support and can help
catalyze foreign aid. (See http://www.imf.org/external/np/exr/facts/scf.htm.) Details on Tanzania’s SCF are
available at www.imf.org/tanzania
International Monetary Fund
700 19th Street, NW
Washington, D. C. 20431 USA

2
“Preserving macroeconomic stability is essential for continued strong growth. Yet,
vulnerabilities may be building up, with pressures for additional fiscal expenditures and a large
current account deficit. To safeguard the sustainability of the public finances, improved public
financial management is a priority, going forward.
“A key objective for the remainder of this fiscal year is to contain expenditures within the limits
set in the mid-year budget review and to strengthen revenue administration. Looking ahead,
efforts will be needed to mobilize additional revenues, beginning with the VAT reform, while
ensuring that revenue assumptions are realistic, so as to eschew the accumulation of new arrears
and to avoid abrupt expenditure cuts during budget execution.
“A crucial medium-term challenge will be to set up appropriate institutional arrangements to
ensure that the benefits from the exploitation of natural gas fields accrue to all Tanzanians. This
will involve establishing a fair taxation regime, transparent contracts with the companies
involved, and a framework to manage resource wealth that promotes inter-generational equity
and is fully integrated with the budget process.
Tanzania is becoming increasingly interconnected with the global economy and greater focus on
international competitiveness is warranted. Accordingly, the exchange rate should fully reflect
market conditions, and a variety of reforms need to be undertaken to dismantle remaining
impediments to trade, including infrastructure bottlenecks, and improve the business climate.”

Press Release No. 14/227
FOR IMMEDIATE RELEASE
May 15, 2014
IMF Executive Board Concludes 2014 Article IV Consultation with Tanzania
On April 25, 2014, the Executive Board of the International Monetary Fund (IMF) concluded the
Article IV consultation1 with Tanzania and completed the third and final review of the country’s
performance under an economic program supported by a Standby Credit Facility arrangement
(see Press Release No. 14/182).
Economic growth in Tanzania is projected to remain strong at 7 percent next year and in the
medium term. Inflation is at 6 percent, gradually converging to the authorities’ 5 percent medium
term objective. The external current account deficit remains among the largest in the region, at
14 percent of GDP this year. Fiscal revenue shortfalls and overruns in domestically-financed
spending led the deficit to rise to 6.8 percent of GDP in 2012/13. Revenue shortfalls in 2013/14
compared to the budget approved by parliament have prompted the authorities to undertake
expenditure cuts during the fiscal year in an effort to meet their 5 percent of GDP deficit target.
Based on the debt sustainability analysis, Tanzania remains at low risk of debt distress. A major
opportunity for the long term, not yet incorporated in the baseline projections, relates to sizable
finds of offshore natural gas that, if confirmed as commercially viable, could generate significant
exports and government revenues during the 2020s.
Executive Board Assessment2
Executive Directors commended the skilful macroeconomic management that has delivered rapid
growth, falling inflation, and continued poverty reduction in the context of Fund-supported
economic programs. Noting risks to the outlook and remaining vulnerabilities, Directors
encouraged the authorities to consolidate the gains so far by stepping up efforts to improve the
1 Under Article IV of the IMF's Articles of Agreement, the IMF holds bilateral discussions with members, usually
every year. A staff team visits the country, collects economic and financial information, and discusses with officials
the country's economic developments and policies. On return to headquarters, the staff prepares a report, which
forms the basis for discussion by the Executive Board.
2 At the conclusion of the discussion, the Managing Director, as Chairman of the Board, summarizes the views of
Executive Directors, and this summary is transmitted to the country's authorities. An explanation of any qualifiers
used in summings up can be found here: http://www.imf.org/external/np/sec/misc/qualifiers.htm.
International Monetary Fund
700 19th
Street, NW
Washington, D. C. 20431 USA

2
policy frameworks, reconstitute buffers, and push ahead with structural reforms in a variety of
areas.
To safeguard the sustainability of the public finances, Directors recommended containing public
spending within the limit of the mid-term budget review, while addressing poverty alleviation
and the large infrastructure deficit through careful expenditure prioritization. They also
encouraged the authorities to intensify revenue mobilization, including through accelerated VAT
reforms. More broadly, Directors agreed that the achievement of fiscal targets would benefit
from further improvements in public financial management, which would prevent the recurrence
of arrears and facilitate their resolution. It would also be important to improve the quality and
dissemination of fiscal data.
Directors commended the Bank of Tanzania for reducing inflation to the mid-single digits and
preserving financial stability. Looking ahead, they advised to further strengthen prudential
oversight, including as regards the regime against money-laundering and the financing of
terrorism. Directors also welcomed the central bank’s intention to transition to an interest rate-
based monetary policy framework, and encouraged a review of the foreign exchange market to
promote greater transparency and efficiency.
Directors took note of the staff’s assessment that the Tanzanian shilling appears to be somewhat
overvalued in real effective terms, but agreed that Tanzania’s ongoing structural transformation
amplifies the uncertainty surrounding such assessment. They nonetheless considered that the
persistently high external current account deficit points to the need to boost external
competitiveness through enhanced exchange rate flexibility as well as additional reforms to
reduce implements to trade, promote financial deepening, and improve the business climate.
Noting that the recent offshore discoveries of natural gas could present a major opportunity for
Tanzania, Directors recommended establishing over the medium-term transparent institutional
frameworks for natural gas taxation and wealth management with a view to fostering good
governance and inter-generational equity.

3
Table 1. Tanzania: Selected Economic and Financial Indicators, 2010/11–2017/18
2010/11 2011/12 2012/13 2013/14 2014/15 2015/16 2016/17 2017/18
Prog.1 Prel. Prog.
1 Proj. Proj. Proj. Proj. Proj.
(Annual percentage change, unless otherwise indicated)
National income and prices
Nominal GDP (in billions of TSh) 34,913 41,125 48,264 48,348 55,228 55,559 63,263 71,718 80,801 90,810
Real GDP growth (calendar year) 2 6.4 6.9 7.0 7.0 7.2 7.2 7.0 7.1 7.0 6.8
Real GDP growth 6.7 6.7 7.0 6.9 7.1 7.1 7.1 7.1 7.0 6.9
Consumer prices (period average) 7.0 17.8 11.6 11.3 7.2 5.8 5.1 5.0 5.0 5.0
Consumer prices (end of period) 10.9 17.4 9.5 7.6 6.0 5.0 5.0 5.0 5.0 5.0
GDP deflator (period average) 8.1 10.3 … 10.0 … 7.4 6.3 5.9 5.3 5.1
External sector
Exports, f.o.b (in billions of U.S. dollars) 4.9 5.6 5.9 5.4 6.5 5.5 6.1 6.6 7.3 7.9
Imports, f.o.b. (in billions of U.S. dollars) 8.0 10.6 11.0 10.5 12.3 11.5 12.4 13.3 14.3 15.6
Export volume 10.9 8.9 2.0 -2.2 12.6 9.7 12.7 10.7 10.6 9.1
Import volume 6.2 28.8 3.2 -2.0 10.2 10.1 9.1 8.7 8.0 8.9
Terms of trade 1.2 1.6 3.4 -1.5 -2.5 -6.9 -1.3 0.2 -0.5 0.3
Nominal effective exchange rate (end of
period; depreciation= -)3 -17.7 6.4 0.6 1.2 ... ... ... ... ... ...
Real effective exchange rate (end of period;
depreciation= -)3 -13.6 21.5 6.0 6.1 ... ... ... ... ... ...
Money and credit
Broad money (M3) 22.0 10.9 14.5 14.9 13.0 14.5 15.5 14.8 14.1 13.8
Average reserve money 19.3 14.2 15.7 14.5 11.9 14.9 13.9 13.4 12.7 12.4
Credit to nongovernment sector 24.3 18.6 17.4 17.1 13.9 16.5 14.7 14.5 13.2 16.2
Velocity of money (GDP/M3; average) 3.2 3.2 3.3 3.3 3.4 3.4 3.3 3.3 3.3 3.2
Treasury bill interest rate (in percent; end of
period) 4.8 13.8 … 13.9 … … … … … …
(Percent of GDP)
Public Finance
Revenue (excluding grants) 16.4 17.6 18.1 17.5 19.9 18.4 19.3 19.5 19.5 19.5 Total grants 4.7 4.5 3.7 3.6 4.2 3.3 3.4 3.5 3.0 3.0 Expenditure
4 27.0 26.2 27.6 28.0 29.1 26.9 27.6 27.1 26.6 26.6
Overall balance (excluding grants)5 -11.4 -8.6 -9.5 -10.5 -9.2 -8.5 -8.3 -7.5 -7.0 -7.0
Overall balance (including grants)5 -6.6 -5.0 -5.8 -6.8 -5.0 -5.2 -4.9 -4.0 -4.0 -4.0
Domestic financing (excluding gas pipeline financing) 3.6 0.8 1.0 2.2 1.0 1.4 1.0 0.5 0.7 0.7 Domestic debt stock (end of period)
6 9.6 11.1 10.4 11.6 10.1 10.5 10.2 9.5 9.2 8.8
Total public debt6,7
39.4 39.8 41.6 40.8 43.3 41.4 42.5 42.1 42.4 42.5
Savings and investment
Resource gap (net exports of goods and services) -15.3 -17.6 -16.7 -15.6 -15.6 -14.8 -14.0 -12.9 -12.0 -11.4 Investment 34.5 35.5 39.2 34.4 38.3 33.4 32.1 31.5 31.5 31.6
Government 8.5 8.8 9.1 8.6 8.9 8.5 8.6 8.6 8.6 8.7
Nongovernment8 26.0 26.8 30.2 25.7 29.4 24.9 23.5 22.9 22.9
Gross domestic savings 19.3 18.0 22.6 18.8 22.7 18.6 18.2 18.6 19.5 20.2
External sector
Current account balance (excluding current transfers) -12.5 -20.8 -16.0 -15.7 -17.0 -15.7 -14.5 -13.3 -12.7 -12.2
Current account balance (including current transfers) -9.4 -18.4 -14.3 -14.0 -15.2 -14.5 -13.3 -12.3 -11.7 -11.3
(Billions of U.S. dollars, unless otherwise indicated)
Balance of payments Current account balance (excluding current
transfers; deficit= -) -3.0 -5.4 -4.8 -4.8 -5.7 -5.4 -5.6 -5.7 -6.0 -6.3 Gross official reserves (end of period) 3.6 3.8 4.2 4.4 4.5 4.6 5.2 5.6 6.2 6.8
In months of imports of goods and services (current year) 4.3 3.5 3.8 4.1 3.6 3.9 4.0 4.1 4.2 4.3
Total external debt stock (end of period; percent of GDP)
7 33.1 34.4 35.0 35.7 36.8 36.7 37.6 37.3 37.5 37.7
Sources: Tanzanian authorities and IMF staff estimates and projections 1 From the sixth review under the PSI and the second review under the SCF arrangement
2 E.g. Calendar year corresponding to 2011/12 is 2012.
3 The figure for 2012/13 reflects the change from July 2012 through June 2013.

4
4 Including unidentified fiscal measures.
5 Actual and preliminary data include adjustment to cash basis.
6 Net of Treasury bills issued for liquidity management
7 Excludes external debt under negotiation for relief, and domestic unpaid claims (reported in Table 2b).
8 Including change in stocks.

Statement by Mr. Saho, Executive Director for United Republic of Tanzania April 25, 2014
Introduction
The Tanzanian authorities have demonstrated a track record of sound macroeconomic policy implementation, which has culminated in robust economic growth and a stable macroeconomic environment. The judicious implementation of a Fund-supported Policy Support Instrument (PSI) (June 2010–June 2013) and the current 18-month Standby Credit Facility (SCF) arrangement has laid a solid foundation to sustain the growth momentum, improve the country’s external competitiveness, maintain price stability, and rebuild fiscal buffers. Overall economic policy, going forward, will focus on the scaling-up of investments in infrastructure and key productive sectors, preserving macroeconomic stability and addressing the underlying structural impediments to growth, consistent with the key national and regional objectives set out in their poverty reduction strategy (the Mkukuta II), the Five Year Development Plan, and the East African Community (EAC) protocols.
Performance under the SCF arrangement has been broadly satisfactory since the inception of the program in July 2012, reflecting the authorities’ adherence to prudent macroeconomic policies and commitment to deepen structural reforms. In view of the continued strong performance—with all but one quantitative PC for end-June 2013 met together with most indicative targets for end-September and December 2013, and the significant progress achieved in implementing the structural reform agenda—my authorities request Directors’ support for the completion of the third and final review under the SCF arrangement. In this context, they request a waiver for the nonobservance of the performance criterion on net domestic financing, breached in the authorities’ bid to ensure continued financing of critical development projects in the face of shortfalls in foreign financing and domestic revenue mobilization.
The Tanzanian authorities appreciate the constructive engagement and policy dialogue with staff in their effort to address the daunting socio-economic challenges and create an environment conducive to supporting their development agenda. They value highly the support of the Fund Management and Executive Directors, and consider the staff report informative, well balanced, and an important source of meaningful policy advice.
Recent economic developments and prospects
The Tanzanian economy continues to register strong economic growth, estimated at 7.0 percent in 2013. Growth has been largely broad-based, driven by increased activity in the agriculture, transport and communications, trade, real estate and business services, and manufacturing sectors. Overall economic growth is projected at 7.2 percent in 2014. The inflation environment remains benign, with headline and core inflation declining during the second half of 2013, on account of tight monetary policy and reduced supply side bottlenecks. Annual headline and core inflation were 5.6 percent and 4.5 percent, respectively, in December 2013 down from 12.1 percent and 8.9 percent in December 2012.

2
Fiscal management, in FY2012/13, was challenged by dwindling external budgetary support, optimistic revenue projections, and weaknesses in public financial management systems. While total expenditures were contained within program targets, the shortfall in domestic revenue mobilization relative to budget projection and the program target resulted in a higher-than-anticipated fiscal deficit, breaching the overall deficit target of 5.5 percent of GDP by 0.3 percent. In spite of efforts to address the accumulation of domestic arrears, the stock increased over the year by 0.5 percent to 1.0 percent of GDP at end-June 2013.
The Bank of Tanzania (BoT) has maintained a tight monetary policy stance, culminating in a decline in key monetary aggregates, with broad money (M3) and private sector credit growth in line with end-December 2013 program targets. Inflation expectations have been effectively anchored and, as highlighted inter alia, inflation has continued to trend downwards. The exchange rate has remained fairly stable, supporting the disinflationary path. The banking sector has remained profitable and adequately capitalized. Financial soundness indicators are robust, with most commercial banks fulfilling the new statutory minimum capital requirement. The portfolio of non-performing loans shrunk steadily from 8.1 percent at end- 2012 to 6.5 percent at end-2013. Effort to improve loan quality and minimize default was bolstered by the establishment of credit reference bureaus.
Medium-term policies and outlook
Fiscal policy
My authorities have continued to pursue prudent fiscal policy aimed at promoting economic growth, enhancing service delivery and improving the socio-economic welfare of the populace, all within the ambit of macroeconomic stability and fiscal sustainability. To this end, they will seek to strike an appropriate balance between their objectives of promoting inclusive growth and preserving macroeconomic stability. To achieve these objectives, they intend to pursue a path of gradual but sustained deficit reduction, culminating in the attainment of the 3 percent of GDP stipulated under the East African Monetary Union (EAMU) protocol. Expenditure restraints and enhanced domestic revenue mobilization would form centerpiece of their medium term fiscal strategy.
On expenditures, the authorities intend to contain recurrent spending, including on the wage bill, while focusing on priorities outlined in the Mkukuta II and the Five Year Development Plan. The strengthening of the public financial management systems will also be vigorously pursued to improve budget execution, including curbing the recurring issue of accumulation of domestic arrears. In the meantime, prompt action is being taken to clear a sizeable portion of longstanding arrears, including by earmarking a portion of potential capital gains taxes on the sale of offshore natural gas exploration rights. To help prevent further build-up of new arrears, a moratorium has been imposed on the contracting of new domestically-financed multi-year projects and a high-level committee comprising key government entities established to provide oversight.

3
On the revenue front, the authorities are committed to expediting implementation of VAT reforms, with a view to modernize the VAT administration, broaden the tax base and streamline the scope of tax exemptions. Key tax legislations will also be revised in line with international best practices.
Monetary and exchange rate policy
My authorities aim to maintain a tight monetary policy stance with the objective to further reduce inflation to the BoT’s policy target of 5 percent in the medium term. To achieve this objective, the BoT will set its policy rate consistent with the envisaged disinflationary path. The authorities will remain vigilant and closely monitor risks to inflation, including those arising from regional supply shocks and domestic energy prices. The array of monetary policy instruments at the Bank’s disposal will be expanded, the sterilization of excess liquidity complemented by more active foreign exchange sales, and the liquidity forecasting and management framework further strengthened. In addition, the authorities will undertake to better understand the channels through which monetary policy impulses are transmitted through the real economy, with a view to gradually transit to an interest rate-based monetary policy framework. They will continue to rely on Fund technical advice and practical operational guidance to ensure a smooth transition.
On the exchange rate, the BoT reaffirms its commitment to a market determined exchange rate regime, and considers it an important safeguard against exogenous shocks. To this end, interventions in the foreign exchange market will be limited to liquidity management and to smoothen out short-term fluctuations in the exchange rate. The BoT will also seek to attain a healthy level of gross international reserves, consistent with the statutory requirement of its Act. In the spirit of the EAC common market protocols, the capital account will be fully liberalized by December 2015 to allow for freer movement of capital within the community and with the rest of the world.
Financial sector stability
My authorities have preserved the stability of the financial sector and promoted its further deepening. While financial soundness indicators have been favorable and the banking sector adequately capitalized, the BoT’s efforts at reinforcing the bank supervisory and regulatory framework will be unrelenting. Consequently, the authorities will continue to sharpen financial stability monitoring tools and enhance the bank stress-testing framework, with technical assistance from the Fund. In addition, the authorities are in the process of developing a framework for consolidated supervision. They also plan to build on the progress in addressing the weaknesses in the country’s AML/CFT framework by undertaking a national assessment of potential risks and proffering appropriate policy measures to mitigate these risks.
Structural reforms
My authorities are committed to implementing far-reaching structural reforms to complement their sound macroeconomic policies, with a view to achieve a more broad-based growth, create employment opportunities and reduce poverty.

4
Recent offshore discoveries of substantial natural gas reserves, if found to be commercially viable, have the potential to lead to the structural transformation of the Tanzanian economy. Mindful of this immense opportunity, my authorities have initiated a process of developing an appropriate fiscal framework that ensures efficient management of prospective revenues from natural gas. A natural gas policy has already been adopted and, with donor support, a comprehensive policy and regulatory framework is being developed. Drafting of a policy paper on fiscal management of gas revenues and amendments to the Income Tax Act incorporating mining and petroleum taxation are expected going forward.
Restoring the financial viability of the national power utilities company (TANESCO) remains a major preoccupation of my authorities going forward. Implementation of an average 40 percent increase in electricity tariff, with effect from January 1, 2014, underscores their commitment to achieving this goal and ensuring more efficient service delivery. Given the recent progress in addressing its financial obligations, and with the expected realization of external donor funding, the profitability of TANESCO is expected to be restored over the medium term.
Development of the private sector will constitute an important component of the country’s economic program for FY2014/15 and the medium term. Efforts to improve the business environment will focus on addressing the huge infrastructure deficit, strengthening the institutional and legal framework for doing business, and enhancing access to credit. Effective implementation of the Mkukuta II is to continue up to end-June 2015. Subsequently, review of the Mkukuta II process is to be undertaken and a successor poverty reduction strategy developed.
Conclusion
My Tanzanian authorities remain committed to pursuing sound macroeconomic policies and implementing far-reaching structural reforms to promote a more inclusive and balanced growth and address the high level of unemployment, within a stable macroeconomic environment. In this regard, they intend requesting Board approval of a successor PSI in the months ahead, following a process of extensive internal consultations to ensure broad ownership and political buy-in of the proposed economic and financial policies. They expect a new program to be effectively aligned with the policy objectives set out in their medium-term macroeconomic framework.