imf country report no. 15/6 republic of korea country report no. 15/6 republic of korea ... the...
TRANSCRIPT

©2015 International Monetary Fund
IMF Country Report No. 15/6
REPUBLIC OF KOREA FINANCIAL SECTOR ASSESSMENT PROGRAM
STRESS TESTING AND FINANCIAL STABILITY ANALYSIS—TECHNICAL NOTE
The Technical Note on Stress Testing And Financial Stability Analysis for the Republic of Korea was prepared by a staff team of the International Monetary Fund. It is based on the information available at the time it was completed in July 2014.
Copies of this report are available to the public from
International Monetary Fund Publication Services PO Box 92780 Washington, D.C. 20090
Telephone: (202) 623-7430 Fax: (202) 623-7201 E-mail: [email protected] Web: http://www.imf.org
Price: $18.00 per printed copy
International Monetary Fund Washington, D.C.
January 2015
REPUBLIC OF KOREA
REPUBLIC OF KOREA
FINANCIAL SECTOR ASSESSMENT PROGRAM December 2014
TECHNICAL NOTE
STRESS TESTING AND FINANCIAL STABILITY ANALYSIS
Prepared by
Monetary and Capital Markets Department
This Technical Note was prepared by IMF staff in the context of the Financial Sector Assessment Program in Korea. It contains technical analysis and detailed information underpinning the FSAP’s findings and recommendations. Further information on the FSAP can be found at http://www.imf.org/external/np/fsap/fssa.aspx.
REPUBLIC OF KOREA
2 INTERNATIONAL MONETARY FUND
CONTENTS
GLOSSARY _________________________________________________________________________________________ 4
EXECUTIVE SUMMARY ___________________________________________________________________________ 5
INTRODUCTION __________________________________________________________________________________ 7 A. Background _____________________________________________________________________________________ 7 B. Key Risks and Vulnerabilities __________________________________________________________________ 10 C. Broad Framework of the FSAP Stress Testing Exercise ________________________________________ 14
BANKING SECTOR SOLVENCY STRESS TESTS _________________________________________________ 16 A. Framework ____________________________________________________________________________________ 16 B. Solvency Scenarios ____________________________________________________________________________ 17 C. Results _________________________________________________________________________________________ 21 D. Further Considerations ________________________________________________________________________ 24
BANKING SECTOR LIQUIDITY STRESS TESTS _________________________________________________ 24 A. Framework for Top-down Stress Testing ______________________________________________________ 24 B. Results of Top-down Test _____________________________________________________________________ 26 C. Framework for the Bottom-up Tests __________________________________________________________ 28 D. Results of the Bottom-up Stress Test _________________________________________________________ 30
SIMPLE STRESS TEST OF NON-BANK DEPOSITORY INSTITUTIONS _________________________ 30
FURTHER CONSIDERATIONS ___________________________________________________________________ 32
BOXES 1.Global Financial Crisis: Korea Stabilization Policy Measures ______________________________________ 8 2. Stress Testing Framework of the Korean Authorities __________________________________________ 15 FIGURES 1. Volatility of Real Gross Domestic Product Growth Rate _________________________________________ 7 2. Distribution of Bank Capital Ratios ______________________________________________________________ 9 3. Bank Return on Assets Across Countries, 2012 ________________________________________________ 11 4. Corporate Sector Debt Repayment Risk—Debt at Risk _______________________________________ 12 5. Household Debt at Risk not Covered by Assets _______________________________________________ 13 6. Macroeconomic Scenario: GDP Path __________________________________________________________ 19 7. Probability of Default in Stress Scenarios ______________________________________________________ 20 8. Commercial Banks: One-year Impact of Credit Costs __________________________________________ 22 9. Housing Price to Disposable Income, OECD Ccountries _______________________________________ 22 10. Commercial Banks: Market Risk ______________________________________________________________ 23 11. Impact of Single-Factor Shocks on Banks' Capital Adequacy Ratios _________________________ 24 12. Results of Top-down Liquidity Stress Test: Breakdown of 30-day Flows _____________________ 27 13. Top-down Foreign Exchange Liquidity Stress Test: Liquid Asset Ratios ______________________ 28 14. Bottom-up Liquidity Stress Tests: Breakdown of 30-Day Cash Flows ________________________ 30
REPUBLIC OF KOREA
INTERNATIONAL MONETARY FUND 3
TABLES 1. Projected and Stressed GDP ___________________________________________________________________ 19 2. Top-down Liquidity Stress Test Assumptions __________________________________________________ 26 3. Assumptions of Bottom-up Liquidity Stress Test ______________________________________________ 29 4. Reverse Stress Tests of Non-bank Depository Institutions ____________________________________ 32 APPENDIXES I. Overview of Korea’s Financial System __________________________________________________________ 34 II. Bank Soundness and Stress Test Results ______________________________________________________ 35 III. Solvency Test Assumptions ___________________________________________________________________ 39 IV. Stress Test Matrices ___________________________________________________________________________ 40
REPUBLIC OF KOREA
4 INTERNATIONAL MONETARY FUND
Glossary
AFS Available for Sale BOK Bank of Korea BU Bottom-up (Stress Test) CAR Capital Adequacy Ratio OECD Organization for Economic Co-operation and Development FSAP Financial Sector Assessment Program FSR Financial Stability Report FSS Financial Supervisory Service FX Foreign Exchange GDD Global Double-Dip (Stress Test Scenario) GDP Gross Domestic Product HTM Held to Maturity IMF International Monetary Fund KAMCO Korean Asset Management Company KRW Korean Won LCR Liquidity Coverage Ratio LTV Loan-to-value Ratio MSB Mutual Savings Bank NBDI Non-Bank Depository Institution NBFI Non-Bank Financial Institution NIM Net Interest Margin NPL Nonperforming Loan PSG Prolonged slow growth (Stress Test Scenario) ROA Return on Assets RWA Risk-weighted Assets SAMP Systemic Risk Assessment Model for Macroprudential Policy SME Small and Medium-sized Enterprise TD Top-down (Stress Test) UAMCO United Asset Management Company UMP Unconventional Monetary Policy USD/US$ United States Dollar WEO World Economic Outlook

REPUBLIC OF KOREA
INTERNATIONAL MONETARY FUND 5
EXECUTIVE SUMMARY1
The financial stability assessment under the Financial Sector Assessment Program (FSAP) for Korea was carried out in close collaboration with the authorities. The assessment included top-down (TD) and bottom-up (BU) stress testing of Korea’s commercial banks and certain non-bank depository institutions (NBDIs); and evaluation of the potential contagion across banks (stemming both from funding pressures and potential defaults). The FSAP team did not have access to confidential supervisory data for the stress tests and the contagion analyses.2 The practice of withholding information in the context of an FSAP, while undesirable, is also observed in other FSAPs. As a result, the analyses were carried out by the authorities in cooperation with participating banks, with the FSAP team performing extensive methodological and estimation validations of the results.
The stress testing exercise included TD and BU stress tests of banks’ solvency and liquidity. For the solvency analysis, the TD tests were based on the internal Systemic Risk Assessment Model for Macroprudential Policy (SAMP) developed by the Bank of Korea (BOK), complemented by macroeconomic projections from the BOK’s macroeconomic model. These were supplemented by BU tests, carried out by individual banks. For the liquidity analysis, the TD tests were carried out by the Financial Supervisory Service (FSS), with separate assessments of banks’ local currency and foreign exchange (FX) liquidity risks. BU tests of liquidity were performed by individual banks, and were based on a different set of assumptions on potential liquidity outflows. All stress tests were based on assumptions and parameters agreed between the authorities and the FSAP team.
The solvency tests include four scenarios that capture key macrofinancial risks. The first three scenarios assess the adverse impact of a potential deterioration in external factors—including renewed and intense uncertainty in Europe and a considerable slowdown of growth in China—that can undermine demand for Korean exports and lead to a sharp economic slowdown. These include: (i) a mild global double-dip; (ii) a severe global double-dip (with shocks of one and two standard deviations of real GDP growth, respectively); and (iii) prolonged slow growth (with cumulative real GDP growth rate deviating by one standard deviation below baseline over a five-year horizon). Growth shocks under these scenarios are commensurate in intensity with those in other FSAPs. The shock under the severe double-dip scenario is more extreme compared to the 1997 Asian crisis. The fourth scenario includes an increase in domestic interest rates in response to a potential unwinding of U.S. unconventional monetary policy (UMP). It is motivated by the prevalence of variable-rate
1 Prepared by Ms. Silvia Iorgova (MCM) and Mr. Phakawa Jeasakul (MCM), with inputs by Ms. Hong Wong (MCM), and Ms. Sonali Jain-Chandra (APD). 2 While there are publicly available balance sheet data for Korea’s banks, the FSAP team did not have access to historical data on NPL sales and write-offs to estimate a macro-financial satellite model of banks’ credit risk. The team also did not have access to data on interbank positions to estimate contagion effects via its network model.

REPUBLIC OF KOREA
6 INTERNATIONAL MONETARY FUND
mortgages in Korea, with policy rates assumed to increase by 250 basis points over two and a half years, starting in mid-2014. Results of stress tests show that Korean banks are well-positioned to withstand severe macrofinancial shocks. The results of the stress testing exercise show that Korean banks can absorb shocks of a larger magnitude compared to the 1997 Asian crisis (under the severe double-dip scenario). All major banks remain well capitalized, and meet the Basel III capital requirements. A rise in interest rates due to a potential unwinding of UMP in the United States is found to have only a limited negative impact on domestic banks, even though the results should be treated with caution.3 Banks’ liquidity risks, both in local currency and FX, tend to be manageable, albeit with a small gap in FX liquidity. The stress testing exercise also included an assessment of the soundness of NBDIs, suggesting thin capital buffers against potential credit risks for some institutions. Stress tests of non-banking institutions were deemed essential for assessing financial stability in Korea, given that these institutions, while individually small, collectively account for 20 percent of domestic household credit. Some NBDIs—including mutual savings banks (MSBs) and credit unions—were found to be able to handle only up to a 6–8 percentage point increase in nonperforming loans before capital fell below the regulatory minimum.
However, the stress test findings are subject to certain important limitations: The FSAP team did not have direct access to supervisory data and publicly available data was
insufficient to carry out an independent analysis. Hence, implementation was carried out by the authorities, with validation of models and results by the FSAP team.
The stress tests did not include certain segments of the financial system. Banks’ stress tests covered only commercial banks, and did not include policy banks or foreign bank branches. Stress tests of non-bank institutions excluded certain types of individually small but collectively large NBDIs due to the lack of sufficient supervisory data.
Complex macrofinancial feedback effects were captured only partially in the stress testing exercise. For example, the BOK macroeconomic model accounts only partially for the impact of higher interest rates on banks’ credit risk, as it does not embed full feedback loops from higher mortgage rates to households’ debt payment burdens and consumption. To accounts for these ‘second-round’ effects, the authorities applied an exogenous ad hoc consumption shock, specified by the FSAP team.
3 The BOK macroeconomic projections model cannot account fully for the impact of higher interest rates on banks’ credit risk (see discussion of stress test limitations below).

REPUBLIC OF KOREA
INTERNATIONAL MONETARY FUND 7
INTRODUCTION
A. Background
1. While Korea has experienced steady economic growth over the past decade, growth moderated sharply in 2012 on global economic headwinds, and only recovered modestly in 2013. Over the past decade, economic growth has been stable and less volatile relative to G20 peers (Figure 1). However, growth decelerated sharply to 2 percent in 2012 from 6.3 percent in 2010, on continued drag on exports and broad-based weakening of domestic demand and particularly fixed investment. The economy has been on a path to economic recovery in 2013 on stronger private consumption and construction, due in part to a low base, but also to a pick-up in wage growth.
Figure 1. Volatility of Real GDP Growth Rate (Standard deviation of annual growth rate, in percent)
Source: International Monetary Fund, World Economic Outlook
2. The economic recovery has been supported by a timely and measured policy response by the Korean authorities. The government introduced a modest fiscal stimulus of 1¼ percent of GDP via a supplementary budget in April 2013. The fiscal consolidation path, to which the government previously committed, has now been delayed as the output gap is still negative, and the 2013 fiscal deficit (excluding social security funds) is projected to widen to 2.1 percent of GDP. The monetary policy stance has been accommodative, with the BOK introducing 50 basis point cumulative cuts in the policy rate since July 2012. In addition, in April 2013, the government introduced a comprehensive policy package to stimulate the languid housing market.
0
1
2
3
4
5
6
7
Fran
ce
Can
ada
Chi
na
Uni
ted
Stat
es
Kore
a
Uni
ted
King
dom
Bra
zil
Ital
y
Indi
a
Japa
n
Ger
man
y
Mex
ico
Rus
sia
1980-2012
2000-2012

REPUBLIC OF KOREA
8 INTERNATIONAL MONETARY FUND
3. Korea’s financial sector has withstood well the aftermath of the global financial crisis, bolstered by robust policy measures. The initial dry-out of liquidity in global money markets, following the collapse of Lehman Brothers, led to a sharp reduction in Korean banks’ FX credit lines and curbed the banks’ ability to roll over short-term external borrowings. The U.S. dollar (USD) funding shortages spilled over into domestic money markets and raised the perceived default risk of Korean banks, given their considerable reliance on wholesale funding. However, despite intensifying liquidity pressures and other negative crisis effects, the financial system has remained stable, due to the prompt introduction of a broad spectrum of policy measures to counteract the mounting financial stability pressures (see Box 1).
Box 1. Global Financial Crisis: Korea Stabilization Policy Measures
After the outbreak of the 2008 crisis, the authorities undertook a broad array of measures to ensure adequate provision of KRW and FX and liquidity to banks; mitigate the debt overhang of domestic corporates; preempt capitalization pressures on banks; and ensure the flow of credit to the economy.1 Most measures, with the exception of the support to small and medium-sized enterprises (SMEs), have been phased out by now. The concrete steps included:
Providing generous liquidity support in both KRW and USD. The BOK broadened the list of eligible counterparties and collateral in its KRW-denominated repo operations and supplied KRW 16.8 trillion in liquidity via long-term repos. It also set aside KRW 5 trillion, of which KRW 2.1 trillion were used, to purchase corporate bonds and commercial papers under the Bond Market Stabilization Fund. Regarding U.S. dollar liquidity, the BOK used foreign reserves and entered into currency swap deals with major central banks to provide up to US$56 billion to banks and trade-related businesses.
Guaranteeing banks’ external debt. The government guaranteed banks’ foreign debt in 2009, even though the scale of use was limited. By end-2009, several banks were able to tap funds from international capital markets without recourse to the government guarantee.
Establishing recapitalization and restructuring funds. In December 2008, the authorities set up a Bank Recapitalization Fund of KRW 20 trillion as a preemptive measure to strengthen banks’ capital base. A one-time injection of KRW 4 trillion into eight banks was carried out in March 2009. The Fund was used on a temporary, countercyclical basis during the crisis to avert potential moral hazard. The Korea Asset Management Corporation (KAMCO) also stood ready to issue up to KRW 40 trillion government-backed bonds to purchase corporate nonperforming loans (NPLs) from financial institutions (only a fraction was used).
Ensuring SMEs’ access to credit. The authorities raised the amount of available SME credit guarantees, increased the guarantee coverage up to 100 percent, and guided banks to roll over all SME loans falling due in 2009. Subsidized lending facilities for SMEs were also expanded, with the BOK raising the Aggregate Credit Ceiling by KRW 3.5 trillion to KRW 10 trillion.
Actively using macroprudential tools to contain systemic liquidity risks in the banking sector. This step was critical in view of Korean banks’ significant reliance on wholesale funding and short-term external debt.
1 Structurally, the dependence of the banking sector on wholesale funding prior to the 2008 crisis was considerably higher in Korea than in the rest of Asia.

REPUBLIC OF KOREA
INTERNATIONAL MONETARY FUND 9
4. The Korean banking system is now considerably sounder compared to late 2008, supported by various policy measures. Banks’ liquidity profiles have improved markedly on the adoption of tighter macroprudential requirements, reflected in lower FX liquidity mismatches and less reliance on short-term wholesale funding among banks.4,5 Banks’ capitalizations have been bolstered by direct capital injections via the Bank Recapitalization Fund after the 2008 crisis. The aggregate capital adequacy ratio (CAR) of the banking system was sound at 14.3 percent as of end-September 2013, up from 12.5 percent at end-2008 (Figure 2). Banks’ capital adequacy is also high compared to other countries.
5. The pace of growth of banks’ exposures to the household sector has slowed down, even though lending by NBFIs remains brisk; banks are mostly exposed to the corporate sector. Household debt, as a share of disposable income, increased rapidly in the early 2000s, rising by more than 40 percentage points from an already high base in 2004 to 156 percent at end-2011. Policy measures to ensure soft landing in household debt, coupled with softer fundamentals—including slowdown in the global economy and weaker domestic demand—have induced some slowdown in household lending since mid-2011. However, household lending by the less-regulated non-bank financial institutions (NBFIs) is still brisk, and at end-June 2013, NBFIs already accounted
4 These macroprudential measures include a ceiling on long-term FX loan-to-deposit ratio (2009); a cap on forward FX contracts (2009); a leverage cap on banks’ FX derivatives positions (2010); and a levy on non-deposit FX liabilities (progressively higher for shorter maturities; 2011).
5 FX lending by Korean commercial banks is relatively limited, accounting for 9 percent of total loans at end-2012. In principle, the link between Korean banks’ external borrowing and domestic FX lending was weak even before the 2008 crisis. In the 30 months prior to the crisis, the rise in external borrowing was five times that of domestic FX lending, and was mostly channeled into FX derivatives positions with local shipbuilding companies (for more on this, see Ree, Yoon and Park (2013).
Figure 2. Distribution of Bank Capital Ratios (In percent; by bank)
Source: Financial Supervisory Service.
0
4
8
12
16
20
1 2 3 4 5 6 7 1 2 3 4 5 6 1 2 3 4 5
September 20132008
Average = 14.3Average = 12.3
Nationwide banks Regional banks Specialized banks

REPUBLIC OF KOREA
10 INTERNATIONAL MONETARY FUND
for roughly a half of the outstanding household loans.6 Altogether, most bank lending (61 percent of the total) is still channeled to the corporate sector. This is less the case for commercial banks (56 percent of total loans) and more so for specialized banks (70 percent). Corporate credit is concentrated in a small number of industries. Three industries—manufacturing, wholesale and retail, and real estate account for roughly two thirds of corporate lending by domestic banks, with manufacturing alone at 44 percent of the total. 6. The current structure of household loans poses a vulnerability to the financial system, despite gradual regulatory changes. Firstly, a high share of mortgage loans—33.6 percent as of end-March 2013—is structured as bullet loans, with households repaying interest and refinancing loans every three years. The need to refinance the loans periodically exposes households to considerable refinancing risks. Secondly, household debt is dominated by variable rate loans, exposing households to a sharp rise of financing costs and banks to rising credit risks, in case of an upward shift in interest rates. The share of fixed rate loans has been increasing, from 5.1 percent at end-2010 to 36.3 percent in March 2013, reflecting regulatory guidance. This has lowered the interest rate risk for households, but has effectively transferred it to banks, potentially raising the vulnerabilities of the latter if they do not adequately hedge this risk or price the fixed-rate loans properly.7
B. Key Risks and Vulnerabilities
7. Banking sector profitability has been subject to downward pressures. Since the onset of the global financial crisis, profitability has been impacted negatively by: (i) the sustained low interest rate environment, which has compressed net interest margins (NIMs); (ii) heightened credit costs due to deteriorating macroeconomic conditions, with higher write-offs and distressed asset sales; (iii) conservative regulatory provisioning standards (up to 150 percent of expected losses); and (iv) some supervisory pressures on banks to cut interest rates and fees. The return on assets (ROA) of commercial banks in 2012 was only 0.5 percent, compared to 1–1¼ percent in 2005–07, lower than in many other peer countries (Figure 3). Importantly, the share of non-interest income since the onset of the crisis has remained low, on average at 17 percent of total income in 2008–11. 6 As of end-June 2013, year-on-year growth in banks’ household loans was down to 2.8 percent, compared to 6.1 percent as of end-June 2011; for NBDIs, growth was down to 4.2 percent from 15.2 percent. However, household lending by non-depository NBFIs continued to rise rapidly, at 13.4 percent year-on-year as of end-June 2013. Also, NBDI lending accelerated to 7 percent by end-2013. In previous years, NBFI lending increased considerably due to differences in prudential (DTI/LTV) limits on bank and non-bank institutions in the late 2000s.
7 In Korea, banks hedge interest rate risk by issuing mortgage-backed securities (MBS) via the Housing Finance Corporation or covered bonds (with legislation for the latter enacted in January 2014).

REPUBLIC OF KOREA
INTERNATIONAL MONETARY FUND 11
Figure 3. Bank Return on Assets Across Countries, 2012 (In percent)
Source: International Monetary Fund, Global Financial Stability Report, April 2013.
8. Banks’ asset quality is sound, reflecting a practice of active disposal of bad assets, mostly via market mechanisms. Commercial banks’ NPLs accounted for only 1.3 percent of total loans at end-2012, and have generally been persistently low (at less than 1 percent) in recent years. However, the low NPL levels reflect active disposal of bad assets, with an average of about 1 percent per year written off or sold, mostly via market mechanisms, to Asset Management Companies (AMCs), such as the United Asset Management Corporation (UAMCO). As a result, new NPL flows outstrip considerably outstanding NPLs, and account for about 1.7-2.6 percent of total loans. AMCs’ recovery rates are allegedly high, with lenders legally having senior claims on up 120 percent of the face value of a loan. However, if housing prices decline sharply, these mechanisms may break down if there is scarcity of counterparties in asset auctions. 9. However, a substantial amount of corporate debt appears to be at risk.8 Debt at risk indicates debt repayment difficulties at a specific point in time and, hence, does not map directly into a potential rise in banks’ NPLs. However, weaker profitability due to the slowdown of economic activity—particularly in certain industries that are facing structural challenges or have been particularly exposed to the global slowdown—has impaired the debt repayment ability of Korean firms. The aggregate debt at risk of the corporate sector—debt owned by financially distressed corporates—has remained elevated, at levels close to those prevailing at the time of the 2008 crisis.9 8 The analysis of the debt at risk of the corporate sector includes some public enterprises, given that the data used in the exercise cannot be split meaningfully between private and public entities. The used data sources include a dataset of companies subject to external audit (compiled by the Bank of Korea) and a dataset of listed companies (provided by Worldscope).
9 Companies are considered financially distressed, and their debt at risk, if their earnings before tax and interest cannot fully cover their interest expenses—i.e., their interest coverage ratios are below 1.
-3
-2
-1
0
1
2
3
4
Co
lom
bia
Ar g
entin
aIn
do
nesi
aTu
rke y
Rus
sia
Phi
li pp
ines
Mex
ico
Bra
zil
Mal
a ysi
aS
out
h A
fric
aS
ing
apo
reC
hile
Po
land
Thai
land
Aus
tral
iaC
anad
aN
ew Z
eala
ndU
nite
d S
tate
sIn
dia
Ho
n g K
ong
SA
RN
orw
a yS
wed
enF
inla
ndK
ore
aU
krai
neF
ranc
eJa
pan
Den
mar
kIta
l yU
nite
d K
ing
do
mN
ethe
rland
sP
ort
u gal
Hun
gar
yS
pai
nG
reec
e

REPUBLIC OF KOREA
12 INTERNATIONAL MONETARY FUND
The aggregate debt at risk of the corporate sector accounted for 29 percent of corporate debt at end-2012, only marginally lower than the 31 percent at end-2008 (Figure 4). The risks appear concentrated in fewer companies in certain sectors, including construction, ship-building and cross-border transportation.
Figure 4. Corporate Sector Debt Repayment Risk: Debt at Risk 1/ 2/ (In percent of aggregate corporate debt)
Source: Bank of Korea. 1/ Based on companies subject to external audit. 2/ Debt at risk refers to debt of companies with interest coverage ratios (ICR) below 1. The ICR is defined as earnings before tax and interest (EBIT) to interest payments.
10. Household indebtedness is high and while short-term vulnerabilities appear limited, rapid housing price deterioration remains a vulnerability in the medium to long term. In the past decade, Korean households have become highly leveraged, with household debt as a share of disposable income increasing from 116 percent in 2004 to 156 percent at end-2011. Both the banking sector and particularly the non-banking sector have considerable exposures to households, with the latter accounting for roughly half of household loans. In the near term, financial stability risks appear muted, in view of high household wealth and prudential buffers, as well as improving growth outlook. The aggregate debt at risk—debt owed by financially distressed households—after accounting for the mitigating effect of asset holdings, accounted for only 0.7 percent of household debt at end-2012 (Figure 5).10 However, a considerable house price decline poses risks in the medium term. A first-order effect of house price decline (i.e., without accounting for negative feedback effects through consumption and growth), would lead to a marginal increase of debt at risk, from 0.7 percent to 1 percent of total household debt. However, a decline in credit quality and
10 Debt at risk is defined as the debt owed by financially distressed borrowers with high debt service ratio of over 40 percent.
10
14
18
22
26
30
34
2007 2008 2009 2010 2011 2012

REPUBLIC OF KOREA
INTERNATIONAL MONETARY FUND 13
an upsurge in credit costs can create a negative feedback loop via a slowdown of the economy and a potential further decline in household creditworthiness.11
Figure 5. Household Debt at Risk not Covered by Assets, by Type of Household 1/
(In percent of aggregate household debt)
Source: Korea Institute of Finance, based on the Household Survey of the Korea National Statistical Office, and a modeling framework provided by the IMF. 1/ Debt at risk refers to the share of debt owed by borrowers with DSR over 40 percent.
11. The exposure of the Korean financial system to post-crisis intensification of risks in global financial markets has been muted, but remains largely untested. In the aftermath of the 2008 crisis, banks decreased considerably their dependence on short-term wholesale funding in global markets. However, they are still exposed to some potential funding pressures if global financial risks increase sharply, for example via a re-intensification of stress in the euro area where most foreign funding originates. Moreover, so far Korea has been largely unaffected by the capital outflows related to a potential UMP exit, but its status of safe haven is still untested. A disorderly UMP exit and a sudden reversal of capital flows could impair the already weak business sentiment and investment. Tighter financial conditions could also put a brunt on domestic growth as funding costs of banks and corporates rise.
11 While the propagation of second-round effects is critical for the scale of the potential impact on households’ creditworthiness, the modeling of these effects is constrained by the lack of historical data on the debt service ratio.
0
5
10
15
20
25
30
All
hous
ehol
ds Q1
Q2
Q3
Q4
Q5
<30
30-3
9
40-4
9
50-5
9
>=60
Full-
time
Part
-tim
e
Self-
empl
oyed
Not covered by financial assets
Not covered by all assets
By Income By Age By Employment Type
REPUBLIC OF KOREA
14 INTERNATIONAL MONETARY FUND
C. Broad Framework of the FSAP Stress Testing Exercise
12. The FSAP stress testing exercise was carried out in close collaboration with the Korean authorities, making use of their existing systemic risk analytical and supervisory tools. The assessment entailed both TD and BU stress tests of commercial banks’ solvency and liquidity, including an evaluation of contagion across banks due to funding liquidity pressures and potential defaults. The FSAP team did not have access to confidential supervisory data, a practice which is undesirable but also observed in other FSAPs. The analyses were carried out by the authorities, with extensive methodological and estimation validations by the FSAP team. The TD solvency tests made use of the BOK’s SAMP framework (used for macroprudential surveillance), complemented by macro projections from the BOK macroeconomic model. These were supplemented by BU tests, carried out by individual banks. The TD liquidity stress tests (local currency and FX) were carried out by the FSS. 13. However, the stress test findings are subject to some important limitations:
The FSAP team did not have direct access to supervisory data. The stress tests were
implemented by the Korean authorities (BOK for solvency stress tests and FSS for liquidity tests). The FSAP team carried out validation of the results, including a discussion with the authorities on the mechanics of their stress testing model and the stability of the estimated parameters. However, the FSAP team could not run the model and verify independently the parameters estimated by the authorities’ model against historical data, as it did not have access to the underlying supervisory data or to sufficient publicly available data.
The FSAP team did not have direct communication with banks on the BU stress testing process. BU stress test results and follow-up inquiries (including methodological questions) were communicated to the FSAP team by the FSS. This did not allow for full validation of banks’ results by the FSAP team.
The stress tests did not include certain segments of the financial system. Per agreement with the authorities, banks’ stress tests covered only commercial banks, and did not include policy institutions and foreign bank branches. Also, the stress tests of non-bank institutions excluded certain types of small (but numerous) NBDIs (e.g., community credit cooperatives)—which collectively account for about 10 percent of aggregate loans—due to the lack of sufficient supervisory data.
Complex macrofinancial feedback effects were captured only partially in the stress testing exercise. For example, the BOK macroeconomic model accounts only partially for the link between higher interest rates and banks’ credit risk, as it does not embed full feedback loops from higher mortgage rates to households’ debt payment burdens and consumption. To accounts for these ‘second-round’ effects, the authorities applied an exogenous ad hoc consumption shock, specified by the FSAP team.
REPUBLIC OF KOREA
INTERNATIONAL MONETARY FUND 15
Box 2. Stress Testing Framework of the Korean Authorities
The BOK has been conducting TD stress tests of the banking system for surveillance (macroprudential) purposes on an ad hoc but frequent basis. These exercises are applied to the commercial banking sector, including the top seven nationwide banks and regional banks. The solvency tests focus on the core risks of Korean banks, including credit risk from: (i) loan to large enterprises; (ii) SME loans; (iii) mortgages; (iv) credit card loans; and (v) other household loans, as well as market risks related to valuation losses on securities in banks’ trading and available-for-sale (AFS) accounts, due to movements in interest rates, stock prices and exchange rates. The BOK also carries out liquidity stress tests of banks’ FX liquidity conditions, with stresses expressed in the form of aggregate liquidity buffers for the banking system in absolute terms. The results of these exercises are not made publicly available on a continuous basis, but some results are published on an ad hoc basis in the BOK Financial Stability Report (FSR). The FSR also occasionally includes analyses on specific types of risks, such as those resulting from banks’ exposures to large enterprises.
The TD solvency stress testing framework of the BOK is highly sophisticated. The stress tests use various modules of the BOK’s SAMP, which integrates different macro-financial systemic risk analyses. The SAMP can project macro-financial factors from a joint fat tail-risk distribution to assess potential bank profits and losses. It also permits an assessment of the propagation of second-round default and liquidity contagion effects across the banking sector. Bank losses due to default contagion are estimated via a network model of the banking system, which takes into account both losses due to liquid asset sales and credit crunches. Contagion due to funding liquidity problems is evaluated via another network model that captures interactions between banks’ default and funding liquidity risks, while taking into account the maturity structures of banks’ assets and liabilities. The model estimates additional funding costs, deposit run-offs (due to capital adequacy concerns), and liquidity shortages. A default due to liquidity contagion occurs if the net worth of a bank that was previously not in default falls below the default threshold due to liquidity contagion losses.
The FSS has been conducting TD FX liquidity stress tests since 2010 and also, in supervisory context, requires from banks to conduct regular BU stress testing exercises. The BU exercises are normally carried out on a biannual basis for banks’ solvency and on monthly basis for FX liquidity. For the purposes of FX liquidity stress testing, the FSS has been applying, and also requiring from banks to apply, shocks in line with the sizable deterioration of banks’ FX liquidity during the 2008 crisis. The scenarios, which banks are expected to apply, entail worsening of liquidity conditions in line with those experienced during the Asian and the global financial crises. However, apart from the supervisory tests, some commercial banks do not carry stress tests that are sufficiently tailored to their own bank-specific risks, and may thus overlook near-term risks relevant for internal capital planning and for potential supervisory actions.
While Korea’s stress testing framework is robust, its effectiveness can be enhanced in several respects. The degree of coordination between the BOK and the FSS can be expanded. Currently, the two institutions do not communicate results to each other, and hence there is no effective channel for cross-validation of BU results (produced by the FSS) and TD results (produced by the BOK). Such cross-validation is deemed essential by many national authorities for effectively validating BU results, as suggested by an IMF survey of stress testing practices.1 In addition, the BU exercise supervised by the FSS would benefit from a more thorough validation of results obtained from banks, for example, of the ways in which banks estimate losses. Finally, the process of systemic risk monitoring would benefit from the adoption of a framework for ongoing stress testing of NBFIs. 1 See Oura, H. and Liliana B. Schumacher, 2012, “Macrofinancial Stress Testing—Principles and Practices,” IMF Policy Paper (Washington: International Monetary Fund).

REPUBLIC OF KOREA
16 INTERNATIONAL MONETARY FUND
BANKING SECTOR SOLVENCY STRESS TESTS
A. Framework
14. The solvency tests evaluated credit and market risks in the banking sector under various stressed macroeconomic scenarios. The scenarios were constructed to reflect extreme but plausible macroeconomic events, and were agreed with the Korean authorities. They were assumed to have a risk horizon of five years through the end-2017, and were estimated using end-2012 data. The scenario-based analysis was carried out both by the authorities (on TD basis), and by individual banks (on BU basis): The TD stress tests covered all commercial banks. These entities include the seven nationwide
banks and all regional banks, the latter treated as an aggregate entity. These institutions account for 100 percent of aggregate assets of commercial banks, 63 percent of aggregate assets of the entire banking system, and 30 percent of aggregate assets of financial institutions. TD stress tests were carried out on a bank-level consolidated basis, using bank-by-bank data by the BOK.
BU tests covered the seven nationwide commercial banks. These institutions account for 76 percent of aggregate assets of commercial banks, 56 percent of aggregate assets of the entire banking sector and 27 percent of aggregate assets of financial institutions.12
Both solvency approaches evaluated credit risks related to different types of bank exposures. These include credit risks related to on- and off-balance sheet exposures; exposures to specific sectors, including corporations (large corporations and SMEs) and households (mortgages, credit cards and other lending). In the BU exercise, banks also provided a breakdown of estimated losses by type of off-balance sheet exposures (related to derivatives and non-derivatives). However, banks did not provide estimates of credit risks due to large exposures. Also, it was unfeasible to evaluate breakdowns of losses from exposures to specific industries, including manufacturing; shipbuilding and shipping; construction and commercial real estate.13
Both solvency approaches also included an evaluation of market risks, based on changes in the prices of the held securities. In both the TD and BU approaches, market risks were broken down by type of account (trading and AFS), and by type of security (domestic sovereign debt, other domestic debt, foreign debt, equities and other securities). Held-to-maturity (HTM) positions were assumed not to be subject to shocks. In both approaches, banks recognized
12 These institutions included Kookmin, Woori, Shinhan, Hana, Korea Exchange, Standard Chartered and Citibank.
13 Normally, Korean banks do not estimate PDs and LGDs on exposures by industry and by currency and the burden on computing these in the limited timeframe of the FSAP exercise was deemed to be too large.
REPUBLIC OF KOREA
INTERNATIONAL MONETARY FUND 17
gains or losses related to trading account through profits and losses, and those related to the AFS account through reserves.
The solvency tests adopted various behavioral assumptions, agreed with the Korean authorities. Banks’ balance sheets were assumed to grow based on: (i) the projected level of credit for each year to 2017 (with projections estimated based on the BOK’s SAMP); and (ii) an assumed constant share of non-loan assets in total assets based on average long-term growth. For the TD, the profitability projections in the baseline were based on the bank profit and loss module of the BOK’s SAMP, linking banks’ profits to twelve macro risk factors (including real, financial and external variables). For the BU, banks projected net interest income under the baseline using their own internal models, but were provided with projections of non-interest income by the BOK’s SAMP, given the lack of internal models to estimate non-interest income. Existing NPLs were adjusted up to include NPL sales, given the practice of active disposal of NPLs by domestic banks. However, new problem loans were assumed to maintain a default status and banks to provision fully any losses over the entire five-year stress testing horizon.14 More details on the various assumptions are provided in Appendix 3.
Potential risks were assessed based on various solvency benchmarks, including Tier 1 capital and total regulatory capital. The hurdle rate is based on Basel II for 2013 and on the Basel III schedule starting 2014, including a conservation buffer but excluding SIFI surcharges. The definition of capital is based on Basel III, while that of risk-weighted assets (RWA) is based on Basel 2.5 and III.
15. The stress testing exercise also included sensitivity tests to individual risk factors. The single-factor sensitivity analyses quantified the impact of shocks associated with one-time changes in individual risk factors, all else equal. The sensitivity tests assessed credit risks related to a one-time spike in interest rates, exchange rate depreciation, and a fall in real house prices. The choice of shocks was motivated by the high share of variable-rate loans to households and households’ vulnerability to housing price shocks, given high mortgage debt.
B. Solvency Scenarios
16. The solvency of the Korean banking system was evaluated under four adverse macroeconomic scenarios. The scenarios were formulated to reflect the key macro-financial risks in Korea, and were mutually agreed with the Korean authorities. The impact of each scenario was evaluated against a baseline scenario based on the April 2013 IMF’s World Economic Outlook (WEO) projections. The scenarios include:
14 New NPLs are provisioned at 100 percent after allowing banks to draw down provisions to required regulatory levels in case of over-provisioning.
REPUBLIC OF KOREA
18 INTERNATIONAL MONETARY FUND
Scenario 1: A mild global double-dip (mild GDD), with a shock equivalent to one standard
deviation of real GDP growth from the baseline in the first two years of the five-year horizon. This scenario assumes a positive (linear) adjustment to baseline in the third year after the shock (see Table 1 for magnitude of suggested shocks). The scenario is assumed to be linked to a global shock, including a significant slowdown in China.
Scenario 2: A severe global double-dip (severe GDD), with a shock equivalent to two standard deviations of real GDP growth from the baseline in the first two years, and a (linear) positive adjustment to baseline in the third and fourth year after the shock. The shock is assumed to be linked to deterioration in global conditions, as in the mild shock.
Scenario 3: Prolonged slow growth (PSG), with cumulative real GDP growth rate deviating by one standard deviation below baseline over a five-year horizon. The magnitude of the shock is based on deviation from trend of the five-year cumulative GDP growth rate between 1990 and 2012. This shock is assumed to be linked to lingering uncertainty in advanced countries and is expected to be severe and protracted.
Scenario 4: An increase in domestic interest rates in response to unwinding of UMP globally. Given the prevalence of variable-rate mortgages in Korea, an exogenous upward interest rate shock can have a considerable negative impact on the repayment ability of domestic borrowers and on banks’ credit costs. Moreover, negative second-round (amplifying) effects via the real economy justify examining the impact of such potential stress via macroeconomic scenario analysis, rather than via single-factor sensitivity analysis. For example, higher mortgage rates can have a negative cash-flow effect on consumption and on the demand for housing, and thus led to deterioration in house prices, a further rise in banks’ credit costs, and reduced credit availability.
17. The scenarios were calibrated to reflect extreme deviations of the Korean economy, in line with shocks applied in other FSAPs. The GDP shocks under the severe (mild) GDD scenarios account for two (one) standard deviations of GDP growth between 1990 and 2012 in line with the severity of the macro shock considered in recent FSAPs to key advanced economies (Table 1 and Figure 6). The cumulative two-year 6.4 percent drop in real GDP under the severe shock is more extreme than the shocks to the Korean economy after the Asian crisis, and the scenarios applied by Korean institutions for supervisory stress tests and for internal risk management and business planning. The PSG scenario assumes a 2.5 percentage point deviation from the baseline each year over a five-year period, accounting for cumulative five-year GDP growth of 6.4 percent, considerably below the minimum 13.1 percent historical cumulative growth rate since 1980. The interest rate scenario is based on a 250 basis point upward shock over 2 ½ years, starting in the second half of 2014. The magnitude of the interest rate shock (with rise in policy rates to the maximum pre-crisis level) is motivated by potential interest rate normalization in the United States. The magnitude of single-factor shocks in the TD was in line with scenario testing, including extreme and moderate

REPUBLIC OF KOREA
INTERNATIONAL MONETARY FUND 19
shocks related to: (i) interest rate spikes of 300 basis points and 200 basis points; (ii) FX depreciation of 50 percent and 30 percent; and (iii) a drop in real house prices of 20 percent and 15 percent.
Table 1. Projected and Stressed GDP
Source: IMF, World Economic Outlook; and IMF staff calculations.
1/ Estimates based on GDP data for 1990-2012. Differences from baseline shown in parentheses.
Figure 6. Macroeconomic Scenario: GDP Path
(In percentage point change, year-on-year)
Source: IMF, World Economic Outlook; and IMF staff calculations.
18. The scenario analysis made use of projected macroeconomic and financial risk factors, estimated via the BOK macro model (BOK12). These risk factors included: GDP growth (for interest rate scenario); inflation; unemployment rate; policy interest rate; credit growth; house prices; equity prices; corporate (A-rated) spreads; short- and long-term government bond yields; and the exchange rate vis-à-vis the USD (Figure A2.1). For the interest rate risk scenario (scenario 4), the authorities also applied an additional exogenous ad hoc consumption shock, specified by the FSAP team. This was done to account fully for feedback loops from higher mortgage rates to households’ debt payment burdens and consumption, a link embedded partially in the model. For the BU, the
Baseline Mild GDD
2013 2.8 -0.5 (-3.3) -3.8 (-6.6) 0.3 (-2.5)2014 3.9 0.6 (-3.3) -2.7 (-6.6) 1.4 (-2.5)2015 4.0 4.0 (0.0) 0.6 (-3.4) 1.5 (-2.5)2016 4.0 4.0 (0.0) 4.0 (0.0) 1.5 (-2.5)2017 4.0 4.0 (0.0) 4.0 (0.0) 1.5 (-2.5)
Severe GDD PSGScenarios

REPUBLIC OF KOREA
20 INTERNATIONAL MONETARY FUND
BOK provided the estimated macro-financial variables to each bank, which estimated the credit risk and market risk parameters under each stress scenario based on these parameters. 19. Credit risks were estimated based on exposure at default (EAD), probability of default (PD), and loss-given default (LGD). These parameters were estimated separately for each one of the principal loan types, including: (i) large enterprise loans; (ii) SME loans; (iii) mortgage loans; (iv) credit card loans; and (v) other household loans.
The EADs were estimated based on projected exposures for each year of the stress testing
window (to end-2017). Credit growth for the stress testing horizon was determined endogenously via the BOK SAMP. The EAD did not take into account committed (but undrawn) credit lines that may be withdrawn by borrowers in case of dsitress, and that may increase EAD above outstanding credit.
PDs were estimated via the SAMP model, using a logit transformation of banks’ NPL ratio as a proxy for the default rate, due to the lack of data. New NPLs were adjusted for write-offs and sales to reflect all actual newly incurred NPLs. The proxied PDs are then related to macroeconomic and financial variables (distinct for each of the five loan types) to estimate stressed PDs under each scenario.
LGDs are approximated by a variant of the S&P model (2010), linking LGD dynamics to the dynamics of PDs.
Figure 7. Probability of Default in Stress Scenarios
Source: Bank of Korea.
20. PDs rise considerably under all scenarios, underlining the robustness of the stress tests. Under both the severe and the mild double-dip scenarios, PDs rise over the initial two years of the stress testing period in line with weaker anticipated GDP growth (Figure 7). As GDP recovers over the medium-term, PDs decline but remain elevated at 2.9 percent and 1.6 percent, respectively, in 2016. The maximum increase in PDs occurs in 2015 and reflects a sizable 181 percent rise to
0.0
0.5
1.0
1.5
2.0
2.5
3.0
3.5
2013 2014 2015 2016 2017
Probability of Default (In percent)
Baseline
Mild
Severe
PSG
Interest rate
0
20
40
60
80
100
120
140
160
180
200
Mild Severe PSG Interest rate
Maximum Increase in Probability of Default(In percent)

REPUBLIC OF KOREA
INTERNATIONAL MONETARY FUND 21
3.3 percent under the severe scenario, and a 73 percent increase to 2 percent under the mild scenario. Under the PSG scenario, PDs increase over time to about 2 percent in 2017, consistent with the persistent shocks to domestic growth over the stress testing horizon. Under the interest rate scenario, the rise in PDs is more muted, in part due to the model constraints in accounting for interest rates shocks, as discussed previously.
21. In the TD, the scenario assessment was complemented by an evaluation of second-round effects due to interlinkages in the financial system. In the TD solvency tests, contagion-related losses were estimated as second-round losses due to liquidity contagion, using the BOK’s SAMP model. However, the high capitalization buffers of Korean banks and the lack of bank defaults after the first-round solvency shocks made the use of the default contagion model unfeasible, as contagion is assumed to be preceded by a default of one or more institutions (see Box 2 for default and liquidity contagion estimation in the SAMP). The use of the SAMP, to estimate contagion effects, was motivated by the inability of the FSAP team to gain access to supervisory data on interbank exposures and, hence, use its own network model.
C. Results
22. The Korean banking system appears sound even under extreme shocks to economic growth or protracted sluggish movement of the economy. The system-wide CARs remain considerably above the Basel III requirement even under severe macroeconomic conditions (Scenario 2 above), including a 3.8 percent contraction of GDP in 2013, and a subsequent 2.8 percent decline in 2014 (Figure A2.2). On an individual basis, all banks are also likely to meet the Basel III capital requirements, with CARs remaining at about or above 10 percent for all years and scenarios.15 The resilience of the Korean banking system reflects very high initial capital buffers and confirms that capital management in Korea is conservative, in part due to policy emphasis on building capital via retained earnings (e.g., via limiting dividend payments). 23. Banks remain solvent even after accounting for potential second-round contagion effects. As expected, the level of bank capital deteriorates further when the impact of interbank and macrofinancial linkages are taken into account, even though these effects tend to be limited. The aggregate CAR of the banking system declines only marginally and remains above the regulatory thresholds for each year, both at the aggregate and the individual bank level (Figure A2.2). By end-2017, when the accumulated effect is the largest, the aggregate CAR of the banking sector under the severe scenario declines to 12 percent taking into account contagion, against 13.6 percent without contagion effects. Altogether, this accounts for a 3.6 percentage point drop relative to the baseline.
15 An important caveat is the results for regional banks are presented on an aggregated basis, presented as synthetic eighth bank in the results. Hence, there may be some variation in the capital adequacy of individual regional banks, but on the average regional banks are well capitalized.

REPUBLIC OF KOREA
22 INTERNATIONAL MONETARY FUND
Figure 8. Commercial Banks: One Year Impact of Credit Costs (Contributions to changes in CAR, in percentage points)
Sources: Bank of Korea and IMF staff estimates.
24. The credit risk of Korean commercial banks is mostly related to corporate exposures. Under both the TD and BU approaches, potential credit costs are mostly related to exposures to SMEs and large corporations, while those linked to household lending are more muted (Figure 8). Importantly, TD and BU credit cost estimates are broadly consistent in the stressed scenarios, despite the methodological differences under both approaches (Appendix IV).16 Yet, the BU approach tends to generate higher credit costs related to SME exposures. Generally, credit costs from residential mortgage loans are small, in part reflecting these loans’ nature as recourse debt with an average system-wide loan-to-value (LTV) ratio of about 50 percent. Unlike housing markets in other OECD countries, in Korea there are no indications of a housing bubble, with the housing affordability index considerably below OECD peers (Figure 9).
Figure 9. Housing Price to Disposable Income, OECD Countries
(In percent)
Source: OECD; IMF staff estimates.
16 However, in the BU solvency stress tests, the aggregate bank-specific losses are smaller than the aggregate losses across the various sectors, because of the longer period (including the Asian crisis) over which banks estimate (through-the-cycle) sectoral PDs.
-4
-3
-2
-1
0
BU TD
Large corporations SMEs MortgagesCredit cards Other household loans RWA change

REPUBLIC OF KOREA
INTERNATIONAL MONETARY FUND 23
25. Market risks are muted, in part due to limited securities’ holdings among commercial banks. Banks’ market risk exposures at end-2012 were about eight times smaller than credit risk exposures, and were mostly related to losses on domestic sovereign debt securities holdings. In the aggregate, the cumulative five-year losses account for about 0.3 percent of RWA at end-2017 under the most adverse scenario of a sharp economic downturn. More than half of these losses are related to domestic sovereign debt holdings (Figure 10). Overall, in the severe GDD scenario, the impact of market shocks is small, reducing some banks’ by up to 0.5 percent of RWA during the peak of the shock in 2015.
Figure 10. Commercial Banks: Market Risk
Sources: Financial Supervisory Service; and Sources: Bank of Korea; Financial Supervisory Service; IMF staff estimates. and IMF staff estimates.
26. However, the TD and BU exercises produce divergent estimates of market risks. The losses over the five-year stress testing horizon amount to up to 0.8 percent of RWA a year in the TD and 0.1 percent in the BU (Figure 10. However, the TD and BU approaches diverge on estimated gains and losses, with an aggregate loss of 0.3 percent of RWA by end-2017 in the TD and an aggregate gain of 1.1 percent in the BU. Generally, differences between TD and BU results are, in part, related to the use of different models and informational sets, with the TD stress tests based mostly on supervisory balance sheet data, and BU using more detailed information at the individual bank level. However, the divergence may also to be related to inability to validate fully the BU stress testing results, given the lack of direct interaction between the FSAP team and banks. 27. When modeled via single-factor analysis, banks’ market risks are limited, even though banks’ sensitivity to interest rate risk is more marked than in the scenarios. A 300 basis point spike in interest rates accounts for up to a 1.9 percentage point drop in the aggregate CAR of commercial banks, even after accounting for contagion, with all banks remaining above the regulatory minimum, at or above 10.7 percent (Figures 11). Interest rate risk is more pronounced than under the interest rate rise scenario (Scenario 4) above, as there are no countervailing effects from other factors, such as gains on equity securities, for example. In addition, potential losses related to a sizable drop in housing prices are non-negligible, but manageable, with banks
-0.05
0.00
0.05
0.10
0.15
0.20
Domestic sovereign
debt
Other domestic
debt
Foreign debt Equities Others
Trading Portfolio
AFS
.
Cumulative 5-Year Market Losses, BU Severe Scenario
(In percent of RWA at end of stress testing period)
-1.0
-0.6
-0.2
0.2
0.6
1.0
2013 2014 2015 2016 2017
TD exercise
BU exercise
Impact of Market Risk in Severe Scenario 1/
(In percent of RWA)

REPUBLIC OF KOREA
24 INTERNATIONAL MONETARY FUND
remaining well capitalized after a more than 2 percentage point drop in CARs. Finally, FX risks are limited, reflecting a small net open FX position (less than 1 percent of capital).
Figure 11. Impact of Single-Factor Shocks on Banks' Capital Adequacy Ratios (In percent)
Sources: Bank of Korea; and IMF staff estimates. Sources: Bank of Korea; and IMF staff estimates.
D. Further Considerations
28. These findings need to be interpreted with caution, due to the inherent limitations of stress testing in general and of this exercise in particular. Most importantly, the potential for complex and difficult to model, macro-financial feedback loops is a risk that requires close monitoring by supervisors and robust risk management by banks. This may explains, for example, the fairly benign impact of a hypothetical sharp spike in interest rates (Scenario 4) compared to other scenarios.17 However, the potential propagation of nonlinear effects—for example via a loop entailing a rise in banks’ credit costs (due to higher household debt-servicing costs), reduced credit availability and falling house prices—may have more severe implications than suggested by the results presented here. Such loops are difficult to model, but could be highly detrimental to macrofinancial stability.
BANKING SECTOR LIQUIDITY STRESS TESTS
A. Framework for Top-down Stress Testing
29. The TD liquidity stress test focused on the impact of potential shocks on both banks’ FX and local currency liquidity conditions (Table 2).
17 For each year of the stress testing horizon, the aggregate ratio of credit costs to RWA is more than two times smaller under the interest rate scenario than under the severe scenario.
12
13
14
15
+200bp +300bp +30% +50% -15% -20%
Interest rate Exchange
rate
Real housing
price
With and Without Contagion
end-2012
after shock: without contagion
after shock: with contagion 10
11
12
13
14
15
16
17
+200bp +300bp +30% +50% -15% -20%
Interest rate Exchange rate
Real housingprice
With Contagionmaxminaggregate

REPUBLIC OF KOREA
INTERNATIONAL MONETARY FUND 25
The TD test covered all commercial banks, including the seven nationwide banks (on an individual basis) and all regional banks (as an aggregate entity). These institutions account for 86 percent of the aggregate assets of commercial banks. The test was conducted on a bank-by-bank basis, using end-March 2013 data by the FSS, consolidated at the bank level. The estimations were carried out by the FSS and validated by the FSAP team.
The test assessed the ability of banks to withstand 30-day persistent withdrawals of wholesale funding and customer deposits. It simulated a sudden, sizable withdrawal of funding, and evaluated the ability of banks to maintain unencumbered high-quality liquid assets above expected liquidity needs under very severe stress scenarios over a 30-day horizon, using the implied cash flow method of Schmieder et al (2011). Liquidity was assessed based on estimated funding gap, representing the difference between banks’ liquid liabilities and assets. The liquidity stress test did not take into account access to central bank liquidity.
The applied liquidity shocks were more extreme than the historical experience of Korea. Generally, given that liquidity crises (including bank runs) are exceedingly rare, there is little in terms of historical precedents (even globally) from which to calibrate extreme shocks (tail risks) sufficiently robustly. Hence, in the case of Korea, the authorities and the IMF team agreed to evaluate the impact of shocks in line with (and exceeding) the Lehman liquidity crisis to gauge the resilience of commercial banks to an extreme liquidity event.18 The applied scenario assumed: (i) a complete freeze of the unsecured short-term wholesale funding market; (ii) a sizable (20 percent) withdrawal of secured short-term wholesale funding; and (iii) run-off rates on term and demand deposits slightly exceeding worst past 1-month deposit withdrawals (Table 2). The confluence of these shocks has no precedent in Korea, and is meant to play the role of a quasi reverse stress test, meant to check the resilience bounds of Korean commercial banks to extreme liquidity stress, a useful tool from policy perspective.
18 For the purposes of the stress test, short-term wholesale funding is assumed to have residual maturity of 30 days or less.
REPUBLIC OF KOREA
26 INTERNATIONAL MONETARY FUND
Table 2. Top-down Liquidity Stress Test Assumptions
1/ Committed lines were assumed to be fully available (100 percent inflows) or non-available (0 percent inflows) under two different scenarios.
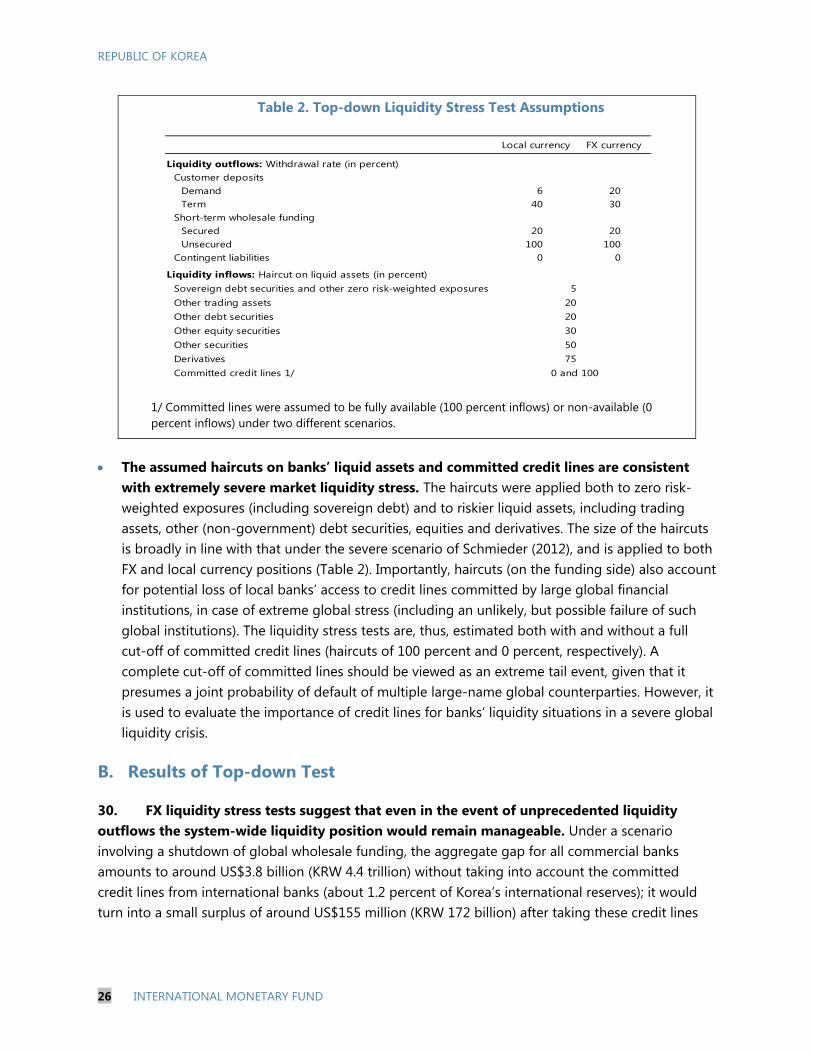
The assumed haircuts on banks’ liquid assets and committed credit lines are consistent with extremely severe market liquidity stress. The haircuts were applied both to zero risk-weighted exposures (including sovereign debt) and to riskier liquid assets, including trading assets, other (non-government) debt securities, equities and derivatives. The size of the haircuts is broadly in line with that under the severe scenario of Schmieder (2012), and is applied to both FX and local currency positions (Table 2). Importantly, haircuts (on the funding side) also account for potential loss of local banks’ access to credit lines committed by large global financial institutions, in case of extreme global stress (including an unlikely, but possible failure of such global institutions). The liquidity stress tests are, thus, estimated both with and without a full cut-off of committed credit lines (haircuts of 100 percent and 0 percent, respectively). A complete cut-off of committed lines should be viewed as an extreme tail event, given that it presumes a joint probability of default of multiple large-name global counterparties. However, it is used to evaluate the importance of credit lines for banks’ liquidity situations in a severe global liquidity crisis.
B. Results of Top-down Test
30. FX liquidity stress tests suggest that even in the event of unprecedented liquidity outflows the system-wide liquidity position would remain manageable. Under a scenario involving a shutdown of global wholesale funding, the aggregate gap for all commercial banks amounts to around US$3.8 billion (KRW 4.4 trillion) without taking into account the committed credit lines from international banks (about 1.2 percent of Korea’s international reserves); it would turn into a small surplus of around US$155 million (KRW 172 billion) after taking these credit lines
Local currency FX currency
Liquidity outflows: Withdrawal rate (in percent)Customer deposits
Demand 6 20Term 40 30
Short-term wholesale fundingSecured 20 20Unsecured 100 100
Contingent liabilities 0 0
Liquidity inflows: Haircut on liquid assets (in percent)Sovereign debt securities and other zero risk-weighted exposuresOther trading assetsOther debt securitiesOther equity securitiesOther securitiesDerivativesCommitted credit lines 1/
750 and 100
520203050
REPUBLIC OF KOREA
INTERNATIONAL MONETARY FUND 27
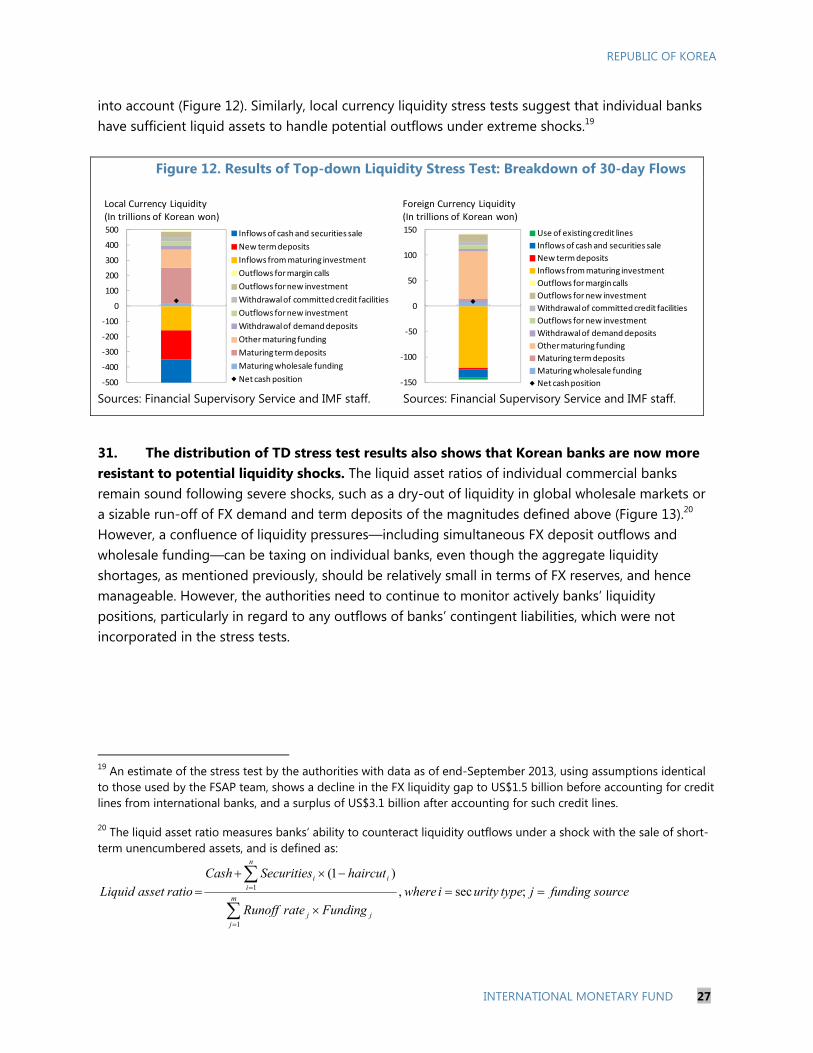
into account (Figure 12). Similarly, local currency liquidity stress tests suggest that individual banks have sufficient liquid assets to handle potential outflows under extreme shocks.19
Figure 12. Results of Top-down Liquidity Stress Test: Breakdown of 30-day Flows
Sources: Financial Supervisory Service and IMF staff. Sources: Financial Supervisory Service and IMF staff.
31. The distribution of TD stress test results also shows that Korean banks are now more resistant to potential liquidity shocks. The liquid asset ratios of individual commercial banks remain sound following severe shocks, such as a dry-out of liquidity in global wholesale markets or a sizable run-off of FX demand and term deposits of the magnitudes defined above (Figure 13).20 However, a confluence of liquidity pressures—including simultaneous FX deposit outflows and wholesale funding—can be taxing on individual banks, even though the aggregate liquidity shortages, as mentioned previously, should be relatively small in terms of FX reserves, and hence manageable. However, the authorities need to continue to monitor actively banks’ liquidity positions, particularly in regard to any outflows of banks’ contingent liabilities, which were not incorporated in the stress tests.
19 An estimate of the stress test by the authorities with data as of end-September 2013, using assumptions identical to those used by the FSAP team, shows a decline in the FX liquidity gap to US$1.5 billion before accounting for credit lines from international banks, and a surplus of US$3.1 billion after accounting for such credit lines.
20 The liquid asset ratio measures banks’ ability to counteract liquidity outflows under a shock with the sale of short-term unencumbered assets, and is defined as:
sourcefundingjtypeurityiwhere
FundingrateRunoff
haircutSecuritiesCash
ratioassetLiquidm
jjj
n
iii
;sec,
)1(
1
1
-500
-400
-300
-200
-100
0
100
200
300
400
500 Inflows of cash and securities sale
New term deposits
Inflows from maturing investment
Outflows for margin calls
Outflows for new investment
Withdrawal of committed credit facilities
Outflows for new investment
Withdrawal of demand deposits
Other maturing funding
Maturing term deposits
Maturing wholesale funding
Net cash position
Local Currency Liquidity(In trillions of Korean won)
-150
-100
-50
0
50
100
150 Use of existing credit lines
Inflows of cash and securities sale
New term deposits
Inflows from maturing investment
Outflows for margin calls
Outflows for new investment
Withdrawal of committed credit facilities
Outflows for new investment
Withdrawal of demand deposits
Other maturing funding
Maturing term deposits
Maturing wholesale funding
Net cash position
Foreign Currency Liquidity(In trillions of Korean won)

REPUBLIC OF KOREA
28 INTERNATIONAL MONETARY FUND
Figure 13. Korea: Top-down Foreign Exchange Liquidity Stress Test: Liquid Asset Ratios (In percent)
Sources: Financial Supervisory Service and IMF staff estimates.
C. Framework for the Bottom-up Tests
32. The BU stress tests also evaluated banks’ resilience to potential FX and local currency and liquidity stress. However, they differed from the TD stress tests in that they evaluated banks’ rollover risks, rather than overall liquidity risks, and were thus meant to complement the overall liquidity assessment in the TD stress tests. Specifically:
The tests covered the seven nation-wide banks on consolidated bank-level basis. These
institutions account for 76 percent of the aggregate assets of commercial banks. The tests were carried out by the individual banks, and used internal models and data as of end-March 2013. The assumed stress horizon was 30 days, in line with the TD test.
Two stress scenarios were considered, a scenario based on worst bank-specific historical outflows and an extreme scenario, applied uniformly across banks. Both scenarios assume: (i) a dry-up of wholesale funding, including a complete shutdown of the unsecured wholesale funding market and a roll-over of up to 20 percent of maturing secured wholesale funding; and (ii) deposit run-offs, calibrated based on worst 30-day bank-specific historical outflows since 1990 or on pre-specified extreme outflows (Table 3). Banks’ deposit outflows are assumed to differ based on the type of currency. Banks are also subject to outflows stemming from contingent liabilities, such as unused credit lines extended by other parties.
The tests were based on cash flow analysis. Banks’ resilience to liquidity shocks was assessed based on their ability to maintain positive net cash positions over the stress horizon. The tests evaluated the impact of shocks to funding availability, and did not account for possible spikes in funding costs that weigh down on profits. The stress parameters were applied uniformly to all banks, without linking the distress to banks’ solvency conditions.
0
200
400
600
800
1,000
1,200
Deposit outflows only Wholesale outflows only
max
min
REPUBLIC OF KOREA
INTERNATIONAL MONETARY FUND 29
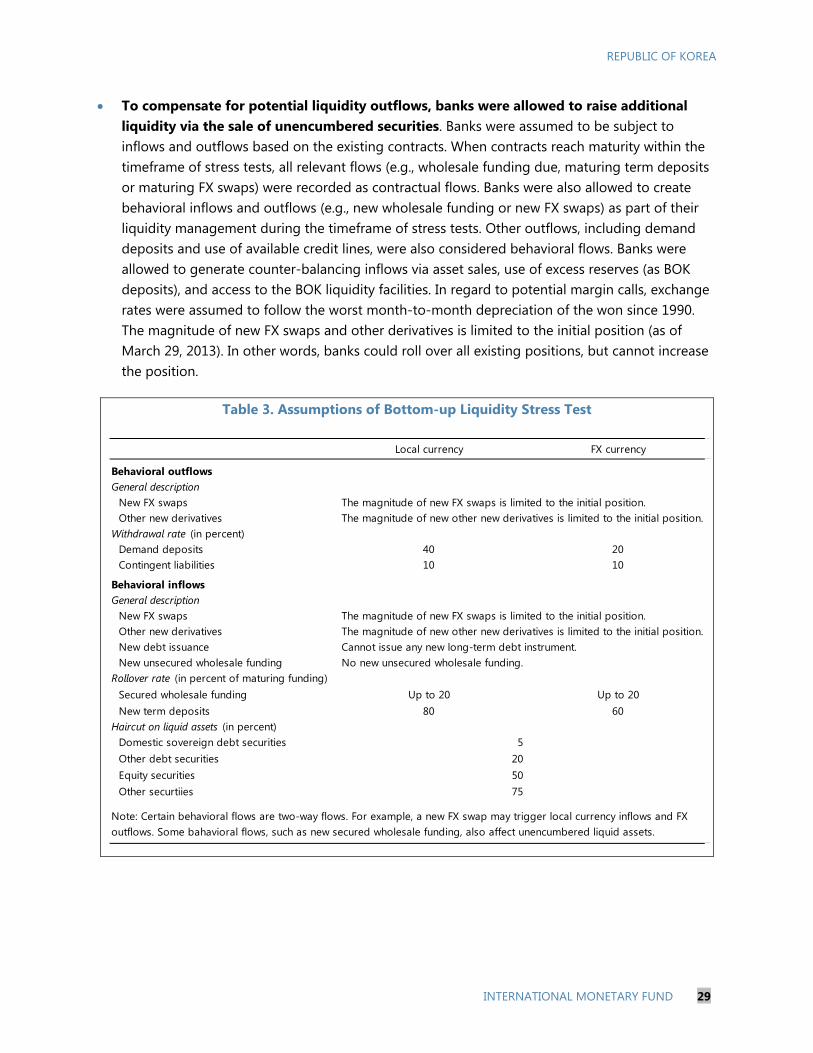
To compensate for potential liquidity outflows, banks were allowed to raise additional liquidity via the sale of unencumbered securities. Banks were assumed to be subject to inflows and outflows based on the existing contracts. When contracts reach maturity within the timeframe of stress tests, all relevant flows (e.g., wholesale funding due, maturing term deposits or maturing FX swaps) were recorded as contractual flows. Banks were also allowed to create behavioral inflows and outflows (e.g., new wholesale funding or new FX swaps) as part of their liquidity management during the timeframe of stress tests. Other outflows, including demand deposits and use of available credit lines, were also considered behavioral flows. Banks were allowed to generate counter-balancing inflows via asset sales, use of excess reserves (as BOK deposits), and access to the BOK liquidity facilities. In regard to potential margin calls, exchange rates were assumed to follow the worst month-to-month depreciation of the won since 1990. The magnitude of new FX swaps and other derivatives is limited to the initial position (as of March 29, 2013). In other words, banks could roll over all existing positions, but cannot increase the position.
Table 3. Assumptions of Bottom-up Liquidity Stress Test
Local currency FX currency
Behavioral outflowsGeneral description
New FX swaps The magnitude of new FX swaps is limited to the initial position.Other new derivatives The magnitude of new other new derivatives is limited to the initial position.
Withdrawal rate (in percent)Demand deposits 40 20Contingent liabilities 10 10
Behavioral inflowsGeneral description
New FX swaps The magnitude of new FX swaps is limited to the initial position.Other new derivatives The magnitude of new other new derivatives is limited to the initial position.New debt issuance Cannot issue any new long-term debt instrument.New unsecured wholesale funding No new unsecured wholesale funding.
Rollover rate (in percent of maturing funding)Secured wholesale funding Up to 20 Up to 20New term deposits 80 60
Haircut on liquid assets (in percent)Domestic sovereign debt securitiesOther debt securitiesEquity securitiesOther securtiies
Note: Certain behavioral flows are two-way flows. For example, a new FX swap may trigger local currency inflows and FX outflows. Some bahavioral flows, such as new secured wholesale funding, also affect unencumbered liquid assets.
5205075

REPUBLIC OF KOREA
30 INTERNATIONAL MONETARY FUND
D. Results of the Bottom-up Stress Test
33. The BU liquidity stress tests indicate that banks would be able to manage their liquidity positions in the event of unprecedented liquidity stress. All seven nationwide commercial banks would have adequate liquid assets to withstand the 30-day freeze in wholesale funding and withdrawal of deposits, with no liquidity shortages for both local and foreign currencies separately. At the system-wide level, the net cash positions after the pre-specified shock are KRW 34 trillion for local currency and KRW 9 trillion for foreign currency, respectively (Figure 13). Banks’ liquidity positions are assessed to be even stronger under a potential repeat of each bank’s worst historical deposit outflow, with net cash positions at KRW 57 and KRW 11 in local currency and foreign currency, respectively. Banks appear to rely roughly equally on sale of liquid assets, renewal of term deposits and inflows from maturing investment to meet local currency funding needs, and on inflows from maturing investments to meet foreign currency funding needs.
Figure 14. Bottom-up Liquidity Stress Tests: Breakdown of 30-Day Cash Flows (In percent)
Sources: Financial Supervisory Service and IMF staff estimates.
SIMPLE STRESS TEST OF NON-BANK DEPOSITORY
INSTITUTIONS
34. NBFIs in Korea account for a large share of domestic lending and thus play a considerably more important role compared to other countries. The nonbanking sector comprises a wide range of heterogeneous small, but collectively
large, institutions. Non-bank depository institutions include credit cooperatives, merchant banks, mutual savings banks and postal savings institution, which account for 14.3 percent of financial sector assets at end-2012. Non-depository financial institutions include insurance companies, asset management companies, securities companies, and credit specialized companies, accounting for 37.5 percent of total assets.
0
200
400
600
800
1,000
1,200
Deposit outflows only Wholesale outflows only
max
min

REPUBLIC OF KOREA
INTERNATIONAL MONETARY FUND 31
The importance of NBFIs for Korea’s financial system has been underpinned by their brisk expansion in recent years. NBFI lending, particularly to less creditworthy households, rose sizably, partly reflecting stricter regulatory treatment for banks. As a result, the share of NBFIs in total financial sector assets increased to 52 percent at end-2012 from 41 percent at end-2000.
NBDIs are not closely interlinked with the rest of the financial system, but their exposures to joint macro risk factors, and collectively large size can pose credit risks. Some larger NBDIs (e.g., credit cooperatives) extend credit to the pool of borrowers from which they draw deposits, and thus effectively limit risks to members of their own institution. However, NBDIs also tend to lend to lower-income households, highly exposed to a sharp downturn of the economy, subjecting these institutions to coincident rise in credit risks across institutions.
35. The FSAP stress testing exercise used a simple framework to assess the credit risks of NBDIs. The simplicity of the approach was motivated by the limited availability of sufficiently detailed data and the dispersion of supervisory functions for various types of institutions across different agencies. The former prompted the application of a simple reverse stress test, meant to assess the share of additional NPLs that NBDIs can absorb before they breach the minimum capital requirements. The latter precluded the application of the tests to certain types of depository institutions, such as community credit cooperatives.
36. The stress test was based on a set of conservative assumptions:
Pre-loss net income was based on the lowest level of pre-loss net income to total net income since 2007, and is adjusted for total assets as of end-2012.
The value of collateral is subject to a 20 percent discount, with only 70 percent of this discounted value recognizable for provisioning purposes. The former reflects potential declines in property prices, while the latter is regulation-based.
Required provisioning is 20 percent for secured loans and 100 percent for unsecured loans. The latter is more stringent than the regulation, under which nonperforming unsecured loans are first classified as doubtful loans for which required provisioning is 75 percent.
The stress test is conducted at the aggregate level for each type of NBDI, which include mutual savings banks, credit unions, and mutual banking entities (e.g., agricultural cooperatives, fishery cooperatives, and forestry cooperatives).
37. The stress test suggests that certain NBDIs appear to have relatively thin capital buffers. For example, mutual savings banks, credit unions, and fishery cooperatives can only handle up to around 10 percentage point increase in NPLs before their capital drops below the minimum required threshold (Table 4). Even other NBDIs that could withstand larger increases in NPLs should be monitored closely, given that the regulatory minimum capital requirements of NBDIs are generally very low. However, even in the event of potentail difficulties at NBDIs, spillovers to other
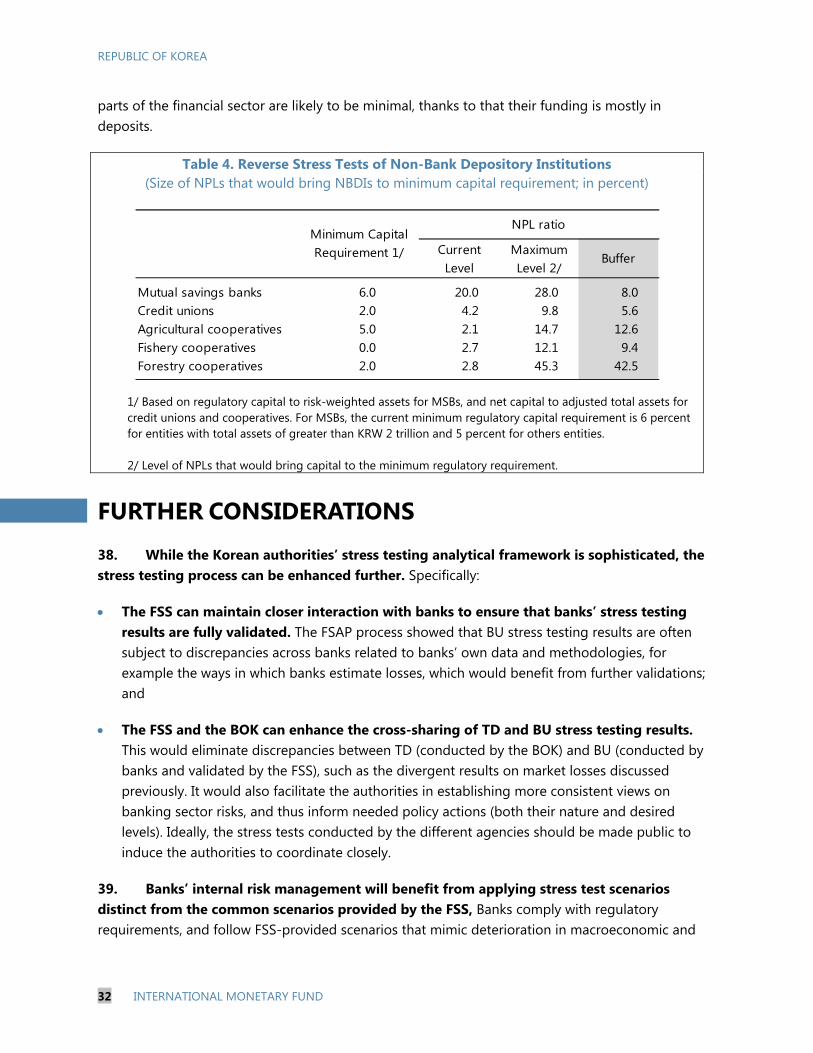
REPUBLIC OF KOREA
32 INTERNATIONAL MONETARY FUND
parts of the financial sector are likely to be minimal, thanks to that their funding is mostly in deposits.
Table 4. Reverse Stress Tests of Non-Bank Depository Institutions (Size of NPLs that would bring NBDIs to minimum capital requirement; in percent)
1/ Based on regulatory capital to risk-weighted assets for MSBs, and net capital to adjusted total assets for credit unions and cooperatives. For MSBs, the current minimum regulatory capital requirement is 6 percent for entities with total assets of greater than KRW 2 trillion and 5 percent for others entities. 2/ Level of NPLs that would bring capital to the minimum regulatory requirement.
FURTHER CONSIDERATIONS
38. While the Korean authorities’ stress testing analytical framework is sophisticated, the stress testing process can be enhanced further. Specifically:
The FSS can maintain closer interaction with banks to ensure that banks’ stress testing results are fully validated. The FSAP process showed that BU stress testing results are often subject to discrepancies across banks related to banks’ own data and methodologies, for example the ways in which banks estimate losses, which would benefit from further validations; and
The FSS and the BOK can enhance the cross-sharing of TD and BU stress testing results. This would eliminate discrepancies between TD (conducted by the BOK) and BU (conducted by banks and validated by the FSS), such as the divergent results on market losses discussed previously. It would also facilitate the authorities in establishing more consistent views on banking sector risks, and thus inform needed policy actions (both their nature and desired levels). Ideally, the stress tests conducted by the different agencies should be made public to induce the authorities to coordinate closely.
39. Banks’ internal risk management will benefit from applying stress test scenarios distinct from the common scenarios provided by the FSS, Banks comply with regulatory requirements, and follow FSS-provided scenarios that mimic deterioration in macroeconomic and
Current Level
Maximum Level 2/
Buffer
Mutual savings banks 6.0 20.0 28.0 8.0Credit unions 2.0 4.2 9.8 5.6Agricultural cooperatives 5.0 2.1 14.7 12.6Fishery cooperatives 0.0 2.7 12.1 9.4Forestry cooperatives 2.0 2.8 45.3 42.5
Minimum Capital Requirement 1/
NPL ratio

REPUBLIC OF KOREA
INTERNATIONAL MONETARY FUND 33
liquidity conditions in line with previous crises. However, they do not appear to run event-specific tests in line with their internal operational needs. 40. NBFIs’ resilience to shocks can be strengthened considerably by the application of a regulatory and supervisory framework consistent with that for banks. The capital framework for NBFIs is a net capital ratio, expressed as the ratio of equity to the sum of total assets and loan loss provisions. A regulatory framework consistent with that for banks—namely, the Basel capital adequacy framework—should be applied to all NBDIs, with larger entities of an equivalent size to banks subjected to stricter supervision.
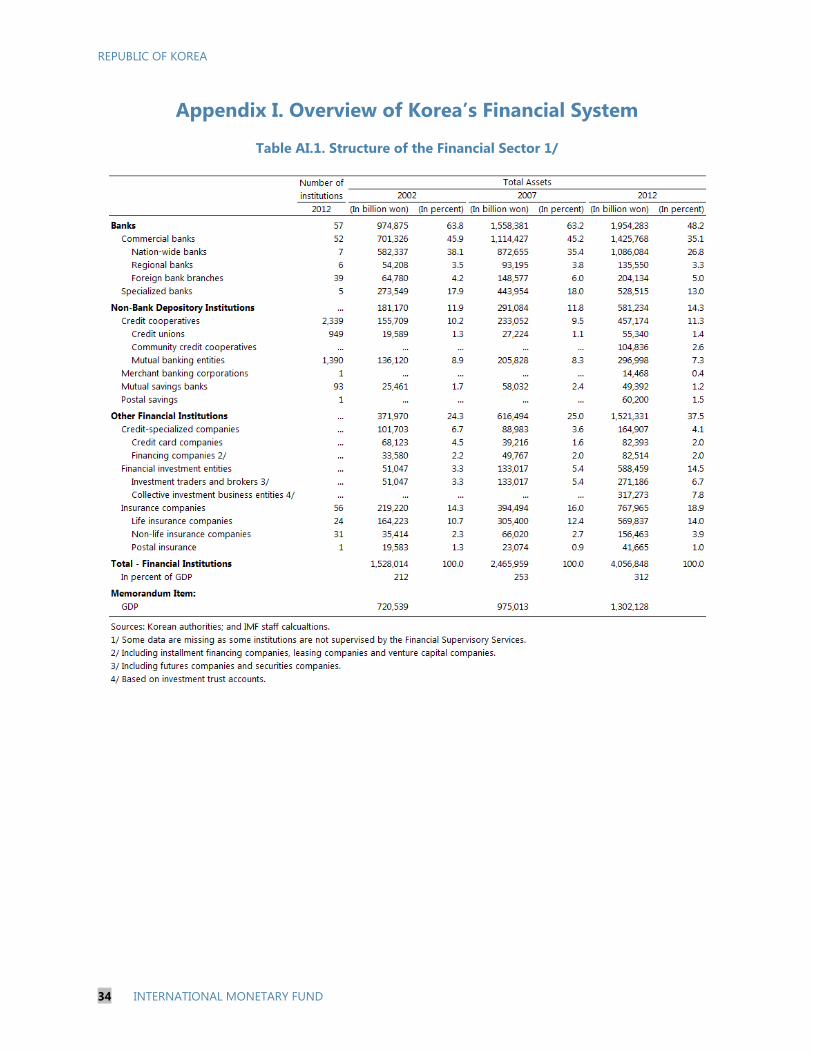
REPUBLIC OF KOREA
34 INTERNATIONAL MONETARY FUND
Appendix I. Overview of Korea’s Financial System
Table AI.1. Structure of the Financial Sector 1/
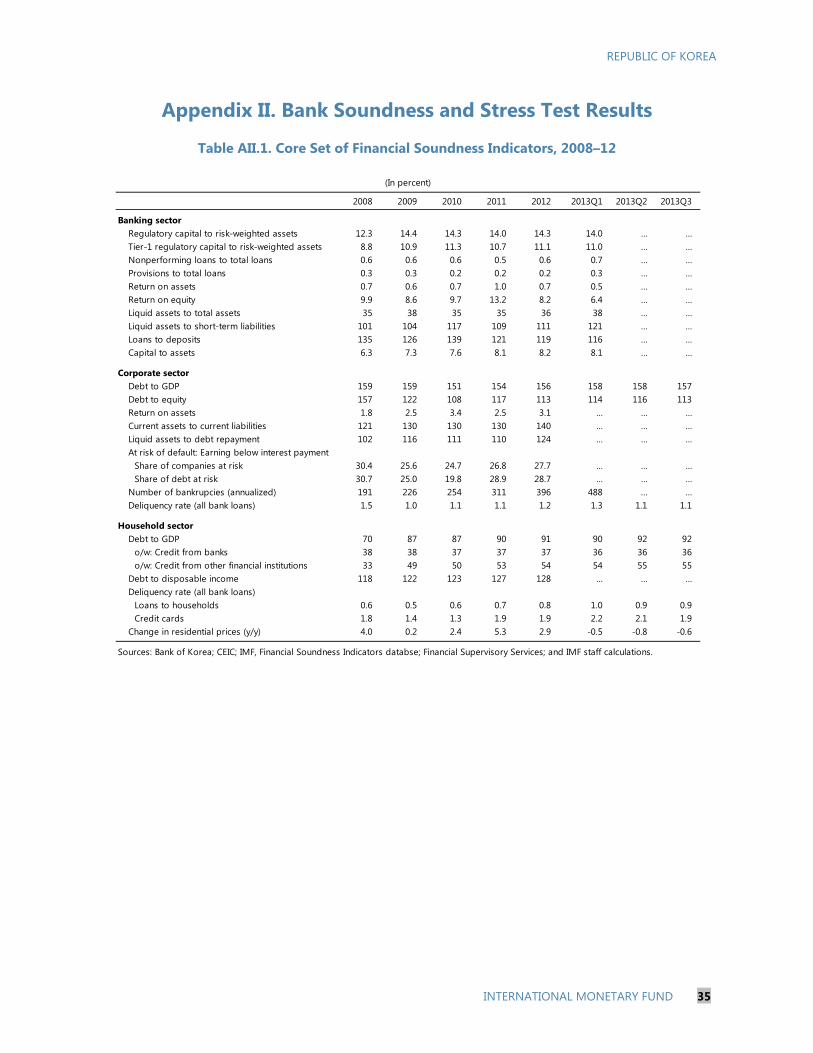
REPUBLIC OF KOREA
INTERNATIONAL MONETARY FUND 35
Appendix II. Bank Soundness and Stress Test Results
Table AII.1. Core Set of Financial Soundness Indicators, 2008–12
2008 2009 2010 2011 2012 2013Q1 2013Q2 2013Q3
Banking sectorRegulatory capital to risk-weighted assets 12.3 14.4 14.3 14.0 14.3 14.0 … …Tier-1 regulatory capital to risk-weighted assets 8.8 10.9 11.3 10.7 11.1 11.0 … …Nonperforming loans to total loans 0.6 0.6 0.6 0.5 0.6 0.7 … …Provisions to total loans 0.3 0.3 0.2 0.2 0.2 0.3 … …Return on assets 0.7 0.6 0.7 1.0 0.7 0.5 … …Return on equity 9.9 8.6 9.7 13.2 8.2 6.4 … …Liquid assets to total assets 35 38 35 35 36 38 … …Liquid assets to short-term liabilities 101 104 117 109 111 121 … …Loans to deposits 135 126 139 121 119 116 … …Capital to assets 6.3 7.3 7.6 8.1 8.2 8.1 … …
Corporate sectorDebt to GDP 159 159 151 154 156 158 158 157Debt to equity 157 122 108 117 113 114 116 113Return on assets 1.8 2.5 3.4 2.5 3.1 … … …Current assets to current liabilities 121 130 130 130 140 … … …Liquid assets to debt repayment 102 116 111 110 124 … … …At risk of default: Earning below interest payment
Share of companies at risk 30.4 25.6 24.7 26.8 27.7 … … …Share of debt at risk 30.7 25.0 19.8 28.9 28.7 … … …
Number of bankrupcies (annualized) 191 226 254 311 396 488 … …Deliquency rate (all bank loans) 1.5 1.0 1.1 1.1 1.2 1.3 1.1 1.1
Household sectorDebt to GDP 70 87 87 90 91 90 92 92
o/w: Credit from banks 38 38 37 37 37 36 36 36o/w: Credit from other financial institutions 33 49 50 53 54 54 55 55
Debt to disposable income 118 122 123 127 128 … … …Deliquency rate (all bank loans)
Loans to households 0.6 0.5 0.6 0.7 0.8 1.0 0.9 0.9Credit cards 1.8 1.4 1.3 1.9 1.9 2.2 2.1 1.9
Change in residential prices (y/y) 4.0 0.2 2.4 5.3 2.9 -0.5 -0.8 -0.6
Sources: Bank of Korea; CEIC; IMF, Financial Soundness Indicators databse; Financial Supervisory Services; and IMF staff calculations.
(In percent)

REPUBLIC OF KOREA
36 INTERNATIONAL MONETARY FUND
Figure AII.1. Top-down Solvency Stress Tests: Basel III Capital Ratios, Aggregate and Distribution, with and without Contagion Effects
Sources: Bank of Korea and IMF staff calculations.
6
8
10
12
14
16
18
2012 2013 2014 2015 2016 2017
Basel III Total Capital Ratio: All Scenarios(In percent)
Baseline Mild SeverePSG Interest Rate Hurdle Rate
6
8
10
12
14
16
18
2012 2013 2014 2015 2016 2017
Basel III Total Capital Ratio: Severe Scenario(Bank distribution; in percent)
Aggregate Minimum Maximum
2
4
6
8
10
12
14
16
2012 2013 2014 2015 2016 2017
Basel III Tier 1 Capital Ratio: All Scenarios(In percent)
Baseline Mild SeverePSG Interest Rate Hurdle Rate
2
4
6
8
10
12
14
16
2012 2013 2014 2015 2016 2017
Basel III Tier 1 Capital Ratio: Severe Scenario(Bank distribution; in percent)
Aggregate Minimum Maximum
6
8
10
12
14
16
18
2012 2013 2014 2015 2016 2017
Basel III Total Capital Ratio: All Scenarios, with contagion effects
(In percent)
Baseline Mild SeverePSG Interest Rate Hurdle Rate
6
8
10
12
14
16
18
2012 2013 2014 2015 2016 2017
Basel III Total Capital Ratio: Severe Scenario, with contagion effects
(Bank distribution; in percent)
Aggregate Minimum Maximum
2
4
6
8
10
12
14
16
2012 2013 2014 2015 2016 2017
Basel III Tier 1 Capital Ratio: All Scenarios, with contagion effects
(In percent)
Baseline Mild SeverePSG Interest Rate Hurdle Rate
2
4
6
8
10
12
14
16
2012 2013 2014 2015 2016 2017
Basel III Tier 1 Capital Ratio: Severe Scenario, with contagion effects
(Bank distribution; in percent)
Aggregate Minimum Maximum

REPUBLIC OF KOREA
INTERNATIONAL MONETARY FUND 37
Figure AII.2. Bottom-up Solvency Stress Tests: Basel III Capital Ratios, Aggregate and Distribution
Sources: Financial Supervisory Service and IMF staff calculations.
6
8
10
12
14
16
18
2012 2013 2014 2015 2016 2017
Basel III Total Capital Ratio: All Scenarios(In percent)
Baseline Mild Severe
PGS Interest Rate Hurdle Rate
2
4
6
8
10
12
14
16
2012 2013 2014 2015 2016 2017
Basel III Total Capital Ratio: All Scenarios(In percent)
Baseline Mild Severe
PGS Interest Rate Hurdle Rate
0 20 40 60 80 100
SevereBaseline
SevereBaseline
SevereBaseline
SevereBaseline
SevereBaseline
2012
201
72
016
201
52
014
201
3.
Severe Double-Dip Scenario(In percent of aggregate risk-weighted assets)
10-12 12-14 14-16 16-18
0 20 40 60 80 100
MildBaseline
MildBaseline
MildBaseline
MildBaseline
MildBaseline
2012
201
72
016
201
52
014
201
3.
Mild Double-Dip Scenario(In percent of aggregate risk-weighted assets)
10-12 12-14 14-16 16-18
0 20 40 60 80 100
PGSBaseline
PGSBaseline
PGSBaseline
PGSBaseline
PGSBaseline
2012
201
72
016
2015
201
42
013
.
Protracted Slow Growth(In percent of aggregate risk-weighted assets)
10-12 12-14 14-16 16-18
0 20 40 60 80 100
Interest rateBaseline
Interest rateBaseline
Interest rateBaseline
Interest rateBaseline
Interest rateBaseline
2012
201
72
016
20
1520
14
201
3.
Upward Interest Rate Shock(In percent of aggregate risk-weighted assets)
10-12 12-14 14-16 16-18

REPUBLIC OF KOREA
38 INTERNATIONAL MONETARY FUND
Figure AII.3. Top-down Solvency Stress Tests: Drivers of Cumulative Impact on Basel III Capital Adequacy Ratios 1/
Sources: Bank of Korea and IMF staff calculations. 1/ Includes all commercial banks; regional banks represented as a single entity.
Figure AII.4. Bottom-up Solvency Stress Tests: Drivers of Cumulative Impact on Basel III Capital Adequacy Ratios
Sources: Financial Supervisory Service; and IMF staff calculations. 1/ Includes all nationwide commercial banks.
-5
0
5
10
15
20
2013 2014 2015 2016 2017
Mild Scenario(In percent)
Pre-loss profit
Beginning capital
Credit loss
Market loss
Other adjustment
Change in RWA
Stressed CAR
CAR under baseline-5
0
5
10
15
20
2013 2014 2015 2016 2017
Severe Scenario(In percent)
Pre-loss profit
Beginning capital
Credit loss
Market loss
Other adjustment
Change in RWA
Stressed CAR
CAR under baseline
-5
0
5
10
15
20
2013 2014 2015 2016 2017
Protracted Growth Scenario(In percent)
Pre-loss profit
Beginning capital
Credit loss
Market loss
Other adjustment
Change in RWA
Stressed CAR
CAR under baseline-5
0
5
10
15
20
2013 2014 2015 2016 2017
Rising Interest Rate Scenario(In percent)
Pre-loss profit
Beginning capital
Credit loss
Market loss
Other adjustment
Change in RWA
Stressed CAR
CAR under baseline
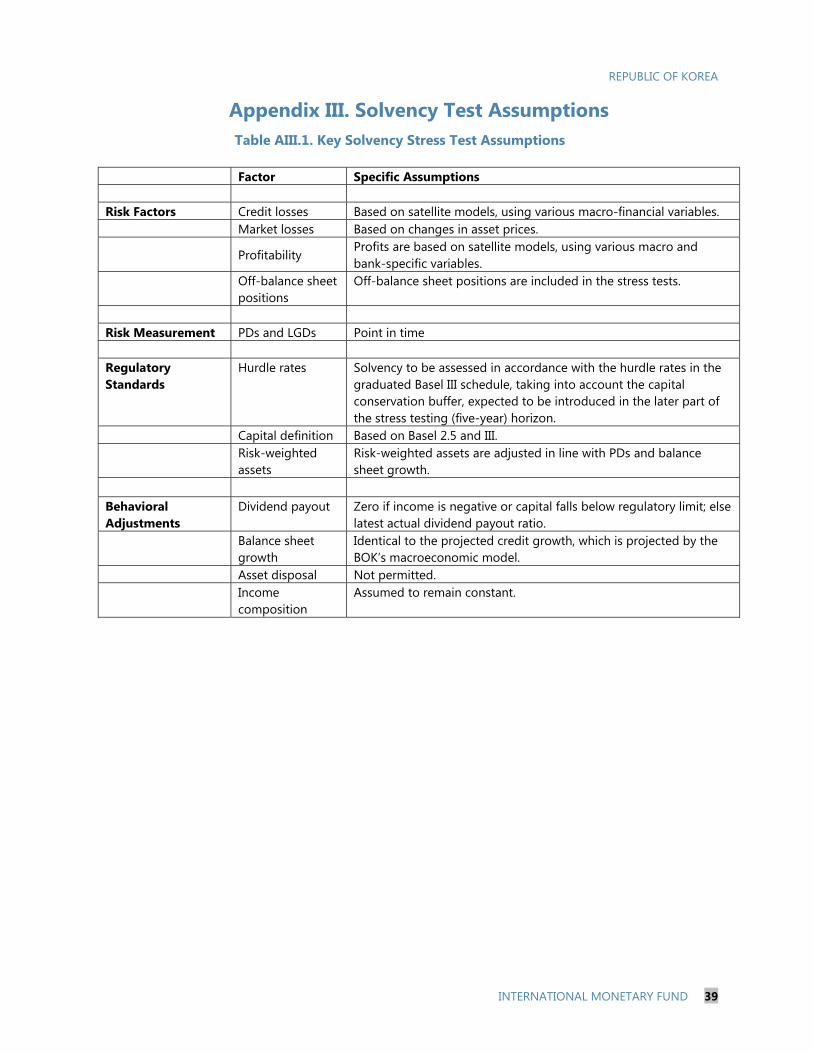
REPUBLIC OF KOREA
INTERNATIONAL MONETARY FUND 39
Appendix III. Solvency Test Assumptions Table AIII.1. Key Solvency Stress Test Assumptions
Factor Specific Assumptions Risk Factors Credit losses Based on satellite models, using various macro-financial variables. Market losses Based on changes in asset prices.
Profitability Profits are based on satellite models, using various macro and bank-specific variables.
Off-balance sheet positions
Off-balance sheet positions are included in the stress tests.
Risk Measurement PDs and LGDs Point in time Regulatory Standards
Hurdle rates Solvency to be assessed in accordance with the hurdle rates in the graduated Basel III schedule, taking into account the capital conservation buffer, expected to be introduced in the later part of the stress testing (five-year) horizon.
Capital definition Based on Basel 2.5 and III.
Risk-weighted assets
Risk-weighted assets are adjusted in line with PDs and balance sheet growth.
Behavioral Adjustments
Dividend payout Zero if income is negative or capital falls below regulatory limit; else latest actual dividend payout ratio.
Balance sheet growth
Identical to the projected credit growth, which is projected by the BOK’s macroeconomic model.
Asset disposal Not permitted.
Income composition
Assumed to remain constant.

REPUBLIC OF KOREA
40 INTERNATIONAL MONETARY FUND
Appendix IV. Stress Test Matrices
Table AIV.1. Stress Test Matrix (STeM) for the Banking Sector: Solvency Risk
Domain Assumptions
Bottom-up by Banks Top-down by Authorities
Institutions included
All nationwide commercial banks (7). All nationwide commercial banks (7); all other commercial banks (on an aggregate basis).
Market share 89 percent of commercial bank assets.
60 percent of banking sector assets.
40 percent of broad financial sector assets.
100 percent of assets of commercial banks.
Data and baseline date
Banks’ internal data as of December 2012 Bank consolidated.
Bank-by-bank supervisory data as of December 2012.
Bank consolidated.
Methodology Banks’ internal models. BOK’s model (SAMP).
Stress test horizon
Five years up to December 2017. Five years up to December 2017 (instantaneous for sensitivity test).
Shocks Scenario analysis (all are macro scenarios, stressing asset prices and macroeconomic variables) Baseline: April 2013 World Economic Outlook (WEO); real GDP growth rate is 2.8 ppts for
2013 and 3.9 ppts for 2014.
A mild global double-dip: A GDP growth rate shock of 1 standard deviation (-3.3 ppts) from baseline in the first two years of a five-year horizon, with linear adjustment back to baseline in the third year. Growth rates at -0.5 percent (2013) and 0.6 percent (2014).
A severe global double-dip: A GDP growth rate shock of 2 standard deviation (-6.6 ppts) from baseline in the first two years of a five-year horizon, with linear adjustment back to baseline in the third and fourth years after the shock. Growth rates at -3.8 percent (2013) and -2.7 percent (2014). Standard deviations for both scenarios are based on 1990-2012 data.
Prolonged slowdown: A cumulative decline of real GDP by 1 standard deviation from baseline over five years (-2.5 ppts/year). This shock is estimated based on the five-year cumulative growth rate between 1990 and 2012.
An increase in interest rates: A 250 bps cumulative increase of domestic interest rates over 2½ years, starting in the second half of 2014, as a result of the advanced countries’ potential exit from unconventional monetary policy.
Sensitivity Analysis (Single-factor analysis) Interest rate-related credit risk: instantaneous
impact of an interest rate spike (extreme shock: 300 bps; moderate: 200 bps).
Exchange rate depreciation (extreme shock:

REPUBLIC OF KOREA
INTERNATIONAL MONETARY FUND 41
Domain Assumptions
Bottom-up by Banks Top-down by Authorities
50 percent; moderate: 30 percent).
A fall in real house prices (extreme shock: 20 percent; moderate: 15 percent).
Risks/factors assessed
Credit risk of loan portfolios by type of exposure (large corporations, SMEs, residential mortgage, credit cards, and others).
Market risk of trading and AFS securities, and off-balance sheet exposure.
All macro scenarios assess both credit and market risks.
Risk factor assumptions
Credit losses are based on satellite models, using various macro/financial variables.
Mark-to-market valuation of trading and AFS securities.
Profitability is based on satellite models, using various macro and bank-specific variables.
Off-balance sheet positions are taken into account.
Contagion effects are incorporated through the channels of funding costs, credit crunch, and fire-sale of assets.
Behavioral Adjustments
Net interest income estimated based on banks’ internal model.
Net interest income estimated based on the authorities’ model.
Balance sheet growth identical to projected credit growth.
A constant share of non-loan assets in total assets based on average long-term growth.
Asset disposal not permitted.
Income composition assumed to remain constant.
Risk-weighted Assets (RWA) assumed to be adjusted in line with PDs (IRB approach).
Dividend payout ratio assumed to be zero if income is negative or capital falls below regulatory limit; else latest actual dividend payout ratio.
Regulatory standards
RWA as per Basel 2.5 and III.
Hurdle rate based on Basel III schedule. Relevant ratios include tier-1 and total capital ratio (8 percent).
Capital definition per Basel 2.5 and III.
Reporting format to the FSAP team
Post-shock solvency ratios and losses by type of exposure (individual institutions).
Distribution of capital ratios across the commercial banking system
Post-shock solvency ratios and losses by type of exposure (7 nationwide banks individually, aggregate by type of institutions).
Distribution of capital ratios across the commercial banking system.
Note: The authorities did not provide the supervisory data. The FSAP team was unable to carry out independent stress test due to the unavailability of publicly available data.
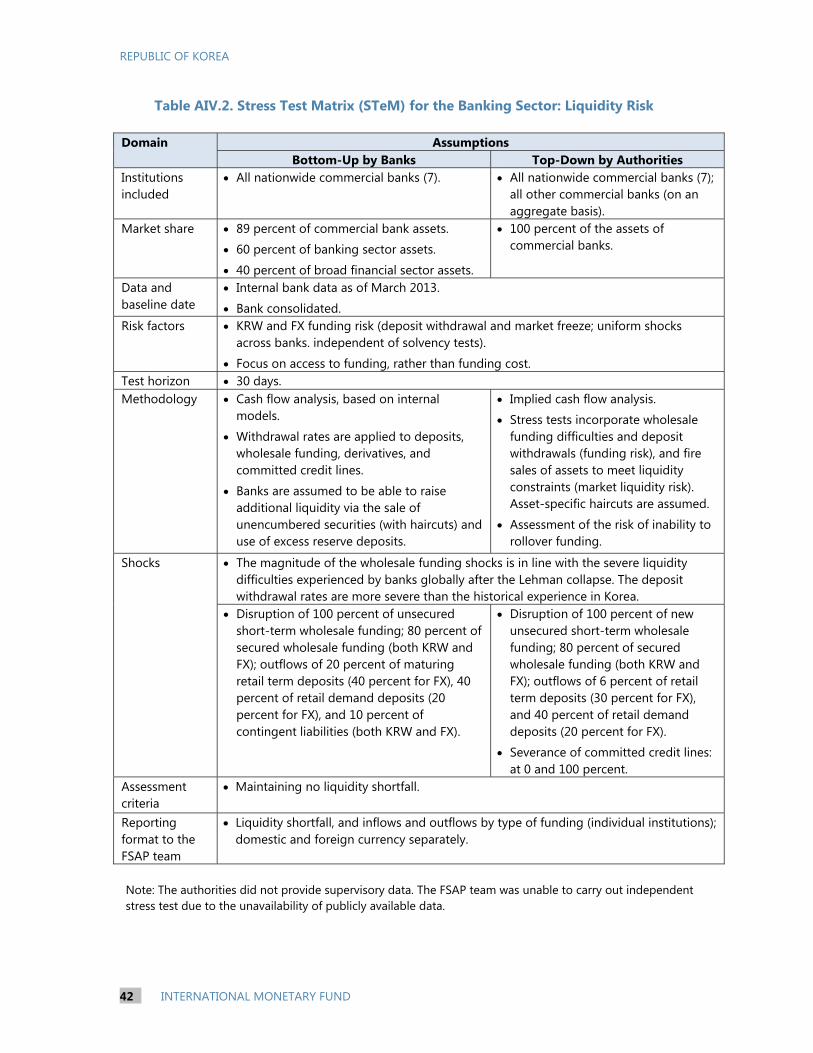
REPUBLIC OF KOREA
42 INTERNATIONAL MONETARY FUND
Table AIV.2. Stress Test Matrix (STeM) for the Banking Sector: Liquidity Risk Domain Assumptions
Bottom-Up by Banks Top-Down by Authorities Institutions included
All nationwide commercial banks (7). All nationwide commercial banks (7); all other commercial banks (on an aggregate basis).
Market share 89 percent of commercial bank assets.
60 percent of banking sector assets.
40 percent of broad financial sector assets.
100 percent of the assets of commercial banks.
Data and baseline date
Internal bank data as of March 2013.
Bank consolidated. Risk factors KRW and FX funding risk (deposit withdrawal and market freeze; uniform shocks
across banks. independent of solvency tests).
Focus on access to funding, rather than funding cost. Test horizon 30 days. Methodology Cash flow analysis, based on internal
models.
Withdrawal rates are applied to deposits, wholesale funding, derivatives, and committed credit lines.
Banks are assumed to be able to raise additional liquidity via the sale of unencumbered securities (with haircuts) and use of excess reserve deposits.
Implied cash flow analysis.
Stress tests incorporate wholesale funding difficulties and deposit withdrawals (funding risk), and fire sales of assets to meet liquidity constraints (market liquidity risk). Asset-specific haircuts are assumed.
Assessment of the risk of inability to rollover funding.
Shocks
The magnitude of the wholesale funding shocks is in line with the severe liquidity difficulties experienced by banks globally after the Lehman collapse. The deposit withdrawal rates are more severe than the historical experience in Korea.
Disruption of 100 percent of unsecured short-term wholesale funding; 80 percent of secured wholesale funding (both KRW and FX); outflows of 20 percent of maturing retail term deposits (40 percent for FX), 40 percent of retail demand deposits (20 percent for FX), and 10 percent of contingent liabilities (both KRW and FX).
Disruption of 100 percent of new unsecured short-term wholesale funding; 80 percent of secured wholesale funding (both KRW and FX); outflows of 6 percent of retail term deposits (30 percent for FX), and 40 percent of retail demand deposits (20 percent for FX).
Severance of committed credit lines: at 0 and 100 percent.
Assessment criteria
Maintaining no liquidity shortfall.
Reporting format to the FSAP team
Liquidity shortfall, and inflows and outflows by type of funding (individual institutions); domestic and foreign currency separately.
Note: The authorities did not provide supervisory data. The FSAP team was unable to carry out independent stress test due to the unavailability of publicly available data.

REPUBLIC OF KOREA
INTERNATIONAL MONETARY FUND 43
Table AIV.3. Stress Test Matrix (STeM) for the Non-bank Depository Institutions (Solvency Risk)
Domain Assumptions Top-down by Authorities
Institutions included
All mutual savings banks; all credit unions; all agricultural cooperatives; all fisheriescooperatives; and all forestry cooperatives (on an aggregate basis of each type).
Market share 69 percent of the assets of non-bank depository institutions. 19 percent of the assets of non-bank financial institutions. 10 percent of the assets of all financial institutions.
Data and baseline date
Data as of December 2012.
Methodology Reverse stress test.
An ad hoc increase in NPLs.
Shocks A 10 percent increase in NPLs.
Assessment criteria Reporting format to the FSAP team
Maximum magnitude of NPL shock that would account for a drop of capitaladequacy below minimum regulatory level.
Post-shock solvency ratios and capital shortages.
Note: The authorities did not provide the supervisory data. The FSAP team was unable to carry out independent stress test due to the unavailability of publicly available data.