imf country report no. 16/231 russian federation · imf country report no. 16/231 russian...
TRANSCRIPT

© 2016 International Monetary Fund
IMF Country Report No. 16/231
RUSSIAN FEDERATION FINANCIAL SYSTEM STABILITY ASSESSMENT
This paper on the Russian Federation was prepared by a staff team of the International
Monetary Fund as background documentation for the periodic consultation with the
Russian Federation. It is based on the information available at the time it was completed
on June 14, 2016.
Copies of this report are available to the public from
International Monetary Fund Publication Services
PO Box 92780 Washington, D.C. 20090
Telephone: (202) 623-7430 Fax: (202) 623-7201
E-mail: [email protected] Web: http://www.imf.org
Price: $18.00 per printed copy
International Monetary Fund
Washington, D.C.
July 2016

RUSSIAN FEDERATION FINANCIAL SYSTEM STABILITY ASSESSMENT
Approved By James Morsink and James Gordon
Prepared By Monetary and Capital Markets Department
This report is based on the work of the Financial Sector Assessment Program (FSAP) missions that visited the Russian Federation during February 2–18, 2016 and March 15–30, 2016. The FSAP findings were discussed with the authorities during the Article IV Consultation mission during May 16–21, 2016.
The FSAP team was led by Karl Habermeier (IMF) and Aurora Ferrari (World Bank) and included Veronica Bacalu (Deputy Mission Chief), Adrian Alter, Nazim Belhocine, Chady El Khoury, Dale Gray, Phakawa Jeasakul, Edda Rós Karlsdóttir, Mikari Kashima, Fabian Lipinsky, Diarmuid Murphy, Katharine Seal (all IMF); Richard Britton and Richard Pratt (IMF experts); and Rinku Chandra (Deputy Mission Chief), Pierre-Laurent Chatain, Jennifer Chien, Eugene Gurenko, Alena Kantarovich, Jean Michel Lobet, Mai Ngyuen, Tatiana Segal, Ilias Skamnelos (all World Bank); and Alma Qamo (World Bank expert).
The mission met with Governor Elvira Nabiullina and the senior management and staff of the Central Bank of Russia; Messrs. Alexei Moiseev and Maxim Oreshkin, Deputy Ministers of Finance; and Mr. Nikolai Podguzov, Deputy Minister of Economic Development. The mission also met with senior executives of local and foreign banks and other representatives of the business community.
FSAPs assess the stability of the financial system as a whole and not that of individual institutions. They are intended to help countries identify key sources of systemic risk in the financial sector and implement policies to enhance its resilience to shocks and contagion. Certain categories of risk affecting financial institutions, such as operational or legal risk, or risk related to fraud, are not covered in FSAPs.
The Russian Federation is deemed by the Fund to have a systemically important financial sector according to SM/10/235 (9/16/2010), and the FSAP stability assessment is part of bilateral surveillance under Article IV of the Fund’s Articles of Agreement.
This report was prepared by the IMF team led by Karl Habermeier. It draws on Detailed Assessment Reports on compliance with the Basel Core Principles for Effective Banking Supervision and the IOSCO Objectives and Principles of Securities Regulation, and on a number of Technical Notes.
June 14, 2016

RUSSIAN FEDERATION
2 INTERNATIONAL MONETARY FUND
CONTENTS
Glossary ___________________________________________________________________________________________ 4
EXECUTIVE SUMMARY ___________________________________________________________________________ 6
MACROFINANCIAL BACKGROUND ______________________________________________________________ 9
A. Macroeconomic Setting and Outlook ___________________________________________________________ 9
B. Financial Sector Structure _____________________________________________________________________ 11
BANKING SYSTEM STABILITY __________________________________________________________________ 12
A. Performance ___________________________________________________________________________________ 12
B. Key Risks and Vulnerabilities __________________________________________________________________ 14
C. Banking Sector Resilience _____________________________________________________________________ 14
D. Liquidity Management ________________________________________________________________________ 18
FINANCIAL SECTOR OVERSIGHT AND REGULATION _________________________________________ 20
A. Institutional Setup _____________________________________________________________________________ 20
B. Banking ________________________________________________________________________________________ 20
C. Financial Markets ______________________________________________________________________________ 21
D. Insurance ______________________________________________________________________________________ 21
E. Financial Market Infrastructures and Payments ________________________________________________ 22
F. Anti-Money Laundering and Combating the Financing of Terrorism __________________________ 22
MACROPRUDENTIAL POLICIES ________________________________________________________________ 23
CRISIS MANAGEMENT AND RESOLUTION ____________________________________________________ 24
A. Lender-of-Last-Resort _________________________________________________________________________ 24
B. Bank Resolution _______________________________________________________________________________ 24
BANKING SECTOR DEVELOPMENT PRIORITIES _______________________________________________ 27
A. Structure and Governance_____________________________________________________________________ 27
B. Financial Inclusion _____________________________________________________________________________ 28
BOX
1. Anti-Crisis Measures Introduced in Late 2014 to Stabilize the Financial System _______________ 10

RUSSIAN FEDERATION
INTERNATIONAL MONETARY FUND 3
FIGURES
1. Recent Economic Developments ______________________________________________________________ 29 2. Corporate Sector Developments, 2006–16 ____________________________________________________ 30 3. Banking System Structure _____________________________________________________________________ 31 4. Bank Assets and Liabilities, 2008–15 ___________________________________________________________ 32 5. Bank Capital and Liquidity, 2008–15 ___________________________________________________________ 33 6. Bank Profitability, 2005–15 ____________________________________________________________________ 34 7. Bank Performance by Asset Size, 2014–15 _____________________________________________________ 35 8. Bank Asset Quality, 2008–15 __________________________________________________________________ 36 9. Stress Test Scenarios and Restructured Loans, 2013–16 _______________________________________ 37 10. Stress Test Results (V-Shaped Scenario) _____________________________________________________ 38
TABLES
1. FSAP Key Recommendations ____________________________________________________________________ 8 2. Selected Macroeconomic Indicators, 2013–21_________________________________________________ 39 3. Risk Assessment Matrix (RAM) ________________________________________________________________ 40 4. Financial Stability Indicators, 2013–16 _________________________________________________________ 41 5. Banking Sector Stress Testing Matrix (STeM) __________________________________________________ 42 6. Macroeconomic Scenarios: Projections, 2015–20 ______________________________________________ 47 7. Detailed Stress Test Results ___________________________________________________________________ 48
APPENDIX
I. 2011 FSAP Stability Module Recommendations Status ________________________________________ 49

RUSSIAN FEDERATION
4 INTERNATIONAL MONETARY FUND
Glossary
AML/CFT Anti-money laundering/combating the financing of terrorism AQR Asset quality review BCPs BIS
Basel Core Principles Bank for International Settlements
BU Bottom-up CAR Capital adequacy ratio CBR Central Bank of the Russian Federation CCP Central counterparty DIA DIF
Deposit Insurance Agency of the Russian Federation Deposit Insurance Fund
EM Emerging market FAPM Federal Agency for Property Management FATF Financial Action Task Force FMI Financial Market Infrastructure FSC National Council on Ensuring Financial Stability FSD Financial Stability Department FX Foreign exchange GDP Gross domestic product GFC Global Financial Crisis IFRS International Financial Reporting Standards IOSCO International Organization of Securities Commissions IT Informational technology FSAP Financial Sector Assessment Program LCR Liquidity coverage ratio LOLR Lender-of-last-resort MIS Management information system ML/TF Money laundering/terrorism financing MoED Ministry of Economic Development MoF Ministry of Finance NCC National Clearing Center NII Net interest income NPLs Nonperforming loans NPSD National Payment Systems Department NRA National risk assessment NSD National Settlement Depository NWF OECD
National Wealth Fund Organization for Economic Cooperation and Development
PD Probability of default

RUSSIAN FEDERATION
INTERNATIONAL MONETARY FUND 5
PEP Politically exposed persons P&A Purchase and assumption RF Reserve Fund RWAs Risk-weighted assets SIB Systemically important bank SOB State-owned commercial bank (bank with state shares) SOE State-owned enterprise TD Top-down T-bills Treasury-bills

RUSSIAN FEDERATION
6 INTERNATIONAL MONETARY FUND
EXECUTIVE SUMMARY The Russian economy is experiencing a protracted recession and faces significant risks. The sharp decline in oil prices has negatively affected growth, while sanctions have impaired access to international markets. These developments have exacerbated the pre-existing structural slowdown in growth and taken a toll on the banking system. The key risks include a weaker medium-term path for oil prices, the intensification of geopolitical tensions and sanctions, and a further slowdown in growth.
The authorities’ policies have helped to keep the banking system stable. The policy response combined liquidity provision, capital support, and temporary regulatory forbearance. The authorities’ crisis management framework has repeatedly been tested in practice and has proven to be effective.
However, the banking system is weak and likely to need additional capital. Even in the baseline scenario, certain banks will need new capital owing to low profitability and increasing credit losses. The required resources increase in the stress scenarios, but remain manageable. If public funds are needed for recapitalization, there is sufficient fiscal space, provided that fiscal policy remains prudent. Stress tests should be supplemented by a granular and comprehensive review of banks’ asset portfolios to gauge capitalization needs.
Systemic liquidity management has played a crucial role in maintaining stability, but faces a changing environment. The banking system may move into structural excess liquidity in 2016 owing to the use of the Reserve Fund (RF) to finance the government deficit. If so, and given that the Central Bank of Russia (CBR) has the tools to sterilize this excess liquidity, money market segmentation could mean that short–term CBR refinancing may co-exist with aggregate liquidity absorption. Issuance of treasury-bills (t-bills) by the government could help sterilize any structural liquidity overhang. Going forward, efforts should focus on improving the functioning of the interbank market so that banks can better manage their liquidity risks.
With the transformation of CBR into a “mega regulator,” supervision of the financial sector has been enhanced. Since 2013, CBR has overseen the banking system, securities markets, financial market infrastructures, private pension funds, insurance, and micro-finance institutions. This reform supports consistent regulation and supervision of almost the entire financial system.
Bank regulation and supervision have greatly improved in recent years, but there is more to be done. Key areas for improvement include related party lending, country and transfer risks, operational risks, and supervisory interactions with external auditors. In addition, the implementation of risk-based supervision is in progress.
Modern regulation and supervision would support future growth of the securities and insurance markets. CBR is rapidly moving ahead with the implementation of International Organization of Securities Commissions (IOSCO) standards for financial market supervision. Further action is needed in the identification of conflicts of interest, protection of clients, auditor

RUSSIAN FEDERATION
INTERNATIONAL MONETARY FUND 7
independence, risk management, and disclosure. Insurance regulation and supervision is still largely rules-based. It would be desirable to implement transparent risk-based supervision and continue building CBR’s specialized insurance expertise.
Financial market infrastructures are well developed, but some aspects need refinement. The National Settlement Depository (NSD) should further develop its business continuity plan to ensure end-of-day settlement in the event of a disruption, and National Clearing Center (NCC) should introduce intraday variation margin calls.
Important steps have been taken to strengthen the AML/CFT framework. The legislative and regulatory frameworks and their implementation have improved since the last assessment in 2008. The authorities still need to complete the national assessment of money laundering/terrorism financing (ML/TF) risks—National Risk Assessment (NRA)—and improve the effective implementation of customer due diligence regarding beneficial owners and politically exposed persons (PEPs) by banks.
There has been considerable progress in developing the macroprudential framework, although the toolkit is limited under existing legislation. Institutional arrangements for financial stability appear to be effective, and macroprudential tools have been used to address identified systemic risks, mainly in retail lending. It would be important to amend the law to provide CBR with a comprehensive set of macroprudential tools.
Improvements in the bank resolution framework will be central to maintaining financial stability while minimizing the use of public funds. Decisive efforts are underway to weed out weaker banks. However, there is a heavy reliance on open bank resolution funded by CBR loans via the Deposit Insurance Agency (DIA). This approach can give rise to moral hazard and is costlier than necessary to the public sector. The resolution toolkit needs to be expanded to improve effectiveness and minimize the use of public funds for all banks. It would be desirable to discontinue CBR loans to the DIA, with any public funds that might be needed for bank restructuring and resolution to be provided by the federal budget. In the medium term, a funding mechanism for recovery of the temporary public financing should be established.
Over the longer term, diversification and deepening of the financial sector are needed to support economic growth. The financial sector is very bank-centric, with state-owned banks playing a dominant role, and there is considerable scope for the further development of securities and insurance markets. There are also significant variations in financial inclusion between urban and rural areas and across income levels, and a comprehensive financial inclusion plan would help to address these issues. Further privatization of state-owned banks would also be desirable, along with governance reforms.

RUSSIAN FEDERATION
8 INTERNATIONAL MONETARY FUND
Table 1. Russian Federation: FSAP Key Recommendations 1/
Recommendations Timing
Banking Stability Conduct an asset quality review (AQR) to ensure adequate bank capitalization (CBR). ST/MT Enhance stress testing practices, including on a consolidated basis and by currency (CBR). ST/MT Liquidity Management Enhance framework to encourage banks to self-insure and manage their risks in the market (CBR).
ST
Review FX repo framework, and formalize lender of last resort (CBR). ST Re-establish t-bill program and coordinate sterilization of excess liquidity (Ministry of Finance—MoF, CBR).
ST
Ensure adequate realized capital through legal amendments as needed (CBR). MT Financial Sector Oversight and Regulation Require prior approval for banks’ domestic investments in nonbank institutions (CBR). ST Issue specific requirements for management of banks’ country and transfer risks (CBR). ST Upgrade framework for relations with and use of banks’ external auditors (CBR). ST Strengthen further the legal framework applicable to related parties (CBR). ST Upgrade framework for prudential oversight of banks’ operational risk (CBR). ST Bring securities and insurance regulation and supervision into line with international standards (CBR).
MT
Ensure the effective implementation of the AML/CFT framework (CBR, MoF, Rosfinmonitoring).
ST
Macroprudential Policy Adopt legal changes to provide a comprehensive policy toolkit (CBR, MoF). ST/MT Crisis Management and Resolution Review the use of public funds to finance the DIA for resolution purposes to be provided by the federal government. If it is necessary to use CBR funds, the federal government should provide an indemnity (CBR, MoF).
MT
Establish a funding mechanism for recovery of the costs of providing temporary public financing through levies on the financial industry (CBR, MoF).
MT
Introduce the full range of resolution powers and safeguards recommended by the FSB Key Attributes, including by implementing legal and operational changes needed to make purchase and assumption (P&A) an effective resolution tool (CBR, MoF).
ST
Banking Sector Development Promote legal reforms to increase state-owned commercial banks (SOB’s) Board effectiveness (MoF, CBR).
MT
Continue gradual privatization of SOBs (MoF, CBR) as conditions permit. MT
1/ “ST–short term” is within one year; “MT–medium term” is one to three years.

RUSSIAN FEDERATION
INTERNATIONAL MONETARY FUND 9
MACROFINANCIAL BACKGROUND A. Macroeconomic Setting and Outlook
1. The Russian economy is experiencing a protracted recession (Figure 1). The sharp decline in oil prices and the reduced access to international capital markets due to sanctions contributed to a 3.7 percent contraction in real gross domestic product (GDP) in 2015. The ruble came under severe pressure at end-2014 amid concerns about external debt redemptions. To curb foreign exchange reserve losses, the CBR floated the exchange rate and hiked the CBR policy rate by 650 bps to 17 percent. Following the ruble depreciation and Russia’s imposition of a food import ban as a response to sanctions, inflation accelerated sharply, peaking at 17 percent in March 2015 before declining to 7½ percent by April 2016. Accordingly, the policy rate was cut in stages, most recently to 10.5 percent in June 2016.
2. Sanctions, market turbulence, and the ensuing recession have taken a toll on banks. Even prior to the sharp depreciation of the ruble, banks’ asset quality and income positions were adversely affected by the growth slowdown. The situation worsened from end-2014 as retail deposit outflows created liquidity pressures, asset prices declined, and banks’ net interest margins deteriorated owing largely to higher policy rates. Credit growth decelerated sharply, in particular in the consumer segment.
3. The authorities took decisive anti-crisis policy measures to preserve banking stability (Box 1). These policies have been successful, and the authorities are now focused on exiting from the measures. In the first half of 2015, confidence in banks strengthened and has been little affected by subsequent episodes of ruble volatility. Retail deposits increased, liquidity conditions improved, and banks’ reliance on CBR funding decreased. In addition, banks have built up sufficient foreign exchange (FX) buffers to repay the CBR FX facilities. On January 1, 2016, most of the remaining regulatory forbearance measures were lifted.1 Nonetheless, as detailed below, the banking system faces significant challenges. CBR continues closing mostly small banks, notably those in weak financial condition or in breach of regulations (including in the AML/CFT area).
1 Some forbearance measures affected provisions and cannot be reversed. Consequently, staff made adjustments to asset quality and provisions in the stress test scenarios, as discussed below.
RUSSIAN FEDERATION
10 INTERNATIONAL MONETARY FUND
Box 1. Anti-Crisis Measures Introduced in Late 2014–15 to Stabilize the Financial System
Liquidity management. Increases in the size and term of CBR ruble facilities, including the acceptance of non-marketable collateral; FX repo facilities; access to CBR facilities for the central counterparty (CCP) at the
Moscow Exchange; and informal limits on the net foreign asset holdings of five large state-owned enterprises.
Capital support. Various programs funded by the federal budget, the NWF, and the CBR, including notably a program worth 1.1 percent of GDP implemented by DIA for the recapitalization of 30 mainly state-owned banks.
Deposit Insurance. Scope of deposit insurance expanded to include unincorporated entrepreneurs; maximum coverage raised from RUB 700,000 to RUB 1.4 million (about US$ 10,000 and 20,000 at the present exchange rate).
Temporary regulatory forbearance. (i) Moratorium on recognizing negative valuation changes for securities portfolios; (ii) permission to price FX-denominated assets and liabilities at October 1, 2014 exchange rates; and (iii) flexibility in loan classification and provisioning. Forbearance measures were adjusted throughout 2015 and considerably reduced by early 2016.
Reducing counterparty risk. Enabling partial compensation of losses arising from banks’ claims against banks whose licenses were revoked.
4. CBR’s operational framework is shifting from containing systemic liquidity risks to managing the consequences of the use of the RF. Starting in early 2015, CBR began tightening access to ruble repurchase and secured loan transactions in order to sterilize the government’s withdrawals from the RF—a budget stabilization fund—and avoid undue volatility in short-term rates.
5. The corporate sector is adjusting to lower oil prices but performance is uneven (Figure 2). Ruble depreciation has cushioned the revenues of energy exporters from lower oil prices. In addition, energy companies have remained profitable as their cost structure is primarily in rubles and they are among the lowest-cost producers globally. The external debt service of major corporations most affected by sanctions is sufficiently covered by their liquid external assets. However, the debt servicing capacity of the corporate sector as a whole shows signs of weakening. In particular, smaller companies reliant on domestic bank financing show weaker profitability, higher leverage, and an increase in nonperforming loans (NPLs). At the aggregate level, about half of total corporate debt is denominated in FX, but domestic FX risk appears contained as net FX debt to the banking system amounts to 4 percent of GDP, while short-term external assets exceed short-term liabilities by about US$65 billion. Despite the large cumulative exchange rate depreciation since late 2014, NPLs denominated in FX have increased only moderately and are still lower than NPLs denominated in rubles.2
2 FX loans are mostly extended to the largest and strongest corporations in Russia. Consequently, provisioning rates are lower and NPLs tend to increase less than for ruble-denominated loans.

RUSSIAN FEDERATION
INTERNATIONAL MONETARY FUND 11
6. The outlook for 2016 is for continued recession, while medium-term prospects remain weak (Table 2). Relatively low oil prices and tighter fiscal policy are projected to result in a GDP contraction of 1.2 percent in 2016. The more competitive exchange rate and the normalization of financial conditions will provide some support to the economy, with growth expected to turn positive in 2017. However, real income growth will remain slow, and households continue to reduce their borrowing. Weak demographics and slow productivity growth are expected to limit potential growth to 1½ percent over the medium term.
7. Risks remain significant, but existing macroeconomic buffers will help limit the impact. The key risks to growth include persistently lower energy prices, and intensification of geopolitical tensions (RAM, Table 3). The materialization of these risks would increase balance of payments pressures and deepen the recession. Although most corporates have enough FX to cover their short-term external debt obligations and are hedged against exchange rate risks, deleveraging could reduce investment and thus output. Weak growth will also weigh on the financial sector. Even though more capital may be needed, the banking sector is relatively small as a share of GDP, and significant government participation in the system has made it easier for the authorities to manage systemic stress. Also, Russia has a floating exchange rate, large official FX reserves, a positive net international investment position of about 20 percent of GDP, and a current account surplus. Balance sheet currency mismatches seem low and do not appear to impose a constraint on exchange rate flexibility. Public sector debt is also low, and financing needs are moderate.
B. Financial Sector Structure
8. The Russian financial sector is relatively small (Figure 3). Banks are the dominant players, with assets amounting to 103 percent of GDP at end-2015. Pension funds, insurance, and mutual funds have assets of 3.6, 2.0, and 3.3 percent of GDP, respectively. The ratio of bank credit to GDP is low among a group of comparators (Brazil, Turkey, India, China, and South Africa).
9. The banking sector is heavily concentrated, and state ownership continues to be important. The largest 20 banks account for three quarters of system assets, while the top 10 banks extend about 70 percent of total lending. State-owned commercial banks (SOBs), dominated by Sberbank and VTB Group, accounted for 60 percent of system assets at end-2015. The top 10 private banks hold 16 percent of system assets, foreign banks hold 13 percent, and 11 percent are held by specialized and small banks. Many smaller banks operate in monoindustrial cities and are often important in their respective regions, complicating efforts to further consolidate the banking sector. The 1990’s saw a decrease in state ownership, but the failure of systemically important private commercial banks in 1998 triggered a partial reversal. The 2008 Global Financial Crisis (GFC) further strengthened the dominance of majority SOBs, including most notably Sberbank, which provided a safe harbor and served as bail-out vehicles during the turbulent period.
10. The business model of Russian banks relies heavily on traditional credit intermediation (Figure 4). Seventy percent of banking assets are loans, followed by securities (mostly in domestic government and corporate bonds), and interbank lending. Banks are mainly

RUSSIAN FEDERATION
12 INTERNATIONAL MONETARY FUND
funded by deposits of nonfinancial corporations and individuals. Capital market funding is very limited.
11. The money market reflects a three-tiered banking system based on ownership structure and credit ratings. Tier I is made up of several large and highly rated banks with low deposit funding costs, which rely mainly on the FX swap market for any wholesale ruble liquidity. These banks also have access to both secured and unsecured interbank markets. Tier II is a larger number of mid-sized banks which do not have access to the unsecured interbank market, and instead raise both FX and ruble in the FX swap and repo markets. These banks have limited lines with Tier I banks and avail themselves of CBR facilities. Tier III is dominated by small banks (with low ratings and larger holdings of higher yielding less liquid assets) with little or no access to the interbank market, often owing to non-transparent ownership structures and lending practices. These banks instead often conserve large cash buffers and can only access CBR operations with high quality collateral.
12. Liquidity management is focused largely on the short term. Larger banks appear reluctant to open significant lines with smaller banks; corporate deposits are price sensitive and easily shift across banks; retail term deposits are easily withdrawn; and government placements with banks can be volatile. Liquidity management is also hampered somewhat by late settlements in the payment system. Despite the increasing use of the CCP, most of interbank activity was at maturities of less than seven days as of February 2016.
BANKING SYSTEM STABILITY
A. Performance
13. Despite recent stress, reported capital ratios remain adequate on average, and liquidity has improved (Figure 5). The capital adequacy ratio of banks was broadly stable in 2015 at about 13 percent, thanks to the capital injections and regulatory forbearance. After forbearance was reduced in early 2016, the capital adequacy ratio (CAR) fell to 12 percent (Table 4). Liquidity has improved, with the loan-to-deposit ratio decreasing to 115 percent by end-2015 from its recent peak of 125 percent, reflecting increased retail deposits, falling credit growth, and government spending out of the RF. However, there is considerable dispersion around these averages, as reflected in the closures of many, mainly small, banks.
14. Loan portfolio quality and profitability have deteriorated (Figure 6). NPLs have increased, with household overdue loans reaching 8.4 percent of total loans by February 2016, compared to 6.5 percent for the corporate sector. Overall NPLs were stable in May–December 2015, reflecting loan rescheduling and regulatory forbearance. Bank profitability has dropped markedly—with the return on assets reaching 0.3 percent at end-2015—to levels similar to those observed during the GFC. Several factors explain these developments. On the revenue side, net interest margins have contracted, reflecting slower asset growth and higher policy rates. In addition, net fees and commissions fell in line with net interest income (NII). On the expenditure side, non-interest

RUSSIAN FEDERATION
INTERNATIONAL MONETARY FUND 13
expenses declined at a lower rate than NII, while provisions have risen sharply owing to the deterioration in loan portfolios.
15. Connected lending and loan concentration continue to be of concern, with possible implications for asset quality. Large exposures stood at 261 percent of capital in February 2016, The reported figures may, however, understate the extent of related party lending, as detailed in the section on bank supervision. Connected lending and loan concentration are especially pronounced among the smaller banks, but some large banks are also affected.
16. Performance across the system is uneven and medium-sized banks appear particularly vulnerable (Figure 7). Banks in the 21–50 segment, by asset size, show the weakest performance, with a negative return on equity of about 25 percent in 2015Q4. These banks did not benefit from the capital injection program and were particularly exposed to underperforming unsecured consumer lending. Two banks in this segment are currently undergoing resolution. Profits of the whole system remained slightly positive owing to the performance of a few of the largest banks.
17. Banks’ net FX exposures appear to be within prudent limits. Banks are adhering to regulatory limits on net open FX positions, with a total overall limit of 20 percent of capital. The net foreign asset position of banks has continued to improve and reached US$100 billion at end-2015, reflecting foreign deposit withdrawals and deleveraging following the imposition of sanctions.
18. Cross-border bank exposures are declining. Based on Bank for International Settlements (BIS) data, the exposure of foreign banks to Russia has halved since the onset of the geopolitical tensions in 2014 to about US$110 billion by end-2015. Forty percent of foreign bank claims are concentrated in France and Italy (US$26 and US$19 billion). Russian international investment position data suggests a cross-border exposure of Russian banks of about US$245 billion at end-2015 (below 20 percent of GDP), of which two thirds are loans and deposits. Russian banks’ subsidiaries operate primarily in Austria, Turkey, and Cyprus.3
19. As in other emerging markets (EMs), financial spillovers to and from Russia have increased substantially in the past two decades.4 However, spillovers from Russia have propagated through equity markets more strongly than from other EMs. At the same time, financial spillovers to Russia stemming from currency markets have more than tripled following the GFC.
20. CBR is implementing Basel III requirements. CBR has identified and published a list of 10 systemically important banks (SIBs). It has already begun to phase in the liquidity coverage ratio (LCR). CBR has also lowered the Common Equity Tier 1 capital minimum from 5 percent to 4½ percent and total capital from 10 percent to 8 percent of risk-weighted assets (RWAs) in order to offset Basel III’s stricter definition of capital and higher risk weights (about 0.6 percentage point) and
3 The exposure of Russian banks to Ukraine, including interbank loans and loans to individuals and firms, was estimated at 1.1 percent of Russia’s GDP in January 2016.
4 Financial spillovers are defined as the impact of asset price movements or volatility in a given country on asset prices in other countries, when accounting for common shocks. See Global Financial Stability Report, Chapter 2, April 2016.

RUSSIAN FEDERATION
14 INTERNATIONAL MONETARY FUND
the introduction of new capital buffers (0.625 percent for capital conservation and 0.15 percent for the systemic surcharge).
B. Key Risks and Vulnerabilities
21. The banking sector—while currently stable—is exposed to significant risks, asset quality being the largest (Figure 8). Even in the absence of a further macroeconomic deterioration, credit losses could be significant. As noted, unsecured consumer lending in 2011–14 has already led to an increase in NPLs in the retail sector. The increase in NPLs in the corporate sector has been smaller thus far, but overdue loans have been rising in various industries, in particular in construction and real estate, where contracts were denominated in FX and were not rolled over when the exchange rate depreciated. Other sectors experiencing increased credit risk include mining, trade, and agriculture, which suffered from low domestic demand and a slowdown in government spending, and also from pre-existing weaknesses in the case of mining.
22. There is considerable uncertainty about the strength of loan portfolios. CBR inspections of asset quality have revealed violations, including lending to shell companies, overvaluation of collateral, misreporting, and unreliable financial statements. Nonperforming assets may thus be higher than reported, reflecting: (i) lower quality of restructured loans; (ii) potentially under-provisioned and under-collateralized portfolios; and (iii) transfer of distressed assets to affiliated off-balance sheet entities that are not subject to consolidated supervision.
23. At a system-wide level, liquidity risk is contained, but individual vulnerabilities remain. The short-term focus and segmented nature of the money market increases the vulnerability of the banking system to liquidity shocks going forward.5 Large banks hold sizeable stocks of high-quality assets and—as noted above—have access to unsecured funding. Lower-rated small and medium-sized banks do not have access to the same low-cost sources of funding, and instead rely on higher yielding collateral, short-term secured markets, and CBR. These banks are vulnerable to liquidity dry-ups.
24. Market risk, including sovereign risk, appears contained, but data limitations make the assessment difficult. Securities portfolios account for 15 percent of total assets at end-2015, and consist mainly of debt securities, but also include small shares of equities and minority interest holdings. While direct sovereign risk is small (sovereign securities constitute only a quarter of debt security portfolios), indirect sovereign risk arising from the state-owned financial and non-financial corporate sectors is likely greater, given that a large share of the banking sector and many large corporations are state-owned.6
C. Banking Sector Resilience
5 During late 2014, the significant fall in oil prices and the flight from ruble denominated assets led to large margin calls on the secured interbank market and the emergence of collateral constraints. As a result, market rates were pushed through CBR’s interest rate corridor ceiling, and the yield curve became inverted for two–three days. 6 A comprehensive analysis of sovereign risks was not undertaken given that supervisory data were not available.

RUSSIAN FEDERATION
INTERNATIONAL MONETARY FUND 15
Stress test design
25. Several stress tests were performed—top-down (TD) by CBR, bottom-up (BU) by banks, and TD by staff (Figure 9; Table 5). The TD tests had a horizon of five years, while the BU test had a horizon of one year. The resilience of the system was assessed relative to the regulatory capital adequacy minimums: 4 ½ percent for Common Equity Tier 1 and 8 percent for the total CAR. The stress tests covered a wide range of risks, including credit, market, interest rate, and liquidity:
Asset quality, income, and capital of individual banks were modeled under three macroeconomic scenarios: baseline, V-shaped, and L-shaped. This allows for a bank-by-bank assessment of possible needs for additional capital.
The TD solvency stress test performed by CBR covered essentially all of the banks in the system (681 in total) and were based on Russian accounting standards, on a stand-alone basis.
The BU stress test covered 12 banks, including 10 systemically important banks (SIBs), accounting for two thirds of system assets.
The TD stress test performed by staff used publicly available data for 37 banks accounting for about 82 percent of system assets, and covered credit and interest rate risk. The data captures consolidated banking groups and is based on International Financial Reporting Standards (IFRS), which somewhat limits the impact of regulatory forbearance.
26. In addition, CBR carried out single-factor tests and system-wide liquidity stress tests. The liquidity stress test included three scenarios (mild, severe, very severe) with a test horizon of one month. The scenarios entail increasingly large outflows from most liability categories and increasingly high discounts on non-liquid asset categories. The scenarios assume no CBR or interbank financing. The liquidity stress tests assess the extent to which liquidity outflows exceed the available liquid assets.
27. The macroeconomic stress scenarios quantified the impact of negative oil price shocks calibrated to tail events in the oil price probability distribution (Table 6). In the V-shaped scenario, oil prices fall to US$19 per barrel, while in the L-shaped scenario, they fall to US$25 per barrel but recover more slowly. These tail events have strong adverse effects on GDP and unemployment. They also entail further large exchange rate depreciation, in view of the relationship between oil prices and RUB/US$ rate. Inflation and short-term interest rates respond strongly to the exchange rate depreciation. In the medium term, the scenarios are conservative. Brent recovers only moderately to US$40 and US$37 in 2020 in the V-shaped and L-shaped stress scenarios, and annual real GDP growth converges to one percent in both scenarios, half a percentage point below 2020 baseline growth.
28. Adjustments were made to provisioning levels in the staff’s TD stress test. Staff estimated the effect on capital adequacy of weak restructured loans and under-provisioning using aggregated data from CBR and information from market participants. First, staff estimated the

RUSSIAN FEDERATION
16 INTERNATIONAL MONETARY FUND
impact of the migration of a certain part of restructured loans into lower loan categories associated with higher provisioning rates. While restructured loans stand at about 30 percent of large loans, one third of the restructured loans were estimated to be of weaker quality at end-2015. The migration of such loans resulted in an increase of loan impairment charges by 1 percentage point of total loans. Second, staff accounted for under-provisioning in each loan category, with the loan impairment charges increasing by an additional 2.2 percentage points. The overall effect of restructuring and under-provisioning was thus assessed to be about 3.3 percentage points.
Stress test results
29. The results suggest that some banks would need to strengthen capital, even in the baseline scenario (Table 7; Figure 10). CBR’s baseline estimate points to an aggregate capital deficit of 0.3 percent of GDP.7 Staff’s baseline simulations are similar to those of CBR in the absence of the adjustment to asset quality discussed above. Taking account of this adjustment, staff’s estimate of the aggregate capital deficit is 1 percent of GDP.8 CBR has indicated that it is prepared to take appropriate corrective action.
30. Tail events such as the V-shaped and L-shaped scenarios would raise the estimated capital needs:
CBR’s TD exercise shows that under the V-shaped and L-shaped scenarios, the aggregate capital deficit reaches, respectively, 2.5 and 2.1 percent of GDP by the end of the five-year horizon. In the V-shaped scenario, the average system-wide CAR remains at about 9 percent, above the regulatory minimum, with 140 banks (30 percent of system assets) breaching minimum capital requirements. In the L-shaped scenario, the average system-wide CAR remains at about 10 percent, with 108 banks (29 percent of system assets) breaching minimum capital requirements. Credit losses account for most of the impact, followed by losses from market risk. NPLs increase by 8.1 and 6.5 percentage points cumulatively in the V-shaped and L-shaped scenarios during the first two years of the stress test horizon.9
The BU analysis shows that CBR’s assessment of risks is significantly more conservative than banks’ own assessment. Over the one year-horizon used in the BU analysis, banks report a capital deficit under the V-shaped scenario that is only 40 percent as large as in the comparable CBR TD exercise, and in the L-shaped scenario, the proportion is even lower at less than 20 percent. Moreover, in the baseline scenario, banks see essentially no capital deficit.
7 The aggregate capital deficit is defined as the amount of additional capital needed to bring all banks up to at least the 8 percent CAR minimum. 8 While staff assessed asset quality conservatively, a more detailed review of asset quality (bank by bank, portfolio by portfolio, and loan by loan) may reveal somewhat larger capital deficits. 9 The stress testing methodologies model loan impairment charges, with NPLs growing in line with loan impairment charges. As CBR did not provide NPL numbers under different scenarios, staff calculated NPLs based on CBR’s credit loss estimates.
RUSSIAN FEDERATION
INTERNATIONAL MONETARY FUND 17
Staff’s TD exercise estimates an aggregate peak capital deficit of about 4½ percent of GDP during the stress test horizon in both the V-shaped and L-shaped scenarios. This figure includes staff’s adjustment to initial asset quality and an increase in risk weights from 90 to 100 percent.10
Without these adjustments, the aggregate capital deficit is about 2.5 percent of GDP, similar to the CBR results. The cumulative increase in NPLs in 2016 and 2016 is about 12½ percentage points with adjustments and 9.2 percentage points without adjustments. Some large state-owned, private, and foreign banks seem to be relatively weaker, as they breach minimum capital ratios under the V-shaped and L-shaped scenarios even without the asset quality adjustment.
31. The single factor test with the largest impact was the bankruptcy of banks’ five largest borrowers, while tests for market risk showed only minor effects. The failure of each bank’s five largest corporate borrowers is a highly unlikely event, but serves to illustrate the sensitivity of banks to loan concentration: it results in a capital deficit in 338 banks (82 percent of system assets) and totaling about 2 percent of GDP. This result reflects the high concentration of lending to a few borrowers in many banks. Tests for market risk included: (i) an exchange rate depreciation of 20 percent; (ii) an upward shift in the yield curve by 1,000 basis points for corporate securities and 400 basis points for government securities; (iii) a stock market decline of 30 percent; and (iv) a combined FX and interest rate shock. All of these tests showed relatively minor effects, owing to the small size of securities portfolios.
32. The results of CBR’s liquidity stress tests show minor liquidity deficits for the mild scenario and substantial but manageable liquidity deficits for the strict and very strict scenarios. Under the mild scenario, only 36 banks (1.7 percent of system assets) show liquidity deficits, with a total shortage of less than 0.1 percent of GDP. These indicators increase to 111 banks (11 percent of system assets) with a shortage of 0.4 percent of GDP in the strict scenario and 181 banks (41.8 percent of system assets) with a shortage of 2.9 percent of GDP in the very strict scenario.
10 These peak level deficits occur in different years, 2017 in the V-shaped scenario, and 2019 in the L-shaped scenario.

RUSSIAN FEDERATION
18 INTERNATIONAL MONETARY FUND
Recommendations
33. CBR has significantly upgraded its stress testing practices in recent years, but some further improvements are possible. Key priorities are: (i) implementation of modern, comprehensive, and integrated TD and BU methodologies covering not just banks but also affiliated entities; (ii) development of an “expected loss approach” for credit risk using probability of default, loss given default, and exposure at default; (iii) development of a credit registry, also to provide additional data; (iv) expanded use of the results of TD bank-by-bank stress tests in the bank supervision process, including for capital planning and dividend policy; (v) possible publication of aggregate TD stress test results in the Financial Stability Review; and (vi) enhanced system-wide stress tests for all banks, beginning with the large and medium-sized banks, using macro scenarios and key bank stress test parameter assumptions over a three-year horizon.
34. It would be advisable to also conduct stress tests on a consolidated basis, and liquidity stress tests by currency. The current stress tests on a solo basis may miss downstreaming of problematic assets by D-SIBs (which are subject to stricter regulatory requirements) to unconsolidated subsidiaries. Similarly, liquidity stress tests based on aggregate asset and liability categories may overlook liquidity shortages in particular currencies.
35. In addition to regular stress tests, a granular and comprehensive asset quality review (AQR) is recommended in support of stronger bank capitalization. Stress tests and the Basel Core Principles (BCPs) assessment (see below) identified room for improvement in asset classification and valuation and in the definition of related party lending. A comprehensive review of banks’ asset portfolios and collateral valuations could thus play a crucial role in putting the banking sector on a stronger footing, including by addressing related party lending. The AQR could be conducted by CBR itself if the use of third-party expertise is not possible for legal reasons. Ahead of the AQR, the authorities should formulate a strategy to address the weaknesses that the AQR may uncover, including the criteria for an eventual use of public funds. The recent creation of a CBR unit specialized in risk analysis is welcome in this connection. Given the level of effort involved, the AQR could be focused to start with on those banks deemed to present the highest risks.
D. Liquidity Management
36. CBR has begun reducing the amount of liquidity provided to the banking sector in early 2015, but continued vigilance is needed. CBR liquidity provision—both domestic currency and FX—helped banks and markets weather the period of severe stress. In the course of 2015, the central bank reduced the amount of liquidity provided for systemic needs, a task helped by RF spending. Going forward, the possible need to sterilize the financing of the government deficit during 2016–17 may require increased co-ordination with the government, while money market segmentation could mean that short–term CBR refinancing may co-exist with aggregate liquidity absorption.
37. CBR has scope to further strengthen its operational framework. For long-term operations, the CBR would be a market rate taker. Early pre-payment options can be eliminated to encourage a broader distribution of liquidity in the market. CBR can improve its risk controls,

RUSSIAN FEDERATION
INTERNATIONAL MONETARY FUND 19
particularly for non-marketable collateral. Third-party bank guarantees should be eliminated: even though they reduce idiosyncratic risk, they can mask systemic risk. Enhancing CBR’s operational framework could help to better protect the CBR’s balance sheet and manage system risks in the market.
38. The FX facility introduced in late 2014 was successful, but needs to be carefully withdrawn. This facility was instrumental in containing FX spillovers into the ruble market. Now that conditions have improved, CBR can continue withdrawing it at a pace commensurate with financial stability. Possible actions include changes to pricing, maturity, and access; collateral concentration limits; haircuts based on CBR risk tolerance; and required repayment when counterparty FX buffers are restored. Nonetheless, flexibility in the use of this instrument needs to be retained in case market-wide strains recur.
39. The government could re-introduce benchmark t-bills at the short end of the yield curve. This step would help to safeguard the CBR balance sheet, support the transmission of monetary policy, allow for a better separation of strategic debt management decisions from short-term liquidity management considerations, and reinforce the role of the Ministry of Finance (MoF) in developing the securities markets.
40. In particular, CBR could coordinate with MoF on the use of t-bills for the sterilization of eventual structural excess liquidity. Although CBR has the tools necessary to manage systemic liquidity, the planned drawdown of the RF to finance the government deficit could entail the emergence of an aggregate structural liquidity surplus in the banking system. Although short-term liquidity can be managed through a combination of deposit auctions and CBR bonds, it is preferable to use t-bills for any long-term sterilization in order to avoid having multiple benchmark issuers.
41. It would be prudent to legally formalize policies governing CBR’s realized capital reserves. The legal framework should provide for central bank solvency to underpin CBR’s capacity to independently and credibly carry out its policy functions. A sound capital framework would more generally discourage offloading additional risks onto CBR, and lay the groundwork for the provision of government indemnities for the risks CBR does take on.
42. Going forward, there is a need to deepen the interbank market, also to encourage banks to better self-insure and manage their risks. Reforms should focus on enhancing banks’ incentives and capacity to fund in markets. CBR policy in this area, supported by the government, could be guided by the following considerations: (i) continue to resolve problematic institutions; (ii) refrain from using distortionary actions such as CBR guarantees; (iii) recalibrate facilities to incentivize holdings of marketable liquid assets; and (iv) encourage term market funding; and (v) foster covered bond and commercial paper markets.

RUSSIAN FEDERATION
20 INTERNATIONAL MONETARY FUND
FINANCIAL SECTOR OVERSIGHT AND REGULATION A. Institutional Setup
43. With the transformation of CBR into a “mega regulator,” financial supervision has been enhanced. Since 2013, CBR has overseen banks, securities markets, financial market infrastructure (FMIs), private pension funds, insurance, and micro-finance institutions. This reform has supported consistent regulation and supervision of almost the entire financial system.
B. Banking
44. CBR has made far-reaching changes to the legal and supervisory landscape in recent years. Legislative impediments to cooperation and collaboration based on domestic and cross border supervisory information exchange have been eliminated. The scope and application of consolidated supervision has been enhanced. CBR now has the power to impose standards for the risk management of banks and banking groups.
45. CBR is developing and enhancing its risk-based approach to supervision. CBR has sharpened its risk focus by differentiating its approach to supervision, including by establishing a dedicated division to supervise SIBs. CBR has recently issued regulations that focus on the quality of risk management and governance within firms. These regulations will introduce, for example, scrutiny of firms’ risk appetite.
46. Despite legislative amendments and improved supervisory practices, several areas for improvement have been identified. These primarily relate to implementing policies and practices that place an emphasis on an early intervention approach that seeks to preclude violations. Five high priority areas have been identified as part of the BCP review:
The legal framework governing CBR’s relationship and interactions with the external audit profession is materially deficient. Currently, CBR does not have adequate powers with respect to the relationship with external auditors.
The flow of information has improved, but there are still limitations. Some elements of the BCP are not met because there are no requirements for banks or external auditors to notify CBR in advance, or at all, of material information that is relevant to the soundness and stability of the supervised bank.
The legal regime applicable to related parties has been improved, but further action is needed. The law has been amended to expand the currently narrow scope of related parties to include a person or a group of people affiliated to the bank. The concept of economic linkages has been introduced in the law, but implementation is not expected before 2017.
Management of country, transfer, and acquisitions risks needs to be improved. There are limited requirements for management of country and transfer risks. As a result, minimum requirements for risk policies, processes, and limits need to be substantially strengthened.

RUSSIAN FEDERATION
INTERNATIONAL MONETARY FUND 21
Oversight of operational risks needs to be enhanced. Currently, the operational risks are governed by CBR recommendations. These recommendations should be converted into a comprehensive and mandatory general operational risk management framework.
C. Financial Markets
47. After completing a two-year process of assuming the powers and functions of the mega-regulator, CBR has been focusing on implementing the related standards. This includes the adoption of the International Organization of Security Commissions (IOSCO) international standards and the corresponding changes in the Russian markets and legal system. In addition to its new supervisory functions covering financial markets and professional market participants, CBR is also pursuing a developmental role for nonbank financial markets with an emphasis on developing regulation and optimizing the regulatory burden on market participants.
48. The effective implementation of the most recent legislative and regulatory changes in financial market oversight is yet to be tested. The recently adopted new legislation has strengthened considerably CBR’s ability to effectively regulate the financial markets closer to international standards. However, evidence of the effective implementation of the recent measures was not yet available at the time of the assessment. Some of the recent regulatory changes (e.g., on rating agencies) are based on international standards. In other areas, further action is required: identification of conflicts of interest; protection of client interests; auditor independence; management of professional market participants; and enabling supervisors to provide guidance on risk management, internal control systems, and on the checks and balances within licensees. Similar action is necessary regarding the issuer’s prospectus and continuous disclosure regimes for listed companies. These steps could make a significant contribution to increasing the investor base.
49. CBR has a comprehensive set of enforcement powers to move to a more risk-based approach to supervision and enforcement. All market intermediaries must be licensed and are subject to an evaluation by CBR, but the criteria need to be enhanced and the capital requirements need to be tailored to risk. In performing its functions, CBR has full powers to collect information, require periodic reports, conduct inspections, and apply sanctions on the regulated and supervised entities. However, in its enforcement activity it relies on checking compliance with many detailed rules. A qualitative approach to enhancing risk management of market participants is likely to prove more effective, given recent international experience. In the light of broader principle-based statutory requirements, CBR would need to develop and mandate a fully risk-based, proactive regime that involves qualitative judgments about risk management, internal control, customer care, and other high-level requirements.
D. Insurance
50. Insurance supervision needs to gradually shift from a rules-based to a transparent risk-based approach, while staff skills and information systems should be strengthened. CBR requires market participants to submit actuarial assessments of reserves as part of their regular reporting. However, such estimates play no role in determining companies’ legal compliance with the insurance solvency requirement, and the current rules-based approach may materially

RUSSIAN FEDERATION
22 INTERNATIONAL MONETARY FUND
underestimate the solvency of the sector. CBR should introduce an actuarially backed solvency standard and establish the core role of actuaries. There is also room to increase the technical capabilities and professional qualifications of staff, who will need modern fully integrated management information systems.
E. Financial Market Infrastructures and Payments
51. Given the systemic importance and interconnectedness of the FMIs, a holistic approach to their oversight is needed. CBR could establish a standing coordination committee of the relevant departments to oversee the payment system, the depositary, repository institutions, and the NCC. The committee would be chaired by a member of the top management of CBR. Key priorities include: (i) a refined business continuity plan for NSD (a systemically important infrastructure) to enable it to complete settlement by the end of the day in all scenarios; (ii) introduction of intraday variation margin calls by NCC with respect to all market segments and irrespective of the settlement cycles; (iii) stronger CBR regulations on protecting client funds collected by e-money operators; (iv) interoperability of all payment systems in the country; (v) reduction of CBR’s residual credit risk by developing its ability to call for additional collateral on the day of liquidation; and (vi) consolidation of all relevant legislation and alignment with the international Principles for Financial Market Infrastructures.
F. Anti-Money Laundering and Combating the Financing of Terrorism
52. Important steps have been taken in recent years to strengthen the legal and regulatory frameworks and AML/CFT supervision. Amendments to the AML/CFT requirements have addressed gaps related to the identification of beneficial owners and politically exposed persons (PEPs). Improved institutional capacity (including Rosfinmonitoring’s operational and strategic analysis and CBR’s AML/CFT supervision and sanctioning of banks) contributed to enhancing the effectiveness of the AML/CFT regime.
53. Even so, further enhancements to the effectiveness of the framework are needed. The CBR needs to improve its understanding of banks’ ML/TF risks and bolster further its risk-based supervisory tools to conduct targeted inspections. In order to prevent the misuse of legal persons created in Russia for ML/TF purposes, related beneficial ownership information should be made available and regularly updated, and its accuracy improved. In this respect, the draft law requiring legal entities to disclose beneficial ownership information is a positive step, and effective implementation will be essential. The remaining deficiencies in the definition of PEPs, the weak implementation of PEP measures by banks, and the low number of related suspicious transaction reports (STRs) increase the likelihood of the laundering of proceeds of corruption. Further guidance can assist banks with the identification and verification of their customers’ beneficial owners, including those held by complex structures and PEPs. Timely feedback from Rosfinmonitoring to banks will also improve the quality and timeliness of STRs. Finally, the authorities have room to improve their overall understanding of ML/TF risks and bolster the outcomes from the framework by completing the national risk assessment and adopting prioritized policies and activities.
RUSSIAN FEDERATION
INTERNATIONAL MONETARY FUND 23
MACROPRUDENTIAL POLICIES 54. The institutional arrangements for macroprudential policies, and for financial system stability more broadly, appear to be effective. The oversight responsibilities are currently shared between CBR and a high-level inter-agency advisory body, the National Council on Ensuring Financial Stability (FSC).11 Given its role as the single financial regulator and supervisor since 2013 and its financial stability mandate, CBR has become the macroprudential authority.
55. In recent years, CBR has used a number of macroprudential tools to deal with systemic risks. CBR has tightened provisioning requirements and increased capital risk weights to curb excessive growth of unsecured consumer lending, helping to improve banks’ ability to handle credit risk. For mortgage lending, CBR has preemptively adopted differentiated capital risk weights based on loan risk characteristics, with a view to containing risks while supporting the extension of mortgage loans to creditworthy borrowers. More recently, in an attempt to reduce dollarization, CBR has imposed a stricter reserve requirement on banks’ non-retail foreign-currency deposits and higher capital risk weights on certain foreign currency exposures.
56. An expanded use of macroprudential tools could help safeguard financial stability in the medium term. The economy is highly exposed to swings in oil prices, and this calls for additional analysis of the relevant macrofinancial linkages, along with the consideration of larger macroprudential solvency and liquidity buffers, taking account of potential policy leakages. Macroprudential tools could support dedollarization, but their use should be motivated primarily by systemic risk mitigation.
57. The CBR Law should be amended to provide for a more comprehensive set of macroprudential tools. The current law does not envisage the full set of recognized macroprudential tools, such as limits on loan-to-value and debt service-to-income ratios. The law should thus be amended to provide an adequate legal foundation for the development and use of the full range of macroprudential tools on an ex-ante basis.
58. CBR has the necessary technical capacity for systemic risk monitoring and assessment, but additional work would be desirable. In particular, it would be useful to (i) conduct an early warning exercise to detect vulnerabilities; (ii) carry out macroprudential stress testing that accounts for second-round effects, solvency-liquidity links, and cross-sectional linkages; and (iii) focus more on “connecting the dots.” The Financial Stability Review would benefit from a clearer presentation of systemic risks and vulnerabilities, the propagation of risks through macrofinancial linkages, and the resilience of the banking system to shocks.
11 The FSC is currently chaired by First Deputy Prime Minister and comprises eleven other senior officials, including the CBR Governor, Minister of Finance, Minister of Economic Development, and DIA General Director.

RUSSIAN FEDERATION
24 INTERNATIONAL MONETARY FUND
CRISIS MANAGEMENT AND RESOLUTION A. Lender-of-Last-Resort
59. CBR’s framework for systemic liquidity provision has proven effective, and consideration could be given to formalizing and strengthening it. Key principles include the following: (i) introducing a discretionary framework to provide temporary direct liquidity support to solvent and viable institutions based on adequate collateral and at a spread to market rates; (ii) establishing that all non-monetary policy related lending would fall under this discretionary framework; and (iii) providing government indemnities to CBR when it has concerns about the entity, collateral, length, size of support, or exit strategy.
60. Several key operational elements need to be introduced to enhance the ability of CBR to anticipate, assess, and monitor liquidity needs. These include: (i) an appropriate governance and stakeholder coordination framework to ensure a cohesive and timely response; (ii) “horizon scanning” so that these exceptional liquidity needs can be anticipated to the extent possible; (iii) an improved understanding of the underlying need for liquidity along with ex-post monitoring by CBR so that moral hazard is minimized; and (iv) an appropriate disclosure and communication strategy agreed among all relevant stakeholders.
B. Bank Resolution
61. CBR is the resolution authority responsible for determining entry into resolution and the resolution method to be used. Under the current resolution framework, other than liquidating a failed bank, CBR can conduct an open bank resolution or a purchase and assumption (P&A) transaction with DIA participation in systemic cases. In open bank resolution, CBR may apply regulatory forbearance to the rescued bank. DIA is responsible for the operational aspects of bank resolution and may agree with or deny CBR’s proposal for its participation, based on the principles of fairness and reasonableness, the bank’s financial position, or the impact on its financial position. DIA may provide financing, either through the Deposit Insurance Fund (DIF) or on its own account, with funding by CBR loans or the government. Non-systemic banks are liquidated and DIA conducts insured deposit payouts.
62. The authorities have resolved many banks in an orderly manner, mostly by open bank resolution or liquidation. Since January 2014, 28 banks were put into open bank resolution using public funds amounting to 1.1 percent of GDP. In addition, over the same period, CBR has revoked licenses of 214 banks, resulting in deposit insurance payouts amounting to 0.8 percent of GDP. P&A transactions have only been used in three cases.
63. The effectiveness of bank resolution could be improved. First, many banks entering resolution are deeply insolvent, with a large deficit to be covered by public funds, partly reflecting frequent misreporting of financial information. Early intervention based on strong supervision would

RUSSIAN FEDERATION
INTERNATIONAL MONETARY FUND 25
help to address this problem (see above on banking oversight). Second, for failed banks that are not liquidated, the authorities’ have preferred to save the entire bank, rather than ensuring the continuity of its critical functions through P&A transactions. Adopting the full range of resolution powers recommended by the FSB Key Attributes would help reduce the reliance on open bank resolution and minimize the use of public funds. Third, an improved resolution framework with better incentives could also be applied to larger banks, although it is unlikely to fully address the issues involved in tackling weaknesses in the largest, systemically important banks.
64. Wider and more effective use of P&A transactions requires legal and operational changes. First, the mandatory DIF may not be used to fund the negative balance between the transferred assets and the liabilities subject to a least cost test. This has been a critical constraint in many resolution cases. A draft bill is being considered to provide for such funding powers. Second, the authorities do not have sufficient flexibility and are generally required to transfer all liabilities in the same priority class. The authorities should have the power to determine the scope of liabilities to transfer subject to the principle that no creditor is worse off than in liquidation. Third, assets can only be transferred at face value, reducing the scope of assets that are attractive to investors. A fair value approach could increase the number of feasible P&A transactions. Fourth, overvaluation of assets and the many instances of fraud related to bank failures make it difficult for the authorities to sufficiently prepare for a P&A transaction prior to entering into resolution. In this context, the use of a bridge bank to temporarily transfer assets and liabilities would provide the breathing space needed to find an ultimate acquirer of the bank’s assets.
65. An expanded range of resolution powers is also needed more generally. First, CBR’s power to take control of a bank in resolution should be strengthened. CBR or a provisional administrator it appoints should have broad powers to take over all decision-making bodies of the ailing bank and to override shareholder rights, including requirements for approval of particular transactions, forced recognition of losses, and limitation of preemption rights. Currently, such broad powers are only provided to a provisional administrator appointed when bankruptcy prevention measures are taken with DIA participation. Second, the authorities’ plan to introduce statutory bail-in powers could be useful in raising the necessary capital for recapitalization, particularly for large and complex banks.12 The specifics of the framework need to be carefully considered, paying due regard to the consistency with the creditor hierarchy in liquidation and the financial condition of the banking sector. The authorities should also consider introducing the power to establish bridge banks (see above) and asset management companies; to temporarily stay early termination rights; and to require group entities to provide continuity of services.
66. There is a case for stronger shareholder and creditor safeguards in resolution. All creditors should be compensated if they do not receive at a minimum what they would have received in liquidation. While respecting the hierarchy of creditor claims in liquidation, the legal framework should permit departure from pari passu treatment of creditors in clearly specified circumstances.
12 A bill is being drafted to provide CBR with the power to conduct a statutory bail-in.

RUSSIAN FEDERATION
26 INTERNATIONAL MONETARY FUND
67. It would be desirable to discontinue CBR financing of the DIA for resolution. Financing that does not meet the requirements of the central bank’s lender-of-last-resort function (see above) should in principle be provided by the federal government. In the medium term, arrangements also need to be made to recover public outlays from the financial industry.
68. Subsidized loans for solvency support may not be the most efficient way of managing the failure of large systemic banks. Funding mostly takes the form of DIA long-term collateralized loans at below-market rates. 13 Over the maturity of the loan, the interest rate difference vis-à-vis market funding provides a subsidy to cover the negative balance of the failed bank and to improve its capital base. This funding arrangement makes bank resolution a lengthy process, during which DIA conducts intensive monitoring and CBR can grant regulatory forbearance.14 As the loan is collateralized, the resolved bank’s assets are heavily encumbered. This reduces the bank’s access to market funding and constrains its ability to restructure its balance sheet.15 Asset injections rather than subsidized loans are thus likely to be more efficient in many cases in which solvency support is deemed necessary to ensure orderly resolution.
69. If the proposed changes to DIA financing are adopted, decision-making for resolution measures involving public funds would require the approval of the MoF. Currently, resolution measures involving the use of CBR loans are decided by the CBR Board, with the DIA having veto power. If CBR loans are no longer provided, resolution measures involving the temporary use of public funds would need to be approved by the MoF. All other resolution measures taken within the least cost test or out of systemic necessity, without resorting to public funds, would be decided by CBR in consultation with the DIA.
70. Changes to deposit insurance coverage and depositor preference could also be helpful. The authorities are considering expanding the scope of deposit insurance coverage to certain corporate entities. This could facilitate the payout process and help protect small corporate depositors. The introduction of a two-tiered depositor preference rule—which puts insured deposits ahead of uninsured deposits in liquidation, and both of these ahead of other senior unsecured creditors— could also reduce costs to the mandatory deposit insurance fund.
71. Legal protection of resolution authorities and their staff needs to be strengthened. Resolution authorities and their staff and agents (such as bankruptcy receivers and liquidators) should be protected by law against liability for actions taken and omissions made while exercising their professional judgment in discharging their duties in good faith. Furthermore, the law should not constrain the implementation of, or result in a reversal of, measures taken by the resolution
13 Loans are typically provided for 10 years at 0.5 percent interest (compared to market rate of 10–11 percent). 14 CBR earmarked funding of DIA’s resolution activities also creates a conflict of interest for CBR in supervising banks undergoing open bank resolution. 15 This constraint would be magnified in a low interest rate environment, which is likely to achieve when the CBR inflation target is met.

RUSSIAN FEDERATION
INTERNATIONAL MONETARY FUND 27
authorities acting within their legal powers and in good faith. Instead, the law should provide for redress through monetary compensation, if justified.
BANKING SECTOR DEVELOPMENT PRIORITIES A. Structure and Governance
72. The structure and governance of the banking system will need to continue to evolve to improve efficiency and stability. The current structure of the system, in which large banks (and in particular majority state-owned banks) play a dominant role, may reduce competition and the efficiency of financial intermediation, and may involve fiscal costs if problems occur in major SOBs. The authorities’ overall approach does not envisage rapid changes to the existing structure, as these could be disruptive, but rather a combination of measures, to be implemented over time. These include further gradual privatization, increased competition, and the closure of weak banks (as discussed above, along with enhancements to the resolution framework). Reforms to the ownership structure of SOBs may also help to improve bank governance.
73. Further gradual privatization is desirable as economic conditions permit. Privatization should wait until the economy recovers from the current deep recession, all the more so as majority state ownership, notably in Sberbank, has provided safe-harbor benefits during periods of turbulence. Successful privatization will also depend on securing anchor investors, which will depend to some extent on developments in sanctions.
74. A less concentrated distribution of bank assets would help to enhance competition and efficiency. The ongoing development by VTB Group of the postal banking network may provide a large-scale alternative to Sberbank in the market for small deposits and other retail financial services. Increased financial inclusion (see below) could also support a gradual gain in the market share of private banks.
75. The ownership of SOBs remains dispersed and complex and may be an obstacle to the spread of good corporate governance practices. Sberbank comes under the CBR; VTB Bank and RAB under the Federal Agency for Property Management (FAPM); and several smaller state banks under various administrative regions. Ownership relations are complex, with many SOBs and SOEs having subsidiaries in the banking sector. At present, only a few SOBs, such as Sberbank and VTB Bank, have solid corporate governance practices, such as board committees, independent directors, a strong control environment, and adequate disclosure. Reassigning ownership, along with a new legal and regulatory framework, could help to increase board effectiveness by reducing the share of government officials, and thus help to align decision-making more closely with commercial objectives. The financial soundness of SOBs would also be enhanced by obliging the government to cover the cost of any subsidized activities in its annual budget, and by ensuring that lending rates are not lower than the cost of funding.
76. The role of CBR as both the major shareholder and the regulator of Sberbank is an unusual feature of the system. This arrangement appears to have worked reasonably well in

RUSSIAN FEDERATION
28 INTERNATIONAL MONETARY FUND
practice, owing to a strong and professional management team at Sberbank and to CBR’s careful balancing of its dual roles. However, in principle, the conflict of interest inherent in this institutional setup may prove to be an obstacle to the longer-run transition to a more market-oriented and competitive banking system.
B. Financial Inclusion
77. Financial inclusion varies significantly and a national strategy is needed. Account penetration stands at 67.4 percent of adults, higher than the regional average but somewhat below high-income non-Organization for Economic Cooperation and Development (OECD) countries. However, there are large variations between urban and rural areas and across income and age groups. Account usage is often limited, and there is a lack of appropriate savings products for the underserved. CBR is currently leading the effort to develop a comprehensive financial inclusion strategy, which will require the endorsement of a range of public and private stakeholders to be successful, including those that can facilitate increased use of modern electronic financial services.

RUSSIAN FEDERATION
INTERNATIONAL MONETARY FUND 29
Figure 1. Recent Economic Developments
Source: Authorities and IMF staff estimates.
2227323742475257626772778220
30405060708090
100110120130
Dec
-13
Feb-
14
Apr-
14
Jun-
14
Aug-
14
Oct
-14
Dec
-14
Feb-
15
Apr-
15
Jun-
15
Aug-
15
Oct
-15
Dec
-15
Feb-
16
Apr-
16
Jun-
16
Exchange Rate and Oil Price
Brent, USD/b
Russian ruble per USD, rhs
468
1012141618202224262830
Dec
-13
Feb-
14
Apr-
14
Jun-
14
Aug-
14
Oct
-14
Dec
-14
Feb-
15
Apr-
15
Jun-
15
Aug-
15
Oct
-15
Dec
-15
Feb-
16
Apr-
16
Jun-
16
Policy and Interbank Rates (In percent)
Interbank rateO/N lending rateREPO rateO/N deposit rate
330
360
390
420
450
480
510
-10123456789
10111213
Dec
-13
Feb-
14
Apr-
14
Jun-
14
Aug-
14
Oct
-14
Dec
-14
Feb-
15
Apr-
15
Jun-
15
Aug-
15
Oct
-15
Dec
-15
Feb-
16
Apr-
16
Jun-
16
CBR Interventions
Reserves, rhs
International Reserves and CBR Net Interventions(In billions of U.S. dollars)
-20
-15
-10
-5
0
5
10
15
20
2006Q1 2008Q3 2011Q1 2013Q3 2016Q1
Current Account(In percent of GDP)
Investment and labor incomeServices balanceTrade balanceCA balance
-5
-4
-3
-2
-1
0
1
2
3
2013
Q1
2013
Q2
2013
Q3
2013
Q4
2014
Q1
2014
Q2
2014
Q3
2014
Q4
2015
Q1
2015
Q2
2015
Q3
2015
Q4
Real GDP(In percent)
y/yq/q SA
85
90
95
100
105
110
115
1 2 3 4 5 6 7 8 9 10 11 12 13 14
Patterns of Past Recessions (Index=100 at start of the recession)
4Q1997
2Q2008
2Q2014

RUSSIAN FEDERATION
30 INTERNATIONAL MONETARY FUND
Figure 2. Corporate Sector Developments, 2006–16 Corporate profitability, in particular in the oil and gas sector, has increased…
…supported by a cost structure primarily in rubles and a low breakeven oil price...
…and by a decline in the ruble. However, the share of companies facing difficulty servicing their debt has increased…
… while smaller companies show weaker financial soundness with lower profitability…
… and higher leverage.
Sources: Authorities and IMF staff estimates.
0
50
100
150
200
250
300
Mar
-06
Sep-
06M
ar-0
7Se
p-07
Mar
-08
Sep-
08M
ar-0
9Se
p-09
Mar
-10
Sep-
10M
ar-1
1Se
p-11
Mar
-12
Sep-
12M
ar-1
3Se
p-13
Mar
-14
Sep-
14M
ar-1
5Se
p-15
Mar
-16
Corporate Profits (1-year moving average, in billions of Russian rubles)
Mining and QuarryingManufacturingWholesale & Retail TradeTransport and ComOther
9
10
11
12
13
17
24
36
41
48
0 10 20 30 40 50 60
Kuwait
Saudi Arabia
Iraq
UAE
Iran
Russia
Venezuela
USA
Canada
Brazil
Break-Even Oil Production Cost(In U.S. dollars per barrel)
20
40
60
80
100
120
140
160
800
1400
2000
2600
3200
3800
4400
Dec
-07
May
-09
Sep-
10
Feb-
12
Jun-
13
Nov
-14
Mar
-16
Price of a Barrel of Oil
Rub value
USD value, rhs
0
5
10
15
20
25
30
35
2006 2008 2010 2012 2014 2014Q1 2015Q2
Companies in Financial Distress and With Negative Equity, 2006−15
Debt of companies under financial distress (in percent of total debt)Debt of companies with negative equity (in percent of total debt)Share of companies under financial distress (in percent)Share of companies with negative equity (in percent)
Large companies
Large companies, with quarterly data
0
1
2
3
4
5
6
7
8
9
10
2006 2008 2010 2012 2014 2014Q1 2015Q2
Nearly all companies
Large companies
Large companies, with quarterly data
Profitability: Return on Assets(In percent)
40
45
50
55
60
65
2006 2008 2010 2012 2014 2014Q1 2015Q2
Nearly all companies
Large companies
Corporate Leverage: Equity to Assets(In percent)

RUSSIAN FEDERATION
INTERNATIONAL MONETARY FUND 31
Figure 3. Banking System Structure
The financial system is slightly less deep than in comparator countries...
… and intermediation is lower...
…the banking system is highly concentrated at the top and fragmented at the bottom...
… while state-owned banks dominate.
Household deposits show a moderately concentrated system…
… in the context of somewhat lower efficiency.
Source: Authorities and IMF staff estimates.
0
10
20
30
40
50
60
70
80
Private-Sector Credit
Pension Fund Assets
Mutual Fund Assets
Insurance Premiums
Indicators of Financial Depth(In percent of GDP, 2013)
BTICS
Emerging Markets
Russia
0
20
40
60
80
100
120
140
160
180
Russia Brazil Turkey India South Africa
China
Domestic Credit by Banking Sector(In percent of GDP, end-2014)
55
60
65
70
75
80
85
700
800
900
1000
1100
1200
1300
2007 2008 2009 2010 2011 2012 2013 2014 2015
Banking System Concentration
Number of banks
Top-20 banks, % of sector assets, rhs
Sberbank, 33
VTB Group, 17
Gazprombank, 7
Otkirtie Group, 6
Russian Agricultural
Bank, 4
Alfa-Bank Group, 3
Soc Gen Group, 2
Unicredit Bank, 2
Promsvyazbank, 2
Raiffeisen Bank, 1
Others, 24
Loan Market Share of Top 10 Banks(In percent, 2015)
Assets Capital Credit to NFC Household deposits
0.00
0.05
0.10
0.15
0.20
0.25
0.30Herfindahl-Hirschman Concentration Index
2011 2012 2013 2014
Area indicating moderate concentration
0102030405060708090
100
Net Interest Margin
Lending-Deposits Spread
Non-Interest
Income to Total
Income
Return on Assets
Return on Equity
Indicators of Efficiency(In percent, 2013)
BTICSEmerging MarketsRussia

RUSSIAN FEDERATION
32 INTERNATIONAL MONETARY FUND
Figure 4. Bank Assets and Liabilities, 2008–15
Asset growth remains positive… …although ruble credit growth is slowing, in particular inthe consumer segment.
Loans are the bulk of banks’ assets. Half of FX lending is to resident corporates.
Banks rely for their funding mainly on deposits from individuals and non-financial corporations…
…and the share of short-term funding reached 50 percent at end-2015.
Sources: Authorities and IMF staff estimates.
-20
0
20
40
60
80
100
120
140
2005 2006 2007 2008 2009 2010 2011 2012 2013 2014 2015
Total Assets Growth(In percent, yoy)
Bottom 25%
median
Top 25%
-20
-10
0
10
20
30
40
50
60
Apr-
09
Jan-
10
Oct
-10
Jul-1
1
Apr-
12
Jan-
13
Oct
-13
Jul-1
4
Apr-
15
Loans to corporatesMortgage loansConsumer loans
Credit Growth (Ruble Denominated)(In percent, yoy)
0
10,000
20,000
30,000
40,000
50,000
60,000
70,000
80,000
90,000
Jan-14 Apr-14 Jul-14 Oct-14 Jan-15 Apr-15 Jul-15 Oct-15
Total Assets of the Russian Banking Sector (In billions of Russian rubles)
LoansSecuritiesOther assets
48%
19%
10%
21%
2%
Corporate loans (residents)Corporate loans (non-residents)Loans to financial firms (residents)Loans to financial firms (non-residents)Loans to individuals
Composition of Loan Portfolio in Foreign Exchange(In percent of total)
0
2
4
6
8
10
12
14
0
5
10
15
20
25
30
35
40
45
Apr-
08
Jan-
09
Oct
-09
Jul-1
0
Apr-
11
Jan-
12
Oct
-12
Jul-1
3
Apr-
14
Jan-
15
Oct
-15
Bank Funding Sources(In percent of total)
Equity Funds from credit institutionsDeposits from NFCs Individual depositsOther Clients' funds Funds from CBR, rhs
0
20
40
60
80
100
Oct-13 Oct-14 Oct-15
Short- vs Long-Term Funding(In percent)
Long term fundingShort term funding

RUSSIAN FEDERATION
INTERNATIONAL MONETARY FUND 33
Figure 5. Bank Capital and Liquidity, 2008–15
Capital ratios remained stable due to capital injection … … and the use of regulatory forbearance to shield risk weighted assets from the impact of the depreciation.
Liquidity dried up following a strong outflow of retail deposits in December 2014…
…which was compensated by CBR stepping in to support liquidity of the banking system.
Since then, confidence has returned and the liquidity situation has improved…
…amid declining loan-to-deposit ratios.
Sources: Authorities and IMF staff estimates
0
5
10
15
20
25
Jan-11 Apr-12 Jul-13 Oct-14 Feb-16
Capital Adequacy(In percent)
Capital to risk-weighted assets
Core capital to risk-weighted assets
CAR Min. Req.
Core Capital Min. Req.
8
9
10
11
12
13
14
15
Apr-08 Jul-09 Oct-10 Jan-12 Apr-13 Jul-14 Oct-15
Equity to Total Assets of Russian Banks (In percent)
-6
-4
-2
0
2
4
6
Jan-08 Aug-09 Mar-11 Oct-12 May-14 Jan-16
Retail Deposits (Percent change, M-o-m, SA)
0
2
4
6
8
10
12
14
16
50
52
54
56
58
60
62
64
66
68
Apr-08 Jul-09 Oct-10 Jan-12 Apr-13 Jul-14 Oct-15
Main Funding Sources (In percent of total liabilities)
Saving accountsFunds received from CBR, rhs
15
20
25
30
Jan-11 Apr-12 Jul-13 Oct-14 Feb-16
Liquidity Assets to Total Assets(In percent)
80
100
120
140
160
180
200
Feb-07 Nov-08 Sep-10 Jul-12 Apr-14 Feb-16
Loan-to-Deposit Ratio (In percent)
Total
Ruble
FX

RUSSIAN FEDERATION
34 INTERNATIONAL MONETARY FUND
Figure 6. Bank Profitability, 2005–15
Bank profitability is has declined sharply since 2010 … …reflecting lower net interest margins and higher provisions…
Net interest income has declined… …as have net fees and commissions.
Cost reductions have provided some offset. Loan impairment charges have not reached 2009 levels.
Sources: Authorities and IMF staff estimates.
-8
-6
-4
-2
0
2
4
6
8
2005
2006
2007
2008
2009
2010
2011
2012
2013
2014
2015
Net Income (In percent of total equity)
Bottom 25%
median
Top 25%
-0.6
-0.4
-0.2
0.0
0.2
0.4
0.6
-2.5-2
-1.5-1
-0.50
0.51
1.52
2.5
2005
2006
2007
2008
2009
2010
2011
2012
2013
2014
2015
Contributions to Net Income(In percent of total assets, median)
Provisions Other Comp. IncNet Fees and Comm. Non-interest ExpenseTrading Income Net Interest Inc.Net Income, rhs
0
0.5
1
1.5
2
2.5
3
3.5
4
4.5
2005
2006
2007
2008
2009
2010
2011
2012
2013
2014
2015
Net Interest Income(In percent of gross loans)
Bottom 25%medianTop 25%
0
0.1
0.2
0.3
0.4
0.5
0.6
0.7
0.8
2005
2006
2007
2008
2009
2010
2011
2012
2013
2014
2015
Net Fees and Commissions (In percent of total assets)
Bottom 25%medianTop 25%
0
0.5
1
1.5
2
2.5
3
2005
2006
2007
2008
2009
2010
2011
2012
2013
2014
2015
Non-Interest Expenses(In percent of total assets)
Bottom 25%medianTop 25%
0
0.5
1
1.5
2
2.5
2005
2006
2007
2008
2009
2010
2011
2012
2013
2014
2015
Loan Impairment Charge(In percent of gross loans)
Bottom 25%medianTop 25%

RUSSIAN FEDERATION
INTERNATIONAL MONETARY FUND 35
Figure 7. Bank Performance by Asset Size, 2014–15 Banks in the 21–50 segment remain the weakest performers…
…with two years of negative profits. Profits of the system are positive thanks to the top 1–5 banks...
…helping this segment keep stable capital adequacy ratios. The top 20 banks benefited from capital support program in the third quarter…
…and the top 20 banks saw more retail deposit inflows in the fourth quarter than other segments…
…while retail loans continue to decline, most prominently in the 21–50 segment.
Sources: Authorities and IMF staff estimates.
-30
-20
-10
0
10
20
30
1-5 6-20 21-50 51-200 201-500 501-Max
Return on Equity
2014Q2 2014Q3 2014Q4 2015Q1
2015Q2 2015Q3 2015Q4
-200
-100
0
100
200
300
400
500
1-5 6-20 21-50 51-200 201-500 501-Max
Profit for the Current Year(In billions of Russian rubles)
2014Q2 2014Q3 2014Q4
2015Q1 2015Q2 2015Q3
2015Q4
0
5
10
15
20
25
30
35
40
1-5 6-20 21-50 51-200 201-500 501-Max
Capital Adequacy Ratio
2014Q2
2014Q3
2014Q4
2015Q1
2015Q2
2015Q3
2015Q4
0
0.5
1
1.5
2
2.5
3
3.5
4
4.5
5
1-5 6-20 21-50 51-200 201-500 501-Max
Equity Capital(In trillions of Russian rubles)
2014Q2
2014Q3
2014Q4
2015Q1
2015Q2
2015Q3
2015Q4
0
10
20
30
40
50
60
1-5 6-20 21-50 51-200 201-500 501-Max
Individual Deposits(In percent of total)
2014Q2
2014Q3
2014Q4
2015Q1
2015Q2
2015Q3
2015Q4
0
10
20
30
40
50
60
1-5 6-20 21-50 51-200 201-500 501-Max
Loans to Non-Financial Institutions(In percent of total assets)
2014Q2 2014Q32014Q4 2015Q12015Q2 2015Q32015Q4

RUSSIAN FEDERATION
36 INTERNATIONAL MONETARY FUND
Figure 8. Bank Asset Quality, 2008–15
NPLs remain lower than their 2008 peak… …although provisions are higher once FX loans, loans to FIs, and governmental institutions are excluded.
Overdue loans in rubles have increased primarily in the construction and retail trade sectors…
…while overdue loans in FX have risen primarily in the real estate, agriculture, and mining sectors.
Nearly 25 percent of the construction portfolio is overdue… …while loans in FX show weak performance in agriculture, mining, and machinery and equipment.
Source: Authorities and IMF staff estimates.
0
1
2
3
4
5
6
7
8
9
10
Jan-08 Aug-09 Mar-11 Nov-12 Jun-14 Feb-16
Overdue Loans and NPLs(In percent of total loans)
Households
Corporate
NPLs
0
2
4
6
8
10
12
14
16
18
20
Apr-09 Apr-10 Apr-11 Apr-12 Apr-13 Apr-14 Apr-15
Loans to corporatesMortgage loansConsumer loans
Provisions (In Russian ruble denominated loans; in percent of total loans)
0
1
2
3
4
5
6
7
8
9
10
Mar
-09
Dec
-09
Sep-
10
Jun-
11
Mar
-12
Dec
-12
Sep-
13
Jun-
14
Mar
-15
Dec
-15
Other Real estate Transport and communications Agriculture, hunting and forestryElectricity, gas and water ManufacturingMining and quarrying Wholesale and retail tradeConstruction
Ruble Overdue Loans to Total Loans by Sector
0
1
2
3
4
5
6M
ar-0
9
Dec
-09
Sep-
10
Jun-
11
Mar
-12
Dec
-12
Sep-
13
Jun-
14
Mar
-15
Dec
-15
OtherWholesale and retail tradeTransport and communicationsConstructionElectricity, gas and waterManufacturingAgriculture, hunting and forestryMining and quarryingReal estate
Foreign Exchange Overdue Loans to Total Loans(In percent, by sector)
0
5
10
15
20
25
30
Mar
-09
Dec
-09
Sep-
10
Jun-
11
Mar
-12
Dec
-12
Sep-
13
Jun-
14
Mar
-15
Dec
-15
Ruble Overdue Loans by Portfolio(In percent)
Wood productsPaper productsConstructionAverage
0
5
10
15
20
25
30
Mar
-09
Dec
-09
Sep-
10
Jun-
11
Mar
-12
Dec
-12
Sep-
13
Jun-
14
Mar
-15
Dec
-15
Mineral products
Machinery and equipment
Agriculture, hunting and forestry
Average
Foreign Exchange Overdue Loans by Portfolio(In percent)
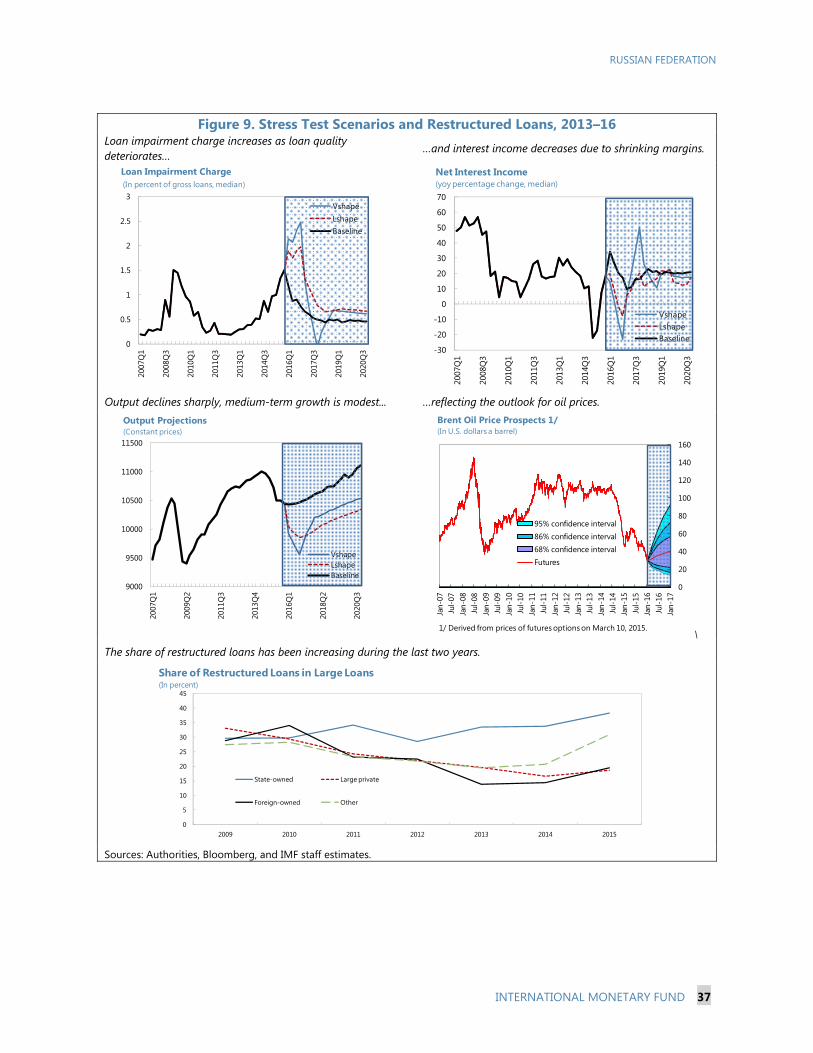
RUSSIAN FEDERATION
INTERNATIONAL MONETARY FUND 37
Figure 9. Stress Test Scenarios and Restructured Loans, 2013–16 Loan impairment charge increases as loan quality deteriorates…
…and interest income decreases due to shrinking margins.
Output declines sharply, medium-term growth is modest... …reflecting the outlook for oil prices.
\
The share of restructured loans has been increasing during the last two years.
Sources: Authorities, Bloomberg, and IMF staff estimates.
0
0.5
1
1.5
2
2.5
3
2007
Q1
2008
Q3
2010
Q1
2011
Q3
2013
Q1
2014
Q3
2016
Q1
2017
Q3
2019
Q1
2020
Q3
Loan Impairment Charge(In percent of gross loans, median)
VshapeLshapeBaseline
-30
-20
-10
0
10
20
30
40
50
60
70
2007
Q1
2008
Q3
2010
Q1
2011
Q3
2013
Q1
2014
Q3
2016
Q1
2017
Q3
2019
Q1
2020
Q3
Net Interest Income (yoy percentage change, median)
VshapeLshapeBaseline
9000
9500
10000
10500
11000
11500
2007
Q1
2009
Q2
2011
Q3
2013
Q4
2016
Q1
2018
Q2
2020
Q3
Output Projections (Constant prices)
VshapeLshapeBaseline
0
20
40
60
80
100
120
140
160Ja
n-07
Jul-0
7Ja
n-08
Jul-0
8Ja
n-09
Jul-0
9Ja
n-10
Jul-1
0Ja
n-11
Jul-1
1Ja
n-12
Jul-1
2Ja
n-13
Jul-1
3Ja
n-14
Jul-1
4Ja
n-15
Jul-1
5Ja
n-16
Jul-1
6Ja
n-17
Brent Oil Price Prospects 1/ (In U.S. dollars a barrel)
95% confidence interval86% confidence interval68% confidence intervalFutures
1/ Derived from prices of futures options on March 10, 2015.
0
5
10
15
20
25
30
35
40
45
2009 2010 2011 2012 2013 2014 2015
Share of Restructured Loans in Large Loans (In percent)
State-owned Large private
Foreign-owned Other

RUSSIAN FEDERATION
38 INTERNATIONAL MONETARY FUND
Figure 10. Stress Test Results (V-Shaped Scenario)
Credit losses peak in the first two years. Capital deficits increases are similar in CBR’s and staff’s stress tests.
Average capital ratios (CBR) bottom out in 2017 and recover by 2020.
Median capital ratios (staff) breach total capital ratio threshold (CAR Threshold) in 2017, and recover slightly above by 2020.
Total capital deficit (staff) is about 2½ percent of GDP(CBR and staff), with additional capital charge of about 2 percent of GDP due to asset quality adjustments.
When adjusting for forbearance, median capital ratios (staff) are more affected.
Sources: Authorities and IMF staff estimates.
0
500
1,000
1,500
2,000
2,500
3,000
3,500
4,000
4,500
2016 2017 2018 2019 2020
Credit Losses (In billions of Russian rubles)
Staff estimates
CBR
0
100
200
300
400
500
600
700
800
900
1,000
2016 2017 2018 2019 2020
Capital Deficit Increase(In billions of Russian rubles)
Staff estimates
CBR
0
2
4
6
8
10
12
14
16
2016 2017 2018 2019 2020
Capital Ratios (CBR, weigthed average, percent)
CET1CARCET1 ThresholdCAR Threshold
0
2
4
6
8
10
12
14
16
2015 2016 2017 2018 2019 2020
CET1CARCET1 ThresholdCAR Threshold
Capital Ratios—Without Asset Quality Adjustments(Staff estimates, median, percent)
2.5 2.4
0.4
1.5
0.4
1.1
0.7
R
P
RW
0.0
0.5
1.0
1.5
2.0
2.5
3.0
RW=90%R=0.9% P=2.2%
RW=100%R&P=3.3%RW=100%
CBR* Staff estimates*
Total Capital Deficit (In percent of GDP)
Note: R=Restructuring; P=Provisioning; RW=Risk Weight.*Includes credit, market , interest, and liquidity risk. **Covers about 80% of total banking assets.
0
2
4
6
8
10
12
14
2015 2016 2017 2018 2019 2020
CET1CARCET1 ThresholdCAR Threshold
Capital Ratios—With Asset Quality Adjustments(Staff estimates, median, percent)

RUSSIAN FEDERATION
INTERNATIONAL MONETARY FUND 39
Table 2. Russian Federation: Selected Macroeconomic Indicators, 2013–21
2013 2014 2015 2016 2017 2018 2019 2020 2021
Production and prices
Real GDP 1.3 0.7 -3.7 -1.2 1.0 1.2 1.5 1.5 1.5Real domestic demand 0.9 -0.9 -10.0 -2.7 0.5 0.6 0.9 1.2 1.3Consumption 3.6 1.1 -7.5 -2.6 0.0 0.1 0.5 0.9 1.1Investment -7.3 -8.0 -18.7 -2.8 2.0 2.0 2.0 2.0 2.0
Consumer pricesPeriod average 6.8 7.8 15.5 7.5 5.7 4.6 4.0 4.0 4.0End of period 6.5 11.4 12.9 6.6 5.2 4.0 4.0 4.0 4.0
GDP deflator 4.8 9.0 7.7 7.4 5.5 4.0 4.0 4.0 4.0Unemployment rate 5.5 5.2 5.6 6.5 6.3 5.6 5.5 5.5 5.5
Public sector 1/
General governmentNet lending/borrowing (overall balance) -1.2 -1.1 -3.5 -3.7 -1.6 -1.1 0.0 0.4 0.4Revenue 34.4 34.3 32.8 31.2 32.2 31.7 31.9 31.9 31.9Expenditures 35.6 35.4 36.3 34.9 33.8 32.8 31.9 31.6 31.4
Primary balance -0.6 -0.4 -2.7 -2.7 -0.4 0.2 1.3 1.7 1.7Nonoil balance -11.1 -11.5 -11.7 -10.0 -8.3 -8.0 -6.9 -6.5 -6.3Nonoil primary structural balance -11.3 -10.3 -10.8 -9.2 -8.2 -7.5 -6.3 -5.9 -5.8
Federal governmentNet lending/borrowing (overall balance) -0.5 -0.4 -2.4 -3.2 -1.5 -1.2 -0.3 0.0 0.0Nonoil balance -9.8 -10.1 -9.8 -9.0 -7.5 -7.4 -6.5 -6.2 -6.1
Money
Base money 8.0 6.3 -4.3 4.6 5.4 5.9 6.3 6.4 6.4Ruble broad money 14.6 2.2 11.5 6.8 7.7 8.3 8.6 8.7 8.7Credit to the economy 17.2 22.8 8.9 7.4 8.5 8.9 9.1 9.2 9.2
External sectorExport volumes 1.9 0.1 2.6 1.1 2.3 1.3 3.2 3.4 3.5Oil 2.7 0.1 10.9 -1.3 -1.6 -1.9 0.5 0.5 0.5Gas 9.9 -11.3 13.8 6.0 2.7 -4.9 0.0 0.0 0.0Non-energy 5.8 7.9 -5.5 2.2 6.4 6.6 6.9 7.0 7.0
Import volumes 3.2 -6.9 -28.4 -3.6 2.7 3.5 4.1 4.5 5.8
External sector
Total merchandise exports, f.o.b 523.3 497.8 339.6 299.0 332.2 344.5 366.8 388.1 409.4Total merchandise imports, f.o.b -341.3 -308.0 -194.0 -180.1 -185.9 -193.5 -202.9 -213.3 -227.2External current account 34.1 59.5 65.8 51.3 69.3 81.0 89.1 98.7 104.9External current account (percent of GDP) 1.5 2.9 5.0 4.0 4.9 5.5 5.7 6.0 6.0Gross international reservesBillions of U.S. dollars 509.6 385.5 368.4 373.1 387.8 415.2 450.0 491.9 535.1Months of imports 2/ 13.0 10.8 15.7 17.2 17.3 17.8 18.4 19.1 19.5Percent of short-term debt 251 302 478 257 274 300 319 352 410
Memorandum items:
Nominal GDP (billions of rubles) 71,017 77,945 80,804 85,722 91,376 96,186 101,582 107,213 113,186Nominal GDP (billions of U.S. dollars) 2,231 2,031 1,326 1,270 1,410 1,477 1,569 1,656 1,738Exchange rate (rubles per U.S. dollar, period aver 31.8 38.4 60.9 67.5 64.8 65.1 64.7 64.8 65.1Oil exports (billions of U.S. dollars) 283.0 269.8 156.2 127.8 145.6 148.1 155.7 161.4 166.3World oil price (U.S. dollars per barrel) 104.1 96.2 50.8 42.2 48.8 50.5 52.8 54.6 56.0Urals crude oil spot price (U.S. dollars per barrel) 106.3 94.5 51.0 42.2 48.9 50.7 53.1 55.0 56.4Oil Extraction (millions of tons) 521.7 525.1 525.0 525.0 525.0 525.0 525.0 525.0 525.0Real effective exchange rate (average percent ch 1.8 -8.5 -17.4 -2.3 7.4 2.1 2.3 1.4 1.6
Sources: Russian authorities; and IMF staff estimates.1/ Cash basis.2/ In months of imports of goods and non-factor services.
(Annual percent change)
(Percent of GDP)
(Annual percent change)
(Billions of U.S. dollars; unless otherwise indicated)
Projections
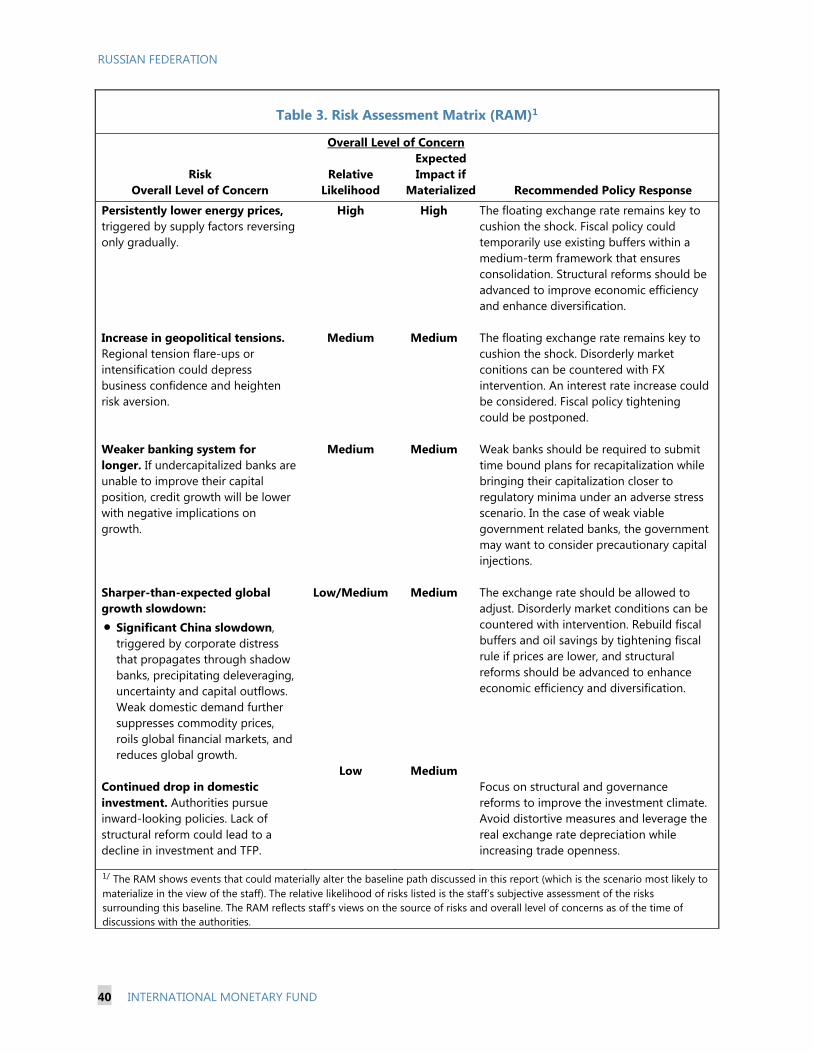
RUSSIAN FEDERATION
40 INTERNATIONAL MONETARY FUND
Table 3. Risk Assessment Matrix (RAM)1
Risk Overall Level of Concern
Overall Level of Concern
Relative Likelihood
Expected Impact if
Materialized
Recommended Policy Response
Persistently lower energy prices, triggered by supply factors reversing only gradually.
High
High
The floating exchange rate remains key to cushion the shock. Fiscal policy could temporarily use existing buffers within a medium-term framework that ensures consolidation. Structural reforms should be advanced to improve economic efficiency and enhance diversification.
Increase in geopolitical tensions. Regional tension flare-ups or intensification could depress business confidence and heighten risk aversion.
Medium
Medium
The floating exchange rate remains key to cushion the shock. Disorderly market conitions can be countered with FX intervention. An interest rate increase could be considered. Fiscal policy tightening could be postponed.
Weaker banking system for longer. If undercapitalized banks are unable to improve their capital position, credit growth will be lower with negative implications on growth.
Medium
Medium
Weak banks should be required to submit time bound plans for recapitalization while bringing their capitalization closer to regulatory minima under an adverse stress scenario. In the case of weak viable government related banks, the government may want to consider precautionary capital injections.
Sharper-than-expected global growth slowdown: Significant China slowdown,
triggered by corporate distress that propagates through shadow banks, precipitating deleveraging, uncertainty and capital outflows. Weak domestic demand further suppresses commodity prices, roils global financial markets, and reduces global growth.
Low/Medium
Medium
The exchange rate should be allowed to adjust. Disorderly market conditions can be countered with intervention. Rebuild fiscal buffers and oil savings by tightening fiscal rule if prices are lower, and structural reforms should be advanced to enhance economic efficiency and diversification.
Continued drop in domestic investment. Authorities pursue inward-looking policies. Lack of structural reform could lead to a decline in investment and TFP.
Low
Medium
Focus on structural and governance reforms to improve the investment climate. Avoid distortive measures and leverage the real exchange rate depreciation while increasing trade openness.
1/ The RAM shows events that could materially alter the baseline path discussed in this report (which is the scenario most likely to materialize in the view of the staff). The relative likelihood of risks listed is the staff’s subjective assessment of the risks surrounding this baseline. The RAM reflects staff's views on the source of risks and overall level of concerns as of the time of discussions with the authorities.

RUSSIAN FEDERATION
INTERNATIONAL MONETARY FUND 41
Table 4. Russian Federation: Financial Stability Indicators, 2013–16 (In percent)
2013March
Financial Soundness IndicatorsCapital adequacyCapital to risk-weighted assets 13.5 12.5 12.7 12.4Core capital to risk-weighted assets 9.1 9.0 8.5 8.4
Credit riskNPLs to total loans 6.0 6.7 8.3 9.2Loan loss provisions to total loans 5.9 6.5 7.8 8.4Large credit risks to capital 204.3 245.5 254.4 248.1
Distribution of loans provided by credit institutionsAgriculture, hunting and forestry 4.3 3.5 3.5 3.6Mining 3.1 4.2 4.9 5.5Manufacturing 13.6 15.5 17.1 16.9Production and distribution of energy, gas and water 2.5 2.5 2.5 2.5Construction 5.6 5.3 4.8 4.8Wholesale and retail trade 13.7 13.3 11.3 11.0Transport and communication 4.2 4.4 4.2 4.3Other economic activities 21.1 21.2 24.1 23.9Individuals 32.0 30.1 27.5 27.6Of which: mortgage loans 8.5 9.4 10.1 12.5
Geographical distribution of interbank loans and depositsRussian Federation 39.7 53.6 54.0 58.9United Kingdom 23.8 13.9 12.3 11.1United States 6.8 4.9 4.5 4.7Germany 0.6 0.4 0.8 1.0Austria 7.3 7.3 4.9 4.1France 1.9 1.8 1.8 2.4Italy 0.1 0.0 0.0 0.1Cyprus 4.7 4.9 9.2 6.2Netherlands 1.5 1.3 0.8 0.4Other 13.6 11.8 11.8 11.0
LiquidityHighly liquid assets to total assets 9.9 10.4 10.6 11.6Liquid assets to total assets 20.5 22.0 24.6 22.8Liquid assets to short-term liabilities 78.7 80.4 139.3 121.8Ratio of client's funds to total loans 98.7 92.8 59.0 59.4
Return on assets 1.9 0.9 0.3 0.4Return on equity 15.2 7.9 2.3 3.4
Balance Sheet Structure, in percent of assetsTotal asset growth rate 16.0 35.2 6.9 9.0
Asset sideAccounts with CBR and other central banks 3.9 4.2 3.0 3.6Interbank lending 8.9 8.9 10.4 10.7Securities holdings 13.6 12.5 14.2 14.6
Liability side Funds from CBR 7.7 12.0 6.5 5.0Interbank liabilities 8.4 8.5 8.5 9.5Individual deposits 29.5 23.9 28.0 27.8
Sources: Authorities and IMF staff calculations.
2014 2015 2016

Table 5. Banking Sector Stress Testing Matrix (STeM)
Domain
Assumptions Top-Down by FSAP Team Top-Down by Authorities Bottom-Up by Authorities
Banking Sector: Solvency Risk
1.
Institutional
Perimeter
Institutions included Top 37
681 12 large banks (including 10 systemically important banks)
Market share 81.5 percent 99.7 percent 66 percent
Data and baseline date Institutions’ public data, up to 3rd Q 2015
Consolidated banking group, and stand-alone basis
Public data and other data, up to 4th Q 2015
Stand-alone basis
Institutions’ own data; up to 4th Q 2015
Stand-alone basis
2. Channels of
Risk
Propagation
Methodology Balance-sheet model (loan impairment charge/ provisions/NPLs)
Supplemental balance sheet analysis of impact of restructuring and under-provisioning
Balance-sheet model (NPLs/provisions)
Banks’ internal models
Satellite Models for
Macrofinancial linkages
Models for credit losses, NPLs, loan impairment charge, pre-impairment income
Satellite model bank by bank using IFRS data
Models for credit losses, NPLs, provisions, pre-impairment income
CBR macro model has second round effects related to the dependency between credit growth and growth of fixed capital investments
Own models
Stress test horizon Five years, 2016–20 Five years, 2016–20 One year
RUSSIAN
FEDERATIO
N
INTERN
ATION
AL MO
NETARY FU
ND
42
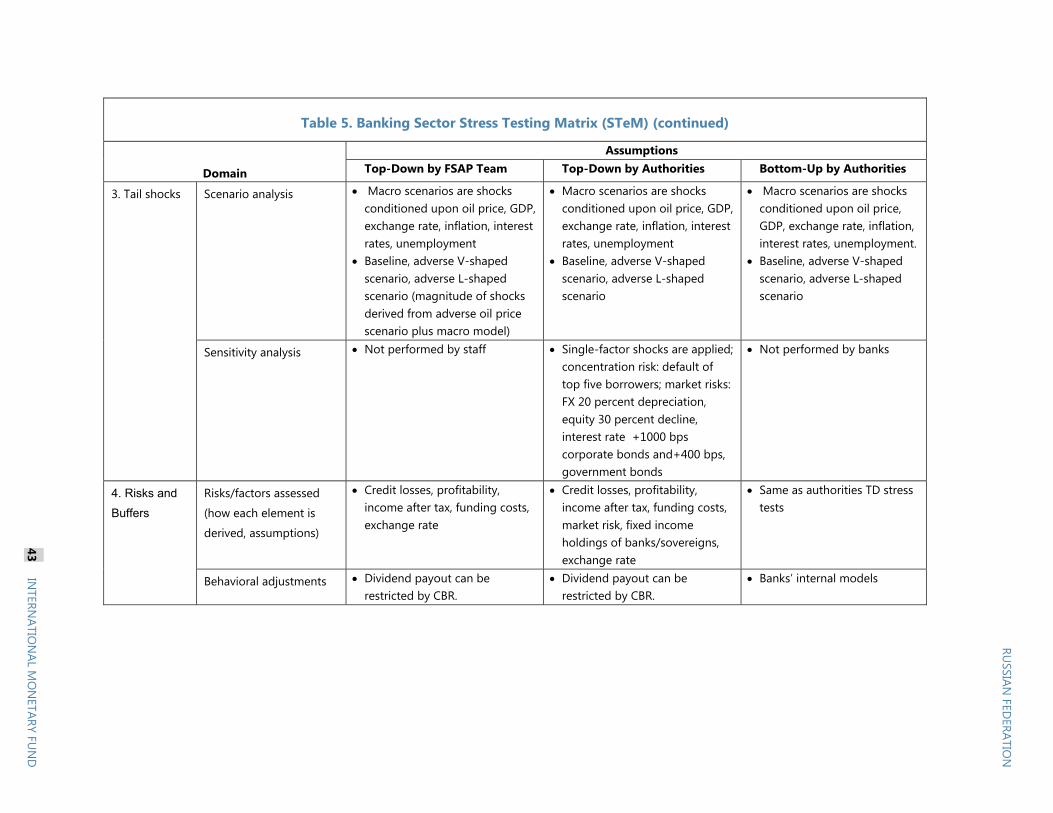
Table 5. Banking Sector Stress Testing Matrix (STeM) (continued)
Domain
Assumptions Top-Down by FSAP Team Top-Down by Authorities Bottom-Up by Authorities
3. Tail shocks Scenario analysis
Macro scenarios are shocks conditioned upon oil price, GDP, exchange rate, inflation, interest rates, unemployment
Baseline, adverse V-shaped scenario, adverse L-shaped scenario (magnitude of shocks derived from adverse oil price scenario plus macro model)
Macro scenarios are shocks conditioned upon oil price, GDP, exchange rate, inflation, interest rates, unemployment
Baseline, adverse V-shaped scenario, adverse L-shaped scenario
Macro scenarios are shocks conditioned upon oil price, GDP, exchange rate, inflation, interest rates, unemployment.
Baseline, adverse V-shaped scenario, adverse L-shaped scenario
Sensitivity analysis
Not performed by staff Single-factor shocks are applied; concentration risk: default of top five borrowers; market risks: FX 20 percent depreciation, equity 30 percent decline, interest rate +1000 bps corporate bonds and+400 bps, government bonds
Not performed by banks
4. Risks and
Buffers
Risks/factors assessed
(how each element is
derived, assumptions)
Credit losses, profitability, income after tax, funding costs, exchange rate
Credit losses, profitability, income after tax, funding costs, market risk, fixed income holdings of banks/sovereigns, exchange rate
Same as authorities TD stress tests
Behavioral adjustments Dividend payout can be restricted by CBR.
Dividend payout can be restricted by CBR.
Banks’ internal models
RU
SSIAN FED
ERATION
43 IN
TERNATIO
NAL M
ON
ETARY FUN
D

Table 5. Banking Sector Stress Testing Matrix (STeM) (continued)
Domain
Assumptions Top-Down by FSAP Team Top-Down by Authorities Bottom-Up by Authorities
5. Regulatory
and Market-
Based
Standards and
Parameters
Calibration of risk
parameters
NPLs/provisions RWA according to standardized
approach Risk weights increase from
90 percent to 100 percent in the prudent approach
NPLs/provisions RWA according to standardized
approach
Own methodologies RWA similar to authorities
stress tests
Regulatory/Accounting
and Market-Based
Standards
Hurdle rate: Basel III schedule, local regulatory requirements
Hurdle rate: Basel III schedule, local regulatory requirements
Hurdle rate: Basel III schedule, local regulatory requirements
CET1 of 4.5 percent, CAR of 8 percent
CET1 of 4.5 percent, CAR of 8 percent
CET1 of 4.5 percent, T1 of 6 percent, CAR of 8 percent
6. Reporting
Format for
Results
Output presentation Dispersion of capital ratios: median
Capital deficit, system wide Pass or fail; percentage of assets
that fail Number of banks
undercapitalized
Distributions by capital ratio: weighted average
Capital deficit, system wide Pass or fail; percentage of assets
that fail Number of undercapitalized
banks
Capital shortfall, system wide. Pass or fail; percentage of
assets that fail Number of banks
undercapitalized
7. Asset
quality
adjustment
Stress testing
methodology
Adjustment for weak restructured loans and under-provisioning lead to one-off increase in provisions at beginning of stress testing period
Not performed by authorities Not performed by banks
RUSSIAN
FEDERATIO
N
INTERN
ATION
AL MO
NETARY FU
ND
44
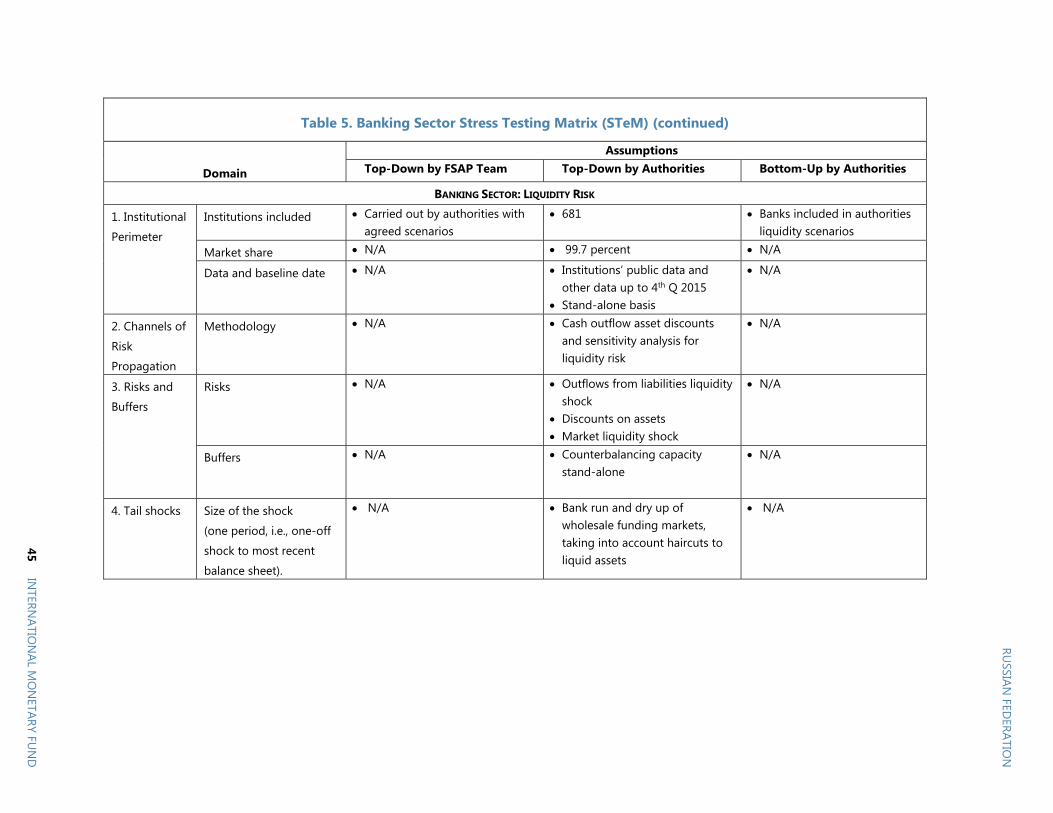
Table 5. Banking Sector Stress Testing Matrix (STeM) (continued)
Domain
Assumptions Top-Down by FSAP Team Top-Down by Authorities Bottom-Up by Authorities
BANKING SECTOR: LIQUIDITY RISK
1. Institutional
Perimeter
Institutions included Carried out by authorities with agreed scenarios
681 Banks included in authorities liquidity scenarios
Market share N/A 99.7 percent N/A
Data and baseline date N/A Institutions’ public data and other data up to 4th Q 2015
Stand-alone basis
N/A
2. Channels of
Risk
Propagation
Methodology
N/A Cash outflow asset discounts and sensitivity analysis for liquidity risk
N/A
3. Risks and
Buffers
Risks N/A Outflows from liabilities liquidity shock
Discounts on assets Market liquidity shock
N/A
Buffers N/A Counterbalancing capacity stand-alone
N/A
4. Tail shocks Size of the shock
(one period, i.e., one-off
shock to most recent
balance sheet).
N/A Bank run and dry up of wholesale funding markets, taking into account haircuts to liquid assets
N/A
45 IN
TERNATIO
NAL M
ON
ETARY FUN
D
RUSSIAN
FEDERATIO
N
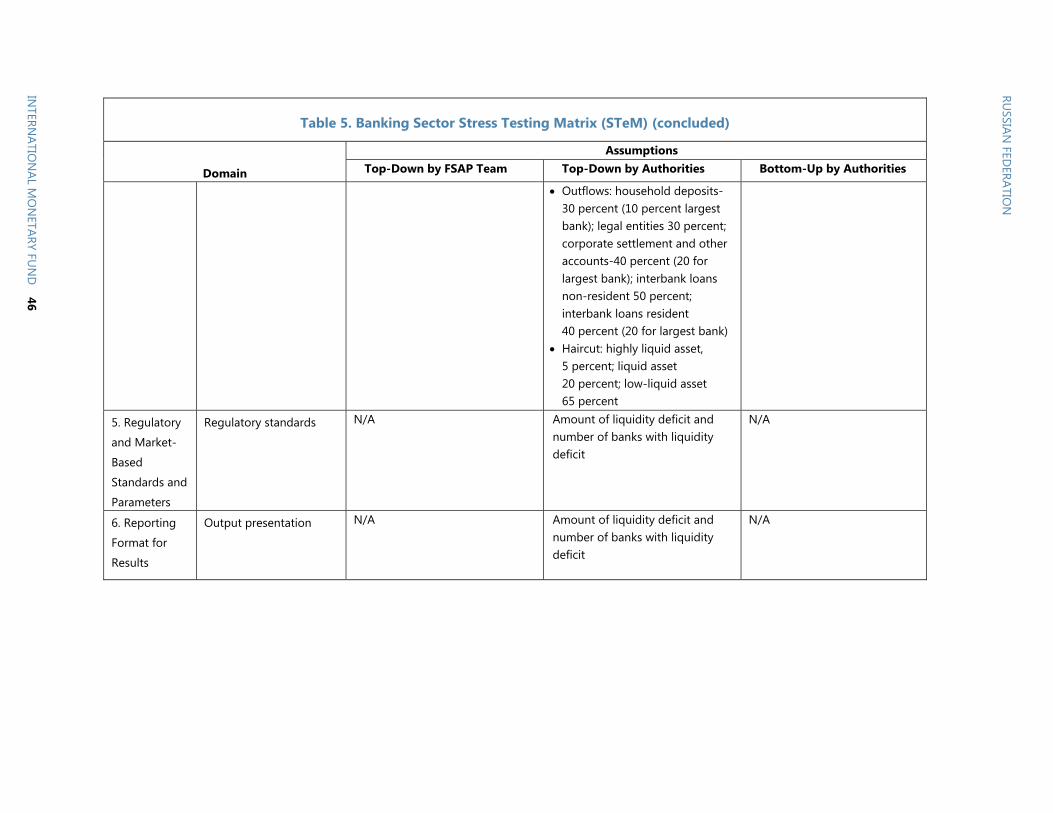
Table 5. Banking Sector Stress Testing Matrix (STeM) (concluded)
Domain
Assumptions Top-Down by FSAP Team Top-Down by Authorities Bottom-Up by Authorities
Outflows: household deposits-30 percent (10 percent largest bank); legal entities 30 percent; corporate settlement and other accounts-40 percent (20 for largest bank); interbank loans non-resident 50 percent; interbank loans resident 40 percent (20 for largest bank)
Haircut: highly liquid asset, 5 percent; liquid asset 20 percent; low-liquid asset 65 percent
5. Regulatory
and Market-
Based
Standards and
Parameters
Regulatory standards N/A
Amount of liquidity deficit and number of banks with liquidity deficit
N/A
6. Reporting
Format for
Results
Output presentation N/A
Amount of liquidity deficit and number of banks with liquidity deficit
N/A
RUSSIAN
FEDERATIO
N
INTERN
ATION
AL MO
NETARY FU
ND
46

RUSSIAN FEDERATION
47 INTERNATIONAL MONETARY FUND
Table 6. Macroeconomic Scenarios: Projections, 2015–20
Actual
A. Baseline Scenario2015 2016 2017 2018 2019 2020
Real GDP (%) -3.7 -1.0 1.0 1.5 1.5 1.5Brent price (USD/bbl, avg.) 53 43 50 54 57 60Exchange Rate (RUB/USD, avg.) 61 73 68 64 62 61Inflation (%, avg.) 15.5 8.3 7.0 5.0 4.0 4.0Short-term Interest Rates (%, avg.) 11.0 8.5 5.5 5.5 5.5 5.5Unemployment (%, avg.) 5.6 6.4 6.1 6.0 6.0 6.0
B. V-Shape Scenario2015 2016 2017 2018 2019 2020
Real GDP (%) -3.7 -7.8 2.6 2.9 1.1 1.0Brent price (USD/bbl, avg.) 53 19 24 32 36 40Exchange Rate (RUB/USD, avg.) 61 100 88 75 71 67Inflation (%, avg.) 15.5 15.9 6.1 4.0 4.2 4.2Short-term Interest Rates (%, avg.) 11.0 17.7 7.6 5.4 5.7 5.7Unemployment (%, avg.) 5.6 9.5 9.2 8.0 7.4 6.9
C. L-Shape Scenario2015 2016 2017 2018 2019 2020
Real GDP (%) -3.7 -5.7 -0.3 1.7 1.1 1.0Brent price (USD/bbl, avg.) 53 25 25 29 33 37Exchange Rate (RUB/USD, avg.) 61 88 91 83 78 74Inflation (%, avg.) 15.5 13.3 5.4 4.1 4.2 4.2Short-term Interest Rates (%, avg.) 11.0 15.2 6.9 5.5 5.7 5.7Unemployment (%, avg.) 5.6 8.9 9.5 8.6 8.0 7.4
Source: IMF staff calculations.
Projections

RUSSIAN FEDERATION
48 INTERNATIONAL MONETARY FUND
Table 7. Detailed Stress Test Results
2016 2017 2018 2019 2020 2016 2017 2018 2019 2020 2016 2017 2018 2019 2020
Top-down, CBR 1/without asset quality adjustment
CET1 capital ratio 2/ 7.9 8.1 8.1 8.3 8.3 5.9 4.6 5.8 6.3 7.2 6.3 5.2 5.6 6.1 6.7Total capital ratio 2/ 12.3 12.5 12.6 12.7 12.8 10.6 9.0 10.1 11.0 11.9 11.0 10.2 10.7 11.3 11.8
Top-down, Staff 3/without asset quality adjustment
CET1 capital ratio 4/ 9.0 8.4 10.1 12.4 14.8 5.4 4.6 5.5 6.2 7.4 6.5 4.8 5.2 5.9 6.5Total capital ratio 4/ 12.5 12.8 13.3 14.2 16.2 8.7 7.5 8.0 8.4 9.0 9.7 8.1 7.8 8.4 8.8
Top-down, Staff 3/with asset quality adjustment
CET1 capital ratio 4/ 6.0 5.5 7.2 9.5 11.8 1.6 0.8 1.7 2.3 3.3 2.5 1.0 1.4 2.0 2.6Total capital ratio 4/ 9.5 9.9 10.3 11.2 13.2 4.5 3.5 3.9 4.2 4.8 5.5 3.9 3.8 4.2 4.7
Top-down, CBR 1/ Sum Sum Sumwithout asset quality adjustment
Credit losses 5/ 1.2 1.7 0.8 0.6 0.5 4.8 3.4 4.7 1.4 0.9 0.7 11.1 2.8 3.7 1.5 0.9 0.7 9.6Total capital deficit 6/ 7/ 0.1 0.2 0.2 0.2 0.3 0.5 1.5 1.9 2.2 2.5 0.4 1.2 1.6 1.9 2.1
Top-down, Staff 3/without asset quality adjustment
Credit losses 5/ 2.9 1.9 1.7 1.8 1.8 10.2 6.8 2.1 1.8 2.5 2.5 15.8 5.8 3.5 2.4 2.6 2.5 16.7Total capital deficit 6/ 0.1 0.2 0.3 0.4 0.4 0.7 1.4 1.7 2.1 2.4 0.4 1.3 1.8 2.3 2.7
Top-down, Staff 3/with asset quality adjustment
Credit losses 5/ 6.2 1.9 1.7 1.8 1.8 13.5 10.1 2.1 1.8 2.5 2.5 19.1 9.1 3.5 2.4 2.6 2.5 20.0Total capital deficit 6/ 0.5 0.8 0.9 1.0 1.0 3.8 4.6 4.4 4.3 4.2 3.0 4.0 4.3 4.4 4.4
Top-down, CBR 1/without asset quality adjustment
No. of banks with capital deficit 1/ 34 36 27 23 19 72 140 76 34 29 62 108 67 35 19Share of banks with capital deficit /8 6.8 7.0 6.2 6.1 5.7 19.1 29.7 18.7 5.8 5.4 17.2 28.9 15.5 6.4 4.9
Top-down, Staff 3/without asset quality adjustment
No. of banks with capital deficit 3/ 7 7 9 9 9 16 20 19 18 16 13 18 19 18 17Share of banks with capital deficit /8 8.4 11.8 15.0 15.0 15.0 37.0 40.0 40.0 39.4 38.1 34.8 38.4 39.4 39.4 39.0
Top-down, Staff 3/with asset quality adjustment
No. of banks with capital deficit 3/ 15 15 15 14 12 27 28 26 25 23 27 25 26 25 24Share of banks with capital deficit /8 37.0 37.0 37.7 37.5 18.7 86.5 86.8 83.5 83.3 44.3 86.5 83.2 83.4 83.3 44.3
Source: IMF staff calculations.
1/ Based on a sample of 681 banks. 5/ In percent of total loans.2/ Asset weighted mean. 6/ In percent of GDP.3/ Based on a sample of largest 37 banks. 7/ Includes also market and liquidity risk.4/ Median 8/ In percent of sample total assets.
Baseline Stress Scenario (V-shaped) Stress Scenario (L-shaped)

RUSSIAN FEDERATION
INTERNATIONAL MONETARY FUND 49
Appendix I. 2011 FSAP Stability Module Recommendations Status
Many key recommendations of the 2011 FSAP have been addressed
At the time of the last FSAP, the economy and financial sector were on the road to recovery following the GFC. The 2011 FSAP noted the authorities’ decisive and broad-based policy response, which successfully supported financial stability during the crisis. Banks’ profitability was improving and stress tests suggested resilience to a variety of sizeable shocks. However, progress toward a more competitive banking system has been slow, as governance continued to be weak and concentration and moral hazard increased.
Since then, the authorities have addressed several of the key 2011 FSAP recommendations:
The scope of the regulatory parameter has been widened to banking groups and CBR has been granted information powers in relation to holding companies; the CBR has also been granted the power to impose standards for risk management of banks and banking groups; to use professional judgment in applying laws and regulations; and share without restrictions information with other domestic authorities and foreign supervisors.
Unified legislation was adopted for the resolution of all banks making permanent the temporary resolution powers introduced in 2008, improving coordination (domestic and cross border) and providing greater powers to sanction owners and managers of failing institutions. The legislation does not apply to bank holding companies.
The authorities have strengthened the macroprudential policy framework, including the establishment of a high-level inter-agency advisory body on systemic risk issues and the CBR’s Financial Stability Committee.
The CBR has been empowered to appoint a provisional administrator and wind down distressed securities firms. These powers need to be strengthened further.