imf country report no. 16/277 central african … · this staff report on discussions with regional...
TRANSCRIPT

© 2016 International Monetary Fund
IMF Country Report No. 16/277
CENTRAL AFRICAN ECONOMIC AND MONETARY COMMUNITY (CEMAC)
COMMON POLICIES OF MEMBER COUNTRIES—PRESS RELEASE; STAFF REPORT; AND STATEMENT BY THE EXECUTIVE DIRECTOR
This staff report on discussions with regional institutions of the Central African Economic and
Monetary Community (CEMAC) was prepared by a staff team of the International Monetary
Fund in the context of the periodic regional surveillance of the CEMAC. The regional perspective
of such discussions is intended to strengthen the bilateral discussions that the IMF holds with
the members in the region under Article IV of the IMF’s Articles of Agreement. The following
documents have been released and are included in the package:
A Press Release summarizing the views of the Executive Board as expressed during its
July 13, 2016 discussion of the staff report.
The Staff Report prepared by a staff team of the IMF for the Executive Board’s
consideration on July 13, 2016, following discussions with regional institutions that ended
on May 9, 2016. Based on information available at the time of these discussions, the staff
report was completed on June 28, 2016.
An Informational Annex prepared by the IMF staff.
A Statement by the Executive Director.
The IMF’s transparency policy allows for the deletion of market-sensitive information and
premature disclosure of the authorities’ policy intentions in published staff reports and other
documents.
Copies of this report are available to the public from
International Monetary Fund Publication Services
PO Box 92780 Washington, D.C. 20090
Telephone: (202) 623-7430 Fax: (202) 623-7201
E-mail: [email protected] Web: http://www.imf.org
Price: $18.00 per printed copy
International Monetary Fund
Washington, D.C.
August 2016

Press Release No. 16/361
FOR IMMEDIATE RELEASE
July 26, 2016
IMF Executive Board Concludes Annual Discussions on CEMAC
Countries’ Common Policies
On July 13, 2016, the Executive Board of the International Monetary Fund (IMF) concluded the
annual discussions on Common Policies and Challenges of Member Countries with the Central
African Economic and Monetary Community (CEMAC).1
CEMAC growth was subdued in 2015. It slowed to 1.6 percent, from 4.9 percent in 2014,
because of reduced public investment and lower oil production. Growth is projected to be
1.9 percent in 2016, as oil production and investment remain sluggish. From 2017 onward,
growth is expected to reach 3½ percent a year, as oil prices gradually recover, some
one percentage point below the average growth level of the past decade of high oil prices.
Growth of money and credit to the economy turned negative in 2015 for the first time in a
decade, contributing to keeping inflation low. The regional fiscal and current account deficits
grew to 6 and 9 percent of GDP in 2015, respectively, as oil export proceeds fell by 32 percent.
Continued low oil prices and high public expenditure will contribute to maintaining both deficits
at about 6 and 8 percent of GDP in 2016, respectively. The gradual recovery in oil prices and the
expected moderate fiscal consolidation should narrow the regional fiscal and current account
deficits to 3 percent by 2021. Reserves have declined. Banks appear to have weathered the
economic downturn thus far.
1 Under Article IV of the IMF’s Articles of Agreement, the IMF holds bilateral discussions with members, usually every year. In the context of these bilateral Article IV consultation discussion, staff hold separate annual discussions with the regional institutions responsible for common policies in four currency unions – the Euro Area, the Eastern Caribbean Currency Union, the Central African Economic and Monetary Union, and the West African Economic and Monetary Union. For each of the currency unions, staff teams visit the regional institutions responsible for common policies in the currency union, collects economic and financial information, and discusses with officials the currency union’s economic developments and policies. On return to headquarters, the staff prepares a report, which forms the basis of discussion by the Executive Board. Both staff’s discussions with the regional institutions and the Board discussion of the annual staff report will be considered an integral part of the Article IV consultation with each member.
International Monetary Fund
700 19th Street, NW
Washington, D. C. 20431 USA

2
Policies to counter the oil-price shock need to focus on fiscal consolidation and real-economy
reforms. In the wake of the oil-price shock, monetary financing has been the primary response
tool. Although the non-oil primary deficit dropped by 8 percentage points of GDP in 2015, this
response has been insufficient to check the overall fiscal deficit. Fiscal policy coordination
among members should be strengthened and fiscal discipline enforcement is needed. Real-
economy reforms, focusing on improving the business climate and boosting private investment,
are also needed to preserve macroeconomic stability.
CEMAC medium-term prospects are challenging. A weaker-than-expected oil price recovery or
a relapse in security conditions in the Lake Chad region could undermine macroeconomic
stability and private investment. Lower growth in China could dampen commodity prices—
especially oil—, lower demand, and reduce financing. In these challenging times, stronger
regional institutions are necessary for promoting regional integration and supporting regional
economic growth.
Executive Board Assessment21
Executive Directors agreed with the thrust of the staff appraisal. They expressed concern about
the region’s deteriorating economic prospects stemming from multiple shocks, in particular the
oil price decline, the challenging security environment, and the insufficient policy response.
With the medium-term outlook facing considerable risks, Directors strongly encouraged the
authorities to take timely and decisive actions to pursue fiscal adjustment and ensure debt and
external sustainability, rebuild foreign reserves buffers, and implement region-wide structural
reforms to diversify the economy and improve investment prospects. Stronger regional
institutions are also essential to improving regional integration and policy coherence and
compliance. Directors also called for enhanced support from the Fund and other international
partners to help the authorities address the current economic difficulties.
Directors stressed the critical importance of continued fiscal consolidation to address the
widening fiscal and current account deficits and to maintain macroeconomic stability. While
welcoming the recent progress, they encouraged further efforts to expand the non-oil tax base
and rationalize and improve the quality of spending to maximize economic returns and social
protection. Directors welcomed the authorities’ intention to pursue prudent borrowing and debt
management policies, and encouraged borrowing on concessional terms to the extent possible.
Directors also welcomed the new regional convergence framework, although a lower debt ceiling
and stronger monitoring mechanisms should be considered.
While acknowledging the supportive role played by the accommodative monetary stance in
weathering shocks, Directors noted the limited scope for further monetary policy easing and
called for greater prudence in this regard. They urged the authorities to freeze the statutory
advances to national governments, avoid indirect monetary financing, and accelerate reforms to
the monetary policy framework to improve its effectiveness, including greater central bank
2At the conclusion of the discussion, the Managing Director, as Chairman of the Board, summarizes the views of Executive Directors, and this summary is transmitted to the regional authorities. An explanation of any qualifiers used in summing ups can be found here: http://www.imf.org/external/np/sec/misc/qualifiers.htm.
3
independence. Directors underscored that rebuilding the low level of reserves is an urgent
priority, and that better pooling of reserves across the members remains important. They
encouraged the implementation of the remaining safeguards assessment recommendations.
Directors noted the resilience of the financial sector, and encouraged the development of a sound
macroprudential framework to safeguard financial stability in the region. Directors also
welcomed the progress made following the 2015 FSAP recommendations, and urged the
implementation of the remaining recommendations, as well as measures to broaden financial
inclusion and strengthen the AML/CFT framework.
Directors stressed the need for ambitious structural reforms to boost competitiveness and
diversification, create private-sector investment opportunities, and improve the business
environment. They encouraged the strengthening of regional institutions to enhance
collaboration and macroeconomic management.
The views expressed by Directors today will form part of the Article IV consultation discussions
on individual members of the CEMAC that take place until the next Board discussion of
CEMAC common policies. It is expected that the next discussion of CEMAC common policies
will be held on the standard 12-month cycle.

4
CEMAC: Selected Economic and Financial Indicators, 2012–17
2012 2013 2014 2015 2016 2017
Estim. Proj. Proj.
(Annual percent change)
National income and prices
GDP at constant prices 5.4 2.1 4.9 1.6 1.9 3.3
Oil GDP -0.3 -8.0 3.0 -0.4 -1.5 0.2
Non-oil GDP 5.9 4.6 5.0 2.6 2.7 4.1
Consumer prices (period average)1 3.9 2.1 2.7 2.3 2.0 2.7
Consumer prices (end of period)1 3.2 2.4 2.6 1.6 2.7 2.4
(Annual changes in percent of beginning-of-period broad money)
Money and credit
Net foreign assets 9.5 -0.4 -7.6 -17.7 -8.5 -3.9
Net domestic assets 6.7 9.0 14.9 15.6 12.1 11.2
Broad money 16.6 6.7 9.4 -2.2 3.6 7.4
(Percent of GDP, unless otherwise indicated)
Gross national savings 30.8 26.5 27.1 20.2 21.1 20.0
Gross domestic investment 30.1 31.4 32.7 29.7 28.8 25.1
Of which: public investment 14.0 14.5 14.3 10.7 9.8 7.9
Government financial operations
Total revenue, excluding grants 27.6 26.8 25.0 20.2 19.0 18.8
Government expenditure 29.2 30.3 29.6 26.6 25.9 23.8
Primary fiscal basic balance2 -0.6 -1.6 -2.5 -4.4 -2.9 -1.2
Basic fiscal balance 3 -1.3 -2.2 -3.1 -5.2 -4.1 -2.4
Overall fiscal balance, excluding grants -1.6 -3.5 -4.6 -6.4 -6.8 -5.0
Primary fiscal balance, including grants -0.3 -2.3 -3.3 -5.0 -4.7 -3.0
Non-oil overall fiscal balance, excluding grants4 -31.0 -29.1 -25.9 -18.0 -15.9 -13.6
Non-oil primary fiscal balance, including grants 4 -28.9 -27.3 -24.0 -16.3 -13.4 -11.2
External sector
Exports of goods and nonfactor services 57.0 53.7 50.8 41.5 36.3 37.0
Imports of goods and nonfactor services 42.4 41.0 43.0 42.3 36.9 34.8
Balance on goods and nonfactor services 14.6 12.7 7.9 -0.8 -0.6 2.2
Current account, including grants 2.9 -0.8 -3.3 -9.4 -7.7 -5.2
External public debt 13.1 15.5 18.5 23.4 25.6 25.8
Gross official reserves (end of period)
Millions of U.S. dollars 17,531 18,222 15,309 10,139 7,866 7,634 Months of imports of goods and services
(less intra-regional imports) 5.7 5.6 6.1 4.6 3.4 3.3
Percent of broad money 88.7 83.7 64.3 52.0 38.5 34.5
Memorandum items:
Nominal GDP (billions of CFA francs) 45,877 45,572 46,702 43,369 43,423 47,019
CFA francs per U.S. dollar, average 511 494 494 591 … … Oil prices (US dollars per barrel) 105 104 96 51 44 51
Source: Authorities' data; and IMF staff estimates and projections. 1 Using as weights the shares of member countries in CEMAC's GDP in purchasing power parity in US dollars. 2 Excluding grants and foreign-financed investment and interest payments. 3 Excluding grants and foreign-financed investment. 4 In percent of non-oil GDP.

CENTRAL AFRICAN ECONOMIC AND
MONETARY COMMUNITY (CEMAC)
STAFF REPORT ON THE COMMON POLICIES OF MEMBER
COUNTRIES
KEY ISSUES
Context and risks. CEMAC is buffeted by the oil-price shock. The outlook has deteriorated,
as members continue to suffer from the shock. Regional and national authorities have yet to
take appropriate measures to address the economic downturn, whilst continuing to face
substantial capacity constraints. Although the banking sector has weathered the downturn
so far, government payment delays could undermine its soundness. Risks are significant: a
weaker-than-expected oil price recovery or deteriorating security conditions could
jeopardize macroeconomic stability.
Policy recommendations
Policy mix. The policy response to the oil revenue loss and increased security spending
has been insufficient. It has led to a contraction in reserves—now below recommended
levels. Fiscal adjustment and real-economy reforms, focusing on improving the business
climate and boosting private investment, are needed to preserve macroeconomic stability.
An incomplete policy response could jeopardize external sustainability.
Monetary policy and safeguards reform. The BEAC’s accommodative monetary
policy has contributed to the decline in reserves and delayed fiscal consolidation.
Meanwhile, the authorities still need to strengthen weak monetary transmission channels.
The BEAC’s Board of Directors has mandated to proceed with two important safeguards
recommendations.
Macrofinancial linkages and the financial sector. Important links between the public
and the banking sectors require (i) the non-accumulation of arrears to ensure the stability of
the banking system; and (ii) a strong microprudential framework to sustain macrofinancial
stability. Progress has been made in implementing some of the 2015 FSAP
recommendations.
Regional integration and convergence framework. CEMAC institutions continue to
face internal constraints, which undermine their capacity to support regional integration and
growth. The newly approved convergence framework can help to manage revenue volatility.
Plans for a medium-term savings rule would help CEMAC to build fiscal buffers to deal with
future commodity shocks.
June 28, 2016
13, 2016

CEMAC
2 INTERNATIONAL MONETARY FUND
Approved By Anne-Marie Gulde-
Wolf and Bob Traa
Discussions were held during April 25–May 9, 2016 in Libreville,
Gabon, and Yaoundé, Cameroon, with the regional central
bank (Banque Centrale des États de l’Afrique Centrale, BEAC); the
banking commission (Commission Bancaire, COBAC); the CEMAC
Commission; and the Development Bank of Central African
States (Banque de Développement des États de l’Afrique Centrale,
BDEAC). The staff team comprised Messrs. de Zamaróczy (head),
Fleuriet (MCM), Gijon, Nassar, van Houtte (African Department),
Mr. Kalonji (resident representative), and Mr. Tchakoté (local
economist). Administrative and research support was provided by
Ms. Koulefianou and Mr. Mengistu, respectively. The team also met
with representatives of academia, the financial sector, and the donor
community.
CONTENTS
A COMMUNITY BLIGHTED BY LOW OIL PRICES________________________________________________ 4
POLICY DISCUSSIONS—MANAGING THE ECONOMIC DOWNTURN __________________________ 7
A. An External Position at Risk ____________________________________________________________________ 7
B. Urgency of Fiscal Consolidation ________________________________________________________________ 9
C. A New Convergence Framework for Regional Stability ________________________________________ 11
D. A Monetary Policy Reaching its Limits ________________________________________________________ 13
E. A Regional Financial Sector Showing Signs of Stress __________________________________________ 15
F. Strengthening Regional Institutions ___________________________________________________________ 17
STAFF APPRAISAL _____________________________________________________________________________ 19
BOX
1. New Convergence Framework _______________________________________________________________ 12
FIGURES
1. Selected Economic Indicators, 2000–15 _______________________________________________________ 5
2. Regional and International Comparisons, 2011–16 ____________________________________________ 6
3. Selected External Indicators, 2007–16 _________________________________________________________ 8
4. External Debt Developments, 2014–16 _______________________________________________________ 10
5. Monetary developments, 2016 _______________________________________________________________ 13
6. Output Gap Estimations, 1990–2015 _________________________________________________________ 14

CEMAC
INTERNATIONAL MONETARY FUND 3
TABLES
1. Selected Economic and Financial Indicators, 2014–21 ________________________________________ 21
2. Millennium Development Goals, 1990–2015 _________________________________________________ 22
3. National Accounts, 2014–21 _________________________________________________________________ 23
4. Relative Size of CEMAC Economies and Importance of Oil Sector, 2014–21 __________________ 24
5a. Fiscal Balances, 2014–21 _____________________________________________________________________ 25
5b. Fiscal Non-oil Balances, 2014–21 _____________________________________________________________ 26
6a. Balance of Payments, 2014–21 _______________________________________________________________ 27
6b. Balance of Payments Indicators by Country, 2014–21 ________________________________________ 28
7. Nominal and Real Effective Exchange Rates, 2006–15 ________________________________________ 29
8. Compliance with Convergence Criteria, 2013–16 _____________________________________________ 30
9. Monetary Survey, 2013–17 ___________________________________________________________________ 31
10. Bank Ratings, December 2015 _______________________________________________________________ 32
11. Financial Soundness Indicators, 2014–15 _____________________________________________________ 33
12. Violations of Prudential Ratios, 2013–15 _____________________________________________________ 34
ANNEXES
I. Risk Assessment Matrix ______________________________________________________________________ 35
II. Response to Past IMF Advice _________________________________________________________________ 37
III. External Sustainability Assessment ___________________________________________________________ 38
IV. 2015 FSAP Recommendations ________________________________________________________________ 44
V. Macrofinancial Linkages ______________________________________________________________________ 45
CEMAC
4 INTERNATIONAL MONETARY FUND
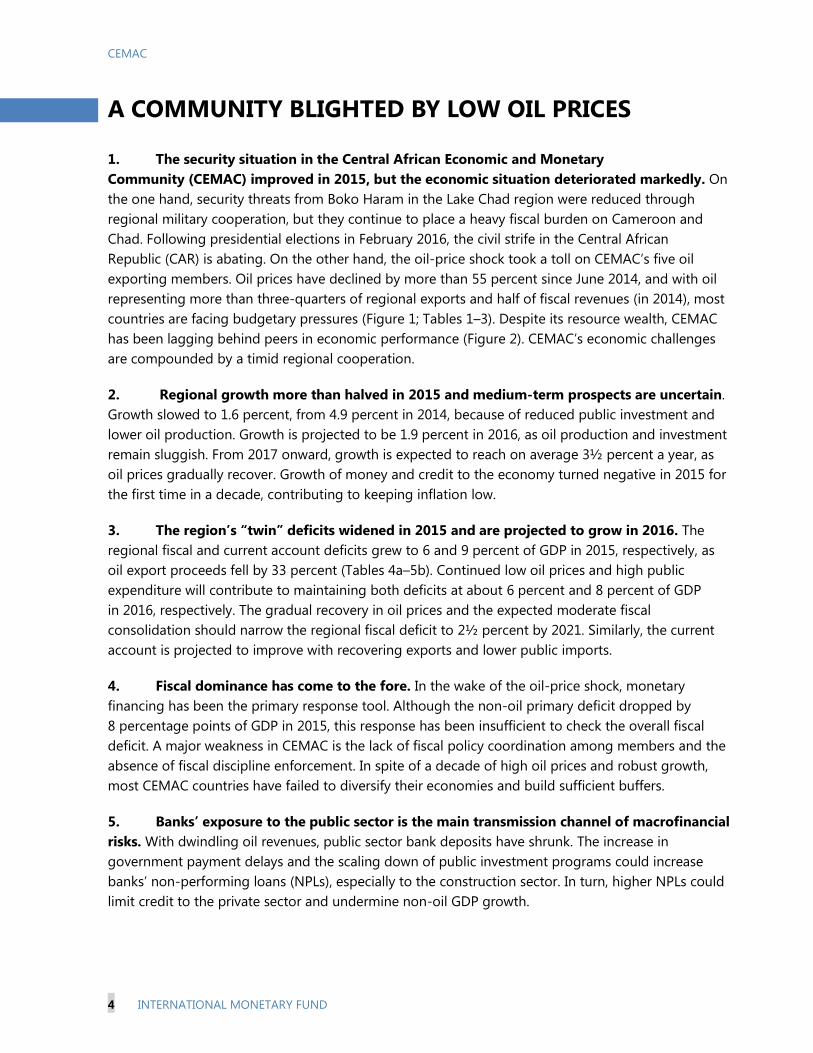
A COMMUNITY BLIGHTED BY LOW OIL PRICES
1. The security situation in the Central African Economic and Monetary
Community (CEMAC) improved in 2015, but the economic situation deteriorated markedly. On
the one hand, security threats from Boko Haram in the Lake Chad region were reduced through
regional military cooperation, but they continue to place a heavy fiscal burden on Cameroon and
Chad. Following presidential elections in February 2016, the civil strife in the Central African
Republic (CAR) is abating. On the other hand, the oil-price shock took a toll on CEMAC’s five oil
exporting members. Oil prices have declined by more than 55 percent since June 2014, and with oil
representing more than three-quarters of regional exports and half of fiscal revenues (in 2014), most
countries are facing budgetary pressures (Figure 1; Tables 1–3). Despite its resource wealth, CEMAC
has been lagging behind peers in economic performance (Figure 2). CEMAC’s economic challenges
are compounded by a timid regional cooperation.
2. Regional growth more than halved in 2015 and medium-term prospects are uncertain.
Growth slowed to 1.6 percent, from 4.9 percent in 2014, because of reduced public investment and
lower oil production. Growth is projected to be 1.9 percent in 2016, as oil production and investment
remain sluggish. From 2017 onward, growth is expected to reach on average 3½ percent a year, as
oil prices gradually recover. Growth of money and credit to the economy turned negative in 2015 for
the first time in a decade, contributing to keeping inflation low.
3. The region’s “twin” deficits widened in 2015 and are projected to grow in 2016. The
regional fiscal and current account deficits grew to 6 and 9 percent of GDP in 2015, respectively, as
oil export proceeds fell by 33 percent (Tables 4a–5b). Continued low oil prices and high public
expenditure will contribute to maintaining both deficits at about 6 percent and 8 percent of GDP
in 2016, respectively. The gradual recovery in oil prices and the expected moderate fiscal
consolidation should narrow the regional fiscal deficit to 2½ percent by 2021. Similarly, the current
account is projected to improve with recovering exports and lower public imports.
4. Fiscal dominance has come to the fore. In the wake of the oil-price shock, monetary
financing has been the primary response tool. Although the non-oil primary deficit dropped by
8 percentage points of GDP in 2015, this response has been insufficient to check the overall fiscal
deficit. A major weakness in CEMAC is the lack of fiscal policy coordination among members and the
absence of fiscal discipline enforcement. In spite of a decade of high oil prices and robust growth,
most CEMAC countries have failed to diversify their economies and build sufficient buffers.
5. Banks’ exposure to the public sector is the main transmission channel of macrofinancial
risks. With dwindling oil revenues, public sector bank deposits have shrunk. The increase in
government payment delays and the scaling down of public investment programs could increase
banks’ non-performing loans (NPLs), especially to the construction sector. In turn, higher NPLs could
limit credit to the private sector and undermine non-oil GDP growth.
CEMAC
INTERNATIONAL MONETARY FUND 5
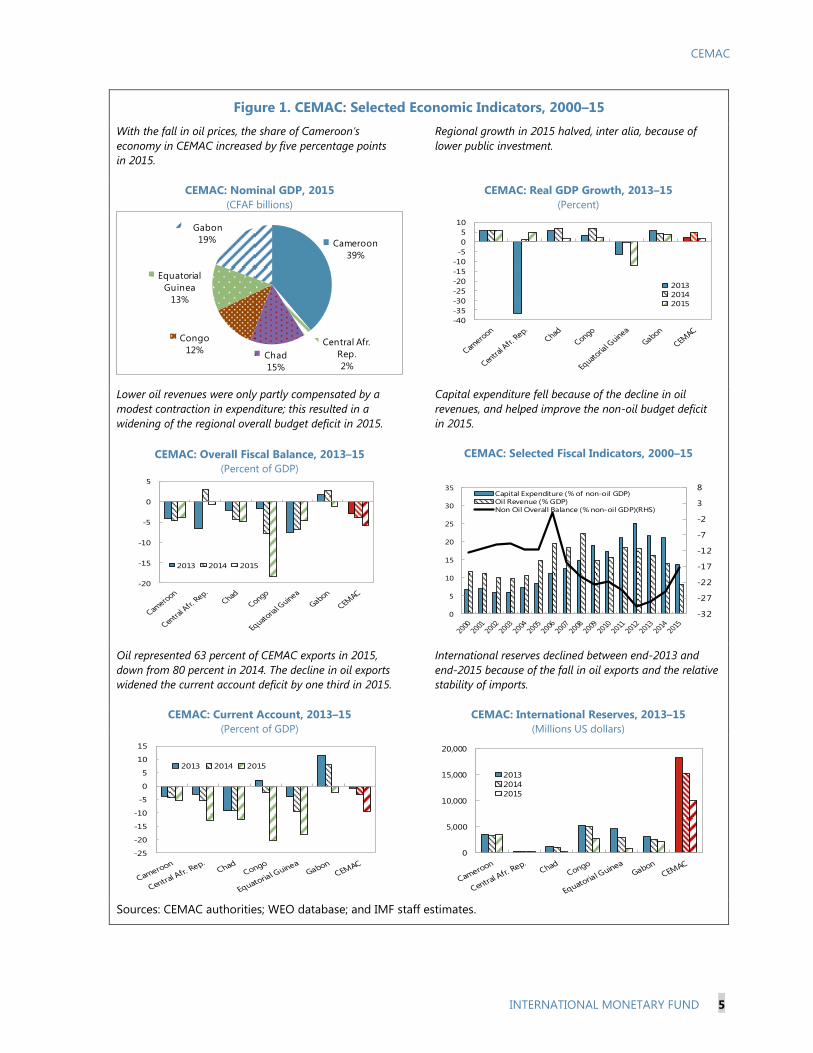
Figure 1. CEMAC: Selected Economic Indicators, 2000–15
With the fall in oil prices, the share of Cameroon’s
economy in CEMAC increased by five percentage points
in 2015.
Regional growth in 2015 halved, inter alia, because of
lower public investment.
CEMAC: Nominal GDP, 2015
(CFAF billions)
CEMAC: Real GDP Growth, 2013–15
(Percent)
Lower oil revenues were only partly compensated by a
modest contraction in expenditure; this resulted in a
widening of the regional overall budget deficit in 2015.
Capital expenditure fell because of the decline in oil
revenues, and helped improve the non-oil budget deficit
in 2015.
CEMAC: Overall Fiscal Balance, 2013–15
(Percent of GDP)
CEMAC: Selected Fiscal Indicators, 2000–15
Oil represented 63 percent of CEMAC exports in 2015,
down from 80 percent in 2014. The decline in oil exports
widened the current account deficit by one third in 2015.
International reserves declined between end-2013 and
end-2015 because of the fall in oil exports and the relative
stability of imports.
CEMAC: Current Account, 2013–15
(Percent of GDP)
CEMAC: International Reserves, 2013–15
(Millions US dollars)
Sources: CEMAC authorities; WEO database; and IMF staff estimates.
Cameroon
39%
Central Afr.
Rep.
2%Chad
15%
Congo
12%
Equatorial
Guinea
13%
Gabon
19%
-40
-35
-30
-25
-20
-15
-10
-5
0
5
10
2013
2014
2015
-20
-15
-10
-5
0
5
2013 2014 2015
-32
-27
-22
-17
-12
-7
-2
3
8
0
5
10
15
20
25
30
35Capital Expenditure (% of non-oil GDP)
Oil Revenue (% GDP)
Non Oil Overall Balance (% non-oil GDP)(RHS)
-25
-20
-15
-10
-5
0
5
10
15
2013 2014 2015
0
5,000
10,000
15,000
20,000
2013
2014
2015

CEMAC
6 INTERNATIONAL MONETARY FUND
Figure 2. CEMAC: Regional and International Comparisons, 2011–16
Economic growth halved in 2015 and it lagged behind that
of African comparator groups.
In 2015, CEMAC recorded the worst fiscal position within
sub-Saharan African comparator groups because of the
fall in oil revenues.
CEMAC: Real GDP, 2011–2015
(Percent)
CEMAC: Overall Fiscal Balance, 2011–15
(Percent)
The current account deficit was also the widest among
comparator groups in 2015.
The reserve coverage at end-2015 was below
recommended levels for a currency union.
CEMAC: Current Account Balance, 2011–15
(Percent)
CEMAC: International Reserves, 2011–15
(Months of prospective imports)
CEMAC non-oil revenues were below those of most
comparable sub-Saharan African countries in 2015.
A challenging business environment constrains private
investment and hampers economic diversification.
Non-Oil Revenue, 2015
(Percent of GDP)
Ease of Doing Business, 2016
(Ranking 1= best, 189=worst)
Sources: CEMAC authorities; WEO database; World Bank; and IMF staff estimates.
0
2
4
6
8
2011 2012 2013 2014 2015
SSA Oil Exporters SSA
WAEMU CEMAC
-6
-5
-4
-3
-2
-1
0
1
2
3
2011 2012 2013 2014 2015
SSA Oil Exporters SSA
WAEMU CEMAC
-8
-6
-4
-2
0
2
4
6
2011 2012 2013 2014 2015
SSA Oil Exporters SSA
WAEMU CEMAC
0
2
4
6
8
2011 2012 2013 2014 2015
SSA Oil Exporters SSA
WAEMU CEMAC
0
5
10
15
20
25
30
.Note: For WAEMU, Kenya, Tanzania, Malawi, and
Mozambique, non-oil revenue is the same as total revenue.
176
147 153143
-20
20
60
100
140
180
220

CEMAC
INTERNATIONAL MONETARY FUND 7
6. The medium-term outlook is fraught with risks (Annex I). A weaker-than-expected oil
price recovery or a relapse in security conditions could undermine macroeconomic stability and
private investment. Lower growth in China could dampen commodity prices—especially oil—, lower
demand, and reduce financing. Previous IMF staff advice has generated limited traction (Annex II).
POLICY DISCUSSIONS—MANAGING THE ECONOMIC
DOWNTURN
Against the backdrop of declining international reserves, dwindling fiscal buffers, and mounting macro-
imbalances, discussions focused on policies to mitigate the structural oil-price shock, supported by
regional and national structural measures, regional integration, and economic diversification.
A. An External Position at Risk
7. CEMAC’s non-oil competitiveness is poor and the external position could weaken
further in the near term. At end-2015, reserve coverage was 4.6 months of future imports and
represented 52 percent of broad money. Despite the depreciation of the euro in 2014–15, both the
nominal and real effective exchange rates (REERs) appreciated during the 12 months to April 2016,
because of the inflation differential and CFA franc appreciation vis-à-vis the currencies of trade
partners. According to model-based assessments, the REER appears to be moderately overvalued (by
about 6 percent) with respect to the current account norms (Figure 3; Table 6; Annex III). In addition,
large structural competitiveness challenges persist.
8. Staff expressed concerns about the significant fall in reserves. Between December 2014
and March 2016, international reserves contracted by 41 percent in CFA francs. By end-March 2016,
reserve coverage dropped to 3.9 months of prospective imports, below what is considered adequate
(5 months) for a resource-rich monetary union with a fixed exchange rate.1 Staff projects that,
without policy adjustment, reserve coverage could shrink in 2016 to a decade low. Staff urged a
stronger CEMAC-wide policy mix (e.g., fiscal retrenchment; end to monetary accommodation; and
structural measures) to forestall this.
9. Staff reiterated its call for the repatriation of foreign assets and improved reserve
management. In a context of falling foreign assets, within and outside CEMAC, member states and
their agencies (e.g., national oil companies) should repatriate them to support the Community’s
external viability. The BEAC has made efforts to improve the management and performance of its
reserves to encourage member states to comply with regional repatriation regulations. However, the
current outlook requires additional measures, such as those recommended by the 2015 Financial
Sector Assessment Program (FSAP). These include: (i) the definition of the optimal level of
reserves; (ii) a better reserve portfolio structure to meet new liquidity requirements; and (iii) a new
method to manage member states’ deposits and ensure that foreign reserves are backed by long-
term resources (Selected Issues Paper—SIP—1). Higher remuneration of reserves should increase
incentives for foreign asset repatriation.
1 “Assessing Reserves Adequacy”, IMF Policy Paper, February 2011; and “Assessing Reserves Adequacy—Specific
Proposals”, IMF Policy Paper, April 2015.
CEMAC
8 INTERNATIONAL MONETARY FUND
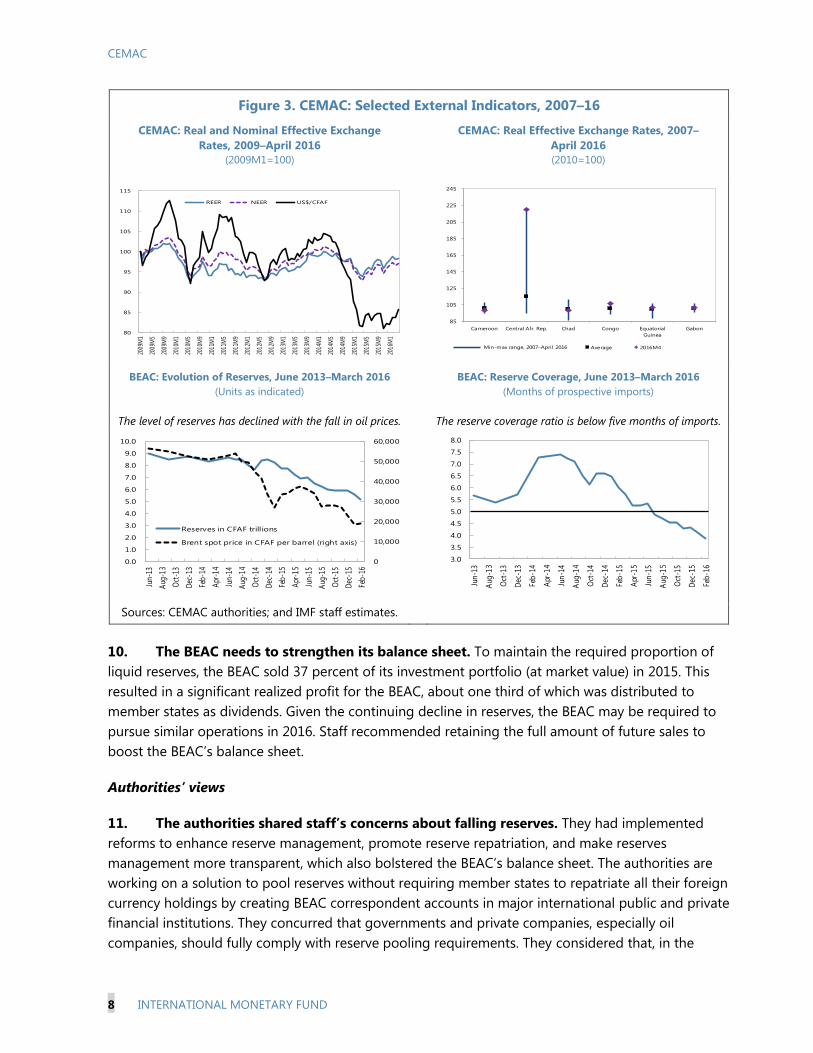
Figure 3. CEMAC: Selected External Indicators, 2007–16
CEMAC: Real and Nominal Effective Exchange
Rates, 2009–April 2016
(2009M1=100)
CEMAC: Real Effective Exchange Rates, 2007–
April 2016
(2010=100)
BEAC: Evolution of Reserves, June 2013–March 2016
(Units as indicated)
BEAC: Reserve Coverage, June 2013–March 2016
(Months of prospective imports)
The level of reserves has declined with the fall in oil prices. The reserve coverage ratio is below five months of imports.
Sources: CEMAC authorities; and IMF staff estimates.
10. The BEAC needs to strengthen its balance sheet. To maintain the required proportion of
liquid reserves, the BEAC sold 37 percent of its investment portfolio (at market value) in 2015. This
resulted in a significant realized profit for the BEAC, about one third of which was distributed to
member states as dividends. Given the continuing decline in reserves, the BEAC may be required to
pursue similar operations in 2016. Staff recommended retaining the full amount of future sales to
boost the BEAC’s balance sheet.
Authorities’ views
11. The authorities shared staff’s concerns about falling reserves. They had implemented
reforms to enhance reserve management, promote reserve repatriation, and make reserves
management more transparent, which also bolstered the BEAC’s balance sheet. The authorities are
working on a solution to pool reserves without requiring member states to repatriate all their foreign
currency holdings by creating BEAC correspondent accounts in major international public and private
financial institutions. They concurred that governments and private companies, especially oil
companies, should fully comply with reserve pooling requirements. They considered that, in the
80
85
90
95
100
105
110
115
2009
M1
2009
M5
2009
M9
2010
M1
2010
M5
2010
M9
2011
M1
2011
M5
2011
M9
2012
M1
2012
M5
2012
M9
2013
M1
2013
M5
2013
M9
2014
M1
2014
M5
2014
M9
2015
M1
2015
M5
2015
M9
2016
M1
REER NEER US$/CFAF
85
105
125
145
165
185
205
225
245
Cameroon Central Afr. Rep. Chad Congo Equatorial
Guinea
Gabon
Average 2016M4Min-max range, 2007–April 2016
0
10,000
20,000
30,000
40,000
50,000
60,000
0.0
1.0
2.0
3.0
4.0
5.0
6.0
7.0
8.0
9.0
10.0
Jun
-13
Aug
-13
Oct
-13
Dec
-13
Feb
-14
Apr
-14
Jun
-14
Aug
-14
Oct
-14
Dec
-14
Feb
-15
Apr
-15
Jun
-15
Aug
-15
Oct
-15
Dec
-15
Feb
-16
Reserves in CFAF trillions
Brent spot price in CFAF per barrel (right axis)
3.0
3.5
4.0
4.5
5.0
5.5
6.0
6.5
7.0
7.5
8.0
Jun
-13
Aug
-13
Oct
-13
Dec
-13
Feb
-14
Apr
-14
Jun
-14
Aug
-14
Oct
-14
Dec
-14
Feb
-15
Apr
-15
Jun
-15
Aug
-15
Oct
-15
Dec
-15
Feb
-16

CEMAC
INTERNATIONAL MONETARY FUND 9
event of a dramatic fall in reserves, the French Treasury’s guarantee will protect the peg.2 To ensure
compliance with their obligations vis-à-vis the French Treasury, they conducted regular asset sales to
match their liquidity needs in foreign currencies.
B. Urgency of Fiscal Consolidation
12. In the presence of a fixed exchange rate regime and weak monetary policy
transmission, policies to counter the oil-price shock need to focus on fiscal consolidation and
real-economy reforms.3 Staff analysis suggests that adjustment through fiscal consolidation is most
appropriate in the case of commodity exporters with a fixed exchange rate regime. National fiscal
policies ranged from fairly conservative (Gabon’s overall fiscal deficit in 2015 was 1 percent of GDP)
to loose (Congo had a deficit of 18 percent of GDP). Staff considered that regional macroeconomic
stability required CEMAC-wide fiscal retrenchment. Given the expected duration of the oil-price
shock and low public savings, staff recommended that regional authorities urge their national
counterparts to take measures to increase non-oil revenue and rein in spending. Staff urged an
expansion of tax bases to move toward the CEMAC objective of non-oil revenue of 17 percent of
GDP. Fiscal consolidation should focus on the quality of expenditure, preserve priority social
spending (e.g., education, health) and finishing infrastructure projects, which are well advanced and
demonstrably support development.
13. The capacity of commercial banks to finance budget deficits may have reached its
limits. Although some banks have ample liquidity—including because of the recent halving of the
reserve requirement—prudential regulations constrain government financing beyond the short term.
Recent stress tests by staff highlight that without an additional increase in banks’ capital, it would be
risky for them to increase sovereign lending.
14. Staff emphasized the need to contain debt (Figure 4). Regional authorities should urge
member countries to adopt cautious debt policies and borrow on concessional terms to the extent
possible. Indeed, member countries have limited access to international financial markets, except at
prohibitive rates. Rapid accumulation of debt would only delay fiscal adjustment and would lower
regional reserves when new external debt service kicks in (SIP 2). The BEAC should consider creating
a regional debt issuance agency, similar to West Africa’s UMEOA Titres, to improve the efficiency of
regional debt markets.
15. Staff presented a “moderate adjustment” scenario and a “no adjustment”
scenario (Text Table 1). In the moderate adjustment scenario, staff assumed—in line with
declarations by several CEMAC governments—that countries would adopt limited adjustment
policies to support macroeconomic stability. Some structural reforms would be implemented to spur
non-oil growth focusing on enhancing the business climate and private investment growth, including
2 Articles 5 and 6 of the Convention between the BEAC and France (signed in 1973 and last revised in 2014), authorize
financing overdrafts in BEAC’s operations account at the French Treasury.
3 On the assessment of monetary policy transmission channels, see SIP 2, “Macrofinancial Linkages and the
Effectiveness of Monetary Policy” in the 2015 CEMAC Regional Consultation Report (15/308).

CEMAC
10 INTERNATIONAL MONETARY FUND
streamlining regulation, promoting tax harmonization, and improving intra-Community trade
facilitation. Conversely, the no adjustment scenario envisaged a continuation of current policies,
which lead to a deterioration in the regional economic outlook, with reserves falling to low levels.4,5
Figure 4. CEMAC: External Debt Developments, 2014–16
Regional external debt continues to grow briskly.
Two thirds of the regional external debt is non-
concessional.
CEMAC: Stocks of External Debt, 2014–16
(Percent of GDP)
CEMAC: External Debt Breakdown, End–2014
(Percent)
Sources: CEMAC authorities; and IMF staff estimates and projections.
Authorities’ views
16. The authorities concurred with staff on the challenging economic outlook. They agreed
on the need to encourage fiscal consolidation at the country level, but noted that regional
authorities could not impose fiscal discipline on member states. They opined that staff’s oil-price
projections were too pessimistic and thus could overestimate the size of the required fiscal
adjustment. They reiterated that countries were aware of the need for adjustment, but if needed,
they could raise additional financing given that regional financial markets still had the capacity to
absorb additional public debt. The BEAC’s plans to revitalize regional debt markets would also
support this. They saw the creation of a regional public debt issuing institution as useful in the long
term, but they felt there were more appropriate measures in the near term (e.g., better coordination
among national Treasuries to plan debt issuances; harmonization of procedures in regional
depositories; stronger competition among market participants).
4 Under this scenario, reserves stabilize in the medium term because of the recovery in oil prices and a surge in oil
production in Congo. However, in the absence of reforms, Dutch disease effects would perpetuate repressed growth,
high un(der)employment, and poverty.
5 Non-oil growth is pulled by large infrastructure programs in the region. A number of major infrastructure projects
will come on stream starting in 2017, which will contribute to non-oil growth. However, this development model is
based on sizable, non-concessional borrowing, and thus it will be difficult to sustain beyond the medium term. In the
alternative scenario, CEMAC countries may be forced to make a more abrupt adjustment, which could entail
suspensions or delays in public investment projects, which will have a negative impact on non-oil growth.
0
5
10
15
20
25
30
35
40
45
50
2014 2015 2016
Cameroon
Central Afr. Rep.
Chad
Congo
Gabon
Equatorial Guinea
1.7
7.6
10.2
6.9
32.4
41.1
IMF
IDA
Other multilateral
Bilateral Paris club
Other bilateral
Commercial debt

CEMAC
INTERNATIONAL MONETARY FUND 11
Text Table 1. CEMAC: Economic Outlook Scenarios, 2016–21
(Units as indicated)
2016 2017 2018 2019 2020 2021
GDP growth
(In percent)
Moderate adjustment scenario 1.9 3.3 3.8 4.1 3.4 3.7
No adjustment scenario 2.5 3.4 2.9 3.5 2.9 3.2
Of which: non-oil growth
(In percent)
Moderate adjustment scenario 2.7 4.1 4.3 4.5 4.5 4.5
No adjustment scenario 3.1 4.1 3.4 3.9 4.0 4.0
Overall budget deficit
(In percent of regional GDP)
Moderate adjustment scenario -6.8 -5.0 -4.1 -2.9 -2.7 -2.3
No adjustment scenario -8.6 -6.9 -5.8 -3.7 -3.4 -3.1
External current account deficit
(In percent of regional GDP)
Moderate adjustment scenario -7.7 -5.2 -4.7 -4.0 -3.6 -3.1
No adjustment scenario -8.3 -6.3 -5.7 -4.1 -3.7 -3.1
Reserve coverage ratio
(In months of prospective imports)
Moderate adjustment scenario 3.4 3.3 3.2 3.3 3.5 3.9
No adjustment scenario 3.3 2.7 2.5 2.4 2.4 2.4
Source: IMF staff projections.
C. A New Convergence Framework for Regional Stability
17. The economic downturn underscores the need to overhaul the regional convergence
framework (Table 8). In late 2015, the CEMAC Commission presented a revised framework, to enter
into force on January 1, 2017. The new framework includes a number of innovative features,
including (i) a new fiscal rule based on a three-year average overall budget deficit; (ii) a public deficit
ceiling, reinforced with a debt break; (iii) a revised inflation criterion; and (iv) additional secondary
criteria (Box 1). The Commission is exploring options to include a budgetary savings mechanism to
help build buffers for future commodity shocks.
18. Staff welcomed the adoption of the new framework as an important step for
strengthening macroeconomic surveillance. Although the framework does not fully reflect staff's
earlier advice, it nonetheless constitutes progress in restraining the pace of debt accumulation.6 Staff
considered that because of the difficulties in monitoring certain criteria (e.g., non-accumulation of
arrears), the new framework should be complemented by a strengthened monitoring mechanism for
6 Staff had advocated lowering the 70 percent ceiling of total debt to GDP.

CEMAC
12 INTERNATIONAL MONETARY FUND
primary and secondary criteria, including a mandate for the Commission to validate the data
submitted. This would require strong political support and adequate resources. Staff supported
creating a fiscal savings mechanism.
Box 1. CEMAC: New Convergence Framework
Budget rule A new fiscal rule, based on the overall balance with an oil revenues savings rule.
Rule = (𝑂𝑣𝑒𝑟𝑎𝑙𝑙 𝐵𝑎𝑙𝑎𝑛𝑐𝑒)/𝐺𝐷𝑃 − 𝛼 (𝑜𝑖𝑙 𝑟𝑒𝑣𝑒𝑛𝑢𝑒𝑠 )/𝐺𝐷𝑃
Parameter α will be the agreed share of oil revenues to be saved for each
country. The new rule will be based on three-year averages to smooth short-
term fluctuations.
Debt ceiling A debt criterion, based on total public debt over GDP, with a ceiling
of 70 percent. A new mechanism will assess the difference between the three-
year average debt levels with respect to a long-term norm and should limit
rapid debt accumulation.
Inflation New criterion using the three-year average instead of the yearly index.
Accumulation of arrears No change (i.e., no arrears are allowed).
19. Staff encouraged the authorities to enhance regional policy coordination and
harmonization. One element would be the implementation of a structural budget-balance rule
which requires, inter alia, comprehensive data, technical forecasting capacity, and the ability to
analyze sector linkages and business cycles (SIP 3). Because these take time to develop, the short-
term priority should be meeting the new fiscal criterion. Implementing the six regional public finance
management (PFM) directives would also enhance coordination (SIP 4). Similarly, CEMAC authorities
should promote harmonized tax policies to reduce dependence on foreign trade in favor of broad-
based domestic taxes. This is particularly important, as international trade negotiations will lower
custom tariffs (see infra).
Authorities’ views
20. The CEMAC Commission indicated that the new framework will be brought to CEMAC
Heads of State for endorsement. Although the new framework had already been adopted by the
ministers of finance, its approval by the presidents would reinforce its legitimacy. The approval would
also help the implementation of new mechanisms, such as the budgetary savings instrument. To
strengthen monitoring, the Commission would enhance cooperation with the BEAC to share
macroeconomic data. The Commission was making a determined effort working with national
authorities to have the CEMAC PFM directives incorporated into national legislation. They expected
significant progress by end-2017.

CEMAC
INTERNATIONAL MONETARY FUND 13
D. A Monetary Policy Reaching its Limits
21. The BEAC has implemented an accommodative monetary policy. It has used direct and
indirect monetary tools to support member states. First, it reversed its previous policy of gradual
elimination of “statutory advances” (i.e., unconditional budget lending) in August 2015, and re-
instituted them at their statutory level, which resulted in a 52 percent increase in such advances
CEMAC-wide. Second, the BEAC approved exceptional additional advances to CAR and
Chad (50 percent of their statutory ceiling). Currently only Cameroon is below its statutory
ceiling (Figure 5).7 Third, the BEAC also lowered its refinancing rate repeatedly and raised
government paper refinancing ceilings for commercial banks. Forth, in April 2016, it halved the
reserve requirement ratio, releasing the equivalent of one-fifth of outstanding statutory advances in
additional bank liquidity.
Figure 5. CEMAC: Monetary Developments, 2016
Statutory advances have increased significantly. The region has a net debtor position with the BEAC.
BEAC: Statutory Advances, End-March 2016
(Billions of CFA francs).
BEAC: Governments’ Net Position, End-February 2016
(Billions of CFA francs)1/
Sources: CEMAC authorities; and IMF staff estimates.
22. Staff considered that the accommodative monetary policy had reached its limits and
had contributed to the loss of reserves. Staff considered that the extent of past monetary
financing was not justified based on ex post regional output gap estimations. Indeed, four countries,
representing some 85 percent of regional GDP, had positive or virtually no output gaps (Figure 6).
Monetary stimulation in this context was likely to stoke inflationary and exchange rate pressures.
Moreover monetary financing not only delayed fiscal consolidation, but also hindered the
development of regional financial markets (SIP 5); limited monetary transmission; and undermined
the effectiveness of new monetary policy instruments developed by the BEAC.8 In addition, staff
wondered whether the BEAC would be able to rescind this policy swiftly if needed. Staff
7 The ceiling for statutory advances is set at 20 percent of the previous year’s fiscal revenue.
8 BEAC will manage liquidity based on money market needs.
0
500
1,000
1,500
2,000
2,500
3,000
Statutory adv. ceilings
Use of statutory adv.
Available funding
-500
-400
-300
-200
-100
0
100
200
300
400
1/ A negative sign denotes a debtor position with respect to BEAC.
Equatorial
Guinea CEMAC
Central
Afr. Rep. Chad

CEMAC
14 INTERNATIONAL MONETARY FUND
recommended the freezing of statutory advances at their current level, pending a resumption of their
gradual elimination when circumstances allow.9 Staff also recommended that the BEAC resist indirect
monetary financing, such as raising refinancing ceilings of commercial banks or granting additional
financing to the regional development bank (BDEAC). These two recommendations are consistent
with lower broad money and credit to the economy in 2015 than the year before. Staff explained
adoption of these recommendations would send a strong signal to member states on the need for
fiscal adjustment to buttress the exchange rate.
Figure 6. CEMAC: Output Gap, 1990–2015
CEMAC’s output gap did not seem to support the
implementation of accommodative monetary policy. Only two countries representing some 15 percent of
regional GDP had negative output gaps in 2015.
CEMAC: Output Gap,1990–20151/
(Billions of CFA francs)
CEMAC: Output Gap, 2015
(Percent)
1/ Output gap estimared using a Hodrick–Prescott decomposition.
Sources: CEMAC authorities; and IMF staff estimates.
23. Staff urged the BEAC to pursue the development of its monetary policy instruments. It
noted the progress in bolstering interbank transactions and establishing a liquidity forecasting
framework. Given that the monetary transmission channel remains weak, the BEAC should accelerate
reforms (e.g., reserve management), with the help of IMF technical assistance, and strengthen its
capacity to conduct monetary policy operations. Staff supported the BEAC’s decision—to be
implemented soon—to standardize the rates of reserve requirements across banks. It argued,
however, against the introduction of computational changes, which could, in practice, exacerbate
excess liquidity (by excluding assets below certain thresholds from reserve requirements). Staff also
supported the decision to stop injecting and withdrawing liquidities simultaneously, as this improves
the transparency of monetary policy and of the interbank money market.
9 Staff understands that if this recommendation was implemented, Cameroon could be considered to be penalized
vis-à-vis its peers because of its restraint in making use of statutory advances.
0
5,000
10,000
15,000
20,000
25,000
30,000
35,000
1990 1992 1994 1996 1998 2000 2002 2004 2006 2008 2010 2012 2014 -14.0
-12.0
-10.0
-8.0
-6.0
-4.0
-2.0
0.0
2.0
4.0
6.0
Cameroon Chad Congo Gabon CEMAC
Central
Afr. Rep.
Equatorial
Guinea
CEMAC
INTERNATIONAL MONETARY FUND 15
Authorities’ views
24. The authorities emphasized they could not remain passive while member governments
were confronting a severe exogenous shock. They considered supporting members’ budget
positions in the current exceptional circumstances as part of their mandate. They argued that
members’ ongoing infrastructure projects needed to continue to sustain development plans. They
saw their accommodative monetary policy as similar to those implemented by other central banks,
confronted with similar trying circumstances.
25. The authorities emphasized progress in reforming monetary policy instruments. They
considered their recent decisions on monetary instruments as increasing the effectiveness of
monetary policy. In particular, a new repo contract, to be put in place in the second half of 2016,
should reduce credit risk in interbank operations and support the development thereof. They were
cognizant, however, of the limitations imposed by the challenging business climate on the
development of the interbank and debt markets.
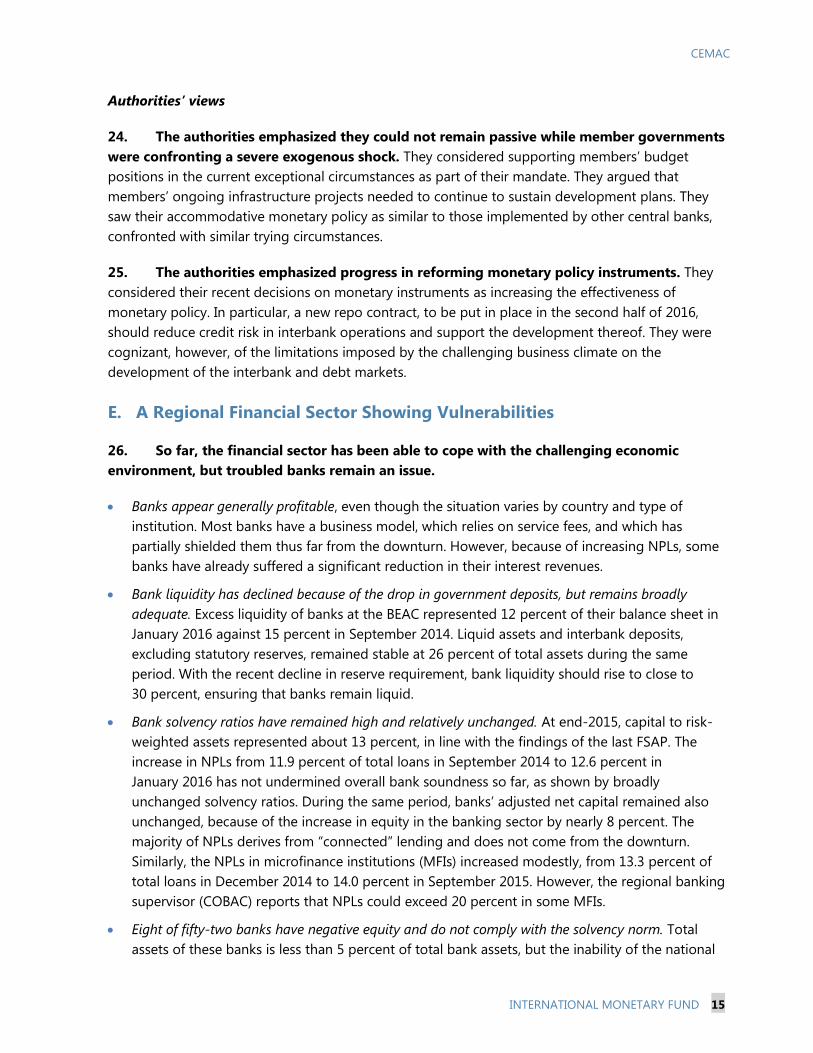
E. A Regional Financial Sector Showing Vulnerabilities
26. So far, the financial sector has been able to cope with the challenging economic
environment, but troubled banks remain an issue.
Banks appear generally profitable, even though the situation varies by country and type of
institution. Most banks have a business model, which relies on service fees, and which has
partially shielded them thus far from the downturn. However, because of increasing NPLs, some
banks have already suffered a significant reduction in their interest revenues.
Bank liquidity has declined because of the drop in government deposits, but remains broadly
adequate. Excess liquidity of banks at the BEAC represented 12 percent of their balance sheet in
January 2016 against 15 percent in September 2014. Liquid assets and interbank deposits,
excluding statutory reserves, remained stable at 26 percent of total assets during the same
period. With the recent decline in reserve requirement, bank liquidity should rise to close to
30 percent, ensuring that banks remain liquid.
Bank solvency ratios have remained high and relatively unchanged. At end-2015, capital to risk-
weighted assets represented about 13 percent, in line with the findings of the last FSAP. The
increase in NPLs from 11.9 percent of total loans in September 2014 to 12.6 percent in
January 2016 has not undermined overall bank soundness so far, as shown by broadly
unchanged solvency ratios. During the same period, banks’ adjusted net capital remained also
unchanged, because of the increase in equity in the banking sector by nearly 8 percent. The
majority of NPLs derives from “connected” lending and does not come from the downturn.
Similarly, the NPLs in microfinance institutions (MFIs) increased modestly, from 13.3 percent of
total loans in December 2014 to 14.0 percent in September 2015. However, the regional banking
supervisor (COBAC) reports that NPLs could exceed 20 percent in some MFIs.
Eight of fifty-two banks have negative equity and do not comply with the solvency norm. Total
assets of these banks is less than 5 percent of total bank assets, but the inability of the national

CEMAC
16 INTERNATIONAL MONETARY FUND
and regional authorities to close them remains an issue and sends the wrong signal to the
financial sector.
27. Staff noted that banks appeared to have weathered the economic downturn thus far,
but vulnerabilities were increasing. These stem partly from delayed government payments to the
private sector, and specifically the construction sector, which is heavily indebted to domestic banks.
For instance, in Equatorial Guinea, credit to the construction sector represented 57 percent of gross
bank loans at end January 2016. Recent stress tests showed that macroeconomic risks had increased
in three countries, compared to the findings of the last FSAP. Tests show that if the oil price shock
further spreads in the real economies, bank solvency will deteriorate. To assess this risk, the COBAC
should run additional stress tests for all member countries.
28. Staff emphasized the importance of the effectiveness of the microprudential
framework to prevent the spreading of macrofinancial risks (Annex V). Given the importance of
direct and indirect links between the public and financial sectors, ongoing reforms of the
microprudential framework are critical to ensure financial stability. Progress has been made following
the 2015 FSAP recommendations, especially in the treatment of connected loans; cross-border
supervision; and treatment of NPLs. Additional efforts are necessary to implement the remaining
FSAP recommendations (Annex IV). Staff encouraged the COBAC to increase the solvency ratio for
systematically important banks, and develop bank supervision on a consolidated basis. Staff
supported the COBAC’s efforts to enhance its supervisory framework through an effective risk-based
supervision, focusing on liquidity and foreign exchange risks.
29. Staff encouraged the BEAC to develop its macroprudential framework. The analytical
tools and institutional capacities needed upgrading to deal with the current economic challenges.
The BEAC had created a Financial Stability Committee (FSC) in 2012, but the Committee's first
working meeting took place only in April 2015. The Committee’s analytical agenda is ambitious, but
constrained by the lack of macrofinancial data. The current approach of “expert judgment” does not
provide a detailed risk mapping, but is a critical step in the design of vulnerability indicators.
30. Staff noted the improvement in bank supervision, following the hiring of new staff.
However, following FSAP recommendations, a number of additional measures should be
implemented to align COBAC’s supervisory framework better with the specificities of CEMAC. Given
the banks’ varying risk profiles, it would be advisable to implement the Basel Pillar II approach, to
allow the COBAC to adjust capital requirements to banks’ risk profiles. To reflect the weakness of
some guarantees or collaterals for loans, the COBAC should increase risk weights applied to these
assets for the calculation of the solvency ratio, to reflect more accurately the associated risk. Finally,
the BEAC and national authorities should agree on resolving troubled banks in a timely manner.
31. Staff welcomed progress in the supervision of MFIs. The COBAC launched e-Sesame, a
data collection system to improve financial information. In addition, increased staffing at the
COBAC’s microfinance department should allow closer monitoring and more frequent inspections.
The COBAC plans to update prudential regulation to raise the minimum capital requirement for MFIs
and restrict lending to non-members. Staff noted, however, that strengthening governance within
MFIs requires a more effective judicial system and more resolute prosecution of fraud.

CEMAC
INTERNATIONAL MONETARY FUND 17
32. Staff advised promoting financial inclusion. The BEAC, working in tandem with national
authorities, should facilitate small and medium-size enterprises’ (SMEs) and households’ access to
credit. With the increase in credit risk of public and construction companies, banks are looking for
new customers, particularly SMEs. However, the lack of financial transparency, accounting reliability,
and governance problems of SMEs hinder credit growth. Staff noted that mobile banking had been
growing rapidly because of recent changes to the legal framework for issuing electronic money. This
development should be supported by appropriate regulation and enhanced supervision.
Authorities’ views
33. The authorities agreed with staff’s assessment of the financial sector. They concurred
that banks were only moderately affected by the economic downturn, because of their business
model. They noted that some banks had strengthened their equity position. Nonetheless, they
remained vigilant and were following closely the situation of the banking sector and stood ready, if
needed, to implement contingency plans, such as appointing interim administrators for problem
banks. They emphasized that the recent increase in COBAC’s staffing (34 new executives) would
enable closer supervision and more on-site visits to banks and MFIs.
34. The authorities concurred with staff’s assessment of macrofinancial linkages. They
agreed that enhanced microprudential supervision should be a priority and that a proper
macroprudential framework should be in place to support financial sector development. They were
committed to strengthening regulations with transnational supervision on a consolidated basis;
implementation of Basel II Pillar II; and enhanced cooperation among regional financial institutions
through the FSC.
F. Strengthening Regional Institutions
35. Uncertain economic prospects should encourage regional and national authorities to
strengthen CEMAC institutions and work together more closely. Several institutions lack
appropriate human and financial resources and countries do not coordinate policies with significant
regional impact (e.g., public investment programs, taxation). Efficient regional institutions could
support efforts to diversify growth, improve budget management, and promote financial sector
development. The CEMAC Commission should work with national governments to improve the
business environment and to promote private investment and economic diversification. Similarly, the
BDEAC should take the lead in coordinating regional infrastructure projects.
36. Staff noted progress in the implementation of the BEAC’s safeguards reforms. In early
May 2016, the BEAC’s Board of Directors mandated the institution to initiate work on improving
governance and transitioning to International Financial Reporting Standards (IFRS). This decision met
two principal requirements the 2016 IMF Finance Department’s (FIN) safeguards mission (see
companion FIN report).
37. Staff welcomed the COBAC’s strengthened operational capacity. The regional supervisor
had more than doubled the number of its inspectors and deployed a new financial information
system. However, more efforts are needed to strengthen the quality of financial reporting and

CEMAC
18 INTERNATIONAL MONETARY FUND
financial sector statistics. Similarly, the COBAC should accelerate the adoption of stricter regulations
on connected loans and on the supervision of MFIs.
38. Staff observed that the CEMAC Commission still faced major challenges. The
Commission has been displaced from its headquarters since 2013, which is hindering its operational
capacity. Despite its constraints, it persevered in launching important reforms, including the adoption
of a new regional surveillance framework; the harmonization of national policies to reduce non-tariff
barriers to intra-regional trade; and integration of national customs policies into a common regional
policy. With the coming into force of the Economic Partnership Agreement (EPA) between Cameroon
and the European Union in August 2016, a region-wide EPA would be necessary to avoid the risk of
tariff dismantling between Cameroon and the European Union undermining intra-regional trade.
Staff encouraged the Commission to coordinate efforts with member states to improve the business
climate and ensure free movement of goods and people.
39. Staff noted that BDEAC envisions becoming a key regional development institution.
Following its 2014 capital increase, the BDEAC is implementing reforms, while expanding its
investment activities. Besides the harmonization of its management and operating procedures with
best international practices, the Bank must increase its support to the design, financing, and
implementation of regional investment projects, including in the form of public-private
partnerships (PPPs).
40. Staff called for a more robust regional legal framework against money laundering and
terrorist financing (AML/CFT), aligned with the 2012 Financial Action Task Force (FATF) standard.10
Resources need to be mobilized to ensure an effective implementation of AML/CFT risk-based
supervision by the COBAC and the enforcement of AML/CFT requirements. GABAC, the recently
recognized FATF-style regional body for Central Africa, is now working with the FATF global network
to combat money laundering and terrorist financing, assess the compliance of its members against
the FATF standard, and provide technical assistance.
41. Sound statistical information is important for policy implementation. Although
commendable efforts have been made in the preparation of financial soundness indicators, progress
is hampered by the lack of resources at the BEAC and national statistics offices. This is compounded
by challenges in the coordination between regional and national institutions. To enhance data
provision, the BEAC could consider implementing a system for preparing and sharing statistics,
similar to that in use at the West African regional bank.
Authorities’ views
42. The authorities considered that the BEAC’s modernization and reform plan was all but
completed. They noted that efforts were still needed in the upgrading of information and budget
management systems.
10 The FATF is an inter-governmental body whose objectives are to set standards and promote effective
implementation of legal, regulatory, and operational measures for combating AML/CFT.

CEMAC
INTERNATIONAL MONETARY FUND 19
43. The Commission and the BDEAC noted that they were addressing challenges on many
fronts. The Commission’s operational capacity is constrained by the lack of permanent headquarters
and the absence of a common position among member states on key issues, such as the EPA or the
reform of the regional business climate. The Commission noted that any regional EPA agreement
should recognize the level of economic development of each member state. The BDEAC authorities
concurred with the need to streamline and improve PPP legislation. They are preparing a new
regional investment strategy; seeking an independent financial rating; and raising funds for regional
projects.
44. The authorities stressed that they made considerable efforts to improve regional
statistics. The BEAC had almost completed a database of regional economic and financial data,
which should be operational later in 2016. They noted, however, the difficulties in collating data at
national level because of the paucity of data in some member countries.
STAFF APPRAISAL
45. CEMAC’s economic situation has deteriorated markedly and the medium-term outlook
entails significant risks. The oil-price shock has taken a toll on the oil-producing Community.
Scaling down of public investment and the lack of economic diversification could have lasting
developmental consequences and affect the most vulnerable parts of the population. Insufficient
policy response to the oil-price and security shocks could undermine regional macroeconomic
stability.
46. The policy response to the oil-price shock needs to be firmed up. Fiscal policy is the most
appropriate tool to address structural shocks for commodity exporters with a fixed exchange rate. In
the absence of sufficient buffers, the fiscal response to the oil revenue loss and increased security
spending has been insufficient. The BEAC’s accommodative monetary policy has reached its limits
and has delayed fiscal adjustment. Foreign reserves have dropped and are expected to stay below
recommended levels in the medium term. These levels may be insufficient to withstand a further
decline in oil prices or another exogenous shock. The BEAC should make progress in ensuring full
compliance with the reserves pooling requirement by member states and government agencies.
Against this background, staff recommended a freezing of statutory advances at their current level,
pending a resumption of their gradual elimination when circumstances allow, and to adopt a
cautious debt policy.
47. The new convergence framework can help strengthen regional macroeconomic
management. it constitutes progress. However, its criteria call for a reinforced monitoring
mechanism, involving regional and national authorities. Staff supports the Commission's plan to
create a fiscal savings mechanism to cope with future revenue shocks. CEMAC authorities should
strengthen regional coordination and harmonization, including the implementation of the six CEMAC
PFM directives.
CEMAC
20 INTERNATIONAL MONETARY FUND
48. The financial sector appears to have weathered the oil-price shock so far. Most
vulnerabilities reflect internal governance challenges more than the economic downturn. However,
emerging government payment delays could undermine the banking sector.
49. An effective microprudential framework is essential to prevent the spread of
macrofinancial risks. Direct and indirect links between the public and the banking sectors can
propagate risks and affect macrofinancial stability. Progress has been made following the 2015 FSAP
recommendations, especially in the treatment of connected loans; cross-border supervision; and
treatment of NPLs. Others still need implementation. Staff encouraged the COBAC raising the
solvency ratio for systematically important banks; developing bank supervision on a consolidated
basis; and implementing an effective risk-based supervision.
50. Liquidity in the banking sector remains ample, especially in the wake of the recent
reduction of the reserve requirement ratio. The BEAC has developed new monetary policy
framework instruments, which should be put in place in late 2016. However, excessive liquidity and
the lack of sufficiently deep interbank and debt markets hamper monetary transmission. The impact
of this liquidity on prices and foreign exchange markets needs to be monitored carefully. The BEAC
should finalize its lender of last resort framework to address specific liquidity needs.
51. After delays, the BEAC made some progress in the implementation of outstanding
safeguards recommendations. The BEAC’s Board of Directors decision to initiate governance
reform and the transition toward IFRS are important steps for the successful completion of
safeguards reform.
52. Regional and national authorities should promote regional integration by
strengthening CEMAC institutions. Efficient regional institutions could support efforts to diversify
growth, enhance public policy coordination, and promote financial sector development. Several
institutions lack human and financial resources to contribute effectively to the creation of an
integrated common market.
53. Shortcomings in regional statistics remain a concern. Although regional authorities (the
BEAC and the COBAC) have made efforts to improve the quality of key economic information,
important gaps remain. In the current economic context, timely and quality statistical information is
essential for policy implementation.
54. The discussions with the CEMAC authorities will remain on a 12-month cycle in
accordance with Decision No.13654-(06/1), adopted on January 6, 2006.
CEMAC
INTERNATIONAL MONETARY FUND 21
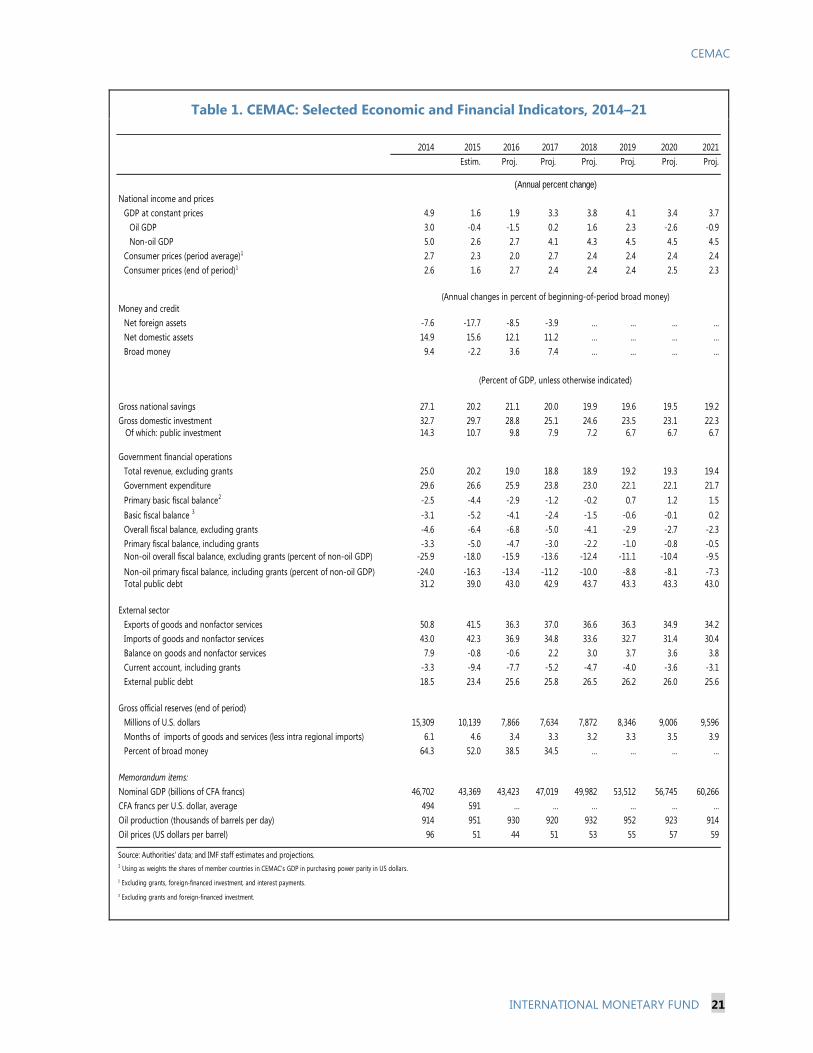
Table 1. CEMAC: Selected Economic and Financial Indicators, 2014–21
2014 2015 2016 2017 2018 2019 2020 2021
Estim. Proj. Proj. Proj. Proj. Proj. Proj.
National income and prices
GDP at constant prices 4.9 1.6 1.9 3.3 3.8 4.1 3.4 3.7
Oil GDP 3.0 -0.4 -1.5 0.2 1.6 2.3 -2.6 -0.9
Non-oil GDP 5.0 2.6 2.7 4.1 4.3 4.5 4.5 4.5
Consumer prices (period average)1 2.7 2.3 2.0 2.7 2.4 2.4 2.4 2.4
Consumer prices (end of period)1 2.6 1.6 2.7 2.4 2.4 2.4 2.5 2.3
Money and credit
Net foreign assets -7.6 -17.7 -8.5 -3.9 … … … …
Net domestic assets 14.9 15.6 12.1 11.2 … … … …
Broad money 9.4 -2.2 3.6 7.4 … … … …
Gross national savings 27.1 20.2 21.1 20.0 19.9 19.6 19.5 19.2
Gross domestic investment 32.7 29.7 28.8 25.1 24.6 23.5 23.1 22.3
Of which: public investment 14.3 10.7 9.8 7.9 7.2 6.7 6.7 6.7
Government financial operations
Total revenue, excluding grants 25.0 20.2 19.0 18.8 18.9 19.2 19.3 19.4
Government expenditure 29.6 26.6 25.9 23.8 23.0 22.1 22.1 21.7
Primary basic fiscal balance2
-2.5 -4.4 -2.9 -1.2 -0.2 0.7 1.2 1.5
Basic fiscal balance 3
-3.1 -5.2 -4.1 -2.4 -1.5 -0.6 -0.1 0.2
Overall fiscal balance, excluding grants -4.6 -6.4 -6.8 -5.0 -4.1 -2.9 -2.7 -2.3
Primary fiscal balance, including grants -3.3 -5.0 -4.7 -3.0 -2.2 -1.0 -0.8 -0.5
Non-oil overall fiscal balance, excluding grants (percent of non-oil GDP) -25.9 -18.0 -15.9 -13.6 -12.4 -11.1 -10.4 -9.5
Non-oil primary fiscal balance, including grants (percent of non-oil GDP) -24.0 -16.3 -13.4 -11.2 -10.0 -8.8 -8.1 -7.3
Total public debt 31.2 39.0 43.0 42.9 43.7 43.3 43.3 43.0
External sector
Exports of goods and nonfactor services 50.8 41.5 36.3 37.0 36.6 36.3 34.9 34.2
Imports of goods and nonfactor services 43.0 42.3 36.9 34.8 33.6 32.7 31.4 30.4
Balance on goods and nonfactor services 7.9 -0.8 -0.6 2.2 3.0 3.7 3.6 3.8
Current account, including grants -3.3 -9.4 -7.7 -5.2 -4.7 -4.0 -3.6 -3.1
External public debt 18.5 23.4 25.6 25.8 26.5 26.2 26.0 25.6
Gross official reserves (end of period)
Millions of U.S. dollars 15,309 10,139 7,866 7,634 7,872 8,346 9,006 9,596
Months of imports of goods and services (less intra regional imports) 6.1 4.6 3.4 3.3 3.2 3.3 3.5 3.9
Percent of broad money 64.3 52.0 38.5 34.5 … … … …
Memorandum items:
Nominal GDP (billions of CFA francs) 46,702 43,369 43,423 47,019 49,982 53,512 56,745 60,266
CFA francs per U.S. dollar, average 494 591 … … … … … …
Oil production (thousands of barrels per day) 914 951 930 920 932 952 923 914
Oil prices (US dollars per barrel) 96 51 44 51 53 55 57 59
Source: Authorities' data; and IMF staff estimates and projections.1 Using as weights the shares of member countries in CEMAC's GDP in purchasing power parity in US dollars.
2 Excluding grants, foreign-financed investment, and interest payments.
3 Excluding grants and foreign-financed investment.
(Annual percent change)
(Annual changes in percent of beginning-of-period broad money)
(Percent of GDP, unless otherwise indicated)

CEMAC
22 INTERNATIONAL MONETARY FUND
Table 2. CEMAC: Millennium Development Goals, 1990–2015
CEMAC SSA CEMAC SSA
Goal 1: Eradicate extreme poverty and hunger
Employment to population ratio, 15+, total (%) 64 63 67 65
Employment to population ratio, ages 15-24, total (%) 50 49 45 47
GDP per person employed (constant 2011 PPP $) 16,447 6,810 25,517 9,344
Income share held by lowest 20% … … 5 …
Malnutrition prevalence, weight for age (% of children under 5) 18 … 14 …
Poverty gap at $1.25 a day (PPP) (%) … … 34 …
Poverty headcount ratio at $1.25 a day (PPP) (% of population) … … 15 …
Vulnerable employment, total (% of total employment) … … 60 …
Goal 2: Achieve universal primary education
Literacy rate, youth female (% of females ages 15–24) … 58 69 66
Literacy rate, youth male (% of males ages 15–24) … 73 77 76
Persistence to last grade of primary, total (% of cohort) 40 56 52 57
Primary completion rate, total (% of relevant age group) 41 54 56 69
Total enrollment, primary (% net) 65 … 79 77
Goal 3: Promote gender equality and empower women
Proportion of seats held by women in national parliaments (%) 12 … 17 24
Ratio of female to male primary enrollment (%) 72 83 90 93
Ratio of female to male secondary enrollment (%) 52 76 68 86
Ratio of female to male tertiary enrollment (%) 27 52 51 73
Share of women employed in the nonagricultural sector (% of total nonagricultural employment) 13 … … ..
Goal 4: Reduce child mortality
Immunization, measles (% of children ages 12–23 months) 56 57 61 73
Mortality rate, infant (per 1,000 live births) 93 108 62 56
Mortality rate, under-5 (per 1,000) 155 180 91 83
Goal 5: Improve maternal health
Adolescent fertility rate (births per 1,000 women ages 15–19) 163 136 111 103
Births attended by skilled health staff (% of total) 58 … 64 48
Contraceptive prevalence (% of women ages 15–49) 16 16 24 26
Maternal mortality ratio (modeled estimate, per 100,000 live births) 1,045 990 568 547
Pregnant women receiving prenatal care (%) 79 … 80 78
Unmet need for contraception (% of married women ages 15–49) 22 … 26 23
Goal 6: Combat HIV/AIDS, malaria, and other diseases
Incidence of tuberculosis (per 100,000 people) 260 278 290 281
Prevalence of HIV, female (% ages 15–24) 2 2 2 2
Prevalence of HIV, male (% ages 15–24) 1 1 1 1
Prevalence of HIV, total (% of population ages 15–49) 2 2 4 5
Tuberculosis case detection rate (%, all forms) 39 29 64 48
Goal 7: Ensure environmental sustainability
CO2 emissions (kg per PPP $ of GDP) 0 1 0 0
CO2 emissions (metric tons per capita) 1 1 2 1
Forest area (% of land area) 53 31 48 28
Improved sanitation facilities (% of population with access) 21 24 35 30
Improved water source (% of population with access) 50 48 69 68
Marine protected areas (% of territorial waters) 1 3 9 6
Terrestrial protected areas (% of total land area) 8 11 21 15
Goal 8: Develop a global partnership for development
Net ODA received per capita (current US$) 94 35 47 48
Debt service (PPG and IMF only, in % of exports, excluding workers' remittances) 13 … 5 4
Internet users (per 100 people) 0 0 9 19
Mobile cellular subscriptions (per 100 people) 0 0 81 71
Telephone lines (per 100 people) 1 1 1 1
Fertility rate, total (births per woman) 6 6 5 5
Other
GNI per capita, Atlas method (current US dollars) 849 600 4,217 1,646
GNI, Atlas method (current US dollars), billions 21 304 14 1,604
Gross capital formation (% of GDP) 18 18 30 22
Life expectancy at birth, total (years) 52 50 57 59
Literacy rate, adult total (% of people ages 15 and above) 34 53 67 60
Population, total (millions) 25 507 48 974
Trade (% of GDP) 55 50 95 61
1990
Source: World Development Indicators.
2015

CEMAC
INTERNATIONAL MONETARY FUND 23
Table 3. CEMAC: National Accounts, 2014–211/
2014 2015 2016 2017 2018 2019 2020 2021
Estim. Proj. Proj. Proj. Proj. Proj. Proj.
Real GDP
Cameroon 5.9 5.9 4.9 4.6 4.9 4.7 4.7 4.6
Central African Republic 1.0 4.8 5.2 5.5 5.8 5.8 5.8 5.8
Chad 6.9 1.8 -0.4 1.6 5.1 8.2 3.4 3.5
Congo, Republic of 6.8 2.3 1.7 5.0 3.1 2.0 1.7 2.9
Equatorial Guinea -0.3 -12.4 -6.0 -3.4 -2.8 -2.3 -1.8 -0.7
Gabon 4.3 4.0 3.2 4.5 4.7 4.9 5.0 4.9
CEMAC 4.9 1.6 1.9 3.3 3.8 4.1 3.4 3.7
Nominal GDP
Cameroon 6.9 7.9 7.0 6.6 6.9 6.7 6.7 6.7
Central African Republic 12.2 11.3 11.3 11.1 10.9 10.9 10.8 9.3
Chad 7.6 -6.4 -3.9 9.4 6.8 11.9 6.4 6.8
Congo, Republic of 0.5 -21.9 -0.6 14.6 3.5 4.6 3.7 5.0
Equatorial Guinea -9.3 -28.6 -16.3 3.2 0.6 1.1 0.9 2.5
Gabon 3.4 -6.1 2.9 9.0 7.8 7.7 7.5 7.1
CEMAC 2.5 -7.1 0.1 8.3 6.3 7.1 6.0 6.2
Real non-oil GDP
Cameroon 5.6 5.2 5.1 5.1 5.1 5.1 5.0 4.9
Central African Republic 1.0 4.8 5.2 5.5 5.8 5.8 5.8 5.8
Chad 7.1 -2.9 0.5 2.5 3.8 4.3 4.4 4.4
Congo, Republic of 7.9 4.8 0.2 3.2 3.4 3.5 3.6 3.6
Equatorial Guinea -0.5 -3.7 -7.6 -3.7 -1.6 -1.0 -0.5 0.8
Gabon 5.0 4.0 5.4 6.6 5.6 5.8 5.8 5.7
CEMAC 5.0 2.6 2.7 4.1 4.3 4.5 4.5 4.5
Consumer price inflation (period average)
Cameroon 1.9 2.8 2.2 2.2 2.2 2.2 2.2 2.2
Central African Republic 11.6 4.5 4.0 3.5 3.0 3.0 3.0 3.0
Chad 1.7 3.7 0.0 5.2 3.0 3.0 3.0 3.0
Congo, Republic of 0.9 2.0 3.3 2.8 2.6 2.6 2.6 2.4
Equatorial Guinea 4.3 2.2 1.4 1.4 1.5 1.6 1.7 1.8
Gabon 4.5 0.1 2.5 2.5 2.5 2.5 2.5 2.5
CEMAC 2.7 2.3 2.0 2.7 2.4 2.4 2.4 2.4
End-of-period inflation
Cameroon 2.6 2.8 2.2 2.2 2.2 2.2 2.2 2.2
Central African Republic 9.7 4.8 4.0 3.5 3.0 3.0 3.0 3.0
Chad 3.7 -0.3 5.0 3.0 3.0 3.0 3.0 3.0
Congo, Republic of 0.5 2.2 3.1 2.7 2.6 2.6 2.5 2.5
Equatorial Guinea 4.3 1.5 1.4 1.5 1.5 1.6 1.8 1.9
Gabon 1.7 0.1 2.5 2.5 2.5 2.5 2.5 2.5
CEMAC 2.6 1.6 2.7 2.4 2.4 2.4 2.5 2.3
Gross national savings
Cameroon 17.3 16.2 15.6 15.0 14.4 13.1 12.6 12.2
Central African Republic 4.6 4.9 6.9 7.3 8.5 9.6 12.0 13.8
Chad 21.5 14.6 26.4 16.8 18.6 17.6 17.1 17.7
Congo, Republic of 39.6 13.3 23.1 25.9 23.3 22.5 22.4 22.4
Equatorial Guinea 25.0 27.6 20.3 20.5 20.4 21.5 22.1 22.7
Gabon 42.9 33.9 30.9 31.0 32.1 33.4 33.9 31.9
CEMAC 27.1 20.2 21.1 20.0 19.9 19.6 19.5 19.2
Gross domestic investment
Cameroon 21.7 21.8 21.3 20.3 19.4 17.9 17.2 16.4
Central African Republic 10.2 13.9 16.9 17.2 17.9 19.0 19.9 21.0
Chad 30.5 27.0 37.7 24.4 25.9 23.1 23.3 23.5
Congo, Republic of 42.2 33.4 30.0 26.4 25.4 24.5 24.7 24.8
Equatorial Guinea 48.7 45.7 35.2 28.2 25.8 24.6 22.4 21.0
Gabon 34.9 36.7 34.4 34.6 35.1 36.1 36.0 34.5
CEMAC 32.7 29.7 28.8 25.1 24.6 23.5 23.1 22.3
Sources: Authorities' data; and IMF staff estimates and projections.1/ CEMAC values are calculated using the purchase power parity (PPP) GDP weighted average of member countries' data.
(Annual percent change)
(Percent of GDP)
(Percent of GDP)
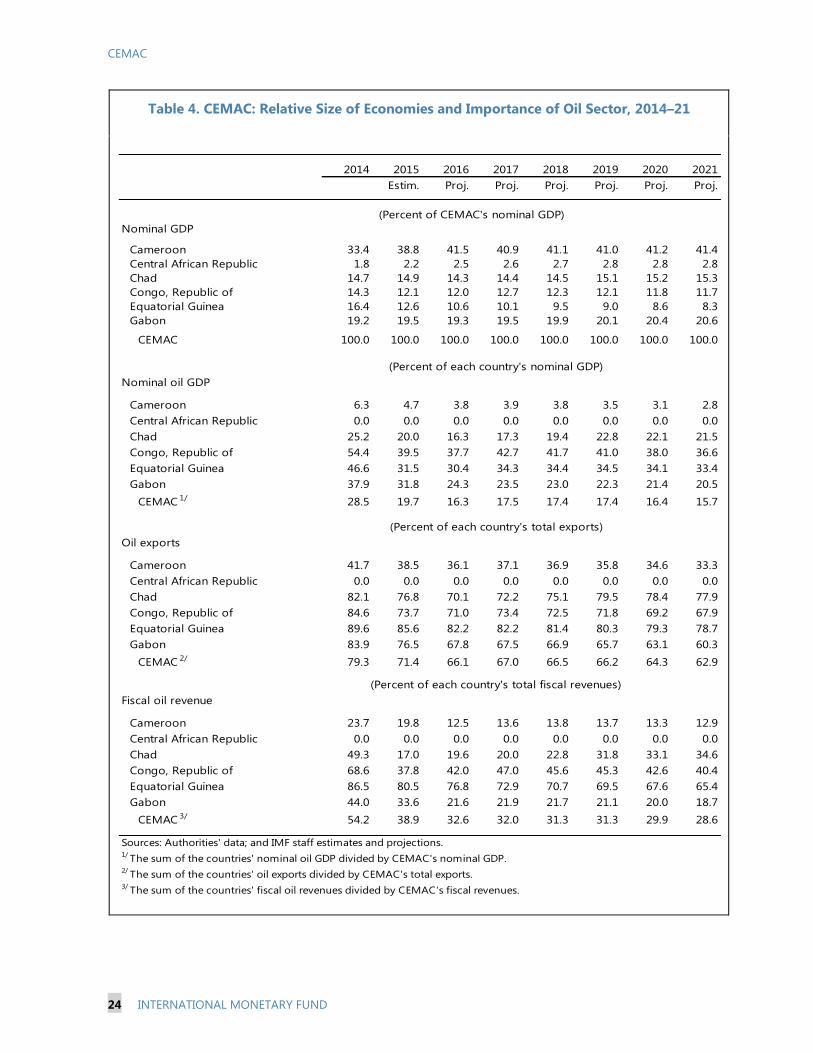
CEMAC
24 INTERNATIONAL MONETARY FUND
Table 4. CEMAC: Relative Size of Economies and Importance of Oil Sector, 2014–21
2014 2015 2016 2017 2018 2019 2020 2021
Estim. Proj. Proj. Proj. Proj. Proj. Proj.
Nominal GDP
Cameroon 33.4 38.8 41.5 40.9 41.1 41.0 41.2 41.4
Central African Republic 1.8 2.2 2.5 2.6 2.7 2.8 2.8 2.8
Chad 14.7 14.9 14.3 14.4 14.5 15.1 15.2 15.3
Congo, Republic of 14.3 12.1 12.0 12.7 12.3 12.1 11.8 11.7
Equatorial Guinea 16.4 12.6 10.6 10.1 9.5 9.0 8.6 8.3
Gabon 19.2 19.5 19.3 19.5 19.9 20.1 20.4 20.6
CEMAC 100.0 100.0 100.0 100.0 100.0 100.0 100.0 100.0
Nominal oil GDP
Cameroon 6.3 4.7 3.8 3.9 3.8 3.5 3.1 2.8
Central African Republic 0.0 0.0 0.0 0.0 0.0 0.0 0.0 0.0
Chad 25.2 20.0 16.3 17.3 19.4 22.8 22.1 21.5
Congo, Republic of 54.4 39.5 37.7 42.7 41.7 41.0 38.0 36.6
Equatorial Guinea 46.6 31.5 30.4 34.3 34.4 34.5 34.1 33.4
Gabon 37.9 31.8 24.3 23.5 23.0 22.3 21.4 20.5
CEMAC 1/ 28.5 19.7 16.3 17.5 17.4 17.4 16.4 15.7
Oil exports
Cameroon 41.7 38.5 36.1 37.1 36.9 35.8 34.6 33.3
Central African Republic 0.0 0.0 0.0 0.0 0.0 0.0 0.0 0.0
Chad 82.1 76.8 70.1 72.2 75.1 79.5 78.4 77.9
Congo, Republic of 84.6 73.7 71.0 73.4 72.5 71.8 69.2 67.9
Equatorial Guinea 89.6 85.6 82.2 82.2 81.4 80.3 79.3 78.7
Gabon 83.9 76.5 67.8 67.5 66.9 65.7 63.1 60.3
CEMAC 2/ 79.3 71.4 66.1 67.0 66.5 66.2 64.3 62.9
Fiscal oil revenue
Cameroon 23.7 19.8 12.5 13.6 13.8 13.7 13.3 12.9
Central African Republic 0.0 0.0 0.0 0.0 0.0 0.0 0.0 0.0
Chad 49.3 17.0 19.6 20.0 22.8 31.8 33.1 34.6
Congo, Republic of 68.6 37.8 42.0 47.0 45.6 45.3 42.6 40.4
Equatorial Guinea 86.5 80.5 76.8 72.9 70.7 69.5 67.6 65.4
Gabon 44.0 33.6 21.6 21.9 21.7 21.1 20.0 18.7
CEMAC 3/ 54.2 38.9 32.6 32.0 31.3 31.3 29.9 28.6
Sources: Authorities' data; and IMF staff estimates and projections.1/
The sum of the countries' nominal oil GDP divided by CEMAC's nominal GDP.2/
The sum of the countries' oil exports divided by CEMAC's total exports.3/
The sum of the countries' fiscal oil revenues divided by CEMAC's fiscal revenues.
(Percent of CEMAC's nominal GDP)
(Percent of each country's nominal GDP)
(Percent of each country's total exports)
(Percent of each country's total fiscal revenues)
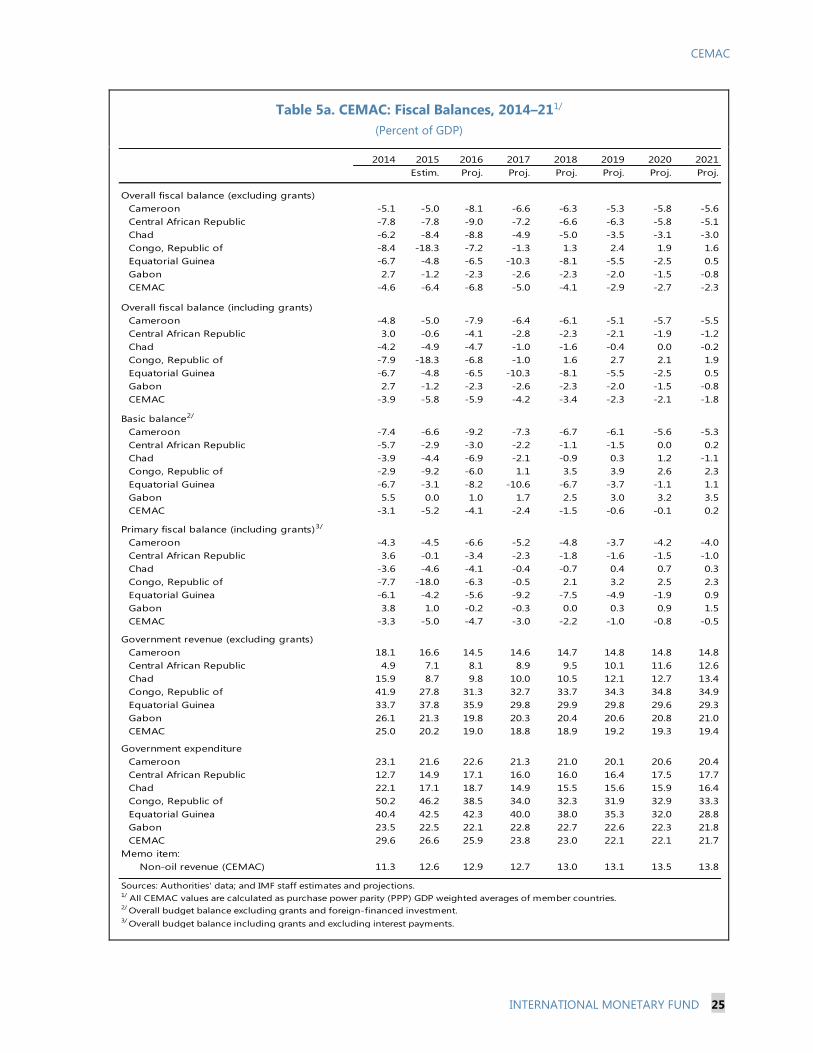
CEMAC
INTERNATIONAL MONETARY FUND 25
Table 5a. CEMAC: Fiscal Balances, 2014–211/
(Percent of GDP)
2014 2015 2016 2017 2018 2019 2020 2021
Estim. Proj. Proj. Proj. Proj. Proj. Proj.
Overall fiscal balance (excluding grants)
Cameroon -5.1 -5.0 -8.1 -6.6 -6.3 -5.3 -5.8 -5.6
Central African Republic -7.8 -7.8 -9.0 -7.2 -6.6 -6.3 -5.8 -5.1
Chad -6.2 -8.4 -8.8 -4.9 -5.0 -3.5 -3.1 -3.0
Congo, Republic of -8.4 -18.3 -7.2 -1.3 1.3 2.4 1.9 1.6
Equatorial Guinea -6.7 -4.8 -6.5 -10.3 -8.1 -5.5 -2.5 0.5
Gabon 2.7 -1.2 -2.3 -2.6 -2.3 -2.0 -1.5 -0.8
CEMAC -4.6 -6.4 -6.8 -5.0 -4.1 -2.9 -2.7 -2.3
Overall fiscal balance (including grants)
Cameroon -4.8 -5.0 -7.9 -6.4 -6.1 -5.1 -5.7 -5.5
Central African Republic 3.0 -0.6 -4.1 -2.8 -2.3 -2.1 -1.9 -1.2
Chad -4.2 -4.9 -4.7 -1.0 -1.6 -0.4 0.0 -0.2
Congo, Republic of -7.9 -18.3 -6.8 -1.0 1.6 2.7 2.1 1.9
Equatorial Guinea -6.7 -4.8 -6.5 -10.3 -8.1 -5.5 -2.5 0.5
Gabon 2.7 -1.2 -2.3 -2.6 -2.3 -2.0 -1.5 -0.8
CEMAC -3.9 -5.8 -5.9 -4.2 -3.4 -2.3 -2.1 -1.8
Basic balance2/
Cameroon -7.4 -6.6 -9.2 -7.3 -6.7 -6.1 -5.6 -5.3
Central African Republic -5.7 -2.9 -3.0 -2.2 -1.1 -1.5 0.0 0.2
Chad -3.9 -4.4 -6.9 -2.1 -0.9 0.3 1.2 -1.1
Congo, Republic of -2.9 -9.2 -6.0 1.1 3.5 3.9 2.6 2.3
Equatorial Guinea -6.7 -3.1 -8.2 -10.6 -6.7 -3.7 -1.1 1.1
Gabon 5.5 0.0 1.0 1.7 2.5 3.0 3.2 3.5
CEMAC -3.1 -5.2 -4.1 -2.4 -1.5 -0.6 -0.1 0.2
Primary fiscal balance (including grants)3/
Cameroon -4.3 -4.5 -6.6 -5.2 -4.8 -3.7 -4.2 -4.0
Central African Republic 3.6 -0.1 -3.4 -2.3 -1.8 -1.6 -1.5 -1.0
Chad -3.6 -4.6 -4.1 -0.4 -0.7 0.4 0.7 0.3
Congo, Republic of -7.7 -18.0 -6.3 -0.5 2.1 3.2 2.5 2.3
Equatorial Guinea -6.1 -4.2 -5.6 -9.2 -7.5 -4.9 -1.9 0.9
Gabon 3.8 1.0 -0.2 -0.3 0.0 0.3 0.9 1.5
CEMAC -3.3 -5.0 -4.7 -3.0 -2.2 -1.0 -0.8 -0.5
Government revenue (excluding grants)
Cameroon 18.1 16.6 14.5 14.6 14.7 14.8 14.8 14.8
Central African Republic 4.9 7.1 8.1 8.9 9.5 10.1 11.6 12.6
Chad 15.9 8.7 9.8 10.0 10.5 12.1 12.7 13.4
Congo, Republic of 41.9 27.8 31.3 32.7 33.7 34.3 34.8 34.9
Equatorial Guinea 33.7 37.8 35.9 29.8 29.9 29.8 29.6 29.3
Gabon 26.1 21.3 19.8 20.3 20.4 20.6 20.8 21.0
CEMAC 25.0 20.2 19.0 18.8 18.9 19.2 19.3 19.4
Government expenditure
Cameroon 23.1 21.6 22.6 21.3 21.0 20.1 20.6 20.4
Central African Republic 12.7 14.9 17.1 16.0 16.0 16.4 17.5 17.7
Chad 22.1 17.1 18.7 14.9 15.5 15.6 15.9 16.4
Congo, Republic of 50.2 46.2 38.5 34.0 32.3 31.9 32.9 33.3
Equatorial Guinea 40.4 42.5 42.3 40.0 38.0 35.3 32.0 28.8
Gabon 23.5 22.5 22.1 22.8 22.7 22.6 22.3 21.8
CEMAC 29.6 26.6 25.9 23.8 23.0 22.1 22.1 21.7
Memo item:
Non-oil revenue (CEMAC) 11.3 12.6 12.9 12.7 13.0 13.1 13.5 13.8
Sources: Authorities' data; and IMF staff estimates and projections.1/
All CEMAC values are calculated as purchase power parity (PPP) GDP weighted averages of member countries.2/
Overall budget balance excluding grants and foreign-financed investment.3/
Overall budget balance including grants and excluding interest payments.
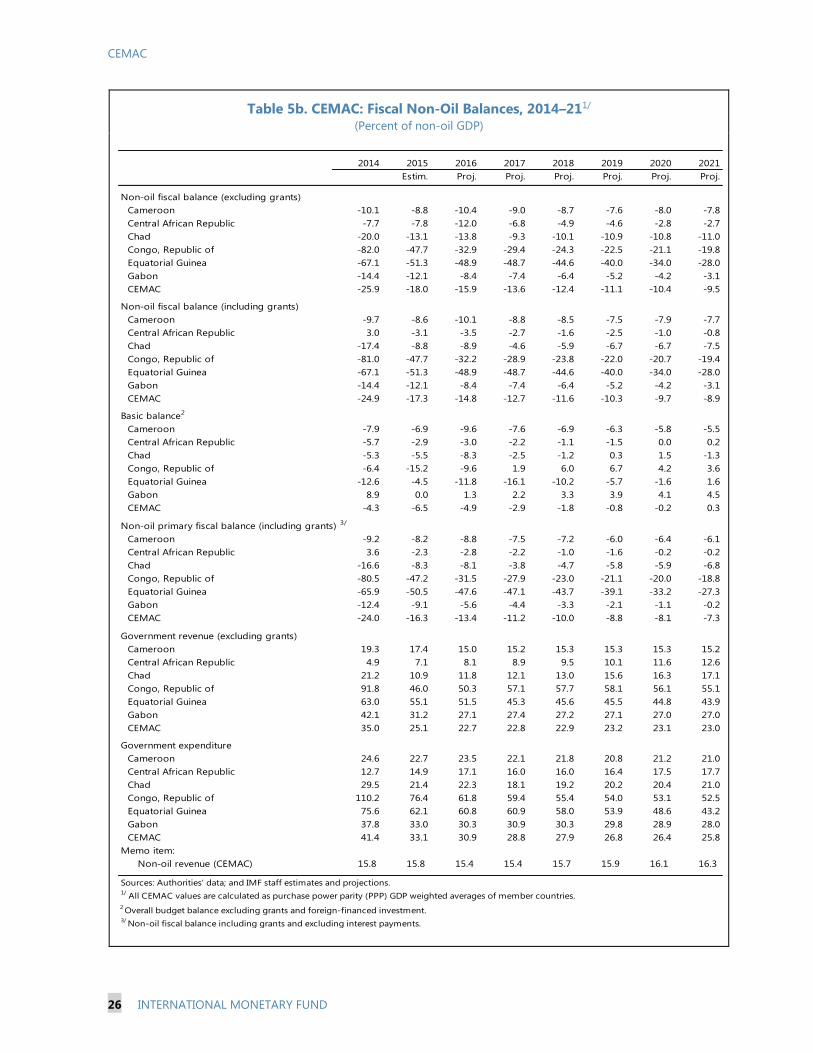
CEMAC
26 INTERNATIONAL MONETARY FUND
Table 5b. CEMAC: Fiscal Non-Oil Balances, 2014–211/ (Percent of non-oil GDP)
2014 2015 2016 2017 2018 2019 2020 2021
Estim. Proj. Proj. Proj. Proj. Proj. Proj.
Non-oil fiscal balance (excluding grants)
Cameroon -10.1 -8.8 -10.4 -9.0 -8.7 -7.6 -8.0 -7.8
Central African Republic -7.7 -7.8 -12.0 -6.8 -4.9 -4.6 -2.8 -2.7
Chad -20.0 -13.1 -13.8 -9.3 -10.1 -10.9 -10.8 -11.0
Congo, Republic of -82.0 -47.7 -32.9 -29.4 -24.3 -22.5 -21.1 -19.8
Equatorial Guinea -67.1 -51.3 -48.9 -48.7 -44.6 -40.0 -34.0 -28.0
Gabon -14.4 -12.1 -8.4 -7.4 -6.4 -5.2 -4.2 -3.1
CEMAC -25.9 -18.0 -15.9 -13.6 -12.4 -11.1 -10.4 -9.5
Non-oil fiscal balance (including grants)
Cameroon -9.7 -8.6 -10.1 -8.8 -8.5 -7.5 -7.9 -7.7
Central African Republic 3.0 -3.1 -3.5 -2.7 -1.6 -2.5 -1.0 -0.8
Chad -17.4 -8.8 -8.9 -4.6 -5.9 -6.7 -6.7 -7.5
Congo, Republic of -81.0 -47.7 -32.2 -28.9 -23.8 -22.0 -20.7 -19.4
Equatorial Guinea -67.1 -51.3 -48.9 -48.7 -44.6 -40.0 -34.0 -28.0
Gabon -14.4 -12.1 -8.4 -7.4 -6.4 -5.2 -4.2 -3.1
CEMAC -24.9 -17.3 -14.8 -12.7 -11.6 -10.3 -9.7 -8.9
Basic balance2
Cameroon -7.9 -6.9 -9.6 -7.6 -6.9 -6.3 -5.8 -5.5
Central African Republic -5.7 -2.9 -3.0 -2.2 -1.1 -1.5 0.0 0.2
Chad -5.3 -5.5 -8.3 -2.5 -1.2 0.3 1.5 -1.3
Congo, Republic of -6.4 -15.2 -9.6 1.9 6.0 6.7 4.2 3.6
Equatorial Guinea -12.6 -4.5 -11.8 -16.1 -10.2 -5.7 -1.6 1.6
Gabon 8.9 0.0 1.3 2.2 3.3 3.9 4.1 4.5
CEMAC -4.3 -6.5 -4.9 -2.9 -1.8 -0.8 -0.2 0.3
Non-oil primary fiscal balance (including grants) 3/
Cameroon -9.2 -8.2 -8.8 -7.5 -7.2 -6.0 -6.4 -6.1
Central African Republic 3.6 -2.3 -2.8 -2.2 -1.0 -1.6 -0.2 -0.2
Chad -16.6 -8.3 -8.1 -3.8 -4.7 -5.8 -5.9 -6.8
Congo, Republic of -80.5 -47.2 -31.5 -27.9 -23.0 -21.1 -20.0 -18.8
Equatorial Guinea -65.9 -50.5 -47.6 -47.1 -43.7 -39.1 -33.2 -27.3
Gabon -12.4 -9.1 -5.6 -4.4 -3.3 -2.1 -1.1 -0.2
CEMAC -24.0 -16.3 -13.4 -11.2 -10.0 -8.8 -8.1 -7.3
Government revenue (excluding grants)
Cameroon 19.3 17.4 15.0 15.2 15.3 15.3 15.3 15.2
Central African Republic 4.9 7.1 8.1 8.9 9.5 10.1 11.6 12.6
Chad 21.2 10.9 11.8 12.1 13.0 15.6 16.3 17.1
Congo, Republic of 91.8 46.0 50.3 57.1 57.7 58.1 56.1 55.1
Equatorial Guinea 63.0 55.1 51.5 45.3 45.6 45.5 44.8 43.9
Gabon 42.1 31.2 27.1 27.4 27.2 27.1 27.0 27.0
CEMAC 35.0 25.1 22.7 22.8 22.9 23.2 23.1 23.0
Government expenditure
Cameroon 24.6 22.7 23.5 22.1 21.8 20.8 21.2 21.0
Central African Republic 12.7 14.9 17.1 16.0 16.0 16.4 17.5 17.7
Chad 29.5 21.4 22.3 18.1 19.2 20.2 20.4 21.0
Congo, Republic of 110.2 76.4 61.8 59.4 55.4 54.0 53.1 52.5
Equatorial Guinea 75.6 62.1 60.8 60.9 58.0 53.9 48.6 43.2
Gabon 37.8 33.0 30.3 30.9 30.3 29.8 28.9 28.0
CEMAC 41.4 33.1 30.9 28.8 27.9 26.8 26.4 25.8
Memo item:
Non-oil revenue (CEMAC) 15.8 15.8 15.4 15.4 15.7 15.9 16.1 16.3
Sources: Authorities' data; and IMF staff estimates and projections.1/
All CEMAC values are calculated as purchase power parity (PPP) GDP weighted averages of member countries.
2 Overall budget balance excluding grants and foreign-financed investment.
3/ Non-oil fiscal balance including grants and excluding interest payments.

CEMAC
INTERNATIONAL MONETARY FUND 27
Table 6a. CEMAC: Balance of Payments, 2014–21
(CFAF billions, when otherwise indicated)
2014 2015 2016 2017 2018 2019 2020 2021
Estim. Proj. Proj. Proj. Proj. Proj. Proj.
Balance on current account -1,551 -4,089 -3,356 -2,440 -2,353 -2,119 -2,036 -1,858
Balance on goods and services 3,686 -355 -272 1,022 1,515 1,956 2,017 2,277
Total exports 23,745 18,011 15,747 17,406 18,307 19,432 19,807 20,590
Exports of goods 21,584 15,918 13,662 15,171 15,950 16,948 17,193 17,808
Oil exports 17,113 11,364 9,030 10,163 10,601 11,227 11,059 11,193
Non-oil exports 4,471 4,554 4,632 5,008 5,349 5,721 6,133 6,615
Exports of services 2,161 2,092 2,085 2,235 2,357 2,484 2,614 2,782
Total imports 20,059 18,365 16,019 16,383 16,792 17,477 17,790 18,313
Imports of goods 12,795 11,704 10,073 10,568 10,748 11,054 11,202 11,463
Imports of services 7,265 6,662 5,946 5,816 6,044 6,422 6,588 6,850
Income, net -5,854 -4,075 -3,511 -3,900 -4,050 -4,264 -4,264 -4,356
Income credits 184 234 235 219 218 223 228 232
Income debits -6,043 -4,313 -3,746 -4,120 -4,269 -4,491 -4,497 -4,593
Of which:
Investment income, debit -1,929 -1,525 -1,058 -1,155 -1,368 -1,753 -1,883 -2,079
Of which: Interest paid on public debt -92 -126 -256 -240 -281 -292 -298 -306
Current transfers, net 618 341 426 434 179 186 206 219
Private current transfers, net 141 189 271 276 2 5 11 10
Official current transfers, net 477 152 155 159 177 182 195 209
Balance on capital and financial accounts 3,735 3,763 3,356 2,440 2,353 2,119 2,036 1,857
Balance on capital account (incl. capital transfers) 159 163 245 231 235 231 241 232
Balance on financial account (incl. reserves) 3,576 3,600 3,111 2,209 2,119 1,887 1,795 1,626
Direct investment, net 3,812 1,765 2,059 1,951 2,002 1,994 1,989 2,058
Portfolio investment, net 12 12 12 13 13 13 14 14
Other investment, net -1,687 -1,234 -289 111 241 152 169 -109
Reserve assets (accumulation -) 1,440 3,056 1,328 134 -138 -273 -377 -338
Errors and omissions, net -2,184 326 0 0 0 0 0 0
Memorandum items:
Nominal GDP 46,702 43,369 43,423 47,019 49,982 53,512 56,745 60,266
Gross official reserves (end of period)
Millions U.S. dollars 15,309 10,139 7,866 7,634 7,872 8,346 9,006 9,596
Months of imports of goods and services 6.1 4.6 3.4 3.3 3.2 3.3 3.5 3.9
Sources: BEAC; and IMF staff estimates and projections.

CEMAC
28 INTERNATIONAL MONETARY FUND
Table 6b. CEMAC: Balance of Payments Indicators by Country, 2014–211/ (Percent of GDP)
2014 2015 2016 2017 2018 2019 2020 2021
Estm. Proj. Proj. Proj. Proj. Proj. Proj.
Balance on Current Account
Cameroon -4.4 -5.5 -5.7 -5.3 -4.9 -4.8 -4.6 -4.2
Central African Republic -5.6 -12.8 -11.1 -10.6 -10.2 -8.9 -8.7 -8.2
Chad -9.0 -12.4 -11.3 -7.7 -7.3 -5.5 -6.2 -5.7
Congo, Republic of -2.6 -20.2 -6.6 0.0 -1.4 -1.1 -1.1 -0.9
Equatorial Guinea -9.6 -18.1 -14.9 -7.6 -5.3 -3.2 -0.3 1.8
Gabon 8.0 -2.2 -4.3 -4.1 -3.8 -3.6 -2.9 -2.3
CEMAC -3.3 -9.4 -7.7 -5.2 -4.7 -4.0 -3.6 -3.1
Balance on Non-Oil Current Account
Cameroon -3.9 -5.1 -5.7 -5.0 -4.6 -4.1 -3.5 -3.0
Chad -13.5 -12.4 -5.6 -4.7 -6.6 -11.0 -11.5 -11.2
Congo, Republic of -26.9 -35.3 -21.4 -16.9 -18.4 -16.9 -16.3 -15.4
Equatorial Guinea -73.6 -72.3 -65.4 -63.1 -58.8 -53.6 -48.3 -43.6
Gabon -14.7 -17.0 -12.6 -12.5 -11.8 -11.1 -10.0 -8.9
CEMAC -22.2 -20.8 -15.4 -14.0 -12.9 -12.2 -11.1 -10.0
Oil Exports
Cameroon 8.7 6.9 5.7 5.9 5.8 5.4 5.1 4.8
Central African Republic 0.0 0.0 0.0 0.0 0.0 0.0 0.0 0.0
Chad 23.1 18.5 14.1 15.4 18.0 22.4 21.2 20.8
Congo, Republic of 57.0 41.8 40.0 45.1 44.0 43.7 39.9 38.4
Equatorial Guinea 85.1 77.7 74.4 74.3 72.8 69.8 67.6 65.8
Gabon 42.3 30.4 24.5 24.2 23.2 22.2 21.1 20.0
CEMAC 36.6 26.2 20.8 21.6 21.2 21.0 19.5 18.6
Imports of goods and non factor services
Cameroon 30.6 27.6 25.1 25.0 24.6 23.8 23.0 22.2
Central African Republic 37.6 34.6 32.0 31.2 29.7 29.7 27.4 27.0
Chad 44.1 43.1 42.0 37.7 37.9 37.8 36.8 36.1
Congo, Republic of 63.5 77.3 63.7 59.7 57.0 56.9 55.5 55.0
Equatorial Guinea 54.2 62.1 60.1 52.6 50.3 47.3 43.9 41.4
Gabon 38.8 37.6 32.1 31.6 30.6 30.1 29.2 28.4
CEMAC 43.0 42.3 36.9 34.8 33.6 32.7 31.4 30.4
Balance on Capital Account
Cameroon 0.0 0.1 0.0 0.0 0.0 0.0 0.0 0.0
Central African Republic 2.1 4.6 8.7 4.3 3.5 2.2 1.9 1.9
Chad 1.5 1.7 2.2 2.4 2.3 2.2 2.3 2.0
Congo, Republic of 0.5 0.0 0.4 0.3 0.3 0.3 0.2 0.3
Equatorial Guinea 0.0 0.0 0.0 0.0 0.0 0.0 0.0 0.0
Gabon 0.0 0.0 0.0 0.0 0.0 0.0 0.0 0.0
CEMAC 0.3 0.4 0.6 0.5 0.5 0.4 0.4 0.4
Foreign Direct Investment
Cameroon 2.9 2.1 1.8 1.6 1.4 1.2 1.1 0.9
Central African Republic 0.1 0.3 1.6 1.8 1.8 1.7 1.7 1.7
Chad 5.2 5.1 8.6 4.4 4.9 3.8 3.7 3.5
Congo, Republic of 19.6 10.6 12.1 12.3 11.9 12.0 10.8 10.7
Equatorial Guinea 15.4 2.8 3.2 3.1 3.1 3.1 3.3 3.2
Gabon 5.6 4.4 5.1 5.0 4.8 4.5 4.6 4.7
CEMAC 8.2 4.1 4.7 4.1 4.0 3.7 3.5 3.4
Reserves
Cameroon 3,168 3,536 3,337 3,052 2,726 2,356 1,967 1,536
Central African Republic 260 214 174 131 86 42 -2 -40
Chad 1,076 369 399 549 649 769 899 578
Congo, Republic of 4,926 2,221 1,401 1,305 1,258 1,406 1,584 1,889
Equatorial Guinea 2,907 1,205 903 822 744 671 632 588
Gabon 2,478 1,863 1,628 1,586 1,719 1,953 2,248 2,552
CEMAC 15,309 10,139 7,866 7,634 7,872 8,346 9,006 9,596
Sources: BEAC; and IMF staff estimates and projections.
(Millions of USD)

CEMAC
INTERNATIONAL MONETARY FUND 29
Table 7. CEMAC: Nominal and Real Effective Exchange Rates, 2006–15
2006 2007 2008 2009 2010 2011 2012 2013 2014 2015
Nominal effective exchange rate
Cameroon 98.1 101.1 103.7 104.6 100.0 101.2 98.1 101.7 103.3 99.5
Central African Republic 99.6 102.6 105.2 104.3 100.0 100.8 97.8 101.3 103.0 98.7
Chad 96.9 99.4 102.0 103.0 100.0 101.1 98.8 100.7 102.1 98.5
Congo, Republic of 99.6 102.3 106.1 105.2 100.0 101.1 98.2 102.0 103.4 97.1
Equatorial Guinea 95.8 100.2 106.0 104.7 100.0 102.0 96.9 99.4 99.2 90.2
Gabon 100.2 102.4 104.3 103.5 100.0 100.3 97.8 100.7 102.0 98.9
CEMAC 1 98.0 101.1 104.3 104.3 100.0 101.1 98.0 101.0 102.2 97.5
Cameroon -0.5 3.1 2.5 0.9 -4.4 1.2 -3.1 3.6 1.6 -3.7
Central African Republic -0.1 3.0 2.5 -0.8 -4.2 0.8 -3.0 3.5 1.7 -4.2
Chad 0.0 2.5 2.7 1.0 -2.9 1.1 -2.3 1.9 1.4 -3.5
Congo, Republic of -0.1 2.7 3.7 -0.8 -5.0 1.1 -2.9 3.8 1.4 -6.1
Equatorial Guinea -0.3 4.6 5.8 -1.3 -4.5 2.0 -4.9 2.6 -0.2 -9.1
Gabon 0.0 2.2 1.9 -0.7 -3.4 0.3 -2.5 3.0 1.3 -3.1
CEMAC1 -0.2 3.1 3.2 0.0 -4.1 1.1 -3.2 3.1 1.2 -4.6
Real effective exchange rate
Cameroon 100.3 101.3 104.4 106.7 100.0 100.2 96.7 99.5 100.8 98.3
Central African Republic 94.2 95.4 102.8 104.9 100.0 99.0 99.2 102.3 127.6 166.3
Chad 101.0 91.5 98.8 108.1 100.0 94.0 101.7 101.8 103.1 101.0
Congo, Republic of 93.6 95.4 99.9 103.1 100.0 99.3 96.8 103.9 103.5 100.6
Equatorial Guinea 84.2 88.3 95.8 99.0 100.0 101.3 95.2 97.2 100.3 104.4
Gabon 95.2 99.7 103.1 103.9 100.0 98.6 96.5 98.2 102.8 99.4
CEMAC 1 95.3 96.2 101.2 104.5 100.0 99.0 97.2 100.0 102.1 100.8
Cameroon 1.5 1.0 3.0 2.2 -6.3 0.2 -3.5 3.0 1.3 -2.5
Central African Republic 4.0 1.2 7.7 2.0 -4.6 -1.0 0.2 3.1 24.8 30.3
Chad 4.8 -9.4 7.9 9.5 -7.5 -6.0 8.2 0.1 1.3 -2.1
Congo, Republic of 1.7 1.9 4.8 3.2 -3.0 -0.7 -2.5 7.3 -0.5 -2.8
Equatorial Guinea 1.5 4.8 8.6 3.3 1.0 1.3 -6.1 2.2 3.2 4.1
Gabon -3.6 4.7 3.5 0.8 -3.8 -1.4 -2.2 1.8 4.6 -3.2
CEMAC 1 1.2 1.0 5.2 3.3 -4.3 -1.0 -1.8 2.8 2.2 -1.3
Source: IMF Information Notice System.1 CEMAC data are weighted by country GDP in purchasing power parity in US dollars.
(Annual percent change)
(Index, 2010=100)
(Annual percent change)
(Index, 2010=100)

CEMAC
30 INTERNATIONAL MONETARY FUND
Table 8. CEMAC: Compliance with Convergence Criteria, 2013–16
2013 2014 2015 2016 2017
Estim. Proj. Proj.
Basic fiscal balance1 (≥ 0)
Cameroon -8.3 -7.4 -6.6 -9.2 -7.3
Central African Republic -7.5 -5.7 -2.9 -3.0 -2.2
Chad -2.0 -3.9 -4.4 -6.9 -2.1
Congo, Republic of 5.7 -2.9 -9.2 -6.0 1.1
Equatorial Guinea -7.5 -6.7 -3.1 -8.2 -10.6
Gabon 4.9 5.5 0.0 1.0 1.7
Number of countries violating 4 5 5 5 4
Consumer price inflation (≤ 3%)
Cameroon 2.1 1.9 2.8 2.2 2.2
Central African Republic 6.6 11.6 4.5 4.0 3.5
Chad 0.2 1.7 3.7 0.0 5.2
Congo, Republic of 4.6 0.9 2.0 3.3 2.8
Equatorial Guinea 3.2 4.3 2.2 1.4 1.4
Gabon 0.5 4.5 0.1 2.5 2.5
Number of countries violating 3 3 2 2 2
Level of public debt (≤ 70% GDP)
Cameroon 18.7 28.0 31.2 36.1 39.2
Central African Republic 38.5 51.1 48.5 47.2 41.2
Chad 29.7 38.5 40.0 41.7 37.9
Congo, Republic of 38.2 47.5 70.6 69.4 61.5
Equatorial Guinea 7.9 12.0 19.6 26.3 28.5
Gabon 29.2 32.2 44.0 47.7 46.7
Number of countries violating 0 0 1 0 0
Non-accumulation of government arrears2 (≤ 0)
Cameroon -0.1 -0.1 -0.1 0.0 0.0
Central African Republic 2.3 -1.4 -1.1 -0.5 -0.7
Chad -3.6 -2.0 -2.1 -1.7 -1.6
Congo, Republic of -2.7 -0.7 -0.3 -0.7 -0.6
Equatorial Guinea 0.0 0.3 0.0 0.0 0.0
Gabon -1.5 -3.6 -3.1 -0.9 0.0
Number of countries violating 1 1 0 0 0
Sources: Authorities' data; and IMF staff estimates and projections.1 Overall budget balance, excluding grants and foreign-financed investment.
2 Includes external and domestic payments arrears. Data reported by country authorities, which may not
coincide with CEMAC teams' findings. A negative sign indicates a reduction in the stock of past arrears.
(Percent of GDP)

CEMAC
INTERNATIONAL MONETARY FUND 31
Table 9. CEMAC: Monetary Survey, 2013–17
2013 2014 2015 2016 2017
Proj. Proj.
Net foreign assets1/ 8,788.1 7,974.7 5,888.5 4,914.9 4,453.3
BEAC 8,123.2 7,719.8 5,547.8 3,910.0 3,337.4
Foreign assets 8,777.5 8,417.0 6,238.3 4,596.1 4,418.6
Of which: `
Operations account 4,974.4 3,847.6 3,288.3 2,068.3 1,988.4
Foreign liabilities -654.3 -697.1 -690.5 -686.2 -1,081.2
Commercial banks 664.9 254.8 340.7 1,004.9 1,115.9
Foreign assets 1,097.3 672.9 735.2 1,560.8 1,672.2
Foreign liabilities -432.4 -418.1 -394.5 -555.8 -556.3
Net domestic assets 2,201.3 3,800.9 5,633.1 7,027.1 8,368.2
Net credit to government -2,430.2 -1,712.3 -6.0 959.0 1,155.7
BEAC, net -2,802.8 -1,449.7 -96.3 845.6 1,028.6
Of which:
Advances 477.9 1,193.9 2,130.2 3,102.9 3,200.6
Government deposits -3,502.0 -2,883.0 -2,484.2 -2,486.7 -2,400.1
Commercial banks, net 372.6 -262.6 90.3 113.4 127.1
Net credit to public agencies -407.5 -263.3 -516.0 -414.0 284.5
Net credit to private sector 5,634.7 6,939.6 6,850.7 7,177.9 7,623.7
Other items, net -595.8 -1,163.2 -695.7 -695.7 -695.7
Broad money 10,760.9 11,775.6 11,521.5 11,942.0 12,821.5
Currency outside banks 2,998.4 3,098.5 3,008.1 3,005.8 3,179.0
Bank deposits 7,762.5 8,677.1 8,513.4 8,936.3 9,642.6
Net foreign assets -0.4 -7.6 -17.7 -8.5 -3.9
Net domestic assets 9.0 14.9 15.6 12.1 11.2
Net credit to government -2.2 6.7 14.5 8.4 1.6
Net credit to the private sector 10.7 12.1 -0.8 2.8 3.7
Other items, net 2.5 -5.3 4.0 0.0 0.0
Broad money 6.7 9.4 -2.2 3.6 7.4
Velocity (GDP/broad money) 4.2 4.0 3.8 3.6 3.7
Broad money 23.6 25.2 26.6 27.5 27.3
Private bank deposits 16.9 16.9 14.1 14.8 14.8
Net credit to the private sector 11.5 14.9 15.8 16.5 16.2
Sources: BEAC; and IMF staff estimates and projections.
(CFAF billions)
(Annual change in percent of beginning-of-period broad money)
(Percent of GDP)
1/ Net foreign assets (NFA) are not directly comparable to reserve flows in the balance of payments because of
BEAC's own international reserves.
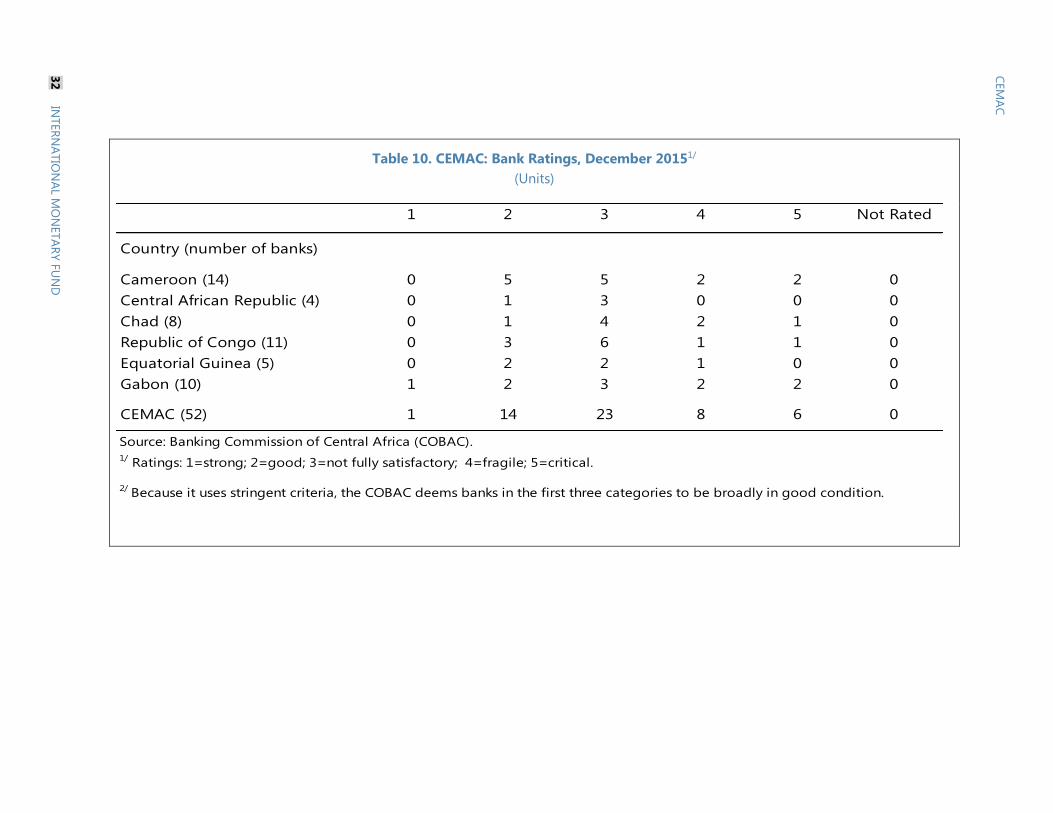
Table 10. CEMAC: Bank Ratings, December 20151/
(Units)
1 2 3 4 5 Not Rated
Country (number of banks)
Cameroon (14) 0 5 5 2 2 0
Central African Republic (4) 0 1 3 0 0 0
Chad (8) 0 1 4 2 1 0
Republic of Congo (11) 0 3 6 1 1 0
Equatorial Guinea (5) 0 2 2 1 0 0
Gabon (10) 1 2 3 2 2 0
CEMAC (52) 1 14 23 8 6 0
Source: Banking Commission of Central Africa (COBAC).
1/ Ratings: 1=strong; 2=good; 3=not fully satisfactory; 4=fragile; 5=critical.
2/ Because it uses stringent criteria, the COBAC deems banks in the first three categories to be broadly in good condition.
32
IN
TER
NA
TIO
NA
L MO
NETA
RY F
UN
D
CEM
AC
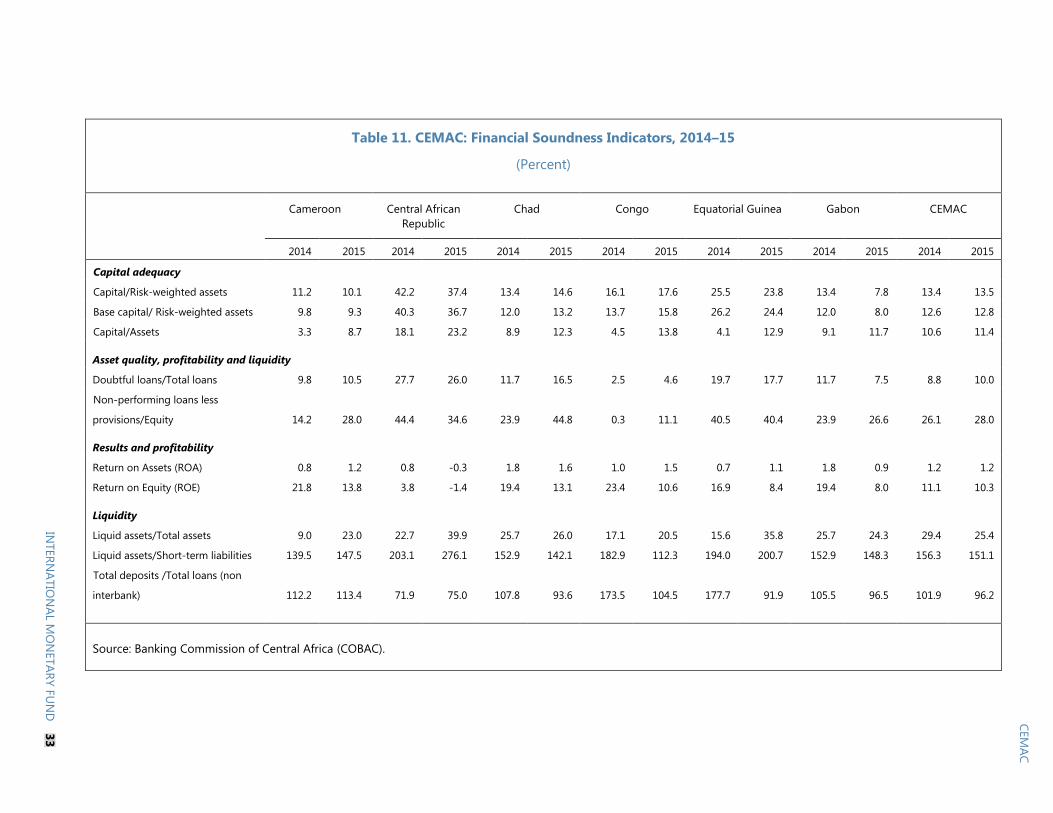
Table 11. CEMAC: Financial Soundness Indicators, 2014–15
(Percent)
Cameroon
Central African
Republic
Chad
Congo
Equatorial Guinea
Gabon
CEMAC
2014 2015 2014 2015 2014 2015 2014 2015 2014 2015 2014 2015 2014 2015
Capital adequacy
Capital/Risk-weighted assets 11.2 10.1 42.2 37.4 13.4 14.6 16.1 17.6 25.5 23.8 13.4 7.8 13.4 13.5
Base capital/ Risk-weighted assets 9.8 9.3 40.3 36.7 12.0 13.2 13.7 15.8 26.2 24.4 12.0 8.0 12.6 12.8
Capital/Assets 3.3 8.7 18.1 23.2 8.9 12.3 4.5 13.8 4.1 12.9 9.1 11.7 10.6 11.4
Asset quality, profitability and liquidity
Doubtful loans/Total loans 9.8 10.5 27.7 26.0 11.7 16.5 2.5 4.6 19.7 17.7 11.7 7.5 8.8 10.0
Non-performing loans less
provisions/Equity 14.2 28.0 44.4 34.6 23.9 44.8 0.3 11.1 40.5 40.4 23.9 26.6 26.1 28.0
Results and profitability
Return on Assets (ROA) 0.8 1.2 0.8 -0.3 1.8 1.6 1.0 1.5 0.7 1.1 1.8 0.9 1.2 1.2
Return on Equity (ROE) 21.8 13.8 3.8 -1.4 19.4 13.1 23.4 10.6 16.9 8.4 19.4 8.0 11.1 10.3
Liquidity
Liquid assets/Total assets 9.0 23.0 22.7 39.9 25.7 26.0 17.1 20.5 15.6 35.8 25.7 24.3 29.4 25.4
Liquid assets/Short-term liabilities 139.5 147.5 203.1 276.1 152.9 142.1 182.9 112.3 194.0 200.7 152.9 148.3 156.3 151.1
Total deposits /Total loans (non
interbank)
112.2 113.4 71.9 75.0 107.8 93.6 173.5 104.5 177.7 91.9 105.5 96.5 101.9 96.2
Source: Banking Commission of Central Africa (COBAC).
CEM
AC
INTER
NA
TIO
NA
L MO
NETA
RY F
UN
D
33

Table 12. CEMAC: Violations of Prudential Ratios, 2013–15
2013 2014 2015 2013 2014 2015 2013 2014 2015 2013 2014 2015 2013 2014 2015 2013 2014 2015
Country (number of banks)
Cameroon (14) 5 4 3 2 3 3 5 4 4 5 4 3 5 3 1 7 5 5
Central African Republic (4) 0 0 0 1 0 0 0 0 0 0 0 0 2 0 0 3 2 1
Chad (8) 0 1 1 1 0 1 0 2 2 1 1 3 3 2 1 1 3 1
Republic of Congo (11) 1 0 1 0 0 4 1 1 5 1 1 2 3 1 1 2 2 2
Equatorial Guinea (5) 0 1 0 0 0 0 0 1 0 1 1 0 0 0 0 1 1 1
Gabon (10) 1 3 3 1 3 2 2 4 4 1 3 4 3 1 0 3 4 5
CEMAC (52) 7 9 8 5 6 10 8 12 15 9 10 12 16 7 3 17 17 15
Cameroon (14) 28 24 29 4 21 6 28 24 23 28 24 6 n.a. 9 2 41 29 29
Central African Republic (4) 0 0 0 17 0 0 0 0 0 0 0 0 n.a. 0 0 91 24 24
Chad (8) 0 13 1 15 0 12 0 18 16 14 13 28 n.a. 6 1 15 38 15
Republic of Congo (11) 3 0 n.a. 0 0 56 5 2 19 3 2 1 n.a. n.a. n.a. 52 4 n.a.
Equatorial Guinea (5) 0 32 0 0 0 0 0 32 0 15 32 0 n.a. 0 0 23 32 23
Gabon (10) 2 5 4 2 19 2 13 19 21 2 5 10 n.a. 2 0 15 19 21
Source: Banking Commission of Central Africa (COBAC).1 Short-term assets of up to one month (remaining maturity) over short-term liabilities of up to one month (remaining maturity).
2 Net capital and other premanent resources over fixed assets.
3 Long-term assets of more than five years over long-term liabilities of more than five years.
5 Single large exposure is limited to 45 percent of capital.
6 Violating banks' deposits as a percentage of total deposits in each country.
(Units)
(Percent of deposits6)
4 Minimum capital is CFAF 5 billion for all the countries.
Transformation Capital Large Exposure5
8% Min 100% Min 100% Min 50% Min CFAF 10 billions Max 45%
Capital Adequacy Liquidity1
Fixed Assets2
Maturity3
Minimum4 Limit on Single
CEM
AC
34
IN
TER
NA
TIO
NA
L MO
NETA
RY F
UN
D

CEMAC
INTERNATIONAL MONETARY FUND 35
Annex I. CEMAC: Risk Assessment Matrix1
Source/Likelihood
Expected Impact
Proposed Policies to Mitigate
Risks
Sharper-than-expected global
growth slowdown
Medium
Significant China slowdown,
triggered by corporate distress that
propagates through shadow banks,
precipitating deleveraging,
uncertainty and capital outflows.
Weak domestic demand further
depresses commodity prices, roils
global financial markets, and reduces
global growth.
Likelihood: low in the short term,
medium thereafter.
Lower growth in China will
continue to depress commodity
prices, including oil, and will have a
negative impact on CEMAC exports.
Lower hydrocarbon revenues will
undermine fiscal sustainability in
most CEMAC countries.
Slower growth in China could
hamper external financing for large
infrastructure projects and cloud
CEMAC’s long-term growth
prospects.
Adopt more vigorous fiscal
consolidation to reduce the “twin”
deficits and ensure external
sustainability.
Develop the regional debt market
to help cover CEMAC members’
financing needs.
Implement an ambitious structural
reform agenda to promote
economic diversification, including
measures to attract more private
capital.
Significant slowdown in other
large emerging markets (EMs) /
frontier economies. Turning of the
credit cycle and fallout from excess
household and corporate
leverage (including in foreign
exchange), as investors withdraw
from EM corporate debt, generating
disorderly deleveraging, with
potential spillbacks to advanced
economies (AEs).
Likelihood: medium in the short
term.
Lower foreign investment in
CEMAC, in particular in the oil
sector, especially from EMs.
Diversify export markets to other
EMs to compensate for China’s
economic slowdown.
Improve external competitiveness
through structural reforms to
improve the regional business
climate.
1 The Risk Assessment Matrix (RAM) shows events that could materially alter the baseline path (the scenario most likely
to materialize in the view of IMF staff). The relative likelihood is the staff’s subjective assessment of the risks surrounding
the baseline (“low” is meant to indicate a probability below 10 percent; “medium” a probability between 10 and
30 percent; and “high” a probability between 30 and 50 percent). The RAM reflects staff views on the source of risks and
overall level of concern as of the time of discussions with the authorities. Non-mutually exclusive risks may interact and
materialize jointly. “Short term” and “medium term” are meant to indicate that the risk could materialize within 1 year
and 3 years, respectively.

CEMAC
36 INTERNATIONAL MONETARY FUND
Source/Likelihood Expected Impact Proposed Policies to Mitigate
Risks
Lower Commodity prices High
Persistently lower energy prices,
triggered by supply factors reversing
only gradually.
Likelihood: high in the medium
term.
Lower oil and other commodity
prices will lower CEMAC exports.
This could threaten the adequacy of
the reserve coverage. Lower
hydrocarbon revenues will erode
fiscal sustainability further in most
CEMAC countries
Eliminate oil subsidy schemes
following the example of Gabon;
widen the non-oil tax base; where
applicable, reform national oil
companies to increase efficiency;
and spur competition in the non-oil
import sector.
Delays in the implementation of
regional and national reforms
High
Weak implementation capacity
and bureaucratic delays both at the
regional and national levels hamper
the pace of reforms. In a low oil-
price environment, CEMAC may find
it even more challenging to support
regional integration.
Likelihood: high in the short term.
Delays in reforms to address
institutional governance and
operational weaknesses could
adversely affect policy
responsiveness.
The absence of significant
progress in public finance and
financial sector reforms could
constrain private investment and
undermine efforts to diversify the
regional economy.
The lack of progress in improving
CEMAC reserve pooling could
undermine regional reserve
coverage, and erode CEMAC’s
external sustainability.
Implement reforms in key regional
institutions. For the BEAC, the
priority should be the finalization of
its modernization plan and the
implementation of FIN’s safeguards
recommendations. The CEMAC
Commission should push for the
implementation of the new regional
surveillance framework and the
finalization of the transposition of
CEMAC’s public finance directives by
member states.
Coordinate national and regional
efforts to improve the business
environment.
Improve the BEAC’s reserve
management system by adopting
the 2015 FSAP recommendations.
Worsening of the Lake Chad
security crisis
High
Security threats would resume and
threaten larger settlements.
Likelihood: medium in the short-
term
Displacement of populations and
interference with economic activities
could affect investment and trade in
affected countries. Additional fiscal
security costs (military spending,
refugee management) could depress
fiscal balances in affected countries.
Create sufficient fiscal buffers by
prioritizing large infrastructure
projects, widening the non-oil tax
base, eliminating oil subsidy
schemes, and where applicable,
reforming national oil companies.

CEMAC
INTERNATIONAL MONETARY FUND 37
Annex II. CEMAC: Response to Past IMF Advice
2015 Regional Consultation Recommendations Authorities’ Response
Po
licy m
ix
Embark on fiscal consolidation to confront the
fall in oil prices.
Resolve the issue of partial repatriation of
reserves by some member states.
Authorities appear committed to macroeconomic policies,
which are consistent with Fund advice. However, some
countries have continued their expansionary fiscal stance,
further reducing policy buffers. Most countries have plans to
initiate some degree of fiscal consolidation in 2016, after
their respective elections.
The BEAC continues to work on a new reserve
management system to address the issue of partial
repatriation of reserves.
Fis
cal
po
licy c
oo
rdin
ati
on
Review the key fiscal convergence criterion on
fiscal balance.
Revise downward the 70 percent of GDP debt
ceiling in an environment of rapidly rising debt
and declining reserves.
Strengthen compliance with, and monitoring of
the regional convergence framework.
The CEMAC Commission has put forward a new
framework, which is not fully consistent with past IMF
advice, but could help mitigate oil revenue volatility. Country
authorities did not support the reduction in the debt ceiling.
The implementation of CEMAC public financial
management (PFM) directives has continued, but has not
been completed; the degree of implementation varies
among countries.
The new convergence framework does not include a new
system to strengthen compliance.
Mo
neta
ry o
pera
tio
ns
/ f
inan
cia
l
secto
r d
evelo
pm
en
t
Pursue the reform of the current monetary
policy framework.
Finalize reforms to strengthen safeguards.
Strengthen the regulatory and supervisory
framework to reinforce financial stability based on
the 2015 FSAP recommendations.
Accelerate the resolution of problem banks.
Adopt measures to stimulate regional interbank
and debt markets.
Monetary policy remains largely ineffective, because of
weak transmission channels, which are hampered by
excessive liquidity and insufficiently deep money and debt
markets. Despite some progress, reform of monetary policy
instruments has been slow.
Progress in the implementation of the safeguards
measures has continued, but progress has been uneven.
Despite progress in the reform of the regulatory
framework, the implementation of key reforms has been
slow.
The revitalization of the regional interbank and debt
markets has been progressing slowly.
Gro
wth
/ r
eg
ion
al
inte
gra
tio
n
Take measures to support the improvement of
the regional business environment.
Strengthen key regional institutions (COBAC,
CEMAC Commission) to implement regional
growth-enhancing policies.
Enhance the quality of the economic and
financial information.
The CEMAC Commission has created a regional business
climate observatory to support improving the business
environment. Some countries have started reforms to
improve the business climate.
The COBAC has increased its headcount by more than
50 percent and its operational capacity has improved. The
CEMAC Commission continues to face significant
operational challenges.
The BEAC is working on a harmonized regional CPI index
and improved monetary statistics.

CEMAC
38 INTERNATIONAL MONETARY FUND
Annex III. CEMAC: External Sustainability Assessment
Based on various methods, the real effective exchange rate appears to be moderately overvalued with
respect to the current account norm and warrants close monitoring. Non-price competitiveness
assessments continue to point to important structural competitiveness issues, which need to be
addressed to ensure that public investment translates into growth and to make the region more
attractive to private investment.
A. Balance of Payments
1. Following the oil-price shock, the regional external current account deficit is projected
to widen in 2016, reflecting a significant deterioration in the trade balance of most of the
Central African Economic and Monetary Community’s (CEMAC) member countries. The current
account deficit grew from 1.8 percent of GDP in 2013 to 9. 4 percent in 2015 (Figure 1). It is expected
to remain high in 2016, reaching 8.1 percent. This deterioration has been driven mainly by sizable
investment programs in most
member states—which have
contributed to higher imports—
and has been compounded by
the fall in oil export proceeds.
In 2016, the current account
deficit in individual member
countries is projected to range
from 5.7 percent of GDP in
Cameroon to 14.9 percent of
GDP in Equatorial Guinea. In the
medium term, a deceleration in
public investments and a slow
recovery in oil exports are
expected to narrow the regional
current account deficit to about 4–5 percent of GDP.
2. Foreign direct investments (FDI) constitute a stable source of external financing. They
have been a steady source of external financing, averaging about 5 percent of GDP in the last
decade (Figure 2). Official aid averaged about 0.8 percent of GDP over the same period, whereas
portfolio investment contributed negatively, at an average of -0.3 percent. Debt-creating financial
flows averaged about 1.2 percent of GDP in the last decade and are expected to remain between
2–3 percent in the medium term. However, net financial inflows did not entirely match the external
financing needs—inducing a projected decline in the official reserves.
-25
-20
-15
-10
-5
0
5
10
15
2013 2014 2015 2016 2017 2018 2019
Figure 1. CEMAC: Current Account Balance, 2012–19
(Percent of GDP)
Cameroon Central African Republic Chad
Congo Equatorial Guinea Gabon
CEMAC
Sources: CEMAC authorities; and IMF staff estimates.

CEMAC
INTERNATIONAL MONETARY FUND 39
Figure 2. CEMAC: External Sector Developments, 2000–16
The regional current account balance has deteriorated -
reflecting the evolution of trade balance and ...
important investment efforts ...
... in most CEMAC countries. Foreign direct investment constitutes a stable source of
external financing, although loans have been decreasing.
The regional real effective exchange rate has
appreciated reflecting the appreciation of the euro and
...
...inflationary pressures in some CEMAC countries.
Sources: CEMAC authorities; International Financial Statistics (IFS); and IMF staff estimates.
-30
-20
-10
0
10
20
30
2000
2001
2002
2003
2004
2005
2006
2007
2008
2009
2010
2011
2012
2013
2014
2015
2016
(est
.)
CEMAC: Current Account Balance, 2000–16
(Percent of GDP)
Income (net) Trade Balance
Current transfers (net) Current Account Balance
-20
0
20
40
2000
2001
2002
2003
2004
2005
2006
2007
2008
2009
2010
2011
2012
2013
2014
2015
2016 (est
.)
CEMAC: Current Account Financing, 2000–16
(Percent of GDP)
Foreign Direct Investment Portfolio investments
Other investment Capital account (incl.grants)
80
85
90
95
100
105
110
115
2009
M1
2009
M6
2009
M11
2010
M4
2010
M9
2011
M2
2011
M7
2011
M12
2012
M5
2012
M10
2013
M3
2013
M8
2014
m1
2014
m6
2014
m11
2015
m4
2015
M9
2016
M2
NEER
REER
US$/CFAF
CEMAC: Real and Nominal Effective Exchange
Rates, 2009–April 2016
(2009M1=100)
-40
-30
-20
-10
0
10
20
30
40
2000
2001
2002
2003
2004
2005
2006
2007
2008
2009
2010
2011
2012
2013
2014
2015
2016 (est
.)
CEMAC: Current Account Balance, 2000–16
(Percent of GDP)
National savings Investment Current account balance
85
105
125
145
165
185
205
225
245
Cameroon Central Afr.
Rep.
Chad Congo Equatorial
Guinea
Gabon
Average 2016M4
CEMAC: Real Effective Exchange Rate of CEMAC
Countries, 2007–April 2016
(2010=100)
Min-max range,
2007-April 2016
-100
-80
-60
-40
-20
0
20
40
Cameroon Central
Afr. Rep.
Chad Congo Equatorial
Guinea
Gabon
CEMAC: Current Account Balances, 2000–16
(Percent of GDP)
Minimum
Maximum
Average
2016 (est.)

CEMAC
40 INTERNATIONAL MONETARY FUND
B. Reserves Adequacy
3. CEMAC’s reserve coverage at end-2015 was below prudent levels and it is projected to
decline in 2016. Regional official reserves are projected to decrease from US$10.1 billion
(CFAF 5,994 billion) at end-2015 to US$7.9 billion (CFAF 4,596 billion) at end-2016, which
corresponds to a decrease from 4.6 months of prospective extra-regional imports to
3.4 months (Figure 3). Reserve adequacy assessment methods give diverging results. Reserve
coverage in 2016 appears adequate using a number of usual metrics—i.e., 39 percent of broad
money; 432 percent of short-term liabilities; and 135 percent in terms of the reserve adequacy ratio,
which is above the level of adequate buffers for crisis prevention. Conversely, in terms of the most
widely used metric (i.e., reserves in terms of prospective imports), reserve coverage in 2016 will
remain below what is considered appropriate for a resource-rich currency union (i.e., 5 months of
imports),1,2 The cost-benefit analysis,3 also indicates that the level of reserves is below the optimal
range, which varies between 4.8 months and 12.0 months of imports, depending on the interest rate
differential with the rest of the world.
Figure 3. BEAC: International Reserves Coverage, 2012–17
Sources: AFR REO-database and IMF staff calculations.
4. Going forward, reserve coverage appears insufficient. It is projected to decline to
about 3.0–3.3 months of imports in the medium term, the lowest level in more than a decade. This
medium-term level is deemed inadequate for a resource-rich currency union. The projected reserve
trajectory could make the Community vulnerable to a further drop in oil prices or another external
shock.
1 “Assessing Reserves Adequacy”, IMF Policy Paper, February 2011; and “Assessing Reserves Adequacy—Specific
Proposals”, IMF Policy Paper, April 2015.
2 These approaches do not take into account the access to reserves guaranteed by the French Treasury under the
Franc Zone arrangements. For more details on the methodology, see IMF Country Report 13/322, 2013.
3 Dabla-Norris, E., J, .I. Kim, and K. Shorono, “Optimal Precautionary Reserves for Low-Income Countries: A Cost-
Benefits Analysis”, IMF Working Paper 11/249, 2011.
0
1
2
3
4
5
6
7
8
2012 2013 2014 2015 2016 2017
(Months of prospective imports)
CEMAC
SSA Oil exporters
WAEMU
0
200
400
600
800
1,000
1,200
1,400
1,600
1,800
0
10
20
30
40
50
60
70
80
90
100
2012 2013 2014 2015 2016 2017
(Percent of other aggregates)
In percent of broad money
In percent of short-term liabilities (RHS)

CEMAC
INTERNATIONAL MONETARY FUND 41
C. Price Competitiveness
5. The assessments of the current account and real effective exchange rate (REER) at the
regional level do not indicate a significant misalignment or price-competitiveness issues. The
REER appreciated by 3.2 percent during the 12 months leading to April 2016, reflecting essentially
the evolution of the nominal effective exchange rate (NEER) and the inflation differential with trading
partners. The NEER appreciated as a result of the CFA franc’s appreciation vis-à-vis the US dollar and
other trading partners’ currencies. Some divergences could be noticed at the individual country level
with about 2 percent REER depreciation in Chad, no change in Gabon, and a 44 percent appreciation
in the Central African Republic. Model-based and other assessments indicate a moderate
overvaluation—6.2 percent on average (Box 1).
D. Structural Competitiveness
6. Survey-based indicators point to important structural competitiveness issues. Various
competitiveness indicators continue to rank CEMAC countries among the worst performers in the
world.
The World Bank‘s 2016 “Doing Business Indicators” show that CEMAC countries remain at the
bottom of the countries
surveyed, with most countries
either stagnating or
regressing in 2016 compared
to 2015 (Figures 4 and 5,
upper panels). CEMAC
countries are behind their
peers in sub-Saharan Africa
and the West African
Economic and Monetary
Union in terms of business
environment.4 The situation is
particularly challenging with
regards to starting a business, getting electricity, and enforcing contracts. Infrastructure remains
inadequate and electricity supply, problematic. Procedures for paying taxes and registering
properties continue to be cumbersome.
The World Bank’s “Governance Indicators” also rank CEMAC countries behind their peers and
show a relative deterioration in the last five years (Figure 5, middle and lower panels). In
particular, the CEMAC lags behind its peers in terms of government effectiveness, accountability,
and quality of regulation.
4 These indicators should be interpreted with caution because of the small number of respondents, a limited
geographical coverage, and standardized assumptions about business constraints and information availability.
-4
0
-1
-2 -2
-6-7
-6
-5
-4
-3
-2
-1
0
Cameroon Central
African
Republic
Chad Congo Equatorial
Guinea
Gabon
Figure 4. Change in Doing Business Ranking, 2015–16
(Units)
Source: World Bank, Doing Business, 2016.

CEMAC
42 INTERNATIONAL MONETARY FUND
Box 1. CEMAC: Current Account and Real Effective Exchange Rate Assessments1
Alternative approaches are applied to assess regional current account and real effective exchange rate (REER)
developments.
The first approach is “EBA-Lite’s” Current Account (CA) model, which compares the underlying current account
balance with the model-estimated current account norm. This model shows a 13.3 percent overvaluation of
the REER in 2015.
The second approach is EBA-Lite’s Index Real
Effective Exchange Rate (IREER). The IREER
regression result for CEMAC indicates a
2.5 percent undervaluation in 2015.
The third approach uses the Bems and
Carvalho’s real annuity method to better
account for natural resource windfall revenues
in CEMAC countries.2 It computes the current
account norm consistent with a long-term
trend in net foreign assets to account for the
impact of oil revenues. This method points to a
16.2 percent positive deviation (i.e., overvaluation) in 2015. However, the model ignores other factors, such as
temporary investment needs, financial frictions, and low investment productivity in CEMAC countries.3
The fourth approach uses Araujo et al.’s. model, which corrects these drawbacks.4 In particular, it estimates the
current account norm consistent with natural resources revenue, investment needs, and real and financial
frictions (absorptive capacities, investment productivity and efficiency, borrowing constraints). The model
indicates a 1.7–2.3 percent REER overvaluation in 2015, depending on the cost overrun assumptions in the
model (60 percent and 40 percent, respectively; see figure above).
Taking into account CEMAC-specific factors, namely the monetary union and the French Treasury’s guarantee,
the results do indicate moderate overall overvaluations of the regional current account and real effective
exchange rate, provided that the current account deficit narrows as expected in the medium term.
1 The alternative Araujo et al. model-based approach was prepared in collaboration with Bin Li and Michele Andreolli. The EBA-Lite
models do not provide a specific template for CEMAC. Hence, as a proxy, we use the EBA-Lite regression coefficients provided by the
IMF’s Strategy and Policy Review Department and CEMAC data, based on purchasing power parity GDP-weighted averages from the
six member countries.
2 Bems, R., Carvalho I. (2009) “Exchange Rate Assessments: Methodologies for Oil Exporting Countries”, IMF Working Paper 09/281.
3 “Macroeconomic Policy Frameworks for Resource-Rich Developing Countries,” IMF Policy Paper, August 2012.
4Araujo, J., Li B., Poplawski-Ribeiro M., Zanna L-F., (2013), “Current Account Norms in Natural Resource Rich and Capital Scare
Economies”, IMF Working Paper 13/80.
Cost overrun
of 40 percent
Cost overrun
of 60 percent
Current account norm (percent of GDP) -5.8 7.1 -1.0 -1.4
Underylying current account (percent of GDP) -9.4 -2.3 -2.3 -2.3
Log REER - norm (percent) 4.63
Log REER - actual (percent) 4.61
Overvaluation (+)/undervaluation (-) (percent)1 23.5 3.4 2.4
Overvaluation (+)/undervaluation (-) (percent)2 13.3 -2.5 16.2 2.3 1.7
Source: IMF staff estimates.1 Based on 0.4 trade elasticity for the Bems and Carvalho, and Araujo et al. methodologies.
2 Based on 0.6 trade elasticity is estimated assuming exports volume and imports volume elasticities equal to zero.
Hakura and Billmeier (2008): "Trade Elasticities in the Middle East and Central Asia: What is the Role of Oil?", WP/08/216, IMF.
CEMAC: External Stability Assessments
Index Real
Effective Exchange
Rate (IREER)
Current
Account (CA)
Bems and Carvalho
Constant Real
Annuity
Araujo et al.
EBA-Lite, 2015 Other Assessments, 2021
-12
-10
-8
-6
-4
-2
0
2015 2016 2017 2018 2019 2020 2021
(cost overrun of 60 percent)
(cost overrun of 40 percent)
Current account (percent of GDP)
CEMAC: Model-Based Current Account Benchmark
(Percent of GDP)
Sources: IMF staff estmates using Araujo et al. (2013).
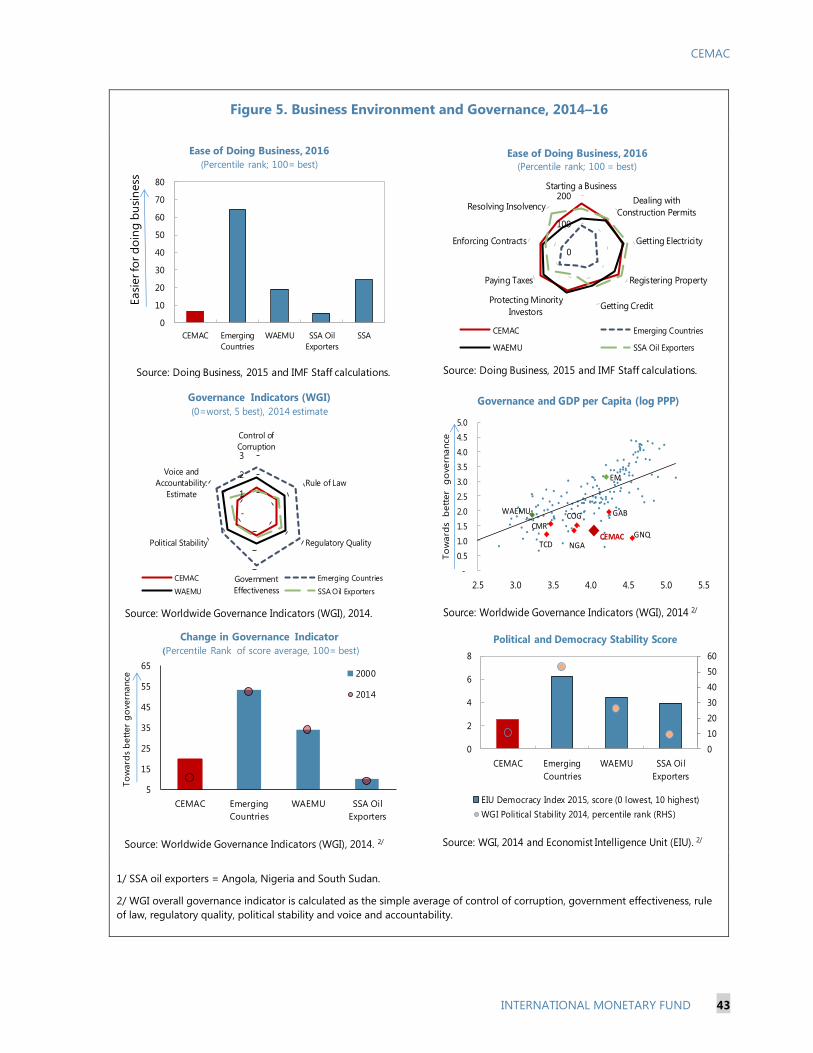
CEMAC
INTERNATIONAL MONETARY FUND 43
Figure 5. Business Environment and Governance, 2014–16
1/ SSA oil exporters = Angola, Nigeria and South Sudan.
2/ WGI overall governance indicator is calculated as the simple average of control of corruption, government effectiveness, rule
of law, regulatory quality, political stability and voice and accountability.
0
10
20
30
40
50
60
70
80
CEMAC Emerging
Countries
WAEMU SSA Oil
Exporters
SSA
Easi
er fo
r d
oin
g b
usi
ness
Ease of Doing Business, 2016
(Percentile rank; 100= best)
Source: Doing Business, 2015 and IMF Staff calculations.
0
100
200Starting a Business
Dealing with
Construction Permits
Getting Electricity
Registering Property
Getting CreditProtecting Minority
Investors
Paying Taxes
Enforcing Contracts
Resolving Insolvency
CEMAC Emerging Countries
WAEMU SSA Oil Exporters
Source: Doing Business, 2015 and IMF Staff calculations.
Ease of Doing Business, 2016
(Percentile rank; 100 = best)
-
1
2
3
Control of
Corruption
Rule of Law
Regulatory Quality
Government
Effectiveness
Political Stability
Voice and
Accountability:
Estimate
Governance Indicators (WGI)
(0=worst, 5 best), 2014 estimate
CEMAC Emerging Countries
WAEMU SSA Oil Exporters
Source: Worldwide Governance Indicators (WGI), 2014.
EM
CMR
TCD
COG
GNQ
GAB
NGACEMAC
WAEMU
-
0.5
1.0
1.5
2.0
2.5
3.0
3.5
4.0
4.5
5.0
2.5 3.0 3.5 4.0 4.5 5.0 5.5
To
ward
s b
ett
er
go
vern
ance
Governance and GDP per Capita (log PPP)
Source: Worldwide Governance Indicators (WGI), 2014 2/
5
15
25
35
45
55
65
CEMAC Emerging
Countries
WAEMU SSA Oil
Exporters
To
ward
s b
ett
er
go
vern
ance
Change in Governance Indicator
(Percentile Rank of score average, 100= best)
2000
2014
Source: Worldwide Governance Indicators (WGI), 2014. 2/
0
10
20
30
40
50
60
0
2
4
6
8
CEMAC Emerging
Countries
WAEMU SSA Oil
Exporters
EIU Democracy Index 2015, score (0 lowest, 10 highest)
WGI Political Stability 2014, percentile rank (RHS)
Political and Democracy Stability Score
Source: WGI, 2014 and Economist Intelligence Unit (EIU). 2/

CEMAC
44 INTERNATIONAL MONETARY FUND
Annex IV. CEMAC: 2015 FSAP Recommendations1
Key Recommendations (By responsible decision-making body)
Impact 1/ Time-
frame
2/
S D
Conference of Heads of State and/or the Ministerial Committee (MC)
1. MC to validate the methodology to assess the optimal level/structure of international reserves.
2. Streamline the procedure for the approval of CEMAC regulations on the financial sector.
3. Formalize cooperation procedures among all the authorities to be involved in a financial crisis. 4. Identify actions to return chairmanship of the BEAC board to the governor.
5. Complete the streamlining of the two competing stock markets. 6. Strengthen the institutional autonomy and accountability of the BEAC and the COBAC. 7. Review the rules and practices for appointing senior staff of the regional financial agencies.
Regional Financial Agencies: BEAC and COBAC
1. Increase the BEAC’s transparency by adopting an appropriate accounting framework. 2. Adopt a regional approach to credit reporting systems, keeping duplications to a minimum. 3. Accelerate implementation of the monetary policy reform. 4. Initiate an asset quality review, at least of the systemic and the most vulnerable banks. 5. Put in place an appropriate lender of last resort framework. 6. Strengthen and formalize the role of the BEAC’s national branches in financial sector reforms. 7. Strengthen the FOGADAC’s pay box function. 8. Continuously strengthen the SG-COBAC’s staffing. 9. Strengthen the prudential framework of lending to connected parties.
10. Review the tools available to the supervisor for implementing risk-based supervision.
11. Establish a mechanism for monitoring financial inclusion.
12. Implement coordinated actions to promote the use of electronic money.
National authorities
1. Ensure that governance of the state-owned banks is consistent with best practices. 2. Streamline mortgage foreclosure procedures within the framework of the OHADA. 3. Secure land rights and strengthen the registration systems. 4. Give preference to official support mechanisms open to all credit institutions. 5. Adopt an AML/CFT prosecution policy (including for predicate offenses). 6. Improve the training/specialization of magistrates and the governance of judicial bodies. 7. Put the national FIUs in Congo and Equatorial Guinea into operation.
1/ S: Stability - D: Development High Average Neutral
2/ Timeframe for implementation Less than a year 1–2 years Over 2 years
1 Prepared by the Financial Stability Assessment Program team.

CEMAC
INTERNATIONAL MONETARY FUND 45
Annex V. CEMAC: Macrofinancial Linkages
A. Context
1. The financial sector in CEMAC is small and highly concentrated. It is dominated by
commercial banks and about 85 percent of total assets belong to foreign banks. Although the
banking sector expanded significantly during the last decade, its size is smaller than in other major
sub-Saharan African economies. In January 2016, CEMAC banking assets represented
CFAF 13 trillion (about US$22.5 billion; 29.9 percent of CEMAC’s GDP), compared to 15.7 percent
in 2004. Banks dominate the financial sector, but microfinance institutions (MFIs) are significant
players in Cameroon and Congo, and in some cases, have become systemic (Congo). Mobile banking
is growing, but it is still a nascent industry.
2. The financial sector does not support CEMAC’s development needs adequately.
Although there are large pockets of excess liquidity in CEMAC, banks are unwilling to extend credit
to the private sector in many instances, because of well-known obstacles (e.g., lack of reliable
financial reporting; weak justice systems). Financial institutions’ resources rely on deposits and their
business model rests about equally on fees and interest rate margins, unlike most banking business
models in the world where interest income is the largest source of revenue. Financial information is
limited and contributes to the lack of trust among institutions, hampering the development of
interbank and debt markets. The regional capital market is small (only four companies are listed) and
fragmented, with two stock exchanges in Douala, Cameroun, and Libreville, Gabon.
B. Macrofinancial Linkages and Risk Spreading
3. The banking sector’s exposure to the public sector is the main transmission channel of
macrofinancial risks (Figure 1). The oil sector is the main driver of economic activity in CEMAC and
generated 59 percent of regional fiscal revenues in the last decade. With the contraction of oil
revenues, public sector bank deposits decreased from 22 percent of total deposits in
September 2014 to 19 percent in January 2016. In addition, the increase in government payment
delays and the scaling down of public investment programs could increase bank’s non-performing
loans (NPLs) to the private sector, in particular the construction sector. Higher NPLs could limit the
profitability of the financial sector and its ability to provide credit to the private sector, and thus
undermine non-oil GDP growth.
4. The direct link between the banking and the oil sectors is weak. At end-January 2016, the
share of loans to extractive industries was only 2.4 percent, and their NPLs represented only
1.4 percent. This link is weak because international oil companies keep their oil revenues abroad and
are externally financed. Moreover, the assets of state-owned oil companies are already included in
the public sector and are covered in the assessment of the link between the public and the banking
sectors (see paragraph 3).
5. Linkages through interbank markets are limited and should hinder the transmission of
shocks. The low level of development of interbank markets explains the weak linkages among
financial institutions. The factors explaining the underdevelopment of these markets include

CEMAC
46 INTERNATIONAL MONETARY FUND
asymmetry of information on credit risk (e.g., the corporate accounts registry—centrale des bilans—is
not fully operational); reluctance of commercial banks to provide liquidity to competitors, which
could help the latter to provide new credits; excess systemic liquidity, which reduces the need for
temporary borrowing; and direct government borrowing from banks, which crowds out the
government bond market. Recent actions of the BEAC to improve its monetary policy framework
may support the development of the interbank market, but it will take some time before these
measures produce their full effects. For example, the BEAC has stopped injecting and borrowing
liquidity at the same time, and started working on a lender of last resort framework, which should
enable it to address specific problems with tailored answers, rather than injecting additional liquidity
into the entire banking system.
Figure 1. CEMAC: Macrofinancial Linkages
Source: IMF.
6. Linkages between MFIs and banks are in some cases strong and require specific
attention. Many banks in CEMAC have created MFIs to access specific client segments, such as
households and small and medium size enterprises (SMEs). In return, the MFIs deposit their excess
liquidity at these banks, as they cannot have an account at the BEAC—except for one MFI. Given that
clients consider MFIs vulnerable, the latter may be subject to liquidity shocks, stemming from
possible deposit runs, which in turn could affect banks with large MFI deposits. The ongoing
liquidations of some MFIs, triggered by severe governance problems, has affected thousands of low-
income savers and highlighted the credit risk that these institutions represent.
C. The Financial Sector’s Health
7. Despite a difficult economic environment, the financial sector has so far weathered the
oil-price shock. Although the situation varies by country and type of institution, banks appear
generally profitable. The increase in NPLs from 11.9 percent of total loans in September 2014 to
12.6 percent in January 2016 did not significantly undermine the soundness of the banking sector.
Monetary
policy
Fiscalpolicy
Real sector(other than oil)
Banking
sector
Exogenous shocks
to the oil sector
Revenue shockRevenue shock
Arrears, less investments
Large use of monetary financing, and international reserves
Excess liquidity reducing the effectiveness of monetary policyReduced access to foreign currencies
Arrears, less deposits
Decrease of credit volume due to higher credit riskMore difficulties to getforeign currencies
Arrears, less deposits

CEMAC
INTERNATIONAL MONETARY FUND 47
The increase in NPLs, however, is significant in the largest CEMAC oil exporting countries where NPLs
were above 19.0 percent at end–January 2016. Construction is the most vulnerable sector for banks.
Similarly, NPLs in microfinance institutions have increased only from 13.3 percent of total loans in
December 2014 to 14.0 percent in September 2015. According to the regional banking
supervisor (COBAC), this level could exceed 20 percent in some important institutions.
8. The financial sector appears generally profitable, but the situation varies by country.
For example, Equatorial Guinea saw a decline of 16 percent in its yearly net banking income
between 2014 and 2015, almost solely explained by a sharp decline in interest rate revenues. In the
same period, Cameroon and Congo saw their yearly net banking income increase by 9 percent and
13 percent, respectively, because of an increase in lending in both countries.
9. Going forward, the current high level of NPLs in some countries could undermine the
soundness of the financial sector and constrain its ability to provide new credits. The solvency
ratios remain comfortable on average, reaching 13.0 percent, with eight of fifty-two banks in CEMAC
not complying with the 8.0 percent norm at end–January 2016. The increase in NPLs may look
small—because the initial level was already high—but remains significant nonetheless. In most
countries this ratio is well below 10 percent.1
10. Although the financial sector has coped so far with the economic downturn, it may not
have enough capacity to withstand further increases in NPLs. Despite recent recapitalizations in
some countries, banks have little spare resources. In January 2016, the banking sector’s excess equity
and long-term debt with respect to total long-term assets were only about CFAF 285 billion (about
USD494 million). Many banks are beset with sizable NPLs, caused by loans granted to connected
parties, in a context of longstanding governance issues. Because of this weakness, they have little
margin to absorb additional risks. Excessive exposure to connected parties remains the critical issue
in CEMAC’s financial sector.
11. Large net oil-exporting countries are the most exposed to further spreading of the
effects of the oil-price shock. Stress tests results show that the average solvency ratio for
Equatorial Guinean banks would decline from 22 percent to 15 percent with the construction sector
becoming the main transmission channel. Gabon would be the second most exposed country, with
stress tests results showing a decline in the average solvency ratio from 15 percent to 8 percent. In
this case, the public sector would be the direct channel because banks have high exposure to the
government.
12. Banks’ excess liquidity at the BEAC remains significant. They represented 12.3 percent of
their total assets in January 2016. Banks could use this excess liquidity to invest in higher yielding
assets, but they remain cautious because of the large uncertainties on credit and liquidity risks.
Moreover, CEMAC banks need to have large liquidity buffers because they cannot rely on easy
refinancing at the BEAC. Their eligible collateral is limited and the pool of outstanding government
bonds is small. Consequently, the level of refinancing at the BEAC is low for most banks; it
represented 1.7 percent of the aggregated sector-wide balance sheet at end–January 2016. At the
1 See http://data.worldbank.org/indicator/FB.AST.NPER.ZS/countries for comparison purposes.

CEMAC
48 INTERNATIONAL MONETARY FUND
same time, banks had only CFAF 123 billion (about USD213 million; 0.9 percent of total assets) of
unused eligible collateral.
13. Some banks have been using their excess liquidity to extend riskier loans. This strategy
could be encouraged by the BEAC’s accommodative monetary policy, which reduces banks’
incentives to discriminate credit risk adequately. In the absence of proper risk assessment tools, such
as a credit bureau, banks should remain careful, and refrain from misusing their excess liquidity.
Foreign-owned banks are in most cases subject to more stringent prudential rules from their parent
companies than locally owned banks, and thus tend to avoid riskier loan practices.
14. Troubled banks remain a critical issue in some CEMAC countries. Eight banks in CEMAC
had negative equity, representing about 4.6 percent of the banking sector’s total assets. The COBAC
should address this issue quickly, as these banks contribute to the lack of confidence among financial
institutions and hamper the development of interbank and money markets. MFIs face similar issues
and the COBAC is working on reinforcing the legal framework of these intuitions by increasing the
minimum capital and strengthening supervisory regulation.
D. Ability of CEMAC Institutions to Prevent Negative Financial Spillovers
15. Bank supervision remains the main protection against negative spillovers through
macrofinancial linkages. The COBAC supervision framework addresses relatively well the credit risk,
but more should be done in relation to loans to connected parties. Many of the 2015 FSAP
recommendations have been implemented—or are planned to be—and should help strengthen
supervision. In addition, the COBAC should also focus on the level of compliance of banks regarding
the quality of the reporting of their financial statements. The supervision of the largest MFIs remains
a major challenge and the ongoing strengthening of the regulatory framework, a top priority.
16. The regional macroprudential framework is at a nascent stage and is hampered by
weak data. Despite the creation of a Financial Stability Committee in 2012, CEMAC institutions do
not have enough capacity to assess risks or develop relevant strategies to absorb shocks. The
Committee should urgently develop a robust set of early warning indicators, covering
macroeconomic indicators, financial institutions, households, government budgets, and financial
markets (e.g., foreign exchange, interest rate).
17. The BEAC has little room to mitigate the effects of the current shock because foreign
reserves have significantly declined and monetary financing has reached its limits. The BEAC
should put in place appropriate measures to preserve foreign reserves. In particular, it should reduce
excess liquidity, and increase its stable resources (i.e., balance sheet liabilities) backing foreign
reserves through its own funds or CEMAC governments’ long-term deposit. On the liquidity side, it
should also urgently finalize its lender of last resort framework to address specific liquidity needs.
18. CEMAC’s weak legal framework undermines the actual value of financial collaterals and
other guarantees. Given that this issue will not be solved in the near term because of the challenges
in CEMAC’s judicial system, banks should avoid overly relying on collateralized credit to hedge
against credit risk. The COBAC should take this issue more into account in its rules when computing
the solvency ratios of banks (for example by increasing the provision rate for NPLs).
CENTRAL AFRICAN ECONOMIC AND
MONETARY COMMUNITY (CEMAC)
STAFF REPORT ON COMMON POLICIES OF MEMBER
COUNTRIES—INFORMATIONAL ANNEX
Prepared By
African Department
(In collaboration with other departments)
RELATIONS OF CEMAC MEMBER COUNTRIES WITH THE FUND _______________________ 2
CONTENTS
June 28, 2016

CEMAC
2 INTERNATIONAL MONETARY FUND
RELATIONS OF CEMAC MEMBER COUNTRIES WITH
THE FUND
Cameroon, Central African Republic (CAR), Chad, Republic of Congo, and Gabon joined the IMF
in 1963, and Equatorial Guinea joined in 1969. All Central African Economic and Monetary
Community (CEMAC) members accepted Article VIII of the IMF articles of agreement on
June 1, 1996.
Relations of the CEMAC Member Countries with the Fund
Cameroon. The last financial arrangement, a Poverty Reduction and Growth Facility (PRGF)
arrangement in an amount equivalent to SDR 18.6 million (about US$26.8 million), expired on
January 31, 2009. The Executive Board approved a SDR 92.9 million (about US$144.1 million)
disbursement under the Rapid-Access Component of the Exogenous Shocks Facility on
July 2, 2009. The last Article IV consultation was concluded on November 18, 2015. Cameroon is
on a 12-month consultation cycle.
Central African Republic. The Executive Board approved financial assistance under the Rapid
Credit Facility (RCF) in the amount of SDR 8.355 million on September 14, 2015 in support of the
Transitional Authorities’ emergency economic recovery program to restore macroeconomic
stability, achieve fiscal consolidation, and strengthen administrative capacity. Total assistance
under the RCF since May 2014 has reached SDR 22.28 million (20 percent of quota). Because of
civil unrest, the last Article IV consultation was concluded on January 30, 2012. In principle, CAR
is on a 12-month consultation cycle.
Chad. The Executive Board approved a three-year ECF arrangement in an amount equivalent to
SDR 79.92 million (about US$122.4 million) on August 1, 2014. It completed the first review of the
ECF arrangement and approved the authorities’ request for an augmentation of access by
SDR 26.64 million (about US$37 million) on April 27, 2015. On April 29, 2015, the Executive
Boards of both IDA and IMF decided that Chad had reached the completion point under the
Heavily Indebted Poor Countries (HIPC) Initiative and supported a debt relief of US$1.1 billion.
The Executive Board completed the second review on December 14, 2015 which brought total
disbursement to SDR 53.93 million (about US$75.1 million). An IMF mission team visited Chad
during March 7–20, 2016 to hold discussions on the third review of the ECF arrangement and
conduct the 2016 Article IV consultation. Broad staff-level agreement has been reached on
conditions for the completion of the third review. Executive Board consideration of the third
review and Article IV consultation is expected to take place in July 2016. The last Article IV
consultation was concluded on February 21, 2014. Chad is on a 24-month consultation cycle.
Republic of Congo. The Executive Board approved a three-year PRGF arrangement for Congo in
an amount equivalent to SDR 8.5 million (about US$12.5 million) on December 8, 2008.The
country reached the Decision Point under the enhanced HIPC initiative on March 8, 2006 and the
Completion Point on January 27, 2010. The three-year Extended Credit Facility (ECF) arrangement
was completed in August 2011. The last Article IV consultation was concluded on July 17, 2015.
Congo has been on a 12-month consultation cycle.

CEMAC
INTERNATIONAL MONETARY FUND 3
Equatorial Guinea. The last financial arrangement, an Enhanced Structural Adjustment
Facility (ESAF) arrangement, in an amount equivalent to SDR 9.9 million, and a Structural
Adjustment Facility (SAF) in an amount equivalent to SDR 3.0 million, both expired on
February 2, 1996. The country is not eligible for assistance under the HIPC initiative. The last
Article IV consultation was concluded on, July 20, 2015. Equatorial Guinea is on a 12-month
consultation cycle.
Gabon. A three-year Stand-By Arrangement, in an amount equivalent to SDR 77.2 million (about
US$117 million) expired on May 7, 2010, with only the first three reviews completed. Gabon is
not eligible for assistance under the HIPC initiative. The last Article IV consultation was concluded
on February 19, 2016. Gabon is on a 12-month consultation cycle.
Safeguards Assessments
The Bank of the Central African States (BEAC) is the regional central bank of CEMAC.
Regional central banks are normally subject to a safeguards assessment every four years. For the
BEAC, governance challenges and control failures, which emerged in 2009, led to close
engagement subsequently through annual IMF monitoring of safeguards “rolling measures.” A
safeguards staff visit to the BEAC conducted in April 2016 found that although the BEAC’s own
Reform and Modernization Plan was nearing completion, the IMF’s two priority
recommendations on governance-focused law reform and the transition to an internationally
recognized financial reporting framework (IFRS) were outstanding. However, following the
April 2016 visit, the BEAC’s Board of Directors mandated that the institution take steps to initiate
work on the priority recommendations. Staff has now revised the road map for implementation
with an envisaged conclusion of the law reform in early 2017 and adoption of IFRS beginning
with the financial statements for 2018. Staff will maintain close engagement with the BEAC to
monitor the implementation of the remaining safeguards measures going forward, and progress
on the latter will remain a condition for new program requests and reviews for CEMAC member
countries.
Exchange System
CEMAC’s currency is the CFA franc. From 1948 to 1999, it was pegged to the French franc. Since the
euro was introduced in 1999, it has been pegged to the euro at the rate of CFAF 655.957 per euro.

CEMAC
4 INTERNATIONAL MONETARY FUND
Article IV Consultation
Following an Executive Board decision in January 2006, discussions with monetary unions have
been formalized and are part of the Article IV consultation process with member countries. The
discussions reported in the companion staff report are thus in relation with Article IV
consultations with the six CEMAC member countries. The Executive Board concluded the last
discussion on common policies of CEMAC members on July 25, 2014. Such discussions are held
on a 12-month cycle.
FSAP Participation and ROSCs
The first regional Financial Sector Assessment Program (FSAP) was carried out during January-
March 2006. Regional Reports on Observance of Standards and Codes (ROSCs) were done in the
areas of monetary and financial policy transparency, banking supervision, and anti-money
laundering and combating the financing of terrorism (AML/CFT) in June 2006. A FSAP update
took place during November 2014-January 2015.

CEMAC
INTERNATIONAL MONETARY FUND 5
Technical Assistance to the Bank of the Central African States, 2011–16
April 2016: MCM workshop on banking supervision to the COBAC.
February 2016: MCM technical assistance (TA) on IFRS implementation.
November 2015: LEG TA on BEAC Charter reform.
June 2015: MCM TA on Liquidity forecasting and management.
June 2015: MCM TA on central bank accounting.
June 2015: MCM TA (AFRITAC Central) on liability management.
April 2015: MCM TA on bank supervision and regulations and financial stability.
November–December 2014: MCM TA bank supervision and regulations.
October 2014: MCM TA risk-based supervision.
May 2014: MCM TA liability management.
April 2014: MCM TA debt management.
March 2014: MCM TA financial soundness indicators.
December 2013: MCM TA sub-regional course on macroeconomic management and debt issues.
July 2013: MCM TA on prudential framework update.
May 2013: MCM TA on central bank governance.
March–April 2012: MCM advisory mission on central bank accounting, monetary operations, and stress
testing.
March 2012: STA TA on development and improvement of monetary and financial statistics and financial
soundness indicators.
October 2011: MCM resident advisor assigned at the COBAC.
July 2011: MCM advisory mission on monetary policy design and implementation.
May 2011: MCM resident general advisor assigned to the Governor of the BEAC on governance,
accounting, and internal controls.

CEMAC
6 INTERNATIONAL MONETARY FUND
Technical Assistance to the Central African Economic and Monetary Community
Commission, 2011–16
January 2016: FAD support to CEMAC public financial management (PFM) directives implementation.
November 2015: FAD public financial management advisor.
November 2015: FAD customs administration CEMAC regional workshop.
November 2014: FAD customs administration CEMAC regional workshop.
June 2014: FAD support to CEMAC directives implementation.
January 2014: FAD CEMAC customs administration workshop.
March–June 2013: FAD TA missions on CEMAC’s PFM directives implementation.
May, June, and November 2012: TA missions on CEMAC’s PFM directives implementation.
May 2012: CEMAC customs administration workshop.
April 2012: FAD and STA participation in the CEMAC workshop on the design of an implementation
strategy for new PFM directives and implementation of the GFSM 2001 directive
March 2012: FAD TA on the development of technical guides.
March 2012: STA TA on the preparation of guidelines for the Tableau des opérations financières de l’État
(TOFE) directive.
July 2011: FAD TA on assessment of CEMAC’s technical assistance needs.
February and April 2011: FAD and STA participation in workshops on the design of new PFM directives
and the draft TOFE.
February 2011: STA participation in the CEMAC workshop on the analysis of macroeconomic
aggregates.
Statement by Mr. Yambaye, Executive Director for the Central African Economic and Monetary Community (CEMAC),
and Mr. N'Sonde, Senior Adivsor to the Executive DirectorJuly 13, 2016
On behalf of our authorities, we express our appreciation to Management for the continued
dialogue with the Central African Economic and Monetary Community (CEMAC). The
Managing Director’s visit last January to the Community’s institutions and member countries in
Yaoundé, Cameroon was the most recent illustration of this excellent relationship. This visit had
been greatly anticipated and met its expectations as a moment of candid and fruitful exchange of
views on policy challenges facing the region. The authorities also welcomed Management’s
subsequent visit to a member country—Chad—confronted with heightened security issues.
Economic and financial performance of the region has been adversely affected by the sharp drop
in oil prices and the security situation. Average GDP growth fell to 1.6 percent in 2015 and is
expected to increase to 1.9 percent in 2016, with further improvements over the medium term.
The inflation rate has remained under control and is estimated at 2.3 percent in 2015. It is
projected to fall to 2 percent in 2016. The overall fiscal balance (excluding grants) is expected to
increase slightly to 6.8 percent of GDP in 2016 from 6.4 percent in 2015, as a result of measures
undertaken. However, there has been a significant increase in the current account balance of the
region to 9.4 percent of GDP in 2015, mainly due to the fall in oil prices. This deficit is projected
to be reduced to 5.2 percent in 2016, with the level of international reserves to be around 3
months of imports,
The CEMAC authorities continue to value highly the policy discussions with staff and their
advice, especially at challenging times characterized by shocks of unprecedented multiplicity and
magnitude. On a number of issues, they concur with staff’s assessment and policy
recommendations, notably as regards the economic outlook, concerns about falling reserves, the
need for fiscal adjustment, and the unexploited potential of the financial sector in fostering private
sector activity. Nevertheless, while the impact of exogenous shocks has brought to the fore
vulnerabilities and risks, the authorities’ views differ somewhat from staff’s in certain areas.
These include the calibrating of the policy mix, the efforts and commitment by some regional
institutions to meet their mandate and effectively contribute to
regional integration; and the rationale for a supportive monetary policy stance to help sustain
activity. They are somewhat concerned with the general tone of the main report, which does not
highlight enough the authorities’ efforts to weather the shocks and can send an alarming signal on
the state of the region.
I. MULTIPLE SHOCKS AND ECONOMIC IMPLICATIONS
The CEMAC region seems to be a good example of what a region can endure with multiple
shocks affecting its economies. The lower oil prices are having a significant toll on the region’s
oil exporters—five of the six member countries—through heavy fiscal burden and widening
current account deficits. The security situation in the Lake Chad region adds to the economic and

2
financial strain in some countries, notably Cameroon and Chad. Central African Republic is
slowly emerging from a long period of socio-political strife. Political tensions in a year of
elections contributed to holding back activity.
Countries like Gabon and Cameroon also face the challenge of tightening financial market
conditions stemming from monetary policy normalization in advanced economies. Already,
capital market rates have increased, spreads further diverged and access to market could prove
more challenging going forward.
The insecurity created by Boko Haram in the Lake Chad region has led Cameroun and Chad to
expend significant budget resources to counter the danger and risks. While progress is being
achieved in reducing this threat, it is important to note that combatting terrorist activities has taken
a huge toll on countries’ budgets and will continue to require important resources.
Weather-related challenges add to the shocks, notably in Chad where drought continues to
advance, episodically causing displacements of populations and requiring budget resources to
cope with humanitarian crises and support agriculture production.
As a result of these economic and non-economic shocks, regional growth has dropped
significantly in 2015 and will remain subdued this year, while medium-term prospects have
turned uncertain. The regional authorities are cognizant of the need to tackle fiscal dominance
through fiscal rules, and start rebuilding depleted buffers.
These shocks, notably the oil price decline, have also dampened the public sector’s bank deposits.
It could harm banks’ balance sheets through higher non-performing loans stemming from
governments’ difficulties in meeting their payment obligations and trimmed infrastructure
programs. These would have adverse implications for credit and non-oil GDP growth.
II. POLICY AND REFORM PRIORITIES
Against the backdrop, the CEMAC authorities have endeavored to dampen the impact of the
shocks and maintain somewhat the long-term development goals, by using the policy mix. In this
regard, the BEAC has used instruments at its disposal for an accommodative monetary policy to
supplement fiscal consolidation and preserve a minimum level of growth-enhancing capital
spending. Our authorities are mindful that more effort is needed in a context of reduced fiscal
buffers and international reserves, rising macroeconomic imbalances, but also long-lasting
structural weaknesses. In particular, they are committed to further fiscal adjustment, particularly
in the context of a fixed exchange rate regime; strengthen regional stability through an appropriate
regional integration framework; improve the monetary policy transmission channels; and enhance
financial sector soundness. Enhancing the capacities of regional institutions to carry out their
respective mandate is a key concern of the CEMAC authorities.
1. Ensuring Fiscal Sustainability
CEMAC authorities fully agree with staff on the necessity to encourage fiscal adjustment at the
country level. Nonetheless, they are of the view that the staff report does not stress enough the

3
consolidation efforts most of the region’s authorities have undertaken in the face of falling oil
receipts and severe security conditions. Over the past years, almost all the CEMAC countries have
initiated sizable fiscal adjustments by making revisions to successive budgets with large spending
cuts. Going forward, the authorities share the view that fiscal consolidation should be attentive of
the need to avoid a recessionary stance, being mindful of the significant growth impulse from
infrastructure investments. Prioritization is of paramount importance. Broadening the tax base will
help expand revenues while improving the quality of expenditure and prioritizing infrastructure
projects on the basis of their economic return and cross-sector spillovers should be pursued.
Already, a number of projects are on hold in many member countries.
The regional authorities remain committed to encouraging prudent borrowing policies to ensure
debt sustainability. Nevertheless, they share the view that, with the exception of one country, debt
ratios remain manageable. Thus, where room exists, borrowing—preferably on concessional
terms—should be pursued to meet critical development needs. In this regard, they agree on the
need to revitalize regional debt markets, promote coordination among national Treasuries to plan
debt issuances and favor stronger competition among market participants. They view the creation
of a regional public debt issuance institution as a longer term objective.
2. Tackling Monetary Policy Challenges
Accommodative monetary policy has helped weather the impact of shocks on fiscal positions, and
sustain growth and development plans somewhat amid an exceptional period of severe exogenous
shock(s). In the face of collapsing oil revenue for most countries in the region, the direct and
indirect monetary policy tools used by the BEAC were deemed the most appropriate and effective
to safeguard critical public spending and credit to the private sector. The BEAC has already
rescinded some of these tools including the statutory advances.
The authorities will pursue these efforts of calibrating monetary and fiscal tools to face shocks,
preserve macroeconomic stability and long-term growth as well. In so doing, they will build on
the progress achieved in reforming monetary policy tools, including the establishment of a
liquidity forecasting framework, the decision to standardize the rates of reserve requirements
across banks and the halt to simultaneous injections and withdrawals of liquidities. They will put
in place this year a new repo contract which will reduce credit risk and promote the development
of interbank operations. In parallel, efforts must be pursued at the country level to improve the
business environment, which will contribute to developing the interbank and debt markets.
The regional authorities remain open to pursuing dialogue with Fund staff on how to further
improve monetary policy instruments.
3. Strengthening the Financial Sector
Financial institutions in CEMAC are broadly profitable, liquid and solvent, although there exist a
few troubled banks. The authorities welcome and agree with staff’s assessment of the region’s
financial sector and macrofinancial linkages, including the increasing vulnerabilities shown
through stress tests. They remain vigilant to developments in the banking sector, notably
regarding troubled banks for which interim administrators will be envisaged every time needed.

4
The authorities emphasize the role played by microfinance institutions in promoting financial
inclusion, and thus, should be promoted along with appropriate regulation and supervision.
The banking Commission, COBAC, is now endowed with strong human capacity to enable closer
supervision, more frequent on-site inspections of banks and microfinance institutions.
4. Addressing Structural Competitiveness
The authorities agree with staff’s analysis on the structural weaknesses that impede
competitiveness. They are aware that strengthening the economies’ resilience will require tackling
these bottlenecks, notably through closing critical infrastructure gaps (energy, roads,
telecommunications) and improve the business environment, notably in the areas of paying taxes,
ease of doing business, and judicial systems.
Enhancing the Regional Convergence Framework and Regional Institutions
The authorities have put in place a new regional convergence framework. This new framework
has been submitted to the Heads of States for approval, with the view to reinforcing its legitimacy
and ownership.
All regional institutions are being strengthened and encouraged to cooperate closely Thus, the
CEMAC Commission and BEAC will be strengthened, notably in data sharing. In addition, the
CEMAC PFM directives are being pushed for incorporation into national legislation, with
expected major progress by end-2017. Other regional institutions, including the development
bank (BDEAC) and the agency in charge of enforcing AML/CFT requirements (GABAC) are
being endowed with adequate capacities to meet their respective mandates.
III. CONCLUSION
The regional authorities have reaffirmed their commitment to put in place the necessary policies
to reduce fiscal and macrofinancial vulnerabilities, strengthen policy frameworks, ensure effective
compliance with the new convergence framework, enhance regional institutions while pushing
efforts to lift the structural impediments to competitiveness. They are reflecting on policies and
reforms to weather the economies against wide oil cycles going forward. Enhanced support from
the Fund at both regional and country levels—in the form of policy advice, technical assistance
and, where required, financial support—will be critical to complement the authorities’ envisaged
policies and reforms, help weather existing shocks, enhance resilience, and put the economy of
the region on a path to more sustainable growth and development.