imf policy paper - imf -- international monetary fund … · · 2016-12-12imf policy paper small...
TRANSCRIPT
© 2016 International Monetary Fund
IMF POLICY PAPER SMALL STATES’ RESILIENCE TO NATURAL DISASTERS AND CLIMATE CHANGE—ROLE FOR THE IMF
IMF staff regularly produces papers proposing new IMF policies, exploring options for reform, or reviewing existing IMF policies and operations. The following documents have been released and are included in this package: The Staff Report, prepared by IMF staff and completed on November 7, 2016 for the
Executive Board’s consideration on December 1, 2016.
The IMF’s transparency policy allows for the deletion of market-sensitive information and premature disclosure of the authorities’ policy intentions in published staff reports and other documents.
Electronic copies of IMF Policy Papers
are available to the public from http://www.imf.org/external/pp/ppindex.aspx
International Monetary Fund
Washington, D.C.
December 2016
SMALL STATES’ RESILIENCE TO NATURAL DISASTERS AND CLIMATE CHANGE—ROLE FOR THE IMF
EXECUTIVE SUMMARY
Small developing states are disproportionately vulnerable to natural disasters. On average, the annual cost of disasters for small states is nearly 2 percent of GDP—more than four times that for larger countries. This reflects a higher frequency of disasters, adjusted for land area, as well as greater vulnerability to severe disasters. About 9 percent of disasters in small states involve damage of more than 30 percent of GDP, compared to less than 1 percent for larger states. Greater exposure to disasters has important macroeconomic effects on small states, resulting in lower investment, lower GDP per capita, higher poverty, and a more volatile revenue base.
One-third of small developing states are also highly or extremely vulnerable to climate change in the lifetime of the current generation. Climate change is projected to affect small states disproportionately, partly by exacerbating natural disasters and partly through more gradual effects such as rising sea level. Small states will thus face much larger economic costs from climate change than larger peers. The impact on important economic sectors (agriculture, tourism, fishing) and pressures on ecosystems could exacerbate poverty and emigration.
Well-designed domestic policies can reduce the direct human and economic costs of climate change and natural disasters. A range of macroeconomic policy approaches will be needed—including not only better disaster response but much more focus on risk reduction and preparedness. These policies should be developed on a proactive basis (not only after disasters have hit), and integrated into core PFM, investment, and debt management frameworks. Risks to the financial sector should similarly be assessed and crisis management frameworks adopted. Risk reduction efforts will improve the business climate, encourage new investments, and help sustain stronger medium-term growth. Capacity building support from the Fund and other development partners will remain critical.
Financing is needed for risk reduction and response to natural disasters and climate change. Advance planning should provide for a combination of fiscal buffers, contingent financing plans, and risk transfer arrangements. Too often, however, disaster financing is largely identified “after the event”. Partly as a result, larger disasters appear
November 4, 2016
SMALL STATES
2 INTERNATIONAL MONETARY FUND
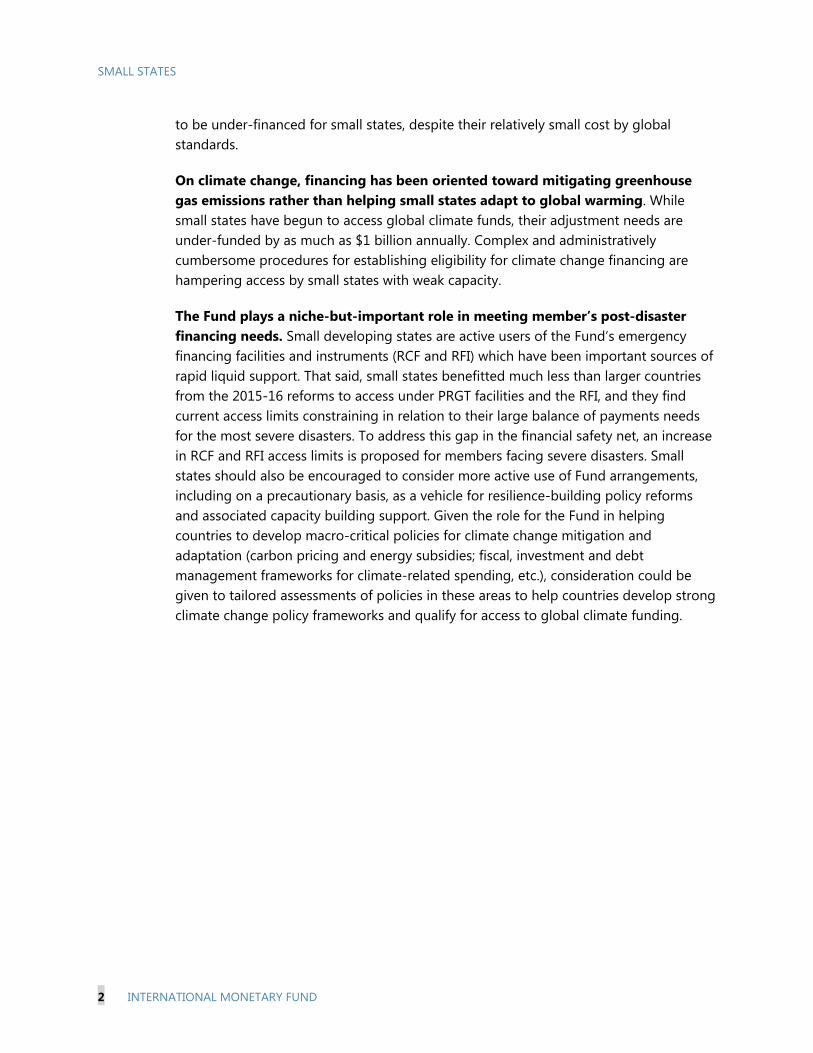
to be under-financed for small states, despite their relatively small cost by global standards.
On climate change, financing has been oriented toward mitigating greenhouse gas emissions rather than helping small states adapt to global warming. While small states have begun to access global climate funds, their adjustment needs are under-funded by as much as $1 billion annually. Complex and administratively cumbersome procedures for establishing eligibility for climate change financing are hampering access by small states with weak capacity.
The Fund plays a niche-but-important role in meeting member’s post-disaster financing needs. Small developing states are active users of the Fund’s emergency financing facilities and instruments (RCF and RFI) which have been important sources of rapid liquid support. That said, small states benefitted much less than larger countries from the 2015-16 reforms to access under PRGT facilities and the RFI, and they find current access limits constraining in relation to their large balance of payments needs for the most severe disasters. To address this gap in the financial safety net, an increase in RCF and RFI access limits is proposed for members facing severe disasters. Small states should also be encouraged to consider more active use of Fund arrangements, including on a precautionary basis, as a vehicle for resilience-building policy reforms and associated capacity building support. Given the role for the Fund in helping countries to develop macro-critical policies for climate change mitigation and adaptation (carbon pricing and energy subsidies; fiscal, investment and debt management frameworks for climate-related spending, etc.), consideration could be given to tailored assessments of policies in these areas to help countries develop strong climate change policy frameworks and qualify for access to global climate funding.
SMALL STATES
INTERNATIONAL MONETARY FUND 3
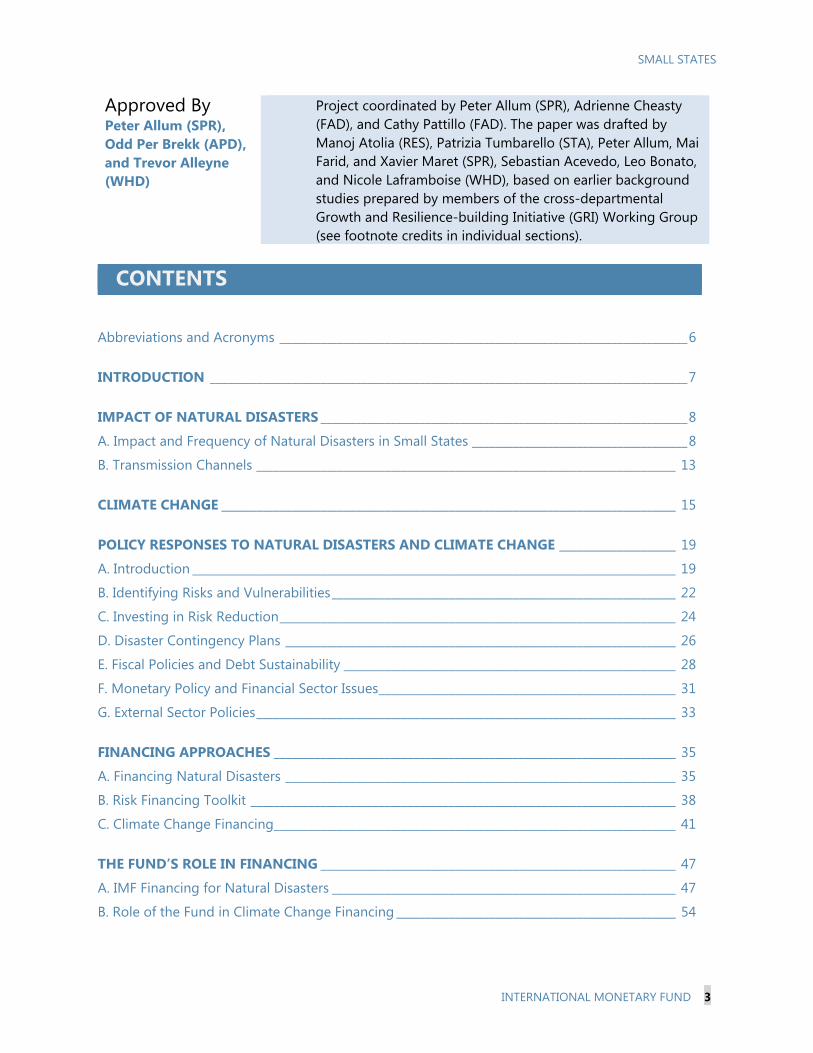
Approved By Peter Allum (SPR), Odd Per Brekk (APD), and Trevor Alleyne (WHD)
Project coordinated by Peter Allum (SPR), Adrienne Cheasty (FAD), and Cathy Pattillo (FAD). The paper was drafted by Manoj Atolia (RES), Patrizia Tumbarello (STA), Peter Allum, Mai Farid, and Xavier Maret (SPR), Sebastian Acevedo, Leo Bonato, and Nicole Laframboise (WHD), based on earlier background studies prepared by members of the cross-departmental Growth and Resilience-building Initiative (GRI) Working Group (see footnote credits in individual sections).
CONTENTS
Abbreviations and Acronyms ______________________________________________________________________ 6
INTRODUCTION __________________________________________________________________________________ 7
IMPACT OF NATURAL DISASTERS _______________________________________________________________ 8
A. Impact and Frequency of Natural Disasters in Small States _____________________________________ 8
B. Transmission Channels ________________________________________________________________________ 13
CLIMATE CHANGE ______________________________________________________________________________ 15
POLICY RESPONSES TO NATURAL DISASTERS AND CLIMATE CHANGE ____________________ 19
A. Introduction ___________________________________________________________________________________ 19
B. Identifying Risks and Vulnerabilities ___________________________________________________________ 22
C. Investing in Risk Reduction ____________________________________________________________________ 24
D. Disaster Contingency Plans ___________________________________________________________________ 26
E. Fiscal Policies and Debt Sustainability _________________________________________________________ 28
F. Monetary Policy and Financial Sector Issues ___________________________________________________ 31
G. External Sector Policies ________________________________________________________________________ 33
FINANCING APPROACHES _____________________________________________________________________ 35
A. Financing Natural Disasters ___________________________________________________________________ 35
B. Risk Financing Toolkit _________________________________________________________________________ 38
C. Climate Change Financing _____________________________________________________________________ 41
THE FUND’S ROLE IN FINANCING _____________________________________________________________ 47
A. IMF Financing for Natural Disasters ___________________________________________________________ 47
B. Role of the Fund in Climate Change Financing ________________________________________________ 54
SMALL STATES
4 INTERNATIONAL MONETARY FUND
ISSUES FOR DISCUSSION _______________________________________________________________________ 55 BOXES 1. Definition and Vulnerabilities of Small States ___________________________________________________ 7 2. Data on Natural Disasters _____________________________________________________________________ 10 3. Climate Change Basics _________________________________________________________________________ 17 4. Integrating Natural Disasters and Climate Change into IMF Macro-frameworks and Risk Analysis _____________________________________________________________________________ 22 5. Fiscal Risk Management and Fiscal Risk Statements ___________________________________________ 23 6. Risk Reduction Approaches ___________________________________________________________________ 24 7. Improving Public Investment Efficiency with PIMA ____________________________________________ 26 8. Examples of Disaster-Related Safety Nets _____________________________________________________ 28 9. A Case Study on IMF Capacity Building on PFM Practices—Pacific Islands ____________________ 29 FIGURES 1. Disaster Distribution for Small and Larger States ______________________________________________ 12 2. Small States: Number of Natural Disasters per Year ___________________________________________ 13 3. Migration from Small Developing States ______________________________________________________ 19 4. Disaster Financing Risk Layering Model _______________________________________________________ 37 5. Global Climate Finance Flows (2014, US$ billions) _____________________________________________ 42 6. Progress Toward the S$100 Billion Goal, 2013-2014 __________________________________________ 43 7. Small Developing States' Share of ODA flows _________________________________________________ 45 8. Institutional Capacity and Access to Multilateral Climate Finance, 2003–15 ___________________ 47 9. Annual Access Ceilings under RCF and RFI ____________________________________________________ 50 TABLES 1. Average Effects of Disasters by Region and Income, 1950–2014 ________________________________ 9 2. Average Effects of Disasters by Type, 1950–2014 _______________________________________________ 9 3. Average Annual Effects of Disasters ___________________________________________________________ 11 4. Sources of Post-Disaster Fiscal and BOP Financing ____________________________________________ 38 5. Climate Change Financing to Small Developing States—2014 ________________________________ 44 6. Countries experiencing severe natural disasters, 2000-15 _____________________________________ 53 References _______________________________________________________________________________________ 57 ANNEXES I. Relative Vulnerabilities of Small States to Natural Disasters and Climate Change _____________ 65 II. Macroeconomic Impacts if Natural Disasters __________________________________________________ 67 III. Vanuatu: Coping with the Damages of Cyclone Pam—Policy Lessons ________________________ 69 IV. Tailoring Macroeconomic Frameworks and Risk Analysis for Natural Disasters and Climate Change _______________________________________________________________________________ 71 V. Exploring the Use of Model-Based Approaches to Assess the Economic Impact of Natural Disasters ______________________________________________________________________________ 82
SMALL STATES
INTERNATIONAL MONETARY FUND 5
VI. World Bank Financing for Natural Disasters __________________________________________________ 87 VII. Financing Practices for Past Natural Disasters _______________________________________________ 88 VIII. Design and Use of Government Deposit Buffers ____________________________________________ 92 IX. Innovative Risk Transfer Approaches _________________________________________________________ 94 X. Fund Financing for Natural Disasters __________________________________________________________ 97

SMALL STATES
6 INTERNATIONAL MONETARY FUND
Abbreviations and Acronyms
CAT bond Catastrophe bond CAT DDO Catastrophe Deferred Drawdown Option CCRIF Caribbean Catastrophe Risk Insurance Facility CCR Trust Catastrophe Containment and Relief Trust CO2 Carbon dioxide COP Conference of the Parties (of the UN Framework Convention on Climate Change) DIG Debt, Investment and Growth model DSA Debt Sustainability Analysis EBF Extra-Budgetary Fund ECF Extended Credit Facility EM-DAT Natural disasters database maintained by Université Catholique de Louvain ENDA Emergency Natural Disaster Assistance FSAP Financial Sector Assessment Program GHG Greenhouse gases IPCC Intergovernmental Panel on Climate Change LAC Latin America and Caribbean LIDC Low-income developing country MENA Middle Eastern and North African countries PDNA Post-Disaster Needs Assessment PFM Public Financial Management PIMA Public Investment Management Assessment PPP Public-private partnership RCF Rapid Credit Facility RFI Rapid Financing Instrument SBA Stand-By Arrangement SCF Stand-by Credit Facility SEA South East Asia SIDS Small Island Developing States SLR Sea-level rise SSA Sub-Saharan Africa
INTERNATIONAL MONETARY FUND 7
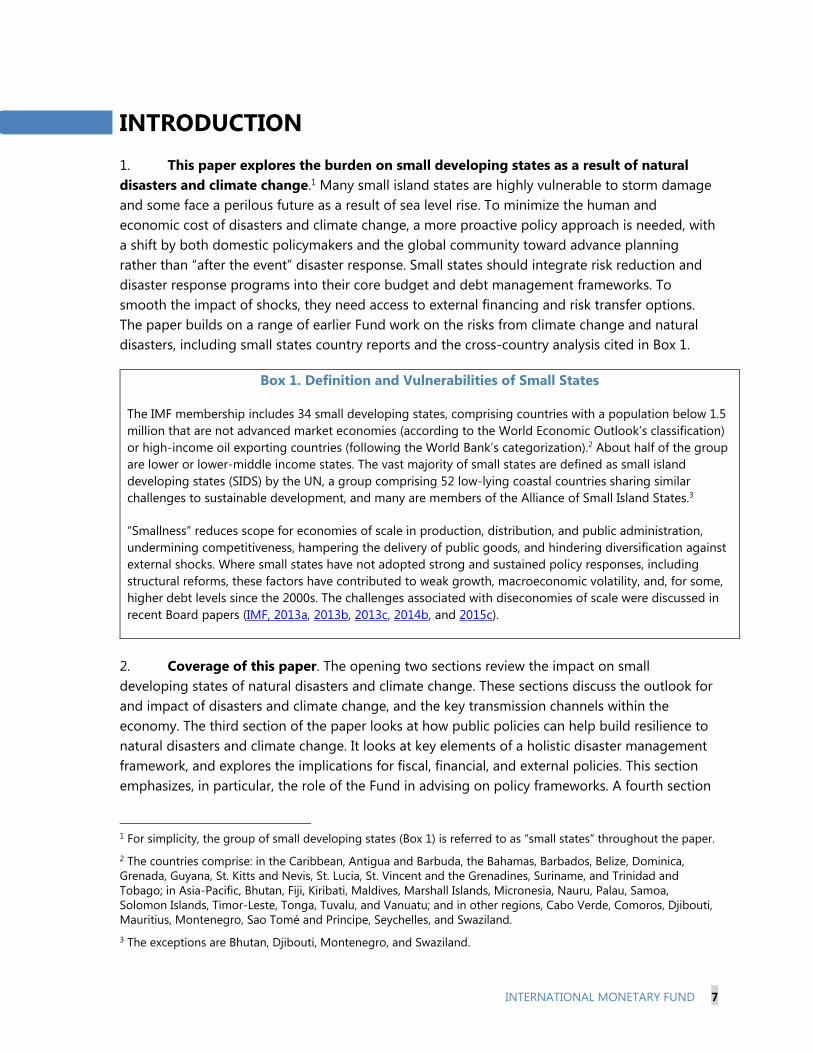
INTRODUCTION 1. This paper explores the burden on small developing states as a result of natural disasters and climate change.1 Many small island states are highly vulnerable to storm damage and some face a perilous future as a result of sea level rise. To minimize the human and economic cost of disasters and climate change, a more proactive policy approach is needed, with a shift by both domestic policymakers and the global community toward advance planning rather than “after the event” disaster response. Small states should integrate risk reduction and disaster response programs into their core budget and debt management frameworks. To smooth the impact of shocks, they need access to external financing and risk transfer options. The paper builds on a range of earlier Fund work on the risks from climate change and natural disasters, including small states country reports and the cross-country analysis cited in Box 1.
Box 1. Definition and Vulnerabilities of Small States
The IMF membership includes 34 small developing states, comprising countries with a population below 1.5 million that are not advanced market economies (according to the World Economic Outlook’s classification) or high-income oil exporting countries (following the World Bank’s categorization).2 About half of the group are lower or lower-middle income states. The vast majority of small states are defined as small island developing states (SIDS) by the UN, a group comprising 52 low-lying coastal countries sharing similar challenges to sustainable development, and many are members of the Alliance of Small Island States.3
“Smallness” reduces scope for economies of scale in production, distribution, and public administration, undermining competitiveness, hampering the delivery of public goods, and hindering diversification against external shocks. Where small states have not adopted strong and sustained policy responses, including structural reforms, these factors have contributed to weak growth, macroeconomic volatility, and, for some, higher debt levels since the 2000s. The challenges associated with diseconomies of scale were discussed in recent Board papers (IMF, 2013a, 2013b, 2013c, 2014b, and 2015c).
2. Coverage of this paper. The opening two sections review the impact on small developing states of natural disasters and climate change. These sections discuss the outlook for and impact of disasters and climate change, and the key transmission channels within the economy. The third section of the paper looks at how public policies can help build resilience to natural disasters and climate change. It looks at key elements of a holistic disaster management framework, and explores the implications for fiscal, financial, and external policies. This section emphasizes, in particular, the role of the Fund in advising on policy frameworks. A fourth section
1 For simplicity, the group of small developing states (Box 1) is referred to as “small states” throughout the paper. 2 The countries comprise: in the Caribbean, Antigua and Barbuda, the Bahamas, Barbados, Belize, Dominica, Grenada, Guyana, St. Kitts and Nevis, St. Lucia, St. Vincent and the Grenadines, Suriname, and Trinidad and Tobago; in Asia-Pacific, Bhutan, Fiji, Kiribati, Maldives, Marshall Islands, Micronesia, Nauru, Palau, Samoa, Solomon Islands, Timor-Leste, Tonga, Tuvalu, and Vanuatu; and in other regions, Cabo Verde, Comoros, Djibouti, Mauritius, Montenegro, Sao Tomé and Principe, Seychelles, and Swaziland. 3 The exceptions are Bhutan, Djibouti, Montenegro, and Swaziland.
SMALL STATES
8 INTERNATIONAL MONETARY FUND
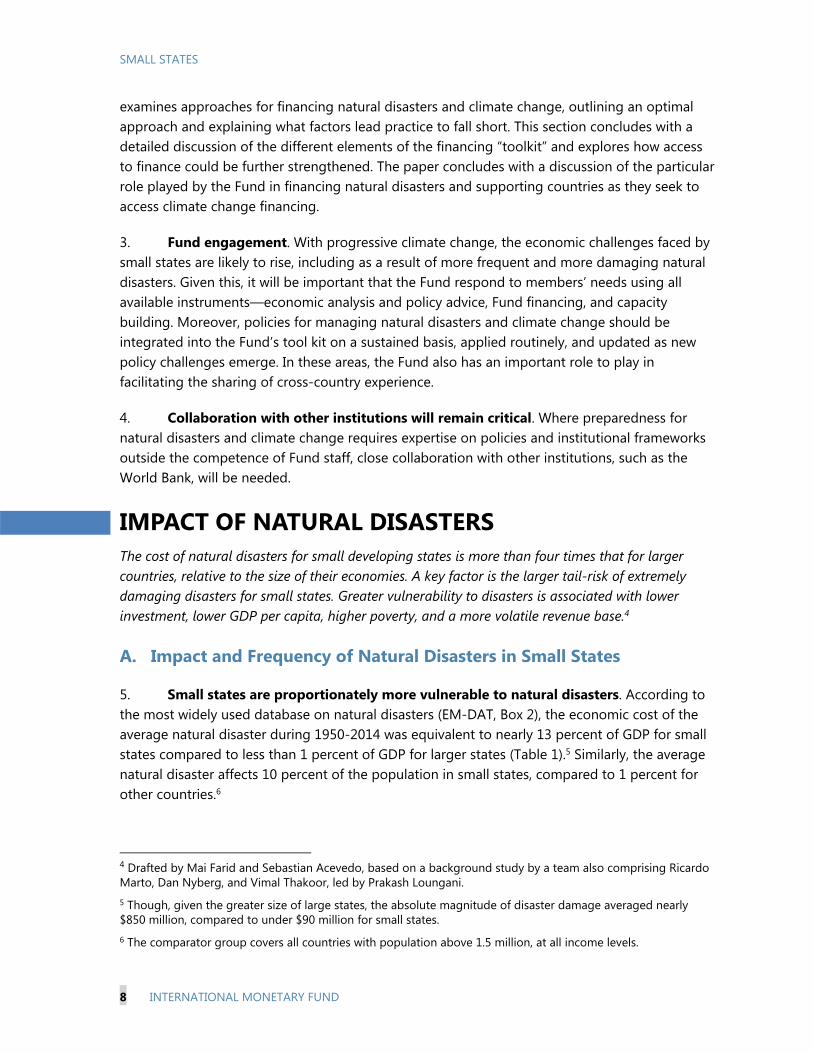
examines approaches for financing natural disasters and climate change, outlining an optimal approach and explaining what factors lead practice to fall short. This section concludes with a detailed discussion of the different elements of the financing “toolkit” and explores how access to finance could be further strengthened. The paper concludes with a discussion of the particular role played by the Fund in financing natural disasters and supporting countries as they seek to access climate change financing.
3. Fund engagement. With progressive climate change, the economic challenges faced by small states are likely to rise, including as a result of more frequent and more damaging natural disasters. Given this, it will be important that the Fund respond to members’ needs using all available instruments—economic analysis and policy advice, Fund financing, and capacity building. Moreover, policies for managing natural disasters and climate change should be integrated into the Fund’s tool kit on a sustained basis, applied routinely, and updated as new policy challenges emerge. In these areas, the Fund also has an important role to play in facilitating the sharing of cross-country experience.
4. Collaboration with other institutions will remain critical. Where preparedness for natural disasters and climate change requires expertise on policies and institutional frameworks outside the competence of Fund staff, close collaboration with other institutions, such as the World Bank, will be needed.
IMPACT OF NATURAL DISASTERS The cost of natural disasters for small developing states is more than four times that for larger countries, relative to the size of their economies. A key factor is the larger tail-risk of extremely damaging disasters for small states. Greater vulnerability to disasters is associated with lower investment, lower GDP per capita, higher poverty, and a more volatile revenue base.4
A. Impact and Frequency of Natural Disasters in Small States
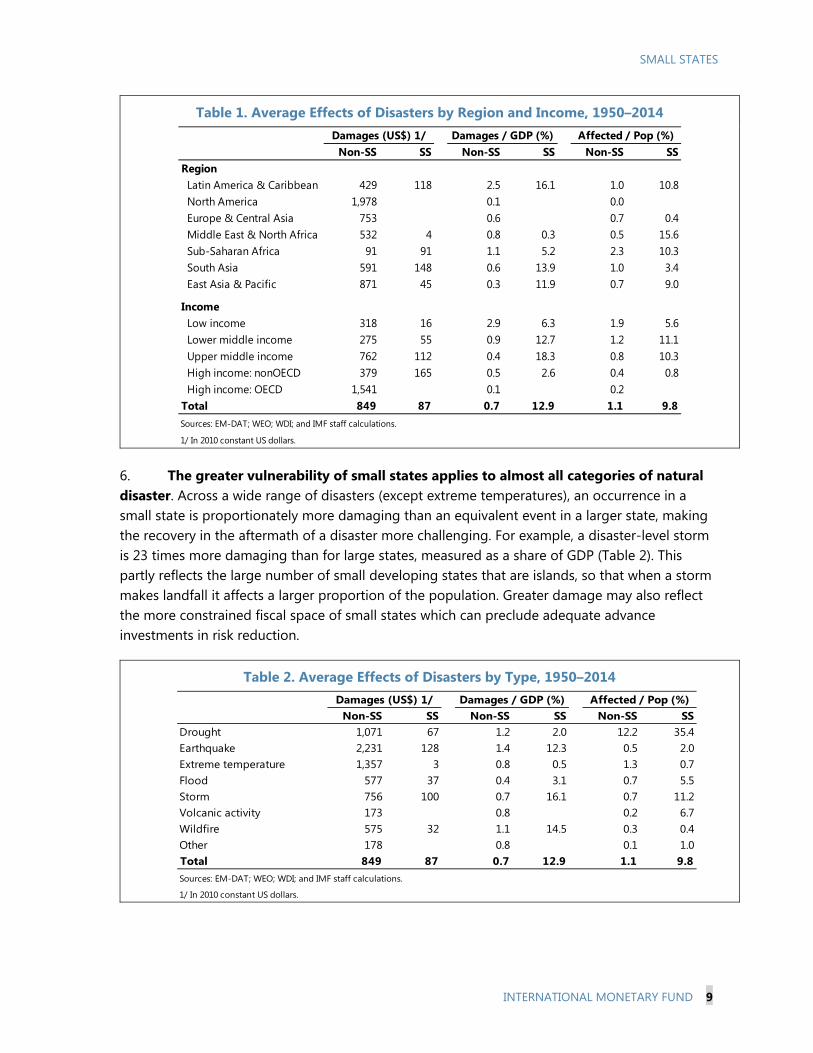
5. Small states are proportionately more vulnerable to natural disasters. According to the most widely used database on natural disasters (EM-DAT, Box 2), the economic cost of the average natural disaster during 1950-2014 was equivalent to nearly 13 percent of GDP for small states compared to less than 1 percent of GDP for larger states (Table 1).5 Similarly, the average natural disaster affects 10 percent of the population in small states, compared to 1 percent for other countries.6
4 Drafted by Mai Farid and Sebastian Acevedo, based on a background study by a team also comprising Ricardo Marto, Dan Nyberg, and Vimal Thakoor, led by Prakash Loungani. 5 Though, given the greater size of large states, the absolute magnitude of disaster damage averaged nearly $850 million, compared to under $90 million for small states. 6 The comparator group covers all countries with population above 1.5 million, at all income levels.
SMALL STATES
INTERNATIONAL MONETARY FUND 9
Table 1. Average Effects of Disasters by Region and Income, 1950–2014
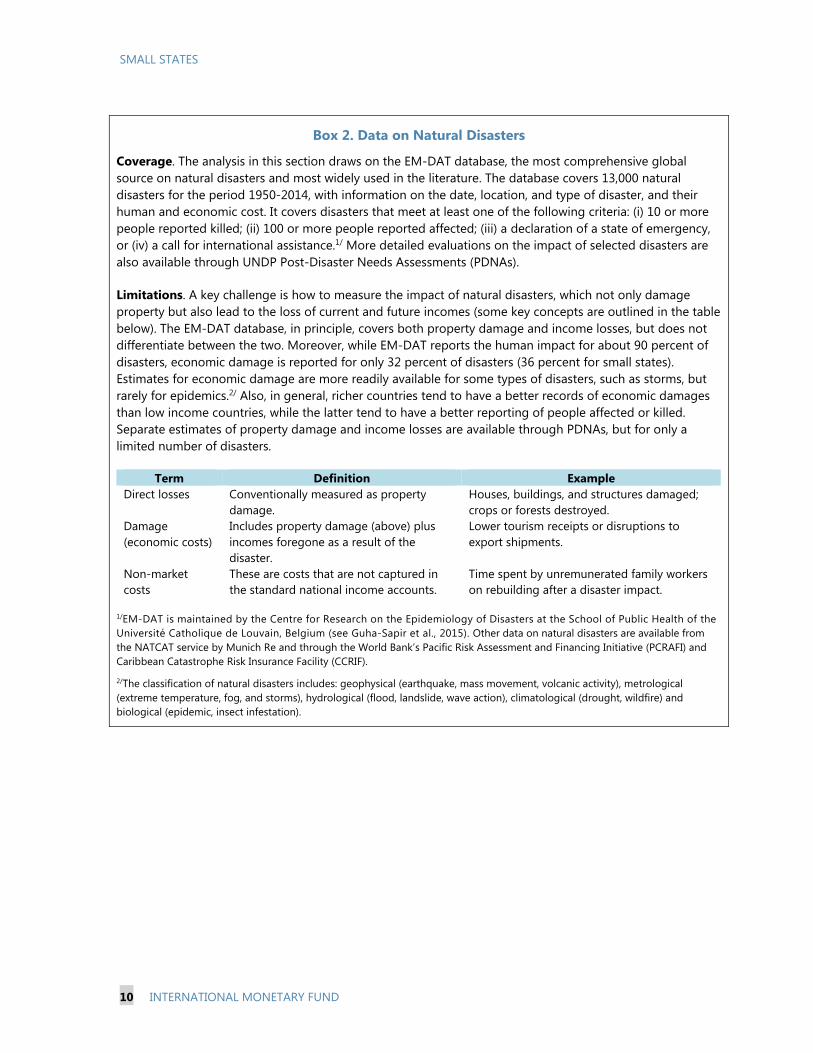
6. The greater vulnerability of small states applies to almost all categories of natural disaster. Across a wide range of disasters (except extreme temperatures), an occurrence in a small state is proportionately more damaging than an equivalent event in a larger state, making the recovery in the aftermath of a disaster more challenging. For example, a disaster-level storm is 23 times more damaging than for large states, measured as a share of GDP (Table 2). This partly reflects the large number of small developing states that are islands, so that when a storm makes landfall it affects a larger proportion of the population. Greater damage may also reflect the more constrained fiscal space of small states which can preclude adequate advance investments in risk reduction.
Table 2. Average Effects of Disasters by Type, 1950–2014
Non-SS SS Non-SS SS Non-SS SSRegionLatin America & Caribbean 429 118 2.5 16.1 1.0 10.8North America 1,978 0.1 0.0Europe & Central Asia 753 0.6 0.7 0.4Middle East & North Africa 532 4 0.8 0.3 0.5 15.6Sub-Saharan Africa 91 91 1.1 5.2 2.3 10.3South Asia 591 148 0.6 13.9 1.0 3.4East Asia & Pacific 871 45 0.3 11.9 0.7 9.0
IncomeLow income 318 16 2.9 6.3 1.9 5.6Lower middle income 275 55 0.9 12.7 1.2 11.1Upper middle income 762 112 0.4 18.3 0.8 10.3High income: nonOECD 379 165 0.5 2.6 0.4 0.8High income: OECD 1,541 0.1 0.2
Total 849 87 0.7 12.9 1.1 9.8
1/ In 2010 constant US dollars.
Sources: EM-DAT; WEO; WDI; and IMF staff calculations.
Damages (US$) 1/ Damages / GDP (%) Affected / Pop (%)
Non-SS SS Non-SS SS Non-SS SSDrought 1,071 67 1.2 2.0 12.2 35.4Earthquake 2,231 128 1.4 12.3 0.5 2.0Extreme temperature 1,357 3 0.8 0.5 1.3 0.7Flood 577 37 0.4 3.1 0.7 5.5Storm 756 100 0.7 16.1 0.7 11.2Volcanic activity 173 0.8 0.2 6.7Wildfire 575 32 1.1 14.5 0.3 0.4Other 178 0.8 0.1 1.0Total 849 87 0.7 12.9 1.1 9.8
1/ In 2010 constant US dollars.
Sources: EM-DAT; WEO; WDI; and IMF staff calculations.
Damages (US$) 1/ Damages / GDP (%) Affected / Pop (%)
SMALL STATES
10 INTERNATIONAL MONETARY FUND
Box 2. Data on Natural Disasters
Coverage. The analysis in this section draws on the EM-DAT database, the most comprehensive global source on natural disasters and most widely used in the literature. The database covers 13,000 natural disasters for the period 1950-2014, with information on the date, location, and type of disaster, and their human and economic cost. It covers disasters that meet at least one of the following criteria: (i) 10 or more people reported killed; (ii) 100 or more people reported affected; (iii) a declaration of a state of emergency, or (iv) a call for international assistance.1/ More detailed evaluations on the impact of selected disasters are also available through UNDP Post-Disaster Needs Assessments (PDNAs).
Limitations. A key challenge is how to measure the impact of natural disasters, which not only damage property but also lead to the loss of current and future incomes (some key concepts are outlined in the table below). The EM-DAT database, in principle, covers both property damage and income losses, but does not differentiate between the two. Moreover, while EM-DAT reports the human impact for about 90 percent of disasters, economic damage is reported for only 32 percent of disasters (36 percent for small states). Estimates for economic damage are more readily available for some types of disasters, such as storms, but rarely for epidemics.2/ Also, in general, richer countries tend to have a better records of economic damages than low income countries, while the latter tend to have a better reporting of people affected or killed. Separate estimates of property damage and income losses are available through PDNAs, but for only a limited number of disasters.
Term Definition Example Direct losses Conventionally measured as property
damage. Houses, buildings, and structures damaged; crops or forests destroyed.
Damage (economic costs)
Includes property damage (above) plus incomes foregone as a result of the disaster.
Lower tourism receipts or disruptions to export shipments.
Non-market costs
These are costs that are not captured in the standard national income accounts.
Time spent by unremunerated family workers on rebuilding after a disaster impact.
1/EM-DAT is maintained by the Centre for Research on the Epidemiology of Disasters at the School of Public Health of the Université Catholique de Louvain, Belgium (see Guha-Sapir et al., 2015). Other data on natural disasters are available from the NATCAT service by Munich Re and through the World Bank’s Pacific Risk Assessment and Financing Initiative (PCRAFI) and Caribbean Catastrophe Risk Insurance Facility (CCRIF).
2/The classification of natural disasters includes: geophysical (earthquake, mass movement, volcanic activity), metrological (extreme temperature, fog, and storms), hydrological (flood, landslide, wave action), climatological (drought, wildfire) and biological (epidemic, insect infestation).
SMALL STATES
INTERNATIONAL MONETARY FUND 11
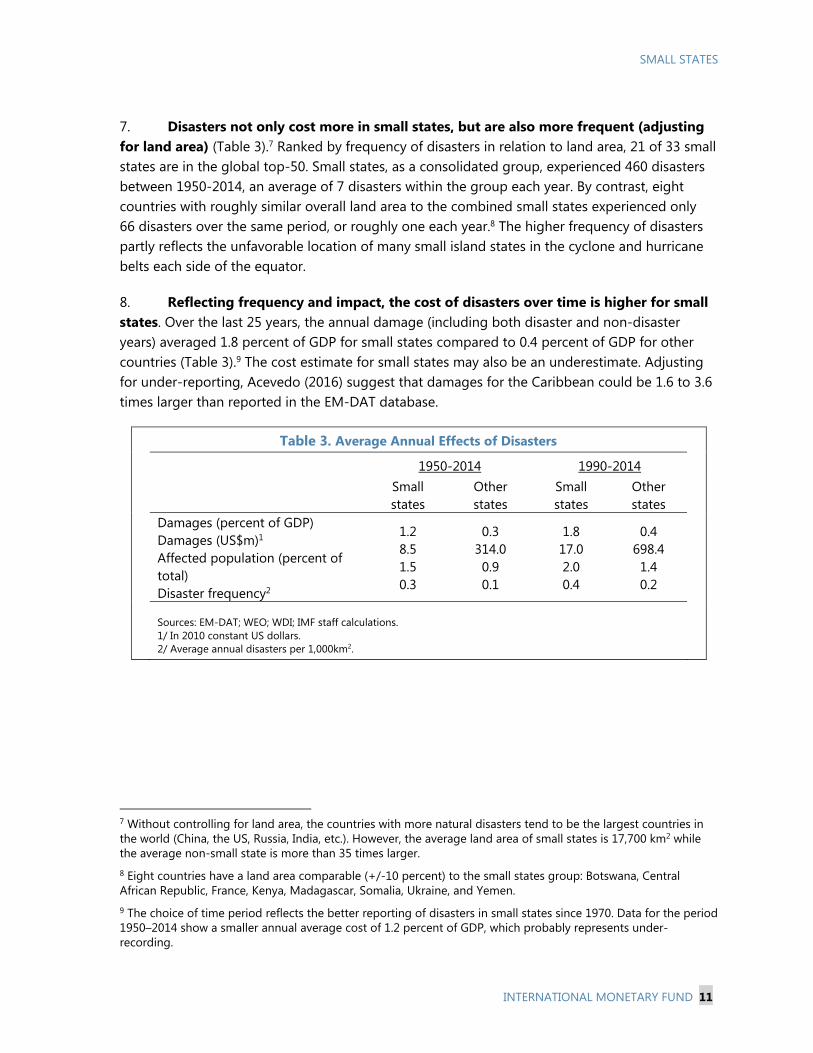
7. Disasters not only cost more in small states, but are also more frequent (adjusting for land area) (Table 3).7 Ranked by frequency of disasters in relation to land area, 21 of 33 small states are in the global top-50. Small states, as a consolidated group, experienced 460 disasters between 1950-2014, an average of 7 disasters within the group each year. By contrast, eight countries with roughly similar overall land area to the combined small states experienced only 66 disasters over the same period, or roughly one each year.8 The higher frequency of disasters partly reflects the unfavorable location of many small island states in the cyclone and hurricane belts each side of the equator.
8. Reflecting frequency and impact, the cost of disasters over time is higher for small states. Over the last 25 years, the annual damage (including both disaster and non-disaster years) averaged 1.8 percent of GDP for small states compared to 0.4 percent of GDP for other countries (Table 3).9 The cost estimate for small states may also be an underestimate. Adjusting for under-reporting, Acevedo (2016) suggest that damages for the Caribbean could be 1.6 to 3.6 times larger than reported in the EM-DAT database.
Table 3. Average Annual Effects of Disasters
1950-2014 1990-2014
Small states
Other states
Small states
Other states
Damages (percent of GDP) Damages (US$m)1
Affected population (percent of total) Disaster frequency2
1.2 8.5 1.5 0.3
0.3 314.0 0.9 0.1
1.8 17.0 2.0 0.4
0.4 698.4 1.4 0.2
Sources: EM-DAT; WEO; WDI; IMF staff calculations. 1/ In 2010 constant US dollars. 2/ Average annual disasters per 1,000km2.
7 Without controlling for land area, the countries with more natural disasters tend to be the largest countries in the world (China, the US, Russia, India, etc.). However, the average land area of small states is 17,700 km2 while the average non-small state is more than 35 times larger. 8 Eight countries have a land area comparable (+/-10 percent) to the small states group: Botswana, Central African Republic, France, Kenya, Madagascar, Somalia, Ukraine, and Yemen. 9 The choice of time period reflects the better reporting of disasters in small states since 1970. Data for the period 1950–2014 show a smaller annual average cost of 1.2 percent of GDP, which probably represents under-recording.
SMALL STATES
12 INTERNATIONAL MONETARY FUND
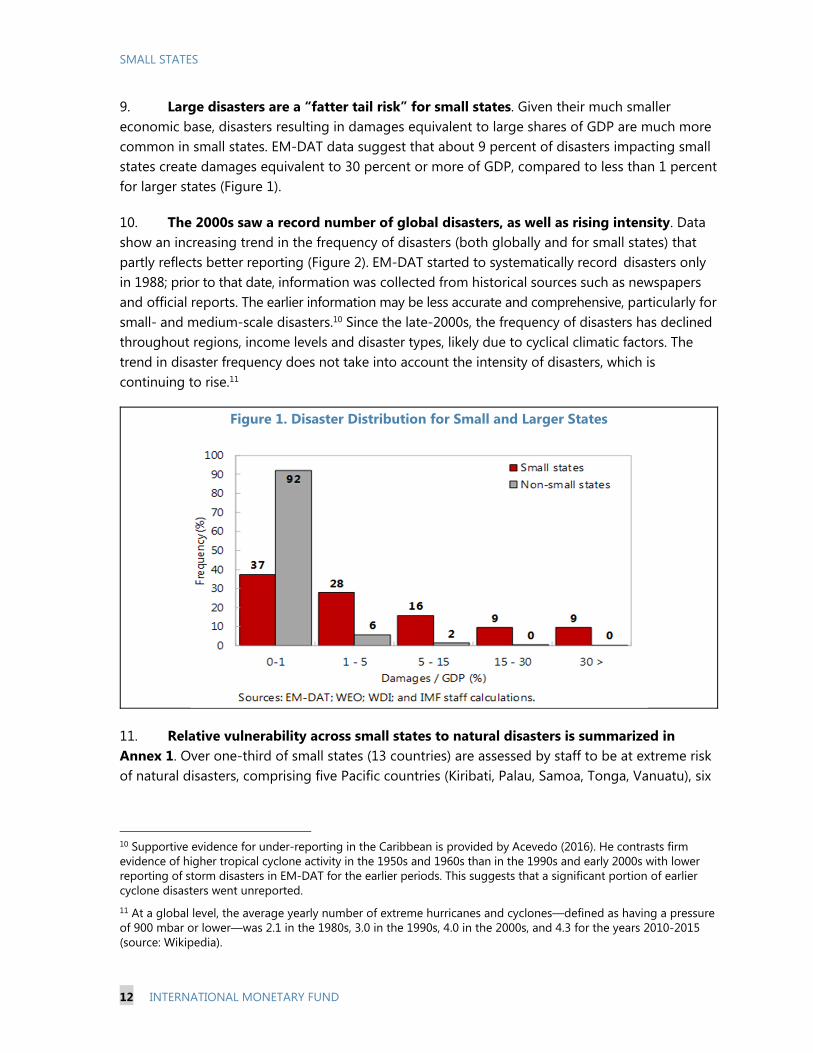
9. Large disasters are a “fatter tail risk” for small states. Given their much smaller economic base, disasters resulting in damages equivalent to large shares of GDP are much more common in small states. EM-DAT data suggest that about 9 percent of disasters impacting small states create damages equivalent to 30 percent or more of GDP, compared to less than 1 percent for larger states (Figure 1).
10. The 2000s saw a record number of global disasters, as well as rising intensity. Data show an increasing trend in the frequency of disasters (both globally and for small states) that partly reflects better reporting (Figure 2). EM-DAT started to systematically record disasters only in 1988; prior to that date, information was collected from historical sources such as newspapers and official reports. The earlier information may be less accurate and comprehensive, particularly for small- and medium-scale disasters.10 Since the late-2000s, the frequency of disasters has declined throughout regions, income levels and disaster types, likely due to cyclical climatic factors. The trend in disaster frequency does not take into account the intensity of disasters, which is continuing to rise.11
Figure 1. Disaster Distribution for Small and Larger States
11. Relative vulnerability across small states to natural disasters is summarized in Annex 1. Over one-third of small states (13 countries) are assessed by staff to be at extreme risk of natural disasters, comprising five Pacific countries (Kiribati, Palau, Samoa, Tonga, Vanuatu), six
10 Supportive evidence for under-reporting in the Caribbean is provided by Acevedo (2016). He contrasts firm evidence of higher tropical cyclone activity in the 1950s and 1960s than in the 1990s and early 2000s with lower reporting of storm disasters in EM-DAT for the earlier periods. This suggests that a significant portion of earlier cyclone disasters went unreported. 11 At a global level, the average yearly number of extreme hurricanes and cyclones—defined as having a pressure of 900 mbar or lower—was 2.1 in the 1980s, 3.0 in the 1990s, 4.0 in the 2000s, and 4.3 for the years 2010-2015 (source: Wikipedia).

SMALL STATES
INTERNATIONAL MONETARY FUND 13
Caribbean countries (Antigua and Barbuda, Belize, Dominica, Grenada, St. Lucia, St. Vincent and the Grenadines) and two other small states (Comoros and Maldives).
B. Transmission Channels
12. This section discusses the macroeconomic impact of natural disasters. These represent an extreme form of a supply shock and can have macroeconomic effects that are both large and long-lasting. The literature describes the cycle of loss and recovery as a three-stage process. The first stage involves direct losses from the destruction of infrastructure and property. In the second stage, indirect losses accumulate from foregone output and incomes, and costs are incurred as individuals and business work around disruptions. Finally, as the recovery starts, rebuilding of infrastructures and replacement of damaged goods leads to a temporary boost in activity and employment in the affected area (although there may be a leakage if outside contractors are brought in). It also opens up the opportunity to upgrade infrastructures. Apart from the cycle of impact and recovery from individual disasters, the periodic destruction of part of a country’s productive assets is an implicit tax on capital which tends to deter investments and lower productivity and living standards on a sustained basis.
Figure 2. Small States: Number of Natural Disasters per Year
13. Natural disasters vary in impact depending on their type as well as with the population and economic characteristics of the affected country. For earthquakes, there is large up-front damage at the time of the shock, and also heavy rebuilding costs. Persistent droughts, by contrast, can be associated with more drawn-out damages and costs. The same type of disaster can have different impacts in different countries. The 2010 earthquake in Chile was stronger and hit a more densely populated area than the same year’s earthquake in Haiti. But because of lower construction standards, the human and economic cost in Haiti was far higher, with 200,000 people killed (1,000 in Chile) and destruction equivalent to 120 percent of GDP (14 percent of GDP in Chile) (see Cavallo and Noy (2010)).

SMALL STATES
14 INTERNATIONAL MONETARY FUND
14. There is a substantial literature documenting the macroeconomic impact of natural disasters. The findings are mixed in some cases, likely reflecting differences in country characteristics as noted above. Accordingly, assessments regarding country disaster vulnerabilities need to blend insights from the literature with specific information on country risks. The findings below are broadly supported by new Fund analysis exploring how macroeconomic outcomes are related to exposure to natural disaster risks (Annex II).
Natural disasters have a clear temporary impact on growth. A number of studies point to negative short-term growth effects as damage to physical assets and to commercial and financial infrastructures result in foregone production in the immediate aftermath of the disaster (Raddatz, 2007; Noy, 2009; Acevedo, 2014; Cabezon et al. 2015). Looking at a slightly longer period, reconstruction spending can lead to a positive growth impact for small disasters (Loayza et al, 2009). Hochrainer (2009) finds a significant negative medium-term impact on growth only for large shocks. Event studies confirm that hurricanes result in an initial jump in unemployment in the short term, followed by reversal to the baseline (Ewing and Kruse, 2002).
Evidence on the impact of natural disasters on underlying long-run growth is more mixed. Cavallo and Noy (2010) finds no significant long-run impact, while Cabezon et al. (2015) find that for the Pacific islands, trend growth over 1980–2014 was 0.7 percentage point lower than it would have been without natural disasters.
Fiscal balances tend to be adversely affected. The adverse impact on short-run activity tends to weaken the tax base: thus, Cabezon et al. (2015) find higher tax revenue volatility in disaster-prone Pacific small states. Spending also tends to rise on account of relief and recovery programs. Fiscal imbalances can lead to higher borrowing. Acevedo (2014) finds that floods in the Caribbean result in higher public debt burdens, while Lee et al. (2016) find that natural disasters increase public indebtedness for Pacific islands. In other cases, fiscal needs are met through grants. In some cases, the fiscal impact of disasters may be understated, to the extent that aggregate spending data conceal a shift of resources toward disaster programs from other priorities.
Natural disasters also tend to worsen the external trade balance. Damage to production and transportation capacity tends to reduce exports. Over the short term, imports could decline with the dislocation to economic activity, but would tend to rise thereafter, buoyed by disaster relief and recovery programs (Rasmussen, 2004, Cabezon et al., 2015). The deterioration tends to be larger for agricultural exporters. Other elements of the balance of payments may improve. Bluedorn (2005) finds that hurricanes lead to an increase in international aid and remittances in the short-term. Also, where countries have insured or reinsured abroad, disasters can result in balance of payments inflows as insurance companies make payments for damages (Laframboise and Loko, 2012).
SMALL STATES
INTERNATIONAL MONETARY FUND 15
Natural disasters can have a disproportionate impact on the poor. Low-income communities tend to be located in the most vulnerable areas with weak housing standards (World Bank, 2003, 2016a, 2016b) and disasters can exacerbate social conditions. Low-income communities also commonly do not have access to credit or insurance to help weather shocks (IMF, 2003). There is also a gender element, with natural disasters having their largest impact on life expectancy for women and girls (Neumayer and Plumper, 2007).
15. Differences in the cost of natural disasters have been attributed to institutions as well as initial economic and financial conditions. Noy (2009) asserts that institutions affect the direct efficiency of the public intervention following disasters or the indirect impact by shaping the private sector response. He finds that higher literacy rates, higher degree of openness to trade, and higher levels of government spending increase the ability of governments to mobilize resources for reconstruction, mitigate the impact of the shock, and contain the spillovers on the macro economy. Economic diversification and fiscal space to conduct counter-cyclical policy can also impact the response and overall economic cost. Regarding financial conditions, countries with better reserve buffers and access to domestic credit, but with less open capital accounts, are better able to cope with disasters.
CLIMATE CHANGE Climate change is expected to exacerbate the impact of natural disasters and worsen other vulnerabilities of small states. About one-third of small states are highly or extremely vulnerable to climate change in the lifespan of the current generation. Key risks are from sea level rise and declining agricultural productivity, with expected spillovers for tourism. Stressed ecosystems could boost poverty and further encourage emigration.12
16. Climate change is likely to increase disaster vulnerabilities globally and particularly for small states. Acevedo (2016) finds that climate changes increases the probability of large natural disasters (tropical storms) and raises mean damages. Specifically, by 2100, tropical storms making landfall could inflict damages up to 77 percent higher than today (with an impact up to 42 percent higher even when storms do not make landfall).13
17. Climate change is also expected to impose broader persistent costs on economies. Depending on climate change outcomes (Box 3), several transmission channels are particularly relevant:
12 This section was drafted by Mai Farid and Sebastian Acevedo, based on a background study by a team also comprising Ricardo Marto, Dan Nyberg, and Vimal Thakoor, led by Prakash Loungani. 13This estimate is based on a high CO2 climate change scenario, with higher sea surface temperatures causing more intense storms as the main transmission channel (see below). It is however lower than the estimate in Nordhaus’s (2010) seminal exercise, which estimates that mean damages for the US could more than double (rise by 113 percent) by 2100.

SMALL STATES
16 INTERNATIONAL MONETARY FUND
Sea-level rise (SLR). SLR is projected to be directly related to the degree of global warming and proximity to the equator. SLR of 50cm by the 2050s is expected based on existing carbon emissions. This could reach 70cm with 2°C global warming (the central goal of the Paris Agreement) and over 1m with 4°C global warming. SLR close to the tropics could be 10-15 percent higher (World Bank, 2013). SLR raises the risk of storm surges, tropical cyclones, and tsunamis, as well as persistent flooding and coastal erosion. The Maldives is at risk of disappearing entirely with SLR of 1m, while other small states also face significant risks (Dominica, Grenada, Kiribati, the Marshall Islands, St. Vincent and the Grenadines, and Tuvalu).14
Extreme temperatures. Global warming is projected to result in more frequent and more intense episodes of extreme heat. While the marginal impact is projected to be smaller for countries closer to the equator, this comes on top of already high average temperatures for small states in the Caribbean, Pacific, and Africa.15
Water stress. SLR can lead to salt water contamination of freshwater aquifers, reducing access to water for drinking and crop irrigation.16 Use of alternative, less healthy water brings risk of water-borne disease. With more volatility in rainfall as a result of climate change, droughts also pose risks to water supplies.17
14 Recent research suggests that sea level rise could impact island atolls more quickly than earlier projected, because with SLR, reefs will provide less protection against wave-induced run-up and flooding (Storlazzi et al., 2015). 15 According to the World Bank (2014a), under a 2°C scenario, the share of land affected by unusual extreme heat at the end of the century is projected to be 70 percent in South East Asia (SEA), 30 percent in the Middle East and North Africa (MENA) region, 30–40 percent in Latin America and the Caribbean (LAC), and 45 percent in Sub-Saharan Africa (SSA), compared, for example to 10–15 percent of land in Europe and Central Asia. Under a 4°C scenario, these shares would more than double. 16 Countries such as the Bahamas and Barbados are almost entirely dependent on ground water for fresh water, while in Mauritius ground water meets 60 percent of domestic water supply needs (UNFCCC, 2007). 17 Under a 2°C scenario (for the 2040s), water runoff available for drinking and irrigation could decline by as much as 30 percent in Latin America and the Caribbean and 50 percent in sub-Saharan Africa (see World Bank (2013 and 2014a), Schlosser and others (2014), Kochhar and others (2015)).
SMALL STATES
INTERNATIONAL MONETARY FUND 17
Box 3. Climate Change Basics
Definition and drivers. Climate change refers here to the gradual change or variability in global mean temperature and related developments such as increased frequency of extreme weather events, variability in precipitation, and rising sea levels (up to several meters if ice sheets melt). There is a broad scientific consensus that manmade emissions of greenhouse gases (GHG) are a key driver of ongoing climate change and their continued trend will cause further warming and long-lasting damage to the climate system (IPCC, 2014).
Warming impact. Global mean temperature has increased progressively since 1900, and is now about 0.8°C higher, mostly from rising GHG concentrations. If carbon dioxide (CO2) equivalent concentrations were stabilized at 450, 550, and 650 parts per million (ppm), mean projected warming over pre-industrial levels would be 2, 3, and 4°C, respectively. Absent mitigation and adaptation, indications are that the global mean temperature increase could reach about 3-4°C or more by the end of this century—producing severe and irreversible change in climate conditions in many parts of the world. The central goal of the Paris Agreement is to limit global warming to 2°C.
18. Small developing states are estimated to be at greater risk than developed countries.18 Projections of climate parameters by IPCC and Maplecroft’s 2016 climate change vulnerability index suggest that countries closer to the equator and low-lying coastal countries (including many small states) are extremely or highly vulnerable to climate change. Roughly three-quarters of low-income countries and one-third of small developing states are assessed as extremely or highly vulnerable to climate change, compared to one-quarter of the rest of the world. The 2016 Maplecroft exposure index assesses risks for 24 small states, of which three are at extreme risk (Fiji, Mauritius, and Montenegro) and a further four at high risk (Belize, Djibouti, Timor Leste, and Vanuatu). This likely understates risks to small states, as a number of vulnerable states are not covered by the assessment (e.g., the low-lying Kiribati and Tuvalu, and tourism-based Maldives) (Annex I).
19. The economic impact on small developing states will be seen in several sectors. Roson and van der Mensbrugghe (2012) identify the main channels of impact as sea-level rise and agriculture for Southeast Asia, Latin America and the Caribbean; water scarcity for MENA; and labor productivity and health for sub-Saharan Africa. Key sectors at risk are the following:
Coastal ecosystems. Damage to coastal areas and infrastructure from SLR will have a broader impact on livelihoods (e.g., fishing) and habitability in these areas. Over the long term, climate change will make some ecosystems completely uninhabitable.19
18 See Farid et al. (2016) for a full discussion. 19 See Burkett (2011) and Barnett and Adger (2003).
SMALL STATES
18 INTERNATIONAL MONETARY FUND
Tourism. Climate change can undermine tourist-based economies through erosion of beaches, reduced freshwater supplies, and extreme climate events (floods, storms, and tsunami) which damage critical infrastructure (airports, roads and hotels). The loss of tourism competitiveness will likely reflect overall stress from climate change, being greatest for developing countries, particularly small developing states vulnerable to SLR.20 This is a major source of risk for the most tourism-dependent small states.21
Agricultural productivity. A number of studies have found that the combination of rising temperatures and greater rainfall volatility (including periods of drought), reduce agricultural productivity and GDP growth (e.g., Reilly and Schimmelpfennig, 1999). With 97 percent of crop land being rain-fed rather than irrigated, countries in sub-Saharan Africa and Southeast Asia are particularly vulnerable (World Bank, 2013). One study projects that output in poor countries could fall by 1.3 percent on average from baseline levels for each 1°C rise in global mean temperatures, largely due to reduced agricultural and industrial output (Dell et al., 2012). Lower crop yields from unfavorable growing conditions are also projected to boost food prices, with implications for low-income groups (Hallegatte et al., 2015).
20. The economic costs of climate change for small states are projected at 15 percent of GDP or more. For Caribbean small states, a one-meter sea-level rise by 2080 is projected to result in losses and damages of about 8 percent of projected GDP (Simpson et al., 2010). For Pacific island small states, a sea level rise of between 1 and 1.7 meters is projected to result in an economic impact of between 3 and 15 percent of GDP due to lost agricultural production, tourism and fisheries and infrastructure damage (Asia Development Bank, 2013). These figures compare with projections for market and nonmarket losses and damages for the global economy ranging from 1 to 4 percent of output for a 4°C increase in global mean temperature.22
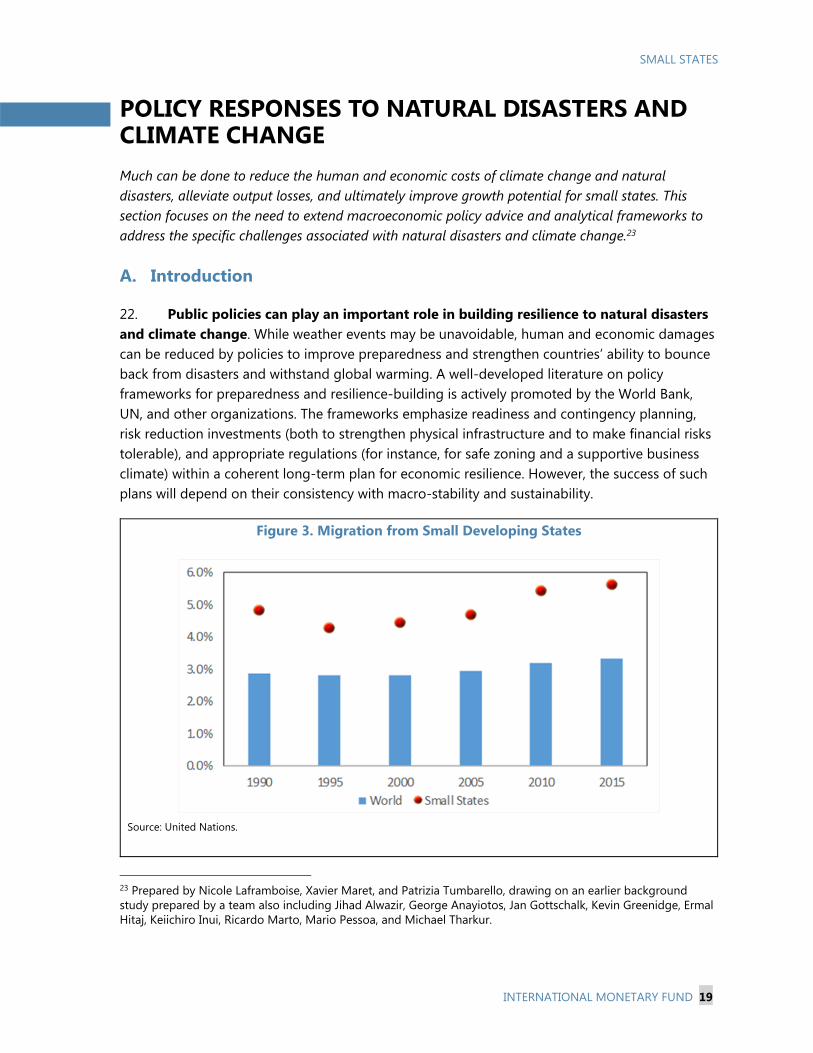
21. Climate change-related stress is projected to boost poverty and emigration. Low-income communities are particularly vulnerable to climate change because of heavy reliance on agricultural incomes, a high proportion of incomes devoted to food items, and limited access to savings or credit to weather climate-related shocks. Economic vulnerability is matched by risks to health and other social indicators. Globally, climate change could push more than 100 million people into poverty by 2030 (Hallegatte et al., 2015). As climate change has a progressive impact on incomes, job opportunities, and living conditions (Khonje, 2015), emigration is likely to increase further—already twice that for larger countries and rising since the early-2000s (Figure 3).
20 See Roson and van der Mensbrugghe (2012), and Simpson and others (2010). 21 Tourism receipts are equivalent to more than 25 percent of GDP for Antigua and Barbuda, the Bahamas, Maldives, Palau, Seychelles, St. Lucia, and Vanuatu. They also exceed 15 percent of GDP for Barbados, Belize, Cabo Verde, Dominica, Fiji, Mauritius, Montenegro, Samoa, and St. Kitts and Nevis (see World Development Indicators). 22 Studies such as Roson and van der Mensbrugghe (2012), Tol (2014), and Dellink and others (2014) adopt different assumptions and projections for climate parameters including the channels of market and non-market impact of climate change. There is considerable variation across studies and uncertainty as to the potential damages from extreme temperature and related catastrophic weather events.
SMALL STATES
INTERNATIONAL MONETARY FUND 19
POLICY RESPONSES TO NATURAL DISASTERS AND CLIMATE CHANGE Much can be done to reduce the human and economic costs of climate change and natural disasters, alleviate output losses, and ultimately improve growth potential for small states. This section focuses on the need to extend macroeconomic policy advice and analytical frameworks to address the specific challenges associated with natural disasters and climate change.23
A. Introduction
22. Public policies can play an important role in building resilience to natural disasters and climate change. While weather events may be unavoidable, human and economic damages can be reduced by policies to improve preparedness and strengthen countries’ ability to bounce back from disasters and withstand global warming. A well-developed literature on policy frameworks for preparedness and resilience-building is actively promoted by the World Bank, UN, and other organizations. The frameworks emphasize readiness and contingency planning, risk reduction investments (both to strengthen physical infrastructure and to make financial risks tolerable), and appropriate regulations (for instance, for safe zoning and a supportive business climate) within a coherent long-term plan for economic resilience. However, the success of such plans will depend on their consistency with macro-stability and sustainability.
Figure 3. Migration from Small Developing States
Source: United Nations.
23 Prepared by Nicole Laframboise, Xavier Maret, and Patrizia Tumbarello, drawing on an earlier background study prepared by a team also including Jihad Alwazir, George Anayiotos, Jan Gottschalk, Kevin Greenidge, Ermal Hitaj, Keiichiro Inui, Ricardo Marto, Mario Pessoa, and Michael Tharkur.
SMALL STATES
20 INTERNATIONAL MONETARY FUND
23. The immediate issue for Fund advice is how best to align macro, fiscal, and financial policies to support resilience-building while maintaining stability and sustainability. In the coming years, a more fundamental reassessment of macroeconomic policies as part of a national survival strategy will be necessary for small states facing an existential threat from climate change and sea level rise. This challenge goes beyond the scope of this paper, but the Fund will in future need to play a central role in helping at-risk countries explore their long-term macro-options.
24. Planning for disasters and a more difficult physical environment should be mainstreamed. Countries should explicitly build disaster and climate change into fiscal and other policy frameworks—including into budget design, public investment planning, and debt and asset management. This integration process should span the following elements:24
Identification and quantification. Steps are needed to identify and quantify the main disaster or climate change risks, their likelihood of realization, potential impacts, and key vulnerabilities (infrastructures at risk, vulnerable communities and populations).
Invest in risk reduction. Guided by risk assessments, decisions should be taken on whether and how to invest in risk reduction.
Develop contingency plans. Where risks cannot be mitigated, contingency plans for disaster response are needed.
Arrange contingency financing. Contingency plans for financing disaster relief and recovery should include self-insurance (fiscal reserves and contingency funds), contingent plans for disaster response using borrowed or grant resources, and risk-transfer arrangements using insurance or other capital market options.
25. Typically, considerable progress is needed to strengthen disaster risk management planning. While the above elements are intuitively straightforward, implementation tends to fall short. Analytical studies point to underinvestment in risk reduction across different countries despite calculated high rates of return on marginal projects.25 Clarke and Dercon (2016) cite multiple examples of flawed disaster response in both advanced and developing countries attributed to inadequate contingency planning, problems in coordinating responses across multiple partners (local and national governments, disaster relief agencies, foreign governments, etc.), and lack of access to necessary financing.
26. Political and other obstacles may need to be addressed. Clarke and Dercon (2016) highlight key challenges for disaster risk planning. Some relate to the professional requirements
24 For approaches to defining disaster risk management frameworks see, for example, Clarke and Dercon (2016) or the Global Disaster Risk Framework (World Bank and UN). 25 One dollar of US federal investment in preparedness is estimated to yield a reduction in damage of approximately $15 (Healy and Mulhotra, 2009).
SMALL STATES
INTERNATIONAL MONETARY FUND 21
for good planning, e.g., scientific expertise in forecasting and modelling disasters or administrative skill in policy coordination. Important obstacles also relate to the politics of disaster risk management. Studies ranging from India to the United States suggest that politicians receive higher electoral rewards for responding to disasters “after the event” than for investing in risk reduction before disasters strike. This is partly because disaster response is more newsworthy than risk reduction, and partly because a program of preventive investments may span multiple administrations with “ownership” that is difficult to attribute. Experience also points to strong administrative and political preferences to retain discretion in responding to events, rather than to commit to ex ante plans—even if discretion is at the cost of speedy and effective response. Clarke and Dercon (2016) argue that a combination of sound professional advice, including from international organizations such as the Fund, and strong domestic leadership are needed to overcome these obstacles. Financing can also be a major hurdle, especially for small states, where spending on disaster risk reduction has to compete for scarce resources with other public services and with the need to maintain cash buffers for responding to disasters and other shocks.
27. Disaster risk management approaches will differ across countries. Steps to implement the disaster risk management framework are explored in more detail below, along with the respective role of the Fund. Since each country faces different risks and vulnerabilities, national preferences will dictate different social and economic priorities and institutional arrangements.26 Accordingly, policy advice should be tailored to country circumstances. The approaches outlined below have been developed specifically with a view to the needs of small states, but will apply in most cases also to larger countries facing risks from natural disasters and climate change. Annex III provides a case study of Vanuatu, exploring the impact of the highly destructive cyclone Pam in 2015 and the resultant policy lessons.
28. Fund engagement should be within its areas of macroeconomic competence. As discussed below, macroeconomic policies and institutions within the Fund’s areas of expertise play an important role in preparing for and responding to natural disasters and climate change. At the same time, many policies also important for reducing the macroeconomic impact of disasters and climate change are outside the Fund’s areas of competence, and Fund staff should collaborate closely with other organizations, such as the World Bank, to develop a full assessment of the adequacy of country policies.
29. The Fund’s tools for assessing risks and vulnerabilities need to be adjusted to incorporate natural disasters. Approaches for integrating natural disasters and climate change risks into standard Fund analysis are discussed in Annex IV with key messages summarized in Box 4. This advice builds on past work on small states, where staff have often explicitly integrated 26 In the Marshall Islands, the government has developed several disaster risk management frameworks at the sub-regional, national, and international level in coordination with UNDP and other partners. Micronesia held a nation-wide forum on disaster risk management involving state and national leaders and other organizations. Tonga has developed specialized hazard maps and is providing stakeholders with training in disaster risk management. In Tuvalu, the government has a national climate change action plan and disaster risk management plan.
SMALL STATES
22 INTERNATIONAL MONETARY FUND
risks and vulnerabilities from natural disasters into projections and policy advice. That said, there has been considerable variance in approaches across countries and there appears to be scope to draw on good practice approaches in a more standardized manner.
B. Identifying Risks and Vulnerabilities
30. The Fund should identify risks and vulnerabilities and ensure they are appropriately reflected in macroeconomic policy frameworks. Disaster planning rests on a clear understanding of risks and vulnerabilities, the latter typically identified by national experts or international partners such as the World Bank and UNDP.27 Based on the specific risks facing particular countries, the Fund can advise on relevant policy responses. Transparent communication is important.
Box 4. Integrating Natural Disasters and Climate Change into IMF Macro-frameworks and Risk Analysis
Macro criticality. In countries where natural disasters and climate change significantly affect economic performance, Fund analysis (of the macro framework, debt sustainability, external imbalances, etc.) should make specific allowance, whether in the short- or medium- to long-term.
Data sources and perspectives. Staff will usually need to combine EM-DAT data, country economic data, and perspectives from country experts to develop a full picture of the potential scale, frequency, and macro transmission channels of natural disasters and climate change. The assumptions adopted for analytical purposes should be clearly documented.
Macro baselines. Medium- to long-term baselines used for assessing policy sustainability (e.g., DSAs) should reflect economic performance not just in good years, but also factoring in the economic impact of future natural disasters. A range of approaches can be used to reflect the “average impact” of disasters, including using historic averages for key variables to develop tailored adjustments based on assumed risks and transmission channels.
Alternative shocks scenarios. The policy implications of adverse scenarios should be assessed. Risks around the baseline and the adequacy of fiscal and external buffers should be evaluated using alternative scenarios calibrated to reflect “average” and/or “tail risk” natural disasters.
Financial risks, reserve adequacy, and GE modeling. Tailored approaches can be used to explore financial sector risks, following practices applied in recent FSAPs. The current reserve adequacy tool can be readily adjusted to reflect the impact of natural disasters. And the Debt, Investment, and Growth (DIG) model could be used to explore the dynamic adjustment path following a disaster (see Annex V).
27 In general, advanced economies will have the expertise and resources to conduct more detailed risk and vulnerability assessments than lower-income countries and small states. The latter will likely focus on a more narrowly-defined range of risks and transmission mechanisms.
SMALL STATES
INTERNATIONAL MONETARY FUND 23
31. Preparation of a fiscal risk statement is a key element of Fund guidance on macro risk management. For countries where natural disasters are important, the risk statement should cover associated risks; this should be presented together with the budget to guide budget discussions.28 The Fund gives TA to countries to develop fiscal risk statements and has also created a fiscal transparency code and evaluation that covers risks from natural disasters.29 More broadly, the Fund recommends that risk management be undertaken within a comprehensive PFM framework covering risk assessment, self-insurance, and risk reduction and transfer (Box 5).
32. Sound macroeconomic data are key for assessing risks and developing policy responses. Given the limited capacity of many small states’ statistical agencies, Fund capacity building will be important across a broad range of sectors (national accounts, fiscal and external accounts, financial sector) and would span issues of methodology, data collection, and compilation. Regional collaboration on macroeconomic data compilation may be an option for some small states.
Box 5. Fiscal Risk Management and Fiscal Risk Statements
Risk identification is important for fiscal transparency. The IMF’s Fiscal Transparency Code defines twelve major risks including natural disasters, and specifies that countries should analyze, disclose, and manage their potential fiscal exposure to such disasters. It indicates that management of these risks should be based in a published strategy. Fiscal risks statements (FRS). These are reports prepared by the government at the time of budget preparation to inform the legislature and civil society about the most relevant fiscal risks and how the government plans to address them. The report, usually prepared by the ministry of finance in coordination with other agencies, should describe and quantify the main fiscal risks, discuss their likelihood, and propose fiscal measures to mitigate and manage them. Countries such as the Philippines, Indonesia, and New Zealand have detailed FRS that cover disasters. For example, the Philippines created a pre-disaster risk assessment, developed a catastrophe risk insurance facility for local governments, and incentivized local governments to pool calamity funds. Framework for managing fiscal risks. Fiscal risk management should follow the broad policy approach in paragraph 24. Fiscal exposure to disaster risks should be identified and quantified in the fiscal risk statement. The statement should guide policymakers and the public toward risk-management priorities by detailing quantifiable and unquantifiable contingent liabilities and whether these are considered probable, possible or remote. Then, mitigation steps should be taken to reduce fiscal exposure, either as part of the budget or during the fiscal year (e.g., public infrastructure investment, tax incentives to encourage resilience-building behavior, or regulatory intervention—see Box 6). Contingency plans should be specified for risks that cannot be mitigated. For example, procedures to allow rapid release of funds in the wake of a natural disaster should be put in place in advance. Contingency financing should be identified in advance to the extent possible, as discussed in more detail in the section on financing (see IMF, 2016a for further details).
28 The identification and disclosure of fiscal risks is a central component of the Fund’s advice on managing fiscal risks. For general guidance, see IMF (2008) and IMF (2012a). 29 For the Fiscal Transparency Code and published Fiscal Transparency Evaluations, see
http://www.imf.org/external/np/fad/trans/index.htm.
SMALL STATES
24 INTERNATIONAL MONETARY FUND
C. Investing in Risk Reduction
33. A risk reduction program to address identified vulnerabilities should be developed. Besides the development of information campaigns to increase preparedness, early warning systems, and contingency planning, risk reduction steps could involve public infrastructure projects, incentives to encourage private sector investments in risk reduction, and financial investment to offset risk. Some relevant options are enumerated in Box 6.
34. The Fund can help determine whether public investment is financeable and part of a coherent medium-term development plan. As discussed later in the paper, public spending on risk reduction needs to be consistent with fiscal space, debt sustainability, and macroeconomic absorptive capacity. This assessment depends, in part, on the projected economic returns from risk reduction programs. Staff are extending debt sustainability analysis on a case-by-case basis to reflect such returns.30 General equilibrium models such as the Fund’s Debt, Investment, and Growth (DIG) model provide a more comprehensive approach for exploring the impact of scaled-up investment on the macro-economy (see Annex V).
Box 6. Risk Reduction Approaches Public infrastructure programs. Stronger infrastructure could offer better protection against disasters. Examples include more effective seawalls along urban coastlines; maintenance or reinforcement of bridges; and investments in urban resilience (resilient construction and building back better).31 Public information provision. Accurate information about risks can influence decisions on where to locate and how to construct private commercial and residential properties.32 For example, risk maps on flood zones, areas at risk from coastal erosion, and landslide areas can provide valuable information to property investors. Where there is a developed insurance industry, this can help in setting terms and conditions for property cover. Information on disaster risk areas can also be used to tailor possible public insurance subsidies, with lower public contributions for high-risk areas. Adequate funding for public early warning systems is also important (e.g., hydro-meteorological and communication systems). Property rights and regulation. Land use and zoning rules can reduce property exposed to disasters (e.g., by limiting building in flood plains) and building codes can ensure property strong enough to withstand disasters. Well-defined rights to own and lease properties create incentives to maintain property values. These can be fostered through affordable and effective land titling procedures and market-friendly rent controls. Fiscal policies and pricing incentives. Targeted incentives could subsidize retrofitting properties to strengthen resilience (less costly to the tax base than a broad-based tax holiday to attract investors to a vulnerable country). Accelerated capital depreciation provisions also offer targeted incentives for investing in property. Fiscal incentives and appropriate pricing could also support more drought resilient crops, protect and expand forest coverage, and preserve scarce water resources.
30 See McIntyre and others (2016). 31 For example, Botswana, the Marshall Islands, Micronesia, St. Lucia, St. Vincent and the Grenadines, and Vanuatu have enhanced disaster resilience through infrastructure projects. 32 World Bank research suggests that information provided by hazard-location maps and data on building quality can be capitalized into property values.
SMALL STATES
INTERNATIONAL MONETARY FUND 25
35. Physical and financial investment in risk reduction (resilience-building) should be part of a well-prioritized public financial management (PFM) strategy.
All resilience-building public investments should be undertaken within the framework of each country’s comprehensive public investment program. While the Fund does not typically advise on specific investment priorities, it can help countries assess and build the strength of their public investment management framework using the Public Investment Management Assessment (PIMA). This provides a comprehensive diagnostic of a country’s current public investment practices and, based on this diagnostic, derives recommendations on how to raise efficiency (Box 7).33
Fiscal buffers should be accumulated via a saving strategy consistent with medium-term
fiscal objectives (e.g., through the gradual accumulation of a rainy-day fund). The Fund should seek to ensure that spending and contingency allowances are integrated into a multi-year budget process. A consistent multi-year process may permit, for instance, contingency funds for emergency needs that remain unspent within a given year to be used for risk reduction measures the following year (as in Mexico and Vietnam). For small states, limited administrative skills and weak PFM systems may hamper the effectiveness of risk reduction efforts.34 In such cases, the Fund can play an important role in capacity building.
36. Regional approaches can be developed for risk reduction. Administrative economies of scale can be achieved by adopting regional regulatory standards or by establishing regional administrative bodies. Thus, in the Caribbean, the Caribbean Disaster Emergency Management Agency (CDEMA) coordinates regional disaster responses and establish codes of good practice, including for building construction. 35
37. More diverse income sources can contribute to reducing risks from natural disasters and climate change. Where small states have a highly-concentrated economic base (relying on agriculture, or tourism, say), it may be possible to develop new sources of income that are more resilient. For example, many small states have very large territorial waters, and Seychelles has pioneered the importance of the “blue economy” as a potential source of incomes and livelihood. The role of the Fund is less to identify potential new growth models than to advise on macroeconomic policies that may be needed for an effective transition (see IMF, 2014d).
33 See IMF (2015b), pp. 19. 34 For low-income developing countries, IMF (2015a), estimates a public investment efficiency gap of 40 percent. 35 Similarly, in the Pacific, regional approaches to strengthen public financial management include shared training facilities and courses (University of the South Pacific, Pacific Islands Center for Public Administration); pools of skilled and specialist resources can be shared across countries (Pacific Financial Technical Assistance Center, Pacific Islands Forum Secretariat); and networks for information sharing (Pacific Islands Financial Managers’ Association, Pacific Islands Tax Administrators Association). The World Bank’s Pacific Resilience Program (PREP) also seeks to foster regional approaches (see Annex VI).

SMALL STATES
26 INTERNATIONAL MONETARY FUND
D. Disaster Contingency Plans
38. Risk reduction activities should be combined with contingency plans for disaster response. Failure to plan ahead can seriously hamper the effectiveness of post-disaster intervention. Clarke and Dercon (2016) highlight the frequency with which public responses fall short because of delays in agreeing intervention priorities, time taken to resolve leadership and coordination issues across multiple levels of government and with foreign counterparts, and lack of short-term financing. They recommend establishing contingency plans for post-disaster action aligned with key risks and vulnerabilities. Thus, if droughts are a key risk, contingency plans could revolve around issues of food security and income support for farmers and pastoralists; if hurricanes are the main risk, plans could focus on emergency housing, compensation for the homeless, and restoration of key public infrastructures.
Box 7. Improving Public Investment Efficiency with PIMA
The IMF’s Public Investment Management Assessment (PIMA) provides a comprehensive diagnostic of a country’s institutional capacity under 15 categories at three key stages of the public investment cycle: (i) investment planning, which covers, inter alia, fiscal rules, the management of PPPs, and regulation; (ii) investment allocation, examining the budgeting process (comprehensiveness, whether allocations are made multi-year) and project selection; and (iii) investment implementation, considering investment protection, the transparency of execution, and the availability of funding. Following a 2015 report identifying average inefficiencies in public investment processes at around 30 percent, the Fund has been deploying this assessment tool across several countries. In partnership with the World Bank, the diagnostic has been conducted in more than 15 pilot countries (see IMF, 2014a and 2015a).
39. To ensure rapid disaster response, discretion should be kept to a minimum. Rules for public intervention should be clearly defined (such as the size of payments to affected households), leadership responsibilities should be explicit, and programs should be triggered by clearly-defined criteria (e.g., hurricanes at or above a certain category). The contingency plan should also be aligned with incentives for the private sector to adopt risk reduction behaviors.
40. Social safety nets provide important contingency coverage. Disasters can lead to permanent harm for victims, especially children, where malnutrition can impair cognition, productivity, and lifetime earnings, and so timely assistance is critical. For effective disaster intervention, contingent plans should be in place to scale up existing safety nets (World Bank, 2016c). The design of new programs after a disaster is declared may not allow for sufficiently prompt intervention.36 Cash transfers or vouchers are increasingly preferred where local markets can meet needs, because, unlike food aid, they offer greater choice and flexibility and stimulate 36 In many small states, the core elements of social protection systems are characterized by weak design and inefficient processes that do not lend themselves to fast response in post-disaster contexts. These would need to be addressed if safety nets are to be used effectively to mitigate risks and respond to shocks. The World Bank’s ongoing operations in Jamaica, Grenada, St. Lucia, and St. Vincent and the Grenadines are aimed at addressing some of these issues.
SMALL STATES
INTERNATIONAL MONETARY FUND 27
domestic supply (Box 8). By contrast, research shows that large inflows of food and clothing aid can disrupt the value chain and undermine the livelihoods of merchants and other local businesses, especially in very small economies. These effects can be worsened by the monetization of aid, or corruption in distribution. Public works programs can also play an important role in providing post-disaster income support, while helping with disaster recovery and rebuilding. In some countries, such programs may be more politically amenable than cash transfers. The scale of relief should, in general, be calibrated to immediate needs, without undermining incentives for a return to more normal labor market participation as part of economic recovery.
41. The Fund can support members by sharing country experience with safety nets. In general, policy choices about the goals of contingency financing plans would be nationally determined, while the Fund has experience in helping countries adopt and strengthen safety nets and create the necessary fiscal space. For additional technical advice on how to design schemes that are well-targeted and efficient, countries should draw on expertise in the World Bank and other relevant institutions. Given that budget constraints are a factor in safety net design, governments should explore with development partners the scope to use contingent financing arrangements to support disaster-related safety net programs.
42. Caution is needed in drawing on pension or provident funds to finance a safety net. Following cyclone Pam, the Vanuatu National Provident Fund (VNPF) allowed its 40,000 active members (mostly civil servants) to withdraw up to 30 percent of their pension fund to cover cyclone-related expenses. Although this successfully provided financing equivalent to 2 percent of GDP over a three-month period, most members were located on less-affected islands and a significant fraction of the withdrawals was likely used for non-disaster purposes (there was no monitoring of funds usage). The drawdown left the VNPF illiquid and less able to finance pension needs. In Fiji, similar concerns arose when public pension fund assets were used to cover disaster recovery needs.
43. The Fund can also advise on the design of budget laws to ensure that budget systems continue to function after a disaster. The legal framework should ensure sufficient spending flexibility to cope with natural disasters, including by: (i) provisions in organic budget laws allowing the government to exceed spending limits up to a defined amount in the event of a formally declared natural disaster; (ii) escape clause provisions in any fiscal responsibility laws to allow the government to break the numerical or procedural targets in case of a major natural disaster; (iii) provision in the annual budget law giving the necessary flexibility to the government to shift resources in case of a major natural disaster; and (iv) establishment of contingency space in the budget to cope with emergency needs (IMF, 2012b). The appropriate approach will depend on the PFM legal tradition in any given country.
SMALL STATES
28 INTERNATIONAL MONETARY FUND
E. Fiscal Policies and Debt Sustainability
A range of fiscal institutions and policies are relevant for managing the macroeconomic vulnerabilities posed by natural disasters and climate change. These span PFM and debt management practices, carbon taxation and energy pricing reform, and approaches for achieving fiscal and debt sustainability.
Box 8. Examples of Disaster-Related Safety Nets
Fiji. In the immediate aftermath of 2016 Tropical Cyclone Winston, the government focused on humanitarian and in-kind support (food, water, tents). After about one month, local markets became functional again, and the government made cash payments to vulnerable groups through the existing social welfare scheme benefitting about 22,800 households and 17,800 pensioners. An impact evaluation found that beneficiaries were faster to recover than non-beneficiaries and that the majority of assistance was spent on essential items. A final stage of support comprised the provision of housing vouchers (around 3-4 months after the cyclone).
Jamaica. Following Hurricane Dean in 2007, Jamaica made a supplemental transfer of around $28 to 90,000 beneficiaries under its established safety net scheme (PATH). In addition, based on assessments of property damage, it provided vouchers to households valued from US$280 to US$850 to purchase hardware supplies from local stores for home repair.
Maldives. A cash transfer system was developed after the 2004 tsunami and delivered to some 53,000 people—about a fifth of the population—within one month. Teams visited all the affected islands, confirmed the damage to houses, and on the next day paid the victims in cash (the equivalent of $40-$115, depending on the damage).
Mauritius. To ensure transparency, post-disaster transfers were distributed in public meetings after assessing housing damage.
Pakistan. After a major earthquake, individuals and families were given a fixed amount for relief and to help rebuild their destroyed houses. Payments were channeled through bank accounts opened by beneficiaries.
Vanuatu. To support rebuilding, the government suspended VAT on building materials for 3 months in the aftermath of cyclone Pam.
Public finance and debt management
44. Policies for disaster risk management should be integrated into a sound budget framework. A sound PFM system is essential to enhancing risk management by incorporating disaster risks into fiscal planning. From a public financial management (PFM) perspective, risk reduction investments, contingency financing plans, and disaster financing approaches discussed above should be part of a top-down approach to budgeting under a transparent and sustainable medium-term fiscal framework (see IMF, 2009 and 2014b). The Fund should continue to play a leading role as provider of technical assistance on PFM practices in small developing states and other disaster-vulnerable countries (Box 9).
SMALL STATES
INTERNATIONAL MONETARY FUND 29
Box 9. A Case Study on IMF Capacity Building on PFM Practices—Pacific Islands
PFM capacity building, designed to improve budget planning and enhance the transparency of public funds, helps the Pacific Islands (PICs) make a strong case for external assistance related to natural disasters and climate change. Public financial management reform and more transparent aid management policies enhance the effectiveness and quality of public expenditure, thus offering benefits that extend beyond climate change and natural disaster risk management. A recent report by the Pacific Islands Forum (PIFS, 2013, Nauru case study) offers several lessons. These include the benefits of integrating climate change into national plans, policies and budgets, and of tracking spending through budget systems. The report also cites the difficulties in quantifying the extent of external financing available for climate change and distinguishing this financing from existing development assistance. These challenges are likely to divert capacity from other aspects of core policy management. The Pacific Financial Technical Assistance Centre (PFTAC) also provided training to enhance Pacific islands’ disaster risk management capacity. PFTAC, in coordination with the World Bank’s Disaster Risk Financing and Insurance (DRFI) Program, delivered a March 2015 regional workshop hosted by the Pacific Islands Forum Secretariat on incorporating natural disaster risks into the fiscal planning process. The workshop addressed special budgetary procedures for providing rapid access to emergency funding; the macroeconomic and fiscal impact of natural disasters; how to incorporate disasters risks into the fiscal planning process, and elements of disaster risk financing.
45. Fund capacity building can also help small states strengthen public debt management in the aftermath of natural disasters. Thus, Vanuatu recently established a public debt management office as part of an emphasis on “building back better” following cyclone Pam. Specific liquidity management innovations could be introduced into domestic and external debt instruments to provide temporary cash flow relief (triggering deferral of debt service for qualifying natural disasters).
Carbon taxes and energy pricing
46. The Fund can advise small states on carbon taxation and energy pricing reform. Small states contribute little to global CO2 emissions and other greenhouse gases. Nonetheless, carbon taxes can help these countries make progress on their emissions commitments and provide an attractive source of revenue. For the 2015 Paris Agreement on climate change, 195 countries submitted emission reduction pledges—independently determined national contributions (INDCs). For example, Mauritius and Seychelles pledged to reduce their emissions by 30 and 20 percent, respectively, relative to business as usual emissions in 2030. Carbon taxes (or tax-like instruments) are the most efficient instruments for reducing emissions. They can also raise substantial new revenues and can be implemented through a straightforward extension of fuel taxes which are well established in most countries and amongst the easiest of taxes to administer. The Fiscal Affairs Department of the IMF has developed spreadsheet tools to quantify the level of carbon pricing needed in different countries, the environmental, fiscal, economic, and incidence impacts of these policies, and their trade-offs with other instruments. The IMF also
SMALL STATES
30 INTERNATIONAL MONETARY FUND
provides country-level guidance on the broader reform of energy prices to reflect the full range of environmental impacts (e.g., air pollution, road congestion). Fiscal and debt sustainability
47. Adequate fiscal buffers are a critical part of disaster contingency planning. As discussed in the next section, domestic resources represent the first “layer” of potential disaster financing, providing immediate liquidity for disaster relief. Indeed, for small disasters, domestic deposit buffers may provide the only necessary financing. Once the appropriate size of the fiscal buffer has been established (see below), a first challenge for fiscal policy may be to accumulate additional savings if the current buffer falls short. This will require an assessment of how savings can be increased (additional revenue measures, savings on expenditures) and a timeline for the policy adjustment. The pace of accumulation of buffers should be considered from a cost-benefit assessment. Where priority spending would need to be cut to boost savings and build buffers, a more gradual accumulation of buffers could be considered drawing on new revenue measures. One option for building buffers is to include a sizeable provision for future natural disasters in the annual budget. In the event that a disaster does not occur, this allocation could be saved, thereby strengthening the fiscal buffer.
48. The fiscal stance should be set taking into account the need to build and maintain contingency buffers. In general, it may be necessary to “look through the cycle”, running a stronger fiscal stance in non-disaster years to accumulate buffers (in the form of savings or debt reduction) that can offset the adverse impact on public finances in future disaster events. The appropriate fiscal stance in non-disaster years will also depend on starting conditions. For example, the fiscal stance calibrated to provision adequately for the costs of future disasters may come on top of primary surpluses necessary to reduce a historically high debt burden. Care is needed to distinguish disaster-related and other random shocks from more permanent changes in fiscal conditions. The Fund can help countries disentangle the temporary disaster element which merits financing from more permanent fiscal shocks for which macroeconomic adjustment would be more appropriate.
49. Fiscal rules can provide the discipline needed to sustain buffers. For countries facing disaster risks, an appropriate rule could target an underlying fiscal balance during normal times that builds buffers and borrowing space. This could be accompanied by an escape clause that allows for larger fiscal deficits as part of the response to shocks such as natural disasters. The rule could also include a “debt brake” that requires fiscal adjustment in case of large ex-post slippages in fiscal balances and associated debt buildup. Where initial fiscal consolidation to reduce debt burdens is necessary, this should precede the introduction of a fiscal rule, thereby making the rule more credible, with the rule serving to lock-in these gains.
50. Debt sustainability assessments take on additional importance in disaster-vulnerable countries. Post-disaster recovery and rebuilding programs typically include a debt-financed element, and the amount and terms of such financing should be carefully reviewed. Experience suggests that rapid debt accumulation is not uncommon in countries experiencing a
SMALL STATES
INTERNATIONAL MONETARY FUND 31
series of disasters. This may reflect a weak underlying fiscal stance, with disaster-related borrowing exacerbating already weak debt dynamics. It may also reflect looser scrutiny of borrowing plans in a post-disaster setting. DSAs should be based on assumptions about trend economic growth and the future fiscal stance that incorporate the risks of adverse shocks from further disasters over the projection period (Box 4 and Annex IV).
51. More adept debt management may also help strengthen fiscal buffers. The stock of existing debt and associated financing requirements may constrain the scale and terms of access to new financing for disaster response. In some cases, debt management approaches may improve credit access—for example, refinancing existing short-term obligations at longer maturities may provide potential for new short-term borrowing. In other cases, the overall debt burden (relative to GDP or revenues) may be excessive, and improved market access will require a sustained period of strengthened fiscal performance to reduce debt ratios and steps to deepen the domestic debt market.
F. Monetary Policy and Financial Sector Issues
Financial sector risks should be identified, and contingency plans adopted and communicated. Deep and well-regulated banking systems and developed capital markets are better able to withstand shocks and provide credit to aid post-disaster recovery.
52. The impact of natural disasters on inflation should be considered in setting monetary conditions. While natural disasters have a negligible impact on inflation in advanced economies, they can have an impact lasting several years in developing countries (Parker, 2016). For the latter, storms can boost food price inflation for up to a year, while earthquakes tend to reduce CPI inflation excluding food, housing, and energy. A good understanding of these effects can help in setting policy in the immediate aftermath of a disaster.
53. The financial sector should be incentivized to support economies through disasters and develop risk-management instruments. For small states, this requires, first, identifying financial sector risks and adopting and communicating contingency plans. Over time, reforms to improve regulations and financial deepening will leave the sector better able to withstand shocks and provide credit to aid post-disaster recovery. Ideally, the financial system would also provide insurance and hedging instruments, as well as financing for investment in risk reduction. However, scale inefficiencies in small states make it likely that these needs will continue to be provided externally.
54. FSAPs and FSSRs can help assess disaster risks. While only a limited number of Financial Sector Assessment Program (FSAP) reviews have been conducted by Bank-Fund teams for small states, they provide illustrative examples of how stress tests can be used to identify the financial risks associated with natural disasters, both for the banking system as well as for the
SMALL STATES
32 INTERNATIONAL MONETARY FUND
insurance sector.37 The recently introduced Financial Sector Stability Reviews (FSSRs) have been developed as a new technical assistance instrument to help countries pursue financial inclusion and deepening in a manner complementary to financial stability. FSSRs have the potential to boost financial sector resilience to natural disasters through support for long-term financial sector development as well as short-term risk management frameworks (see below).
55. Crisis management strategies and contingency plans should be tailored to identified risks. Disaster risk management strategies can draw on Fund FSAPs and other capacity building on financial crisis preparedness and safety nets. The strategy should be tested in crisis simulations, and financial institutions and the public should be informed about the plans and tools available to handle a crisis.
Infrastructure. Key immediate goals are to ensure continued access to the banking system, continuity of the payment system, and ability to conduct cash transfers. Continued access to microfinance and mobile banking can also help in conducting financial transactions after a disaster.38 Where there is a developed local insurance sector, it should have infrastructure in place to allow prompt response in the event of a disaster.
Institutions. The strategy should define the responsibilities and actions of key institutions (usually the central bank, ministry of finance, regulatory authorities, and parliament) and establish plans for contingency financial sector response and recovery. Public lending institutions may be expected to play a role in financing the recovery, though risks should be carefully considered.39
37 The 2015 Samoa FSAP included two stress tests on a category 4 tropical cyclone, modeling the damage on physical property and production, with consequences for bank solvency. 38 In the West Bank and Gaza, the Palestine Monetary Authority issued banking regulations in preparations for natural disasters that included implementation of business continuity, disaster recovery, and crisis management plans adopted by all banks. These plans identified and insured critical information backups, alternative operational sites 50km away from each HQ, and emergency operation procedures and evacuation plans. 39 In Samoa, public development bank lending following natural disasters has been a key part of the government’s recovery strategy. The Samoa FSAP stressed the importance of sound supervision of the development bank, reform of its governance (drawing on World Bank expertise), and full accounting for any public costs of such credit in the budget and DSA.
SMALL STATES
INTERNATIONAL MONETARY FUND 33
56. Longer-term planning should target financial deepening and building financial resilience.
Steps to improve financial access can help countries weather disasters, as can longer term efforts to develop insurance and capital markets. Resilient mobile banking and microfinance networks should also be developed to supplement the traditional banking system for cash transfer after a disaster, and to support remittances, which are always an important source of incomes in small states and can be augmented when there is an urgent need.40 The development of private insurance should be a priority, either domestically or through regional or international arrangements. More developed financial systems may also be able to finance public interventions or restructure obligations more easily in a post-disaster setting.
Strong regulatory and supervisory frameworks can make banking systems more resilient to shocks. Disasters can undermine loan performance, resulting in financial stress. Financial crisis preparedness/safety nets, including a solid bank resolution framework and a deposit insurance scheme, should be strengthened in advance of natural disasters. For small states with limited supervisory capacity, the focus should be on the basics (such as access to financial data, and conducting off- and on-site supervision).
57. Higher prudential capital and liquidity ratios may be appropriate for disaster-vulnerable countries. Developing and running stress tests would help determine suitable macro-prudential measures to address liquidity stresses, which may be more acute for smaller countries. The regulator would need to balance various factors such as profitability, capital adequacy, non-performing loans (NPLs), deposit growth, and overall growth in the economy with the potential impact of disaster risks on the economy and the financial sector.
G. External Sector Policies
58. The assessment of appropriate external buffers should take account of key features of small states. The impact of disasters on the balance of payments of small states is proportionately higher as a share of GDP. In addition, most small states have fixed exchange rate arrangements. These two factors suggest that the optimal level of reserve cover is likely to be higher than for other economies. A natural disaster will likely increase demand for foreign currency that will require substantial intervention to support the pegs. Even in states with flexible exchange rate rates, a higher level of reserves will help prevent disorderly foreign exchange market developments.
40Considering the loss of correspondent banking relationships by some small states and the off-shore nature of many small island banking systems, the ex-ante adoption and implementation of a robust AML/CFT regime consistent with FATF international standards will contribute to their ability to receive needed remittances in a timely and efficient manner.
SMALL STATES
34 INTERNATIONAL MONETARY FUND
59. Standard reserve adequacy metrics often do not factor in the risk/ impact of disasters and underestimate reserve needs for countries susceptible to natural disasters. The metric for reserve adequacy developed by Mwase (2012) for small states takes into account countries’ susceptibility to natural disasters.41 The metric places a greater weight on short-term debt and exports than for other countries, reflecting the higher vulnerability of small islands to terms-of-trade shocks and the limited financial structures that could lead to accelerated deleveraging for countries without short-term market debt. Thus, the metric requires higher reserve holdings than would normally be assessed to reduce the probability of a crisis (i.e., minimizing the probability that a shock leads to a crisis). This framework could be applied, tailored to the specific circumstances of different small states.42 Further analysis is also warranted regarding the appropriate reserve buffers for disaster-affected countries. Based on a sample of countries, small states do not appear to significantly draw on reserves following disasters to finance balance of payments needs (Annex VII, Figure 2). One possibility is, that with limited reserve buffers, imports are delayed until external financing can be mobilized.
60. Pooling of reserves at the regional level may help reduce the costs of preparing for natural disasters. It allows members to share risk, thereby lowering the level of reserves that each country needs to maintain. Such pooling of reserves--as in the case of the Latin American International Reserve Fund (FLAR) and the Chiang Mai Initiative (CMI) in East Asia--offers a way to deal with idiosyncratic shocks, such as with natural disasters.43 Pooling international reserves allow members to benefit from economies of scale, thereby reducing the cost of natural disaster insurance premiums.44 It also reduces the need for excessive reserves hoarding owing to incentives to avoid resort to official financing. Transfers from the regional reserve pool following a natural disaster would also allow for a faster recovery, a cushion to the balance of payments, and can even mitigate capital outflows by instilling confidence. The main drawback to such a mechanism is moral hazard and sovereign risk concerns associated with risk sharing across countries.
41This metric is not yet reflected in the IMF’s current toolkit for assessing reserves adequacy. 42 In Swaziland, staff’s policy advice on reserve adequacy in the 2014 and 2015 Article IV consultations was based on an analysis that took into account large exogenous shocks where the probability of a large shock (e.g., natural disaster) is based on a cross-country sample average. Staff recommended boosting reserve cover to 5-7 months of imports. 43 FLAR provides balance of payments assistance to member countries by granting credits or guaranteeing loans to third parties. It helps harmonize the exchange, monetary and financial policies of member countries (Bolivia, Colombia, Costa Rica, Ecuador, Paraguay, Peru, Uruguay, and Venezuela) and improves the terms of investment of international reserves made by the Andean countries. CMI is a multilateral currency swap arrangement among the 10 members of the ASEAN plus the “A three” countries: China, Japan, and South Korea. CMI seeks to provide an efficient and credible mechanism for offering emergency liquidity to ASEAN +3 economies experiencing currency crises. 44 Under the World Bank-supported PCRAFI, consideration is being given to establishing a mutual fund that could meet country needs in the event of smaller disasters that do not trigger a sovereign insurance payout.
SMALL STATES
INTERNATIONAL MONETARY FUND 35
FINANCING APPROACHES 61. This section discusses financing needs related to natural disasters and climate change.45 It opens by exploring current practices for financing natural disasters, optimal approaches, and obstacles to the latter. This is followed by a detailed discussion of several key financing options, with specific recommendations for usage. The section concludes with a discussion of access to climate change financing for small states.
A. Financing Natural Disasters
Countries should develop advance plans for financing natural disasters, rather than looking at options only “after the event”. Advance plans should comprise a mix of fiscal buffers, contingent grant and loan arrangements, and risk transfer options. Limited progress has been made in this direction, and large disasters tend to be under-financed for small states, despite the relatively small cost by global standards.
62. Natural disasters give rise to several financing needs. Prior to disasters, financing should be allocated to a program of risk reduction investments. When disasters strike, financing is needed for relief and recovery. Then, longer-term financing is needed for rebuilding. Each of these elements of financing should be integrated into the fiscal and debt management frameworks.
63. Uncertainty is the biggest challenge, so ex-ante risk reduction should be a priority. The main challenge is how to provision for urgent post-disaster relief and recovery costs that are, by their nature, unpredictable and require financing that was not envisaged in the budget process. Rebuilding needs in the aftermath of a disaster are similarly difficult to predict. Risk reduction investments, on the other hand, are predictable and can be integrated in a straightforward manner into the medium-term fiscal framework. There is a strong case for expanding ex ante risk reduction investment to a far greater extent than currently, since not only can this type of financing be managed with more predictability, but—more fundamentally—the greater a country’s success with risk reduction, the lower its expected damages that will need ex-post financing.
64. Currently, however, small states’ disaster financing is almost exclusively focused on ex-post recovery rather than on ex-ante risk reduction. Governments face constraints on domestic and external resources, and difficulties in accessing financial instruments at costs that seem affordable. Hence they continue to rely on ex-post borrowing and support from the international community to pay for rebuilding. The result is underinvestment in adaptation and
45 Drafted by Leo Bonato, drawing on a background study prepared by a team comprising Mai Farid, Burcu Hacibedel, Sarwat Jahan, Marshall Mills, Andrea Salerno, Wendell Samuel, Nobuyasu Sugimoto, Eriko Togo, and Marilyn Whan-Kan, led by Adrienne Cheasty and Cathy Pattillo.
SMALL STATES
36 INTERNATIONAL MONETARY FUND
risk reduction as well as a slow, fragmented, and unreliable response to natural disasters (Clarke, 2016). Data on overseas development assistance (ODA) point to a clear ex-post emphasis. During 1990-2010, emergency response and reconstruction accounted for 86 percent of disaster-related ODA disbursements, with disaster prevention and preparedness representing only 14 percent.46 For small developing states, the latter proportion was only slightly higher (24 percent). ODA financing is also less than fully additional. There is also evidence that, in the aftermath of a disaster, external development partners reassign previously allocated funding, implying a reprogramming of spending priorities.47 While this may be an efficient use of resources, it can overstate the country’s access to net new financing. Moreover, it implies a tradeoff between disaster recovery and the developmental goals that would otherwise have been financed.
65. The World Bank has developed a risk-layered framework for optimizing disaster financing. Given a country’s disaster risk, policy makers should choose a mix of financial instruments that finances their contingent liability at the lowest economic opportunity cost (Clarke et al. 2016). The model balances the speed of access to post-disaster resources with the cost and potential availability of financing (Figure 4).
Small disasters. Small but unpredictable financing needs can be met using self-insurance—either by reallocating spending or drawing down available government deposits. This can provide resources quickly and at a lower cost than via sovereign insurance.
Moderate sized disasters. Financing needs will typically exceed buffers available from self-insurance, and will require access to external resources. Since external grants and loans are often difficult to mobilize at short notice, efforts should be made to establish contingent arrangements that provide access to resources in the event of a disaster. For moderate and large disasters, risk transfer options should also be developed, whereby a third party takes over a portion of disaster-related financial risks in exchange for a fee or premium.
Largest disasters. In these cases, large-scale insurance is not cost-effective, but catastrophe adjusters in sovereign bonds can allow some risk transfer in the form of debt service savings.48 Debt sustainability considerations may prevent large scale use of borrowed resources, and there may be little alternative but to depend on grants and humanitarian assistance, where available, though financing flows are often slow and unpredictable.
46 Based on the Disaster Aid Tracking Database compiled by the Global Facility for Disaster Reduction and Recovery. During 1990-2010, just two percent of overall ODA was devoted to disaster-related activities (US$92 billion, of which $1.2 billion to small developing states). 47 For instance, after Hurricane Ivan, where damages to Grenada amounted to more than US$800 million, donors pledged about US$150 million in aid, but one third of this took the form of reallocated commitments. 48 For an extensive discussion of disaster financing approaches, see World Bank, 2014b.
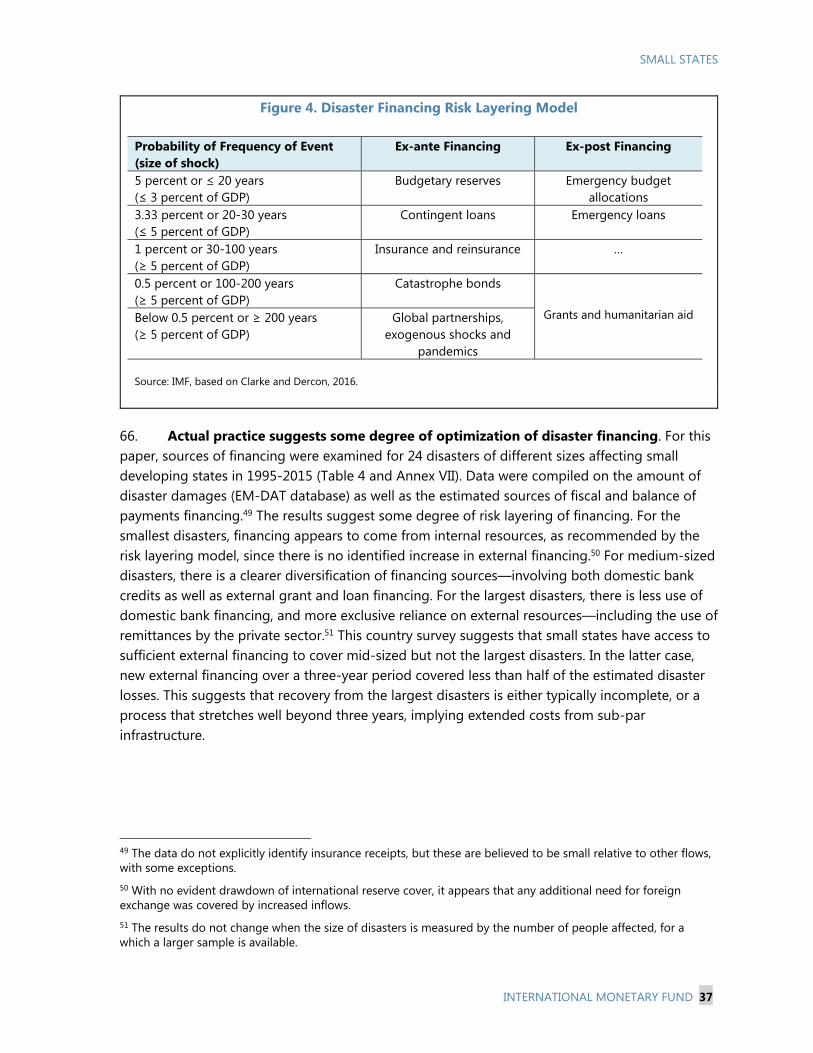
SMALL STATES
INTERNATIONAL MONETARY FUND 37
Figure 4. Disaster Financing Risk Layering Model
Probability of Frequency of Event (size of shock)
Ex-ante Financing Ex-post Financing
5 percent or ≤ 20 years (≤ 3 percent of GDP)
Budgetary reserves Emergency budget allocations
3.33 percent or 20-30 years (≤ 5 percent of GDP)
Contingent loans Emergency loans
1 percent or 30-100 years (≥ 5 percent of GDP)
Insurance and reinsurance …
0.5 percent or 100-200 years (≥ 5 percent of GDP)
Catastrophe bonds
Grants and humanitarian aid Below 0.5 percent or ≥ 200 years (≥ 5 percent of GDP)
Global partnerships, exogenous shocks and
pandemics Source: IMF, based on Clarke and Dercon, 2016.
66. Actual practice suggests some degree of optimization of disaster financing. For this paper, sources of financing were examined for 24 disasters of different sizes affecting small developing states in 1995-2015 (Table 4 and Annex VII). Data were compiled on the amount of disaster damages (EM-DAT database) as well as the estimated sources of fiscal and balance of payments financing.49 The results suggest some degree of risk layering of financing. For the smallest disasters, financing appears to come from internal resources, as recommended by the risk layering model, since there is no identified increase in external financing.50 For medium-sized disasters, there is a clearer diversification of financing sources—involving both domestic bank credits as well as external grant and loan financing. For the largest disasters, there is less use of domestic bank financing, and more exclusive reliance on external resources—including the use of remittances by the private sector.51 This country survey suggests that small states have access to sufficient external financing to cover mid-sized but not the largest disasters. In the latter case, new external financing over a three-year period covered less than half of the estimated disaster losses. This suggests that recovery from the largest disasters is either typically incomplete, or a process that stretches well beyond three years, implying extended costs from sub-par infrastructure.
49 The data do not explicitly identify insurance receipts, but these are believed to be small relative to other flows, with some exceptions. 50 With no evident drawdown of international reserve cover, it appears that any additional need for foreign exchange was covered by increased inflows. 51 The results do not change when the size of disasters is measured by the number of people affected, for a which a larger sample is available.
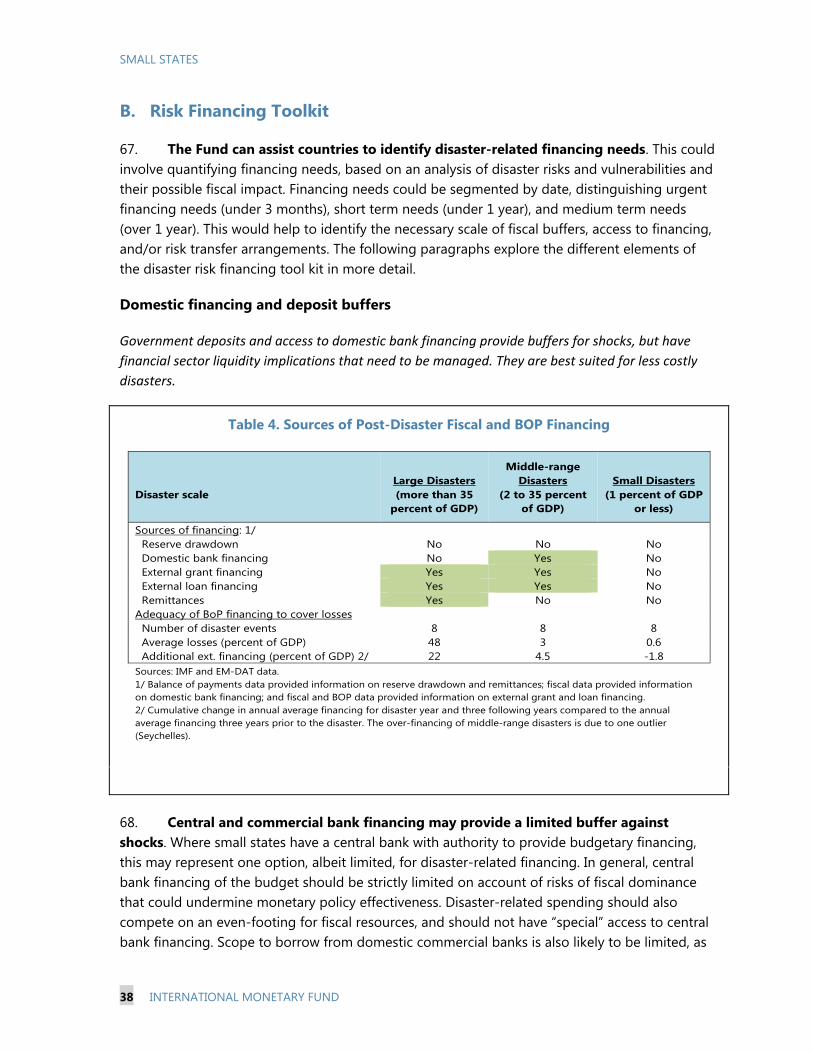
SMALL STATES
38 INTERNATIONAL MONETARY FUND
B. Risk Financing Toolkit
67. The Fund can assist countries to identify disaster-related financing needs. This could involve quantifying financing needs, based on an analysis of disaster risks and vulnerabilities and their possible fiscal impact. Financing needs could be segmented by date, distinguishing urgent financing needs (under 3 months), short term needs (under 1 year), and medium term needs (over 1 year). This would help to identify the necessary scale of fiscal buffers, access to financing, and/or risk transfer arrangements. The following paragraphs explore the different elements of the disaster risk financing tool kit in more detail.
Domestic financing and deposit buffers
Government deposits and access to domestic bank financing provide buffers for shocks, but have
financial sector liquidity implications that need to be managed. They are best suited for less costly
disasters.
Table 4. Sources of Post-Disaster Fiscal and BOP Financing
68. Central and commercial bank financing may provide a limited buffer against shocks. Where small states have a central bank with authority to provide budgetary financing, this may represent one option, albeit limited, for disaster-related financing. In general, central bank financing of the budget should be strictly limited on account of risks of fiscal dominance that could undermine monetary policy effectiveness. Disaster-related spending should also compete on an even-footing for fiscal resources, and should not have “special” access to central bank financing. Scope to borrow from domestic commercial banks is also likely to be limited, as
Large Disasters
Middle-range Disasters Small Disasters
Disaster scale (more than 35 percent of GDP)
(2 to 35 percent of GDP)
(1 percent of GDP or less)
Sources of financing: 1/ Reserve drawdown No No No Domestic bank financing No Yes No External grant financing Yes Yes No External loan financing Yes Yes No Remittances Yes No NoAdequacy of BoP financing to cover losses Number of disaster events 8 8 8 Average losses (percent of GDP) 48 3 0.6 Additional ext. financing (percent of GDP) 2/ 22 4.5 -1.8Sources: IMF and EM-DAT data. 1/ Balance of payments data provided information on reserve drawdown and remittances; fiscal data provided information on domestic bank financing; and fiscal and BOP data provided information on external grant and loan financing. 2/ Cumulative change in annual average financing for disaster year and three following years compared to the annual average financing three years prior to the disaster. The over-financing of middle-range disasters is due to one outlier (Seychelles).

SMALL STATES
INTERNATIONAL MONETARY FUND 39
liquidity in the system may not be adequate to provide additional fiscal financing at a time when the banking system faces other financing and liquidity needs on account of the disaster. Overall, domestic borrowing is likely to be most useful in the context of small-scale disasters.
69. Government deposit buffers provide an alternative to domestic borrowing. In principle, such buffers are designed to cover early disaster response needs without compressing other priority spending until other sources can be mobilized. In some disaster-vulnerable countries in the Pacific, governments aim to maintain a deposit buffer equivalent to 3 months of recurrent spending. This buffer could, in principle, take the form of deposits in the government’s general fund, a “virtual” contingency fund within the general fund, or a dedicated fund for natural disasters. The Fund can advise on the design and management of deposit buffers and the use of dedicated contingency funds (Annex VIII). An important general consideration is that the drawdown of deposit buffers within the banking system will have similar liquidity implications as government borrowing that will need to be managed. Where current deposit buffers are inadequate, the Fund can advise on strategies for accumulating assets.52 As noted in the fiscal policy discussion, the timeline for building adequate buffers may depend on broader fiscal constraints, and would need to be specified consistently with the country’s public investment and debt and asset management strategies, given the trade-off between building buffers, capital spending, and reducing debt burdens.
External borrowing and insurance
Contingent lines of credit help reduce ex ante disaster financing uncertainty, while insurance products allow for risk transfer, at a cost.
70. Contingent lines of credit reduce external financing uncertainties. Financing can be slow to arrange, particularly if markets perceive the disaster as having increased credit risks.53 For these reasons, Clarke and Dercon (2016) argue for ex ante financing agreements that can be mobilized in the event of a disaster. Contingent financing arrangements can be arranged with bilateral, multilateral, and commercial creditors. At a bilateral level, for example, the Marshall Islands, Micronesia, and Palau benefit from compact agreements with the United States offering access to emergency support from relevant U.S. agencies, notably the Federal Emergency Management Agency (FEMA) and the United States Agency for International Development (USAID).54 At the multilateral level, the World Bank’s CAT DDO offers a pre-approved line of credit for countries experiencing disasters. Currently, this instrument is available only for middle
52 For example, unspent amounts in a contingency fund could be accumulated as a fiscal buffer. 53 For example, hurricane Ivan in the 2004 contributed to the debt default by Grenada in 2005. 54 In February 2016, the government of the Marshall Islands declared a state of emergency, citing severe drought conditions, resulting from a protracted El Niño system. A subsequent declaration of emergency by the U.S. administration activated support from FEMA.
SMALL STATES
40 INTERNATIONAL MONETARY FUND
income countries, and the Seychelles is the only small state that has negotiated coverage.55 The World Bank, with G20 financing, also recently established a Pandemic Emergency Financing Facility which could serve as a good model for natural disaster financing. The facility protects poor countries against pandemics using catastrophe bonds, reinsurance, and a cash window. Financing under the IMF’s RCF and RFI are not fully contingent, in that they are subject to conditions for access;56 however, the fact that these do not entail a Fund-supported program helps facilitate rapid disbursement. One downside to contingent credit is that the ex-ante fiscal costs of disaster relief remain uncertain and, even on an ex post basis, the fiscal impact is deferred until debt service falls due.
71. More clarity in budgeting can be provided through insurance and other risk transfer arrangements. By insuring public assets, governments can reduce uncertainties associated with direct exposure to disaster risks. Similarly, encouraging insurance of private property reduces the risk that the public sector will be called on to cover private losses. Empirical research has shown that countries with more private and public insurance penetration experience far lower output and income losses from disasters.57 Prompt insurance compensation reduces downtime for productive assets, reduces disruption of infrastructure, and indemnifies producers for income losses. The research suggests that countries with relatively low insurance penetration stand to benefit the most because they have relatively more unprotected earning assets compared to countries nearing saturation. However, uptake of insurance coverage should reflect cost-benefit considerations. For disaster financing in Ethiopia, Clarke and Dercon (2016) show that a financing strategy that includes insurance is far less costly than other options when disasters are large (i.e., 1-in-30 year events), but this advantage declines with smaller, more common events. Similarly, Bevan and Adam (2016) show that insurance is less costly than tax increases and expenditure reallocation for some disasters.
72. Traditional indemnity insurance of physical assets is not widespread in small states. The cost of indemnity insurance is high, especially where markets are underdeveloped and competition is limited.58 High premiums can also reflect the high probability and cost of disasters in small states. As a result, uptake is low, with premium payments for non-life cover averaging just 1 percent of GDP for typical small states. That said, Belize and Grenada rely on traditional insurance against severe natural disasters. In Grenada this covered about 4.5 percent of total
55 Discussions are underway as part of the IDA 18 replenishment to make the CAT DDO available to IDA countries, including small island states. 56 For example, that the country faces an urgent balance of payments need, and that this is expected to be resolved within one year and that no major policy adjustments are necessary to address underlying balance of payments difficulties. 57 See for example Melecky and Raddatz (2011), von Peter and Saxena. (2012), and Munich Re (2013). 58 Market development is not the full explanation, since use of disaster insurance is low even in advanced economies facing lower disaster probabilities. Japanese insurance coverage is one of the highest in the world at more than 10 percent of GDP. But earthquake insurance covers less than 30 percent of property, and covered only about 15 percent of the losses in the 2011 earthquake.
SMALL STATES
INTERNATIONAL MONETARY FUND 41
damages (9.2 percent of GDP) in a recent large disaster. There is some evidence from developing countries that traditional insurance for disasters has been more successful and sustainable under public-private partnerships than under exclusively private or public options. In considering this option, contingent risks to the budget would need to be carefully monitored. At the same time, the private market can be supported through better regulation and supervision, and there may be a role for some level of mandatory catastrophe insurance.59
73. Innovative approaches for sharing natural disaster risks have emerged over the past decade. Parametric insurance has emerged as a complement to regular indemnity insurance. Rather than covering specific physical assets, it is effectively an options contract that pays out in the event of a disaster that exceeds a pre-specified severity. Triggers for payout can be specified, for example, in terms of storm, flood, or earthquake intensity (measured according to third party data). Parametric insurance is quick-disbursing, but costs can be high because the market for cover is still developing. In some cases, economies of scale have been achieved by pooling cover at a regional level. A second innovation has been the development of catastrophe (CAT) bonds, which are issued as financing instruments by disaster-vulnerable countries. In exchange for a generous coupon payment, investors agree to forgive the bond principal in the event of a disaster (as measured by a parametric trigger). This releases resources from debt service to finance disaster response. Further details on these approaches are provided in Annex IX.
74. The Fund can support insurance development in several ways. Technical assistance on debt management strategies could be extended to include approaches for assessing the optimal mix of debt and insurance instruments. Since insurance is an alternative to debt-financing of disaster relief, countries need to understand how to balance debt against insurance (i.e., risk retention against risk transfer). This involves adopting a framework that weighs the costs of borrowing (debt service costs, market access risks) against the costs of insurance (insurance premia, basis risk). By helping countries better understand these tradeoffs, Fund expertise would help countries decide on what type and level of insurance coverage to purchase. The Fund can also help identify approaches to promote sustainable development and oversight of private insurance markets, including through FSAPs and FSSRs. A deeper dialogue with the insurance industry would make the Fund contribution more effective in this area.
C. Climate Change Financing
Small states have begun to access global climate funds, but their needs remain under-funded by as much as $1 billion annually. Moreover, available financing is biased toward mitigation (reducing greenhouse gas emissions) rather than adaptation needs (adjusting to the impact of climate change). Access to climate change financing is complex and administratively cumbersome, hampering access by small states with weak capacity.
59New Zealand increased its coverage against earthquakes to about 90 percent of all residential buildings following the introduction of mandatory insurance.

SMALL STATES
42 INTERNATIONAL MONETARY FUND
75. Estimated global financing for climate change currently approaches $400 billion annually. According to the most comprehensive source, cumulative financing (public and private) reached US$391 billion in 2014 (Figure 5). The private sector accounts for the largest share, with investments predominantly in carbon emissions mitigation in advanced and emerging countries. However, data on climate change financing are subject to a large degree of uncertainty. The architecture of climate finance is complex and evolving rapidly with a multiplicity of initiatives. International financial institutions, multilateral mechanisms, and climate funds operate side by side with national development assistance agencies, bilateral and national funds. The fragmentation of financing sources hampers the consistency and quality of data as different entities report according to their own definition, level of detail, frequency, and with different quality control procedures.60 Despite recent efforts to improve the situation, significant data gaps remain, particularly for private financing and public financing that is not channeled through multilateral or national development banks. 61
60 The operational definition of climate finance recommended by the UNFCCC states that “Climate finance aims at reducing emissions, and enhancing sinks of greenhouse gases and aims at reducing vulnerability of, and maintaining and increasing the resilience of human and ecological systems to negative climate change impacts.” (UNFCCC, 2014). 61 Including estimates of private investment in energy efficiency and domestic public financing, global climate finance would reach US$933 billion in 2014, which is still small compared, for example, with the US$1.6 trillion invested in fossil energy (UNFCCC, 2016).
Figure 5. Global Climate Finance Flows (2014, US$ billions)
Source: Climate Policy Initiative (2016)
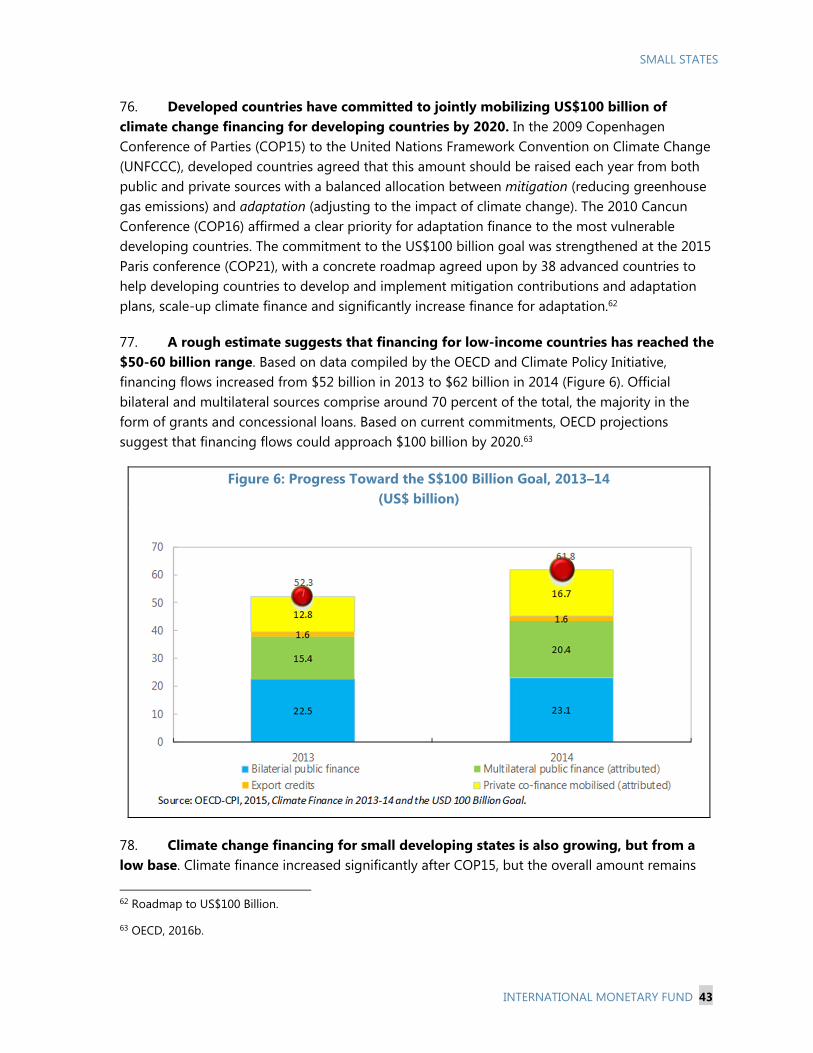
SMALL STATES
INTERNATIONAL MONETARY FUND 43
76. Developed countries have committed to jointly mobilizing US$100 billion of climate change financing for developing countries by 2020. In the 2009 Copenhagen Conference of Parties (COP15) to the United Nations Framework Convention on Climate Change (UNFCCC), developed countries agreed that this amount should be raised each year from both public and private sources with a balanced allocation between mitigation (reducing greenhouse gas emissions) and adaptation (adjusting to the impact of climate change). The 2010 Cancun Conference (COP16) affirmed a clear priority for adaptation finance to the most vulnerable developing countries. The commitment to the US$100 billion goal was strengthened at the 2015 Paris conference (COP21), with a concrete roadmap agreed upon by 38 advanced countries to help developing countries to develop and implement mitigation contributions and adaptation plans, scale-up climate finance and significantly increase finance for adaptation.62
77. A rough estimate suggests that financing for low-income countries has reached the $50-60 billion range. Based on data compiled by the OECD and Climate Policy Initiative, financing flows increased from $52 billion in 2013 to $62 billion in 2014 (Figure 6). Official bilateral and multilateral sources comprise around 70 percent of the total, the majority in the form of grants and concessional loans. Based on current commitments, OECD projections suggest that financing flows could approach $100 billion by 2020.63
Figure 6: Progress Toward the S$100 Billion Goal, 2013–14 (US$ billion)
78. Climate change financing for small developing states is also growing, but from a low base. Climate finance increased significantly after COP15, but the overall amount remains
62 Roadmap to US$100 Billion. 63 OECD, 2016b.

SMALL STATES
44 INTERNATIONAL MONETARY FUND
small, reaching less than US$1 billion in 2014 (Table 5). Multilateral development banks play a key role, having channeled $444 million to small states in 2014.64 In the same year, direct assistance from bilateral donors amounted to US$368 million while US$140 were provided by dedicated multilateral and bilateral climate funds.65
Table 5. Climate Change Financing to Small Developing States – 2014 (US$ millions)
79. A majority of small states financing is for climate change mitigation, falling short of adaptation needs. Although COP16 placed increased emphasis on adaptation for low-income and small developing countries, mitigation still accounts for some 58 percent of total climate change financing for small developing states. According to the most recent estimates, global adaptation costs are 2 to 3 times higher than international public finance available for this purpose and to close this gap adaptation finance would have to be between 6 to 13 times larger by 2030 (United Nations, 2016). For small states, in 2010 the World Bank estimated a shortfall in annual adaptation financing relative to their needs of about $800 million (Margulis and Narain, 2010). Of this shortfall, 66 percent was for Caribbean states, 27 percent for Pacific states, and 7 percent for Africa and the Indian Ocean. Adaptation priorities vary across small states, with the infrastructure representing the largest cost, and expected to increase over time with
64 Figures for multilateral development banks (MDBs) are based on data on MDBs’ own resources included in African Development Bank, Asian Development Bank, European Bank for Reconstruction and Development, European Investment Bank, Inter-American Development Bank, International Finance Corporation, and World Bank (2015a). These data are only available for the 39 members of the Alliance of Small Island States (AOSIS) (list available at http://aosis.org/about/members/.) which likely overestimates the amount directed to the sample of 34 small developing states. 65 Among the various programs, the most active are the Pilot Program for Climate Resilience (PCCR) under the Strategic Climate Fund (SCF), which is part of Climate Investment Funds (CIFs) hosted and administered by the World Bank; the Least Developed Countries Fund (LDCF), which is part of the Global Environment Fund (GEF) under the UNFCCC, but also hosted by the World Bank; the Global Climate Change Alliance (GCCA), established by the European Union to target LDCs and SIDS; the Adaptation Fund (AF) under the UNFCC. The new Green Climate Fund (GCF) under the UNFCCC has already approved several projects for small developing states.

SMALL STATES
INTERNATIONAL MONETARY FUND 45
urbanization. Other priorities include investments in coastal zones, water supplies, agriculture, human health, and preparedness for extreme weather events.
80. Additionality of climate change financing is a concern for small developing states. Bilateral and multilateral climate finance may crowd out pre-existing commitments. Indeed, over the last decade, bilateral climate finance to small developing states has increased more rapidly than overall official development assistance (Figure 7). Projections suggest that aid to these countries will stagnate at current levels going forward. Moreover, in addition to the data issues mentioned above, tracking progress toward the US$100 billion goal is complicated by the difficulty to distinguish between resources made available by donors under previous commitments and new and additional resources.
Figure 7. Small developing states’ share of ODA flows (percent)
Source: IMF staff elaborations on OECD CRS database
81. Eligibility criteria for financing are complex and administratively cumbersome for small developing states. The multiplicity of funding sources and intermediaries has given origin to an equally fragmented set of criteria that regulate the flow of climate funds. While multilateral development banks have adopted broadly harmonized principles to guide eligibility and disbursement for climate-related projects, criteria for climate funds and bilateral initiatives vary markedly. Eligibility criteria for the main existing funds include: (i) being a party to the UNFCCC eligibility/Kyoto Protocol; (ii) eligibility for general financing/technical assistance from the institution (IFAD, World Bank, UNDP), including debt sustainability and macroeconomic context; (iii) consistency with the funding institution’s strategic objectives or themes/ specialization; (iv) consistency with national plans/strategies; and (v) recipient government’s commitment, etc. In many cases, applicants are required to have coherent national climate plans already in place. Fulfilling the conditions for access to available funds can be a challenge for small developing
SMALL STATES
46 INTERNATIONAL MONETARY FUND
states with low capacity.66 While most governments and financing partners recognize the need for more effective coordination and partnership in climate change financing, efforts are at an early stage. A particular challenge is to adjust administrative procedures to the scale of small states’ funding needs.67
82. Strengthening administrative capacity will be critical for helping small developing states access climate change financing. Adequate administrative capacity is essential to coordinate domestic institutions to access, manage, and use climate finance in an effective manner. Indeed, small developing states with lower institutional capacity have less access to multilateral climate finance (Figure 8).68 Also, supporting policies may be necessary to promote adaptation efforts and governments can play an important role. Policy intervention can help overcome market failures and promote private sector adaptation. Key factors for an enabling domestic environment are stable domestic policies and consistent legal and regulatory frameworks. These factors can help attract and absorb international climate finance while ensuring the effective and accountable use of the funds.
66 Recognizing the need to bolster small states’ access to climate change funding, a Commonwealth Climate Finance Access Hub was launched in 2016. Located in Mauritius and co-financed by Australia and the Commonwealth Secretariat, the hub will place climate finance advisors in small states for periods of 1-2 years to help host ministries identify and apply for climate change funding. 67 A forthcoming OECD/World Bank report finds that over half of the climate and disaster resilience projects in SIDS are smaller than $200,000, and that the combined total of SIDS projects represents just 2 percent of global projects. 68 This result holds even when controlling for the level of per capita income.
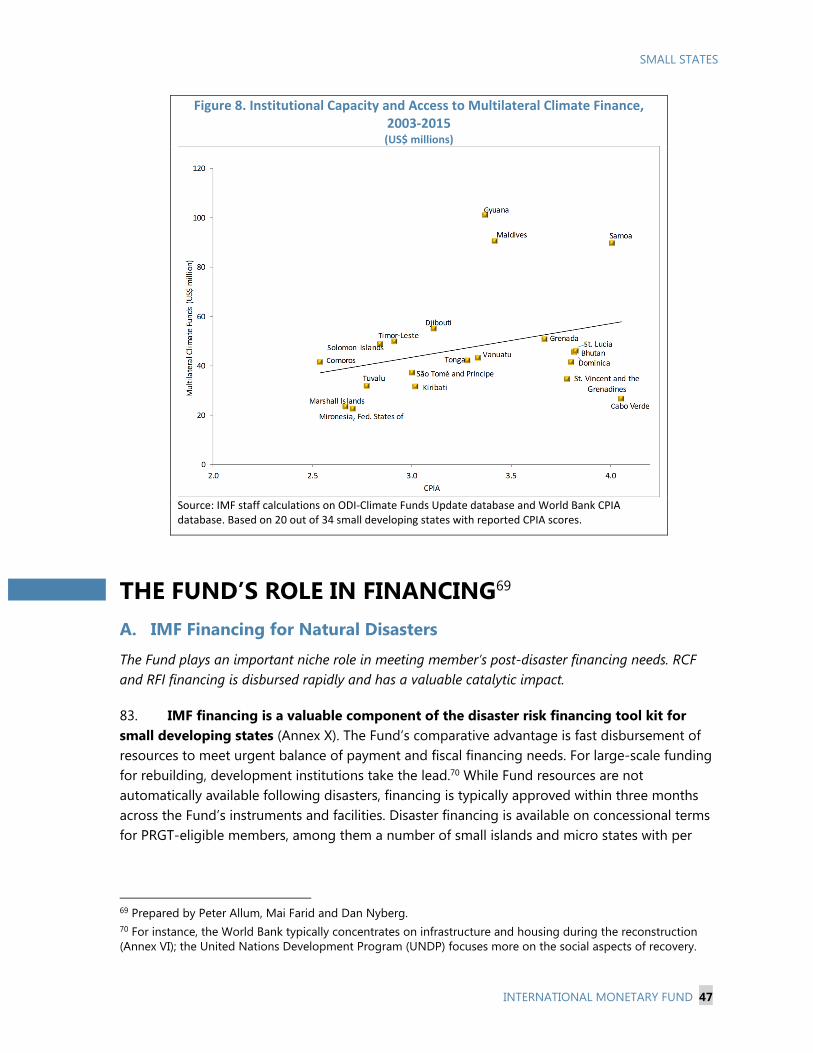
SMALL STATES
INTERNATIONAL MONETARY FUND 47
Figure 8. Institutional Capacity and Access to Multilateral Climate Finance, 2003-2015 (US$ millions)
Source: IMF staff calculations on ODI-Climate Funds Update database and World Bank CPIA database. Based on 20 out of 34 small developing states with reported CPIA scores.
THE FUND’S ROLE IN FINANCING69 A. IMF Financing for Natural Disasters
The Fund plays an important niche role in meeting member’s post-disaster financing needs. RCF and RFI financing is disbursed rapidly and has a valuable catalytic impact.
83. IMF financing is a valuable component of the disaster risk financing tool kit for small developing states (Annex X). The Fund’s comparative advantage is fast disbursement of resources to meet urgent balance of payment and fiscal financing needs. For large-scale funding for rebuilding, development institutions take the lead.70 While Fund resources are not automatically available following disasters, financing is typically approved within three months across the Fund’s instruments and facilities. Disaster financing is available on concessional terms for PRGT-eligible members, among them a number of small islands and micro states with per
69 Prepared by Peter Allum, Mai Farid and Dan Nyberg. 70 For instance, the World Bank typically concentrates on infrastructure and housing during the reconstruction (Annex VI); the United Nations Development Program (UNDP) focuses more on the social aspects of recovery.
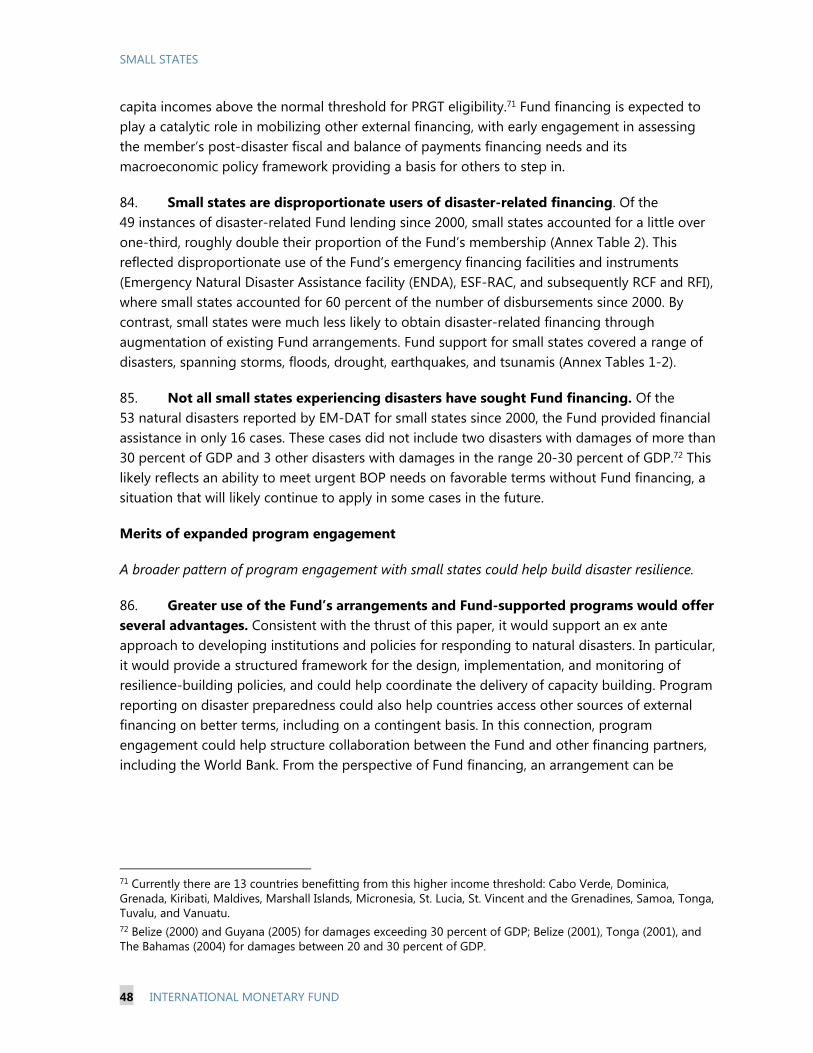
SMALL STATES
48 INTERNATIONAL MONETARY FUND
capita incomes above the normal threshold for PRGT eligibility.71 Fund financing is expected to play a catalytic role in mobilizing other external financing, with early engagement in assessing the member’s post-disaster fiscal and balance of payments financing needs and its macroeconomic policy framework providing a basis for others to step in.
84. Small states are disproportionate users of disaster-related financing. Of the 49 instances of disaster-related Fund lending since 2000, small states accounted for a little over one-third, roughly double their proportion of the Fund’s membership (Annex Table 2). This reflected disproportionate use of the Fund’s emergency financing facilities and instruments (Emergency Natural Disaster Assistance facility (ENDA), ESF-RAC, and subsequently RCF and RFI), where small states accounted for 60 percent of the number of disbursements since 2000. By contrast, small states were much less likely to obtain disaster-related financing through augmentation of existing Fund arrangements. Fund support for small states covered a range of disasters, spanning storms, floods, drought, earthquakes, and tsunamis (Annex Tables 1-2).
85. Not all small states experiencing disasters have sought Fund financing. Of the 53 natural disasters reported by EM-DAT for small states since 2000, the Fund provided financial assistance in only 16 cases. These cases did not include two disasters with damages of more than 30 percent of GDP and 3 other disasters with damages in the range 20-30 percent of GDP.72 This likely reflects an ability to meet urgent BOP needs on favorable terms without Fund financing, a situation that will likely continue to apply in some cases in the future.
Merits of expanded program engagement
A broader pattern of program engagement with small states could help build disaster resilience.
86. Greater use of the Fund’s arrangements and Fund-supported programs would offer several advantages. Consistent with the thrust of this paper, it would support an ex ante approach to developing institutions and policies for responding to natural disasters. In particular, it would provide a structured framework for the design, implementation, and monitoring of resilience-building policies, and could help coordinate the delivery of capacity building. Program reporting on disaster preparedness could also help countries access other sources of external financing on better terms, including on a contingent basis. In this connection, program engagement could help structure collaboration between the Fund and other financing partners, including the World Bank. From the perspective of Fund financing, an arrangement can be
71 Currently there are 13 countries benefitting from this higher income threshold: Cabo Verde, Dominica, Grenada, Kiribati, Maldives, Marshall Islands, Micronesia, St. Lucia, St. Vincent and the Grenadines, Samoa, Tonga, Tuvalu, and Vanuatu. 72 Belize (2000) and Guyana (2005) for damages exceeding 30 percent of GDP; Belize (2001), Tonga (2001), and The Bahamas (2004) for damages between 20 and 30 percent of GDP.
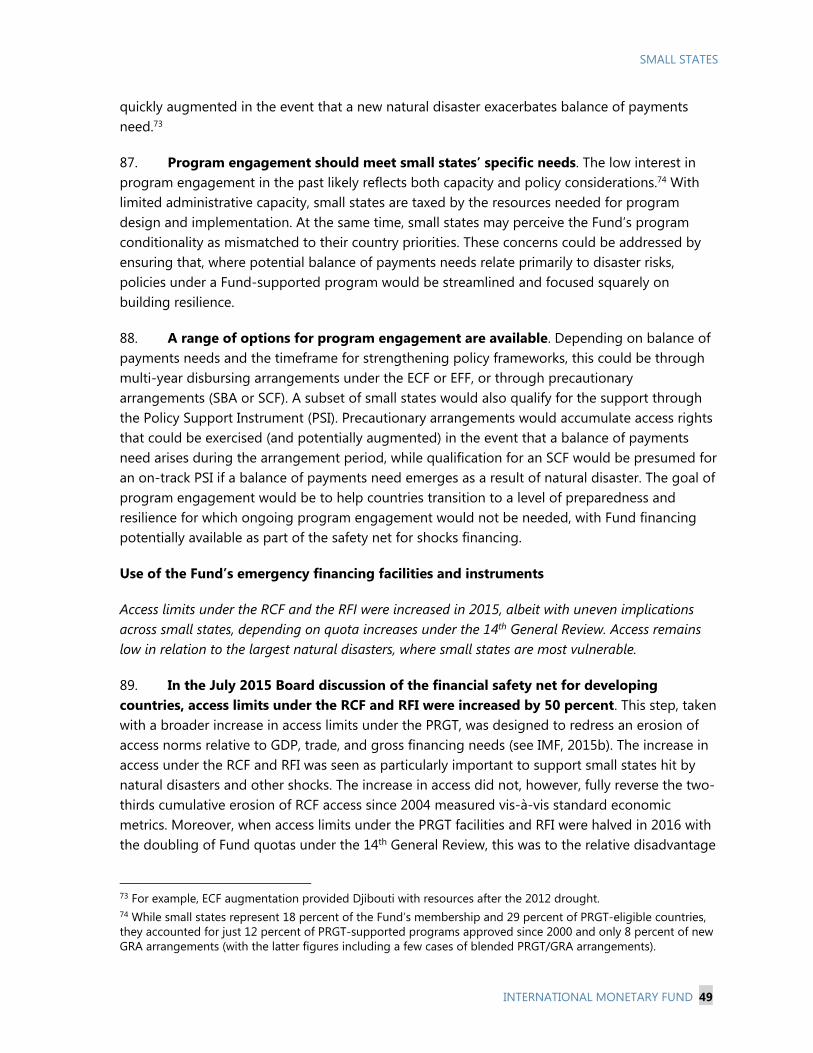
SMALL STATES
INTERNATIONAL MONETARY FUND 49
quickly augmented in the event that a new natural disaster exacerbates balance of payments need.73
87. Program engagement should meet small states’ specific needs. The low interest in program engagement in the past likely reflects both capacity and policy considerations.74 With limited administrative capacity, small states are taxed by the resources needed for program design and implementation. At the same time, small states may perceive the Fund’s program conditionality as mismatched to their country priorities. These concerns could be addressed by ensuring that, where potential balance of payments needs relate primarily to disaster risks, policies under a Fund-supported program would be streamlined and focused squarely on building resilience.
88. A range of options for program engagement are available. Depending on balance of payments needs and the timeframe for strengthening policy frameworks, this could be through multi-year disbursing arrangements under the ECF or EFF, or through precautionary arrangements (SBA or SCF). A subset of small states would also qualify for the support through the Policy Support Instrument (PSI). Precautionary arrangements would accumulate access rights that could be exercised (and potentially augmented) in the event that a balance of payments need arises during the arrangement period, while qualification for an SCF would be presumed for an on-track PSI if a balance of payments need emerges as a result of natural disaster. The goal of program engagement would be to help countries transition to a level of preparedness and resilience for which ongoing program engagement would not be needed, with Fund financing potentially available as part of the safety net for shocks financing.
Use of the Fund’s emergency financing facilities and instruments
Access limits under the RCF and the RFI were increased in 2015, albeit with uneven implications across small states, depending on quota increases under the 14th General Review. Access remains low in relation to the largest natural disasters, where small states are most vulnerable.
89. In the July 2015 Board discussion of the financial safety net for developing countries, access limits under the RCF and RFI were increased by 50 percent. This step, taken with a broader increase in access limits under the PRGT, was designed to redress an erosion of access norms relative to GDP, trade, and gross financing needs (see IMF, 2015b). The increase in access under the RCF and RFI was seen as particularly important to support small states hit by natural disasters and other shocks. The increase in access did not, however, fully reverse the two-thirds cumulative erosion of RCF access since 2004 measured vis-à-vis standard economic metrics. Moreover, when access limits under the PRGT facilities and RFI were halved in 2016 with the doubling of Fund quotas under the 14th General Review, this was to the relative disadvantage
73 For example, ECF augmentation provided Djibouti with resources after the 2012 drought. 74 While small states represent 18 percent of the Fund’s membership and 29 percent of PRGT-eligible countries, they accounted for just 12 percent of PRGT-supported programs approved since 2000 and only 8 percent of new GRA arrangements (with the latter figures including a few cases of blended PRGT/GRA arrangements).
SMALL STATES
50 INTERNATIONAL MONETARY FUND
of the majority of small states, whose quotas rose by less than 100 percent. As a result, the half of small states that received the smallest quota increases saw only a minor increase in the SDR value of access to RCF and RFI financing as a result of the 2015-2016 reforms (Figure 9).
Figure 9. Annual Access Ceilings under RCF and RFI (in SDR terms, January 2015=100)
Source: IMF Staff.
90. The RCF/RFI safety net is small in relation to the largest natural disasters. Severe disasters are likely to result in larger immediate balance of payments needs, and while Fund financing is typically higher in such cases, the increase is not fully in proportion to disaster costs. Thus, for smaller disasters (defined as involving costs of less than 30 percent of GDP), Fund emergency financing was equivalent to 11.6 percent of disaster impact, while the equivalent figure was 2.4 percent for larger disasters (with costs in excess of 30 percent of GDP) (see Annex Table 2). Some decline in the Fund’s relative role might be expected, to the extent that larger disasters involve larger reconstruction efforts financed by bilateral creditors, regional development banks, and commercial creditors. However, there is evidence that, for the most severe disasters, the need for Fund financing can exceed the current annual RFI financing limit and the corresponding RCF limit under the shock window (37.5 percent of quota). For example, in 2015, following hurricane damage to Dominica and cyclone damage in Vanuatu, Fund financing under the RCF and RCF/RFI blends were approved in amounts equivalent to 53.5 and 71.4 percent of current quotas.
SMALL STATES
INTERNATIONAL MONETARY FUND 51
91. Fund arrangements are not seen as a good substitute for the RCF/RFI safety net for severe disaster cases. In principle, where the RCF and RFI cannot meet immediate disaster-related BOP needs, members can request a Fund arrangement—which, as discussed above, could support resilience-building policies. However, in the immediate aftermath of a severe disaster countries find it difficult to free up policy-making resources for discussions with the Fund on medium-term policy frameworks.75 Given this, and with the prospect that disasters could become progressively more severe with climate change, greater access appears warranted for the RCF and RFI to meet the immediate balance of payments needs of members facing severe natural disasters.
92. To round-off the 2015 financial safety net reforms, consideration could be given to higher RCF/RFI access limits for countries impacted by severe disasters. Indeed, this approach was suggested by a few Directors in 2015. Reforms could be framed as outlined below. In the event of Board support, a formal proposal could be developed for Board consideration.
Annual access. For countries impacted by severe disasters, defined as causing damage of 30 percent of GDP or higher, the annual access limit under the RCF and RFI would be set at 60 percent of quota. In all other cases, the current annual access limit would apply (37.5 percent of quota). As at present, access would be determined on a case-by-case basis, based on balance of payments need, capacity to repay, and the catalytic role of Fund financing. The augmented access limit would apply to the full Fund membership—though, as discussed below, countries experiencing disasters of this scale tend to be smaller states.76
Cumulative access limits would remain unchanged at 75 percent of quota. Where countries benefit from higher RCF/RFI access under the severe disaster window, this would reduce remaining cumulative access below 37.5 percent of quota.
Measurement. Damages, for above purposes, would comprise the value of destruction of physical assets plus foregone output, measured relative to pre-disaster GDP projections. In measuring disaster damages, the Fund would draw on assessments by the national authorities, UNDP, World Bank, and other relevant agencies.
Letter of intent. For countries seeking financing within the augmented RCF or RFI window, an expectation could be established that the authorities’ letter of intent should document existing and planned practices in regard to the adoption and implementation of disaster risk reduction approaches. This documentation requirement would not slow access to Fund financing and would not establish conditionality. However, it would allow the Board to assess the adequacy of policy efforts to manage disaster risks, including the potential need for
75 Indeed, good practice suggests that the design of a disaster risk management framework involve a wide group of counterparts, including other development partners, different levels of government, the private sector, and non-governmental organizations. Thus, a Fund arrangement designed to promote resilience-building would normally involve a broad and potentially time-intensive consultative process. 76 RFI assistance would continue to count toward the applicable RCF annual and cumulative access limits, but not vice versa.
SMALL STATES
52 INTERNATIONAL MONETARY FUND
capacity building support for such efforts in the post-disaster period. Moreover, consistent with current policy, higher access under the RCF shocks window would only be expected in cases where the member’s existing and prospective policies are sufficiently strong to address the shock.
93. Eligibility for the augmented access window for severe disasters would be relatively rare. Historically, fewer than one-in-ten disasters in small states resulted in damages of 30 percent of GDP or higher, a ratio that falls below one-in-one hundred for larger states (Text Figure 1). Over the period 2000-2015, eleven countries would have met the proposed threshold (Table 6).77 Of this group, ten were PRGT eligible, nine were small states, and nine sought Fund financing, generally through the Fund’s emergency facilities and instruments.
94. An augmented access limit for the RCF and RFI would result in only modest additional demand for Fund resources. On the assumption that the augmented access limit is used, on average, roughly once each year, and given the typical size of countries that may prove eligible, the additional demand on PRGT and GRA resources is projected to be limited.78 Importantly, the proposed reform would preserve the financial sustainability of the PRGT.79
77A further country, Kenya, would have come very close, with a drought causing damages equivalent to 28.8 percent of GDP. 78Based on the historic occurrence of natural disasters across countries, their scale in relation to GDP, and country quotas, projections for additional RCF loan demand would under most scenarios remain within less than 5 percent of the annual average lending capacity of the PRGT, and well within the observed swings in loan demand the PRGT is equipped to cope with (IMF, 2016c). 79Ring-fencing access to countries facing disaster damages of more than 30 percent of GDP reduces potential loan demand considerably compared to the option of an across-the-board increase in RCF and RFI access limits. The potential impact on PRGT and GRA loan demand would likely remain modest with other relatively high thresholds (e.g., 20 or 40 percent of GDP). However, raising the threshold above 30 percent of GDP could make use of the new access window unnecessarily rare. Given inevitable uncertainties around the costing of disaster impacts, a much lower threshold could also result in some smaller disasters being overstated to access the new financing window. After several years’ experience, use of the higher access window and the associated disaster damage threshold could be reviewed.
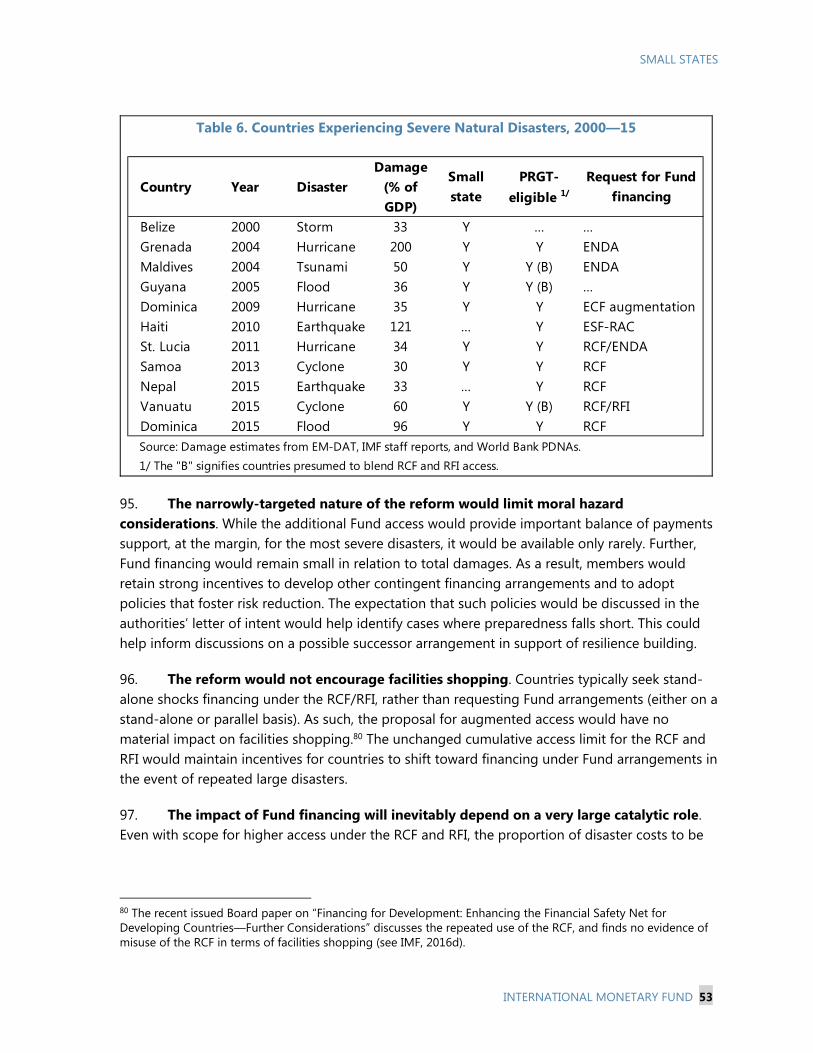
SMALL STATES
INTERNATIONAL MONETARY FUND 53
Table 6. Countries Experiencing Severe Natural Disasters, 2000—15
95. The narrowly-targeted nature of the reform would limit moral hazard considerations. While the additional Fund access would provide important balance of payments support, at the margin, for the most severe disasters, it would be available only rarely. Further, Fund financing would remain small in relation to total damages. As a result, members would retain strong incentives to develop other contingent financing arrangements and to adopt policies that foster risk reduction. The expectation that such policies would be discussed in the authorities’ letter of intent would help identify cases where preparedness falls short. This could help inform discussions on a possible successor arrangement in support of resilience building.
96. The reform would not encourage facilities shopping. Countries typically seek stand-alone shocks financing under the RCF/RFI, rather than requesting Fund arrangements (either on a stand-alone or parallel basis). As such, the proposal for augmented access would have no material impact on facilities shopping.80 The unchanged cumulative access limit for the RCF and RFI would maintain incentives for countries to shift toward financing under Fund arrangements in the event of repeated large disasters.
97. The impact of Fund financing will inevitably depend on a very large catalytic role. Even with scope for higher access under the RCF and RFI, the proportion of disaster costs to be
80 The recent issued Board paper on “Financing for Development: Enhancing the Financial Safety Net for Developing Countries—Further Considerations” discusses the repeated use of the RCF, and finds no evidence of misuse of the RCF in terms of facilities shopping (see IMF, 2016d).
Country Year DisasterDamage
(% of GDP)
Small state
PRGT-eligible 1/
Request for Fund financing
Belize 2000 Storm 33 Y … …Grenada 2004 Hurricane 200 Y Y ENDAMaldives 2004 Tsunami 50 Y Y (B) ENDAGuyana 2005 Flood 36 Y Y (B) …Dominica 2009 Hurricane 35 Y Y ECF augmentationHaiti 2010 Earthquake 121 … Y ESF-RACSt. Lucia 2011 Hurricane 34 Y Y RCF/ENDASamoa 2013 Cyclone 30 Y Y RCFNepal 2015 Earthquake 33 … Y RCFVanuatu 2015 Cyclone 60 Y Y (B) RCF/RFIDominica 2015 Flood 96 Y Y RCFSource: Damage estimates from EM-DAT, IMF staff reports, and World Bank PDNAs.1/ The "B" signifies countries presumed to blend RCF and RFI access.
SMALL STATES
54 INTERNATIONAL MONETARY FUND
met from other financing sources would remain very large.81 The Fund would continue to play an important catalytic role in identifying balance of payments needs, providing quick-disbursing funds for immediate needs, and confirming a sound macroeconomic framework for disaster relief and recovery. In the case of severe disasters, the ability of members to access a rarely-used higher access window could send a strong message of the Fund’s support, helping trigger comparable exceptional support from other development partners, which will likely involve large scale grants to maintain sustainable debt positions.
B. Role of the Fund in Climate Change Financing
The Fund’s role in helping countries develop policies for climate change mitigation and adaptation suggests that tailored assessments of progress in these areas could help countries access global climate funding.
98. The Fund could support global efforts to combat climate change by assessing and advising on countries’ macroeconomic policies as they relate to climate change preparedness. These assessments could be conducted in collaboration with the World Bank, with the Fund covering macroeconomic policy goals and implementation in its areas of competence. The latter include the adoption of energy taxes and subsidy reforms that appropriately price carbon emissions; the quality of frameworks for managing public infrastructure investments, including in climate change mitigation and adaptation; the strength of public finance management systems and their capacity to effectively intermediate budget resources dedicated to climate change programs; and the consistency of climate change spending programs with goals for fiscal and debt sustainability and macroeconomic absorption capacities.
99. Climate change policy advice could help countries develop coherent macro policy frameworks. Under the UN Framework Convention on Climate Change, countries have communicated Intended Nationally Determined Contributions (INDCs), specifying steps to be taken in the context of their own national circumstances, capabilities and priorities to help reduce global greenhouse gas emissions. Over the period through 2020, these INDCs will be formalized as national climate change programs which, in turn, should be aligned with overall national development strategies. To support this process, the Fund can advise countries on how to create sustainable fiscal space for climate change programs, PFM and investment management tools, and good international practices as regards energy taxation and carbon pricing. Fund engagement would be particularly important where domestic policy capacity is limited—for example in small states and fragile states.
81 Annex table 2 suggests that average shocks facility financing of 36 percent of quota met just 2.4 percent of disaster damages for small states. Even with access of 60 percent of quota, Fund financing would remain only 4 percent of overall damages.
SMALL STATES
INTERNATIONAL MONETARY FUND 55
100. Assessments could also help catalyze climate change financing. Official bilateral and multilateral agencies have a strong interest in providing climate change financing to countries maintaining sound macroeconomic policy frameworks. In principle, a favorable Bank-Fund assessment of a country’s climate change policy framework could simplify the process of qualifying for financing.82 Staff have discussed the climate change financing process with the Green Climate Fund (GCF), World Bank, and UN agencies. These exchanges suggested that IMF macroeconomic policy assessments would be welcome, though further work would be needed to establish the specific role that Fund assessments could play in catalyzing financing. Given the current climate change financing architecture with fragmented responsibilities across multiple funds and agencies, the Fund’s assessments would likely remain one of many factors determining funding decisions.
101. Climate change policy assessments would have resource implications which would be funded through prioritization of existing resources. Article IV surveillance would normally cover macroeconomic policies relating to climate change where these are macro-critical, but coverage would not typically be comprehensive across the areas identified above. A full assessment would typically require additional Fund resources, either to complement the Article IV consultation process or to staff a separate staff visit. This would involve additional effort of the country teams and drawing on technical assistance expertise, the sum of which would depend on the number and type of countries covered by the assessments. Given the Fund’s budget ceiling, this would require prioritization of the work of the country teams and within the overall technical assistance resource envelope.
102. Consideration could be given to IMF climate change policy assessments on a pilot basis. Small and fragile states would be priorities for Fund engagement, given their more limited administrative depth. Given potential resource costs and the as yet uncertain catalytic impact of such assessments, a pilot approach would provide implementation lessons that could adapted more widely, depending on the Fund’s evolving role in supporting members as they confront the macroeconomic challenges of climate change. A future review of the Fund’s role in supporting climate change, including through such pilots, would be useful to help refine and guide policies.
ISSUES FOR DISCUSSION 103. Directors may wish to discuss the following issues:
Policy approaches. Do Directors agree that strengthened domestic policy frameworks should play an important role in mitigating disaster vulnerabilities, and that a greater emphasis is needed on developing ex ante disaster risk management frameworks and integrating the macroeconomic elements into core public fiscal, debt, and financial management practices?
82 Consideration could be given to providing climate change policy assessments as a form of technical assistance, with the expectation that the country assessment would be published.

SMALL STATES
56 INTERNATIONAL MONETARY FUND
Financing for natural disasters. Do Directors agree that small states should seek to develop more ex ante financing arrangements, including insurance and other options for risk transfer? Do Directors see scope for the international community to better support small states by developing contingent financing arrangements and supporting regional insurance pooling arrangements?
Climate change financing. Do Directors agree that enhanced access to financing for climate change adjustment is a priority for small states? Do Directors agree on the importance of developing less complex and administratively cumbersome application procedures to enhance financing access for small states?
IMF arrangements. Do Directors agree that use of Fund arrangements by small states could help in developing policies and institutions necessary for resilience to natural disasters? Where natural disasters are the main factor giving rise to potential balance of payments need, do Directors agree that program design could be streamlined and focused on resilience building policies?
RCF and RFI financing. Do Directors see merit in an increase in the annual access limits under the RCF and RFI to better meet the needs of members facing urgent balance of payments needs following severe natural disasters?
IMF climate change assessments. Do Directors see value in IMF assessments of macroeconomic policies related to climate change mitigation and adaptation? Do they favor exploring such assessments, on a pilot basis, for small states in partnership with the World Bank?
Capacity building. Do Directors agree that, with strained administrative capacity in small states, sustained Fund support will be critical across the full range of its activities, with a particular emphasis on capacity building?
SMALL STATES
INTERNATIONAL MONETARY FUND 57
References Acevedo, Sebastian, 2014. “Debt, Growth and Natural Disasters: A Caribbean Trilogy,” IMF Working Paper
No. 14/125, (Washington: International Monetary Fund).
Acevedo, Sebastian, 2016. “Gone with the Wind: Estimating Hurricane and Climate Change Costs in the Caribbean,” IMF Working Paper 16/199.
Asia Development Bank, 2013, “The Economics of Climate Change in the Pacific,” (Manila: Asia Development Bank).
Barnett, J. and W. Adger, 2003, “Climate Dangers and Atoll Countries.” Climatic Change, Vol. 61, pp. 321-337.
Bevan, David and Christopher Adam. 2016. “Financing the Reconstruction of Public Capital after a Natural Disaster.” The World Bank Group, Washington, DC.
Bluedorn, J. C., 2005. “Hurricanes: Intertemporal Trade and Capital Shocks.” Nuffield College Economics Paper, No. W22.
Buffie, E., A. Berg, C. Pattillo, R. Portillo, and L.F. Zanna, 2012, “Public Investment, Growth, and Debt Sustainability: Putting Together the Pieces,” IMF Working Paper 12/144.
Burkett, M., 2011. “The Nation Ex-Situ: On Climate Change, Deteritorialized Nationhood, and the Post-Climate Era,” Climate Law, Vol. 2, pp. 345-374.
Cabezon, E., L. Hunter, P. Tumbarello, K. Washimi, and Y. Wu, 2015. “Enhancing Macroeconomic Resilience to Natural Disasters and Climate Change in the Small States of the Pacific.” IMF Working Paper No. 15/125, (Washington: International Monetary Fund).
Cavallo, E., and Noy, I., 2010, “The Economics of Natural Disasters: A Survey,” IDB Working Paper Series No. 124, (Washington: International Development Bank).
Clarke, Daniel. 2016, “Disaster Risk Finance as a Tool for Development — A Summary of Findings from the Disaster Risk Finance Impact Analytics Project”, The World Bank Group, Washington, DC.
Clarke, Daniel Jonathan and Stefan Dercon. 2016. “Dull Disasters? How Planning Ahead Will Make a Difference”, Oxford University Press, Oxford; The World Bank Group, Washington, DC.
Clarke, Daniel, Mahul, Olivier, Poulter, Richard, and Tse Ling Teh, 2016. “Evaluating Sovereign Disaster Risk Finance — A Framework”, Policy Research Working Paper No. 7721, Finance and Markets Global Practice Group, The World Bank Group, June.
Climate Policy Initiative, 2016, “Global Landscape of Climate Finance 2015”.
Dell, M., B. Jones, and B. Olken, 2012. "Temperature Shocks and Economic Growth: Evidence from the Last Half Century." American Economic Journal: Macroeconomics 4(3): 66–95.
Dellink, R., E. Lanzi, J. Château, F. Bosello, R. Parrado, and K. Bruin, 2014, “Consequences of Climate Change Damages for Economic Growth: A Dynamic Quantitative Assessment,” OECD Economics Department Working Paper No. 1135, (Paris: Organization for Economic Co-operation and Development).
Ewing, B. and Kruse, J., 2002. “The Impact of Project Impact on The Wilmington, North Carolina, Labor Market,” Public Finance Review, Vol. 30(4), pp. 296-309.
SMALL STATES
58 INTERNATIONAL MONETARY FUND
Farid, M., M. Keen, M. Papaioannou, I. Parry, C. Pattillo, and A. Ter-Martirosyan and others, 2016. “After Paris, Fiscal, Macroeconomic and Financial Implications of Climate Change,” Staff Discussion Note No. 16/01, (Washington: International Monetary Fund).
Guerson, A., 2016, “Assessing Government Self-Insurance Needs against Natural Disasters—An Application to the ECCU”, ECCU Article IV Staff Report, Appendix, 2016.
Guha-Sapir, Debarati; Below, Regina; and Hoyois, Philippe (2015). EM-DAT: The CRED/OFDA International Disaster Database, (Brussels, Belgium: Université Catholique de Louvain). Available: www.emdat.be
Hallegatte S., B. Bangalore, L. Bonzanigo, M. Fay, T. Kane, U. Narloch, J. Rozenberg, D. Treguer, and A. Vogt-Schilb, 2015, “Shock Waves: Managing the Impacts of Climate Change on Poverty,” Climate Change and Development Series, (Washington: The World Bank).
Healy, A., and N. Mulhotra, 2009, “Myopic Voters and Natural Disaster Policy,” American Political Science Review, Vol. 103(3), pp. 387-406.
Hochrainer, S., 2009, “Assessing the Macroeconomic Impacts of Natural Disasters – Are there Any?” World Bank Policy Research, Working Paper No. 4968, (Washington: The World Bank).
IMF, 2003, “Fund Assistance for Countries Facing Exogenous Shocks,” http://www.imf.org/external/np/pdr/sustain/2003/080803.pdf.
IMF, 2008, “Fiscal Risks—Sources, Disclosure, and Management”, SM/08/154.
IMF, 2009, “Fiscal Rules—Anchoring Expectations for Sustainable Public Finances”.
IMF, 2012a, “Fiscal Transparency, Accountability and Risk”, FO/DIS/12/151.
__________, 2012b, “Natural Disasters: Mitigating Impact, Managing Risks” IMF Working Paper 12/45, 2012.
IMF, 2013a, Macroeconomic Issues in Small States and Implications for Fund Engagement, (February 20, 2013).
__________, 2013b, Asia and Pacific Small States— Raising Potential Growth and Enhancing Resilience to Shocks.
__________, 2013c, Caribbean Small States—Challenges of High Debt and Low Growth.
IMF, 2014a, “Making Public Investment More Efficient,” FO/DIS/15/64, 2014.
__________, 2014b, “Staff Guidance Note on the Fund’s Engagement with Small Developing States”, 2014.
__________, 2014c, “Update on the Fiscal Transparency Initiative”, August 2014.
__________, 2014d, “Sustaining Long-Run Growth and Macroeconomic Stability in Low-Income Countries—The Role of Structural Transformation and Diversification”, FO/DIS/14/33, March 2014.
IMF, 2015a, “Making Public Investment More Efficient”, IMF Policy Paper, June 2015.
__________, 2015b, “Financing for Development—Enhancing the Financial Safety Net for Developing Countries”, June 2015.
__________, 2015c, “Macroeconomic Developments and Selected issues in Small Developing States”, March 2015.
SMALL STATES
INTERNATIONAL MONETARY FUND 59
IMF, 2016a, “Analyzing and Managing Fiscal Risks: Best Practices”, June 2016.
__________, 2016b, “Guidance Note on the Assessment of Reserve Adequacy and Related Considerations”, June 2016.
__________, 2016c, “Update on the Financing of the Fund’s Concessional Assistance and Debt Relief to Low-Income Countries”, April 2016.
__________, 2016d, “Financing for Development: Enhancing the Financial Safety Net for Developing Countries—Further Considerations”, October 2016.
Intergovernmental Panel on Climate Change, 2014. “Climate Change 2014: Synthesis Report Summary for Policymakers,” Geneva.
Khonje, W., 2015, “Migration and Development: Perspectives from Small States”. The Commonwealth Secretariat.
Kochhar, K., C. Pattillo, Y. Sun, and others, 2015, “Is the Glass Half Empty or Half Full? Issues in Managing Water Challenges and Policy Instruments.” Staff Discussion Note No. 15/11, (Washington: International Monetary Fund).
Laframboise, N., and B. Loko, 2012, “Natural Disasters: Mitigating Impact, Managing Risks.” IMF Working Paper No. 12/245, (Washington: International Monetary Fund).
Loayza, N., E. Olaberría, J. Rigolini, and L. Christiansen, 2009. “Natural Disasters and Growth—Going Beyond the Averages.” World Bank Policy Research Working Paper 4980, (Washington: The World Bank).
Lee, D., P. Tumbarello, K. Washimi and T. Zeinullayev (forthcoming), “Mind the Gap: Public Investment, Growth and Natural Disaster Risk in the Small States of the Pacific,“ Working Paper, (Washington: International Monetary Fund).
Margulis, Sergio and Urvashi Narain, 2010, “The Cost to Developing Countries of Adapting to Climate Change: New Methods and Estimates — The Global Report on the Economics of Adaptation to Climate Change Study”, The World Bank Group, Washington, DC.
McIntyre, Arnold, and others, 2016, “Caribbean Energy: Macro-Related Challenges”, IMF Working Paper, WP/16/53, March 2016.
Melecky, Martin and Raddatz, Claudio E., 2011, “How do Governments Respond? Natural-Disaster Shocks and the Fiscal Stance, World Bank Policy Research Working Paper No. 5564.
Melina, G., S. Yang, and L.F. Zanna, 2014, “Debt Sustainability, Public Investment, and Natural Resources in Developing Countries: The DIGNAR Model,” IMF Working Paper No. 14/50, forthcoming in Economic Modelling.
Munich Re, 2013, “Economic consequences of natural catastrophes: Emerging and developing economies particularly affected – Insurance cover is essential’. Position Paper, October 2013
Mwase, 2012, “How Much Should I hold? Reserve Adequacy in Emerging Markets and Small Islands”, IMF Working Paper, WP/12/205.
Neumayer, E. and T. Plümper, 2007. “The Gendered Nature of Natural Disasters: The Impact of Catastrophic Events on the Gender Gap in Life Expectancy, 1981–2002,” Annals of the Association of American Geographers, Vol. 97(3), 551–566.
Noy, I., 2009, “The Macroeconomic Consequences of Disasters.” Journal of Development Economics Vol. 88(2), pp. 221-231.
SMALL STATES
60 INTERNATIONAL MONETARY FUND
OECD, 2016a, “Climate Finance in 2013-14 and the US$100 Billion Goal”, in collaboration with the Climate Policy Initiative (CPI), Venice.
_______, 2016b, “2020 Projections of Climate Finance Towards the USD 100 Billion Goal: Technical Note”, OECD publishing.
Pacific Islands Forum Secretariat (PIFS), 2013, “Pacific Climate Change Finance Assessment: Nauru Case Study”, in collaboration with Australian Aid and United Nation Development Program.
Parker, Miles, 2016, “The Impact of Natural Disasters on Inflation”, Reserve Bank of New Zealand, DP2016/06.
Raddatz, C., 2007, “Are External Shocks Responsible for the Instability of Output in Low-Income Countries?” Journal of Development Economics Vol. 84(1), pp. 155-187.
Rasmussen, T., 2004, “Macroeconomic Implications of Natural Disasters in the Caribbean.” IMF Working Paper No. 4/224, (Washington: International Monetary Fund).
Roadmap to US$100 Billion.
http://dfat.gov.au/international-relations/themes/climate-change/Pages/climate-finance-roadmap-to-us100-billion.aspx
Roson, R., and D. van der Mensbrugghe, 2012, “Climate Change and Economic Growth: Impacts and Interactions,” International Journal of Sustainable Economy, Vol. 4(3), pp. 270-85.
Reilly, J., and D. Schimmelpfennig, 1999. “Agricultural Impact Assessment, Vulnerability, and the Scope for Adaptation.” Climate Change, Vol. 40, pp. 745–88.
Schlosser, C., K. Strzepek, X. Gao, and others, 2014. “The Future of Global Water Stress: An Integrated Assessment.” Report No. 254, MIT Joint Program on the Science and Policy of Global Change, (Cambridge: Massachusetts Institute of Technology).
Simpson, M., D. Scott, and M. Harrison, and others, 2010, “Quantification and Magnitude of Losses and Damages Resulting from the Impacts of Climate Change: Modeling the Transformational Impacts and Costs of Sea Level Rise in the Caribbean,” United Nations Development Programme.
Storlazzi, Curt, Edwin Alias, and Paul Berkowitz, 2015, “Many Atolls May be Uninhabitable within Decades due to Climate Change”, Nature.com, Scientific Reports, Article 14546, September 2015.
Tol, R., 2014. “Correction and Update: The Economic Effects of Climate Change,” Journal of Economic Perspectives Vol. 28 (November), pp. 221–26.
UNFCCC, 2007, “Impacts, Vulnerabilities and Adaptation in Developing Countries”, Bonn, Germany.
UNFCCC, 2014, “Biennial Assessment and Overview of Climate Finance Flows Report”, UNFCCC Standing Committee on Finance, New York, 2014
UNFCCC, 2016. " Fourteenth Meeting of the Standing Committee on Finance."
United Nations, 2016, “The Adaptation Finance Gap Report”, UN Environment Program, New York, 2016
von Peter, von Dahlen and Saxena, 2012, „Unmitigated disasters? New evidence on the macroeconomic cost of natural catastrophes”, BIS Working Papers.
World Bank, 2003, “Caribbean Economic Overview 2002: Macroeconomic Volatility, Household Vulnerability, and Institutional and Policy Responses,” Report No. 24165, LAC (Washington: World Bank).
SMALL STATES
INTERNATIONAL MONETARY FUND 61
World Bank, 2013, “Turn Down the Heat: Climate Extremes, Regional Impact and the Case for Resilience,” (Washington: The World Bank Group)
World Bank, 2014a, “Turn Down the Heat: Confronting the New Climate Normal”, (p15, footnote, p40)
__________, 2014b, “Financial Protection Against Natural Disasters: An Operational Framework for Disaster Risk Financing and Insurance”. Washington, DC.
World Bank, 2015a, “2014 Joint Report on Multilateral Development Banks’ Climate Finance”
__________, 2015b, “IDA's crisis response window”, IDA17 mid-term review, Washington, D.C.
World Bank, 2016a, “Shock Waves: Managing the Impacts of Climate Change on Poverty”, Washington, DC: World Bank.
__________, 2016b, “World Bank Group Engagement with Small States: Taking Stock”, World Bank Operations Policy and Country Services, August 2016.
__________, 2016c, “Building Resilience through Social Protection”, SISRI Knowledge Note No. 2. Small Island States Resilience Initiative, The World Bank and Global Facility for Disaster Reduction and Recovery (GFDRR), authors Williams, A, F. Lamanna and N. Jones.
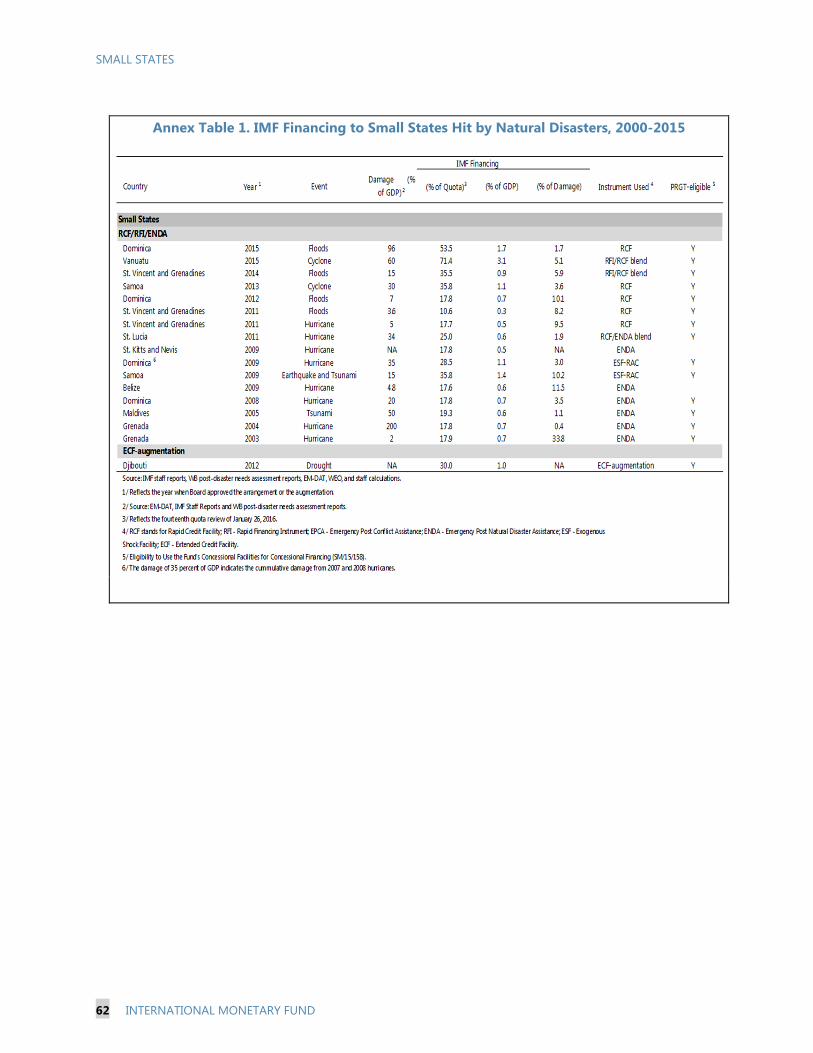
SMALL STATES
62 INTERNATIONAL MONETARY FUND
Annex Table 1. IMF Financing to Small States Hit by Natural Disasters, 2000-2015
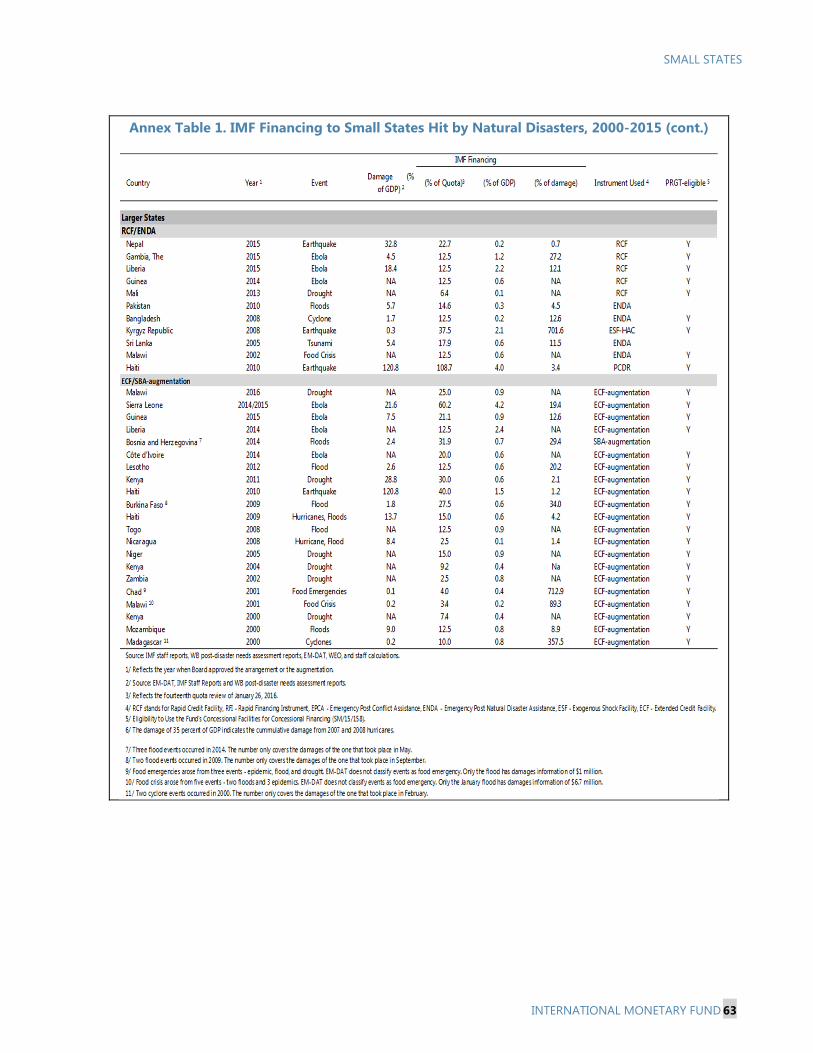
SMALL STATES
INTERNATIONAL MONETARY FUND 63
Annex Table 1. IMF Financing to Small States Hit by Natural Disasters, 2000-2015 (cont.)

SMALL STATES
64 INTERNATIONAL MONETARY FUND
Annex Table 2. IMF Financing for Natural Disasters, 2000—June 2016
Source: IMF and EM-DAT (see Annex Table 1). 1/ Includes a few cases of double-counting. Specifically, Ebola support in 2014-15 for Guinea and Liberia is included as both RCF disbursements and ECF augmentation, and support following Haiti’s 2010 earthquake is included as both ECF augmentation and under the PCDR. 2/ Includes purchases under the RCF, RFI, ENDA, Exogenous Shock Facility - Rapid Access Component, augmentations of existing ECF and SBA arrangements, and debt relief under the PCDR. 3/ Disbursements measured in percentage of current (2016) quota. 4/ Support for Djibouti following a drought in 2012; no damage estimates available. 5/ The RCF request followed Nepal’s 2015 earthquake which resulted in damage of 33 percent of GDP. 6/ The ratio of IMF financing to damage excludes one outlier (2008 Kyrgyz Republic earthquake) where disaster damages appear to be under-reported, leading to a high ratio of Fund financing relative to reported damages. 7/ Following Haiti’s 2010 earthquake, the Fund provided financing equivalent to 0.9 percent of GDP through ECF augmentation plus PCDR debt relief equivalent to 4 percent of GDP. 8/ This ratio excludes three outliers (2001 Malawi food crisis, 2001 Chad food emergencies, and 2000 Madagascar cyclone) where disaster damages appear to be under-reported, leading to a high ratio of Fund financing relative to reported damages.
Number of
Disaster Events1/
Damage (% of GDP)
IMF Financing 2/
(% of quota)3/
(% of GDP)
(% of damage)
Small states Emergency facilities (ENDA, RCF, RFI) No EM-DAT damage estimates Damage under 30% of GDP Damage 30% of GDP or higher ECF augmentation4/ Total
16 1 8 7 1 17
… 9.0
72.1 …
17.8 21.4 35.9 30.0
0.5 0.7 1.3 1.0
… 11.6 2.4 …
Larger states Emergency facilities (ENDA, RCF) No EM-DAT damage estimate Damage under 30% of GDP Damage 30% of GDP or higher 5/ ECF/SBA augmentation PCDR 7/ Total
10 3 6 1 21 1 31
…
4.3 32.8 16.7 120.8
10.5 17.9 22.7 17.8 108.7
0.5 1.1 0.2 0.9 4.0
…
13.7 6/ 0.7
6.4 8/ 3.4
SMALL STATES
INTERNATIONAL MONETARY FUND 65
Annex I. Relative Vulnerabilities of Small States to Natural Disasters and Climate Change1
Vulnerabilities to natural disasters and climate change vary across small developing states. While climate change may make natural disasters more destructive, the two risks are often quite distinct. Thus, Mauritius is more at risk from climate change than natural disasters, and vice versa for Samoa. The Fund’s engagement with small states should take these differential vulnerabilities into account, as summarized in Table 1. Based on a range of indicators, about two-thirds of small developing states are estimated to be extremely or highly vulnerable to natural disasters. About one-third of small states are similarly assessed as vulnerable to climate change within the current generation (next 30 years) based on risks calculated by the IPCC and Maplecroft.2 The specific rankings in this table are sensitive to the underlying methodologies on the definition and aggregation of risk measures. Accordingly, the rankings should be regarded as indicative, and be complemented by specific measures of the vulnerabilities of individual countries.
For climate change, country coverage of vulnerability ratings is more limited. Several countries for which ratings are not available are identified from other sources as being at high risk from sea level rise (i.e., Kiribati, Maldives, Marshall Islands, Micronesia, and Tuvalu).
1 Drafted by Mai Farid and Sebastian Acevedo, based on a background study by a team also comprising Ricardo Marto, Dan Nyberg, and Vimal Thakoor, led by Prakash Loungani. 2 Climate Change Vulnerability Index assesses the combined risk of exposure to extreme climate-related weather events and changes in major climate parameters (temperature, precipitation, sea-level), and sensitivity to exposure in life-supporting sectors of food, water, health, infrastructure, and ecosystems services. Darker red indicates more extreme vulnerability. Other indices to assess vulnerability to climate change include Center for Global Development—Quantifying Climate change, DARA Climate Vulnerability Monitor, University of Notre Dame—Global Adaptation Index (ND-Gain), World Food Programme, and the Food Insecurity and Climate Change Vulnerability.
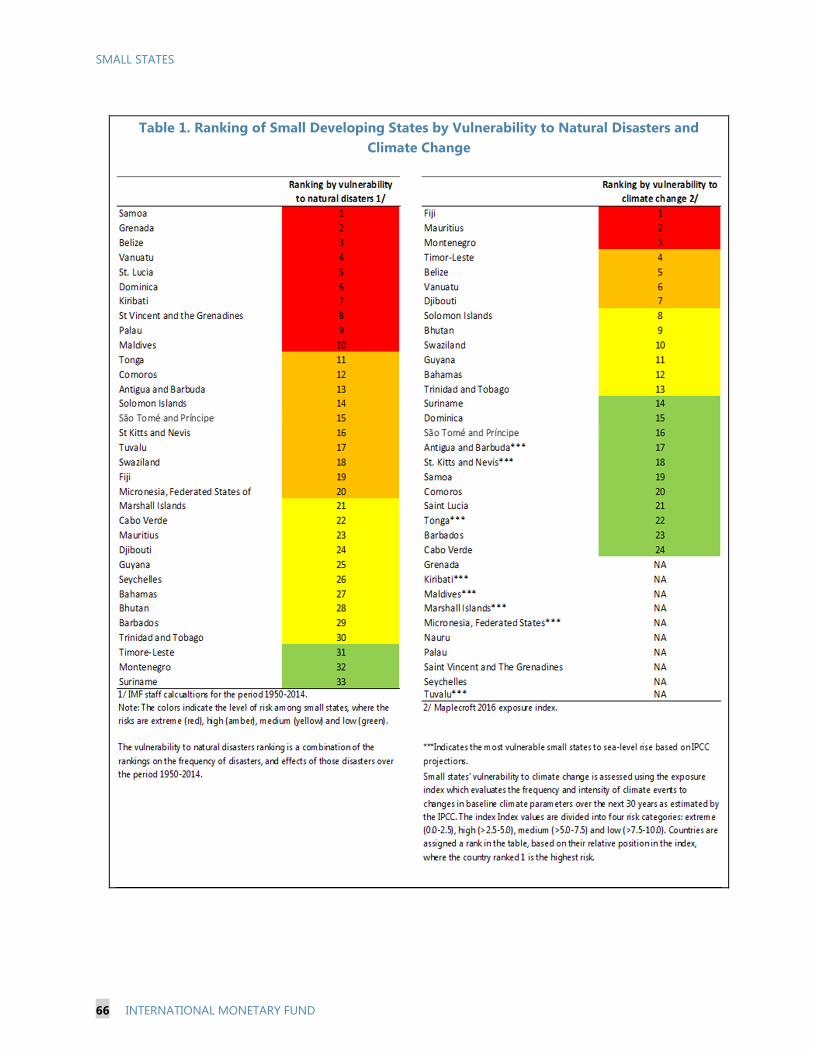
SMALL STATES
66 INTERNATIONAL MONETARY FUND
Table 1. Ranking of Small Developing States by Vulnerability to Natural Disasters and
Climate Change

SMALL STATES
INTERNATIONAL MONETARY FUND 67
Annex II. Macroeconomic Impacts of Natural Disasters
This annex explores the impact of natural disasters on small states by comparing vulnerability to natural disasters to key macro outcomes.1 The study used EM-DAT data for 1990-2014, measuring vulnerability from three dimensions: frequency of disasters; economic cost (damages as percent of GDP); and social cost (percentage of population affected). Vulnerability is compared to long-term averages for macro outcomes, with small states compared to larger countries. To ensure comparability, outliers are excluded: disasters are included only where economic and social cost data are available, where the economic cost is at most 3 percent of GDP, and where at most 8 percent of the population are affected. A few countries with large land areas and a large total number of recorded disasters are excluded (China, India, Philippines, US), as they would otherwise dominate the results.
The results confirm that disasters have an adverse impact on some key macro outcomes, with small states disproportionately impacted. More frequent exposure to disasters tends to result in long-run economic and social costs, with small states most affected. The results are strongest for GDP per capita, agricultural activity, and poverty. Specific findings are summarized below.
GDP per capita. Countries hit more frequently by disasters tend to have a lower GDP per capita, with the largest impact for small states. Where countries frequently experience disasters with a high social cost, GDP per capita also tends to be lower. The reverse is the case for economic cost—which is positively related to GDP per capita. However, the causality may run in the opposite direction here, with more advanced economies standing to lose more from disasters.
Poverty (% of population). The findings echo those above, with poverty tending to be higher for countries impacted most frequently by disasters and facing the highest social cost.
Agricultural contribution to GDP (% share). Countries more reliant on agriculture tend to face higher social costs from natural disasters, notably in the case of small states. Agriculture-based economies also tend to experience more frequent disasters, though the causality is unclear.
Tax revenue (% of GDP). Tax ratios tend to be lower for countries most frequently impacted by natural disasters and for countries where disasters have the highest economic cost.
Government consumption (% of GDP). For small states, spending tends to be highest for countries impacted most frequently by disasters and those experiencing disasters with a higher social cost.
Trade balance (% of GDP). Countries vulnerable to disasters tend to have less favorable trade balances, though this effect is found only for large countries, not small states.
1 Drafted by Mai Farid and Sebastian Acevedo, based on a background study by a team also comprising Ricardo Marto, Dan Nyberg, and Vimal Thakoor, led by Prakash Loungani.
SMALL STATES
68 INTERNATIONAL MONETARY FUND
Overall and private gross capital formation (% of GDP). Countries facing frequent and economically costly disasters tend to have lower overall and private sector capital formation, with the largest impact for small states. This may be one channel, operating through capital stocks, that influences GDP per capita and living standards.
External development assistance (% of budget financing). There is no evidence for greater access to long-term external development assistance for countries more vulnerable to disasters.
SMALL STATES
INTERNATIONAL MONETARY FUND 69
Annex III. Vanuatu: Coping with the Damages of Cyclone Pam—Policy Lessons1
The 2016 Article IV consultation with Vanuatu focused on assessing the extent of the recovery from the 2015 cyclone and drawing lessons for IMF support. Fifteen months after Cyclone Pam struck Vanuatu, the economy continues to recover from extensive damage. Reconstruction efforts have begun to yield positive results, with the reopening of damaged hotels and refurbishment of Port Vila’s international airport supporting the return of tourists to the islands. With the benefit of hindsight, this annex explores lessons for helping achieve post-disaster macroeconomic stability.
Cyclone Pam was one of the most damaging natural disasters in Vanuatu’s history. The cyclone struck Vanuatu in March 2015, causing overall damages amounting to more than 60 percent of GDP. It affected almost 72 percent of the population (more than 188,000 inhabitants). The main productive sectors were highly affected, with particular damages to tourism and transport infrastructure and production losses in agriculture and tourism. The damages exceeded that of any other natural disaster experienced in the region in recent memory.
In the aftermath of Cyclone Pam, development partners contributed significant amounts of aid-in-kind, grants, and loans. In addition to the IMF’s financial assistance under the RCF and RFI (about USD23.8 million), more than USD210 million (28 percent of GDP) was committed by bilateral and multilateral partners, with about USD72 million in grants received in 2015. Although donor responses were swift and generous (in particular from bilateral partners), financing disbursements have been slow on account of delays to the reconstruction program.
The immediate response was quite effective in alleviating human suffering and restoring economic activity, and despite substantial delays there are encouraging developments. The authorities’ and partners’ response ensured prompt access to food and shelter. The medium- to long-term recovery was more sluggish. A Recovery Committee was established in August 2015 to coordinate reconstruction efforts, but some recovery procedures proved burdensome and delayed key initiatives. Schools are still being held in tents and health centers are still partially destroyed in the most-affected islands. However, major infrastructure projects (including roads, the building of international wharfs and inter-island shipping facilities) have started and the reconstruction of social infrastructure is in the pipeline.
Vanuatu’s experience suggests several lessons:
Institutions matter. Disaster response can be delayed without institutions and contingency plans for quick and smooth disaster response. Vanuatu had established in 2013 a Ministry dealing exclusively with climate change issues, making the National Disaster Management Office (NDMO) central to coordinating preparedness and recovery initiatives. The NDMO responded adequately to the population’s basic needs
1Prepared by Ricardo Marto (RES).
SMALL STATES
70 INTERNATIONAL MONETARY FUND
following Cyclone Pam, and although the Recovery Committee was quickly established, advance attention to avoiding bureaucratic obstacles in its operations would have been useful.
Domestic buffers need to be in place. Fiscal buffers in Vanuatu were limited. The Response Fund, triggered in case of a major emergency, could provide up to 1.5 percent of the government’s budget for that fiscal year (0.3 percent of GDP), falling short of the expenses needed to restore basic services. A permanent mechanism that could help face immediate recovery concerns should be considered to expedite the response to average-size natural disasters.
External buffers need to be actionable. External buffers, including donors’ financial support, should be more predictable and partners should ensure disbursements are timely and at concessional terms. Although Vanuatu’s partners promptly committed considerable resources, disbursements have been slow. The sovereign insurance payout through the PCRFI initiative was limited, covering less than 1 percent of damages. The authorities should therefore contemplate instruments that commit pre-approved resources that can be drawn down in the event of a major disaster and ensure greater donor contributions for sovereign insurance mechanisms.
Resilient infrastructure includes better maintenance. Given Vanuatu’s high risk from natural disasters and climate change, the budget should include an explicit allocation for disaster risk reduction and climate change adaptation. In addition to investing in new infrastructures and programs, the authorities should ensure adequate funding for infrastructure maintenance.
Social safety nets should be well-targeted. While post-disaster relief programs should ideally leverage existing safety nets, this was not an option for Vanuatu. Accordingly, the government needed to resort to ad hoc interventions (temporary suspension of VAT and import duties on construction materials; deferred payment of vehicle registration fees and VAT payments; subsidies for agricultural seedlings to affected households). The National Provident Fund also allowed members to withdraw part of their retirement savings to cover expenses related to damages. While these programs provided welcome relief, they raise questions about effective targeting and the appropriate use of scarce resources.
Monetary policy can help alleviate liquidity constraints and foster the continuity of the payments system. IMF financial support helped consolidate RBV’s comfortable level of reserves, which smoothed the impact of the cyclone. RBV also provided effective liquidity support by reducing its monetary policy rate by about 340 basis points, and cutting the statutory reserve deposit requirement for commercial banks from 7 to 5 percent. Supervisory authorities should ensure banks have adequate business continuity plans. In Vanuatu, banks were able to provide enough physical currency to proceed with daily activities when banks were closed, ATM machines down, and the only mean of payment available were notes and coins. They also provided waivers on retail customers’ loan repayments for 2 to 3 months and delayed loan repayments for 6 to 12 months to some corporate customers pending an insurance payout.
SMALL STATES
INTERNATIONAL MONETARY FUND 71
Annex IV. Tailoring Macroeconomic Frameworks and Risk Analysis for Natural Disasters and Climate Change1
A. Introduction
1. This annex explores how the Fund’s macro frameworks and risk analysis should be designed to appropriately reflect the impact of natural disasters and climate change on small states’ economies. It identifies macro-financial frameworks and risk analysis approaches that can be used when developing policy recommendations for managing natural disasters and climate change.
2. The next section provides general guidance on integrating natural disasters into macro frameworks and risk analysis. It outlines approaches for disaster risk analysis. Subsequent sections cover the practicalities of this work in more detail, discuss existing approaches, and provide recommendations for future good practice techniques. In many cases, country teams are already adopting many of these proposals, and the intention is to define options and establish norms to help ensure consistently strong analysis.
3. Fund analysis should focus on countries for which natural disasters are projected to have a significant macro-financial impact. These countries are typically, though not exclusively, small states. The earlier discussion of relative natural disaster risks across small states (paragraph 11 of the main paper and Annex I) can help guide decisions on whether to include these risks in Fund analysis. Approaches should be flexible, based on country interest and staff’s assessment of risks and policy priorities.
B. Data sources and Reporting of Assumptions
4. Analysis starts with the potential size, frequency, and transmission channels of disasters. A first source is provided by EM-DAT data which can be used to identify the timing of past disasters for a given country as well as their economic and social impact. One downside of this database is the limited coverage of economic losses. In addition, it does not measure the impact of disasters on GDP, budgets, or the balance of payments, and ignores the dynamic pattern of the economic impact. Accordingly, staff should also draw on country-level data on economic developments at the time of past disasters. Careful examination of movements in the national accounts, fiscal accounts, and balance of payments may help identify the size and transmission channels for past disasters.2 Staff can further strengthen their assessment through discussions with government officials, business leaders, and the relevant experts and other stakeholders.
1 Prepared by a team comprising Ms. Gold (WHD) and Messrs. Allum (SPR), Atolia (RES), Cihak (MCM), Ding (APD), Geiregat (FIN), Guerson (WHD), Mooney (FIN), and Takizawa (SPR). 2 The main paper highlighted some of the key transmission channels. Care is needed to allow for lagged effects: for example, GDP growth could fall at the time of the disaster but rise above trend as reconstruction projects are implemented.
SMALL STATES
72 INTERNATIONAL MONETARY FUND
5. In some cases, perspectives can be gained from the World Bank’s Post-Disaster Needs Assessments (PDNAs). For a limited number of disasters, the Bank has compiled detailed estimates of physical damage and production losses.3 While PDNA estimates of production losses may be a starting point for analyzing the GDP impact of disasters, there is no one-to-one relationship between estimated production losses and measured GDP.4 This may be because the PDNA includes non-marketed production excluded from measured GDP (as cited in the case of Vanuatu) or because the production losses are measured before taking into account the positive offsetting effects from post-disaster reconstruction activities in the public and private sectors. Physical damage estimates may be useful for purposes of general equilibrium modeling of destruction to the capital stock, but do not typically feature in Fund macro-frameworks given the general absence of balance sheet data.5
6. The assumptions underpinning disaster risk analysis should be transparently documented. Where Fund documents include an analysis of natural disaster risks, the relevant assumptions on size and frequency of disasters, macro impact, and policy responses should be detailed. This would represent an improvement in regard to current practices (Box 1). Where staff has developed a dynamic model of the impact of natural disasters for scenario purposes, this could also be documented (see example in Annex Table 1).
C. Developing Macroeconomic Baselines
7. This section addresses how to develop medium- to long-term macroeconomic baselines for assessing economic sustainability. Vulnerability to disasters can accumulate over many years and through a series of disasters, as fiscal shocks lead to higher borrowing and as infrastructures damage saps private investment and growth. Economic performance for these countries may be episodic. For a number of years, trends may look favorable as post-disaster recovery buoys growth and budget outcomes; but then a new disaster marks a period of much less favorable outcomes. For such countries, it is important that long-term projections be based not just on the more favorable outlook in non-disaster years, but also factor in the down-cycles that come with disasters, as well as any benefits from investing in resilience to disasters. For projections such as those used for the LIC DSA that can cover a period as long as 20 years, these adjustments to reflect potential disaster effects are critical.
3 This work is conducted through the World Bank-managed Global facility for Disaster reduction and Recovery (GFDRR). 4 Thus, in Vanuatu’s 2015 cyclone, production losses were estimated in the PDNA at 24 percent of GDP, while Fund staff estimated that measured GDP growth in 2015 would be reduced by only 5½ percent of GDP as a result of the cyclone. Similarly, the PDNA for Samoa estimated production losses at over 12 percent of GDP, while the staff report requesting RCF financing estimated the GDP impact at 1.1 percent of GDP. 5 For modeling and other purposes, a distinction should be made between damage to productive capital assets and damage to social assets (e.g., housing).
SMALL STATES
INTERNATIONAL MONETARY FUND 73
Box 1. Past Practice in Analyzing Natural Disaster Risks
A survey of recent IMF country reports for small states has been conducted with a view to assessing the treatment of natural disaster risks in macro frameworks and risk analysis. A large number of country reports cover the impact of actual disaster events. Discussions typically focus on overall damage, lost production, and consequences for the budget. The latter include lost revenues, outlays on post-disaster relief and reconstruction, and budget financing. Risk analysis is sometimes provided for countries subject to frequent disasters. In these cases, country reports sometimes include a discussion of forward-looking disaster risks and the appropriate policy response. Macro-financial baselines do not explicitly reflect the long-term impact of periodic natural disasters. Country reports are not typically explicit about whether or how the macro-financial impacts of future natural disasters are reflected in medium- and long-term macro projections, such as those prepared for the LIC DSA. In general, teams do not appear to systematically consider disaster impacts when making baseline projections, with a few noteworthy exceptions.6 There is also no standard practice for modeling or reporting risks associated with natural disasters. In many cases, a qualitative discussion is presented in the Risk Assessment Matrix (RAM). In other cases, quantitative disaster scenarios are explored, either in the staff report, or more often in the DSA. Country reports are generally opaque as to how prospective natural disaster risks would impact the economy, and what policies are in place to address such risks. The degree of detail in these areas varies significantly, even for neighboring countries within the same area department. Disaster risks are most comprehensively analyzed for small states in the Caribbean and Pacific. This country group is subject to the most frequent and destructive hurricanes/cyclones. Outside these regions, country reports typically cover the impact of ongoing disasters (such as drought in sub-Saharan Africa) with less emphasis on the potential impact of future disasters. This may reflect the lower macro criticality of natural disasters for larger, more diversified economies.
8. A number of approaches can be adopted for building realistic long-term macro baselines. In general, these seek to “look through the cycle”, adopting projections for key variables that are realistic long-term averages, taking disaster and non-disaster years together. The resulting baseline will tend to be smooth, rather than including periodic disaster-related disturbances. However, by adjusting average growth downwards (say) to allow for the future impact of disasters, the level of GDP would be the same at the end of the smooth baseline as it would be under a stochastic alternative. Moreover, this approach helps separate analysis of long-term policy sustainability from questions of the adequacy of policy buffers in the presence of shocks (the second issue being covered in detail later in this annex).
9. In some cases, variables can be projected based on long-term historic averages. Where disasters are relatively common, a long average of past performance (e.g., 20 years) could capture the
6 For example, recent reports for Dominica and St. Kitts and Nevis.
SMALL STATES
74 INTERNATIONAL MONETARY FUND
impact of disasters. For example, growth projections could be based on a long-term historic average, rather than the more recent average for non-disaster years.7 This approach represents a relatively straightforward and transparent way to include natural disaster effects in the baseline. It has the drawback, however, of not explicitly distinguishing between underlying (non-disaster) performance and the separate impact of natural disasters. In addition, it does not take into account potential structural factors that, for some countries, may make past averages not representative of future prospects. Thus, this approach is unlikely to be useful for projecting revenue- and expenditure-GDP ratios, which are subject to important structural shifts. For such variables, other approaches will be needed, as discussed below.
10. A second approach is to adjust non-disaster projections using the estimated or modeled impact of disasters. A starting point would be to identify the likely path of an economic variable in the absence of disasters. For example, a projection for the public expenditure-GDP ratio could be based on recent outcomes in non-disaster years, taking into account policies likely to impact on future spending. This projection would then be adjusted to include the annual average impact of prospective disasters. The adjustment could vary in sophistication, and in principle could take into account: (a) the anticipated frequency of disasters; (b) their likely magnitude; (c) the impact of disasters on the macro variable in question; and (d) the expected policy response. For example, if past disasters have occurred, on average, once every 10 years, this implies a 0.1 probability of a future disaster in any given year. In this case, the baseline for a given variable could be adjusted by the product of this probability and impact of an average disaster.8
11. Where data are of poor quality, other approaches may be needed to identify disaster effects. For some small states, EM-DAT may not provide country coverage and national data sources may be unreliable for purposes of identifying national disaster effects. A mix of approaches can be adopted in such cases. Using long run historical trends may capture average disaster effects. And approximate estimates of the impact of disasters might be derived using a “synthetic control” approach from comparisons with peer countries that are similar, except with respect to exposure to disasters. Under this approach, outcomes for a particular variable (e.g., growth) in a disaster-prone country are compared to those for a control group of countries with similar characteristics other than exposure to natural disasters.9 The resulting difference can be attributed to the impact of natural disasters and can be used for purposes of constructing the macro baseline. It should be recognized, however, that estimates are subject to a margin of error, reflecting the difficulty of identifying counterpart countries that differ only on account of disaster vulnerability.
7 This approach was adopted for projecting underlying GDP growth in the St. Kitts and Nevis staff report since past trends were viewed as a good indicator of future growth in the absence of evident structural breaks. For this report, revenues and expenditures and other key macro variables were appropriately based on recent performance and policies, rather than past averages. 8 To allow for the dynamics of disaster responses, the impact should be calculated on a cumulative multi-year basis. Thus, if the average disaster worsens the overall fiscal balance by 2 percentage point in the immediate year and by 1 percentage point in each of the following two years, the cumulative impact of 4 percentage points would be used with the disaster probability (0.1 in this example), to produce a natural disaster fiscal adjustment factor of 0.4 percentage points. 9 This approach was adopted in the 2015 Samoa staff report.
SMALL STATES
INTERNATIONAL MONETARY FUND 75
12. Adjustments should, in principle, include “second round effects”, as the public and private sectors adjust to the impact of disasters. Macro baselines should not only reflect the first-round impact of natural disasters but also seek to include the most important reactions by governments, households, and corporations. For example, governments may undertake fiscal adjustment to offset part of the costs of a natural disaster or may gain access to new grant financing to pay for disaster recovery. These policy reactions should be included only where there are good reasons to expect that such measures would be adopted—based on past practices or an established policy framework. There should be no presumption that policy reactions will fully address the costs of natural disaster, ensuring sustainability of the adjusted macro baseline.10
13. Adjustments to macro baselines should ideally allow the fiscal impact of disasters to be separately identified. Fiscal projections could be adjusted in two ways: either by adjusting budget lines individually (revenues adjusted downwards, public expenditure and grant receipts adjusted upwards), or by introducing a new line into the fiscal accounts showing the net impact of disasters. This could be shown above-the-line, after the unadjusted overall balance including grants. In general, the second approach (showing a “net disaster impact” line) is recommended for presentational clarity.11 Because detailed analysis is less important for the presentation of the balance of payments, disaster effects could be integrated into variables separately (exports, grant inflows, etc.) rather than by introducing a separate line item for disaster impacts.
14. Care is needed that disaster adjustments do not complicate near-term policy discussions. For the current year and possibly one year ahead, baseline macroeconomic projections could be “clean”, excluding any adjustment for natural disaster impacts. This would allow staff reports to show macro projections aligned to the authorities’ growth assumptions, planned budgets, etc. This could result in some variables “deteriorating” between the clean baseline (years 0-1) and the baseline including annual average disaster effects (years 2 and beyond). The basis for any such shift would need to be explained in the country report.12 Staff should also be clear in discussions that this presentational approach does not imply a view that there is a lower probability of a natural disaster in the near term, or a corresponding lower need for contingency planning.
15. Where countries invest to become more resilient to natural disasters, this should be reflected in long-term macro frameworks. The beneficial impact can be recognized by reducing the negative disaster adjustments in the outer years of the macro framework. A key question is the return on investments, and how much is captured by the public sector. For example, do debt-financed investments in resilience-building generate sufficient additional future fiscal savings and growth-related tax collections to be self-financing? Or do taxes need to rise in parallel to ensure fiscal sustainability? To lay the foundations for this analysis, teams should be cautious in projecting future savings from resilience-
10 The significant historic debt accumulation by several Caribbean countries at high risk of natural disasters suggests that policy reactions have not fully offset disaster costs in the past. 11 This could be labeled, for example, as the “disaster cost contingency spending”. This approach was adopted in the Dominica report [provide references]. 12 This shift in the presentation is another reason why showing a net disaster impact line in the fiscal accounts would help presentational clarity.
SMALL STATES
76 INTERNATIONAL MONETARY FUND
building investments. Where possible, independent evidence of the likely rate of return on such investments would be valuable.
D. Constructing Alternative Shocks Scenarios
16. This section discusses how to prepare alternative scenarios to model risks around the baseline. While a disaster-adjusted baseline helps to assess long-term policy sustainability, risks to the baseline are important when considering the appropriate size of fiscal and external buffers. Even where policies are sustainable based on the annual average impact of disasters, fiscal and external buffers may be inadequate to weather the impact of a natural disaster. These risks and the corresponding need for contingency plans can be assessed using an alternative scenario or stress test that models a single large disaster event. For example, debt sustainability analysis (DSAs) should typically include an alternative scenario featuring an appropriately scaled disaster event. Discussions of reserve adequacy in the context of the external sector assessment (ESA) should also look at potential reserve drains arising from disasters. Such risk analysis should be standard practice for all DSAs and ESAs for countries at high risk of natural disasters, and would help inform Risk Assessment Matrices (RAMs) for these countries.
17. The alternative scenarios would chart the dynamic response to a large shock. A standard scenario would involve an “average” disaster, while tail risks could be explored by modelling the sort of disaster that might occur once every 50 or 100 years.13 The scenario would trace the immediate and subsequent response of key macro variables, typically spanning several years of post-disaster reconstruction. This type of alternative scenario has already been used by some country teams, and implications for debt can easily be studied using the LIC DSA toolkit.
18. Stochastic simulation offers an alternative, more sophisticated approach to exploring risks. This approach—for example using Monte Carlo experiments—could be run drawing random shocks calibrated to the statistical distribution of historical natural disasters, measured by size and frequency. Under each simulation, the randomly-produced shocks would impact on key macro variables according to the estimated dynamic pass-through relationship. This will produce a probabilistic distribution of the main economic variables required to assess fiscal and debt sustainability incorporating the risks from natural disasters. It could be used, for example, to inform policy decisions on the amount of savings required to reliably achieve fiscal sustainability in scenarios consistent with the recurrent occurrence of natural disasters. It could also be used to assess the adequacy of buffers or contingency plans. Thus, for example, scenario outcomes could be used to calculate the probability that disaster-related public spending would exceed a particular level in a given year (or group of years). Similar results could be developed for other variables (growth, external balance, etc.).14
13 Since individual country data are not available to clearly define the scale of “a once in 50 years” disaster, these estimates would typically be informed by data across a range of countries and periods. 14 The Monte Carlo approach has been used in an innovative manner in the case of Dominica, tailored to the specific circumstances following a somewhat different approach than that described above.
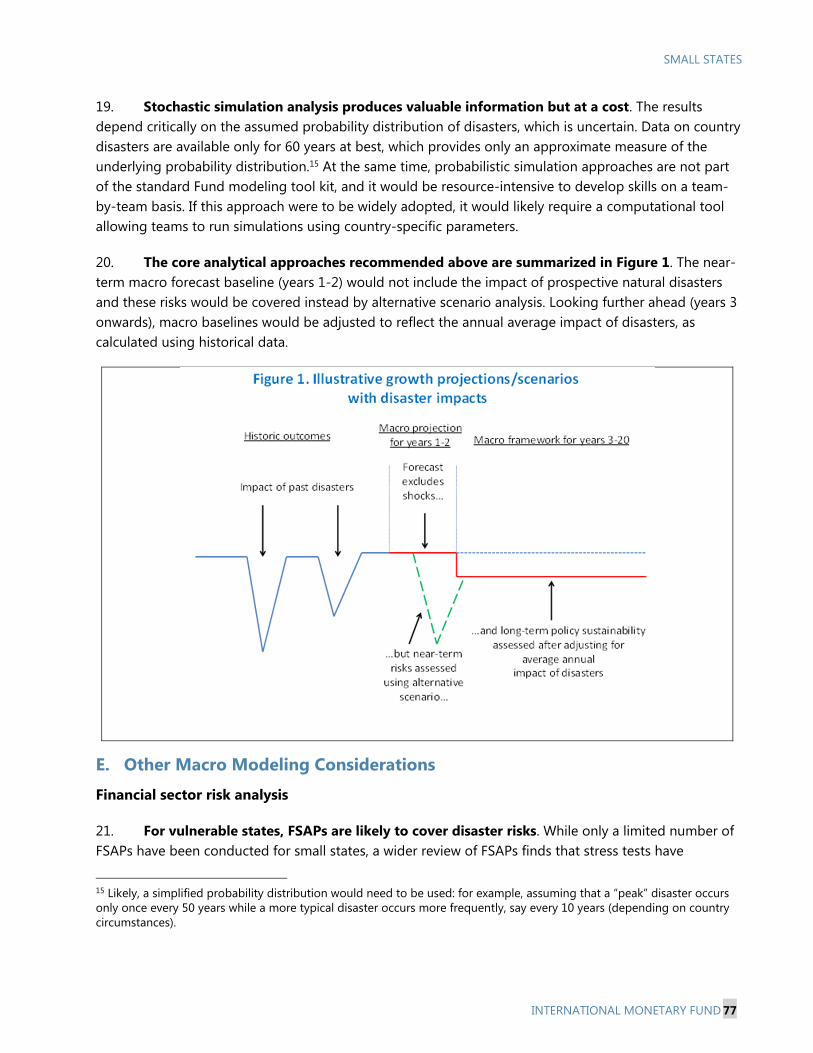
SMALL STATES
INTERNATIONAL MONETARY FUND 77
19. Stochastic simulation analysis produces valuable information but at a cost. The results depend critically on the assumed probability distribution of disasters, which is uncertain. Data on country disasters are available only for 60 years at best, which provides only an approximate measure of the underlying probability distribution.15 At the same time, probabilistic simulation approaches are not part of the standard Fund modeling tool kit, and it would be resource-intensive to develop skills on a team-by-team basis. If this approach were to be widely adopted, it would likely require a computational tool allowing teams to run simulations using country-specific parameters.
20. The core analytical approaches recommended above are summarized in Figure 1. The near-term macro forecast baseline (years 1-2) would not include the impact of prospective natural disasters and these risks would be covered instead by alternative scenario analysis. Looking further ahead (years 3 onwards), macro baselines would be adjusted to reflect the annual average impact of disasters, as calculated using historical data.
E. Other Macro Modeling Considerations
Financial sector risk analysis
21. For vulnerable states, FSAPs are likely to cover disaster risks. While only a limited number of FSAPs have been conducted for small states, a wider review of FSAPs finds that stress tests have
15 Likely, a simplified probability distribution would need to be used: for example, assuming that a “peak” disaster occurs only once every 50 years while a more typical disaster occurs more frequently, say every 10 years (depending on country circumstances).
SMALL STATES
78 INTERNATIONAL MONETARY FUND
sometimes sought to identify the financial risks associated with natural disasters. Recent FSAP reports commonly refer to natural disaster risks, and stress tests for the insurance sector often consider the projected impact of sizeable disaster events.16 Modeling disaster shocks is less straightforward for the banking sector, where the possibility of disasters is associated with operational risk. To assess the latter, consideration would need to be given to the impact of natural disasters on different elements of banks’ income statements. This is a complex task in practice, and disaster risks are instead typically assessed from the perspective of solvency, tracing a causal link running from disasters to lower GDP to decline in asset quality. Following this approach, the 2015 Samoa FSAP based two stress tests on a category 4 tropical cyclone, modeling the damage on physical property and production, with consequences for bank solvency.
22. Macro-financial linkages should also be considered. In principle, savings in the banking system provide an important buffer for the private sector to weather disasters. The quality of bank assets could suffer a serious blow if the natural disaster impacts their clients. For example, crop destruction may make it difficult for farmers to repay agricultural credits, leading to an increase in non-performing loans. Severe disasters may also undermine the normal functioning of the financial system in the short run, acting to delay the recovery process.17
Reserve adequacy
23. External sector assessments should take into account buffers needed to cope with vulnerability to natural disasters. As noted earlier, the balance of payments would typically deteriorate following a natural disaster reflecting lost exports and additional import needs, and its financing would rely on remittances, external grants and borrowing, and possible reserve drawdowns. To the extent that financing is not readily available at reasonable cost, countries vulnerable to natural disasters may need to build higher external buffers.
24. The Fund’s existing reserve adequacy assessment tools can be tailored to countries prone to natural disasters. Of the Excel-based templates available for assessing reserve adequacy (ARA), the ARA-CC methodology for credit-constrained economies is likely to be the most relevant to small developing states. The guidance note discusses how the tool and approach can take into account country-specific risk and other factors which are also relevant to natural disasters.18 These include: (i) expected shocks (e.g., future disasters); (ii) structural changes (e.g., investing in resilience); (iii) alternative scenarios (e.g., a natural disaster in the next year); and (iv) risk aversion (e.g., precautionary incentives because of higher vulnerability to natural disasters).
16 For example, in the Portugal FSAP, the impact was considered of an earthquake equivalent to that in 1755, and in the France FSAP, the impact was considered of a similar storm to that in 1999. The recent United States FSAP considered the effects of hurricanes, earthquakes, and tornadoes, in combination with adverse macro scenarios. 17 The staff report for Vanuatu’s 2015 Article IV and RCF/RFI requests was exemplary in discussing financial linkages and policy reactions to Cyclone Pam. In this case, commercial banks allowed for voluntary suspension of debt service over 2-3 months, and an emergency borrowing facility (along with other liquidity measures) was activated by the central bank. 18 See IMF (2016b) and additional background and analysis in Mwase (2012).
SMALL STATES
INTERNATIONAL MONETARY FUND 79
F. General Equilibrium Modeling
25. Teams looking to explore the general equilibrium impact of natural disasters could do so using the Debt, Investment, and Growth (DIG) model. This would allow teams to provide policy advice based on a coherent framework. The impact of natural disasters could be introduced into the DIG model in three ways. First, the disaster can be assumed to wipe out a part of the current output and second, destroy a portion of the existing productive capital, constraining production until these assets are replaced through new investments. Disasters can also be viewed as having a third, temporary impact on the productivity of capital while business activities are disrupted by the after-effects of the disaster.
26. The DIG model can be used to explore the adjustment path following a disaster. Using different parametric assumptions, this model can explore how rapidly the public and private sectors can rebuild lost productive capacity, the impact of policy responses, the importance of access to credit or insurance, and the importance of labor and product market flexibility for post-disaster recovery. Further discussion and illustrative charts are provided in Annex IV.
27. There are, however, constraints to the existing DIG model. For example, disaster-prone countries are distinct in having a more uncertain investment environment. Investors will seek a higher rate of return to compensate for risks to capital. This distinction relative to non-disaster prone countries is not currently a feature of the DIG model.
G. Climate Change
28. Over the coming 50 years, climate change is expected to have major macroeconomic consequences. Rising sea levels, desertification, and excessive heat levels are just some of the changes that will affect current patterns of production and employment, even after costly outlays on adaptation. The challenge for the Fund is how to integrate these changes into standard long-term macro baselines for assessing policy sustainability. One problem is the high degree of uncertainty about the path of climate change and how this will influence economic activity in countries. A further consideration is that climate change will build up only gradually, and the macro impact may only start to be significant toward the end, or even beyond the standard 20-year period adopted for long-term baseline analysis.
29. Given these considerations, the primary focus of the Fund’s near-term risk analysis is likely to be on natural disasters, rather than climate change. While climate change is anticipated to contribute, over time, to larger and more destructive natural disasters, this trend is not sufficiently well-defined as to allow macro baselines to be developed with a gradation of disaster effects, rising over time. Instead, risks analysis using alternative scenarios that model peak disaster events (one-in-a-century disasters, say) can be used as a proxy for the risks that could emerge with climate change.
30. For the near term, adjustments to macro baselines are most relevant for adjustment and mitigation investments. Countries may be undertaking or considering public outlays that would either mitigate carbon emissions (e.g., by shifting to renewable energy sources) or that would help the country adjust to the effects of climate change (e.g., by investing in infrastructures that are resilient to rising sea levels or to more frequent droughts). These investments may be launched, in many cases, within the
SMALL STATES
80 INTERNATIONAL MONETARY FUND
period covered by Fund macro baselines, and could be significant in scale. Thus, in developing fiscal baselines, teams should ensure that consideration is given to the level of public spending and whether this adequately reflects likely outlays relating to climate change. While some substitution may be possible within public investment programs to cover climate change needs, in many cases it will require a higher overall level of spending. Where country authorities have not yet considered the impact of climate change on fiscal and debt sustainability, the Fund’s analysis of potentially necessary climate change-related investments would be an important contribution to macro surveillance. In this work, teams will need to seek independent information on likely costs and recognize the associated uncertainties.
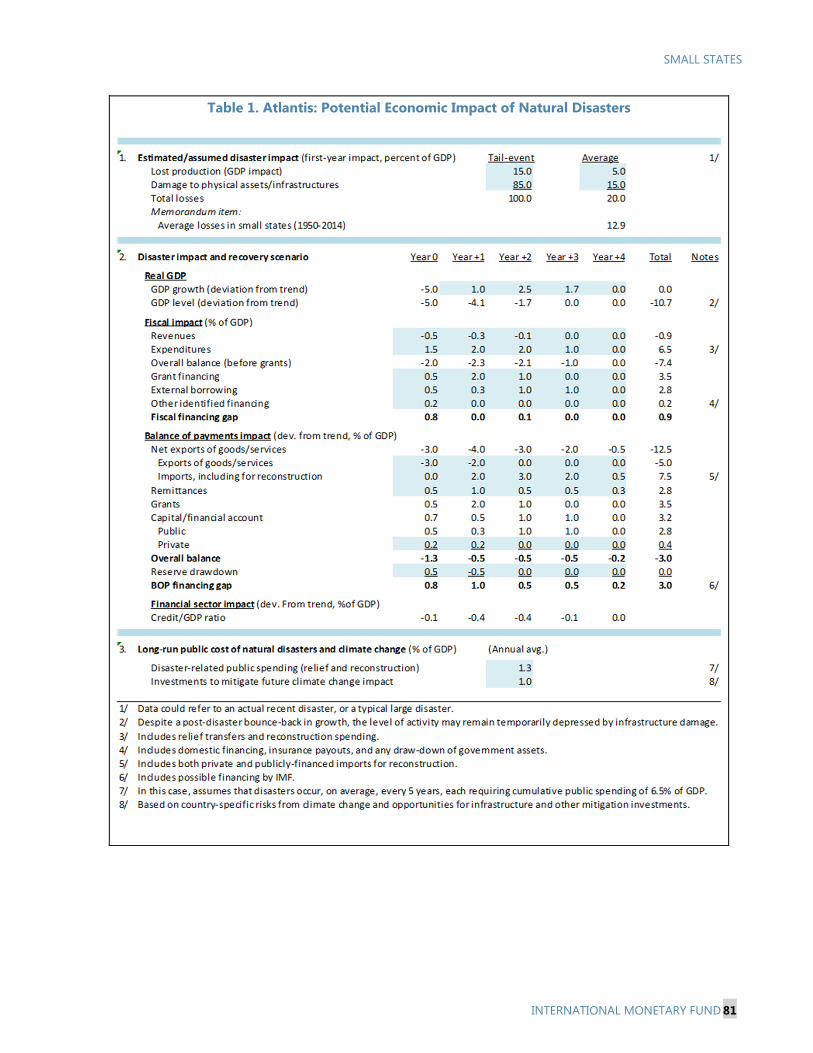
SMALL STATES
INTERNATIONAL MONETARY FUND 81
Table 1. Atlantis: Potential Economic Impact of Natural Disasters
SMALL STATES
82 INTERNATIONAL MONETARY FUND
Annex V. Exploring the Use of Model-Based Approaches to Assess the Economic Impact of Natural Disasters1
Introduction This annex assesses the feasibility and the value of model-based approaches for assessing the economic impact of natural disasters in a typical low-income developing country. The focus is on the Debt, Investment, and Growth (DIG) model of RES and SPR, and its variants. The annex describes the merits of a model-based approach; summarizes the DIG model and its recent use in country analysis; outlines how a natural disaster can be modeled in the DIG framework; and provides an example of how the model could be applied to a stylized low-income developing country. The annex concludes by providing examples of policy questions relating to natural disasters that the DIG framework could address. The model-based approach explored here provides a coherent framework for a consistent and more informed policy analysis. This advantage of model-based approach in policy analysis is the result of (1) incorporating in the model, in a systematic matter, reasonable economic behavior (such as, quantity demanded goes down when price goes up) and the constraints on economic choices (the budget constraints); (2) making explicit the relationship between underlying assumptions and the resulting outcomes; and (3) moreover, considering the costs and benefits of policy choices, the policy trade-offs, in an internally consistent manner, in particular, taking into account inter-temporal dimension through appropriate discounting. Using the DIG and DIGNAR models Fund staff developed a model-based framework to analyze the effects of public investment scaling-up on growth and debt sustainability. The DIG model, developed in Buffie et al. (2012), is a dynamic low-income developing country (LIDC)-specific open-economy model that incorporates the nexus between public investment and growth, different financing strategies (external concessional, external commercial, and domestic), and fiscal reaction rules. It also captures high rates of return on public capital as well as significant inefficiencies in public investment and absorptive capacity constraints, which are pervasive in LIDCs. The link between public investment and growth in the model arises from the fact that the outputs of the two production sectors producing traded and non-traded good depend not only labor and private capital used, but also on the stock of public infrastructure, as it determines the productivity of the production process. The model has been widely used for analyzing the macroeconomy and informing the policy discussion with authorities in LIDCs. Fund staff have applied the model and extensions to 14 countries and a custom and economic union in the context of Article IV consultations, program reviews, and donor meetings (Afghanistan, Benin, Burkina Faso, Cabo Verde, CEMAC, Cote d’Ivoire, Ethiopia, Ghana, Lesotho,
1 This annex was prepared by Manoj Atolia (RES).
SMALL STATES
INTERNATIONAL MONETARY FUND 83
Liberia, Rwanda, Senegal, Togo, and Yemen). This work has complemented the IMF-World Bank DSF by helping country teams and authorities assess the growth, debt, and fiscal implications of ambitious, front-loaded infrastructure investment plans contained in national development plans or PRSPs. These plans are not fully funded by aid, resulting in a financing gap that could be covered by fiscal adjustment, external commercial or domestic borrowing. Extensions of the model have analyzed the implications of investing not only in infrastructure, but also in energy (e.g., Ethiopia and Senegal) or security (e.g. Afghanistan). On-going applications include Cambodia, Maldives, Nigeria and Sri Lanka. These applications have formed the basis of policy dialogue with authorities regarding the trade-offs of different financing strategies, as well as the role of key structural characteristics for growth and debt sustainability effects of public investment. The DIG model’s framework is quite flexible and has been extended by Fund staff to incorporate special features of natural resource-rich developing countries. This extended model, termed the Debt, public Investment, Growth and Natural Resources model (DIGNAR), was developed in Melina et al. (2014). It has been used to assess the macroeconomic implications of investment surges, including for debt sustainability. The DIGNAR model has been applied to 12 countries in Article IV consultations and TA missions (Angola, Côte d’Ivoire, Chad, Guinea, Kazakhstan, Liberia, Mauritania, Mongolia, Mozambique, Myanmar, Niger, and Sierra Leone). On-going applications include Botswana and Iran. The analysis underscored the role of the volatility of resource prices, the uncertainty of resource output, and the exhaustibility of resource reserves in strategies to avoid excessive and unsustainable borrowing. A sustainable investing approach that combined a gradual investment scaling-up with a resource fund—a fiscal buffer mechanism that saves additional resource revenues in boom times and can be drawn down to support investment spending during low resource revenues—could help protect the economy from boom-bust cycles and therefore support macroeconomic stability—e.g., Angola. Extending the DIG approach to natural disasters The DIG model’s framework can be used to assess the economic impact of natural disasters and evaluate the policy responses to these disasters. For the purpose of the analysis of natural disasters, it would be necessary to capture in this framework at least three important (negative) effects of these disasters. First is the loss of current output. Second is the loss of productive assets. Third is the disruptions in the functioning of the critical infrastructure that reduce the productivity of the remaining, surviving assets. These effects of a natural disaster can be modeled in a DIG model in a very natural way as a loss of current output, a (permanent) loss of public and private capital, and a (temporary) decline of productivity. As demonstrated by this modeling strategy, the current models are flexible enough to partly address some of the questions related to the impact of and policy responses to natural disasters. These current breed of models, however, may not be able to fully address all the implications of the natural disasters. The reason is that recurrent and severe natural disasters not only affect economic decisions due to repeated dislocation of productive activity, but, more importantly, they are also likely to create tremendous uncertainty about the outcomes of the economic activity. A proper analysis of these adverse effects of frequent natural disasters, thus, may require a stochastic model which explicitly takes
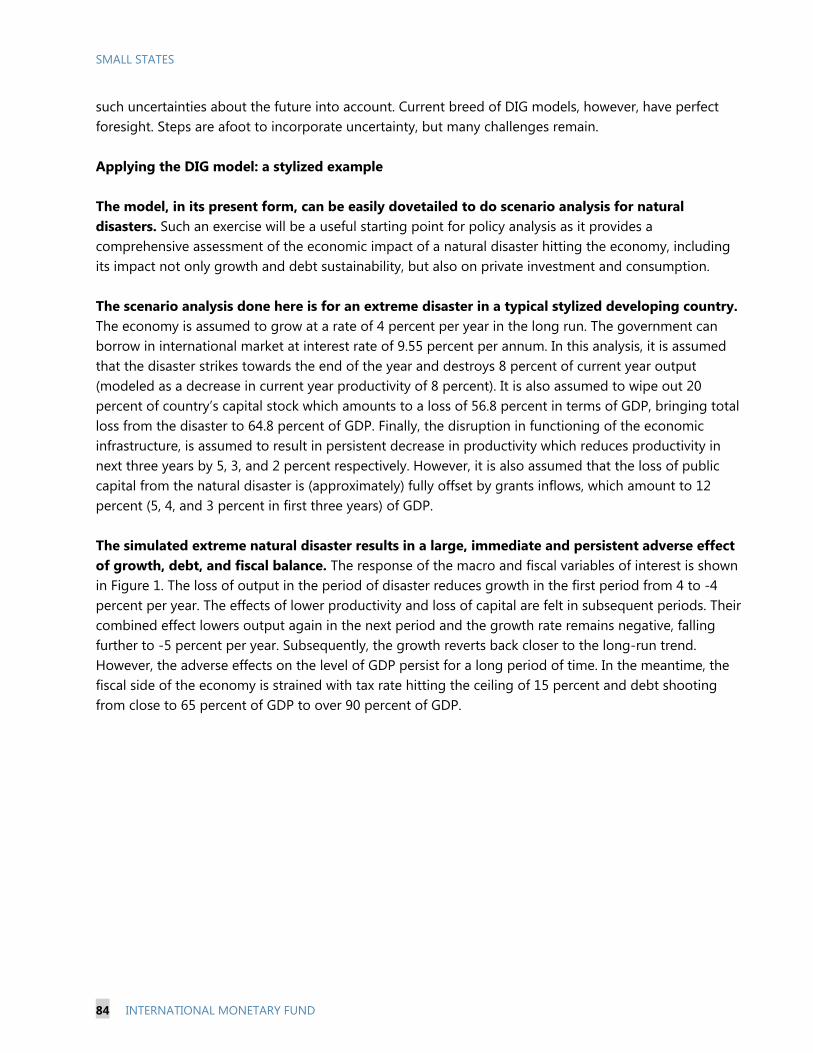
SMALL STATES
84 INTERNATIONAL MONETARY FUND
such uncertainties about the future into account. Current breed of DIG models, however, have perfect foresight. Steps are afoot to incorporate uncertainty, but many challenges remain. Applying the DIG model: a stylized example The model, in its present form, can be easily dovetailed to do scenario analysis for natural disasters. Such an exercise will be a useful starting point for policy analysis as it provides a comprehensive assessment of the economic impact of a natural disaster hitting the economy, including its impact not only growth and debt sustainability, but also on private investment and consumption. The scenario analysis done here is for an extreme disaster in a typical stylized developing country. The economy is assumed to grow at a rate of 4 percent per year in the long run. The government can borrow in international market at interest rate of 9.55 percent per annum. In this analysis, it is assumed that the disaster strikes towards the end of the year and destroys 8 percent of current year output (modeled as a decrease in current year productivity of 8 percent). It is also assumed to wipe out 20 percent of country’s capital stock which amounts to a loss of 56.8 percent in terms of GDP, bringing total loss from the disaster to 64.8 percent of GDP. Finally, the disruption in functioning of the economic infrastructure, is assumed to result in persistent decrease in productivity which reduces productivity in next three years by 5, 3, and 2 percent respectively. However, it is also assumed that the loss of public capital from the natural disaster is (approximately) fully offset by grants inflows, which amount to 12 percent (5, 4, and 3 percent in first three years) of GDP. The simulated extreme natural disaster results in a large, immediate and persistent adverse effect of growth, debt, and fiscal balance. The response of the macro and fiscal variables of interest is shown in Figure 1. The loss of output in the period of disaster reduces growth in the first period from 4 to -4 percent per year. The effects of lower productivity and loss of capital are felt in subsequent periods. Their combined effect lowers output again in the next period and the growth rate remains negative, falling further to -5 percent per year. Subsequently, the growth reverts back closer to the long-run trend. However, the adverse effects on the level of GDP persist for a long period of time. In the meantime, the fiscal side of the economy is strained with tax rate hitting the ceiling of 15 percent and debt shooting from close to 65 percent of GDP to over 90 percent of GDP.
SMALL STATES
INTERNATIONAL MONETARY FUND 85
Annex Figure 1. Response of Macro and Fiscal Variables to a Severe Natural Disaster
Potential extensions and applications of the DIG framework to natural disasters The following list provides some examples of other questions which existing model(s) could modified to address to some extent:
The model can be used to address the cost and benefits of building ex ante resilience against natural disasters. Building resilience would require an initial investment, but would reduce the losses from future disasters. This trade-off can be analyzed in the model by feeding into the model the effectiveness of the investment in resilience-building in reducing the economic impact of the future disasters.
The model can be used to study and compare various financial and insurance policies to mitigate the economic impact of natural disasters. For example, the model may be usefully employed to study various tradeoffs between carrying the risk of disasters versus off-loading it in financial markets through various options such as insurance with a broad coverage or just a catastrophic one. The model incorporates a very elaborate setup for the government and thus can be used to study various policy tradeoffs, for example, between paying-when-disaster-strikes and self-insurance, e.g., through fiscal and foreign exchange buffers, built up during good times to draw down during the times of a natural disaster.
SMALL STATES
86 INTERNATIONAL MONETARY FUND
Moreover, it can be put to use to understand the best way of organizing and financing post-disaster reconstruction. During post-disaster times, many regular development activities are suspended and effort is directed towards reconstruction. In addition, government may borrow and/or increase taxes to raise additional resources for reconstruction. The growth and macroeconomic impact of such, alternative policies can be assessed in these models.
The effect of natural disasters on investment and FDI can be analyzed as well. Natural disasters affect investment by lowering the return on such investment. The model can be employed to address this issue. However, the other very important channel through which such disasters may dissuade investors is the uncertainty that they generate. A proper analysis of these adverse effects of frequent natural disasters on investment would require a stochastic model.
There are other questions that the model may find hard to address or require extending it in significant ways. For example, consider the effect of natural disasters on sustained, long-run growth. The determinants of long-run growth are not well understood. Lack of investment is considered to be one reason for poor growth performance. To the extent, natural disasters deter investment that would affect economic growth. However, the trend, long-run growth is exogenous in the DIG model. Thus, in its present form, the DIG is not set up to address this issue. Another such example would be the effect of natural disasters on migration and brain drain. The model as such will be hard to adapt to answer questions of migration. The current set up assumes that labor is not mobile across countries and including margins needed for agents to make a choice may require a significant change in the set up.
SMALL STATES
INTERNATIONAL MONETARY FUND 87
Annex VI. World Bank Financing for Natural Disasters
The World Bank has had a central role in ex-post natural disaster support complementary to that of the Fund. A majority of Bank member countries have turned to it for emergency assistance after a natural disaster. Prior to 2008, its crisis support was mainly ad hoc and primarily relied on restructuring of, or diversion of resources away from, existing projects. Until 2008, the Emergency Recovery Loan (ERL) was the lending instrument of choice for natural disasters but it averaged almost as long as other lending instruments to begin disbursements, leaving the Bank with no true emergency lending mechanism other than reallocations (World Bank, 2006).
The World Bank has a key role in the global framework for disaster risk reduction. In 2005, in the wake of the Indian Ocean tsunami, UN member countries adopted the Hyogo Framework for Action, the first action plan to reduce mortality and economic losses from disasters. In 2006, to operationalize the framework, the World Bank, the UN, and donors launched the Global Facility for Disaster Reduction and Recovery (GFDRR), a global partnership program housed and managed by the World Bank. Its total portfolio consisted of 226 grants at the end of FY2014 for a total of US$156 million, and 85 new grants worth US$60 million have subsequently been approved. In 2013, over 70 percent of the World Bank's Country Partnership Strategies recognized natural disasters as a risk to sustainable development, and disaster risk reduction has been integrated into the institutional scorecard to monitor progress (United Nations, 2013). The Sendai Framework, which replaced the Hyogo Framework in 2015, introduced a significant shift from disaster management to disaster risk management and an increased focus on coordination with other relevant frameworks, including that on climate change.
Starting in 2008, the World Bank has developed three new mechanisms to provide additional resources more rapidly in response to natural disasters. The Bank created the IDA Crisis Response Window (CRW), Immediate Response Mechanism (IRM) and Development Policy Finance with a Catastrophic Risk Deferred Drawdown Option (CAT DDO). The CRW, established in 2009, provides low-income countries expedited access to funding following severe natural shocks. The IRM, approved in 2011, can provide access to a portion of the member’s undisbursed IDA balances within weeks rather than months of an emergency. The CAT DDO is a contingent credit line that serves as quick-disbursing bridge financing in the event of a natural disaster. Although six small states have started to use the CRW, no small state has an IRM and only one – Seychelles – has a CAT DDO.1
In parallel, the World Bank is working with its members to reduce disaster risks. Its efforts focus on integrating disaster risk management and climate change adaptation into the Bank’s development assistance programs and promoting resilient development and policy reforms. For example, under the Pacific Resilience Program (PREP), approved in June 2015, the Bank will offer support through 2020 to strengthen early warning, resilient investments and financial protection of participating countries. Working with multiple countries, PREP will encourage regional approaches, including multi-hazard early warning systems, impact forecasts, and response coordination. For climate change, the World Bank’s Climate Change Action Plan 2016-2020 commits that by FY19, 20 percent of new health, nutrition, and population projects will consider climate in their design.
1 For more details, see World Bank, 2006 and 2015b.
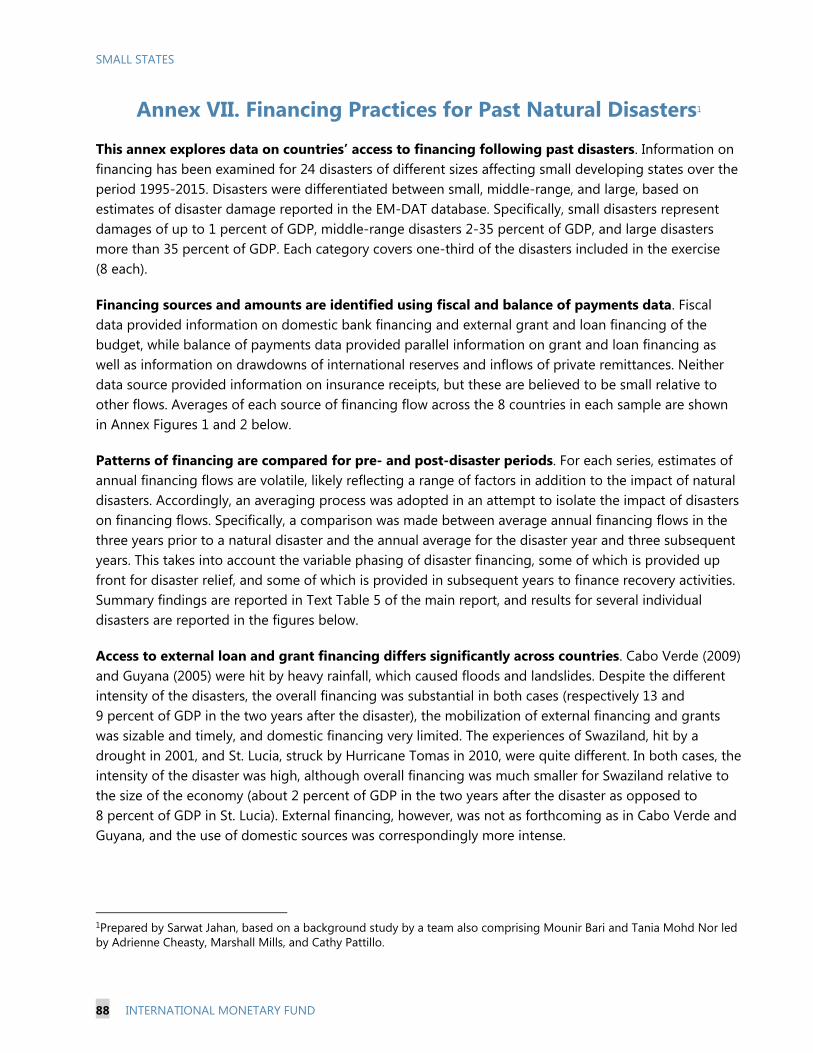
SMALL STATES
88 INTERNATIONAL MONETARY FUND
Annex VII. Financing Practices for Past Natural Disasters1
This annex explores data on countries’ access to financing following past disasters. Information on financing has been examined for 24 disasters of different sizes affecting small developing states over the period 1995-2015. Disasters were differentiated between small, middle-range, and large, based on estimates of disaster damage reported in the EM-DAT database. Specifically, small disasters represent damages of up to 1 percent of GDP, middle-range disasters 2-35 percent of GDP, and large disasters more than 35 percent of GDP. Each category covers one-third of the disasters included in the exercise (8 each).
Financing sources and amounts are identified using fiscal and balance of payments data. Fiscal data provided information on domestic bank financing and external grant and loan financing of the budget, while balance of payments data provided parallel information on grant and loan financing as well as information on drawdowns of international reserves and inflows of private remittances. Neither data source provided information on insurance receipts, but these are believed to be small relative to other flows. Averages of each source of financing flow across the 8 countries in each sample are shown in Annex Figures 1 and 2 below.
Patterns of financing are compared for pre- and post-disaster periods. For each series, estimates of annual financing flows are volatile, likely reflecting a range of factors in addition to the impact of natural disasters. Accordingly, an averaging process was adopted in an attempt to isolate the impact of disasters on financing flows. Specifically, a comparison was made between average annual financing flows in the three years prior to a natural disaster and the annual average for the disaster year and three subsequent years. This takes into account the variable phasing of disaster financing, some of which is provided up front for disaster relief, and some of which is provided in subsequent years to finance recovery activities. Summary findings are reported in Text Table 5 of the main report, and results for several individual disasters are reported in the figures below.
Access to external loan and grant financing differs significantly across countries. Cabo Verde (2009) and Guyana (2005) were hit by heavy rainfall, which caused floods and landslides. Despite the different intensity of the disasters, the overall financing was substantial in both cases (respectively 13 and 9 percent of GDP in the two years after the disaster), the mobilization of external financing and grants was sizable and timely, and domestic financing very limited. The experiences of Swaziland, hit by a drought in 2001, and St. Lucia, struck by Hurricane Tomas in 2010, were quite different. In both cases, the intensity of the disaster was high, although overall financing was much smaller for Swaziland relative to the size of the economy (about 2 percent of GDP in the two years after the disaster as opposed to 8 percent of GDP in St. Lucia). External financing, however, was not as forthcoming as in Cabo Verde and Guyana, and the use of domestic sources was correspondingly more intense.
1Prepared by Sarwat Jahan, based on a background study by a team also comprising Mounir Bari and Tania Mohd Nor led by Adrienne Cheasty, Marshall Mills, and Cathy Pattillo.
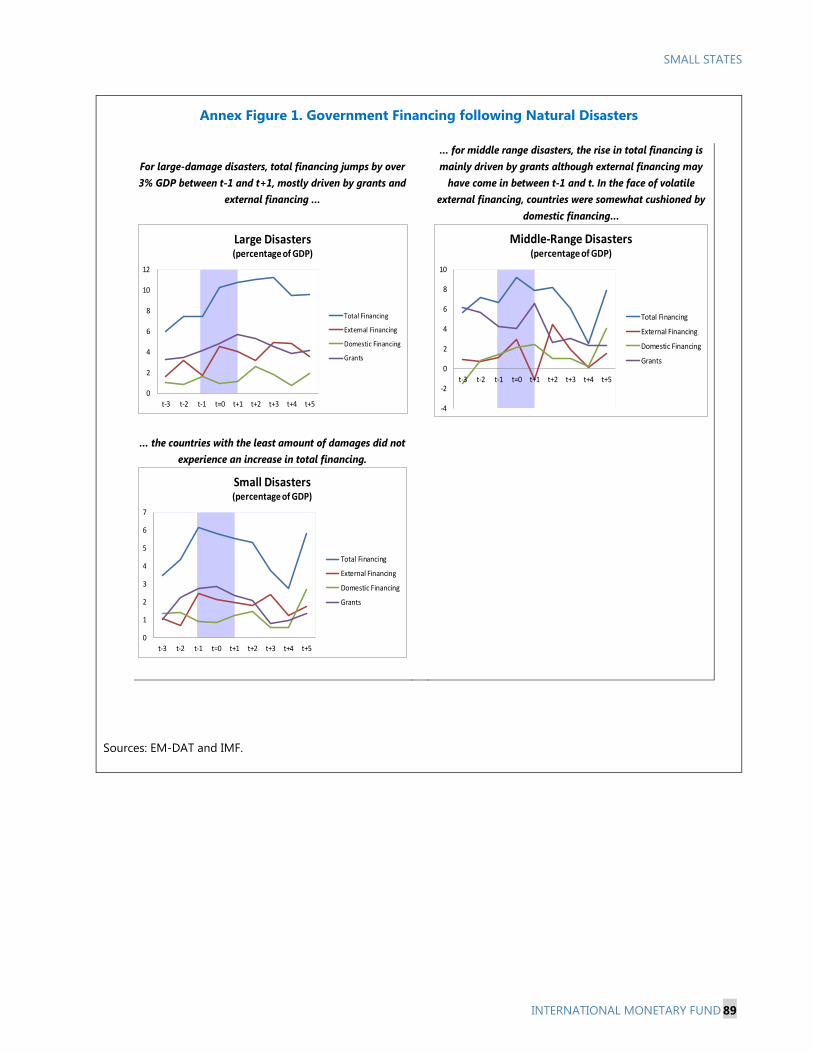
SMALL STATES
INTERNATIONAL MONETARY FUND 89
Annex Figure 1. Government Financing following Natural Disasters
Sources: EM-DAT and IMF.
For large-damage disasters, total financing jumps by over 3% GDP between t-1 and t+1, mostly driven by grants and
external financing …
… for middle range disasters, the rise in total financing is mainly driven by grants although external financing may
have come in between t-1 and t. In the face of volatile external financing, countries were somewhat cushioned by
domestic financing…
… the countries with the least amount of damages did not experience an increase in total financing.
0
2
4
6
8
10
12
t-3 t-2 t-1 t=0 t+1 t+2 t+3 t+4 t+5
Large Disasters(percentage of GDP)
Total Financing
External Financing
Domestic Financing
Grants
-4
-2
0
2
4
6
8
10
t-3 t-2 t-1 t=0 t+1 t+2 t+3 t+4 t+5
Middle-Range Disasters(percentage of GDP)
Total Financing
External Financing
Domestic Financing
Grants
0
1
2
3
4
5
6
7
t-3 t-2 t-1 t=0 t+1 t+2 t+3 t+4 t+5
Small Disasters(percentage of GDP)
Total Financing
External Financing
Domestic Financing
Grants
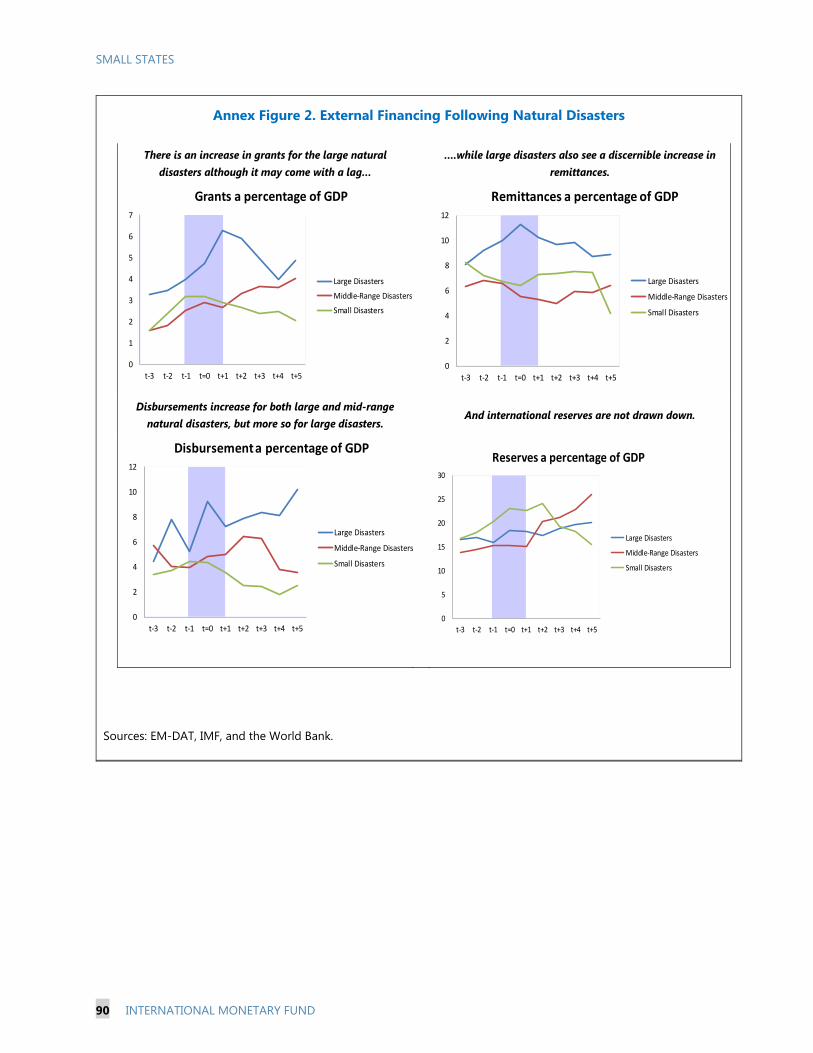
SMALL STATES
90 INTERNATIONAL MONETARY FUND
Annex Figure 2. External Financing Following Natural Disasters
Sources: EM-DAT, IMF, and the World Bank.
There is an increase in grants for the large natural disasters although it may come with a lag…
….while large disasters also see a discernible increase inremittances.
Disbursements increase for both large and mid-range natural disasters, but more so for large disasters.
And international reserves are not drawn down.
0
1
2
3
4
5
6
7
t-3 t-2 t-1 t=0 t+1 t+2 t+3 t+4 t+5
Grants a percentage of GDP
Large Disasters
Middle-Range Disasters
Small Disasters
0
2
4
6
8
10
12
t-3 t-2 t-1 t=0 t+1 t+2 t+3 t+4 t+5
Remittances a percentage of GDP
Large Disasters
Middle-Range Disasters
Small Disasters
0
2
4
6
8
10
12
t-3 t-2 t-1 t=0 t+1 t+2 t+3 t+4 t+5
Disbursement a percentage of GDP
Large Disasters
Middle-Range Disasters
Small Disasters
0
5
10
15
20
25
30
t-3 t-2 t-1 t=0 t+1 t+2 t+3 t+4 t+5
Reserves a percentage of GDP
Large Disasters
Middle-Range Disasters
Small Disasters
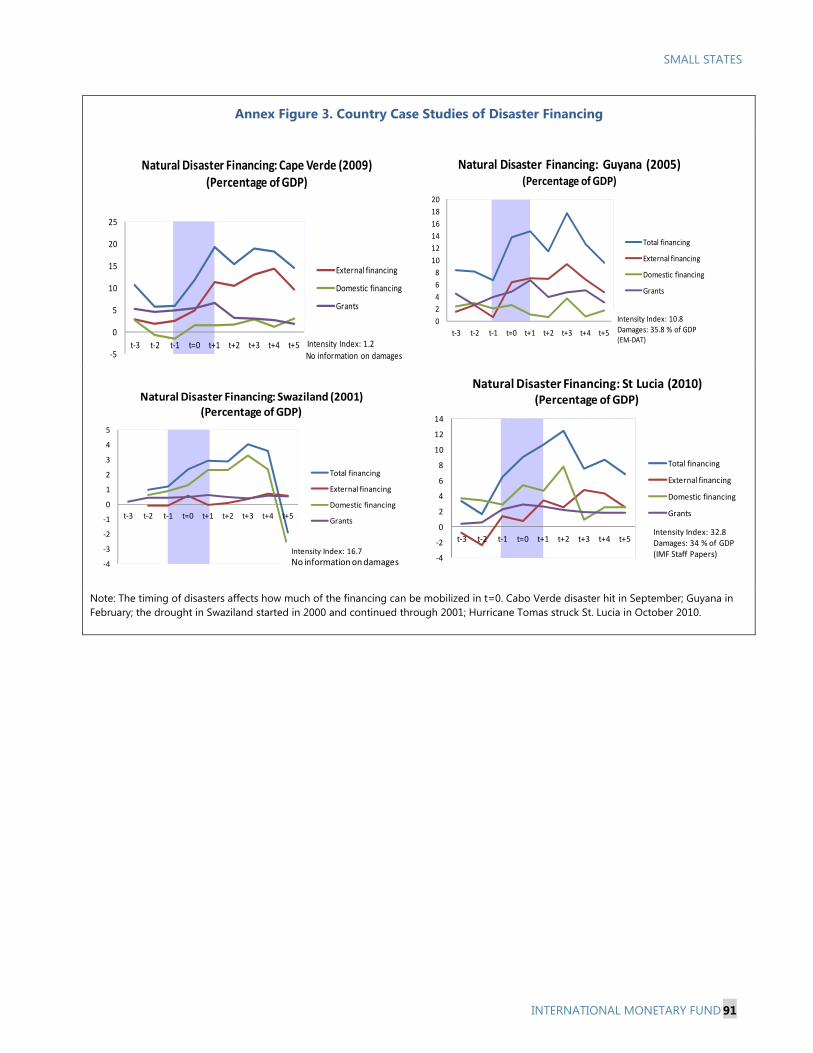
SMALL STATES
INTERNATIONAL MONETARY FUND 91
Annex Figure 3. Country Case Studies of Disaster Financing
Note: The timing of disasters affects how much of the financing can be mobilized in t=0. Cabo Verde disaster hit in September; Guyana in February; the drought in Swaziland started in 2000 and continued through 2001; Hurricane Tomas struck St. Lucia in October 2010.
-5
0
5
10
15
20
25
t-3 t-2 t-1 t=0 t+1 t+2 t+3 t+4 t+5
Natural Disaster Financing: Cape Verde (2009) (Percentage of GDP)
External financing
Domestic financing
Grants
Intensity Index: 1.2 No information on damages
-4
-3
-2
-1
0
1
2
3
4
5
t-3 t-2 t-1 t=0 t+1 t+2 t+3 t+4 t+5
Natural Disaster Financing: Swaziland (2001) (Percentage of GDP)
Total financing
External financing
Domestic financing
Grants
Intensity Index: 16.7
No information on damages -4
-2
0
2
4
6
8
10
12
14
t-3 t-2 t-1 t=0 t+1 t+2 t+3 t+4 t+5
Natural Disaster Financing: St Lucia (2010)(Percentage of GDP)
Total financing
External financing
Domestic financing
Grants
Intensity Index: 32.8 Damages: 34 % of GDP(IMF Staff Papers)
0
2
4
6
8
10
12
14
16
18
20
t-3 t-2 t-1 t=0 t+1 t+2 t+3 t+4 t+5
Natural Disaster Financing: Guyana (2005)(Percentage of GDP)
Total financing
External financing
Domestic financing
Grants
Intensity Index: 10.8 Damages: 35.8 % of GDP(EM-DAT)
SMALL STATES
92 INTERNATIONAL MONETARY FUND
Annex VIII. Design and Use of Government Deposit Buffers
Design of deposit buffers
Size of buffers. The appropriate size for a deposit buffer depends on the projected probability of natural disasters and their associated financing needs (loss of revenues, new spending pressures).1 It also depends on the expected timeline for accessing alternative financing sources (external grants, loans, insurance payouts), the capacity of the government to preserve the buffer against other spending pressures, and the scope to reduce disaster risks through mitigation measures. Where countries have ready access to borrowed resources, the optimal deposit buffer would also depend on the relative costs of holding buffers rather than taking on new post-disaster debts. (As most small states face constrained short-run borrowing opportunities, this issue of relative costs would not typically be a major consideration.) Given these considerations, the appropriate size of buffers should be determined on a case-by-case basis, rather than using a standardized metric.
Using deposit buffers. The use of deposit buffers after a natural disaster can have macroeconomic consequences that are similar to domestic borrowing. A drawdown of deposits at the central bank has the same effect as borrowing from the central bank in that it generates liquidity that could jeopardize goals for inflation or the exchange rate. Scope to draw on deposits held with domestic commercial banks may also be constrained by disaster-related stress affecting the banking system. In the extreme, a weak bank could face deposit runs following a disaster, impeding use of the government’s deposit buffer. Credit and liquidity risk to the government from deposits held with commercial banks could be addressed, in part, through higher capital ratios, liquidity ratios specific to government deposit buffers, separation of buffer-related assets from other investments, other investment restrictions, or an emergency liquidity assistance facility operated by the central bank in the event of a natural disaster. These safeguards would be burdensome, however, for banks to apply and for the government to monitor. Overall, deposit buffers held with domestic banks are best suited for financing modest post-disaster spending needs.
Overseas buffers. Larger deposit buffers would be more readily usable if invested abroad. This could be in the form of central bank international reserves or government deposits with foreign commercial banks. The drawdown of funds would not, in the first instance, impact domestic liquidity conditions.2 That said, the repatriation and use of foreign funds could have implications for exchange rate management. The latter impact could be beneficial, to the extent that the supply of foreign currency helps meet balance of payments needs arising from the disaster. As a contingency measure, holding foreign currency buffers in today’s interest rate environment would also have opportunity costs that should be weighed. Use of dedicated contingency funds
Countries building up budgetary reserves to address natural disaster risks may choose to utilize a dedicated fund for this purpose. The main characteristics of such funds are that they have a dedicated 1 The size of saving funds and the annual budget contributions needed to self-insure against natural disasters can be estimated, for example, by simulating natural disasters and their impact on macroeconomic variables (see Guerson, 2016). 2 Where the government sells foreign exchange domestically to finance its disaster-related spending, this acts to sterilize any creation of domestic liquidity.
SMALL STATES
INTERNATIONAL MONETARY FUND 93
financing source, specific governance and investment rules, and very restrictive rules regarding the way the resources are to be utilized. They are attractive for building up reserves because they provide
considerable flexibility in timing expenditures across years, and can hold money in reserve, away from the demands placed on the general budget funds, until it is needed.
However, many of these funds are extra-budgetary (EBFs), meaning that they are kept outside of the usual budget process and follow different allocation rules. EBFs are less transparent and, by not being part of the regular budget process, allocate resources without taking account of alternative budget needs. To mitigate these disadvantages, a well-designed framework should have the following characteristics:
The fund should be consolidated with budget information to allow assessment of the overall fiscal situation; at a minimum, the fund balance should appear in financial statements, and drawdowns from the fund should appear in budget execution reports.
There should be a standing appropriation that allows for spending immediately after certain trigger event (such as a declaration of a disaster emergency by the executive).
It should have clear rules governing the use of the resources; follow normal government accounting standards; prepare and publish audited financial statements; define governance rules; and adopt prudent and transparent investment policies. In general, normal PFM rules should apply, but procurement rules for immediate disaster response should be adjusted to allow for quicker procurement.
It should be limited to respond to disasters with large fiscal impacts: hence, drawdowns should only start above a threshold size, or a minimum total cost estimate. Smaller expenditure needs should be covered through budget contingencies.
The size of the fund should be determined by taking into account (i) expected damages, (ii) likely available support from the international community (incl. IMF support), (iii) ability to borrow in an emergency, and (iv) opportunity costs for building up buffers. The fund should not get too large because (i) its primary purpose is to “buy time” by covering immediate expenses during which time longer-term financing can be arranged, and (ii) a large fund will generate pressures to tap it for other purposes.
The fund is a funding source, not an implementing agency. Hence, spending authority should rest with implementing agencies who decide and execute post-disaster spending. The fund typically should not have staff dedicated to it.
Dedicated funds are useful as a funding source for expenditures that cannot be included in the budget because of their inherent unpredictability; however, they should not be used for predictable medium- to long-term expenditures such as climate change adaptation or resiliency investment. These should be included in medium-term budget frameworks or as standing legislation within the annual budget processes, and executed through the budget.
SMALL STATES
94 INTERNATIONAL MONETARY FUND
Annex IX. Innovative Risk Transfer Approaches
Innovative approaches for sharing natural disaster risks have emerged over the past decade. This annex covers two important developments—parametric insurance and catastrophe (CAT) bonds. In line with the risk layering approach described in the main paper, a blend of traditional insurance, parametric insurance, and CAT bonds can reduce the overall cost of coverage against risks that vary in probability and severity. Access to such insurance may depend on maintaining incentives for risk reduction in the public and private sectors, and risk transfer arrangements should be conditional on efforts to reduce disaster risks, or should include financial incentives to take such actions.
Parametric insurance
Whereas payments under regular indemnity insurance rely on case-by-case damage assessments, parametric insurance pays out as soon as third party data confirms a disaster event based on pre-defined parameters. Insurance contracts can be tailored to key risks and vulnerabilities in each country, such as hurricane wind speed, or earthquake intensity.
Parametric insurance has the key advantage of being quick-disbursing and its use is growing, albeit from a low base.1 Costs of cover tend to be high, reflecting several factors. Where disasters are common, the costs of risk transfer will be high, and parametric insurance is best used as cover for the most severe, uncommon disasters. Uncertainties about the distribution of disaster risks can also raise cost of coverage, at least until insurers develop accurate models of parametric distributions. Basis risk can also reduce the cost-effectiveness of parametric insurance, and research to better understand disaster transmission channels can help improve the design of risk cover.2 Similar to the sovereign bond markets, initial participation by the sovereign can help foster price discovery and reduce the cost of subsequent sovereign participation. Given these various considerations, payouts have typically covered just 1 percent at most of total losses, reflecting limited coverage offered or bought by the authorities as well as basis risk.
Regional pooling of parametric insurance can also help exploit economies of scale. Regional risk pooling is a natural extension of parametric insurance that relies on participation of multiple parties including governments and IFIs for both initial capitalization and policy coordination. With initial capitalization provided by donors and IFIs, the regional pool transfers part of its risk to international reinsurance and capital markets. The World Bank (2014b) estimates that risk pooling reduces the ex-ante financial costs of insurance by up to 50 percent, reflecting partial sharing of capital, administrative and operating economies,3 and improved access to reinsurance markets. Accordingly, support for regional risk pooling
1 Derivatives market transactions also offer scope for “insurance-like” risk transfer. Financial instruments meeting such needs will increasingly be available, though the challenge will be to achieve cost-effective economies of scale for issuers and to reduce basis risk for purchasers. 2 Basis risk arises where model parameters are only loosely related to losses (e.g., wind-speed fails to fully capture the destructive power of a hurricane). 3 For example, the extension of the CCRIF from the Caribbean to Central American countries provided economies of scale by distributing administrative and risk modelling research costs across a larger client base.
SMALL STATES
INTERNATIONAL MONETARY FUND 95
may be a cost-effective way for global partners to promote risk transfer by small states. Several regional risk pooling arrangements are in place:
Caribbean. The Caribbean Catastrophe Risk Insurance Facility (CCRIF), supported by the World Bank and international donor community was launched in 2007. The expansion of the CCRIF to include Central America is projected to reduce premiums for the Caribbean countries by 25 percent and 36 percent for Central America. Caribbean countries already enjoy a 50 percent reduction in premiums from what they would have paid individually.
Pacific. In 2013, a similar facility was created for Pacific countries—the Pacific Catastrophe Risk Insurance Pilot. This program was made possible through the collective efforts of the Government of Japan, the World Bank, and the Global Facility for Disaster Reduction and Recovery.
Africa. African Risk Capacity, an Africa insurance pool for droughts (flood risks to be added at a later date) issued its first policies in May 2014 to cover events with a frequency of I in 5 years. It has a current membership of 32 countries including three small states—Comoros, Djibouti, and Sao Tome and Principe.
Catastrophe bonds
Catastrophe (CAT) bonds and other state contingent financial instruments provide for a degree of risk transfer. CAT bonds offer institutional investors high coupons, but in the event of a disaster, bond principal is forgiven, freeing the resources from the issue for disaster management. Principal forgiveness depends on a parametric trigger, based on scientifically measurable characteristics of a hazard. This facilitates quick action in the event of a disaster, while at the same time protecting investors from moral hazard arising from asymmetric information.
Parametric Insurance Payouts and Estimated Total Losses
Insurance Payout
Payout Total losses (in percent
($million) ($million) of losses)
Anguilla CCRIF 2010 4.2 13 32.3
Barbados CCRIF 2010 8.5 741 1.1
St. Lucia CCRIF 2010 3.2 588 0.5
St. Vincent and the Grenadines CCRIF 2010 1.1 288 0.4
Haiti CCRIF 2010 8 14000 0.1
Dominica CCRIF 2015 2.4 244 1.0
Vanuatu PCRIP 2015 1.9 268 0.7
Source: CCRIF, PCRIP, and various media reports.
SMALL STATES
96 INTERNATIONAL MONETARY FUND
Mexico is, to date, the only sovereign to issue a CAT bond, with a 2012 issue providing coverage against earthquakes and hurricanes. The World Bank has also issued a CAT bond to finance CCRIF, the parametric insurance facility for Caribbean countries. In the case of Grenada, debt restructurings during 2014/15 have also included hurricane clauses, developed with Fund advice. Specifically, in a debt exchange with commercial bondholders, new bonds featured a haircut as well as a “hurricane clause” that will defer up to 2 semi-annual payments for all debt service in the event of qualifying hurricane. Depending on the timing of the event, the debt service deferment could provide as much as 5 percent of GDP in cash flow relief. A similar clause was included in Grenada’s debt restructuring with the export-Import Bank of Taiwan, and a hurricane clause, though much weaker, was included in Grenada’s November 2015 Paris Club rescheduling agreement.
SMALL STATES
INTERNATIONAL MONETARY FUND 97
Annex X. Fund Financing for Natural Disasters
Rapid Credit Facility (RCF). Established in 2009, the RCF provides rapid financial support in a single, up-front loan disbursement. Access is available to low-income countries eligible for concessional borrowing through the Poverty Reduction and Growth Trust (PRGT). RCF financing carries a zero interest rate, has a grace period of 5½ years, and a final maturity of 10 years. The RCF replaced the earlier subsidized Emergency Natural Disaster Assistance (ENDA).
Rapid Financing Instrument (RFI). Established in 2011, the RFI is available on non-concessional GRA terms, and is repayable within 3¼ to 5 years. Both the RCF and RFI are designed for members that do not require a full-fledged economic reform program (e.g., because of the transitory and limited nature of the shock), or where such a program is not feasible because the need is urgent or policy implementation capacity is limited.
Access limits under the RCF and RFI. The annual access limit under the RCF and RFI was increased from 50 to 75 percent of quota in July 2015 as part of a financial safety net package for developing countries. (The same package eliminated the scope to use the RCF and RFI in parallel to obtain financing of up to 100 percent of quota.) With the increase in quotas in 2016, annual access limits were halved to 37.5 percent of quota.
Augmentation of an existing program. When a country with an IMF-supported program is hit by a natural disaster, augmented financing under the existing program can provide additional financial support. Also, an IMF program can play a catalytic role in mobilizing international assistance even when an augmentation of resources under the existing program does not take place (e.g., Solomon Islands, 2014).
Catastrophe Containment and Relief (CCR) Trust. Established in 2015, the CCR Trust replaced the earlier Post-Catastrophe Debt Relief (PCDR) Trust.1 It allows the Fund to join international debt relief efforts when poor countries are hit by catastrophic natural and/or public health disasters. The IMF can provide debt relief to free up resources to meet exceptional balance of payments needs created by the disaster, rather than having to assign those resources to debt service. The post-catastrophe relief assistance under the CCR Trust is available to 38 low-income countries eligible for concessional borrowing through the PRGT and which also have either a per capita income below US$1,215—or, for small states, a population below 1.5 million and a per capita income below US$2,430.2 A country qualifies for post-catastrophe relief under the CCR Trust if it is hit by a disaster that directly affects at least one third of the population and affects a large portion of the economy evidenced by either destruction of more than a quarter of the country’s productive capacity (as estimated by such early indications as destroyed structures and the impact on key economic sectors and public institutions) or caused by damage exceeding 100 percent of GDP.
1 Following the 2010 Haiti earthquake, the PCDR trust was established to permit the Fund to provide debt relief on IMF repayments when poor countries are hit by the most catastrophic natural disasters. 2 Among the Pacific islands, only Solomon Islands meet these criteria.