immunisation coverage, 2012 - department of health · participation in the acir is opt-out so it...
TRANSCRIPT
E208 CDI Vol 38 No 3 2014
Annual report Immunisation coverage, 2012
Abstract
This, the 6th annual immunisation coverage report, documents trends during 2012 for a range of standard measures derived from Australian Childhood Immunisation Register (ACIR) data, and National Human Papillomavirus (HPV) Vaccination Program Register data. These include coverage at standard age milestones and for individual vaccines included on the National Immunisation Program (NIP) and coverage in adolescents and adults. The proportion of Australian children ‘fully vaccinated’ at 12, 24 and 60 months of age was 91.7%, 92.5% and 91.2%, respectively. For vac-cines available on the NIP but not assessed during 2012 for ‘fully vaccinated’ status or for eligibility for incentive payments (rotavirus and pneumococcal at 12 months and meningococcal C and varicella at 24 months) coverage varied. Although pneumococ-cal vaccine had similar coverage at 12 months to other vaccines, coverage was lower for rotavirus at 12 months (83.6%) and varicella at 24 months (84.4%). Although ‘fully vaccinated’ coverage at 12 months of age was lower among Indigenous children than non-Indigenous children in all jurisdic-tions, the extent of the difference varied, reaching a 15 percentage point differential in South Australia but only a 0.4 percentage point differential in the Northern Territory. Overall, Indigenous coverage at 24 months of age exceeded that at 12 months of age nationally and for all jurisdictions, but as receipt of varicella vaccine at 18 months is excluded from calculations, this represents delayed immunisation, with some contribution from immunisation incen-tives. The ‘fully vaccinated’ coverage estimates for vaccinations due by 60 months of age for Indigenous children exceeded 90% at 91% in 2012. Unlike in 2011, at 60 months of age, there was no dramatic variation in coverage between Indigenous and non-Indigenous children for individual jurisdictions. As previously documented, vaccines recommended for Indigenous children only, hepatitis A and pneumo-coccal vaccine, had suboptimal coverage at 60.1% and 73.1%, respectively, although there was a considerable improvement in coverage from 2011, 57.7% and 68.2% respectively. On-time receipt (before 49 months of age) of vaccines by Indigenous children at the 60-month milestone age improved substantially between 2011 (19%) and 2012 (38%) but the disparity in on-time vaccination between Indigenous and non-Indigenous children worsened at the 60-month age milestone from 2011 (from 1.8 to 5.4 percentage points) and remained the same
for the 12 and 24-month age milestones. By late 2012, the percentage of children who received the 1st dose of DTPa vaccine dose at less than 8 weeks of age was greater than 50% in all but 1 jurisdiction and greater than 70% for New South Wales, the Australian Capital Territory and Tasmania. Further, by late 2012, the percentage of children who received the 4th dose of DTPa vaccine dose at less than 4 years of age was greater than 30% in 3 juris-dictions. The percentage of children whose parents officially objected to vaccination in Australia was 1.7% and this figure varied by jurisdiction. However, there is a further 2.1% of children whose parents don’t officially object but whose children have no vaccines recorded on the ACIR. Coverage data for the 3rd dose of HPV from the national HPV register in the school catch up program was similar to 2011 at 71% but was substantially lower for the catch up program for females outside school (44%–69%), although this was an improvement from 2011. Commun Dis Intell 2014;38(3):E208–E231.
Keywords: immunisation coverage, immunisation delay, vaccine objection, human papilloma virus vaccine coverage
Introduction
This is the 6th annual immunisation cover-age report, with the first 4 reports beginning in 2007.1–4 It consolidates regular reports produced by the National Centre for Immunisation Research and Surveillance5–19 using Australian Childhood Immunisation Register (ACIR) data and highlights important trends and significant issues over the preceding 12 months. It follows the format of the previous reports, providing a detailed summary for 2012 that includes vaccination coverage at standard milestone ages, coverage for vaccines not included in standard coverage assessments, timeliness of vaccination, coverage for Indigenous children and data for small geographic areas on the prevalence of vaccine objectors. This report also includes data from previously published sources on adolescents who are not on the ACIR. Readers are referred to the first report for a more detailed explanation of the background to this series of annual reports and the range of analyses presented.1 This report uses the longstanding international practice of reporting at key milestone ages, to measure cov-erage against national targets and to track trends over time. Table 1 shows the Australian National Immunisation Program Schedule for 2012.
ImmunIsatIon coverage, 2012Brynley P Hull, Aditi Dey, Rob I Menzies, Julia M Brotherton, Peter B McIntyre
Annual reportImmunisation coverage, 2012

CDI Vol 38 No 3 2014 E209
Immunisation coverage, 2012 Annual report
High levels of reporting to the Australian Childhood Immunisation Register are maintained by a system of incentive payments for immunisa-tion providers and carers. These have been dis-cussed in detail elsewhere18 and are highlighted in Table 2. However, changes to immunisation policy, the incentive payment system and changes to the ‘fully immunised’ coverage algorithms may have an impact on reported vaccination coverage; some recent changes are highlighted in the Box and are also referred to in this report.
Methods
The Australian Childhood Immunisation Register
The ACIR was established on 1 January 1996, by incorporating demographic data from Medicare on all enrolled children under the age of 7 years.5 Participation in the ACIR is opt-out so it consti-tutes a nearly complete population register, as approximately 99% of children are registered with Medicare by 12 months of age.5 Children not enrolled in Medicare can also be added to the ACIR
via a supplementary number. Since 2001, immuni-sations given overseas may be recorded if a provider endorses their validity. Data are transferred to the ACIR when a recognised immunisation provider supplies details of an eligible immunisation either automatically from medical practice software or through the Internet using the Medicare Australia website or by submitting paper encounter forms. The existence of medical contraindications and conscientious objection to immunisation is also recorded on the ACIR. All vaccination records for a child remain on the register indefinitely, but no new immunisation encounter records are added after the 7th birthday.
Immunisations recorded on the Register must be rendered in accordance with the guidelines issued by the National Health and Medical Research Council as stated in The Australian Immunisation Handbook.20 Notifications falling outside these guidelines or duplicate notifications prompt an enquiry with the provider and, if their validity cannot be established, they are rejected.
Table 1: Australian National Immunisation Program Schedule for children, adolescents and adults in 2012
Age Vaccine*Childhood vaccinesBirth HepB2 months HepB DTPa Hib IPV 13vPCV Rotavirus4 months HepB DTPa Hib IPV 13vPCV Rotavirus6 months HepB DTPa Hib IPV 13vPCV Rotavirus†
12 months Hib MMR HepA‡ MenCCV18 months VV HepA‡§ 13vPCV‡
24 months HepA§ 13vPCV§
48 months DTPa IPV MMRAdolescent vaccines12 years HepB|| dTpa VV|| HPV¶
15 years dTpa Influenza**,††, 23vPPV‡‡
Adult vaccines≥ 50 years Influenza**,†† 23vPPV**65 years Influenza†† 23vPPV
* A glossary of vaccine abbreviations is provided at the end of the report.† 3rd dose of rotavirus vaccine at 6 months is dependent on vaccine brand used in each state or territory.‡ Aboriginal and Torres Strait Islander children in Western Australia and the Northern Territory.§ Aboriginal and Torres Strait Islander children in Queensland and South Australia.|| Catch up only.¶ Females only.** For Indigenous people only.†† Annual vaccination, all aged ≥6 months with medical risk factors, non-Aboriginal adults ≥65 years.‡‡ Aboriginal adults with medical risk factors.

E210 CDI Vol 38 No 3 2014
Annual report Immunisation coverage, 2012
Table 2: History of payments provided by the Australian Government for immunisation in Australia, 1996 to 2013
Year introduced Parent/carer General practice1996 ACIR notification payment
$6* per notification of completion of all vaccines at each age-based National Immunisation Program (NIP) schedule point
1998 Childcare Assistance Rebate and/or the Childcare Cash Rebate†
Amount varied depending on income, number and age of child(ren) as well as type and duration of care used.
GPII Service Incentive Payment$18.50 per notification of completion of all vaccines at each of the aged-based NIP schedule points
Maternity Immunisation Allowance (MIA)†
$200‡ per ‘fully vaccinated’ child at 19 months of age if child had received all vaccines due up to 18 months of age
GPII Outcomes Bonus payment$3.50 per ‘fully immunised’ whole-patient equivalent (WPE)§ if practice coverage rate for children <7 years of age is over 90%||
2000 Childcare Rebate replaced previous Childcare Assistance and Cash rebates‡
Amount varied depending on income, number and age of child(ren) as well as type and duration of care used
July 2004 Means testing removed from Maternity Immunisation Allowance¶
July 2008 National HPV Register notification payment introduced$6 per dose notified
October 2008 GPII Service Incentive Payment ceased–$111 per child ≤7 years of age¶
January 2009 MIA split into 2 payments$129** paid in 2 instalments paid for ‘fully immunised’ children aged between 18–24 months and between 4–5 years
June 2010 National HPV Register notification payment ceased¶
–$6 per doseJuly 2012 MIA ceased¶
–$258 per ‘fully immunised’ childGPII Outcomes Bonus payment ceased–$3.50 per WPE aged ≤7 years¶
Immunisation status of children aged 1, 2 and 5 years linked to the existing Family Tax Benefit Part A supplement†
Maximum of $726 per age milestone, total $2,178 per ‘fully immunised’ child
* In Queensland the ACIR notification payment is $3 per notification, totalling $18 if all vaccines at each of the 6 aged-based schedule points on the NIP are notified to the ACIR.
† Means tested.‡ Amount in 1998. This had increased annually to $233 by 2008 prior to being split into 2 payments totalling $258 per child.§ The whole patient equivalent is a numerical representation of the proportion of care provided to a patient (aged ≤ 7 years) at
a general practice during a 12 month reference period, compared with the overall care provided to that patient by all other general practices that child may have visited during the same period. The WPE is calculated from the Medical Benefits Schedule fee value of non-referred services.
|| GPII outcomes bonus payment applied to general practices with 70%, 80% and 90% coverage levels in 1st year, then 80% and 90% coverage levels in 2nd year and 90% coverage levels from 3rd year onwards. In addition, general practices must have been registered with the GPII scheme and had ≥10 WPEs to qualify for the payment.
¶ Denotes removal of a payment or payment condition.** Amount from 2009 to end June 2012.

CDI Vol 38 No 3 2014 E211
Immunisation coverage, 2012 Annual report
Measuring immunisation coverage using the Australian Childhood Immunisation Register
The cohort method has been used for calculating coverage at the population level (national and state or territory)21 since the ACIR’s inception. Cohort immunisation status is assessed at 12 months of age (for vaccines due at 6 months), 24 months of age (for vaccines due at 12 and 18 months), and 60 months of age (for vaccines due at 48 months). A minimum 3-month lag period is allowed for late notification of immunisations to the regis-ter, but only immunisations given on or before a child’s 1st, 2nd or 5th respective birthdays are considered.21 If a child’s records indicate receipt of the last dose of a vaccine that requires more than 1 dose to complete the series, it is assumed that earlier vaccinations in the sequence have been given. This assumption has been shown to be valid.6, 9
Three-month birth cohorts are used for time trend analyses, while 12-month wide cohorts are used for other analyses in this report such as for small area analysis. The 12-month wide cohorts used in this report are children born between 1 January and 31 December 2011 for the 12-month milestone age; children born between 1 January and 31 December 2010 for the 24-month milestone age; and children born between 1 January and 31 December 2007 for the 60-month milestone age.
The proportion of children designated as ‘fully immunised’ is calculated using the number of children completely immunised with the vaccines of interest by the designated age as the numerator, and the total number of Medicare-registered chil-dren in the age cohort as the denominator. ‘Fully immunised’ at 12 months of age was defined as a child having a record on the ACIR of a 3rd dose of the combined DTPa-hepB-IPV-Hib vac-
Box: Recent significant changes in immunisation policy, immunisation incentives and coverage calculation algorithmsJuly 2013 – The combined Haemophilus influenzae type b (Hib) and meningococcal serogroup C (MenC) vaccine, Menitorix® at 12 months of age, was added to the National Immunisation Program (NIP) schedule. This combination vaccine replaces the single dose of monovalent meningococcal C conjugate vaccine (MenCCV) and booster dose of monovalent Hib vaccine previously scheduled at 12 months of age.A combination measles, mumps, rubella, varicella (MMRV) vaccine for children aged 18 months was added to the NIP. The MMRV vaccine replaces the separate measles, mumps, rubella (MMR) vaccine currently given at 4 years, and the varicella vaccine (for chickenpox) currently given at 18 months.Pneumococcal conjugate vaccine, meningococcal C vaccine and varicella vaccine (as MMRV) included in the algorithms used to calculate ‘fully vaccinated’ coverage at 12 and 24 months.The hepatitis A vaccination schedule for Indigenous children changed so that dose 1 is administered to Indigenous children at 12 months of age and dose 2 at 18 months of age in all 4 jurisdictions (the Northern Territory, Western Australian, Queensland and South Australia).February 2013 – Males and females aged 12–13 years received the human papillomavirus (HPV) vaccine at school. Males aged 14–15 years also received the vaccine as part of a catch-up program until the end of the 2014 school year.October 2012 – Prevenar 13® (13-valent pneumococcal conjugate vaccine, 13vPCV) replaced 23-valent pneumococcal polysaccharide vaccine (23vPPV) as a booster dose in Indigenous children.July 2012 – Eligibility for the Family Tax Benefit Part A supplement required that children are assessed as
fully immunised, replacing the Maternity Immunisation Allowance.July 2011 – Prevenar 13® (13vPCV) replaced Prevenar® (7-valent pneumococcal conjugate vaccine, 7vPCV) on the NIP for children at 2, 4 and 6 months of age in all states and territories except the Northern Territory (adopted 13vPCV from 1 October 2011). Also, a single supplementary dose of 13vPCV was funded for children aged 12–35 months who had not received a dose of 13vPCV or 10vPCV in their primary course. This ‘supplementary dose’ was available from October 2011 through to the end of September 2012. It was also available through the NIP to medically at-risk and Indigenous children on the 3+1 schedule, to be given at least 2 months after the booster dose.December 2009 – Changes in the coverage calculation algorithms that tightened the rules regarding the receipt of Haemophilus influenzae type b and hepatitis B vaccines for children aged 12 and 24 months to lead to more accurate measures of Haemophilus influenzae type b and hepatitis B vaccine coverage in Australia.October 2009 – The recommendation by the Australian Technical Advisory Group on Immunisation (ATAGI) that the 4th dose of diphtheria-tetanus-pertussis (acellular) (DTPa) vaccine can be given from 3½ years of age instead of the previously recommended 4 years of age.March 2009 – The recommendation by NSW Health and ATAGI to parents and immunisation providers to consider bringing the 1st dose of DTPa forward to 6 weeks of age to provide earlier protection.January 2009 – Changes to the overdue rules so that children were classified as overdue for pre-school boosters at 4 years and 1 month instead of the previous 5 years of age. This applied to parental and provider incentive payments.

E212 CDI Vol 38 No 3 2014
Annual report Immunisation coverage, 2012
cine. ‘Fully immunised’ at 24 months of age was defined as a child having a record on the ACIR of a 3rd dose of the combined DTPa-hepB-IPV-Hib vaccine, a 4th dose of Haemophilus influenzae type b polysaccharide conjugated to tetanus toxoid vac-cine, and a 1st dose of an measles-mumps-rubella (MMR)-containing vaccine. ‘Fully immunised’ at 60 months of age was defined as a child having a record on the ACIR of a 4th dose of combined DTPa-IPV vaccine, and a 2nd dose of an MMR-containing vaccine.
Immunisation coverage estimates were also cal-culated for individual National Immunisation Program (NIP) vaccines, including the 6 NIP vaccines not routinely reported in Communicable Diseases Intelligence and not part of ‘fully immun-ised’ calculations at 12 and 24 months of age. They were: a 3rd dose of pneumococcal polysaccharide vaccine and 2nd or 3rd dose of rotavirus vaccine by 12 months of age; a 1st dose of a varicella vac-cine and a 1st dose of meningococcal C vaccine by 24 months of age; a 2nd dose of hepatitis A vaccine in Indigenous children by 30 or 36 months of age; and a dose of pneumococcal vaccine in Indigenous children by 30 months of age.
Changes to immunisation policy and changes to the ‘fully immunised’ coverage algorithms have had an impact on vaccination coverage presented in this report. In December 2007, the coverage algorithm for immunisations due at 48 months of age was changed to assess children at 60 months, not 72 months of age. In January 2009, changes were made to the overdue rules so that children were classified as overdue for pre-school boosters at 49 months instead of the previous 60 months of age. This applied to parental and provider incentive payments (Table 2). In March 2009, a recommendation was made by ATAGI to parents and immunisation provid-ers to consider bringing the 1st dose of DTPa forward to 6 weeks of age to provide earlier protection against pertussis infection. From the September 2009 coverage assessment date onwards, changes were made in the coverage calculation algorithms that tightened the rules regarding receipt of Hib and hepatitis B vaccines for children aged 12 and 24 months of age. Prior to September 2009, if a child aged 12 months of age had a record on the ACIR of a 2nd or 3rd dose of any child Hib vaccine, he or she was con-sidered ‘fully vaccinated’. From September 2009, a child needed a record on the ACIR of a 3rd dose of any Hib vaccine or a 2nd dose of either PedvaxHIB or Comvax to be assessed as ‘fully vaccinated’. Prior to September 2009, if a child aged 12 months of age had a record on the ACIR of a 2nd or 3rd dose of any hepatitis B vaccine, he or she was considered ‘fully vaccinated’. From
September 2009, a child needed a record on the ACIR of a 3rd dose of any hepatitis B vaccine or a 2nd dose of Engerix B (paediatric), Comvax, or hepatitis B (paediatric) vaccine, to be assessed as ‘fully vaccinated’. In October 2009, a recom-mendation was made by ATAGI that the 4th dose of DTPa containing vaccine can be given from 42 months of age instead of the previously recommended 48 months of age.
Timeliness
Age-appropriate immunisation was defined as receipt of a scheduled vaccine dose within 30 days of the recommended age. For example, a child who received the 1st dose of DTPa (due at 60 days of age) when he or she was more than 90 days of age was classified as late for that dose. For descriptive purposes, we categorised the outcome measure for each dose as either vaccine dose ‘no delay’, ‘delay of between 1 and 6 months’, or ‘delay greater than 6 months’. Doses received ’too early’ (greater than 30 days prior to when it was due), and doses never administered or recorded were excluded. Timeliness is measured in 12-month birth cohorts. Children included in the timeli-ness analysis were assessed at 1–3 years after doses were due, to allow time for late vaccinations to be recorded. Therefore, cohorts assessed for timeliness are not the same as those assessed for coverage milestones. The interval between doses was not evaluated. Timeliness of different vac-cines and doses was also compared by plotting the cumulative percentage receiving each vaccine dose by age, with the proportion ever immunised set as 100%.
Remoteness status
The area of residence of children was defined as ‘Major Cities’, ‘Inner Regional’, ‘Outer Regional’, ‘Remote’, and ‘Very Remote’ using the Accessibility/Remoteness Index of Australia (ARIA),22 which was developed by GISCA (now the Australian Population and Migration Research Centre) as a joint project with the Australian Department of Health in 1997/98. ARIA is an unambiguously geographical approach to defining remoteness. The most widely used ARIA product is ARIA+. ARIA+ is a continuous varying index with values ranging from 0 (high accessibility) to 15 (high remoteness), and is based on road distance meas-urements from over 12,000 populated localities to the nearest Service Centres in 5 size categories based on population size. For the timeliness analy-sis, we combined the 2 ‘Regional’ categories into 1 category (‘Inner and Outer Regional’) and the 2 ‘Remote’ categories into 1 category (‘Remote and Very Remote’).
CDI Vol 38 No 3 2014 E213
Immunisation coverage, 2012 Annual report
Indigenous status
Indigenous status on the ACIR is recorded as ‘Indigenous’, ‘non-Indigenous’ or ‘unknown’, as reported by the child’s carer to Medicare, or by the immunisation provider to the ACIR. For this report we considered 2 categories of children: ‘Indigenous’ and ‘non-Indigenous’. Children with unknown Indigenous status were presumed to be ‘non-Indigenous’. Coverage estimate time trends are presented from 2004 only, due to poor rates of reporting Indigenous status prior to then.23
Small area analysis
Analysis for small areas was calculated for the Australian Bureau of Statistics (ABS)-defined Statistical Area 3 (SA3) areas,24 chosen because each is small enough to show differences within jurisdictions but not too small to render maps unreadable. Maps were created using version 12 of the MapInfo mapping software25 and the ABS Census Boundary Information. As postcode is the only geographical indicator available from the ACIR, the ABS Postal Area to SA3 Concordance 2006 was used to match ACIR postcodes to SA3s, in order to create a SA3 field for each child in the relevant study cohort.26
Vaccine objection
A child must be registered with Medicare before its parent(s) can lodge an official objection to immu-nisation. Parents can also object to immunisation but also refuse to lodge any official objection to the ACIR. We used the percentage of children with no vaccines recorded on the ACIR as a proxy measure of the number of these children.15 Some children with no vaccines recorded on the ACIR will be officially registered as ‘vaccine objectors’ and some will not be registered as such. Registered vaccine objectors are eligible for parent incentive payments even if their children are unvaccinated. Proportions of children with: official vaccine objector status and no vaccines recorded on the ACIR; official vaccine objector status and at least 1 vaccine recorded on the ACIR and; no official vaccine objector status and no vaccines recorded on the ACIR were calculated from the cohort of chil-dren registered with Medicare, and born between 1 January 2010 and 31 December 2010. We chose this cohort when calculating proportions so that children under the age of 12 months were not included, to allow sufficient time for registration of objection and exclude infants late for vaccination.
Human papillomavirus vaccine coverage
The National Human papillomavirus Vaccination Program is listed on the NIP
schedule, funded under the Immunise Australia Program, and delivered to females through an ongoing school-based program usually in the first year of secondary school. From 2013, males are also being offered Human papillomavirus (HPV) vaccination. From 2007 to 2009, there was a time-limited catch up program delivered through schools, general practices and com-munity immunisation services for females up to age 26 years. Immunisation against HPV is achieved with a course of 3 doses of vaccine, over a 6-month period. Data on the National HPV Vaccination Program are provided by the National HPV Vaccination Program Register, which is operated by the VCS Inc. The pur-pose of this legislated register is to support the implementation of the vaccination program and to provide data for monitoring and evaluation.27 States and territories provide data to the HPV register from their school based programs. Doses administered in general practice or by commu-nity providers outside of the school program are notified on a voluntary basis, with a notification payment provided only to general practitioners (GPs) during the 2007–2009 catch up program. The World Health Organization proposes using 15 years as the reference age for HPV vaccina-tion coverage for the purposes of international comparison. Data on notified HPV coverage was obtained from National HPV Vaccination Program Register.28
Coverage in the elderly
As there has not been an Adult Vaccination Survey29 undertaken in Australia since 2009, no data is presented in this 2012 report on influenza and pneumococcal (23vPPV) vaccination coverage in the elderly. The next Adult Vaccination Survey is planned for 2015.
Results
Coverage estimates
Overall
Coverage estimates in 2012 for full-year birth cohorts at the 3 milestone ages of 12 months, 24 months and 60 months are provided in Tables 3, 4 and 5. Nationally and for almost all jurisdic-tions, ‘fully immunised’ coverage and coverage for all individual vaccines (except rotavirus and vari-cella vaccines) for the 12-month, 24-month and 60-month age groups exceed the 1993 Immunise Australia Program’s target of 90%. However, cov-erage at 60 months of age in Western Australia was below this target for all vaccines and ‘fully immunised’.

E214 CDI Vol 38 No 3 2014
Annual report Immunisation coverage, 2012
Table 3: Percentage of children immunised by 12 months of age, 2012, by vaccine and state or territory*
Vaccine† ACT NSW NT Qld SA Tas. Vic. WA Aust.Total number of children 5,377 97,849 3,792 62,005 19,776 6,221 72,624 32,468 300,112Diphtheria, tetanus, pertussis (%) 93.4 91.8 92.4 92.5 92.3 93.1 92.9 91.0 92.2Poliomyelitis (%) 93.4 91.7 92.4 92.4 92.3 93.0 92.8 90.9 92.2Haemophilus influenzae type b (%) 93.3 91.6 92.4 92.4 92.2 92.8 92.7 90.8 92.0Hepatitis B (%) 92.9 91.5 92.3 92.1 92.0 92.8 92.4 90.4 91.8Fully immunised‡ (%) 92.8 91.4 92.2 92.1 91.9 92.7 92.3 90.2 91.7Rotavirus (%) 86.5 86.3 86.6 81.5 84.4 87.8 83.5 77.7 83.613vPCV (%) 92.7 90.5 91.7 91.6 91.6 90.6 91.3 89.2 90.9
* For the birth cohort born in 2011.† A glossary of vaccine abbreviations is provided at the end of the report.‡ ’Fully immunised’ – 3 doses of a diphtheria, tetanus and pertussis-containing vaccine, 3 doses of polio vaccine, 2 or 3 doses
of PRP-OMP-containing Haemophilus influenzae type b (Hib) vaccine or 3 doses of any other Hib vaccine, and 2 or 3 doses of Comvax hepatitis B vaccine or 3 doses of any other hepatitis B vaccines.
Source: Australian Childhood Immunisation Register.
Table 4: Percentage of children immunised by 24 months of age, 2012, by vaccine and state or territory*
Vaccine† ACT NSW NT Qld SA Tas. Vic. WA Aust.Total number of children 5,238 97,741 3,626 62,470 19,631 6,040 72,729 32,643 299,987Diphtheria, tetanus, pertussis (%) 95.7 94.6 95.9 94.5 94.5 95.5 95.5 93.3 94.7Poliomyelitis (%) 95.7 94.6 95.9 94.5 94.5 95.5 95.4 93.3 94.7Haemophilus influenzae type b (%) 95.8 95.0 96.1 94.6 94.6 95.8 95.5 93.5 94.9Hepatitis B (%) 95.0 94.2 95.5 94.0 94.2 95.4 95.0 92.5 94.2Measles, mumps, rubella (%) 94.5 93.8 95.1 94.0 93.7 95.1 94.5 92.5 93.9Fully immunised‡ (%) 93.1 92.3 94.0 92.6 92.4 94.1 93.2 90.5 92.5Varicella (%) 88.9 83.2 86.1 87.1 83.8 85.9 84.5 81.8 84.4MenC (%) 94.3 93.4 94.5 93.4 93.4 94.9 94.0 91.5 93.4
* For the birth cohort born in 2010.† A glossary of vaccine abbreviations is provided at the end of the report.‡ ‘Fully immunised’ – 3 or 4 doses of a DTPa-containing vaccine, 3 doses of polio vaccine, 3 or 4 doses of PRP-OMP-
containing Hib vaccine or 4 doses of any other Hib vaccine, 3 or 4 doses of Comvax hepatitis B vaccine or 4 doses of all other hepatitis B vaccines, and 1 dose of a measles, mumps and rubella-containing vaccine.
Source: Australian Childhood Immunisation Register
Table 5: Percentage of children immunised by 60 months of age, 2012, by vaccine and state or territory*
Vaccine ACT NSW NT Qld. SA Tas. Vic. WA AustraliaTotal number of children 5,009 99,730 3,611 64,466 20,207 6,543 74,163 33,136 306,865Diphtheria, tetanus, pertussis (%) 93.0 91.7 90.8 91.9 90.8 92.5 92.9 89.5 91.7Poliomyelitis (%) 92.9 91.6 90.9 91.8 90.7 92.4 92.8 89.5 91.7Measles, mumps, rubella(%) 92.6 91.5 90.8 91.8 90.5 92.7 92.7 89.4 91.6Fully immunised (%) 92.3 91.2 90.5 91.4 90.2 92.2 92.4 88.9 91.2
* For the birth cohort born in 2007.† ‘Fully immunised’ – 4 or 5 doses of a diphtheria-tetanus-DTPa-containing vaccine, 4 doses of polio vaccine, and 2 doses of
an MMR-containing vaccine.Source: Australian Childhood Immunisation Register

CDI Vol 38 No 3 2014 E215
Immunisation coverage, 2012 Annual report
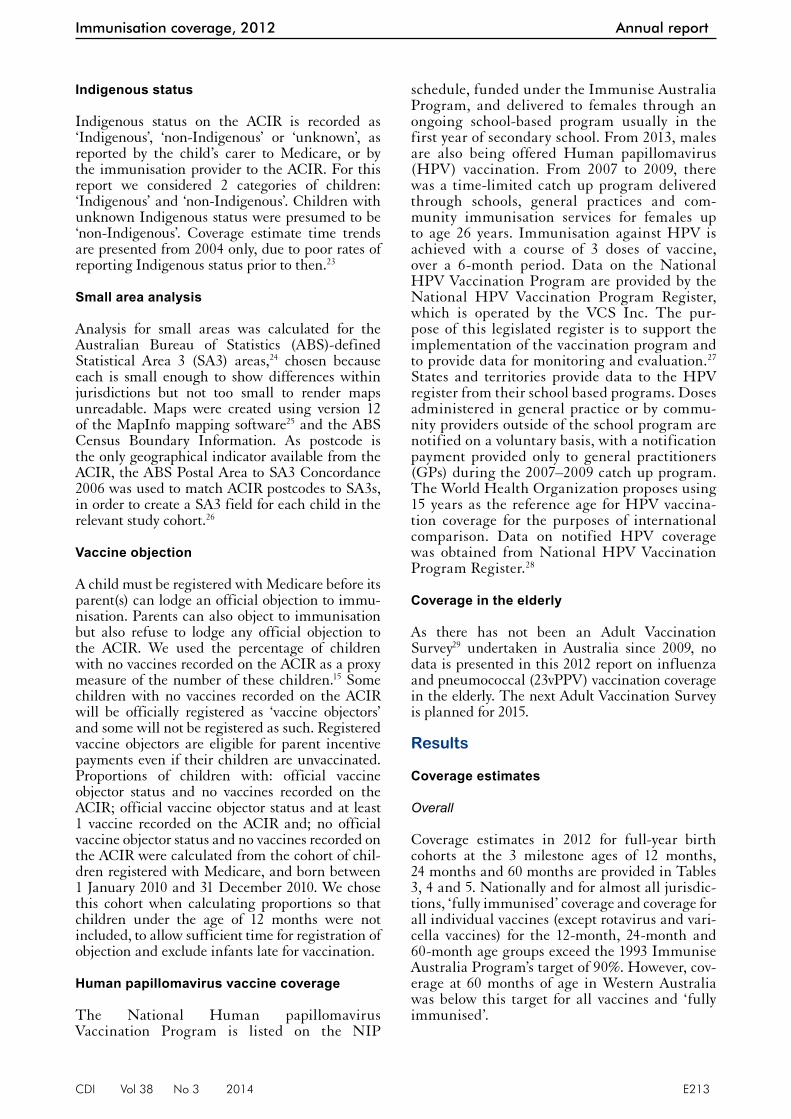
Figure 1 shows time trends in ‘fully immunised’ childhood vaccination coverage in Australia, assessed at 12 months, 24 months, and at 60 months of age, for 3-month cohorts born from 1 January 1999 to 31 December 2011. There is a clear trend of increas-ing vaccination coverage over time for all age groups assessed, with the 2 youngest age cohorts having the highest coverage for most of the period. The propor-tion ‘fully immunised’ at 12 months of age increased steadily from 75% for the 1st cohort in 1997 to 91.5% by 31 December 2012. At the 24-month milestone, ‘fully immunised’ coverage estimates also increased steadily from 64% for the 1st cohort to 92.2% by December 2012. ‘Fully immunised’ coverage esti-mates assessed at 72 months of age, for vaccines due at 48 months, were first reported in Communicable Diseases Intelligence in 2002, and increased stead-ily from 80.6% in early 2002 to 87.3% in late 2007, including a noticeable increase in June 2006, cor-responding with the introduction of combination vaccines. From the beginning of 2008, when the assessment age was changed from 72 months to 60 months, ‘fully immunised’ coverage was sub-stantially lower at 80.7% in December 2008, which was related to delayed immunisation. However, during 2009–2011, coverage for the 60-month age group rose substantially and kept increasing throughout 2012 to be comparable with coverage for the 2 younger age groups at 91.8%.
Individual vaccines
DTPa and polio coverage at 12 months of age remained relatively stable from the latter part of 2001 to 2012 (Figure 2). Coverage for the Hib and hepatitis B vaccines at 12 months of age (prior to the change in algorithm to measure cover-age that occurred in the latter half of 2009) are becoming similar to those for DTPa and polio in the last 2 cohorts of 2009 and on to 2012 and to more accurately reflect the situation (Figure 2). Coverage for 13-valent pneumococcal conjugate vaccine (13vPCV) rose steadily from below 90% in mid-2007 to be just below that for all other vaccines due at this age at around 91%, except for rotavirus vaccine. Rotavirus vaccine coverage rose steeply from late 2008 from below 70% to almost 84% in late 2011 and kept increasing throughout 2012 to be at 83.6%.
For most of the study period, hepatitis B coverage was higher than for all other vaccines at 24 months of age, at just under 95%, due to the different cover-age algorithm described above (Figure 3). Coverage was lowest for MMR and Hib, the only vaccines that have a 12-month dose used in calculations, but in 2012, coverage is similar for all vaccines at just under 95%, except for varicella vaccine.
Figure 1: Trends in ‘fully immunised’ vaccination coverage estimates, Australia, 2000 to 2012, by age cohorts
50
55
60
65
70
75
80
85
90
95
100
31 M
ar 0
030
Sep
00
31 M
ar 0
130
Sep
01
31 M
ar 0
230
Sep
02
30 M
ar 0
330
Sep
03
31 M
ar 0
430
Sep
04
31 M
ar 0
530
Sep
05
31 M
ar 0
630
Sep
06
31 M
ar 0
730
Sep
07
31 M
ar 0
830
Sep
08
31 M
ar 0
930
Sep
09
31 M
ar 1
030
Sep
10
31 M
ar 1
130
Sep
11
31 M
ar 1
230
Sep
12
Cov
erag
e (%
)
Coverage assessment date for each cohort
ACIR-fully vaccinated by 12 monthsACIR-fully vaccinated by 24 monthsACIR-fully vaccinated by 72 monthsACIR-fully vaccinated by 60 months
18 month dose of DTParemoved from schedule
Combination vaccinesintroduced leadingto less injections Coverage algorithm
changed to assess children at 5 years,
not 6 years
GPII SIP Paymentremoved
Coverage at 24 months exceeds that at 12 months
By 3-month birth cohorts born between 1 January 1999 and 31 December 2011. Coverage assessment date was 12 months after the last birth date of each cohort.Source: Australian Childhood Immunisation Register.

E216 CDI Vol 38 No 3 2014
Annual report Immunisation coverage, 2012
Figure 2: Trends in vaccination coverage estimates for individual vaccines at 12 months of age (DTPa, IPV, Hib, HepB, 13vPCV, and rotavirus),*,† Australia, 2000 to 2012
70
75
80
85
90
95
100
31 M
ar 0
030
Sep
00
31 M
ar 0
130
Sep
01
31 M
ar 0
230
Sep
02
30 M
ar 0
330
Sep
03
31 M
ar 0
430
Sep
04
31 M
ar 0
530
Sep
05
31 M
ar 0
630
Sep
06
31 M
ar 0
730
Sep
07
31 M
ar 0
830
Sep
08
31 M
ar 0
930
Sep
09
31 M
ar 1
030
Sep
10
31 M
ar 1
130
Sep
11
31 M
ar 1
230
Sep
12
Cov
erag
e (%
)
Coverage assessment date for each cohort
DTPa
Polio
Hib
Hep B
PCV
Rotavirus
* 3rd dose of DTPa, IPV, and 13vPCV, 2nd or 3rd dose of Hib, HepB, and rotavirus.† A glossary of vaccine abbreviations is provided at the end of the report.By 3-month birth cohorts born between 1 January 1999 and 31 December 2011. Coverage assessment date was 12 months after the last birth date of each cohort.Source: Australian Childhood Immunisation Register.
Figure 3: Trends in vaccination coverage estimates for individual vaccines at 24 months of age (DTPa, IPV, Hib, HepB, MMR, MenCCV, and VV),*,† Australia, 2000 to 2012
70
75
80
85
90
95
100
31 M
ar 0
030
Sep
00
31 M
ar 0
130
Sep
01
31 M
ar 0
230
Sep
02
30 M
ar 0
330
Sep
03
31 M
ar 0
430
Sep
04
31 M
ar 0
530
Sep
05
31 M
ar 0
630
Sep
06
31 M
ar 0
730
Sep
07
31 M
ar 0
830
Sep
08
31 M
ar 0
930
Sep
09
31 M
ar 1
030
Sep
10
31 M
ar 1
130
Sep
11
31 M
ar 1
230
Sep
12
Cov
erag
e (%
)
Coverage assessment date for each cohort
DTPaPolioHibHep BMMRMenCVaricella
* 3rd or 4th dose of DTPa, 3rd dose of IPV, 3rd or 4th dose of Hib, 2nd or 3rd dose of HepB, 1 dose of MMR, MenCCV, and VV.† A glossary of vaccine abbreviations is provided at the end of the report.By 3-month birth cohorts born between 1 January 1998 and 31 December 2010. Coverage assessment date was 24 months after the last birth date of each cohort.Source: Australian Childhood Immunisation Register.
CDI Vol 38 No 3 2014 E217
Immunisation coverage, 2012 Annual report
24-month group (Figure 5). As for non-Indigenous children, coverage at 60 months of age increased following the change in due/overdue rules.
Although coverage at 12 months was lower among Indigenous children in all jurisdictions, the extent of the difference varied, reaching 15 and 11 per-centage point differentials in South Australia and Western Australia, respectively, but only a 0.4 percentage point differential in the Northern Territory (Table 7). By age 24 months, the coverage disparity between Indigenous and non-Indigenous children ranged from 5.5 percentage points higher in the Northern Territory and 6 percentage points lower in South Australia (Table 7).
Table 6: Vaccination coverage estimates, 2012, by age, vaccine and Indigenous status
Vaccine*Milestone
age IndigenousNon-
IndigenousDTPa 12 months† 85.7 92.5
24 months‡ 94.2 94.760 months§ 91.3 92.0
IPV 12 months† 85.7 92.524 months‡ 94.2 94.760 months§ 91.3 91.9
Hib 12 months† 85.7 92.424 months‡ 94.8 94.960 months§ N/I N/I
HepB 12 months† 85.6 92.124 months‡ 94.2 94.260 months§ N/I N/I
MMR 12 months† N/I N/I24 months‡ 94.3 93.960 months§ 91.7 91.8
VV 12 months† N/I N/I24 months‡ 82.2 84.560 months§ N/I N/I
MenCCV 12 months† N/I N/I24 months‡ 93.8 93.460 months§ N/I N/I
13vPCV 12 months† 85.5 91.224 months‡ N/I N/I60 months§ N/I N/I
Rotavirus 12 months† 70.3 84.224 months‡ N/I N/I60 months§ N/I N/I
* A glossary of vaccine abbreviations is provided at the end of the report.
† Birth cohort born 1 January 2011 – 31 December 2011‡ Birth cohort born 1 January 2010– 31 December 2010§ Birth cohort born 1 January 2007 – 31 December 2007N/I Not included in coverage estimates for that group.
Figure 4: Trends in vaccination coverage estimates for individual vaccines (DTPa, IPV, and MMR)*,† at 60 months of age (72 months prior to December 2007), Australia, 2002 to 2012
70
75
80
85
90
95
100
31 M
ar 0
2
30 S
ep 0
2
30 M
ar 0
3
30 S
ep 0
3
31 M
ar 0
4
30 S
ep 0
4
31 M
ar 0
5
30 S
ep 0
5
31 M
ar 0
6
30 S
ep 0
6
31 M
ar 0
7
30 S
ep 0
7
31 M
ar 0
8
30 S
ep 0
8
31 M
ar 0
9
30 S
ep 0
9
31 M
ar 1
0
30 S
ep 1
0
31 M
ar 1
1
30 S
ep 1
1
31 M
ar 1
2
30 S
ep 1
2
Cov
erag
e (%
)
Coverage assessment date for each cohort
DTPa at 72 moPolio at 72 moMMR at 72 moDTPa at 60 moPolio at 60 moMMR at 60 mo
Coverage algorithm changedto assess children at 5 years,not 6 years
* 4th dose of DTP and polio, 2nd dose of MMR.† A glossary of vaccine abbreviations is provided at the end
of the report.By 3-month birth cohorts born between 1 January 1996 and 31 December 2007. Coverage assessment date was 72 months after the last birth date of each cohort up to December 2007 and then 60 months after the last birth date of each cohort.Source: Australian Childhood Immunisation Register.
There was a marked increase in coverage for indi-vidual vaccines at 60 months of age following the change in the due/overdue rules in January 2009, with coverage increasing to levels similar to when coverage was assessed at 72 months of age (Figure 4). Coverage for all individual vaccines is at almost 92% in 2012, probably related, in part, to completed immunisation by 48 months of age being introduced in 2009 as a requirement for GP incentive payments.
Coverage estimates for Indigenous children
Unlike in previous years, immunisation coverage is now only lower for Indigenous children than non-Indigenous for the 12 months age group, with little or no difference at 24 and 60 months of age (Table 6). The coverage differential between Indigenous and non-Indigenous children for individual vaccines varies, with coverage at 24 months of age for most vaccines being almost identical for both groups and greater among Indigenous children for Hib, MMR and meningococcal C vaccines.
The proportion of Indigenous children ‘fully immunised’ by 24 months of age remained consist-ently higher than at 12 months and 60 months of age until 2012 where coverage for the 60-month age group rose to levels comparable with that for the

E218 CDI Vol 38 No 3 2014
Annual report Immunisation coverage, 2012
in South Australia to 7 percentage points higher in the Northern Territory, compared with non-Indigenous children (Table 7).
Coverage for National Immunisation Program vac-cines not routinely reported elsewhere
Pneumococcal conjugate vaccine and rotavirus vaccine
The 7-valent pneumococcal conjugate vaccine was first added to the NIP in January 2005 and was replaced in July 2011 by 13vPCV for all Australian children at 2, 4 and 6 months of age. Since cover-age was first calculated for this vaccine in early 2006, it has remained high, with a slight increase from 89% to 91.2% (Figure 2). Coverage is greater than the 1993 Immunise Australia Program tar-get of 90% in all jurisdictions except for Western Australia where it was 89.2% (Table 3).
Rotavirus vaccine was added to the NIP in July 2007, so coverage for 2 or 3 doses (depend-ing on vaccine) at 12 months of age could be calculated only from the December 2008 quarter onwards. Rotavirus coverage was lower nationally
Figure 5: Trends in ‘fully immunised’ vaccination coverage estimates for Indigenous children in Australia, 2002 to 2012, by age cohorts
70
75
80
85
90
95
100
31 M
ar 0
2
30 S
ep 0
2
30 M
ar 0
3
30 S
ep 0
3
31 M
ar 0
4
30 S
ep 0
4
31 M
ar 0
5
30 S
ep 0
5
31 M
ar 0
6
30 S
ep 0
6
31 M
ar 0
7
30 S
ep 0
7
31 M
ar 0
8
30 S
ep 0
8
31 M
ar 0
9
30 S
ep 0
9
31 M
ar 1
0
30 S
ep 1
0
31 M
ar 1
1
30 S
ep 1
1
31 M
ar 1
2
30 S
ep 1
2
Cov
erag
e (%
)
Coverage assessment date for each cohort
12 months24 months72 months60 months
Coverage algorithm changed to assess children at 60 months,
not 72 months
Table 7: Percentage of children fully immunised by 12 months, 24 months and 60 months of age, 2012, by Indigenous status and state or territory
State or territoryACT NSW NT Qld SA Tas. Vic. WA Aust.
12 months – fully immunised (%)*Indigenous 81.5 85.9 91.9 87.2 77.1 90.1 86.3 78.9 85.6Non-Indigenous 93.0 91.6 92.3 92.5 92.5 92.9 92.4 90.9 92.012 months – fully immunised (incl rotavirus & pneumococcal polysaccharide vaccine) (%)†
Indigenous 73.0 74.2 78.6 67.2 59.9 81.0 71.4 54.5 68.9Non-Indigenous 84.4 82.8 86.1 83.7 85.6 83.1 83.4 79.4 83.024 months – fully immunised (%)‡
Indigenous 91.6 91.8 96.9 93.0 86.7 93.9 90.2 89.4 92.1Non-Indigenous 93.1 92.3 92.2 92.6 92.6 94.1 93.2 90.5 92.5
24 months – fully immunised (incl varicella & Men C) (%)†
Indigenous 84.6 77.6 89.3 83.1 72.0 80.5 77.1 75.2 80.1
Non-Indigenous 86.7 81.2 82.0 85.8 82.7 84.7 82.7 79.8 82.6
60 months – fully immunised (%)§
Indigenous 91.0 91.4 93.9 92.0 85.7 93.1 92.4 86.9 91.0
Non-Indigenous 92.8 91.3 89.4 91.5 90.9 89.7 92.0 89.3 91.4
* ’Fully immunised’ – 3 doses of a diphtheria (D), tetanus (T) and pertussis-containing (P) vaccine, 3 doses of polio vaccine, 2 or 3 doses of PRP-OMP-containing Haemophilus influenzae type b (Hib) vaccine or 3 doses of any other Hib vaccine, and 2 or 3 doses of Comvax hepatitis B vaccine or 3 doses of any other hepatitis B vaccines.
† A glossary of vaccine abbreviations is provided at the end of the report.‡ ‘Fully immunised’ – 3 or 4 doses of a DTPa-containing vaccine, 3 doses of polio vaccine, 3 or 4 doses of PRP-OMP-
containing Hib vaccine or 4 doses of any other Hib vaccine, 3 or 4 doses of Comvax hepatitis B vaccine or 4 doses of all other hepatitis B vaccines, and 1 dose of a measles, mumps and rubella-containing (MMR) vaccine.
§ ‘Fully immunised’ – 4 or 5 doses of a DTPa-containing vaccine, 4 doses of polio vaccine, and 2 doses of an MMR-containing vaccine.
At 60 months of age, there was variation between individual jurisdictions, ranging from coverage 5 percentage points lower for Indigenous children

CDI Vol 38 No 3 2014 E219
Immunisation coverage, 2012 Annual report
(Figure 2), and had greater variation between jurisdictions compared with other vaccines given at 2, 4 and 6 months, which may be due to the strict upper age limits for this vaccine. Reported cover-age in 2012 for 2 doses of Rotarix® or 3 doses of Rotateq® vaccine at 12 months of age varied from 87.8% and 86.6% in Tasmania and the Northern Territory respectively (both Rotarix®) to 77.7% in Western Australia (Rotateq®) (Table 3).
Meningococcal C vaccine and varicella vaccine
Meningococcal C vaccine was added to the NIP in January 2003. Since coverage was first calculated for this vaccine in early 2006, it has remained at high levels with an increase over 2 years from 88% to almost 93.5% (Figure 3). There was little varia-tion in 2012 by jurisdiction with all jurisdictions experiencing coverage levels greater than 91% and some, the Northern Territory and Tasmania, approaching 95% (Table 4).
Varicella vaccine was added to the NIP in November 2005. Reported coverage for this vac-cine has consistently been 10–15 percentage points lower than that for all the other vaccines assessed at the 24-month milestone, being 84.4% for the latest assessment in 2012 (Figure 3). This is prob-ably partly due to the shorter time varicella has been on the NIP and the age of administration (18 months). The 18-month schedule point was historically associated with lower coverage when there was an 18-month pertussis booster prior to 2003. Between 2003 and 2005, there was a gap of over 2 years when no vaccine was administered at 18 months. Reported varicella vaccine coverage in 2012 also shows considerable variation by jurisdic-tion from 81.8% in Western Australia to 88.9% in the Australian Capital Territory (Table 4).
Due to the 18-month schedule point being histori-cally associated with lower coverage; there being only a 6-month time period to catch up for vari-cella vaccination, and that there is the possibility that parents may delay the varicella vaccination, we compared varicella coverage estimates assessed at 24 months to estimates assessed at 36 months by jurisdiction (Figure 6). The differences in the expected increases in coverage varied by jurisdiction from a 5.6 percentage points increase in Western Australia to a 2.6 percentage points increase in the Australian Capital Territory. Three jurisdictions reach 90% varicella coverage or very close to 90% when the vaccine is assessed at 36 months.
Data are also available from the ACIR on the num-ber of reports from GPs stating that children born since May 2004 have natural immunity to varicella and do not require varicella vaccination. Reports of natural immunity to varicella total greater than
27,810 since May 2004 (not shown), corresponding to approximately 1.1% of the cohort. It is likely that there is underreporting of presumed natural immunity by GPs but this is unlikely to fully account for lower varicella coverage.
Hepatitis A vaccine and 23-valent pneumococcal polysaccharide vaccine
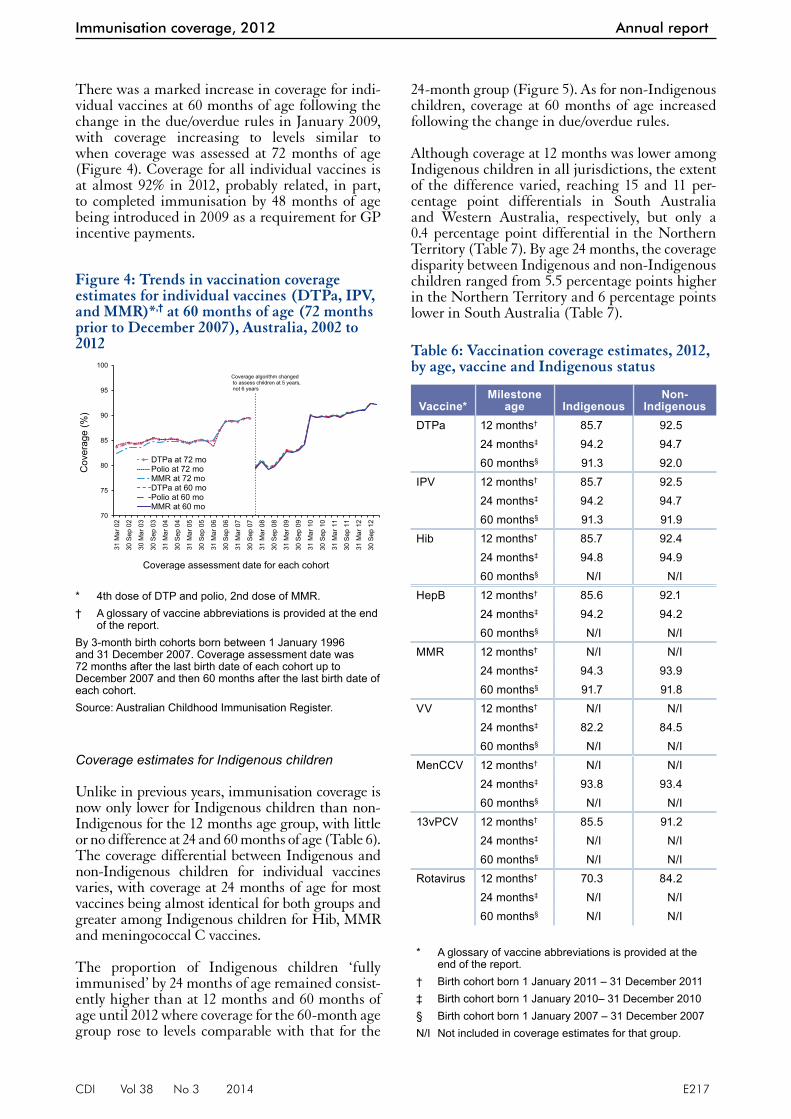
Hepatitis A vaccine was available in Australia prior to the development of the ACIR in 1996 and has been included on the NIP for Indigenous chil-dren in the Northern Territory, South Australia, Western Australia, and in Queensland since November 2005, but was used earlier than this in North Queensland. Since March 2007, coverage of 2 doses of hepatitis A vaccine for Indigenous children by 30 months of age in Western Australia and the Northern Territory and 36 months of age in Queensland and South Australia has increased from 58% to 60% in December 2012 (Figure 7). An additional 10% of children had received 1 dose of hepatitis A vaccine by 18 or 24 months of age, putting national coverage for at least 1 dose of hepatitis A vaccine for 2012 at 70.5% in Indigenous children compared to 60% for 2 doses (Table 8). There is a variation in reported hepatitis A vac-cine coverage by jurisdiction, from a low of 32% in South Australia to a high of 85.4% in the Northern Territory (Table 8).
The pneumococcal vaccine has been recom-mended and funded as a booster at 18–24 months of age since 2001for Indigenous children in 4 juris-dictions (the Northern Territory, South Australia, Western Australia, and Queensland). Coverage has gradually increased from 47% in March 2007 to 73% in December 2012 (Figure 7). From 2011 to
Figure 6: A comparison of coverage of varicella vaccine assessed in 2012 at 24 months of age versus 36 months of age, by state or territory, cohort born October to December 2009
87.3
83
85.9 85.8
82.183
84.2
79.6
83.5
89.9
87
89.8 90.3
87 86.788.3
85.2
87.9
60
65
70
75
80
85
90
95
100
ACT NSW NT Qld SA Tas. Vic. WA Aust.
Cov
erag
e (%
)
State or territory
24 months
36 months
E220 CDI Vol 38 No 3 2014
Annual report Immunisation coverage, 2012
2012, coverage increased by almost 10 percentage points. There is a large variation in pneumococ-cal vaccine coverage by jurisdiction from a low of 56.5% in South Australia to a high of 90.2% in the Northern Territory (Table 8).
Hepatitis B birth dose
Since 1999, coverage for the birth dose of hepatitis B vaccine has slowly decreased from 14.9% to 3.3% in 2012 (data not shown). It’s highly likely that these estimates are considerable underestimations of the true coverage figures with significant underreport-ing to the ACIR of the administration of the dose being the likely reason. A 2006 unpublished report found a minimum estimate for coverage of the birth dose of hepatitis B vaccine of 85%, based on provider-completed parent-held written records.30
Recommendation to give 1st dose of DTPa from 6 weeks of age and the 4th dose of DTPa from 3.5 years of age
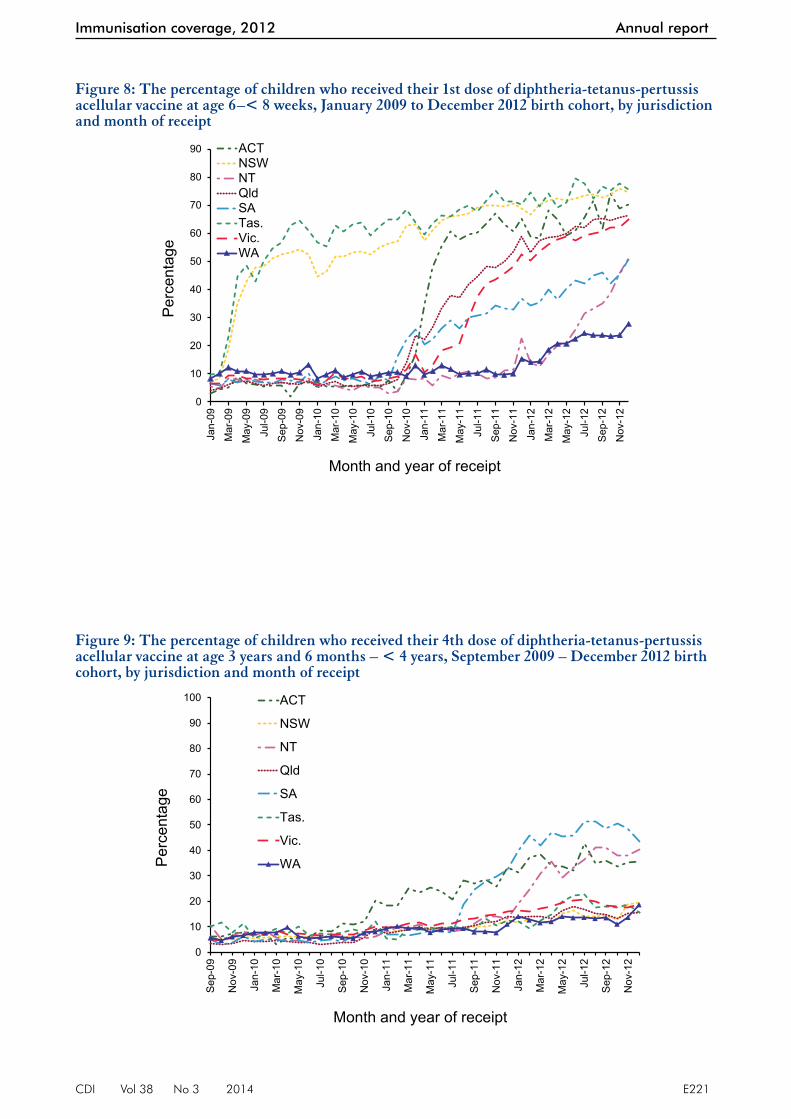
In response to a pertussis epidemic and to provide early protection to young infants, it was recom-mended by the ATAGI in March 2009, and pro-moted in that year during epidemics in New South Wales and Tasmania (later in other jurisdictions), that immunisation providers give the 1st dose of DTPa vaccine at 6 weeks of age instead of 8 weeks of age. Prior to this, very few children received the vaccine dose at less than 8 weeks of age, but for New South Wales, Tasmania and the Australian Capital Territory the percentage rose over the 3 years with more than 70% of children receiv-ing the dose prior to 8 weeks of age in December 2012 (Figure 8). By late 2012, this percentage was greater than 50% in all but 1 jurisdiction. Another change in DTPa vaccine scheduling occurred in October 2009 when the pre-school booster dose of DTPa-IPV was scheduled at 3.5–4 years instead of 4 years of age. This change in schedule took longer to take effect with no jurisdiction giving the vac-cine in great numbers at 3.5–4 years of age until November 2010 (Figure 9). As at December 2012, more than 30% of children in 3 jurisdictions were receiving the dose at 3.5–4 years of age, in South Australia and the 2 territories (Figure 9).
Timeliness of immunisation
Timeliness has been examined for vaccines requir-ing both multiple doses (DTPa, 13vPCV and MMR) and a single dose (MenCCV) at 12 and 24 months of age.
As demonstrated in previous studies, the propor-tion with vaccination delay increased with older age (Figure 10). The greatest proportion with any delay was seen with the 2nd dose of MMR vaccine with 57% of doses given late and 9% given more than 6 months late. This analysis is for doses due in 2010 allowing up to 3 years for capturing delayed doses, as explained in the methods. These figures are very similar to those in the 2011 report.
Table 8: Vaccination coverage* for hepatitis A (Indigenous only) and pneumococcal (Indigenous only), 2012, by state or territory†
Vaccine type‡
State or territory Hepatitis A§ Pneumococcal|| 13vPCV¶
NT 85.4 (92.7) 90.2 87.3Qld 58.2 (64.2) 73.0 70.5SA 32.2 (50.8) 56.5 41.3WA 56.8 (75.5) 66.3 55.3Aust. 60.1 (70.5) 73.1 67.6
* For the last 3-month cohorts assessable in 2012.† Northern Territory, Queensland, South Australia and
Western Australia only.‡ A glossary of vaccine abbreviations is provided at the
end of the report.§ Indigenous only: 2 doses by 30 months of age for
Western Australia and the Northern Territory (1 dose by 18 months of age), 2 doses by 36 months of age for Queensland and South Australia (1 dose by 24 months of age).
|| Indigenous only: 1 dose of 13vPCV (4th dose) or 23vPPV (1st dose) or 10vPCV (4th dose in the Northern Territory) by 36 months of age for Australia.
¶ Indigenous only: 1 dose of 13vPCV (4th dose) by 36 months of age for Australia.
Figure 7: Trends in coverage estimates for hepatitis A* and pneumococcal† vaccines for Indigenous children, Australia,‡ 2007 to 2012
0
10
20
30
40
50
60
70
80
90
100
Mar
-07
Jun-
07
Sep
-07
Dec
-07
Mar
-08
Jun-
08
Sep
-08
Dec
-08
Mar
-09
Jun-
09
Sep
-09
Dec
-09
Mar
-10
Jun-
10
Sep
-10
Dec
-10
Mar
-11
Jun-
11
Sep
-11
Dec
-11
Mar
-12
Jun-
12
Sep
-12
Dec
-12
Cov
erag
e (%
)
Month and year of assessment
Pneumococcal
Hepatitis A 13vPCV catch-upcampaign begun
* Two doses assessed at 30 months for Western Australia and the Northern Territory, 2 doses assessed at 36 months for Queensland and South Australia.
† 18-month dose assessed at 30 months of age.‡ Northern Territory, Queensland, South Australia and
Western Australia only.
CDI Vol 38 No 3 2014 E221
Immunisation coverage, 2012 Annual report
Figure 8: The percentage of children who received their 1st dose of diphtheria-tetanus-pertussis acellular vaccine at age 6–< 8 weeks, January 2009 to December 2012 birth cohort, by jurisdiction and month of receipt
0
10
20
30
40
50
60
70
80
90
Jan-
09
Mar
-09
May
-09
Jul-0
9
Sep
-09
Nov
-09
Jan-
10
Mar
-10
May
-10
Jul-1
0
Sep
-10
Nov
-10
Jan-
11
Mar
-11
May
-11
Jul-1
1
Sep
-11
Nov
-11
Jan-
12
Mar
-12
May
-12
Jul-1
2
Sep
-12
Nov
-12
Per
cent
age
Month and year of receipt
ACTNSWNTQldSATas.Vic.WA
Figure 9: The percentage of children who received their 4th dose of diphtheria-tetanus-pertussis acellular vaccine at age 3 years and 6 months – < 4 years, September 2009 – December 2012 birth cohort, by jurisdiction and month of receipt
0
10
20
30
40
50
60
70
80
90
100
Sep
-09
Nov
-09
Jan-
10
Mar
-10
May
-10
Jul-1
0
Sep
-10
Nov
-10
Jan-
11
Mar
-11
May
-11
Jul-1
1
Sep
-11
Nov
-11
Jan-
12
Mar
-12
May
-12
Jul-1
2
Sep
-12
Nov
-12
Per
cent
age
Month and year of receipt
ACT
NSW
NT
Qld
SA
Tas.
Vic.
WA

E222 CDI Vol 38 No 3 2014
Annual report Immunisation coverage, 2012
For the 3rd dose of DTPa, there was greater delay for Indigenous children than non-Indigenous children, with a 21.5% differential in on-time vac-cination at less than 7 months of age (Figure 11). The same pattern was found for timeliness of the 1st dose of MMR, but with a smaller differ-ential of 13% (Figure 12). Although Indigenous children had only slightly lower coverage than non-Indigenous children by 24 months of age, they were more likely to have delayed vaccination and this differential in on-time vaccination between Indigenous and non-Indigenous continues to be high (the corresponding differentials for the 3rd dose of DTPa and 1st dose of MMR from the 2011 report were 22% and 13%, respectively).
Vaccination with the 3rd dose of DTPa and the 1st dose of MMR was delayed by more than 1 month for 26%–38% of Indigenous children and 17%–26% of non-Indigenous children (Table 9). The proportion with long delays (i.e. greater than 6 months) was 2–4 times higher in Indigenous children than in non-Indigenous children, with greater differences for the 3rd dose of DTPa and for Indigenous children living in Major Cities and in Inner and Outer Regional areas. Delays of 1–6 months were also more frequent for Indigenous children, although less marked, espe-cially for the 1st dose of MMR. The proportion with short delays was greater among Indigenous children residing in Remote and Very Remote areas than in Major Cities for the 3rd dose of diphtheria-tetanus-pertussis vaccine (38% versus 26%), but not for the 1st dose of MMR.
Vaccination delay for Indigenous children by jurisdiction was measured for the 3rd dose of
13vPCV, with greater delays of 1–6 months in Western Australia (35.7%) and the Northern Territory (36.7%) (Figure 13). This is an improvement from 2011 where the correspond-ing figures were 40% and 37.1%, respectively. The proportion of Indigenous children with long delays increased substantially from 2011 in all jurisdictions with South Australia increas-ing from 6.2% to 9.8% and Western Australia increasing from 5.8% to 11.1%.
Figure 10: Vaccination delay for cohorts born in 2010 (DTPa3, MMR1, MenCCV1) and 2006 (MMR2*)
17.8
25.4 24.9
48.1
2.9
2.7 3.4
8.9
0
10
20
30
40
50
60
DTP3 MMR1 MENC1 MMR2
% w
ith d
elay
ed im
mun
isat
ions
Vaccine
> 6 mths after schedule point
1-6 mths after schedule point
* A glossary of vaccine abbreviations is provided at the end of the report.
Figure 11: Timeliness* of the 3rd dose of DTPa† vaccine (DTP3) for the cohort born in 2010, by Indigenous status
0
10
20
30
40
50
60
70
80
90
100
5 mths 6 mths 7 mths 8 mths 9 mths 10 mths 11 mths 12+ mths
Per
cent
age
cove
red
Age child received dose of DTP3
Non-Indigenous
Indigenous
21.5%
On time vaccination
* Percentage covered = number of children who received vaccine dose at particular ages/the total number of children who received the vaccine dose.
† A glossary of vaccine abbreviations is provided at the end of the report.
Figure 12: Timeliness* of the 1st dose of MMR† vaccine (MMR1) for the cohort born in 2010, by Indigenous status
0
10
20
30
40
50
60
70
80
90
100
11 mths 12 mths 13 mths 14 mths 15 mths 16 mths 17 mths 18+ mths
Per
cent
age
cove
red
Age child received dose of MMR1
Non-Indigenous
Indigenous13%
On time vaccination
* Percentage covered = number of children who received vaccine dose at particular ages/the total number of children who received the vaccine dose
† A glossary of vaccine abbreviations is provided at the end of the report.

CDI Vol 38 No 3 2014 E223
Immunisation coverage, 2012 Annual report
In contrast to the 3rd dose of DTPa and the 1st dose of MMR, analysis of timeliness of immu-nisation for a vaccine due at 48 months of age, the 2nd dose of MMR, showed a much smaller differ-ential in delay in receiving this vaccine between non-Indigenous children and Indigenous children, with a 5.3% differential at less than 49 months of age (Figure 14). However, timeli-ness for both groups was considerably improved from the previous report in 2011.
Trends in timeliness of the 3rd dose of pneumo-coccal vaccine and the 1st dose of MMR vaccine by Indigenous status are provided in Figures 15 and 16. Timeliness for the 3rd dose of pneumo-coccal vaccine improved marginally over time for non-Indigenous children; however no improve-ments were seen for Indigenous children. In con-trast, there were no noteworthy changes over time in timeliness of the 1st dose of MMR for either Indigenous or non-Indigenous children.
Table 9: Vaccination delay, by Indigenous and remoteness status for the cohort of children born in 2010 and assessed in 2012, Australia
Vaccine dose Indigenous status Remoteness
1–6 months after schedule point
%
> 6 months after schedule point
%Diphtheria-tetanus-pertussis acellular3
Indigenous Major Cities 26.4 10.4Inner and Outer Regional 30.6 10.9Remote and Very Remote 38.1 8.5
Non-Indigenous Major Cities 17.0 2.4Inner and Outer Regional 17.9 2.9Remote and Very Remote 17.0 2.4
Measles-mumps-rubella1 Indigenous Major Cities 33.7 7.8Inner and Outer Regional 34.7 6.3Remote and Very Remote 32.0 6.0
Non-Indigenous Major Cities 25.1 2.4Inner and Outer Regional 24.8 2.6Remote and Very Remote 26.3 2.2
* A glossary of vaccine abbreviations is provided at the end of the report.
Figure 13: Vaccination delay for Indigenous children for the 3rd dose of pneumococcal conjugate vaccine for the cohort born in 2010, by jurisdiction
27.5 27.9
36.731.3 32.0
28.831.8
35.7
5.57.3
6.5
8.29.8
4.17.2
11.1
0
10
20
30
40
50
60
ACT NSW NT Qld SA Tas. Vic. WA
% w
ith d
elay
ed im
mun
isat
ions
State or territory
> 6 months after schedule point
1-6 months after schedule point
Figure 14: Timeliness* of the 2nd dose of measles-mumps-rubella vaccine (MMR2) for the cohort born in 2006, by Indigenous status
0
10
20
30
40
50
60
70
80
90
100
< 47mths
47 mths 48 mths 49 mths 50 mths 51 mths 52 mths 53 mths 54 mths 55+mths
Per
cent
age
cove
red
Age child received dose of MMR2
Non-Indigenous
Indigenous
On time vaccination
* Percentage covered = number of children who received vaccine dose at particular ages/the total number of children who received the vaccine dose.
E224 CDI Vol 38 No 3 2014
Annual report Immunisation coverage, 2012
Objection to vaccination
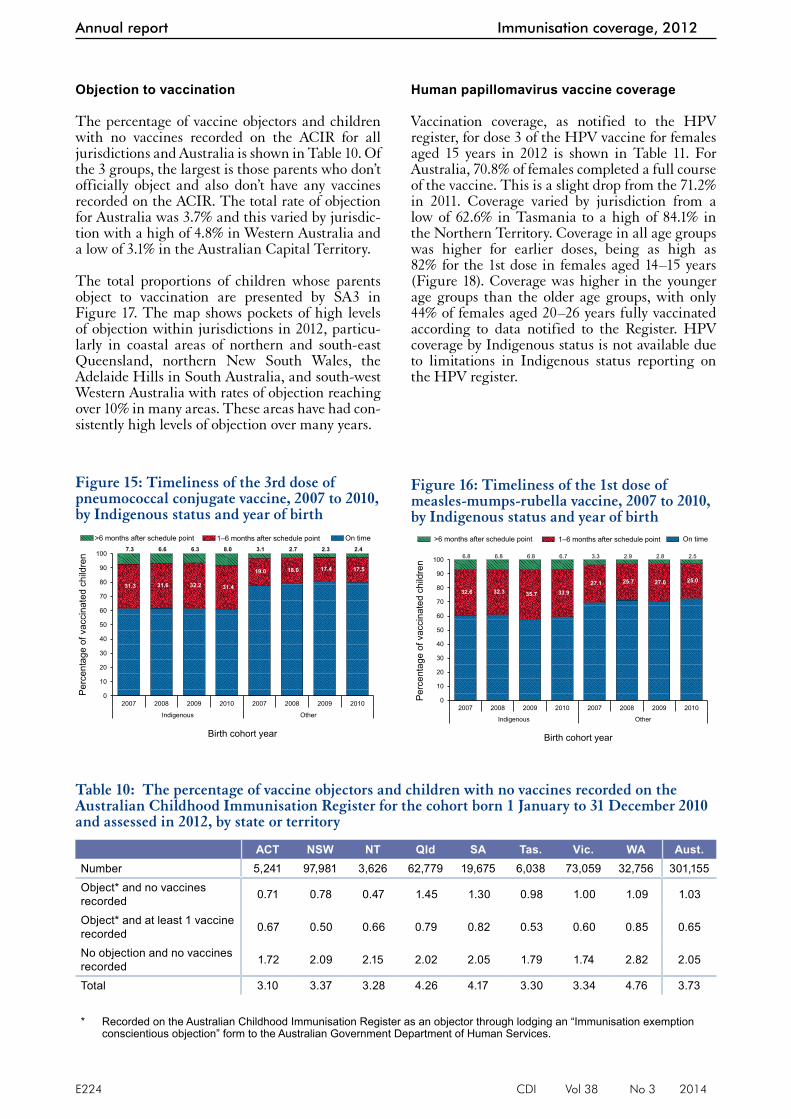
The percentage of vaccine objectors and children with no vaccines recorded on the ACIR for all jurisdictions and Australia is shown in Table 10. Of the 3 groups, the largest is those parents who don’t officially object and also don’t have any vaccines recorded on the ACIR. The total rate of objection for Australia was 3.7% and this varied by jurisdic-tion with a high of 4.8% in Western Australia and a low of 3.1% in the Australian Capital Territory.
The total proportions of children whose parents object to vaccination are presented by SA3 in Figure 17. The map shows pockets of high levels of objection within jurisdictions in 2012, particu-larly in coastal areas of northern and south-east Queensland, northern New South Wales, the Adelaide Hills in South Australia, and south-west Western Australia with rates of objection reaching over 10% in many areas. These areas have had con-sistently high levels of objection over many years.
Human papillomavirus vaccine coverage
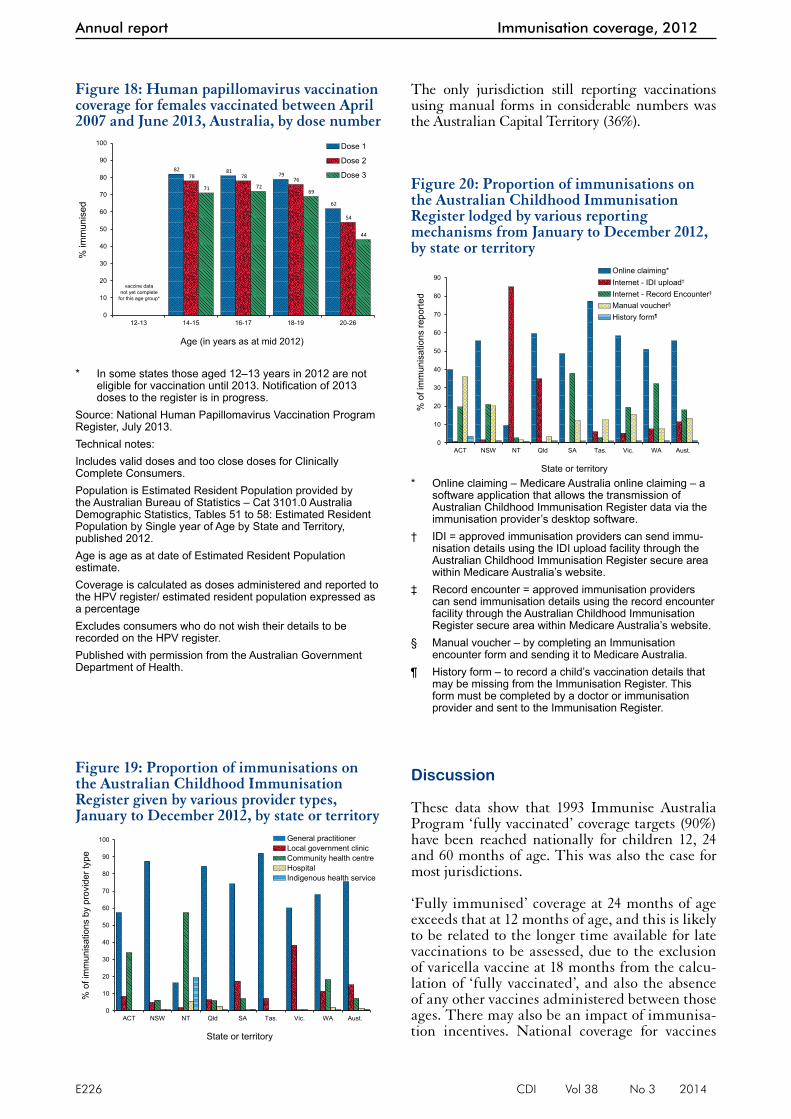
Vaccination coverage, as notified to the HPV register, for dose 3 of the HPV vaccine for females aged 15 years in 2012 is shown in Table 11. For Australia, 70.8% of females completed a full course of the vaccine. This is a slight drop from the 71.2% in 2011. Coverage varied by jurisdiction from a low of 62.6% in Tasmania to a high of 84.1% in the Northern Territory. Coverage in all age groups was higher for earlier doses, being as high as 82% for the 1st dose in females aged 14–15 years (Figure 18). Coverage was higher in the younger age groups than the older age groups, with only 44% of females aged 20–26 years fully vaccinated according to data notified to the Register. HPV coverage by Indigenous status is not available due to limitations in Indigenous status reporting on the HPV register.
Figure 15: Timeliness of the 3rd dose of pneumococcal conjugate vaccine, 2007 to 2010, by Indigenous status and year of birth
31.3 31.6 32.2 31.4
19.0 18.0 17.4 17.5
7.3 6.6 6.3 8.0 3.1 2.7 2.3 2.4
0
10
20
30
40
50
60
70
80
90
100
2007 2008 2009 2010 2007 2008 2009 2010
Indigenous Other
Per
cent
age
of v
acci
nate
d ch
ildre
n
Birth cohort year
>6 months after schedule point 1–6 months after schedule point On time
Figure 16: Timeliness of the 1st dose of measles-mumps-rubella vaccine, 2007 to 2010, by Indigenous status and year of birth
32.6 32.3 35.7 33.927.1 25.7 27.0 25.0
6.8 6.8 6.8 6.7 3.3 2.9 2.8 2.5
0
10
20
30
40
50
60
70
80
90
100
2007 2008 2009 2010 2007 2008 2009 2010
Indigenous Other
Per
cent
age
of v
acci
nate
d ch
ildre
n
Birth cohort year
>6 months after schedule point 1–6 months after schedule point On time
Table 10: The percentage of vaccine objectors and children with no vaccines recorded on the Australian Childhood Immunisation Register for the cohort born 1 January to 31 December 2010 and assessed in 2012, by state or territory
ACT NSW NT Qld SA Tas. Vic. WA Aust.Number 5,241 97,981 3,626 62,779 19,675 6,038 73,059 32,756 301,155Object* and no vaccines recorded 0.71 0.78 0.47 1.45 1.30 0.98 1.00 1.09 1.03
Object* and at least 1 vaccine recorded 0.67 0.50 0.66 0.79 0.82 0.53 0.60 0.85 0.65
No objection and no vaccines recorded 1.72 2.09 2.15 2.02 2.05 1.79 1.74 2.82 2.05
Total 3.10 3.37 3.28 4.26 4.17 3.30 3.34 4.76 3.73
* Recorded on the Australian Childhood Immunisation Register as an objector through lodging an “Immunisation exemption conscientious objection” form to the Australian Government Department of Human Services.

CDI Vol 38 No 3 2014 E225
Immunisation coverage, 2012 Annual report
Provider type
GPs administer the large majority of immunisa-tions in Australia (Figure 19) with the proportion given by GPs having increased by almost 5% over the past 11 years (data not shown). Local government clinics also administer a substantial proportion of immunisations, especially in some jurisdictions. The only other category of provider administering major numbers of immunisations nationally is community health centres. Regional differences are marked, with immunisations almost entirely administered by GPs in some jurisdictions (New South Wales, Queensland, South Australia, Tasmania and Western
Australia), while in others a majority are given by local government (Victoria) and community health clinics (the Northern Territory).
Mechanisms of reporting to the Australian Childhood Immunisation Register
The proportion of vaccinations on the ACIR lodged by the various reporting mechanisms available by jurisdiction is shown in Figure 20. The most com-mon method of reporting for all but 1 jurisdiction was through Online claiming. Almost 80% of vac-cinations given in Tasmania were reported through this method. In contrast, 85% of vaccinations given to children in the Northern Territory were reported using electronic data interchange via the Internet.
Figure 17: Proportion of total objectors to immunisation for the cohort born January 2010 to December 2010, Australia, 2012
% total objection10 to 14 (8)8 to 10 (12)6 to 8 (27)4 to 6 (101)0 to 4 (203)
Richmond Valley -Coastal - 13.6%
Nambour -Pomona - 10.9%
Tablelands (East) -Kuranda- 8.9%
Gold CoastHinterland- 9.0%
Creswick - DaylesfordBallan- 8.6%
Adelaide Hills - 8.7%
Mundaring- 10.9%
SOURCE: Australian Childhood Immunisation Register
Noosa - 10.1%
Fyshwick - PialligoHume- 10.0%Adelaide City -
10.3%
Fremantle- 10.9%
Table 11: Percentage of girls turning 15 years in 2011 and 2012 immunised for dose 3 of human papillomavirus vaccine, by state or territory
Year ACT NSW NT Qld. SA Tas. Vic. WA Australia2011 73.2 72.7 79.5 70.2 66.0 64 74.5 64.8 71.22012 74.0 70.7 84.1 68.7 70.1 62.6 73.6 69.9 70.8
Source: National Human Papillomavirus Vaccination Program Register, July 2013.Includes valid doses and too close doses for Clinically Complete Consumers.
E226 CDI Vol 38 No 3 2014
Annual report Immunisation coverage, 2012
The only jurisdiction still reporting vaccinations using manual forms in considerable numbers was the Australian Capital Territory (36%).
Discussion
These data show that 1993 Immunise Australia Program ‘fully vaccinated’ coverage targets (90%) have been reached nationally for children 12, 24 and 60 months of age. This was also the case for most jurisdictions.
‘Fully immunised’ coverage at 24 months of age exceeds that at 12 months of age, and this is likely to be related to the longer time available for late vaccinations to be assessed, due to the exclusion of varicella vaccine at 18 months from the calcu-lation of ‘fully vaccinated’, and also the absence of any other vaccines administered between those ages. There may also be an impact of immunisa-tion incentives. National coverage for vaccines
Figure 18: Human papillomavirus vaccination coverage for females vaccinated between April 2007 and June 2013, Australia, by dose number
82 81 79
62
78 78 76
54
71 7269
44
0
10
20
30
40
50
60
70
80
90
100
12-13 14-15 16-17 18-19 20-26
% im
mun
ised
Age (in years as at mid 2012)
Dose 1
Dose 2
Dose 3
vaccine datanot yet complete
for this age group*
* In some states those aged 12–13 years in 2012 are not eligible for vaccination until 2013. Notification of 2013 doses to the register is in progress.
Source: National Human Papillomavirus Vaccination Program Register, July 2013.Technical notes:Includes valid doses and too close doses for Clinically Complete Consumers.Population is Estimated Resident Population provided by the Australian Bureau of Statistics – Cat 3101.0 Australia Demographic Statistics, Tables 51 to 58: Estimated Resident Population by Single year of Age by State and Territory, published 2012.Age is age as at date of Estimated Resident Population estimate.Coverage is calculated as doses administered and reported to the HPV register/ estimated resident population expressed as a percentageExcludes consumers who do not wish their details to be recorded on the HPV register.Published with permission from the Australian Government Department of Health.
Figure 19: Proportion of immunisations on the Australian Childhood Immunisation Register given by various provider types, January to December 2012, by state or territory
0
10
20
30
40
50
60
70
80
90
100
ACT NSW NT Qld SA Tas. Vic. WA Aust.
% o
f im
mun
isat
ions
by
prov
ider
type
State or territory
General practitionerLocal government clinicCommunity health centreHospitalIndigenous health service
Figure 20: Proportion of immunisations on the Australian Childhood Immunisation Register lodged by various reporting mechanisms from January to December 2012, by state or territory
0
10
20
30
40
50
60
70
80
90
ACT NSW NT Qld SA Tas. Vic. WA Aust.
% o
f im
mun
isat
ions
repo
rted
State or territory
Online claiming*Internet - IDI upload†
Internet - Record Encounter‡
Manual voucher§
History form¶
* Online claiming – Medicare Australia online claiming – a software application that allows the transmission of Australian Childhood Immunisation Register data via the immunisation provider’s desktop software.
† IDI = approved immunisation providers can send immu-nisation details using the IDI upload facility through the Australian Childhood Immunisation Register secure area within Medicare Australia’s website.
‡ Record encounter = approved immunisation providers can send immunisation details using the record encounter facility through the Australian Childhood Immunisation Register secure area within Medicare Australia’s website.
§ Manual voucher – by completing an Immunisation encounter form and sending it to Medicare Australia.
¶ History form – to record a child’s vaccination details that may be missing from the Immunisation Register. This form must be completed by a doctor or immunisation provider and sent to the Immunisation Register.
CDI Vol 38 No 3 2014 E227
Immunisation coverage, 2012 Annual report
due at 48 months of age continued to improve during 2012 with coverage greater than 91% for all 4 cohorts. This increase is due to improved timeliness of vaccination, and is probably related to the change to the overdue rules in January 2009, where children became overdue for their pre-school boosters at 49 months of age instead of the previous 60 months. This change had an impact on eligibility for child care benefits for parents and outcome payments for providers. It was accompanied by a letter from Medicare Australia advising parents of the change, and the follow-up of overdue children by local health authorities.
There is earlier evidence that immunisation incen-tives to providers positively impacted on cover-age estimates.13 However, the initial analyses in this report provide no evidence of a reduction in coverage associated with the removal of Service Incentive Payments in October 2008, while cov-erage at 60 months has increased following the due and overdue rules changes. More analysis is required however, to examine the impact of these changes in more detail.
A number of vaccines that are included in the NIP are not included when calculating ‘fully immunised’ status or in eligibility for incentive payments. Coverage estimates for 13vPCV and meningococcal C vaccines are comparable with estimates for vaccines that are included in ‘fully vaccinated’ calculations, but estimates for varicella and rotavirus are still substantially lower. During 2012, there was only a small change in national coverage for varicella from 2011 (from 83.9% to 84.4%) and national coverage for rotavirus vaccine decreased marginally by 0.2 of a percentage point from 2011 (from 83.8% to 83.6%). However, when we assessed varicella coverage at 36 months of age instead of 24 months we observed higher estimates across all jurisdictions ranging from 2.6 to 5.6 per-centage points higher, suggesting many parents delay the administration of the varicella vaccine by more than 6 months. For rotavirus vaccines, strict upper age limits for administration may explain lower coverage when compared with other vac-cines assessed at 12 months of age, whilst varicella is the only vaccine due at 18 months, and this milestone was historically problematic and lapsed for a 2 year period (2003–2005) when there were no vaccines scheduled. The implications also vary. In the case of rotavirus vaccine, coverage of 80% or greater has been associated with substantial herd immunity and decreases in rotavirus hospitalisa-tions in Australia and elsewhere.31, 32 In contrast, modelling studies suggest that low coverage with varicella vaccine may result in a shift of disease to older age groups with higher disease severity.33 This will change from July 2013 with the inclusion
of 13vPCV, MenCCV, and varicella (as MMRV) in the algorithms used to calculate fully immunised coverage at 12 and 24 months of age.
Coverage for vaccines recommended for Indigenous children only (i.e. hepatitis A and a booster dose of pneumococcal vaccine) remained sub-optimal during 2012 but increased substantially from 2011 for the 23-valent pneumococcal polysaccharide vaccine (nationally, from 63% to 73%). This is likely due to the change in the pneumococcal vac-cine used as a booster dose in Indigenous children from 23vPPV to 13vPCV in October 2012 and the 13vPCV catch up program in 2011 that continued until September 2012. The extent of underreporting to the ACIR for these vaccines is unknown but may be more than for ‘universal’ vaccines, given the lack of incentive payments for notification to the ACIR. However, lower coverage for vaccines targeted at Indigenous people has been a relatively consist-ent finding using a range of different methods for both children14 and adults.34 Both a lack of provider knowledge about the recommendations for high risk groups, and poor identification of Indigenous children by immunisation providers are likely to be important contributing factors. Differences in schedules between jurisdictions may also contrib-ute. During 2012, coverage for both vaccines was much higher in the Northern Territory, which gives the vaccines at 6 months younger (Hepatitis A, 12 and 18 months, 23vPPV 18 months), than in South Australia and Queensland (18 and 24, and 24 months). However, coverage for both vac-cines in 2012 for Queensland was similar to that in Western Australia even though the vaccines are given 6 months later in Queensland. The presence of other vaccines on the schedule at the same age may assist achieving higher coverage at 12 months and 18 months of age. Failure to receive a 2nd dose by 10% of children also contributed to the low cov-erage for hepatitis A vaccine. However, a protective antibody response after 1 dose is expected from a majority of children.35
Although coverage data reveal that most children eventually complete the scheduled vaccination series by the 24-month milestone, many still do not do so in a timely manner. On-time vaccina-tion in 2012 as measured in this report for vaccines assessed at 12 and 24 months of age has improved only for the 3rd dose of pneumococcal vaccine assessed at 12 months of age. However, timeliness cannot be measured in the most recent cohort, as time must be allowed for late vaccination to be received. Poorer timeliness in Indigenous children has been noted previously in infants. Timeliness has continued to improve at 60 months of age for both Indigenous and non-Indigenous children. However, as coverage and timeliness of vac-cines assessed at 60 months of age has improved,

E228 CDI Vol 38 No 3 2014
Annual report Immunisation coverage, 2012
the disparity in timeliness between Indigenous and non-Indigenous children has increased, as improvements in non-Indigenous children were not fully duplicated in Indigenous children. Delayed vaccination is a concern, especially for diseases where multiple vaccine doses are required for protection and the disease risk among young infants is significant (e.g. pertussis). Immunisation at the earliest appropriate age should be a public health goal for countries such as Australia where high levels of vaccine coverage at milestone ages have been achieved.
The ACIR has shown the rapid uptake of new vaccines and consistently high coverage for all vaccines, unlike some other developed countries.36,
37 In comparison with similar countries, reported coverage at 12 months of age is higher,37 and, with almost 4% of children not vaccinated due to parental refusal, targeting of on-time vaccina-tion is required to significantly improve the cur-rent levels of greater than 91% ‘fully immunised’ at 12 months of age. Areas of low coverage have been identified in many remote areas and areas containing higher proportions of vaccine objectors. Further vaccination coverage estimates in small areas has been provided by the National Health Performance Authority for children in 2011–12.38
Coverage data for HPV from the national HPV register reflect a successful school-based program with lower coverage for the catch-up program.39,
40 Under-notification to the HPV register of doses administered in general practice and the community contributes to the apparently lower coverage in women currently aged over 20 years, with independent coverage estimates from popula-tion surveys in this age group suggesting under-notification of around 5%–15%.40, 41 The 10%–18% drop in coverage between dose 1 and 3 may also reflect under-notification of doses missed in school and caught up in general practice but not notified to the register, as well as demonstrating the chal-lenges in delivering a 3 dose vaccination course to adolescents.
Australia’s HPV vaccination program remains the most broadly targeted program in the world, with no other country having provided a free catch up program up to the age of 26 years. The coverage achieved in the program has been sufficient to result in demonstrable decreases in HPV preva-lence in young women,42 genital warts43 and cervi-cal abnormalities.44
Unfortunately, coverage data are not available for Indigenous adolescents. For adults, data are only available from the Aboriginal and Torres Strait Islander Health Survey, last conducted in 2004–05.45
Data provided in this report reflect continuing successful delivery of the NIP in Australia, while identifying some areas for improvement. Coverage for varicella and rotavirus vaccines is below that for other vaccines. Timeliness of vaccination could be improved, particularly for Indigenous infants, and coverage for vaccines recommended only for Indigenous infants is lower than for other vac-cines. From July 2013, varicella and other NIP vaccines (meningococcal C and pneumococcal conjugate vaccines) have been included in cover-age assessments for ‘fully immunised’, and thereby in eligibility for provider and parent incentives.46 It will be important to evaluate the impact of this change in coming years and given the encouraging improvements in timely coverage seen with the changes to reimbursement introduced in 2009 for the 48-month milestone, this promises to have a favourable impact. especially for varicella vaccine where high coverage is crucial to long-term out-comes of the program.
Author detailsBrynley Hull1Aditi Dey1
Rob Menzies1
Julia Brotherton2
Peter McIntyre1
1. National Centre for Immunisation Research and Surveillance of Vaccine Preventable Diseases, The Children’s Hospital at Westmead and University of Sydney, Westmead, New South Wales
2. Victorian Cytology Service Registries: (National HPV Vaccination Program Register and Victorian Cervical Cytology Registry), Carlton South, Victoria
Corresponding author: Mr Brynley Hull, National Centre for Immunisation Research and Surveillance of Vaccine Preventable Diseases, The Children’s Hospital at Westmead and University of Sydney, Locked Bag 4001, WESTMEAD NSW 2145. Email: [email protected]

CDI Vol 38 No 3 2014 E229
Immunisation coverage, 2012 Annual report
Abbreviations
7vPCV 7-valent pneumococcal conjugate vaccine
10vPCV 10-valent pneumococcal conjugate vaccine
13vPCV 13-valent pneumococcal conjugate vaccine
23vPPV 23-valent pneumococcal polysaccharide vaccine
ABS Australian Bureau of Statistics
ACIR Australian Childhood Immunisation Register
ARIA Accessibility/Remoteness Index of Australia
ATAGI Australian Technical Advisory Group on Immunisation
DTP diphtheria-tetanus-pertussis
DTPa Diphtheria-tetanus-pertussis (acellular) vaccine
dTpa Adolescent/adult diphtheria-tetanus-pertussis (acellular) vaccine
GP general practitioner
GPII General Practice Immunisation Incentives Scheme
HepA hepatitis A virus
HepB hepatitis B virus
Hib Haemophilus influenzae type b
HPV human papillomavirus vaccine
IPV inactivated poliovirus vaccine
MenC meningococcal serogroup C
MenCCV meningococcal C conjugate vaccine
MIA Maternity Immunisation Allowance
MMR measles-mumps-rubella
MMRV measles-mumps-rubella-varicella
NIP National Immunisation Program
PRP-OMP Haemophilus influenzae type b polysaccharide conjugated to the outer membrane protein of Neisseria meningitidis vaccine
SA3 Australian Bureau of Statistics Statistical Area 3
VV Varicella vaccine
WPV whole-patient equivalent

E230 CDI Vol 38 No 3 2014
Annual report Immunisation coverage, 2012
References1. Hull B, Deeks S, Menzies R, McIntyre P. Immunisation
coverage annual report, 2007. Commun Dis Intell 2009;33(2):170–187.
2. Hull B, Mahajan D, Dey A, Menzies RI, McIntyre PB. Immunisation coverage annual report, 2008. Commun Dis Intell 2010;34(3):241–258.
3. Hull B, Dey A, Mahajan D, Menzies RI, McIntyre PB. Immunisation coverage annual report, 2009. Commun Dis Intell 2011;35(2):132–148.
4. Hull B, Dey A, Menzies RI, McIntyre PB. Immunisation coverage annual report, 2011. Commun Dis Intell 2013;37(4):22.
5. Hull BP, McIntyre PB, Heath TC, Sayer GP. Measuring immunisation coverage in Australia. A review of the Australian Childhood Immunisation Register. Aust Fam Physician1999;28(1):55–60.
6. Hull BP, McIntyre PB. Immunisation coverage reporting through the Australian Childhood Immunisation Register – an evaluation of the third-dose assumption. Aust N Z J Public Health 2000;24(1):17–21.
7. Hull BP, McIntyre PB, Sayer GP. Factors associated with low uptake of measles and pertussis vaccines – an ecologic study based on the Australian Childhood Immunisation Register. Aust N Z J Public Health 2001;25(5):405–410.
8. Hull B, Lawrence G, MacIntyre CR, McIntyre P. Immunisation coverage: Australia 2001. Canberra: Commonwealth Department of Health and Ageing; 2002.
9. Hull BP, Lawrence GL, MacIntyre CR, McIntyre PB. Estimating immunisation coverage: is the ‘third dose assumption’ still valid? Commun Dis Intell 2003;27(3):357–361.
10. Hull BP, Lawrence GL, MacIntyre CR, McIntyre PB. Is low immunisation coverage in inner urban areas of Australia due to low uptake or poor notification? Aust Fam Physician2003;32(12):1041–1043.
11. Hull BP, Lawrence GL, MacIntyre CR, McIntyre PB. Immunisation coverage in Australia corrected for under-reporting to the Australian Childhood Immunisation Register. Aust N Z J Public Health 2003;27(5):533–538.
12. Hull BP, McIntyre PB, Couzos S. Evaluation of immunisa-tion coverage for Aboriginal and Torres Strait Islander children using the Australian Childhood Immunisation Register. Aust N Z J Public Health 2004;28(1):47–52.
13. Lawrence GL, MacIntyre CR, Hull BP, McIntyre PB. Effectiveness of the linkage of child care and mater-nity payments to childhood immunisation. Vaccine 2004;22(17–18):2345–2350.
14. Hull BP, McIntyre PB. What do we know about 7vPCV coverage in Aboriginal and Torres Strait Islander chil-dren? Commun Dis Intell 2004;28(2):238–243.
15. Lawrence GL, Hull BP, MacIntyre CR, McIntyre PB. Reasons for incomplete immunisation among Australian children. A national survey of parents. Aust Fam Physician2004;33(7):568–571.
16. Hull BP, McIntyre PB. Timeliness of childhood immunisa-tion in Australia. Vaccine 2006;24(20):4403–4408.
17. Hull BP, Deeks S, Menzies R, McIntyre PB. What do we know about 7vPCV coverage in Aboriginal and Torres Strait islander children? A 2007 update. Commun Dis Intell 2008;32(2):257–260.
18. Hull BP, Deeks SL, McIntyre PB. The Australian Childhood Immunisation Register—A model for universal immuni-sation registers? Vaccine 2009;27(37):5054–5060.
19. Hull B, Dey A, Menzies RI, McIntyre PB. Immunisation coverage annual report, 2010. Commun Dis Intell 2013;37(1):19.
20. Australilan Government Department of Health and Ageing. The Australian Immunisation Handbook.10th edn. Canberra: Australian Government Department of Health and Ageing; 2013.
21. O’Brien ED, Sam GA, Mead C. Methodology for meas-uring Australia’s childhood immunisation coverage. Commun Dis Intell 1998;22(3):36–37.
22. Australian Population and Migration Research Centre. Accessibility/Remoteness Index of Australia (ARIA+). [online] 2011. Accessed on 20 November 2013. Available from: http://www.adelaide.edu.au/apmrc/research/projects/category/aria.html
23. Rank C, Menzies RI. How reliable are Australian Childhood Immunisation Register coverage estimates for indigenous children? An assessment of data quality and coverage. Commun Dis Intell 2007;31(3):283–287.
24. Australian Bureau of Statistics. Australian Statistical Geography Standard (ASGS). 2011. Accessed on. Available from: http://www.abs.gov.au/websitedbs/d3310114.nsf/home/australian+statistical+geography+standard+%28asgs%29
25. MapInfo. MapInfo version 12.5 [computer program]. Connecticut: Pitney Bowes Software Inc.; 2014.
26. Australian Bureau of Statistics. Australian Statistical Geography Standard (ASGS): Correspondences, July 2011. [online]. Accessed on 21 November 2013. Available from: http://www.abs.gov.au/AUSSTATS/[email protected]/Lookup/1270.0.55.006Main+Features1July%202011?OpenDocument
27. Gertig DM, Brotherton JM, Saville M. Measuring human papillomavirus (HPV) vaccination coverage and the role of the National HPV Vaccination Program Register, Australia. Sex Health 2011;8(2):171–178.
28. Australian Government Department of Health. Human Papillomavirus (HPV). 2013. Accessed on 21 November 2013. Available from: http://www.immunise.health.gov.au/internet/immunise/publishing.nsf/Content/immunise-hpv
29. Australian Institute of Health and Welfare. 2009 Adult Vaccination Survey: summary results. 2011. Accessed on 21 November 2013. Available from: http://www.aihw.gov.au/publication-detail/?id=10737418409
30. Lawrence G HB, McIntyre P. Monitoring immunisa-tion coverage: Australia 2005. National Centre For Immunisation Research and Surveillance; 2006. p. 84.
31. Buttery JP, Lambert SB, Grimwood K, Nissen MD, Field EJ, Macartney KK, et al. Reduction in rotavirus-associated acute gastroenteritis following introduction of rotavirus vaccine into Australia’s National Childhood vaccine schedule. Pediatr Infect Dis J 2011;30(1 Suppl):S25–S29.
32. Dey A, Wang H, Menzies R, Macartney K. Changes in hospitalisations for acute gastroenteritis in Australia after the national rotavirus vaccination program. Med J Aust 2012;197(8):453–457.
33. Brisson M, Edmunds W, Gay N, Law B, De Serres G. Modelling the impact of immunization on the epi-demiology of varicella zoster virus. Epidemiol Infect 2000;125(3):651–669.

CDI Vol 38 No 3 2014 E231
Immunisation coverage, 2012 Annual report
34. Menzies R, Turnour C, Chiu C, McIntyre P. Vaccine pre-ventable diseases and vaccination coverage in Aboriginal and Torres Strait Islander people, Australia 2003 to 2006. Commun Dis Intell 2008;32(Suppl):S2–S67.
35. Plotkin S, Orenstein WA, Offit PA. Vaccines 5th edn. Elsevier; 2008.
36. National, state, and local area vaccination coverage among children aged 19–35 months—United States, 2012. MMWR Morb Mortal Wkly Rep 2013;62(36):733–740.
37. Health and Social Care Information Centre. NHS Immunisation Statistics England 2012–13. England; 2013.
38. National Health Performance Authority. Healthy Communities: Immunisation rates for children on 2011–12. Sydney, Australia; 2013.
39. Ward KF, Menzies RI, Quinn HE, Campbell-Lloyd S. School-based vaccination in NSW. N S W Public Health Bull 2010;21(9–10):237–242.
40. Brotherton J, Gertig D, Chappell G, Rowlands L, Saville M. Catching up with the catch-up: HPV vaccination coverage data for Australian women aged 18–26 years from the National HPV Vaccination Program Register. Commun Dis Intell 2011;35(2):197–201.
41. Brotherton JM, Mullins RM. Will vaccinated women attend cervical screening? A population based survey of human papillomavirus vaccination and cervical screen-ing among young women in Victoria, Australia. Cancer Epidemiol 2012;36(3):298–302.
42. Tabrizi SN, Brotherton JM, Kaldor JM, Skinner SR, Cummins E, Liu B, et al. Fall in human papillomavirus prevalence following a national vaccination program. J Infect Dis 2012;206(11):1645–1651.
43. Ali H, Donovan B, Wand H, Read TR, Regan DG, Grulich AE, et al. Genital warts in young Australians five years into national human papillomavirus vac-cination programme: national surveillance data. BMJ 2013;346:f2032.
44. Brotherton JM, Fridman M, May CL, Chappell G, Saville AM, Gertig DM. Early effect of the HPV vaccination programme on cervical abnormalities in Victoria, Australia: an ecological study. Lancet 2011;377(9783):2085–2092.
45. Australian Bureau of Statistics. National Aboriginal and Torres Strait Islander Health Survey, 2004–05. Canberra; 2006.
46. Department of Health. Immunise Australia Program. 2013. Accessed on 5 December 2013. Available from: http://www.health.gov.au/internet/immunise/publish-ing.nsf/Content/home