immunization and vaccine development (ivd) searo · bangladesh 1668 0 1607 97 176 71 71 1368 0 9...
TRANSCRIPT

Immunization and Vaccine
Development (IVD) SEARO
Protecting People from Vaccine Preventable Diseases
Monthly Vaccine Preventable Disease and
Immunization Update
Published: December 10, 2015

Last wild poliovirus case by type, SEAR
*Dots are randomly placed within blocks (Sub-districts)
WPV Type 2
District: Aligarh
State: Uttar Pradesh (India)
Date of onset: 24-Oct-1999
WPV Type 3
District: Pakur
State: Jharkhand (India)
Date of onset: 22-Oct-2010
WPV Type 1
District: Howrah
State: West Bengal (India)
Date of onset: 13-Jan-2011
Country Year
Bangladesh 2006
Bhutan 1986
DPR Korea 1996
India 2011
Indonesia 2006
Maldives 1994
Myanmar 2007
Nepal 2010
Sri Lanka 1993
Thailand 1997
Timor-Leste 1995
Last wild poliovirus
case by country
Data as of 07 Dec 2015

% Adequate Stool Specimen Collection Non-polio AFP Rate
The boundaries and names shown and the designations used on this map do not imply the expression of any opinion whatsoever on the part of
the World Health Organization concerning the legal status of any country, territory, city or area or of its authorities, or concerning the delimitation
of its frontiers or boundaries. Dotted lines on maps represent approximate border lines for which there may not yet be full agreement.
© WHO 2015. All rights reserved
< 1
1 – 1.99
>2
No Non-Polio AFP Case
< 60%
60% – 79%
> 80%
No AFP Case
AFP Surveillance Indicators by First Administrative Level*, 2015
Total AFP Cases = 45428
Non-Polio AFP Rate =7.49
Adequate Stool specimen = 86%
Countries reporting AFP cases= 10 (91%)
*Bhutan, Maldives & Timor-Leste by country
Data as of 07 Dec 2015

4
Non-polio AFP Cases by Month of Onset
SEAR, 2011-2015 Month 2011 2012 2013 2014 2015
Jan 4598 4994 4560 4451 4080
Feb 3863 4483 4016 3990 3721
Mar 4344 4586 4279 4185 3658
Apr 4302 4727 4305 4018 3486
May 4874 5486 4430 4500 3745
Jun 5387 5449 5035 5149 4056
Jul 6175 5959 5832 5518 4033
Aug 7000 7564 5940 6414 4862
Sep 7308 7888 6034 6122 4890
Oct 6255 5709 5282 5086 4199
Nov 5793 4785 5171 4952 1148
Dec 5370 4382 4534 4095
Total 65269 66012 59418 58480 41878
Data as of 07 Dec 2015

5
0
0.5
1
1.5
2
2.5
3
3.5
4
4.5
5
5.5
6
BAN BHU DPRK IND INO MAV MMR NEP SRL THA TLS
No
n-P
olio
AF
P R
ate
2011 2012 2013 2014 2015
Non-polio AFP Rate*
SEAR, 2011–2015
* Number of discarded AFP cases per 100,000 children under 15 years of age
SEAR Minimum Target
and above ~~~~~~~~
9.62
13.49 13.94
12.48 6.12
12.50
Data as of 07 Dec 2015

6
Percent Adequate Stool Specimen Collection*
SEAR, 2011-2015
0
20
40
60
80
100
BAN BHU DPRK IND INO MAV MMR NEP SRL THA TLS
2011 2012 2013 2014 2015
Minimum Target
Perc
en
t
*Percentage with 2 specimens 24 hours apart and within 14 days of paralysis onset.
Data as of 07 Dec 2015

7
N=
794
N=
838
N=
30571
N=
964
N=
145
N=
291
N=
76
N=
909
N=
35175
N=
931
N=
170
N=
277
N=
103
Percent of Non-Polio AFP Cases Under Immunized for OPV
(6 Months to 5 Yrs), SEAR, 2011-2015
N=
862
N=
33691
N=
987
N=
164
N=
303
N=
100
N=
28997
N=
898
N=
158
N=
236
N=
80
N=
759
N=
20922
N=
521
N=
76
N=
164
N=
51
Data as of 07 Dec 2015

8
Total AFP Cases = 42132
Non-Polio AFP Rate =9.62
Adequate Stool specimen = 86%
Districts reporting AFP cases= 630 (93%)
* Number of discarded AFP cases per 100,000 children under 15 years of age (annualized by week 49, 2015)
** Percentage with 2 specimens 24 hours apart and within 14 days of paralysis onset.
Note: Some AFP cases may still be pending final classification.
Adequate Stool
Specimen Collection
< 60%
60% – 79%
> 80%
No AFP Case
Non-Polio AFP Rate
< 1
1 – 1.99
>2
No Non-Polio AFP Case
AFP Surveillance Indicators by District
India, 2015
Non-polio AFP Rate* Percent Adequate Stool
Specimen Collection **
Data as of 07 Dec 2015

9
Non-polio AFP Cases by Month of Onset
India, 2011-2015 Month 2011 2012 2013 2014 2015
Jan 4241 4599 4132 4110 3752
Feb 3538 4113 3644 3657 3451
Mar 3983 4170 3885 3781 3315
Apr 3926 4262 3864 3621 3206
May 4462 5001 4007 4042 3405
Jun 4978 4988 4622 4683 3708
Jul 5692 5452 5385 5168 3782
Aug 6582 7119 5555 6035 4527
Sep 6852 7386 5590 5747 4603
Oct 5800 5282 4888 4711 3925
Nov 5400 4455 4777 4565 1101
Dec 5024 4063 4245 3790
Total 60478 60890 54594 53910 38775
Data as of 07 Dec 2015
10
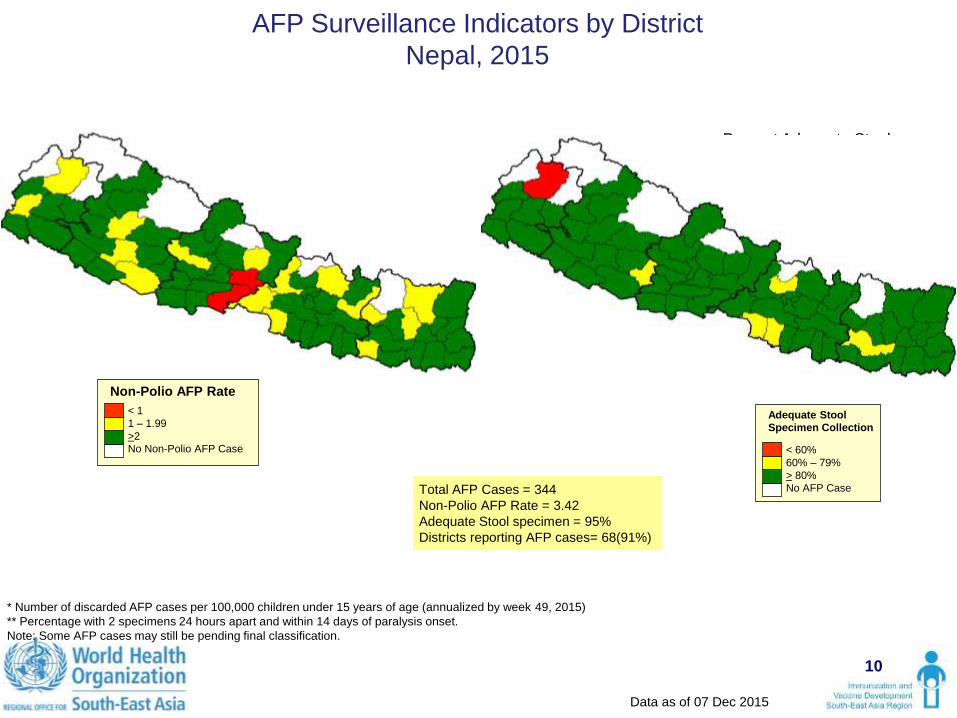
AFP Surveillance Indicators by District
Nepal, 2015
Total AFP Cases = 344
Non-Polio AFP Rate = 3.42
Adequate Stool specimen = 95%
Districts reporting AFP cases= 68(91%)
* Number of discarded AFP cases per 100,000 children under 15 years of age (annualized by week 49, 2015)
** Percentage with 2 specimens 24 hours apart and within 14 days of paralysis onset.
Note: Some AFP cases may still be pending final classification.
Non-polio AFP Rate* Percent Adequate Stool
Specimen Collection **
Adequate Stool
Specimen Collection
< 60%
60% – 79%
> 80%
No AFP Case
Non-Polio AFP Rate
< 1
1 – 1.99
>2
No Non-Polio AFP Case
Data as of 07 Dec 2015

11
Non-polio AFP Cases by Month of Onset
Nepal, 2011-2015 Month 2011 2012 2013 2014 2015
Jan 43 50 32 50 32
Feb 21 51 41 48 30
Mar 42 47 61 40 45
Apr 46 51 56 31 25
May 49 61 49 41 19
Jun 44 69 57 42 37
Jul 59 70 65 47 36
Aug 64 92 63 38 37
Sep 63 69 47 40 34
Oct 43 37 30 37 25
Nov 48 22 37 38 2
Dec 46 21 38 34
Total 568 640 576 486 322
Data as of 07 Dec 2015

12
AFP Surveillance Indicators by Province
Myanmar, 2015
Total AFP Cases = 261
Non-Polio AFP Rate =1.65
Adequate Stool specimen = 92%
Provinces reporting AFP cases= 17 (94%)
* Number of discarded AFP cases per 100,000 children under 15 years of age (annualized by week 49, 2015)
** Percentage with 2 specimens 24 hours apart and within 14 days of paralysis onset.
Note: Some AFP cases may still be pending final classification.
Non-polio AFP Rate* Percent Adequate Stool
Specimen Collection **
Adequate Stool
Specimen Collection
< 60%
60% – 79%
> 80%
No AFP Case Non-Polio AFP Rate
< 1
1 – 1.99
>2
No Non-Polio AFP Case
Data as of 07 Dec 2015

13
Non-polio AFP Cases by Month of Onset
Myanmar, 2011-2015
Month 2011 2012 2013 2014 2015
Jan 27 18 32 41 21
Feb 29 9 13 24 19
Mar 24 11 16 19 16
Apr 21 22 20 22 14
May 33 35 18 38 27
Jun 36 42 27 38 18
Jul 41 44 34 39 26
Aug 39 58 36 47 32
Sep 53 96 27 42 32
Oct 52 64 49 29 13
Nov 38 33 63 24
Dec 25 24 69 26
Total 418 456 404 389 218
Data as of 07 Dec 2015

14
AFP Surveillance Indicators by District
Bangladesh, 2015
Total AFP Cases = 1266
Non-Polio AFP Rate =2.65
Adequate Stool specimen = 97%
Districts reporting AFP cases= 64 (100%)
Non-polio AFP Rate* Percent Adequate Stool Specimen
Collection **
Adequate Stool
Specimen Collection
< 60%
60% – 79%
> 80%
No AFP Case
Non-Polio AFP Rate
< 1
1 – 1.99
>2
No Non-Polio AFP Case
* Number of discarded AFP cases per 100,000 children under 15 years of age (annualized by week 49, 2015)
** Percentage with 2 specimens 24 hours apart and within 14 days of paralysis onset.
Note: Some AFP cases may still be pending final classification.
Data as of 07 Dec 2015

15
Non-polio AFP Cases by Month of Onset
Bangladesh, 2011-2015 Month 2011 2012 2013 2014 2015
Jan 130 122 155 73 87
Feb 109 112 110 69 100
Mar 105 135 107 115 127
Apr 127 168 125 130 121
May 155 140 148 169 167
Jun 151 145 149 198 134
Jul 183 146 134 154 107
Aug 159 114 116 168 139
Sep 154 153 125 117 97
Oct 142 128 95 102 133
Nov 92 120 94 104 35
Dec 103 84 54 79
Total 1610 1567 1412 1478 1247
Data as of 07 Dec 2015

16
AFP Surveillance Indicators by Province
Indonesia, 2015
Total AFP Cases = 1097
Non-Polio AFP Rate = 1.61
Adequate Stool specimen = 93%
Provinces reporting AFP cases= 31 (91%)
Non-polio AFP Rate*
* Number of discarded AFP cases per 100,000 children under 15 years of age (annualized by week 49, 2015)
** Percentage with 2 specimens 24 hours apart and within 14 days of paralysis onset.
Note: Some AFP cases may still be pending final classification.
Percent Adequate Stool Specimen Collection **
Adequate Stool
Specimen Collection
< 60%
60% – 79%
> 80%
No AFP Case
Non-Polio AFP Rate
< 1
1 – 1.99
>2
No Non-Polio AFP Case
Data as of 07 Dec 2015

17
Non-polio AFP Cases by Month of Onset
Indonesia, 2011-2015 Month 2011 2012 2013 2014 2015
Jan 118 164 169 135 151
Feb 125 160 181 149 108
Mar 160 174 174 198 118
Apr 153 200 195 184 98
May 130 203 163 172 98
Jun 140 164 144 155 120
Jul 160 200 166 66 48
Aug 114 129 131 87 97
Sep 137 139 205 158 101
Oct 178 147 182 165 98
Nov 171 114 158 170 6
Dec 134 157 94 125
Total 1720 1951 1962 1764 1043
Data as of 07 Dec 2015

18
AFP Surveillance Indicators by Province
Thailand, 2015
Total AFP Cases = 154
Non-Polio AFP Rate = 1.08
Adequate Stool specimen = 68%
Provinces reporting AFP cases= 61 (79%)
Annualized Non-polio AFP Rate*
* Number of discarded AFP cases per 100,000 children under 15 years of age (annualized by week 49, 2015)
** Percentage with 2 specimens 24 hours apart and within 14 days of paralysis onset.
Note: Some AFP cases may still be pending final classification.
Percent Adequate Stool Specimen Collection **
Adequate Stool
Specimen Collection
< 60%
60% – 79%
> 80%
No AFP Case
Non-Polio AFP Rate
< 1
1 – 1.99
>2
No Non-Polio AFP Case
Data as of 07 Dec 2015

19
Non-polio AFP Cases by Month of Onset
Thailand, 2011-2015 Month 2011 2012 2013 2014 2015
Jan 17 22 19 24 14
Feb 18 24 20 25 5
Mar 13 25 24 12 12
Apr 13 7 22 16 16
May 26 20 19 17 16
Jun 17 15 17 18 17
Jul 26 30 27 27 15
Aug 22 30 19 18 11
Sep 24 30 18 11 13
Oct 27 37 16 19 2
Nov 22 27 18 25
Dec 24 22 16 26
Total 249 289 235 238 121
Data as of 07 Dec 2015

VPD Reporting, 2014
Data as of 31 May 2015
# O
utb
rea
ks
# C
ase
s
# O
utb
rea
ks
# C
ase
s
# O
utb
rea
ks
# C
ase
s
Bangladesh 1668 0 1607 97 176 71 71 1368 0 9 178 11 166 2 31 105 13 12 NR 3490 15-Apr-15 12 100 100
Bhutan 69 0 69 0 4 0 0 0 0 0 0 0 0 0 0 0 0 0 35 18 18-Mar-15 12 75 75
DPR Korea 11 0 11 0 0 0 0 0 0 0 0 0 0 0 0 0 0 0 0 0 13-Mar-14 12 8 8
India 54193 110 NR NR NR 1693 1013 34818 101 768 26113 110 4993 17 614 NR NR NR NR NR 19-Jun-15 12 8 0
Indonesia 12943 7 5719 1471 713 173 108 2104 21 80 803 7 69 3 13 75 421 NR NR NR 20-Apr-15 12 83 17
Maldives 0 0 9 0 0 0 0 0 0 0 0 0 0 0 0 0 0 0 0 3 15-Jan-15 12 42 25
Myanmar 242 0 242 8 24 7 7 236 0 3 102 1 5 0 0 32 35 3 0 34 20-Mar-15 12 83 75
Nepal 350 1 292 9 14 2 2 18 0 0 0 0 0 0 0 7 NR NR 1423 19 12-Feb-15 12 100 75
Sri Lanka 3117 0 2123 1560 10 1 1 10 0 0 0 1 10 0 0 0 0 81 191 6957 17-Mar-15 12 100 100
Thailand 1191 0 427 70 19 0 0 0 0 0 0 0 0 0 0 2 17 14 589 NR 22-Jan-15 12 83 25
Timor-Leste 47 1 40 25 1 2 2 33 1 2 20 0 0 0 0 1 2 3 6 3 23-Jan-15 12 8 0
Total 73831 119 10539 3240 961 1949 1204 38587 123 862 27216 130 5243 22 658 222 488 113 2244 105241 At least 5 blood samples should be collected and tested from each outbreak. 2 Adverse Events Follow ing Immunization; Sri Lanka AEFI data do not reflect cases but events. 3 Monthly VPD and AEFI reports due to SEARO/IVD on or before 15th of each month. NR=No report
Date
of
last
rep
ort
# r
ep
ort
s e
xp
ecte
d
% C
om
ple
ten
ess
% T
imeli
ness
Neonata
l T
eta
nus
Dip
hth
eria
Pert
ussis
Encephalitis
Nu
mb
er
of
Cases o
f
AE
FI
2
Number of Cases
Country
Routine Reporting of clinically
suspected measles cases
Suspected measles
outbreaksLaboratory Confirmed1
# R
ub
ella
+ve
# O
utb
rea
ks
# O
utb
rea
ks
Inve
stig
ate
d
# C
ase
s
# D
ea
ths
Rubella
Outbreaks
Mixed
Outbreaks
# C
ase
s
# D
ea
ths
# T
este
d fo
r
se
rolo
gy
# M
ea
sle
s +
ve
Measles
Outbreaks

VPD Reporting, 2015
Data as of 31 October 2015
# O
utb
rea
ks
# C
ase
s
# O
utb
rea
ks
# C
ase
s
# O
utb
rea
ks
# C
ase
s
Bangladesh 2115 0 2072 110 117 63 63 835 0 4 78 3 48 2 5 81 2 9 0 1871 12-Nov-15 10 100 100
Bhutan 63 0 63 2 0 0 0 0 0 0 0 0 0 0 0 0 0 1 0 5 08-Oct-15 10 60 60
DPR Korea 124 0 0 0 0 0 0 0 0 0 0 0 0 0 0 0 0 0 0 0 30-Nov-15 10 30 0
India 52060 170 NR NR NR 1817 954 22562 113 633 15574 77 2208 27 629 NR NR NR NR NR 20-Oct-15 10 50 10
Indonesia 6143 6 2937 499 527 45 22 719 0 15 227 6 108 1 4 51 236 NR NR NR 20-Nov-15 10 100 10
Maldives 10 0 10 0 2 0 0 0 0 0 0 0 0 0 0 0 0 0 0 0 12-Nov-15 10 60 40
Myanmar 206 0 206 3 28 1 1 13 0 0 0 0 0 0 0 21 71 5 0 143 09-Nov-15 10 100 80
Nepal 251 3 149 23 5 8 8 260 1 5 213 0 0 0 0 6 NR NR 788 3 20-Nov-15 10 100 90
Sri Lanka 2256 0 1673 1223 8 1 1 53 0 1 53 0 0 0 0 0 0 92 146 8393 13-Nov-15 10 100 100
Thailand 381 0 381 18 29 6 6 55 0 9 9 2 35 0 0 0 12 31 437 NR 28-Sep-15 10 40 20
Timor-Leste 42 0 28 6 4 0 0 0 0 0 0 0 0 0 0 1 1 3 2 1 21-Sep-15 10 20 0
Total 63651 179 7519 1884 720 1941 1055 24497 114 667 16154 88 2399 30 638 160 322 141 1373 104161 At least 5 blood samples should be collected and tested from each outbreak. 2 Adverse Events Follow ing Immunization; Sri Lanka AEFI data do not reflect cases but events. 3 Monthly VPD and AEFI reports due to SEARO/IVD on or before 15th of each month. NR=No report
Rubella
Outbreaks
Mixed
Outbreaks
Neonata
l T
eta
nus
Dip
hth
eria
Pert
ussis
Encephalitis
Date
of
last
rep
ort
# r
ep
ort
s e
xp
ecte
d
% C
om
ple
ten
ess
% T
imeli
ness
Number of Cases
Nu
mb
er
of
Cases o
f
AE
FI
2
# O
utb
rea
ks
Country
Routine Reporting of clinically
suspected measles cases
Suspected measles
outbreaksLaboratory Confirmed1
# O
utb
rea
ks
Inve
stig
ate
d
# C
ase
s
# D
ea
ths
Measles
Outbreaks
# C
ase
s
# D
ea
ths
# T
este
d fo
r
se
rolo
gy
# M
ea
sle
s +
ve
# R
ub
ella
+ve

Measles and Rubella Serology (IgM), 2014
Data as of 31 January 2015
# % # %
Bangladesh Dhaka 2051 1992 143 7.2 221 12.0 99.6
Bhutan Thimphu 69 61 0 0.0 4 6.6 77.0
DPR Korea Pyongyang 55 55 2 3.6 0 0.0 100.0
Ahmedabad 468 468 306 65.4 25 15.4 99.6
Bengaluru 528 381 258 67.7 27 22.0 93.7
Bhopal 212 212 134 63.2 21 26.9 63.7
Chennai 796 263 150 57.0 20 17.7 86.7
Guw ahati 74 74 28 37.8 32 69.6 95.9
Hyderabad 138 138 103 74.6 3 8.6 95.7
Jaipur 289 289 205 70.9 17 20.2 95.2
Kolkata 1386 1386 752 54.3 281 44.3 0.0
Lucknow 683 623 496 79.6 15 11.8 62.8
Patna 171 171 117 68.4 11 20.4 66.7
Pune 889 869 570 65.6 38 12.7 91.6
5634 4874 3119 64.0 490 27.9 60.8
Bandung 902 902 369 40.9 231 43.3 96.1
Jakarta 4083 4027 1558 38.7 531 21.5 65.7
Surabaya 2860 2857 1718 60.1 189 16.6 44.5
Yogyakarta 2643 2643 661 25.0 394 19.9 58.3
10488 10429 4306 41.3 1345 22.0 60.6
Maldives Male 695 695 0 0.0 3 0.4 100.0
Myanmar Yangon 282 282 24 8.5 29 11.2 83.3
Nepal Kathmandu 328 328 8 2.4 15 4.7 97.3
Sri Lanka Colombo 2080 2054 1496 72.8 10 1.8 86.8
Thailand Bangkok 147 147 12 8.2 8 5.9 100.0
Timor-Leste Dilli NR NR NR NR NR NR NR
21829 20917 9110 43.6 2125 18.0 69.6
Source: Reported by SEAR Measles Laboratory Netw ork NR=No Report
1 To be reported w ithin 4 days in 2014 - in transition state
Indonesia Total
TOTAL
Measles +ve Rubella +ve
India
India Total
Indonesia
Country LaboratoriesNumber of Serum
Samples ReceivedNumber Tested
Results
% Results Reported within 7
Days 1

Measles and Rubella Serology (IgM), 2015
Data as of 31 October 2015
# % # %
Bangladesh Dhaka 2411 2411 137 5.7 133 5.8 92.3
Bhutan Thimphu 69 73 2 2.7 0 0.0 94.5
DPR Korea Pyongyang NR NR NR NR NR NR NR
Ahmedabad 437 437 300 68.6 48 35.0 99.8
Bengaluru 486 409 166 40.6 117 48.1 100.0
Bhopal 256 256 198 77.3 11 19.0 96.1
Chandigarh 116 115 83 72.2 15 46.9 93.0
Chennai 803 194 103 53.1 22 24.2 79.4
Delhi 372 369 245 66.4 23 18.5 74.3
Guw ahati 260 201 152 75.6 11 22.4 97.0
Hyderabad 48 48 24 50.0 12 50.0 100.0
Jaipur 364 364 255 70.1 25 22.9 98.1
Kolkata 1135 1135 673 59.3 191 41.3 57.8
Lucknow 2336 2088 1485 71.1 96 15.9 69.2
Patna 605 600 397 66.2 31 15.3 86.7
Pune 624 518 320 61.8 40 20.2 89.6
7842 6734 4401 65.4 642 27.5 78.9
Bandung 1492 1136 367 32.3 477 62.0 91.5
Jakarta 3485 2178 574 26.4 472 29.4 74.5
Surabaya 2161 1427 585 41.0 204 24.2 61.0
Yogyakarta 2793 1452 143 9.8 415 31.7 79.1
9931 6193 1669 26.9 1568 34.7 75.6
Maldives Male 10 10 0 0.0 2 20.0 100.0
Myanmar Yangon 210 210 4 1.9 29 14.1 94.3
Nepal Kathmandu 380 380 86 22.6 16 5.4 98.4
Sri Lanka Colombo 2011 1647 1207 73.3 7 1.6 91.2
Thailand Bangkok 170 169 6 3.6 15 9.2 100.0
Timor-Leste Dilli NR NR NR NR NR NR NR
23034 17827 7512 42.1 2412 23.4 81.6
Source: Reported by SEAR Measles Laboratory Netw ork NR=No Report
1 To be reported w ithin 4 days from 2014 - in transition state
Indonesia
Indonesia Total
TOTAL
Measles +ve Rubella +ve
India
India Total
Country LaboratoriesNumber of Serum
Samples ReceivedNumber Tested
Results
% Measles Results
Reported within 4 Days 1