impact analysis of the greensboro coliseum complex for the...
TRANSCRIPT

Regional Dynamics & Economic Modeling Laboratory
Impact Analysis of the Greensboro Coliseum Complex for the 2012 Operating Year
On
Greensboro & Guilford County, North Carolina and the Surrounding Area
Robert T. Carey, Ph.D.
August 23, 2013
Phone: 864-656-4700 http://sti.clemson.edu
Strom Thurmond Institute Clemson University
Perimeter Road Clemson, SC 29634-0125

Strom Thurmond Institute
The views presented here are those of the author(s) and are not necessarily those of the Strom Thurmond Institute
(STI) or of Clemson University. Nothing in this report should be construed to indicate endorsement by STI or by
Clemson University. STI is the university’s premiere public policy research institute, serving business, government,
and community constituents, supporting interdisciplinary graduate education and providing objective research and
outreach in economic and regional development and natural resource areas. STI is a nonprofit, nonpartisan, tax-
exempt policy research organization and is a unit of the Clemson University Office of Economic Development.

Strom Thurmond Institute
Economic Impact of The Greensboro Coliseum—i
The Greensboro Coliseum Complex includes six
separate facilities, including the Coliseum, which
is the nation’s largest single-seat arena, with a
seating capacity of 23,500. The Complex also in-
cludes the War Memorial Auditorium (2,400
seats), the Odeon Theater (300 seats), the Special
Events Center (167,000 square feet), the Pavilion
(30,000 square feet), and the recently-completed
Greensboro Aquatic Center (GAC).
The Complex impacts the
local economy in two ways:
operational spending, in-
cluding capital expenditures
and wages paid to employ-
ees, and spending by visi-
tors to the Greensboro re-
gion attending events at the
Complex on food, fuel, re-
tail, and lodging. This eco-
nomic activity generates
impacts in the broader econ-
omy that include “spillover” effects, generating
jobs and income for retail, service, and other
workers in the region. This economic activity in
turn affects local (county and municipal) govern-
ment revenues. This model seeks to quantify these
impacts for the 2012 operating year. Findings in-
clude:
The Coliseum Complex, including the GAC,
generated an estimated 1,021 jobs in Guilford
County from its operational spending, 996 of
which are predicted to be located in Greensbo-
ro. Operational spending at
the GAC alone created an
estimated 74 jobs in Guil-
ford County in 2012, all of
which are predicted to be
located in Greensboro; this
includes the 70 full and
part-time workers directly
employed by the GAC.
“Non-local” visitors to
events at the Coliseum, in-
cluding the GAC, generated
between 418-718 estimated
jobs in the county (230-395 in Greensboro).
Jobs created by visitors to events at the GAC
alone ranged between 141-150 (including 78-
83 jobs in Greensboro).
The estimated total combined impact from op-
erations and visitors are presented in tables S-
1 (showing the estimates for the City of
Greensboro alone) and S-2 (showing the esti-
mates for Guilford County as a whole, includ-
ing Greensboro).
Local (county and municipal) governments in
Executive Summary
Entire Complex Low Estimate High Estimate
Employment 1,226 1,391
Output (Total Impact) $26,588,500 $35,503,500
Net Local Government Revenue $1,601,900 $2,182,200
GAC Only Low Estimate High Estimate
Employment 152 157
Output (Total Impact) $4,979,900 $5,256,900
Net Local Government Revenue $362,300 $450,600
City of Greensboro, 2012
Table S-1. Estimated Total Impact from Coliseum Complex
Entire Complex Low Estimate High Estimate
Employment 1,439 1,739
Output (Total Impact) $48,342,700 $64,551,800
Net Local Government Revenue $2,836,400 $3,614,800
GAC Only Low Estimate High Estimate
Employment 215 224
Output (Total Impact) $9,054,300 $9,557,900
Net Local Government Revenue $617,700 $646,100
Table S-2. Estimated Total Impact from Coliseum Complex Guilford County (incl. Greensboro), 2012

Strom Thurmond Institute
Economic Impact of The Greensboro Coliseum—ii
Guilford County realized a positive estimated
net impact on revenues of between $2.8-$3.6
million from the Coliseum, including opera-
tional and visitor spend-
ing, in 2012. Of this, ap-
proximately $1.6-$2.2
million is predicted to
have been realized by
the municipal govern-
ment of Greensboro.
The impact from the
Coliseum spills over to the remainder of the
state as well as Guilford and the surrounding
counties. The total impact of Complex to the
state of North Carolina as a whole is reported
in Table S-3.
The impact of overnight
visitor spending for the
2013 Atlantic Coast Confer-
ence Men’s Basketball
Tournament was estimated
as an addendum to this
study. These estimates are
presented in Table S-4.
The impact from capital spending at the Com-
plex in the years 2010-11 and projected 2013-
14 was also estimated. Results are presented in
Table S-5. Note that 2012 capital expenditures
were significantly less than in the years shown
in the table; 2012 capital spending was there-
fore included in the operational spending im-
pact models included in tables S-1 and S-2.
Concept County Total Greensboro
Employment 62 34
Output (Total Impact) $3,612,100 $1,986,600
Net Local Government Revenue $267,000 $222,500
Table S-4. Estimated Overnight Visitor Impact
2013 ACC Tournament, Guilford County
Concept 2010 2011 2013 2014
Employment 35 24 33 26
Output (Total Impact) $3,364,400 $2,348,500 $3,293,800 $2,586,500
Net Local Government Revenue $192,900 $124,400 $184,300 $140,200
Table S-5. Estimated Impact of Capital Exp.
City of Greensboro (2010-11 in nomial dollars, 2013-14 in current 2012 dollars)
Concept Low Estimate High Estimate
Employment 1,824 2,206
Output (Total Impact) $90,455,745 $121,213,912
Net Local Government Revenue $5,560,679 $7,337,313
Net State Government Revenue $5,970,400 $7,944,700
Table S-3. Total Coliseum Impact
State of North Carolina, 2012

Strom Thurmond Institute
Table of Contents
Executive Summary……………………………………………………..……........…....….. i
I. Introduction…………………………………………………………………………...….. 1
II. The Model………………….…………………………………………………………..... 1
III. Results—Operations & Capital Expenditures..........................................................….... 2
A. Coliseum Complex (including GAC)………………………………...………..... 2
B. Aquatic Center Only………………………………..………………...…..…...… 2
IV. Results—Visitor Spending………………………...............................................…….... 3
A. Coliseum Complex (including GAC)………………………………...………..... 3
B. Aquatic Center Only………………………………..………………...…..…...… 4
V. Combined Impacts..……..………………………...….………………………….…........ 4
VI. Conclusion.……………..………………………...….……………...……….….…........ 5
VII. Addenda…………………………………………………………………….………….. 5
A. The 2013 ACC Basketball Tournament………………………………….……… 5
B. Capital Spending Projects (2010-2014)…………………….……..…….….....… 5
Appendix I—Impact Estimates, Guilford/Greensboro........................................................... 7
Appendix II—Impact Estimates, Greensboro & Winston-Salem MSAs.............................. 10
Appendix III—Gross Local Government Revenue Detail……............................................ 12


Strom Thurmond Institute
Economic Impact of The Greensboro Coliseum—1
I. Introduction
The City of Greensboro, North Carolina and the
Greensboro War Memorial Commission requested
the Regional Dynamics & Economic Modeling La-
boratory at the Strom Thurmond Institute, Clemson
University to estimate the economic and fiscal im-
pact that the Greensboro Coliseum Complex has on
the city of Greensboro and Guilford County.
The Greensboro Coliseum Complex, located within
the city of Greensboro, includes six separate facili-
ties, including the Coliseum, which is the nation’s
largest single-seat arena, with a seating capacity of
23,500. The Complex also includes the War Memori-
al Auditorium (2,400 seats), the Odeon Theater (300
seats), the Special Events Center (167,000 square
feet), the Pavilion (30,000 square feet), and the re-
cently-completed Greensboro Aquatic Center.
II. The Model
In estimating the impact of operations, capital invest-
ment, and visitor spending associated with the
Greensboro Coliseum Complex, the Regional Dy-
namics & Economic Modeling Laboratory utilized
the input-output (I/O) function of the Regional Dy-
namics (REDYN) eco-
nomic modeling en-
gine. REDYN is one of
the largest computer
models of the United
States economy ever
built. The REDYN
model forecasts a base-
line level of activity
within over 800 Stand-
ard Occupation Classi-
fications (SOC) and
703 North American Industry Classification System
(NAICS) sectors. It also considers distance-to-market
and transportation costs in determining the supply
and demand of commodities across geographic re-
gions. Changes to employment, income, or demand
for products or services by either the private or the
public sector can be input to the model. Based on
these inputs, the REDYN model generates a county
level estimate of the resultant variation from the pro-
jected baseline, as well as the effects on every indus-
try.
Impacts were estimated using data provided by the
client for the 2012 operational year. Data include an-
nual operational expenditures including wage bill
(with fringes), number of employees, and capital ex-
penditures. The data provided were stated in terms of
the Coliseum’s fiscal year, which begins July 1 and
ends June 30. For modeling purposes, however, they
are treated and presented as calendar year 2012.
In addition to operational data, visitation data were
provided by the client for estimating the impact of
visitor spending on the region. Visitor data include
room nights associated with events at the Complex
(provided by the Greensboro Convention and Visi-
tor’s Bureau) and total attendance at events.
Results from the model reported in the following are
the estimated impact that the Coliseum Complex had
on overall economic activity and local government
revenues during 2012. These impacts include direct,
indirect, and induced effects. Direct impacts are the
jobs, wages, and output that are directly attributable
to the facility; direct impacts are essentially the in-
puts to the model listed
in Table 1. Indirect
impacts are the jobs,
wages, and output at-
tributable to the facili-
ty’s suppliers, includ-
ing vendors and con-
tractors. Induced ef-
fects are the jobs and
income created in the
broader economy
through spending of
wage income by the workers employed by the Coli-
seum and its suppliers.
Impacts are reported using the following metrics:
· Employment is the number of jobs or job
equivalents created by the Complex and visi-
tor spending through direct, indirect, and
Coliseum (including GAC)
Employment (FT & PT) 961
Operational Spending (including wages) $20,958,220
Capital Expenditures $210,616
Aquatic Center
Employment (FT & PT) 70
Operational Spending (including wages) $999,220
Capital Expenditures $116,620
Table 1. Operations Model Inputs, 2012

Strom Thurmond Institute
Economic Impact of The Greensboro Coliseum—2
induced effects.
· Disposable income is the aggregated
household income, less taxes, for all
households within the county. Disposable
income is primarily wage-driven, but also
includes income from dividends, interest, and
rent.
· Output or total impact, is the dollar value of
all goods and services produced within the
county within a given year. This is broader
than but roughly equivalent to regional GDP.
· Net local government revenue is revenue
collected by local (county and municipal)
governments from all sources, including
taxes, licensing, fees, and intergovernmental
transfer, less expenses.
· Net state government revenue is revenue col-
lected by state government from all sources,
less expenses. State and local government
revenue and expense data in the model are
based on the U.S. Census of Governments.
III. Results—Operations
& Capital Expenditures
These models estimate the impact that the Coliseum
Complex had on the region through normal opera-
tional expenditure, including wages paid to full and
part-time employees, and payments to vendors. The
Greensboro Aquatic Center (GAC), for which FY
2012 was the first full year of operation, is also mod-
eled separately from the remainder of the complex.
Detailed tables showing impact estimates for Greens-
boro, Guilford County, and the surrounding counties
are included in the Appendix.
A. Coliseum Complex (Including GAC)
The Complex (including the GAC) employed 961
full and part-time workers, including full and part-
time workers employed by the security contractor
and the food services contractor. The model esti-
mates that the total employment impact to Guilford
County from Coliseum operations was 1,021 jobs,
996 of which are predicted to be in Greensboro. The
impact on disposable income is estimated to be $8.6
million countywide, including over $4.7 million in
income to households in Greensboro. Total impact
on output is projected to be nearly $25.8 million for
the county, of which $14.2 million is output within
the city of Greensboro. The output multiplier—the
ratio of direct operational spending to total impact—
for the Complex is approximately 1.16; in other
words, every $1,000 spent by the Coliseum on opera-
tions generates an additional $160 of output in Guil-
ford County.
Coliseum operations also impact state and local gov-
ernment revenues. Economic activity of any kind
generates both costs and revenue for governments.
The revenue sources are obvious: local sales taxes,
property taxes resulting from the appreciation of
property values associated with new business activi-
ty, licenses and fees, and payments to utilities. How-
ever, economic activity also creates additional de-
mands on government services, such as public safety,
codes enforcement, and roads and other infrastruc-
ture. Local governments within the county are esti-
mated to net close to $1.3 million in revenues from
the economic activity generated by Complex opera-
tions, including approximately $675,000 in net reve-
nues to Greensboro city government. North Carolina
state government is estimated to net $3.3 million in
revenues.
B. Aquatic Center Only
The GAC employed 70 full and part-time workers in
2012. GAC operations generate a total estimated jobs
impact of 74 jobs in Guilford County, all of which
are projected to be located in Greensboro. These jobs
create just over $500,000 in additional disposable
income for households in the county, of which
$278,000 is projected to remain with households in
Greensboro; this distribution is largely due to some
of the individuals who may work in Greensboro not
residing in the city. The total economic impact on
output is estimated to exceed $1.3 million for Guil-
ford County, of which nearly $735,000 is produced
by businesses in Greensboro. The output multiplier
for the GAC is approximately 1.20; in other words,

Strom Thurmond Institute
Economic Impact of The Greensboro Coliseum—3
every $1,000 spent by the GAC on operations is esti-
mated to generate an additional $200 of output in
Guilford County.
The net impact projected from GAC operations indi-
cates that additions to revenue exceed additional
costs for local governments countywide by nearly
$74,000, including an estimated net positive return to
Greensboro city government of nearly $41,000.
North Carolina state government likewise enjoys a
net positive return of $196,700 from spillover effects
in Guilford County and its surrounding counties, in-
cluding spillovers into the remainder of the state.
IV. Results—Visitor Spending
Visitors to events at the Coliseum Complex are as-
sumed to spend money on food, retail, lodging, and
fuel. Visitation data are presented in Table 2. Data on
the number of visitors lodging overnight are based
upon room-night data provided by the Greensboro
Convention and Visitor’s Bureau (CVB). The num-
ber of persons per room for GAC events was as-
sumed to average 3.53. Events at the remaining Coli-
seum facilities was estimated to average 2.83 persons
per room. Hotel room rates are the average of a sam-
pling of room rates within a five-mile radius of the
Coliseum; this averages to $87.50 per room per
night.
In addition to hotel costs, visitors lodging overnight
are assumed to consume three meals over the course
of their stay. Food and retail costs are based upon
federal per-diem rates published by the U.S. General
Services Administration for Greensboro, except that,
for the sake of conservatism, the lunch rate of $13
per person was used for dinner rather than the $29
allowed by the per diem rate.
Twenty-five percent of overnight visitors are as-
sumed to purchase $40 worth of gasoline
(approximately one full tank at current prices as of
the writing of this report) within the county.
In addition to overnight visitors indicated by CVB
room-night data, 50 percent of remaining patrons are
assumed to be day visitors from outside of Guilford
County. These visitors are assumed to consume
lunch and to purchase retail ($5 per person per day,
as allowed by the federal per diem rate) within the
county during their visit. Further, 20 percent of day
visitors (i.e. 10 percent of total non-overnight pa-
trons) are assumed to purchase $40 worth of gasoline
in the county. Patrons to the Coliseum who are
“local” to the Greensboro/Guilford County area
are excluded from the study as they can be pre-
sumed to engage in spending in the region inde-
pendent of their attendance of Coliseum events.
For both the GAC and the remainder of the Coli-
seum, a “low” estimate of visitor spending impact
was modeled using only overnight visitors and a
“high” estimate which also includes spending by
day visitors. The actual impact from spending by
“non-local” patrons of the Coliseum is predicted
to fall within the range between these two esti-
mates. Detailed tables showing impact estimates
for Guilford and the surrounding counties are includ-
ed in the Appendix.
A. Coliseum Complex (Including GAC)
The impact on employment in Guilford County from
visitor spending for the Complex (including the
GAC) is projected to fall between 418 and 718 jobs,
including 230 to 395 jobs within the City of Greens-
boro. The impact on household disposable income is
estimated to be between $7.1 and $12.4 million in the
county ($3.9-$6.8 million in Greensboro); the impact
on total output is estimated to fall between $22.6 and
$38.8 million in Guilford County ($12.4-$21.3 mil-
Coliseum (incl. GAC)
Total Event Attendance 1,554,066
Room-Nights * 71,605
Overnight Visitors (based on room-nights) 220,602
Aquatic Center
Total Event Attendance 120,884
Room-Nights * 25,657
Overnight Visitors (based on room-nights) 90,569
* Source: Greensboro CVB
Table 2. Visitation Data, 2012

Strom Thurmond Institute
Economic Impact of The Greensboro Coliseum—4
lion in Greensboro). Local governments in Guilford
County are estimated to have enjoyed a net revenue
impact of $1.6 to $2.4 million in 2012, of which be-
tween $927,000 to $1.5 went to Greensboro city gov-
ernment. Revenue for the state government were im-
pacted by an estimated net of $2.6 to $4.6 million in
2012.
B. Aquatic Center Only
GAC patrons in 2012 numbered 120,884, of which
an estimated 90,569 were overnight visitors. Visitors
to the GAC in 2012 are estimated to have created
between 141 and 150 jobs in Guilford County
through their consumer spending, including between
78 and 83 jobs in Greensboro. This spending contrib-
uted $2.4 to $2.6 million in disposable income for
households in the county ($1.3 to $1.4 million within
Greensboro) and $7.7 to $8.2 million in total output
($4.2 to $4.5 million in Greensboro). County and
municipal governments in Guilford County netted
approximately $544,000 to $572,000 in revenue, in-
cluding $321,500 to $409,800 going to Greensboro
city government. The state government netted an es-
timated $907,000 to $968,000 in revenues.
Note that the margin of error indicated in the visitor
spending impact estimates for the full Complex is
larger than that estimated for visitors for GAC
events. This is due to the larger proportion of over-
night visitors reported for GAC events than for the
remainder of the Complex, as overnight visitors in
general are assumed to spend more and therefore
generate a larger economic impact than day visitors.
V. Combined Impacts
Due to the linear nature of I/O models, the estimated
impacts from operations and visitor spending can be
added to generate an estimate of the total impact of
the facility on the region. These combined impacts
are presented in figures 1, 2 and 3 and in tabular
form in the Appendix.
0 500 1,000 1,500 2,000
Low Estimate
High Estimate
Fig.1 - Coliseum Total Est. Employment
Impact (Jobs)
County Total Greensboro
$0 $20 $40 $60 $80
Low Estimate
High Estimate
Fig.2 - Coliseum Total Est. Impact on Output (Millions of dollars)
County Total Greensboro
$0 $1 $2 $3 $4
Low Estimate
High Estimate
Fig.3 - Coliseum Total Est. Net Local Fiscal
Impact (Millions of dollars)
County Total Greensboro

Strom Thurmond Institute
Economic Impact of The Greensboro Coliseum—5
VI. Conclusion
Due to the number of visitors drawn by events at the
Greensboro Coliseum, it is almost a given that the
Complex generates a positive economic impact on
the region. This report has attempted to quantify this
impact as well as the fiscal impact that the Complex,
its operations, and its visitors have on state and local
governments. Findings indicate that the revenue im-
pact from the Coliseum is greater than the costs gen-
erated through demands on government services cre-
ated by the increase in economic activity.
VII. Addenda
The following I/O models were run in addition to
those run for the Coliseum’s 2012 operating year.
First, the economic impact of overnight visitors for
the 2013 Atlantic Coast Conference (ACC) Men’s
Basketball Tournament is estimated. Second, the im-
pact from 2010-2011 capital expenditures and those
planned for 2013-2014 are estimated. Detailed tables
showing impact estimates for each of the following
models for Guilford County and the City of Greens-
boro are included in the Appendix.
A. 2013 ACC Tournament
Data provided by the Greensboro CVB indicate that
16,200 room-nights were associated with the ACC
Basketball Tournament that occurred in March 2013.
For modeling purposes, these rooms are assumed to
have been occupied two persons per room. The same
assumptions regarding expenditures were applied as
in the previous visitor spending models. Because this
model only includes overnight visitors, no “high-
low” range is provided; the estimated impacts are
therefore believed to be somewhat conservative.
These impact estimates are presented in the Appen-
dix.
The model estimates that 62 jobs were created in
Guilford County as a result of spending by ACC
Tournament patrons, of which approximately 34
were in the City of Greensboro. The estimated im-
pact on disposable income was $1.1 million
($618,000 in Greensboro), and the impact on output
was $3.6 million ($2 million in Greensboro). Local
government revenues in Guilford County were high-
er by an estimated $267,000, with $222,500 project-
ed as going to Greensboro city government. The net
fiscal impact on North Carolina state government is
estimated to have been $421,000.
B. Capital Expenditures
The impact estimates reported here include those of
historic capital expenditures in fiscal years 2010 and
2011 and projected expenditures in fiscal years 2013
and 2014; these expenditures are reported in Table 3.
FY 2012 expenditures, which were substantially less
than those in 2010-11 and those projected for 2013-
14, are excluded in this model as they were included
in the operational spending models earlier in this re-
port. Note that dollar amounts stated in the following
are not adjusted for inflation.
Impact estimates from capital expenditures are re-
ported in the Appendix. Figure 4 shows the estimated
impact on net local government revenues in each
year. On average, capital spending by the Coliseum
Complex in the reported years creates an estimated
impact of 54 jobs (including 30 jobs in the City of
Greensboro), $2.1 million in disposable income ($1.2
million in Greensboro), and $5.3 million in output
($2.9 million in Greensboro). Local governments in
Guilford County enjoy an increase in net revenues of
approximately $291,700 ($160,450 in the City of
$0
$50
$100
$150
$200
$250
$300
$350
$400
2010 2011 2013 2014
Fig.4 - Est. Net Local Fiscal Impact from
Capital Expenditures (Thousands of dollars)
County Total Greensboro

Strom Thurmond Institute
Economic Impact of The Greensboro Coliseum—6
Greensboro) on average per
year, and North Carolina state
government benefits on aver-
age by approximately $1.9
million in net revenues.
It is important to note that, be-
cause capital spending projects
involve the purchase of materi-
al and equipment that is pro-
duced outside of the region,
there is always some “leakage”
involved in the economic im-
pact from these expenditures.
As a result, the net impact of
capital projects on a region,
while usually positive, are frequently less than the
original amount invested. Additionally, the economic
impact from capital spending generally only persists
so long as the capital project is ongoing.
Project Fiscal Year Expenditure
Schiffman's Diamond Club 2010 $225,000
GAC 2010 $10,000,000
ACC Hall of Champions 2010 $2,300,000
Terrace Lounge 2010 $1,670,000
White Oak Amphitheater 2010 $500,000
2010 Total $14,695,000
GAC 2011 $9,500,000
White Oak Amphitheater 2011 $500,000
2011 Total $10,000,000
Capital Improvement Project Phase I 2013 $14,000,000
Capital Improvement Project Phase II 2014 $11,000,000
(2010-11 in nomial dollars, 2013-14 in current 2012 dollars)
Table 3. Direct Capital Expenditures
Strom Thurmond Institute
Economic Impact of The Greensboro Coliseum—7
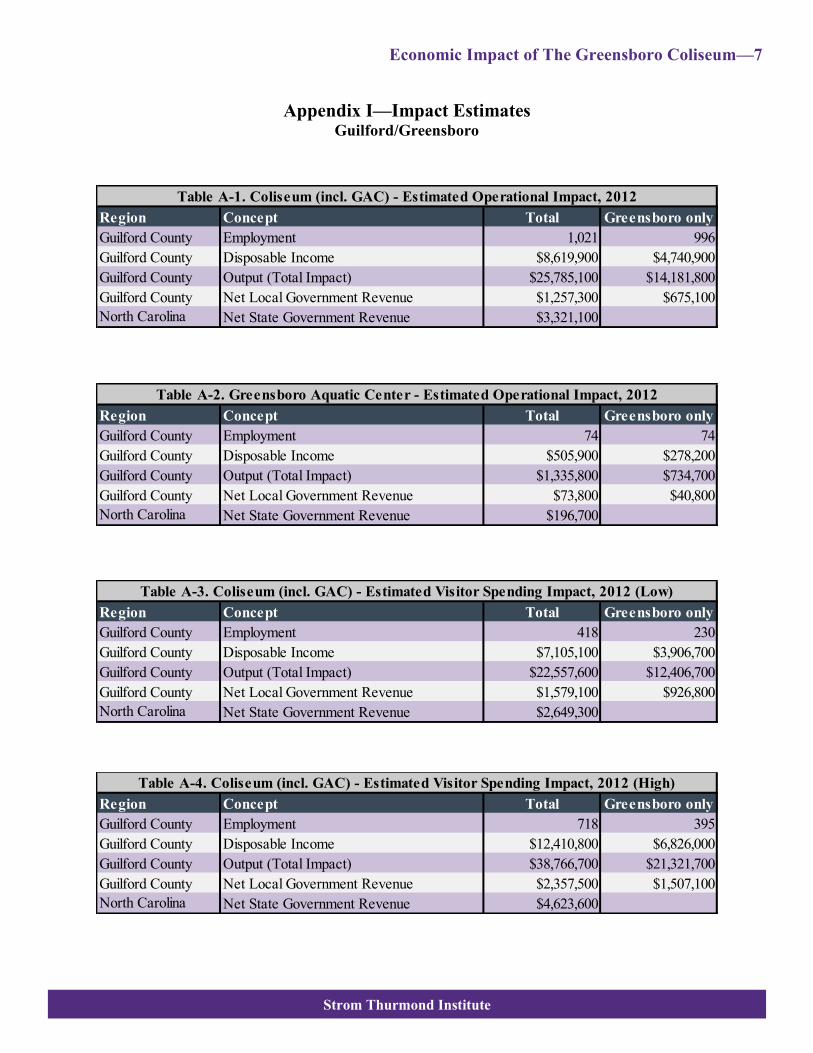
Appendix I—Impact Estimates Guilford/Greensboro
Region Concept Total Greensboro only
Guilford County Employment 1,021 996
Guilford County Disposable Income $8,619,900 $4,740,900
Guilford County Output (Total Impact) $25,785,100 $14,181,800
Guilford County Net Local Government Revenue $1,257,300 $675,100
North Carolina Net State Government Revenue $3,321,100
Table A-1. Coliseum (incl. GAC) - Estimated Operational Impact, 2012
Region Concept Total Greensboro only
Guilford County Employment 74 74
Guilford County Disposable Income $505,900 $278,200
Guilford County Output (Total Impact) $1,335,800 $734,700
Guilford County Net Local Government Revenue $73,800 $40,800
North Carolina Net State Government Revenue $196,700
Table A-2. Greensboro Aquatic Center - Estimated Operational Impact, 2012
Region Concept Total Greensboro only
Guilford County Employment 418 230
Guilford County Disposable Income $7,105,100 $3,906,700
Guilford County Output (Total Impact) $22,557,600 $12,406,700
Guilford County Net Local Government Revenue $1,579,100 $926,800
North Carolina Net State Government Revenue $2,649,300
Table A-3. Coliseum (incl. GAC) - Estimated Visitor Spending Impact, 2012 (Low)
Region Concept Total Greensboro only
Guilford County Employment 718 395
Guilford County Disposable Income $12,410,800 $6,826,000
Guilford County Output (Total Impact) $38,766,700 $21,321,700
Guilford County Net Local Government Revenue $2,357,500 $1,507,100
North Carolina Net State Government Revenue $4,623,600
Table A-4. Coliseum (incl. GAC) - Estimated Visitor Spending Impact, 2012 (High)

Strom Thurmond Institute
Economic Impact of The Greensboro Coliseum—8
Region Concept Total Greensboro only
Guilford County Employment 141 78
Guilford County Disposable Income $2,428,700 $1,335,800
Guilford County Output (Total Impact) $7,718,500 $4,245,200
Guilford County Net Local Government Revenue $543,900 $321,500
North Carolina Net State Government Revenue $906,500
Table A-5. Greensboro Aquatic Center - Estimated Visitor Spending Impact, 2012 (Low)
Region Concept Total Greensboro only
Guilford County Employment 150 83
Guilford County Disposable Income $2,594,500 $1,427,000
Guilford County Output (Total Impact) $8,222,100 $4,522,200
Guilford County Net Local Government Revenue $572,300 $409,800
North Carolina Net State Government Revenue $968,400
Table A-6. Greensboro Aquatic Center - Estimated Visitor Spending Impact, 2012 (High)
Region Concept Total Greensboro only
Guilford County Employment 1,439 1,226
Guilford County Disposable Income $15,725,000 $8,647,600
Guilford County Output (Total Impact) $48,342,700 $26,588,500
Guilford County Net Local Government Revenue $2,836,400 $1,601,900
North Carolina Net State Government Revenue $5,970,400
Table A-7. Full Complex - Estimated Total Impact, 2012 (Low)
Region Concept Total Greensboro only
Guilford County Employment 1,739 1,391
Guilford County Disposable Income $21,030,700 $11,566,900
Guilford County Output (Total Impact) $64,551,800 $35,503,500
Guilford County Net Local Government Revenue $3,614,800 $2,182,200
North Carolina Net State Government Revenue $7,944,700
Table A-8. Full Complex - Estimated Total Impact, 2012 (High)

Strom Thurmond Institute
Economic Impact of The Greensboro Coliseum—9
Region Concept Total Greensboro only
Guilford County Employment 62 34
Guilford County Disposable Income $1,123,400 $617,900
Guilford County Output (Total Impact) $3,612,100 $1,986,600
Guilford County Net Local Government Revenue $267,000 $222,500
North Carolina Net State Government Revenue $420,900
Table A-9. Men's ACC Tournament - Estimated Overnight Visitor Spending Impact, 2013
Region Concept Total Greensboro only
Guilford County Employment 64 35
Guilford County Disposable Income $2,411,200 $1,362,200
Guilford County Output (Total Impact) $6,117,100 $3,364,400
Guilford County Net Local Government Revenue $350,700 $192,900
North Carolina Net State Government Revenue $2,279,700
Guilford County Employment 44 24
Guilford County Disposable Income $1,695,100 $932,300
Guilford County Output (Total Impact) $4,270,100 $2,348,500
Guilford County Net Local Government Revenue $226,200 $124,400
North Carolina Net State Government Revenue $1,449,700
Guilford County Employment 60 33
Guilford County Disposable Income $2,388,700 $1,313,800
Guilford County Output (Total Impact) $5,988,700 $3,293,800
Guilford County Net Local Government Revenue $335,000 $184,300
North Carolina Net State Government Revenue $2,104,500
Guilford County Employment 47 26
Guilford County Disposable Income $1,873,600 $1,030,500
Guilford County Output (Total Impact) $4,702,700 $2,586,500
Guilford County Net Local Government Revenue $254,900 $140,200
North Carolina Net State Government Revenue $1,591,300
(2010-11 in nomial dollars, 2013-14 in current 2012 dollars)
Table A-10. Estimated Annual Impact from Capital Spending
2014
2013
2011
2010

Strom Thurmond Institute
Economic Impact of The Greensboro Coliseum—10
Appendix II—Impact Estimates Greensboro & Winston-Salem MSAs
Greensboro-High Point MSA Low Estimate High Estimate
North Carolina - Guilford 1,439 1,739
North Carolina - Randolph 13 17
North Carolina - Rockingham 9 12
...MSA Total 1,460 1,768
Winston-Salem MSA Low Estimate High Estimate
North Carolina - Davie 2 3
North Carolina - Forsyth 114 153
North Carolina - Stokes 2 3
North Carolina - Yadkin 1 2
...MSA Total 119 119
Remainder of North Carolina 245 319
…State Total 1,824 2,206
Table A-11. Estimated Total Impact from Coliseum Complex 2012
Employment
Greensboro-High Point MSA Low Estimate High Estimate
North Carolina - Guilford $15,725,000 $21,030,700
North Carolina - Randolph $1,699,839 $2,294,551
North Carolina - Rockingham $551,770 $1,390,502
...MSA Total $17,976,609 $24,715,753
Winston-Salem MSA Low Estimate High Estimate
North Carolina - Davie $269,924 $367,059
North Carolina - Forsyth $5,152,881 $6,993,045
North Carolina - Stokes $422,718 $573,811
North Carolina - Yadkin $201,031 $273,257
...MSA Total $6,046,553 $8,207,171
Remainder of North Carolina $11,639,518 $15,396,576
…State Total $35,662,680 $48,319,500
Disposable Income
Table A-12. Estimated Total Impact from Coliseum Complex 2012

Strom Thurmond Institute
Economic Impact of The Greensboro Coliseum—11
Greensboro-High Point MSA Low Estimate High Estimate
North Carolina - Guilford $48,342,700 $64,551,800
North Carolina - Randolph $1,155,519 $1,603,747
North Carolina - Rockingham $855,587 $1,185,801
...MSA Total $50,353,806 $67,341,347
Winston-Salem MSA Low Estimate High Estimate
North Carolina - Davie $143,644 $197,531
North Carolina - Forsyth $10,775,873 $14,836,913
North Carolina - Stokes $137,094 $187,728
North Carolina - Yadkin $93,097 $127,103
...MSA Total $11,149,708 $15,349,275
Remainder of North Carolina $28,952,230 $38,523,290
…State Total $90,455,745 $121,213,912
Table A-13. Estimated Total Impact from Coliseum Complex 2012
Output (Total Impact)
Greensboro-High Point MSA Low Estimate High Estimate
North Carolina - Guilford $2,836,400 $3,614,800
North Carolina - Randolph $263,397 $355,543
North Carolina - Rockingham $150,606 $203,183
...MSA Total $3,250,403 $4,173,526
Winston-Salem MSA Low Estimate High Estimate
North Carolina - Davie $36,796 $50,035
North Carolina - Forsyth $723,421 $981,746
North Carolina - Stokes $63,432 $86,102
North Carolina - Yadkin $29,844 $40,565
...MSA Total $853,493 $1,158,448
Remainder of North Carolina $1,456,783 $2,005,339
…State Total $5,560,679 $7,337,313
Table A-14. Estimated Total Impact from Coliseum Complex 2012
Net Local Government Revenue

Strom Thurmond Institute
Economic Impact of The Greensboro Coliseum—12
Table A-15 – Estimated Impact on Gross Local Gov-
ernments Revenue -- Total
(Guilford County)
Revenue Source (thousands of
dollars) 2012
All Revenue $3,791.9
-General revenue $2,904.4
--Intergovernmental revenue $1,232.9
---From federal government $91.5
---From state government $1,141.4
---From local government $0.0
--General revenue from own sources $1,671.5
---Taxes $831.3
----Property $640.3
----Sales and gross receipts $874.9
-----General sales $441.2
-----Selective sales (incl. hotel) $390.1
------Motor fuel $0.0
------Alcoholic beverage $0.9
------Tobacco products $0.0
------Public utilities $0.0
------Other selective sales $13.1
----Individual income $0.0
----Corporate income $0.0
----License taxes $3.1
-----Motor vehicle license $3.1
-----Other license taxes $0.0
----Other taxes $35.9
---Charges and miscellaneous general
revenue
$840.2
----Current charges $687.6
-----Education $59.2
------Institutions of higher education $26.1
------School lunch sales (gross) $27.2
Appendix III—Gross Local Government Revenue Detail Operational and Visitor Spending, Coliseum including GAC
Table A-15 (Continued) – Estimated Impact on Gross
Local Governments Revenue -- Total
(Guilford County)
Revenue Source (thousands of
dollars) 2012
------Other education $5.9
-----Hospitals $345.5
-----Highways $0.0
-----Air transportation (airports) $22.1
-----Parking facilities $2.7
-----Sea and inland port facilities $0.0
-----Natural resources $0.1
-----Parks and recreation $10.8
-----Housing and community develop-
ment
$7.9
-----Sewerage $113.6
-----Solid waste management $42.0
-----Other charges $83.7
----Miscellaneous general revenue $152.6
-----Interest earnings $69.5
-----Special assessments $1.6
-----Sale of property $4.2
-----Other general revenue $77.3
-Other than general revenue $340.2
--Utility revenue $295.9
---Water supply $52.8
---Electric power $227.7
---Gas supply $12.4
---Transit $3.0
--Liquor store revenue $45.6
--Insurance trust revenue ($1.2)
---Unemployment compensation $0.0
---Employee retirement ($1.2)
---Workers' compensation $0.0