impact assessment of savings groups - mangotree.org · innovations for poverty action 101 whitney...
TRANSCRIPT
Innovations for Poverty Action
101 Whitney Avenue, Second Floor, New Haven, CT 06510, USA
http://www.poverty-action.org
Impact Assessment of Savings Groups Findings from Three Randomized Evaluations of
CARE Village Savings and Loan Associations programs in Ghana, Malawi and Uganda
Final Report
Innovations for Poverty Action

Impact Assessment of Savings Groups Findings from Randomized Evaluations of CARE Village Savings and Loans Associations in Ghana, Malawi and Uganda
2
Prepared by
Dean Karlan
Bram Thuysbaert
Christopher Udry
Emily Cupito
Rohit Naimpally
Edgar Salgado
Beniamino Savonitto
September 20, 2012
Acknowledgements
This study was conducted in collaboration with the CARE offices in Ghana, Malawi, Uganda and the Access Africa program. We thank the
manager of the VSLA programs that collaborated in the study: Gifty Blekpe and David Sumbo in Ghana, Geoffrey Kumwenda in Malawi,
and Grace Majara in Uganda. A special thank you to Moses Akadimah, Mackenzie Chivwala, Sylvia Kaawe, Rebecca Nyonyozi, and to the
many managers and field coordinator of the implementing organizations involved in the study. The studies in Malawi and Uganda were
conducted under a subgrant from CARE International, Access Africa Program. We thank Sybil Chidiac, Abdoul-Karim Coulibaly, Mark
Staehle and Lauren Hendricks for the support during the design and the oversight of the study.
IPA and the co-authors retained intellectual freedom on this project throughout. Human subjects ethics approval was provided by the FAS
Human Subject Committee at Yale University and by the Institutional Review Board at Innovations for Poverty Action. We thank Guy
Grossman and Muthoni Ngatia for their intellectual input on parts of this research. Fieldwork was managed and research assistance provid-
ed by several IPA staff: Salifu Amadou, Alex Bartik, Manuela Bucciarelli, Ya-Ting Chuang, Angela Garcia Vargas, Manya Ghahremani,
Matt Hoover, Elizabeth Koshy, Linda Pappagallo, and Rachel Strohm all provided excellent field management and research assistance. For
their support and oversight of the research work, we also thank: Kelly Bidwell, Carolina Corral, Annie Duflo, Katie Hughes, Jessica
Kiessel, Justin Oliver, Doug Parkerson, Pia Raffler.
Impact Assessment of Savings Groups Findings from Randomized Evaluations of CARE Village Savings and Loans Associations in Ghana, Malawi and Uganda
3
TABLE OF CONTENTS
TABLE OF CONTENTS................................................................................................................................................. 3
EXECUTIVE SUMMARY ............................................................................................................................................... 4
SECTION 1. INTRODUCTION ........................................................................................................................................ 5
SECTION 2. THE INTERVENTION ................................................................................................................................... 7
SECTION 3. THE STUDY ............................................................................................................................................. 9
SECTION 4. UPTAKE AND USES OF VSLAS ................................................................................................................... 12
4A - Characteristics of VSLA Members ............................................................................................................................ 12
4B - Uses of Financial Tools ............................................................................................................................................ 14
4C - Uptake and Replication ........................................................................................................................................... 16
SECTION 5. IMPACT ASSESSMENT .............................................................................................................................. 20
5A - Theory of Change .................................................................................................................................................... 21
5B - Impacts ................................................................................................................................................................... 22
1. Financial Management ........................................................................................................................................... 22
2. Income Generating Activities .................................................................................................................................. 26
3. Women’s Empowerment........................................................................................................................................ 28
4. Shocks and Food Security ....................................................................................................................................... 30
5. Expenditures and Consumption .............................................................................................................................. 33
6. Education ............................................................................................................................................................... 34
7. Health .................................................................................................................................................................... 36
8. Asset Accumulation ................................................................................................................................................ 37
5C - Estimating the Impact on Participants...................................................................................................................... 38
SECTION 6. CONCLUSIONS ....................................................................................................................................... 40
APPENDIX I - STUDY AREAS ..................................................................................................................................... 41
APPENDIX II - QUALITATIVE INSIGHTS FROM MALAWI AND UGANDA ................................................................................. 42
APPENDIX III - GLOSSARY ......................................................................................................................................... 44
APPENDIX IV - TABLES ............................................................................................................................................ 46

Impact Assessment of Savings Groups Findings from Randomized Evaluations of CARE Village Savings and Loans Associations in Ghana, Malawi and Uganda
4
EXECUTIVE SUMMARY
Researchers from IPA, along with CARE staff and their
implementing partners, conducted a randomized evaluation
of Village Savings and Loans Association (VSLA) programs
in Ghana, Malawi, and Uganda to examine two questions:
Who joins savings groups? And, what is the impact on
households from programs that promote savings groups?
The evaluation used a randomized control trial (RCT) de-
sign, in which eligible communities were randomly divided
into two sets: a set of villages with access to a VSLA pro-
gram (the treatment group) and a set of villages where the
program was not implemented during the study (the control
group). The study started in Ghana in 2008 and in Malawi
and Uganda in 2009, and the final data collection took place
in 2011 in the three countries.
Each site included a panel survey in which households were
surveyed before the start of the program implementation and
again two or three years later. Over 15,000 households in
almost 950 communities were surveyed. The surveys cov-
ered a large variety of topics, including health, education,
income-generating activities, asset holdings, food consump-
tion, non-food expenditure, intra-household decision making
and community involvement.
At the time of the endline survey, after an average of two
years of program implementation in the three sites, one third
of respondents had joined a VSLA group. On average,
members had been part of a group for 15 months and 61% of
members had gone through a full savings cycle, normally
lasting between 8 and 12 months. The evaluation should thus
be thought of as assessing the relatively short-term impacts
of the intervention.
We first tested whether VSLAs change the financial
behavior of participants. We find that they do. Savings group
participation increases substantially in treatment villages
compared to control villages. Moreover, VSLAs do not seem
to be dominated solely by the better-off community
members, although wealth, education, age and business
ownership are correlated with participation.
We find evidence of replication of the savings group
approach across villages, with little evidence that replicated
groups lose quality relative to the groups formed in targeted
villages. Moreover, in the control areas, we see about 6% of
respondents participating in VSLAs. This diminishes our
ability to detect impact somewhat, but also points to the
popularity of the program and the eagerness of community
members to join VSLAs.
VSLAs substantially increase the portfolio of financial
services available to participants. More people have access
to savings and loans, and average deposit and loan volumes
increase as a result of the program. Saving balances increase
significantly, even after subtracting outstanding debits.
The increased access to financial tools, and perhaps the
social aspect of the VSLAs, helps women invest in their
businesses. We find that women with access to VSLAs are
much more likely to take out a loan for commerce and are
significantly more likely to own a business. Income from
businesses increases as well. However, this increase in busi-
ness activity is accompanied by an increased likelihood to
experience business failure. This is consistent with savings
groups helping to enable more businesses, even though some
do fail.
The presence of savings groups leads to improvements in
women’s intra-household decision-making power, but we
observe little change in women’s involvement in the
community.
We see no significant changes in households’ ability to miti-
gate economic shocks, but we do witness some small im-
provements in food security, with households less likely to
reduce the food consumption of adults in the household.
We find that households access more credit for a variety of
investment purposes, including for agriculture, health and
education. There is some evidence, although not robust to
alternative econometric analysis, that the intervention in-
creased the enrollment of children of primary-school age.
However, we do not detect changes in agricultural produc-
tion, livestock holdings or the accumulation of household
assets. In addition, use of health services and health expendi-
tures remain unaffected, and we see no impacts on housing
conditions, food consumption or non-food expenditures.
As the follow-up survey was conducted two to three years
after the baseline, and the program was not launched imme-
diately after the baseline survey in all locations, we cannot
exclude that more time is needed for the short-term changes
we observe to lead to longer term changes in agricultural
incomes, non-financial asset holdings, health improvements
and consumption increases. Thus, we conclude that the long-
term welfare impacts of the VSLA program are in need of
further research.

Impact Assessment of Savings Groups Findings from Randomized Evaluations of CARE Village Savings and Loans Associations in Ghana, Malawi and Uganda
5
SECTION 1. INTRODUCTION
In an analysis of financial diaries of low-income respondents
around the world, Collins et al. (2009) show that the poor
manage surprisingly complex financial portfolios and use a
large set of financial instruments that can be quite compli-
cated. They find that the poor need access to financial ser-
vices in order to help manage this complexity. These finan-
cial services are intended to help clients achieve three goals.
First, they allow clients to save money in good times, in
order to help them maintain their average consumption lev-
els during difficult times (known as consumption smooth-
ing). Second, they help clients weather unexpected econom-
ic shocks, such as illness, drought or crop failure. Finally,
financial services allow clients to save for the future. Being
able to handle these diverse problems, both in the short and
the long term, is vitally important to moving out of poverty.
The quest to improve access to financial services has gener-
ally fallen into two broad categories: providing access to
credit through microcredit enterprises, and saving mecha-
nisms. Credit, savings, insurance products, and transfers
contribute in different ways to the capacity of the poor to
conduct these activities. When Mohammed Yunus created
the Grameen Bank in 1983, he did so with the knowledge
that a gap existed between the financial products offered by
conventional banking and those demanded by the poor. The
success of the Grameen model led to the proliferation of the
microcredit industry around the world.
Recent randomized evaluations show that microcredit
provision can spur business investment and help firms
reduce risk. However, the available evidence has not found
that microcredit programs lead to an overall reduction in
poverty amongst beneficiaries and their broader
communities, nor do they significantly affect education
outcomes, health care usage or female empowerment
(Bauchet et al. 2011).1 These findings support the
observation that although credit can be an important
resource for the poor, other tools, particularly savings and
insurance, are also likely important for improving the
financial management capacity and welfare of the poor.
Collins et al. (2010) observe that the financial tools available
to their financial diary respondents are often expensive and
inadequate for their financial needs. Grameen-style group
1 Bauchet et al. (2011), “Latest Findings from Randomized Evaluations of
Microfinance”, CGAP, FAI, IPA and J-PAL
loans are often mismatched relative to the cash flow needs of
their members. A Rotating Savings and Credit Association
(ROSCAs), a merry-go-round savings group, can be
unreliable and excessively rigid. Moreover, many of these
informal financial mechanisms operate on a short-term basis.
This limits the availability of the large lump sums needed for
significant capital investments.
In 1991, CARE developed a new savings group program in
Niger that attempted to overcome the difficulties of offering
access to credit and savings to the rural poor. The structure
of this new program, called a Village Savings and Loans
Association (VSLA) built on the ROSCA model to create
groups of people that could pool their savings as a source for
lending funds to group members, but with more flexibility
than a ROSCA.
At its core, the VSLA program promotes the creation of self-
managed and self-financed microfinance groups. Each
member contributes regular savings deposits to a common
pot; members are then able to take out loans from those
savings. Loans are paid back to the group with interest. At
the end of each cycle – typically 8 to 12 months – the fund is
shared out, with members receiving back their accumulated
deposits plus interest. While similar characteristics can be
found amongst a range of informal associations present in
the developing world, VSLAs provide the framework and
well-tested methodologies that arguably make these savings
groups more flexible, democratic and durable than ROSCAs,
or other types of Accumulating Savings and Credit
Associations (ASCAs).
VSLAs are normally comprised of 15-30 members who have
chosen to be a part of the program. At every meeting,
usually on a weekly basis, members save by purchasing
shares. The amount of each share is set by the group. Each
share is marked in a logbook given to all members,
simplifying accounting procedures. Depending on their
ability to save in a given week, members can decide whether
to save one share, or more (with a maximum of 5).
In addition to providing members with a flexible and safe
way to save, VSLAs allow members to take loans from the
group, with a term and interest rate decided by the group at
the beginning of each cycle. Loans are normally collected
and distributed on a monthly basis and maximum amounts
Impact Assessment of Savings Groups Findings from Randomized Evaluations of CARE Village Savings and Loans Associations in Ghana, Malawi and Uganda
6
are determined by the group as a multiple of the total share
contribution of the member.
To ensure the autonomy and sustainability of the group, the
promoting organization only provides training and support –
generally limited to the first cycle – to the members of the
association. At the beginning of each cycle, VSLA members
elect a management committee, composed of 5 members,
that manages the transactions of the group. The money
deposited with the group is kept in a locked box, with 3 keys
held by different group members to ensure security. In some
cases, especially towards the end of the cycle when the
group’s funds may be considerable, the group may decide to
deposit the funds in a financial institution.
The meetings continue regularly for a cycle that is set to last
for a specific amount of time, normally between 8 and 12
months. At the end of each cycle, the money saved, plus the
interest earned on loans made by the group, is shared by
group members.
Most groups also establish a social or emergency fund as an
insurance and solidarity mechanism. This social fund gives
members facing emergencies or financial shocks, access to
small amounts of funds. Disbursements of the social fund
are approved by the group and generally made in the form of
a grant or an interest-free loan.
According to Allen and Staehle (2007), VSLAs complement
the role of traditional formal institutions by providing the
“means to intermediate small amounts of local capital on
flexible terms and transact frequently at no cost.”2 They
function like small, unregulated financial institutions,
providing their members with an accessible source of credit,
a safe place to save regularly, and a solidarity fund
functioning as a cushion for emergencies. Given these
advantages, VSLAs have a greater potential to bring
financial services to poorer and more remote clients than
formal financial institutions.3
In 2008, Innovations for Poverty Action (IPA) began a series
of randomized evaluations of CARE’s savings group model,
to rigorously measure its impact on the lives of the people in
the program communities. These impact studies were con-
ducted for CARE’s Village Savings and Loans Associations,
2 Allen and Staehle, 2007, “Programme Guide. Field Operations Manual”,
VSL Associates, Version 2.92. 3 Ashe, J. (2010), “The Savings-Led Revolution”, in Financial Promise for
the Poor, Wilson et al. eds.
in Ghana (where the program was called ESCAPE) and in
Malawi and Uganda (where it was known as Save Up). The
Saving for Change program in Mali, implemented by Oxfam
USA and Freedom from Hunger, is a similar savings pro-
gram, but is not evaluated in this report. The evidence col-
lected in these four sites will provide an important contribu-
tion to knowledge about the impacts of savings groups.
Section 2 briefly describes the VSLA intervention and its
scale-up methodology. Section 3 presents the design of the
study and describes the data collected for the study. In
Section 4, we examine program take-up, the profile of
VSLA members, and the uses of VSLA share-outs, loans
received from the group and the social fund. In Section 5, we
present the findings of the impact evaluation of the VSLA.
Section 6 summarizes the main findings of the study and
concludes.

Impact Assessment of Savings Groups Findings from Randomized Evaluations of CARE Village Savings and Loans Associations in Ghana, Malawi and Uganda
7
April – June 2008 Baseline surveys in Ghana
June 2008 VSLA Program begins in Ghana
Feb – April 2011 Endline survey in Ghana
June 2011 VSLA Program:
Control Areas
April – July 2011 Endline Malawi and Uganda
June 2009 VSLA Program begins in Malawi and Uganda
April – July 2009 Baseline surveys in Malawi and Uganda
2009 2010 2011
Figure 1 - Timeline
SECTION 2. THE INTERVENTION
In 2008, the IPA research team and CARE offices worked
together to design a program that would scale up VSLA
operations in Ghana, Uganda and Malawi. CARE and its
implementing partners worked jointly with the IPA team to
plan the roll-out of these scaled-up activities in a randomly
assigned set of communities. By randomly assigning
communities to either receive the VSLA program (the
treatment group) or not to receive it during the study period
(the control group), IPA is able to rigorously assess the
impact of the VSLA model by comparing treatment
communities to statistically similar communities in the
control group.
In total, the study in Ghana, Uganda and Malawi involved a
sample of over 15,000 households spread over almost 1,000
villages. The study period in Ghana spanned April 2008 to
May 2011, while the studies in Uganda and Malawi began in
April 2009 and concluded in June 2011. CARE obtained
funding for a second roll-out of the program in the study’s
control areas, and VSLA implementation in these areas be-
gan after the conclusion of the study in each country.
In Ghana, the study was carried out in five districts in the
north. (The location of these districts is shown on a map in
Appendix 1). This part of the country is sparsely populated.
The majority of households rely on agriculture as their main
livelihood, and less than 10% of households own a business.
Almost two-thirds live on less than $1.25 per person a day,
and education is limited. In addition, it is one of the least
banked regions in the country.
IPA administered a baseline survey between April and June
2008 in 175 sample villages across Ghana. A take-up
analysis in September 2009 found lower than expected take-
up in treatment villages and substantial take-up in control
villages. Since this situation made it more difficult for
researchers to cleanly identify the program’s effects on
treatment communities, the sample was increased in the
endline survey scheduled for February 2011. The endline
survey randomly selected households to be added to the
sample to reach a sample size of 7,073 households in the
same communities.
In the Garu Tempane, Bawku and East Mamprusi districts in
the northeast, CARE partnered with Presbyterian
Agricultural Services to promote VSLAs and train
participants. CARE partnered with Rural Aid Action
program in Lawra, and CARE implemented the program
directly in Builsa district. The study covers approximately
30 months of VSLA programming in the 88 villages
assigned to receive the intervention.
In Malawi the study was conducted in 4 of the 7 districts
covered by Care’s Access Africa scale-up program. As can
be seen in Appendix 1, these districts have a wide
geographical spread, covering each of the 3 major regions of
the country. In each region, the study covered areas where
VSLA or Savings Group promotion programs had not taken
place before, either under the aegis of CARE or any other
organization.
The Malawi sample is comprised of villages with an average
population of approximately 840 people. Infrastructure is
poor, and cattle herding is most respondents’ primary
livelihood. About 40% of households owned a business at
the time of the baseline and 66% live on less than $1.25 per
person a day.
After a baseline survey that took place between April and
June 2009, program activities started in the 95 clusters of
villages assigned to receive the program.
Impact Assessment of Savings Groups Findings from Randomized Evaluations of CARE Village Savings and Loans Associations in Ghana, Malawi and Uganda
8
The implementing partners working in the study areas were:
Catholic Development Commission in Malawi (Mzuzu and
Lilongwe), Evangelical Lutheran Development Program and
Emmanuel International. Fieldwork, starting with
sensitization of targeted communities, began – on average –
two weeks after the end of baseline data collection and
continued for approximately 22 months before the endline
data collection started in April 2011.
In Uganda, the study was conducted in 7 of the 13 districts
covered by the Save Up scale-up program. The study areas
were selected among those with no known existing or
planned savings group programming by CARE or other
organizations.
The project was carried out by 7 implementing partners in
98 clusters: Rucode and Build Africa in the East; and
Parents Concern, Covoid, Aprocel, Rudfa, and KIRDP in the
West. Baseline data collection ended in mid-June 2009.
Implementation began within a few weeks of the completion
of data collection, with the sensitization of communities and
the recruitment and formation of the first groups. Endline
data was collected starting in April 2011, approximately 22
months from the beginning of the program.
At the time of the baseline, 30% of the households owned a
business, and approximately 45% of our sample lived on less
than $1.25 per person a day.
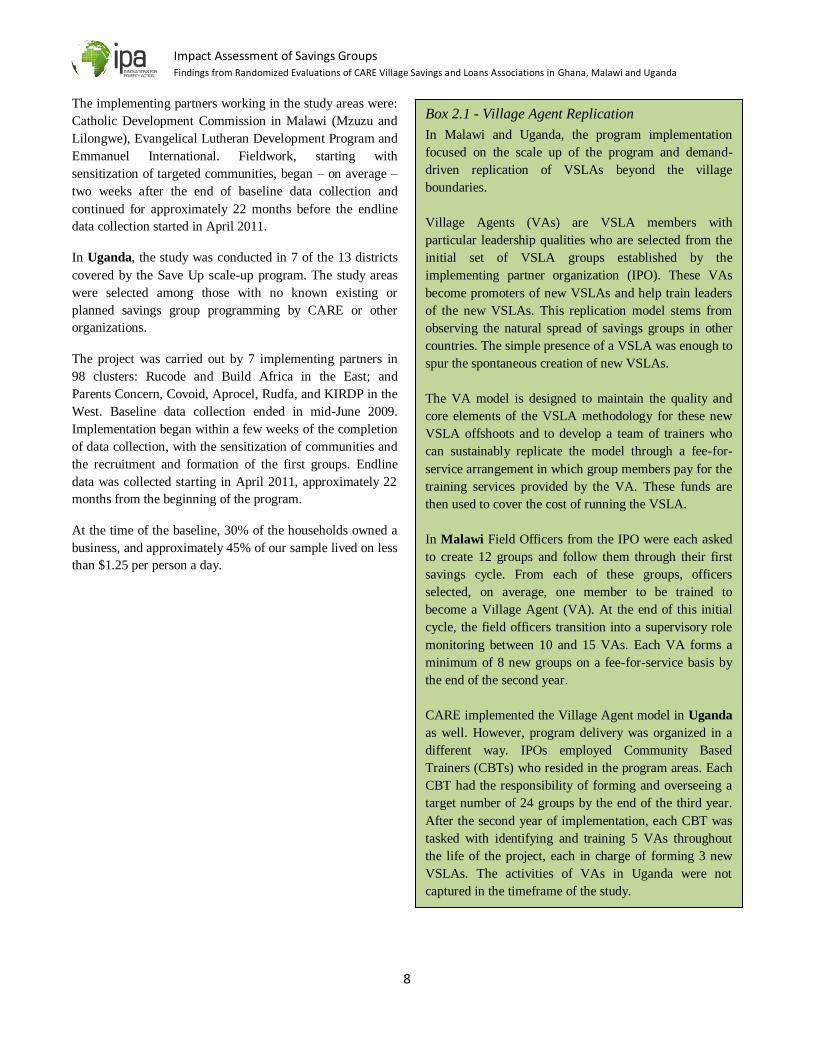
Box 2.1 - Village Agent Replication
In Malawi and Uganda, the program implementation
focused on the scale up of the program and demand-
driven replication of VSLAs beyond the village
boundaries.
Village Agents (VAs) are VSLA members with
particular leadership qualities who are selected from the
initial set of VSLA groups established by the
implementing partner organization (IPO). These VAs
become promoters of new VSLAs and help train leaders
of the new VSLAs. This replication model stems from
observing the natural spread of savings groups in other
countries. The simple presence of a VSLA was enough to
spur the spontaneous creation of new VSLAs.
The VA model is designed to maintain the quality and
core elements of the VSLA methodology for these new
VSLA offshoots and to develop a team of trainers who
can sustainably replicate the model through a fee-for-
service arrangement in which group members pay for the
training services provided by the VA. These funds are
then used to cover the cost of running the VSLA.
In Malawi Field Officers from the IPO were each asked
to create 12 groups and follow them through their first
savings cycle. From each of these groups, officers
selected, on average, one member to be trained to
become a Village Agent (VA). At the end of this initial
cycle, the field officers transition into a supervisory role
monitoring between 10 and 15 VAs. Each VA forms a
minimum of 8 new groups on a fee-for-service basis by
the end of the second year.
CARE implemented the Village Agent model in Uganda
as well. However, program delivery was organized in a
different way. IPOs employed Community Based
Trainers (CBTs) who resided in the program areas. Each
CBT had the responsibility of forming and overseeing a
target number of 24 groups by the end of the third year.
After the second year of implementation, each CBT was
tasked with identifying and training 5 VAs throughout
the life of the project, each in charge of forming 3 new
VSLAs. The activities of VAs in Uganda were not
captured in the timeframe of the study.
Impact Assessment of Savings Groups Findings from Randomized Evaluations of CARE Village Savings and Loans Associations in Ghana, Malawi and Uganda
9
SECTION 3. THE STUDY
An impact evaluation should assess how people’s lives
changed because of an intervention. Ideally, an evaluation
should compare the experiences of people who participated
in the intervention with similar people who did not
participate, as this would mean that any differences between
the two groups should be attributable exclusively to the
intervention. Randomized controlled trials (RCTs) are the
most rigorous way of identifying statistically similar groups
of people and determining the effect of an intervention.
To evaluate the impact of the VSLA program, we conduct an
RCT, randomly assigning part of our study sample to receive
the program and part to serve as the control group. By
randomly assigning groups to receive the VSLA program,
we can ensure that participation in the program is not driven
by other underlying characteristics of the people
participating. For instance, if implementing partner
organizations could choose the villages in which to offer the
VSLA program in a non-random manner, they might select
villages that are easier to reach by road. These villages
might systematically differ from more remote villages in
many ways, meaning that a simple comparison of VSLA
villages to non-VSLA villages would not cleanly identify the
impact of having a VSLA, but would also capture other
underlying differences unrelated to the VSLA. It would not
be possible to tell which of the differences between the
villages was attributable to the VSLA, and which would
have existed anyway. Randomization solves this problem.
In this evaluation, the VSLA program is offered to
households in communities that are randomly chosen from
each country’s sample. In each village, the program rolls out
naturally, with village members coming together to form
groups. These groups are then trained, based on the
availability of trainers or agents in the community. This
study design is known as a clustered randomized controlled
trial, or randomized program placement (Karlan and
Goldberg4).
In designing the evaluation of the VSLA program, it is
important to consider that not all households in treatment
communities actually participate in the VSLAs, and that not
all VSLA members begin participating in the savings groups
at the same time. The officer or village agent sent by a
4 Karlan and Goldberg (2011),“Microfinance Evaluation Strategies”, in The
Handbook of Microfinance, pp.33-36
partner to set up a VSLA does not select the specific people
who will form a group. Instead, people self-select into
groups on their own time when given the opportunity.
An important advantage of this study design is that it allows
us to document and analyze the take-up trends of the
program, and to compare the characteristics of community
members who joined a VSLA group against the broader
community. As our survey respondents are selected to be
representative of their communities, we are confident that
our results are applicable to the entire community studied.
In Ghana, our study covers a sample of 175 communities. Of
these, 87 were assigned to serve as a control group, and 88
were assigned to receive the visits of a trainer from the
ESCAPE program, to form VSLAs in the village. In each
village, we sampled 30 households to participate in the
study.
The VSLA scale-ups in Malawi and Uganda focused heavily
on a replication model, aiming to form new groups in
surrounding villages when demand for the program exists
(Box 2.1). In this case, rather than randomly assigning
specific villages to receive the VSLA program (as we did in
Ghana), we created clusters of villages as the randomization
unit. In each cluster, we selected a primary village that
would be targeted as the initial center of activities by the
implementing partner. A secondary community was then
selected within a 4 kilometer radius of the primary village.
The locations of secondary villages were not disclosed to
implementing partners in order to avoid targeting of these
villages. The data collected on households from these
secondary villages allows us to measure the extent to which
the program extends beyond the primary village selected for
implementation.
The Uganda sample comprises 391 villages, divided over
196 clusters. In each cluster, we collected data for 15
households in the primary village and 8 in the secondary
village. In Malawi we identified 190 clusters, for a total of
380 villages. We surveyed 15 households in primary villages
and 9 in secondary villages.
In each country, IPOs implemented the VSLA program in
control group communities after the endline data collection
was finished, in order to allow those communities to receive
the benefits of VSLA participation.

Impact Assessment of Savings Groups Findings from Randomized Evaluations of CARE Village Savings and Loans Associations in Ghana, Malawi and Uganda
10
Data Collection
Time-Frame. Baseline data collection was conducted
between April and June 2008 in Ghana and between April
and June 2009 in Uganda and Malawi. Endline data
collection took place between February and May 2011 in
Ghana and between April and June 2011 in Uganda and
Malawi. This allowed us to collect data over a period of 30
months in Ghana and 22 months in Uganda and Malawi.
In both the baseline and endline rounds, four separate
surveys were administered. First, at the household level,
respondents were asked about household indicators such as
agricultural production, income-generating activities,
economic shocks, etc. In addition, an adult survey was
administered to selected adults in every household, covering
a variety of questions about their individual experience of
gender issues, community involvement and questions on
savings and loans activities. Third, a village survey was
administered to village leaders, asking about various
characteristics of their community. Finally, a market
questionnaire allowed IPA surveyors to record the prices of
a variety of staple foods at the market, to allow us to impute
the market prices of food that respondents grew themselves.
One critical difference between the baseline and endline
surveys was the method by which surveying was conducted.
While paper surveys were used at the baseline, surveys at the
endline were conducted exclusively on netbook computers,
using specialized software for computer-assisted
interviewing (CAI). The use of CAI helped ensure data of a
high quality that could be rapidly translated into analysis
results.
Attrition. Each household was asked to respond to both the
baseline and endline survey. Overall, 13,555 households
were surveyed across the three countries for the baseline:
4,487 households in Ghana, 4,529 in Malawi and 4,539 in
Uganda. At endline 15,397 households were surveyed: 7,073
in Ghana, 4,130 in Malawi and 4,194 in Uganda. The sample
size in Ghana was increased for the endline to mitigate
worries about low take-up rates in treatment villages and the
proximity of control villages to treatment villages, which
caused some control villages to adopt the VSLA program.
Considerable efforts were devoted to tracking down baseline
households for the endline survey, as revealed by the
survey’s low attrition rates. The overall attrition rate over the
pooled sample of three countries was 8.8% (7.6% in
Uganda, 9.5% in Malawi and 9.2% in Ghana). A test
presented in Table A1 (Appendix IV) shows how attrition
rates were uncorrelated with the treatment. Such high quality
data allows us to determine with confidence that any
changes in the treatment groups’ behavioral and welfare
outcomes can reliably be attributed to the VSLA program.
Questionnaires
In order to determine the impact of savings groups on indi-
viduals, households and communities, we administered the
following four questionnaires:
1. Household Questionnaire
This questionnaire asked a person knowledgeable about the
household, usually a household head or spouse, for
information about the characteristics of both the household
as a whole, and individual members of the household.
Questions covered a wide set of topics including education
and health status of household members, income generating
activities, and the household’s reactions to economic shocks.
2. Adult Questionnaire
After administering the household questionnaire, our survey
staff asked to speak privately and confidentially with one or
more adult household members.
In the baseline survey, adult surveys were conducted in
Uganda and Malawi with both the household head and
his/her spouse. Efforts were made to interview all adult
women privately in Ghana. For the endline survey, only one
adult was interviewed in depth. We randomly selected either
the male or female adult baseline respondent as the adult
respondent for the endline survey in Uganda. In Malawi, we
tracked the female adult respondent from the baseline, while
in Ghana we randomly selected one female adult respondent
to participate in the endline survey.
The adult questionnaire asked for information about the
primary respondent’s current savings and loan use, as well
as her participation in savings groups, other community
activities, and about her interactions with other members of
the household.
3. Village Questionnaire
Our survey staff also administered a questionnaire to
community leaders in every village, usually the community
chair, or chief, in addition to village council members.
This survey covered the characteristics of the village as a
whole, including its distance from roads and the presence of
Impact Assessment of Savings Groups Findings from Randomized Evaluations of CARE Village Savings and Loans Associations in Ghana, Malawi and Uganda
11
schools and other facilities. The survey also asked for the
village population and primary income generating activities
of villagers. We asked the leaders about common crops and
livestock in the village and used their responses to estimate
the prices of these items. In addition, we inquired about any
savings groups that existed in the village during the previous
two years.
4. Market Questionnaire
In order to estimate the value of agricultural production and
food consumption, our survey staff conducted a market
survey on the prices and quantities of a long list of food
stuffs. We administered 15-25 market surveys in the same
districts and at the same time as the household, adult and
village surveys.
Baseline Characteristics
Over the three country sample, the typical household
contains 5 to 6 members, with at least one of these members
being under the age of 5 in Malawi and Uganda. The
probability of these households having a female head varies
from country to country, from a low of 4% in Ghana to
nearly 23% in Uganda. (Table A in Appendix IV)
In addition to the higher likelihood of the household head
being a female, the Malawi and Uganda samples also display
a higher level of literacy amongst female primary
respondents: while a little over 10% report being able to read
and write in Ghana, the corresponding statistic is close to
60% in the other two countries. The primary female
respondent is also substantially more likely to have had five
years of schooling in Malawi and Uganda (65% and 45%
respectively) than in Ghana (7%). This is in contrast to the
numbers for primary female enrollment, which are
marginally higher for Ghana as opposed to Malawi, and
secondary female enrollment, which is only marginally less
in Ghana than in Malawi and Uganda. Mediating these
numbers is the fact that only 32% of the villages in Malawi
report having a primary school in the village, as opposed to
51% of the villages in Uganda and nearly 60% of the
villages in Ghana.
Nearly every household across the three countries reports
being engaged in some farming activity. However, the
sample in Ghana reports considerably less involvement in
non-farming income activities: just over 9% of respondents
in Ghana own a business at the baseline, compared to nearly
30% in Uganda and 40% in Malawi. Similarly, while only
16% of the baseline respondents in Ghana engage in paid
labor, over half the respondents do so in Malawi and
Uganda.
Ownership of assets does not follow a similar pattern by
country; for instance, while only 15% of households in
Ghana report owning cell phones as opposed to 25% in
Malawi and 31% in Uganda, 76% own bicycles in Ghana,
compared to 57% and 40% in Malawi and Uganda
respectively.
This within-country variance in household assets is also
observed in the housing characteristics of sample
households: while a household in Uganda is substantially
more likely to have an iron sheet roof than a household in
Ghana or Malawi (64%, compared to 16% and 18%
respectively), it is also less likely to have electricity than a
household in Ghana (1% in Uganda, compared to 7% in
Ghana).
The three countries are more similar on baseline savings
metrics. The percentage of women that report holding
savings ranges from 35% in Ghana to 49% in Malawi and
62% in Uganda. However, less than 5% of women report
holding savings in formal environments – such as banks and
microfinance institutions. Given the low levels of formal
savings at the baseline, the sample was well suited for the
VSLA program. With only 19% of the female respondents
across the three countries having received a loan at the
baseline, there is also a potential need for the emergency
lending facilities that a VSLA allows for.
Balance Check
As Table A demonstrates, most of the key characteristics
that could affect the outcomes of the VSLA program are
well balanced between treatment and control groups across
all three countries. Households in the treatment group are
slightly wealthier than those in the control group, and
women are slightly better educated. In substantive terms,
however, these differences are small. More importantly, we
observe significant differences in school enrollment between
the treatment and control groups. School enrollment for
children of primary school age is significantly and
substantively higher in the treatment areas. This imbalance is
mostly driven by an imbalance in the Ghana data, but school
enrollment is slightly higher in the treatment group in
Malawi as well. It is important to keep this imbalance in
mind, since it will have implications for the interpretation of
our estimates of the impact of the VSLA program on school
enrollment.
Impact Assessment of Savings Groups Findings from Randomized Evaluations of CARE Village Savings and Loans Associations in Ghana, Malawi and Uganda
12
Characteristics of VSLAs:
a. Money accumulates over time
b. Members meet on a weekly basis
c. Members are allowed to take a loan from the group
d. Members have received or expect to receive a share-out
e. Groups were formed with the help of a trainer
f. Groups deposit funds in a box
SECTION 4. UPTAKE AND USES OF VSLAS
To be able to study who joins a VSLA and who doesn’t, the
first task at hand is to identify VSLA members in our
sample. This is not an obvious task, since many types of
savings groups exist, respondents don’t know the term
VSLA and, if respondents are in a savings group that was
formed by an NGO, they often don’t know the name of the
organization that provided training.
In our adult surveys, we asked primary respondents whether
they had saved in a group in the two years leading to the
endline survey. If they had, we asked about the various
characteristics of the group to determine whether it was a
ROSCA, VSLA or other type of ASCA. By asking
respondents if the money accumulates in their group, or if
one person takes the entire pot at each meeting, we
distinguish between a ROSCA and an ASCA. We then
define VSLAs as ASCAs that meet on a weekly basis, keep
group funds secure in a box, allow members to take a loan
from the group, and were formed with the help of a trainer.
In this section, we will first compare characteristics of
VSLA members to those of non-members and attempt to
identify predictors of VSLA membership. Next, we describe
how members report using the financial instruments
provided by the VSLA. We then present take-up figures and
look at the trends of group formation and replication beyond
the primary villages in Malawi and Uganda.
4A - Characteristics of VSLA Members
Before getting to the quantitative comparison of members’
and non-members, we briefly discuss the findings of a set of
focus groups discussions conducted in Malawi 17 months
after the launch of the program. The goal of these focus
groups was to determine why members had joined a VSLA,
while others in the community had not.
Overall, frequency of meetings and geographic proximity
were presented as the main reasons to join a VSLA.
Discussions conducted amongst people in program
communities who had not yet joined a group revealed that
these people were initially distrustful, or had misunderstood
how such groups worked. After their initial hesitance
however, many of the participants were waiting for the
opportunity to start a group. Anecdotally, we were not able
to detect important differences in the focus group between
VSLA members and nonmembers in terms of socio-
economic status, education levels and ties with the
community. (Appendix II)
In a quantitative analysis, we compared baseline
characteristics of VSLA members with those of non-
members in our sample. Our findings are presented in Table
D. Data from the pooled dataset of study participants across
the three countries show significant differences between the
two groups. The comparison shows that the women who
joined a VSLA had a larger household at the baseline, with
slightly older children than non-members. Their households
were significantly wealthier, as shown by a 0.36 standard
deviation difference in the asset index - a principal
components index of assets owned by the household.
A comparison of ownership of selected assets confirms this
difference in wealth. Members’ households are 4.4
percentage points more likely to own a cell phone and a
bicycle at the baseline, and 4 percentage points more likely
to have a roof made from an iron sheet. Members are also
more likely to have had access to electricity in their house at
the baseline.
While we do not find a statistically significant difference in
the pooled sample for indicators of business ownership, both
Malawi and Uganda show that VSLA members were
significantly more likely to have had a business at the
baseline, by 10.4 and 5.6 percentage points respectively.
There are no statistically significant differences in age and
literacy levels between members and non-members in the
pooled sample. These results are largely being driven by
strong variation in how education affects participation in
VSLAs at the country level. In Uganda and Malawi, more
educated community members are more likely to participate
Impact Assessment of Savings Groups Findings from Randomized Evaluations of CARE Village Savings and Loans Associations in Ghana, Malawi and Uganda
13
and members were more literate than non-members, by 12
and 10 percentage points respectively. In Uganda 51% of
members had attended school for at least 5 years while only
40% of non-members had done so. Members in Uganda
were also on average 2 years older than non-members. By
contrast, neither educational attainment nor age is correlated
with VSLA participation in Ghana.
Members are 6 percentage points more likely than non-
members to have held any savings at the baseline survey;
this difference is particularly significant in Uganda where
73% had some savings compared to 58% of non-members.
In Malawi members were 3 percentage points more likely to
have a savings account with a formal institution. We find
similar differences in credit use: members across the three
countries were 4 percentage points more likely to have
received a loan before the baseline survey.
A comparison of the community integration index shows
that members were more likely to be more integrated into
the community than non-members at the baseline.5 Members
in Malawi and Uganda were also significantly less likely to
be able to influence decisions taken by the household than
non-members.6 We see no impact of the degree of women’s
empowerment on VSLA participation in Ghana.
To conclude, members and non-members differ significantly
when we compare the two groups based on baseline
characteristics. Members are wealthier, more literate and
also have more access to, or experience with, financial tools.
In addition, they are more integrated into the community,
and in two countries, report more influence when taking
decisions in the household.
In addition to comparing unconditional means between
members and non-members, we run a multivariate analysis
where we regress VSLA take-up on a set of baseline
household, individual and village characteristics. For these
regressions, we use the treatment group only. The findings
are presented in Table E.
The pooled sample shows that primary respondents in
households that had at least one business at the baseline are
4.2 percentage points more likely to join a VSLA. The
coefficient is 13.7 and 12.7% in Ghana and Malawi,
5 see Appendix III for index definition.
6 ibid.
respectively, while the point estimate is positive, but not
significant, in Uganda.
We divide our respondents across four income quartiles
based on the asset index discussed above. We find that
respondents in the richest quartile are 3.5 percentage points
more likely join a group than their peers. Wealthier
respondents are more likely to join groups in all three
countries, with members of the top quartiles in Ghana and
Malawi being 11.0 and 7.5 percentage points more likely to
join a group, respectively, and members of the third quartile
in Uganda being nearly 5 percentage points more likely to
join a VSLA.
Respondents in the 26 to 40 year-old age bracket appear to
be significantly more likely than both their younger and
older peers to join a VSLA. Literacy is a strong predictor of
membership in Malawi and Uganda, where literate
respondents are 8 percentage points more likely to become a
member of a group. However, literacy is not a significant
predictor of VSLA membership in Ghana.
In Ghana, use of credit is a particularly strong predictor for
membership where respondents that had received a loan
before the program are 19.8 percentage points more likely to
join a VSLA group. In Uganda the same group is 5.4
percentage points more likely to join a VSLA. Holding
savings at the baseline in Uganda leads to a 9.5 percentage
point higher likelihood to be in a VSLA; this is the only
country where we find a link between savings before the
program, and VSLA membership.
Higher integration and participation in the community also
appear to be significant predictors of membership in a VSLA
in the Malawi and Uganda samples.
We conclude by presenting a couple of country-specific
predictors that are not available for all three sites. In
Uganda, we collected information on VSLA take-up for
primary men as well as women. Not surprisingly, we find
that women are much more likely to become VSLA
members (10 percentage points). Finally, the Malawi
baseline included a set of questions to measure respondents’
aversion to risk and to determine whether an individual was
present-biased. We find that members that were more risk
averse at baseline are significantly (5.2 percentage points)
more likely to join a group.
Impact Assessment of Savings Groups Findings from Randomized Evaluations of CARE Village Savings and Loans Associations in Ghana, Malawi and Uganda
14
4B - Uses of Financial Tools
In this section, we provide information reported by members
of VSLAs on the financial instruments that they use and the
ways in which they spend funds from the groups. Focus
group discussions conducted in Malawi sought to gather
qualitative information on the ways in which VSLA
members contributed to and benefitted from the groups.
Respondents reported having taken loans from VSLAs in
order to take advantage of new business opportunities as
well as to weather emergencies and support food
consumption in difficult times. Share-outs provide members
with a means to invest in productive activities; Malawian
respondents report using share-outs for expenditures ranging
from agricultural inputs and business investments to house
repairs and education. (Appendix II)
The survey data collected in the three countries that
comprise our study confirms these qualitative observations.
The timeline of data collection activities is in Section 2.
Table B presents the ways in which members use the
financial instruments provided by VSLAs. The pooled
sample shows that share outs are most commonly used to
fund education expenses (16%) and food consumption (16%
as well). In addition, 14% spent the funds on non-fertilizer
agricultural inputs while 13% used the funds to pay for
business expenses. About 61% of members had received a
share-out at the time of the endline survey while 68% had
taken at least one loan from the group. The most common
reported uses of loans are business investments (29%) and
food and education expenditures (13% each.)
In most instances, VSLAs also give members access to an
emergency fund, used by the group to assist members in
difficult situations. The pooled sample reveals that about
38% of members had received assistance from the group
through this tool. The most common uses of these funds are
for health expenses (56%) and funeral expense (17%).
In the following paragraphs, we discuss in detail the share of
members that has accessed the financial products offered by
the VSLAs in each of the three countries and discuss the
more common uses of the funds made available by the
groups.
In Ghana, members typically contribute about one Ghana
Cedi ($0.66) per week to the VSLA. As Table C shows,
median contribution levels are consistent across time and do
not seem to increase significantly with the age of the group.
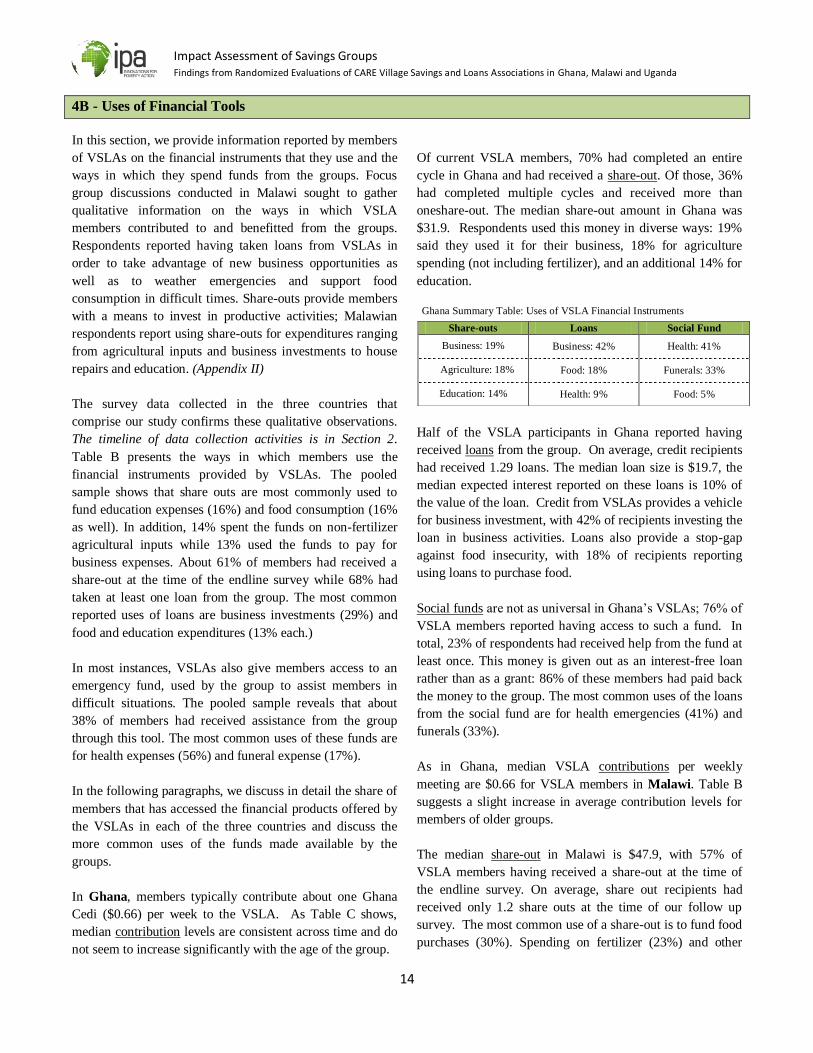
Of current VSLA members, 70% had completed an entire
cycle in Ghana and had received a share-out. Of those, 36%
had completed multiple cycles and received more than
oneshare-out. The median share-out amount in Ghana was
$31.9. Respondents used this money in diverse ways: 19%
said they used it for their business, 18% for agriculture
spending (not including fertilizer), and an additional 14% for
education.
Ghana Summary Table: Uses of VSLA Financial Instruments
Half of the VSLA participants in Ghana reported having
received loans from the group. On average, credit recipients
had received 1.29 loans. The median loan size is $19.7, the
median expected interest reported on these loans is 10% of
the value of the loan. Credit from VSLAs provides a vehicle
for business investment, with 42% of recipients investing the
loan in business activities. Loans also provide a stop-gap
against food insecurity, with 18% of recipients reporting
using loans to purchase food.
Social funds are not as universal in Ghana’s VSLAs; 76% of
VSLA members reported having access to such a fund. In
total, 23% of respondents had received help from the fund at
least once. This money is given out as an interest-free loan
rather than as a grant: 86% of these members had paid back
the money to the group. The most common uses of the loans
from the social fund are for health emergencies (41%) and
funerals (33%).
As in Ghana, median VSLA contributions per weekly
meeting are $0.66 for VSLA members in Malawi. Table B
suggests a slight increase in average contribution levels for
members of older groups.
The median share-out in Malawi is $47.9, with 57% of
VSLA members having received a share-out at the time of
the endline survey. On average, share out recipients had
received only 1.2 share outs at the time of our follow up
survey. The most common use of a share-out is to fund food
purchases (30%). Spending on fertilizer (23%) and other
Share-outs Loans Social Fund
Business: 19% Business: 42% Health: 41%
Agriculture: 18% Food: 18% Funerals: 33%
Education: 14% Health: 9% Food: 5%

Impact Assessment of Savings Groups Findings from Randomized Evaluations of CARE Village Savings and Loans Associations in Ghana, Malawi and Uganda
15
agricultural items (12%) are reported as uses for these funds
as well, while 19% report having spent the funds on house
repairs.
About two-thirds of members in Malawi had taken out at
least one loan from the group at the endline, with an average
of 1.9 loans. The median loan size is $18.2, and members
paid back - or expected to pay back - 10% interest on the
principal. Consistent with the profile described above, the
majority of VSLA loans are used for business investments
(40%). Food consumption is the second most important loan
use, with an 18% share, while health and education are
rarely mentioned.
The data shows that aid from the social fund in Malawi is
mostly distributed in the form of a grant. While nearly every
group has a social fund, 27% of the respondents reported
having ever received a transfer from the fund. The fund is
mostly accessed for health (61%) and funeral expenses
(10%), but it is also helpful for paying for educational
expenses (8%) and for food consumption (7%).
In Uganda, the median weekly deposit amount is $ 0.84, the
breakdown for which is presented in Table C and suggests
that members of more mature groups increase their
contributions slightly. The median for groups formed in the
second semester of the program is $1.05.
Malawi Summary Table: Uses of VSLA Financial Instruments
Similar to Malawi, 56% of VSLA members in Uganda have
completed a whole cycle and gone through at least one
share-out. Among these members, the average number of
share-outs is 1.3. The median share-out size is about $42.2.
Respondents use these funds for education expenses (27%),
livestock purchases (17%), food consumption and house
repairs (16% each).
Uganda Summary Table: Uses of VSLA Financial Instruments
In Uganda, 85% of members declare having taken out a loan
from the group at least once, with a median loan amount of
$20.8 per person. Members paid back, or expected to pay
back, about 10% more than the principal loan. On average,
each borrower took out 2.1 loans from the VSLA at the time
of the endline survey. Loans are mainly used to fund
education (24%) and health (18%) expenses, although 13%
of loan recipients report having invested funds in their
business.
Finally, 93% of VSLA members in Uganda say that their
VSLA has a social fund. The fund is most commonly dis-
bursed in the form of an emergency loan that members have
to pay back to the group. A high percentage of members
(61%) had received one of these loans at the time of the
endline survey. Paying for health expenses was by far the
most common use of credit from the social fund (59%).
Share-outs Loans Social Fund
Education: 27% Education: 24% Health: 59%
Livestock: 17% Health: 18% Education: 10%
Food: 16%
Health: 16% Business: 13% Food: 9%
Share-outs Loans Social Fund
Food: 30% Business: 42% Health: 61%
Fertilizer: 23% Food: 20% Funerals: 26%
House: 19% Agriculture: 8% Food: 5%

Impact Assessment of Savings Groups Findings from Randomized Evaluations of CARE Village Savings and Loans Associations in Ghana, Malawi and Uganda
16
4C - Uptake and Replication
Across the three countries included in this study, we find
that 31.2% of female primary respondents participate in a
VSLA in treatment areas at the time of the endline survey. In
the control areas, we find 6.2% of women participating in a
VSLA. (Table 1.A.)
In the next paragraphs, we discuss take-up country by
country. Take-up figures are presented in Table C.
In Ghana, we collected endline data approximately 30
months from the beginning of the program. In treatment
areas, 35.7% of female primary respondents report
participating in a VSLA during the past two years, while a
relatively high 8.4% of women in control areas report
participation. As Table B shows, the median number of
participants in a savings groups in Ghana is 23. Given the
earlier start of the program implementation in Ghana, most
groups were older than the ones in the other two countries:
the average group member had been part of the group for
about 20 months. One tenth of VSLA members also partake
in another type of ASCA, while 2% are also members of a
ROSCA. In Ghana, about 3 out of 4 members say that their
VSLA has a social or emergency fund.
In Malawi, 21.8% of female primary respondents in
treatment areas participate in VSLAs. We find very little
take-up in the control areas in Malawi, with only 2.6% of
respondents in the control group having joined a group that
has the characteristics of a VSLA. As Table C shows, take-
up in the control group seems to be a fairly recent
phenomenon, attributable to a spillover of program activities
beyond a cluster’s borders, or due to households travelling to
treatment villages to join a group. Groups in Malawi are
smaller than the ones in the other two countries, with a
median of 19 members in each group. The average group
was formed about 12 months before the endline survey.
Only 2% of VSLA members also reports being part of a
ROSCA, and a similar percentage is also a member of
another ASCA.
In treatment clusters in Uganda, we find that 35.5% of
women are part of a VSLA at the time of the endline survey.
Take-up in control areas is 6.4%. VSLAs have a median size
of 30 members and were created, on average, 14 months
before the endline survey. Uganda displays higher levels of
diffusion of informal groups compared to the other two sites.
This is evident when looking at the percentage of VSLA
members that are part of other groups. Table B shows that
32% of VSLA members are also part of another ASCA; of
these, about one-third is part of more than one VSLA. The
penetration rate of ROSCAs is also high, with 26% of VSLA
members also part of a ROSCA.
Control group uptake
Our follow up survey found take-up in control areas, with
6.2% of respondents reporting being members of a VSLA.
Take-up in the control areas is likely caused by a
combination of factors.
First, other implementers may have initiated VSLAs in
control areas. In our village survey, we asked village leaders
for the names of the organizations that trained community
members to organize the savings groups. This data was
difficult to collect as respondents often did not know or
remember if the trainer was affiliated with a particular
organization. Despite the selection of areas with no ongoing
VSLA programming, some of our research areas might still
have groups formed before the study that continued their
activity.
Second, VSLAs are designed to be self-replicating and self-
sustaining. Members of existing groups may wish to start
new groups in surrounding communities. In addition, other
communities may witness the benefits of the savings groups
and begin to organize the groups on their own. This
spontaneous replication may have contributed to the creation
of the savings groups present in control areas at the time of
our follow up survey.
Third, community members may travel to treatment areas to
participate in VSLAs. The take-up rates presented in this
32%
36%
22%
36%
6% 8%
3%
6%
Pooled Ghana Malawi Uganda
Graph 4.1 - VSLA Take-Up Treatment
Control
Impact Assessment of Savings Groups Findings from Randomized Evaluations of CARE Village Savings and Loans Associations in Ghana, Malawi and Uganda
17
study reflect the share of individuals that partake in the
savings groups – regardless of where these groups are
located. Despite our efforts to choose treatment and control
areas that were adequately far apart from each other, it is
possible that community members in control areas would
travel to participate in the groups.
Finally, it is also possible that trainers from implementing
organizations and village agents did not adhere to the
research protocol and supported groups beyond the assigned
program areas.
It is difficult to assess the relative contribution of these
different factors. As mentioned earlier, respondents did not
always know the full name of the person who trained their
group, and often did not know whether the trainer was
affiliated with a particular organization. As groups continue
to replicate, it becomes less clear as to which groups are
products of the efforts of an organization, and which should
simply be credited to entrepreneurial community members.
In response to our discovery of VSLAs in the control areas
in Ghana, our research staff revisited these communities to
further investigate the creation of these groups. We found
that some of the trainers were indeed trained by staff of
implementing partners. This shows how, as the surrounding
communities learn from the experience of the program areas,
demand for VSLAs develops in control villages and it
becomes increasingly difficult for implementing partners to
enforce research protocols.
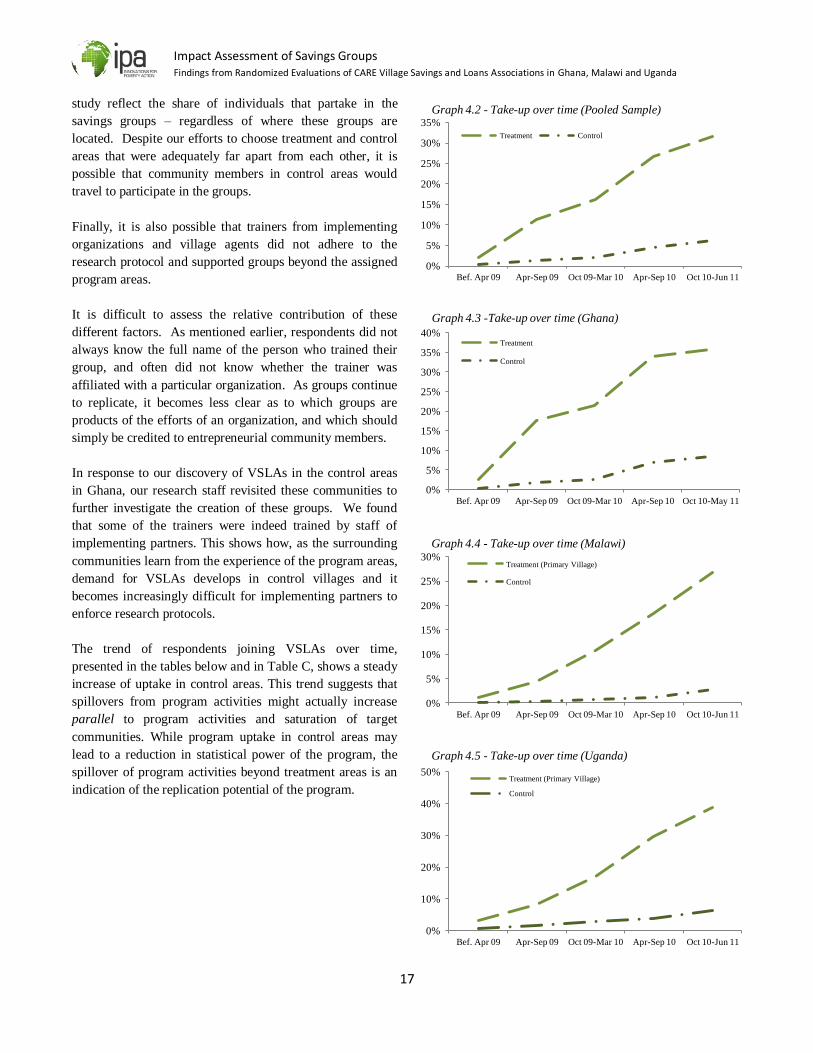
The trend of respondents joining VSLAs over time,
presented in the tables below and in Table C, shows a steady
increase of uptake in control areas. This trend suggests that
spillovers from program activities might actually increase
parallel to program activities and saturation of target
communities. While program uptake in control areas may
lead to a reduction in statistical power of the program, the
spillover of program activities beyond treatment areas is an
indication of the replication potential of the program.
0%
5%
10%
15%
20%
25%
30%
35%
Bef. Apr 09 Apr-Sep 09 Oct 09-Mar 10 Apr-Sep 10 Oct 10-Jun 11
Graph 4.2 - Take-up over time (Pooled Sample)
Treatment Control
0%
5%
10%
15%
20%
25%
30%
35%
40%
Bef. Apr 09 Apr-Sep 09 Oct 09-Mar 10 Apr-Sep 10 Oct 10-May 11
Graph 4.3 -Take-up over time (Ghana)
Treatment
Control
0%
5%
10%
15%
20%
25%
30%
Bef. Apr 09 Apr-Sep 09 Oct 09-Mar 10 Apr-Sep 10 Oct 10-Jun 11
Graph 4.4 - Take-up over time (Malawi)
Treatment (Primary Village)
Control
0%
10%
20%
30%
40%
50%
Bef. Apr 09 Apr-Sep 09 Oct 09-Mar 10 Apr-Sep 10 Oct 10-Jun 11
Graph 4.5 - Take-up over time (Uganda)
Treatment (Primary Village)
Control
Impact Assessment of Savings Groups Findings from Randomized Evaluations of CARE Village Savings and Loans Associations in Ghana, Malawi and Uganda
18
Replication
Adhesion to VSLAs in treatment communities increased
steadily throughout the study period. This trend is clearly
illustrated in Table C, and the graph below presents the share
of respondents that joined a VSLA over time.
Two mechanisms are likely to contribute to the spread of
VSLAs over time. The first is an increase in demand for
VSLAs. This may increase gradually as people in the village
become familiar with the groups and their utility by
observing the experience of early adopters. Focus group
discussions with non-members in Malawi confirm that most
respondents became interested in joining a VSLA after
witnessing their peers take out loans and collect share-outs.
Having seen their friends and family afford school fees and
buy assets and fertilizer, non-members became aware of the
potential of the program, and some of them contacted the
village agents and asked to be trained.
The second mechanism is a supply-based one. After an
initial set of groups is formed and trained, trainers and field
officers can begin forming new groups. As discussed above,
the fee-for-service village agent (VA) model has the
potential to multiply the capacity of the program to supply
village members, with training and supervision, to form
VSLAs. Anecdotal evidence from the focus groups shows
that supply-side limitations are an important determinant of
uptake. In focus groups conducted in Malawian communities
17 months after the beginning of the program, community
members explained that they were waiting for an
opportunity to be trained by a village agent, as the existing
groups in their community had already reached the
maximum number of members. (Appendix II)
The remainder of this section will look at replication in
Malawi and Uganda. In these two sites, the Access Africa
program explicitly included a focus on replication of the
program in the communities surrounding a primary target
village. This involved the deployment of village agents
(VAs) – group members trained to become facilitators and
trainers of new groups – in Malawi, and community based
trainers (CBTs) in Uganda.
As discussed in detail in Section 3, our research clusters in
Malawi and Uganda were explicitly designed to capture the
replication of the program beyond the primary communities.
The objective was to understand the extent to which the
program spreads in the areas surrounding the village. In each
cluster, we collected information on households in a
secondary village located within a radius of 4 km from the
primary village. The location of these secondary villages
was not disclosed to the implementing partners in order to
avoid targeting.
As the operational strategies for replication and the
recruitment of village agents were different across the two
sites, we present these statistics on a country level. Table C
breaks down take-up rates for these two countries in primary
and secondary villages. The two charts below illustrate take-
up trends in primary and secondary villages. We compare
group characteristics in primary and secondary villages for
each country.
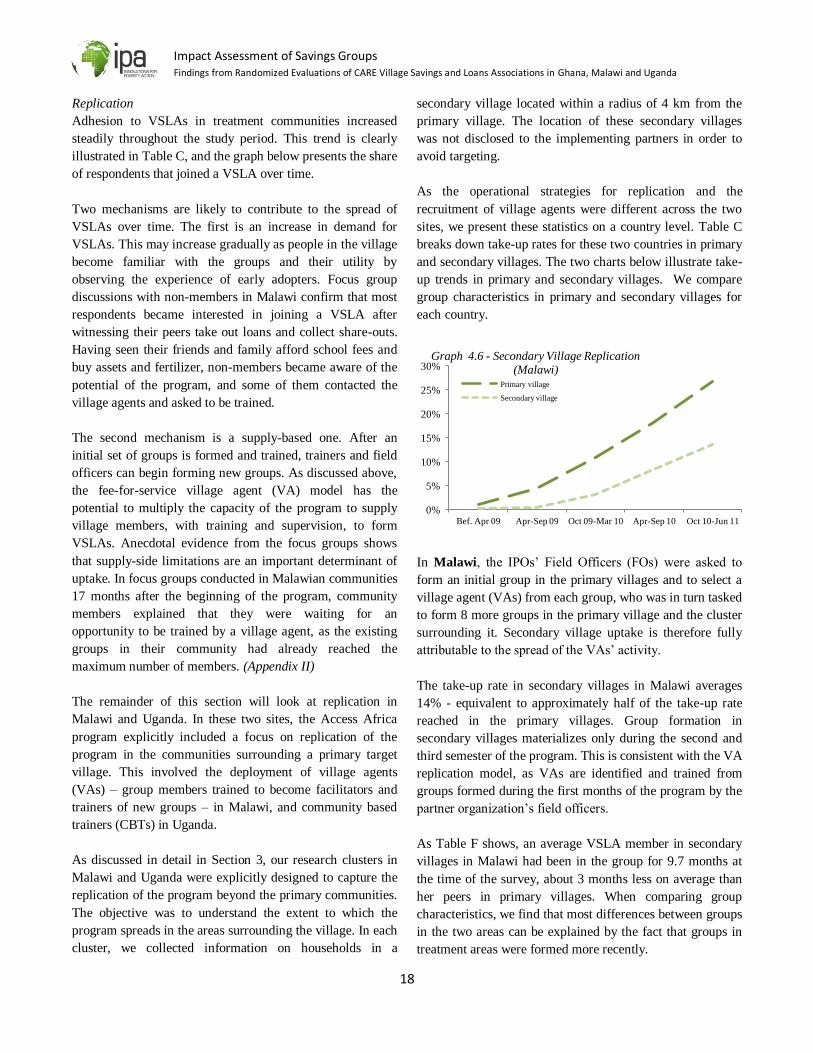
In Malawi, the IPOs’ Field Officers (FOs) were asked to
form an initial group in the primary villages and to select a
village agent (VAs) from each group, who was in turn tasked
to form 8 more groups in the primary village and the cluster
surrounding it. Secondary village uptake is therefore fully
attributable to the spread of the VAs’ activity.
The take-up rate in secondary villages in Malawi averages
14% - equivalent to approximately half of the take-up rate
reached in the primary villages. Group formation in
secondary villages materializes only during the second and
third semester of the program. This is consistent with the VA
replication model, as VAs are identified and trained from
groups formed during the first months of the program by the
partner organization’s field officers.
As Table F shows, an average VSLA member in secondary
villages in Malawi had been in the group for 9.7 months at
the time of the survey, about 3 months less on average than
her peers in primary villages. When comparing group
characteristics, we find that most differences between groups
in the two areas can be explained by the fact that groups in
treatment areas were formed more recently.
0%
5%
10%
15%
20%
25%
30%
Bef. Apr 09 Apr-Sep 09 Oct 09-Mar 10 Apr-Sep 10 Oct 10-Jun 11
Graph 4.6 - Secondary Village Replication (Malawi)
Primary village
Secondary village
Impact Assessment of Savings Groups Findings from Randomized Evaluations of CARE Village Savings and Loans Associations in Ghana, Malawi and Uganda
19
The relatively short duration of the groups in the secondary
villages most likely leads to the differences in the median
size of loans in primary ($19.9) and secondary ($13.3)
villages. This is consistent with lower balances accumulated
in the newer groups. Not surprisingly, only 42% of
secondary village groups had shared out at the time of the
endline survey, 15 percentage points less than in the primary
villages.
Characteristics of the group that do not correspond with
group duration show no difference between the village types.
The median number of members is identical in primary and
secondary villages. Loan use and access to the social fund
do not differ significantly across the two sites, nor does the
weekly contribution amount, or the size of the share-outs
that were received.
Perhaps because of the relatively limited access to VSLAs,
we find that VSLA members in secondary villages are more
likely to also be part of a ROSCA. This is consistent with
our findings – presented in the impact section of this report –
that the presence of VSLAs crowds out ROSCA
membership slightly.
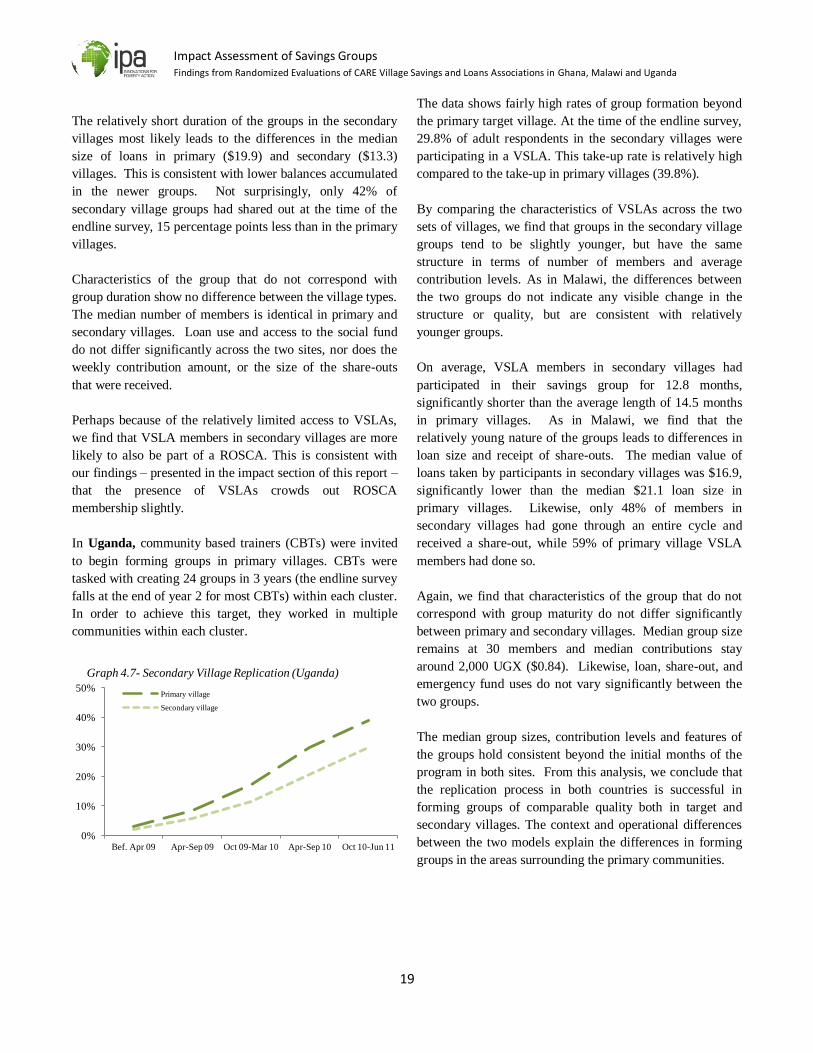
In Uganda, community based trainers (CBTs) were invited
to begin forming groups in primary villages. CBTs were
tasked with creating 24 groups in 3 years (the endline survey
falls at the end of year 2 for most CBTs) within each cluster.
In order to achieve this target, they worked in multiple
communities within each cluster.
The data shows fairly high rates of group formation beyond
the primary target village. At the time of the endline survey,
29.8% of adult respondents in the secondary villages were
participating in a VSLA. This take-up rate is relatively high
compared to the take-up in primary villages (39.8%).
By comparing the characteristics of VSLAs across the two
sets of villages, we find that groups in the secondary village
groups tend to be slightly younger, but have the same
structure in terms of number of members and average
contribution levels. As in Malawi, the differences between
the two groups do not indicate any visible change in the
structure or quality, but are consistent with relatively
younger groups.
On average, VSLA members in secondary villages had
participated in their savings group for 12.8 months,
significantly shorter than the average length of 14.5 months
in primary villages. As in Malawi, we find that the
relatively young nature of the groups leads to differences in
loan size and receipt of share-outs. The median value of
loans taken by participants in secondary villages was $16.9,
significantly lower than the median $21.1 loan size in
primary villages. Likewise, only 48% of members in
secondary villages had gone through an entire cycle and
received a share-out, while 59% of primary village VSLA
members had done so.
Again, we find that characteristics of the group that do not
correspond with group maturity do not differ significantly
between primary and secondary villages. Median group size
remains at 30 members and median contributions stay
around 2,000 UGX ($0.84). Likewise, loan, share-out, and
emergency fund uses do not vary significantly between the
two groups.
The median group sizes, contribution levels and features of
the groups hold consistent beyond the initial months of the
program in both sites. From this analysis, we conclude that
the replication process in both countries is successful in
forming groups of comparable quality both in target and
secondary villages. The context and operational differences
between the two models explain the differences in forming
groups in the areas surrounding the primary communities.
0%
10%
20%
30%
40%
50%
Bef. Apr 09 Apr-Sep 09 Oct 09-Mar 10 Apr-Sep 10 Oct 10-Jun 11
Graph 4.7- Secondary Village Replication (Uganda)
Primary village
Secondary village
Impact Assessment of Savings Groups Findings from Randomized Evaluations of CARE Village Savings and Loans Associations in Ghana, Malawi and Uganda
20
SECTION 5. IMPACT ASSESSMENT
In this section, we present our findings of the impacts of the
VSLA program on the households in our sample. We first
set forth a theory of change to describe how savings groups
might affect participants, their households and their
communities. VSLAs can lead to changes in the tools that
respondents use to manage expenditures and investments.
These short-term changes in behavior, and the prolonged
usage of a wider set of financial tools, may in the long run
lead to the creation of wealth and ultimately, changes in the
well being of households.
Our results are organized around this theory. We test for
impacts on each of the areas below:
a. Financial Management
b. Income Generating Activities
c. Women’s Empowerment
d. Reactions to Shocks and Food Security
e. Expenditures and Consumption
f. Education
g. Health
h. Asset Accumulation
We present impact estimates for the individual countries
(Table 2) as well as for the pooled sample (Table 1).7 The
large sample size of the pooled sample allows us to detect
impacts that are significant in the overall sample but might
be present on too small a scale in each individual country to
be detected there. Furthermore, in spite of some operational
differences in the program implementation, the program in
the three countries was very similar and our theory of
change and hypotheses about impacts are the same for the 3
countries. For these two reasons, our preferred analysis is
based on the pooled sample.
This study reflects a snapshot in time along the theory of
change. We collected data approximately 30 months after
implementation had begun in Ghana and after roughly 22
months in Uganda and Malawi. The pooled sample across
7 The impact estimates presented in the tables were obtained by running
ordinary least squares (OLS) regressions of the outcome variable on a
treatment indicator and a set of district dummies. When available, the
baseline value of the outcome variable is included as a control variable. No
further control variables were included. The clustering of standard errors is
at the level at which the randomization was conducted – i.e. the village in
Ghana and the cluster of primary and secondary villages in Malawi and
Uganda.
the three sites shows that about 31.2% of respondents were
part of a VSLA at the time of the endline survey. While it is
possible to test whether the creation of VSLAs led to a
change in the use of financial tools and other behaviors
directly affected by the instruments and opportunities
created by the groups, the study timeline is likely too short
to yield significant welfare impacts from the program.
As discussed in the previous sections, when thinking about
the potential impacts of the program, it is important to note
that VSLAs form over time. At the time of the endline
survey, members had participated in a group for an average
of 15 months, and about 61% of them had already completed
their first cycle. With cycles normally lasting between 8 and
12 months, our sample is mostly comprised of members of
fairly young groups.
Our analysis measures the impact of the program on the
people living in communities assigned to receive the
program, regardless of whether and when any member of the
household joined a VSLA. This estimated impact is called
the intent-to-treat (ITT) effect, since it represents the average
impact on all individuals who were “intended” to receive the
service. All impacts presented in Tables 1 and 2, and
discussed in this section will be ITT estimates. In Part C of
this section, we discuss approaches to estimate the VSLA’s
direct effect on participating households. We will discuss
pros and limitations of each of these tools, and present
findings in Table 3. As a general point, the impact on the
households who participate is likely to be larger than the
average impact on everyone in a village, as long as the direct
impact of participation is stronger than any “spillover”
impact, i.e., the benefits one accrues from merely being in a
village that receives a VSLA but not participating in a
VSLA oneself. However, the main discussion focuses on the
ITT analysis.
Appendix III presents a glossary of the terminology used in the
analysis with respects to the sample of reference, statistical
significance and currency conversion. The appendix also lists the
variables that comprise the indices constructed for the analysis.

Impact Assessment of Savings Groups Findings from Randomized Evaluations of CARE Village Savings and Loans Associations in Ghana, Malawi and Uganda
21
5A - Theory of Change
The mechanism by which VSLAs may affect people’s lives
can be thought of as a chain of events, with short-run
behavioral changes from the program potentially leading to
welfare impacts in the long-run. In this section, we discuss a
theory of change, outlining our hypotheses about the impacts
of VSLAs and their sequencing.
As discussed above, VSLAs have three main components:
savings, loans and a social welfare fund. Thus, we begin by
testing whether this increased access to financial tools leads
to an overall change in the way VSLA members manage
their personal finances and the tools they use to finance
expenditures and investments. We define these as short-run
behavioral changes, immediate impacts that could
materialize over the first months of group membership and
to grow in tandem with the group financial portfolio, and the
confidence and trust that members have in it. If these
changes occur as a result of the program, we would expect to
be able to detect them for members that have been in a group
between 6 months and 2 years.
The groups function as commitment devices for regular
savings accumulation. We hypothesize that VSLAs will not
perfectly substitute for membership in other savings groups
and savings through other channels. As a result, we expect
members to save more on a regular basis, with the VSLA
being both an additional savings channel as well as a
commitment device to put money aside regularly, protecting
it from temptation and the reach of family and friends.
Access to loans from the VSLA may lead to an overall ex-
tension of credit to individuals with no previous access to
loans and an increase in the average loan amounts received
by respondents. Loans could be used to invest in income
generating activities, such as the purchase of agricultural and
business inputs. Improved credit and access to the group’s
emergency or social fund may allow members to smooth the
impacts of economic shocks, unforeseen health expendi-
tures and guarantee food security to the household. Loans
could be used to fund education expenses as well.
The regular interaction with other group members and the
control gained over the financial options offered by the
group may render women more confident and increase their
ability to influence decisions in their households and their
communities. This is likely to be a gradual process that
might take a year or two of membership to be detected.
At the end of the 8 to 12 month cycle, VSLA members re-
ceive a share-out of the savings accumulated, as well as
interest earned from the loans taken by group members dur-
ing the cycle. The availability of this large lump sum may
offset some of the reduction in expenditures that could result
from adopting a regular savings regime and may substantial-
ly increase most of the outcomes above.
Growing savings and loan volumes in more mature groups,
as well as long-term behavioral changes could lead to
substantial improvements in welfare outcomes over time.
Higher investment levels could lead to higher yields in
agriculture and to growth in business ownership as well
as increased profits. Access to savings groups may alleviate
the impact of shocks on the household, and easier access to
lump-sums through savings and loans may translate to
improvements in health indicators and education levels.
Households might also begin accumulating larger assets.
Food security, intra-household decision-making and –
more generally – members’ involvement in the community
are also hypothesized to improve with time.
The creation of welfare impacts in the longer-term is largely
dependent on the VSLA program’s ability to lead to
significant and relevant changes in short-term behavioral
indicators, such as usage of financial services to improve
investments and smooth financial shocks and expenditures.
On average, households that had joined a VSLA at the time
of the endline survey had been members for 12 months in
Malawi, 14 in Uganda, and 20 in Ghana. These numbers
place our study sample at a point in our theory of change
where we can test many of the behavioral impacts described
above. It might be too early, however, to detect significant
impacts on welfare outcomes. Groups might reasonably take
two to three years before we could observe measurable
changes in welfare indicators.
In the remainder of this section, we present our findings,
following the sequence of potential changes as outlined by
the theory of change. We start by testing impacts on
financial management, investments in income generating
activities, reactions to shocks, expenditures, consumption
smoothing, empowerment, and community participation. We
then look at impacts on risk coping, health and education,
and asset accumulation.
Impact Assessment of Savings Groups Findings from Randomized Evaluations of CARE Village Savings and Loans Associations in Ghana, Malawi and Uganda
22
5B - Impacts
1. Financial Management
We begin our analysis on the impact of the VSLA program
by examining whether respondents in treatment communities
change the way they manage their finances. We find that the
VSLA program increases members’ savings deposits and use
of credit, with an overall increase in net savings balances
(calculated by subtracting outstanding loans from current
total savings).
Focus Group Discussions
The focus group discussions conducted in both Malawi and
Uganda indicate that respondents in the study areas desire to
accumulate savings to mitigate highly seasonal incomes and
to afford lump sum expenditures. Many of the focus group
respondents currently save, but safety, accessibility and cost
are considerable barriers that limit their ability to accumulate
savings. Discussants note that formal savings institutions
such as banks and savings and credit cooperatives often
charge high fees, are far away, and may intimidate
community members. More informal means of savings such
as keeping money with family and friends may lead to
disagreements as well as loss of income. Finally, keeping
money at home leaves these savings vulnerable to
temptation spending or pressure from other household
members to spend.
Focus group discussants also report limited access to credit
to fund unexpected expenses and smooth irregular income
flows. Formal financial institutions are often difficult to
access and impose considerable screening processes. Lack of
understanding and mistrust are common barriers to access
for these institutions that, added to significant transportation
costs, lead respondents to prefer other credit sources.
Friends and relatives are the most common source of credit,
while moneylenders and traders, while considered
accessible, are generally treated as a last resort as they are
believed to lend at unfair terms. Informal savings groups
were also fairly common in Uganda at the time of the
baseline, but group mismanagement, barriers to entry and
liquidity constraints for loans were frequently cited issues
for these groups. A summary of focus group discussions is
provided in Appendix II.
VSLAs are designed to expand the financial portfolios of
community members by offering a safe, convenient
mechanism for accumulating savings and by providing easy
and convenient access to credit. The ability to meet the
weekly deposit commitment was presented as an important
achievement by VSLA members in focus groups discussions
in Malawi. Members explained that through the groups, they
have understood the importance of regular savings and
begun to work hard every week to find money to deposit, or
pay back the loans from the group.
This observation supports one of the basic assumptions of
our theory of change of the VSLA program: deposits in
VSLAs do not simply substitute for savings that would have
otherwise been held in other environments. VSLA members
might in fact increase total savings through the commitment
to regular minimum deposits, and the restricted access to
these deposits for the duration of the cycle.
If participants were already saving as much as they desired
before the VSLA intervention, we would expect to see a
reduction in the use of other savings channels, such as say
savings held at home or in banks. However, if respondents
were constrained in their ability to save by high entry or
transaction costs or other barriers, we may see a net increase
in saving and perhaps a reduction in non-essential expenses
or transfers.
A similar reasoning can be applied to the impact of VSLAs
on access to credit and transfers received from others. If the
available alternatives for borrowing money were too limited
for the needs of the household, we may find a net increase in
overall borrowing because of the program.
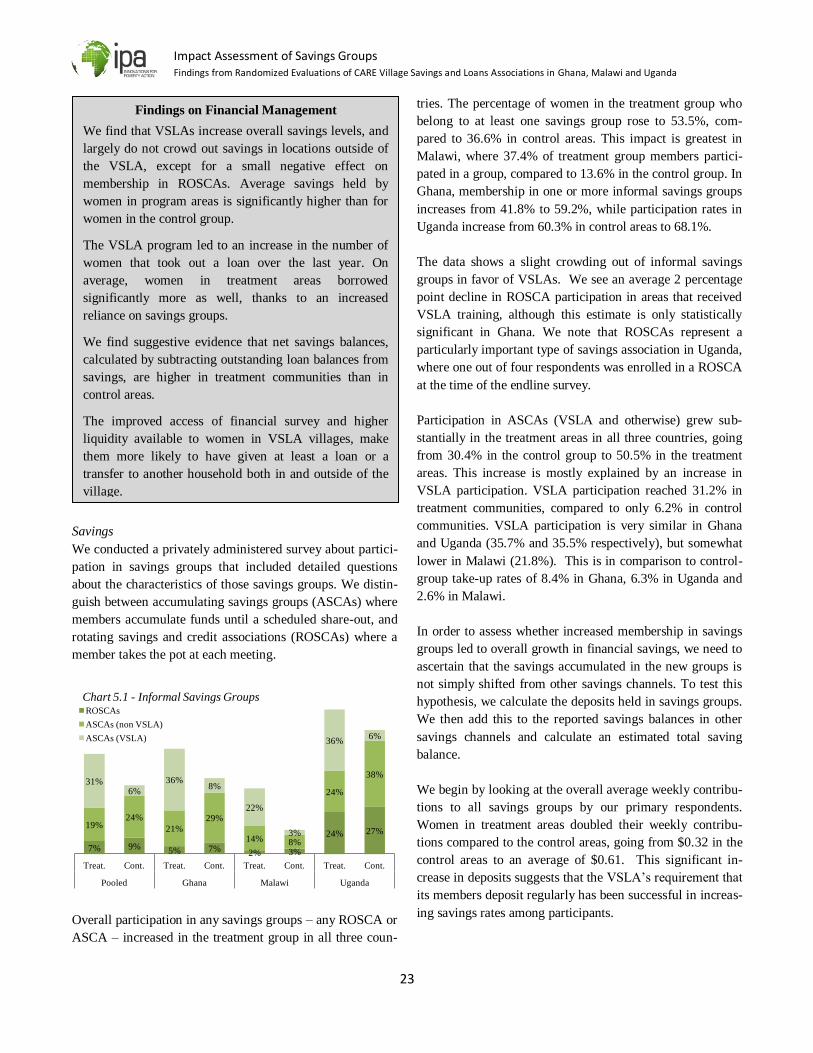
Impact Assessment of Savings Groups Findings from Randomized Evaluations of CARE Village Savings and Loans Associations in Ghana, Malawi and Uganda
23
Savings
We conducted a privately administered survey about partici-
pation in savings groups that included detailed questions
about the characteristics of those savings groups. We distin-
guish between accumulating savings groups (ASCAs) where
members accumulate funds until a scheduled share-out, and
rotating savings and credit associations (ROSCAs) where a
member takes the pot at each meeting.
Overall participation in any savings groups – any ROSCA or
ASCA – increased in the treatment group in all three coun-
tries. The percentage of women in the treatment group who
belong to at least one savings group rose to 53.5%, com-
pared to 36.6% in control areas. This impact is greatest in
Malawi, where 37.4% of treatment group members partici-
pated in a group, compared to 13.6% in the control group. In
Ghana, membership in one or more informal savings groups
increases from 41.8% to 59.2%, while participation rates in
Uganda increase from 60.3% in control areas to 68.1%.
The data shows a slight crowding out of informal savings
groups in favor of VSLAs. We see an average 2 percentage
point decline in ROSCA participation in areas that received
VSLA training, although this estimate is only statistically
significant in Ghana. We note that ROSCAs represent a
particularly important type of savings association in Uganda,
where one out of four respondents was enrolled in a ROSCA
at the time of the endline survey.
Participation in ASCAs (VSLA and otherwise) grew sub-
stantially in the treatment areas in all three countries, going
from 30.4% in the control group to 50.5% in the treatment
areas. This increase is mostly explained by an increase in
VSLA participation. VSLA participation reached 31.2% in
treatment communities, compared to only 6.2% in control
communities. VSLA participation is very similar in Ghana
and Uganda (35.7% and 35.5% respectively), but somewhat
lower in Malawi (21.8%). This is in comparison to control-
group take-up rates of 8.4% in Ghana, 6.3% in Uganda and
2.6% in Malawi.
In order to assess whether increased membership in savings
groups led to overall growth in financial savings, we need to
ascertain that the savings accumulated in the new groups is
not simply shifted from other savings channels. To test this
hypothesis, we calculate the deposits held in savings groups.
We then add this to the reported savings balances in other
savings channels and calculate an estimated total saving
balance.
We begin by looking at the overall average weekly contribu-
tions to all savings groups by our primary respondents.
Women in treatment areas doubled their weekly contribu-
tions compared to the control areas, going from $0.32 in the
control areas to an average of $0.61. This significant in-
crease in deposits suggests that the VSLA’s requirement that
its members deposit regularly has been successful in increas-
ing savings rates among participants.
7% 9% 5% 7% 2% 3%
24% 27% 19%
24%
21%
29%
14% 8%
24%
38% 31%
6%
36% 8%
22%
3%
36% 6%
Treat. Cont. Treat. Cont. Treat. Cont. Treat. Cont.
Pooled Ghana Malawi Uganda
Chart 5.1 - Informal Savings Groups ROSCAs
ASCAs (non VSLA)
ASCAs (VSLA)
Findings on Financial Management
We find that VSLAs increase overall savings levels, and
largely do not crowd out savings in locations outside of
the VSLA, except for a small negative effect on
membership in ROSCAs. Average savings held by
women in program areas is significantly higher than for
women in the control group.
The VSLA program led to an increase in the number of
women that took out a loan over the last year. On
average, women in treatment areas borrowed
significantly more as well, thanks to an increased
reliance on savings groups.
We find suggestive evidence that net savings balances,
calculated by subtracting outstanding loan balances from
savings, are higher in treatment communities than in
control areas.
The improved access of financial survey and higher
liquidity available to women in VSLA villages, make
them more likely to have given at least a loan or a
transfer to another household both in and outside of the
village.
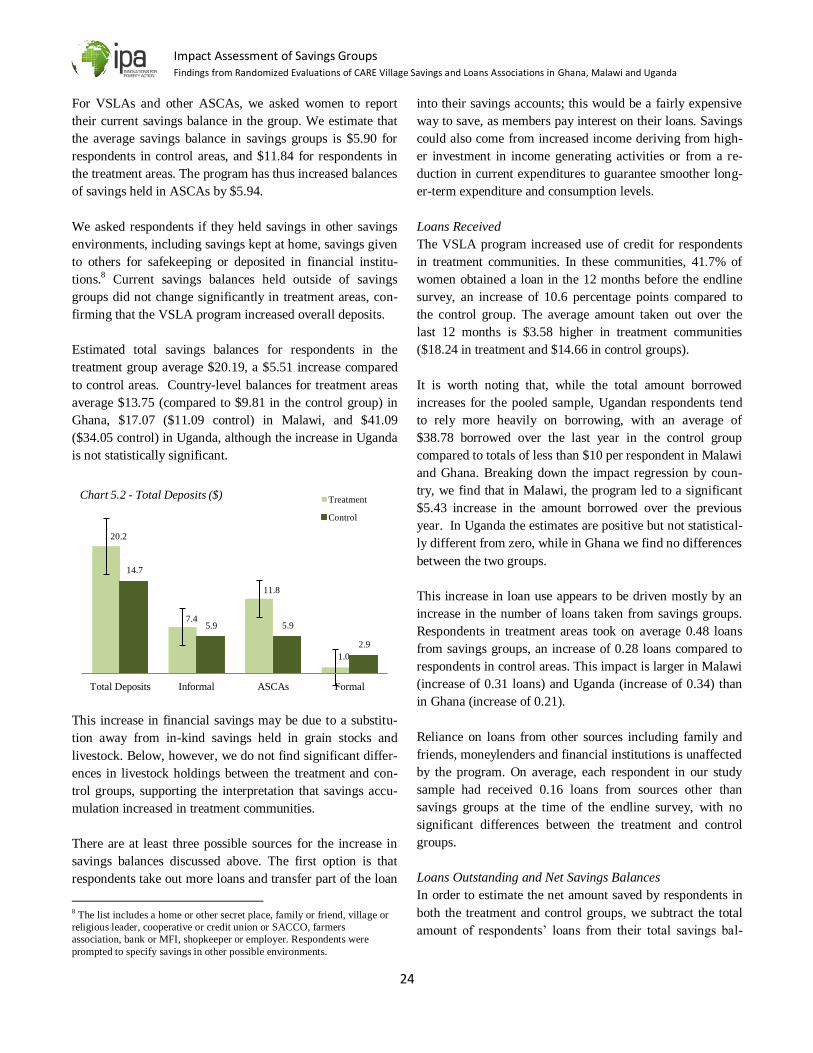
Impact Assessment of Savings Groups Findings from Randomized Evaluations of CARE Village Savings and Loans Associations in Ghana, Malawi and Uganda
24
For VSLAs and other ASCAs, we asked women to report
their current savings balance in the group. We estimate that
the average savings balance in savings groups is $5.90 for
respondents in control areas, and $11.84 for respondents in
the treatment areas. The program has thus increased balances
of savings held in ASCAs by $5.94.
We asked respondents if they held savings in other savings
environments, including savings kept at home, savings given
to others for safekeeping or deposited in financial institu-
tions.8 Current savings balances held outside of savings
groups did not change significantly in treatment areas, con-
firming that the VSLA program increased overall deposits.
Estimated total savings balances for respondents in the
treatment group average $20.19, a $5.51 increase compared
to control areas. Country-level balances for treatment areas
average $13.75 (compared to $9.81 in the control group) in
Ghana, $17.07 ($11.09 control) in Malawi, and $41.09
($34.05 control) in Uganda, although the increase in Uganda
is not statistically significant.
This increase in financial savings may be due to a substitu-
tion away from in-kind savings held in grain stocks and
livestock. Below, however, we do not find significant differ-
ences in livestock holdings between the treatment and con-
trol groups, supporting the interpretation that savings accu-
mulation increased in treatment communities.
There are at least three possible sources for the increase in
savings balances discussed above. The first option is that
respondents take out more loans and transfer part of the loan
8 The list includes a home or other secret place, family or friend, village or
religious leader, cooperative or credit union or SACCO, farmers
association, bank or MFI, shopkeeper or employer. Respondents were
prompted to specify savings in other possible environments.
into their savings accounts; this would be a fairly expensive
way to save, as members pay interest on their loans. Savings
could also come from increased income deriving from high-
er investment in income generating activities or from a re-
duction in current expenditures to guarantee smoother long-
er-term expenditure and consumption levels.
Loans Received
The VSLA program increased use of credit for respondents
in treatment communities. In these communities, 41.7% of
women obtained a loan in the 12 months before the endline
survey, an increase of 10.6 percentage points compared to
the control group. The average amount taken out over the
last 12 months is $3.58 higher in treatment communities
($18.24 in treatment and $14.66 in control groups).
It is worth noting that, while the total amount borrowed
increases for the pooled sample, Ugandan respondents tend
to rely more heavily on borrowing, with an average of
$38.78 borrowed over the last year in the control group
compared to totals of less than $10 per respondent in Malawi
and Ghana. Breaking down the impact regression by coun-
try, we find that in Malawi, the program led to a significant
$5.43 increase in the amount borrowed over the previous
year. In Uganda the estimates are positive but not statistical-
ly different from zero, while in Ghana we find no differences
between the two groups.
This increase in loan use appears to be driven mostly by an
increase in the number of loans taken from savings groups.
Respondents in treatment areas took on average 0.48 loans
from savings groups, an increase of 0.28 loans compared to
respondents in control areas. This impact is larger in Malawi
(increase of 0.31 loans) and Uganda (increase of 0.34) than
in Ghana (increase of 0.21).
Reliance on loans from other sources including family and
friends, moneylenders and financial institutions is unaffected
by the program. On average, each respondent in our study
sample had received 0.16 loans from sources other than
savings groups at the time of the endline survey, with no
significant differences between the treatment and control
groups.
Loans Outstanding and Net Savings Balances
In order to estimate the net amount saved by respondents in
both the treatment and control groups, we subtract the total
amount of respondents’ loans from their total savings bal-
20.2
7.4
11.8
1.0
14.7
5.9 5.9
2.9
Total Deposits Informal ASCAs Formal
Chart 5.2 - Total Deposits ($) Treatment
Control
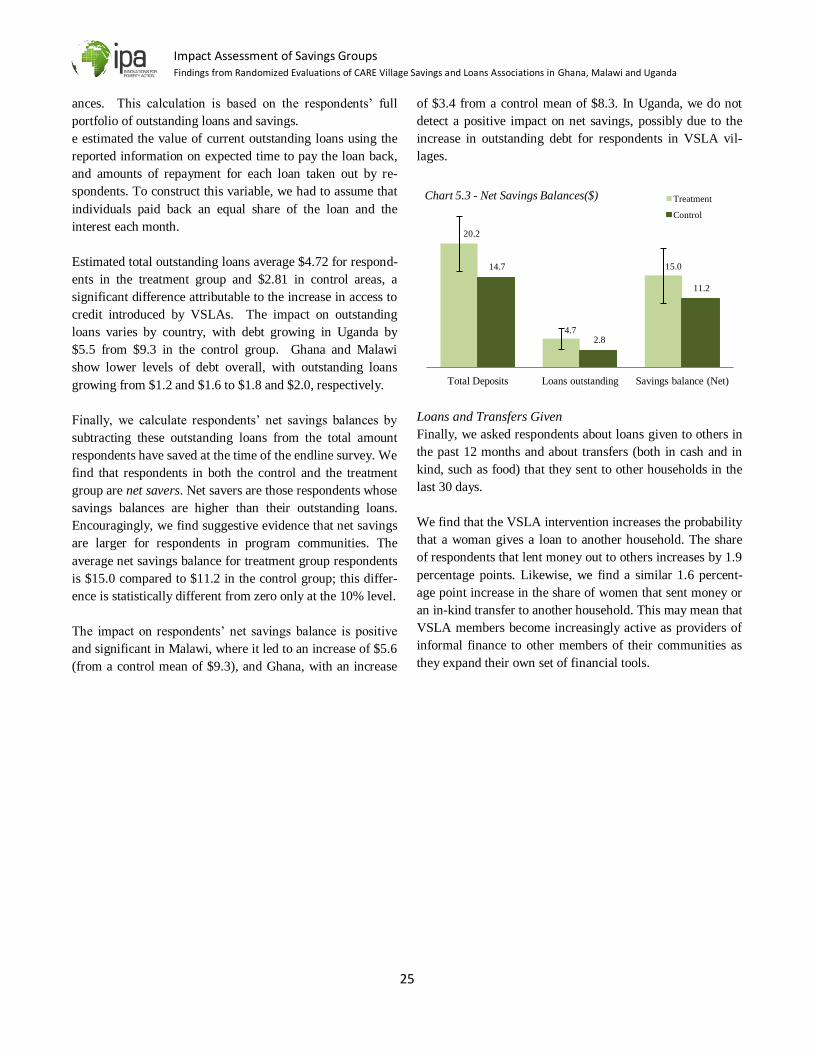
Impact Assessment of Savings Groups Findings from Randomized Evaluations of CARE Village Savings and Loans Associations in Ghana, Malawi and Uganda
25
ances. This calculation is based on the respondents’ full
portfolio of outstanding loans and savings.
e estimated the value of current outstanding loans using the
reported information on expected time to pay the loan back,
and amounts of repayment for each loan taken out by re-
spondents. To construct this variable, we had to assume that
individuals paid back an equal share of the loan and the
interest each month.
Estimated total outstanding loans average $4.72 for respond-
ents in the treatment group and $2.81 in control areas, a
significant difference attributable to the increase in access to
credit introduced by VSLAs. The impact on outstanding
loans varies by country, with debt growing in Uganda by
$5.5 from $9.3 in the control group. Ghana and Malawi
show lower levels of debt overall, with outstanding loans
growing from $1.2 and $1.6 to $1.8 and $2.0, respectively.
Finally, we calculate respondents’ net savings balances by
subtracting these outstanding loans from the total amount
respondents have saved at the time of the endline survey. We
find that respondents in both the control and the treatment
group are net savers. Net savers are those respondents whose
savings balances are higher than their outstanding loans.
Encouragingly, we find suggestive evidence that net savings
are larger for respondents in program communities. The
average net savings balance for treatment group respondents
is $15.0 compared to $11.2 in the control group; this differ-
ence is statistically different from zero only at the 10% level.
The impact on respondents’ net savings balance is positive
and significant in Malawi, where it led to an increase of $5.6
(from a control mean of $9.3), and Ghana, with an increase
of $3.4 from a control mean of $8.3. In Uganda, we do not
detect a positive impact on net savings, possibly due to the
increase in outstanding debt for respondents in VSLA vil-
lages.
Loans and Transfers Given
Finally, we asked respondents about loans given to others in
the past 12 months and about transfers (both in cash and in
kind, such as food) that they sent to other households in the
last 30 days.
We find that the VSLA intervention increases the probability
that a woman gives a loan to another household. The share
of respondents that lent money out to others increases by 1.9
percentage points. Likewise, we find a similar 1.6 percent-
age point increase in the share of women that sent money or
an in-kind transfer to another household. This may mean that
VSLA members become increasingly active as providers of
informal finance to other members of their communities as
they expand their own set of financial tools.
20.2
4.7
15.0 14.7
2.8
11.2
Total Deposits Loans outstanding Savings balance (Net)
Chart 5.3 - Net Savings Balances($) Treatment
Control
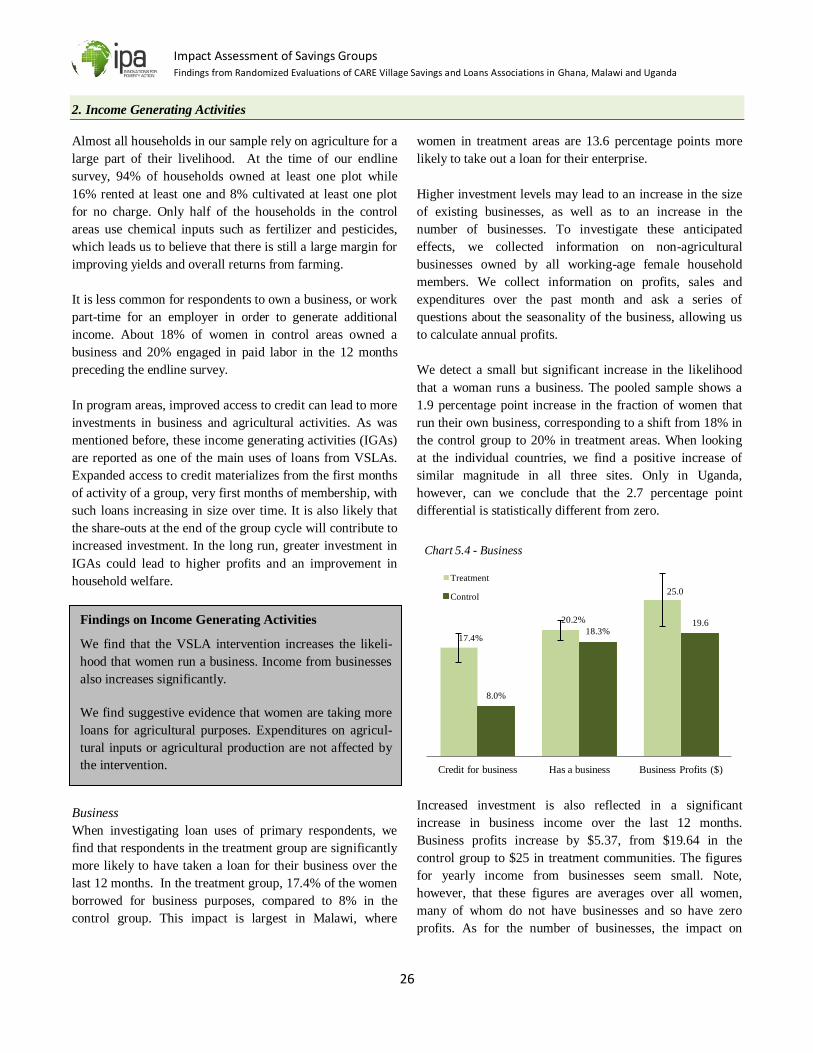
Impact Assessment of Savings Groups Findings from Randomized Evaluations of CARE Village Savings and Loans Associations in Ghana, Malawi and Uganda
26
2. Income Generating Activities
Almost all households in our sample rely on agriculture for a
large part of their livelihood. At the time of our endline
survey, 94% of households owned at least one plot while
16% rented at least one and 8% cultivated at least one plot
for no charge. Only half of the households in the control
areas use chemical inputs such as fertilizer and pesticides,
which leads us to believe that there is still a large margin for
improving yields and overall returns from farming.
It is less common for respondents to own a business, or work
part-time for an employer in order to generate additional
income. About 18% of women in control areas owned a
business and 20% engaged in paid labor in the 12 months
preceding the endline survey.
In program areas, improved access to credit can lead to more
investments in business and agricultural activities. As was
mentioned before, these income generating activities (IGAs)
are reported as one of the main uses of loans from VSLAs.
Expanded access to credit materializes from the first months
of activity of a group, very first months of membership, with
such loans increasing in size over time. It is also likely that
the share-outs at the end of the group cycle will contribute to
increased investment. In the long run, greater investment in
IGAs could lead to higher profits and an improvement in
household welfare.
Business
When investigating loan uses of primary respondents, we
find that respondents in the treatment group are significantly
more likely to have taken a loan for their business over the
last 12 months. In the treatment group, 17.4% of the women
borrowed for business purposes, compared to 8% in the
control group. This impact is largest in Malawi, where
women in treatment areas are 13.6 percentage points more
likely to take out a loan for their enterprise.
Higher investment levels may lead to an increase in the size
of existing businesses, as well as to an increase in the
number of businesses. To investigate these anticipated
effects, we collected information on non-agricultural
businesses owned by all working-age female household
members. We collect information on profits, sales and
expenditures over the past month and ask a series of
questions about the seasonality of the business, allowing us
to calculate annual profits.
We detect a small but significant increase in the likelihood
that a woman runs a business. The pooled sample shows a
1.9 percentage point increase in the fraction of women that
run their own business, corresponding to a shift from 18% in
the control group to 20% in treatment areas. When looking
at the individual countries, we find a positive increase of
similar magnitude in all three sites. Only in Uganda,
however, can we conclude that the 2.7 percentage point
differential is statistically different from zero.
Increased investment is also reflected in a significant
increase in business income over the last 12 months.
Business profits increase by $5.37, from $19.64 in the
control group to $25 in treatment communities. The figures
for yearly income from businesses seem small. Note,
however, that these figures are averages over all women,
many of whom do not have businesses and so have zero
profits. As for the number of businesses, the impact on
17.4%
20.2%
25.0
8.0%
18.3% 19.6
Credit for business Has a business Business Profits ($)
Chart 5.4 - Business
Treatment
Control
Findings on Income Generating Activities
We find that the VSLA intervention increases the likeli-
hood that women run a business. Income from businesses
also increases significantly.
We find suggestive evidence that women are taking more
loans for agricultural purposes. Expenditures on agricul-
tural inputs or agricultural production are not affected by
the intervention.
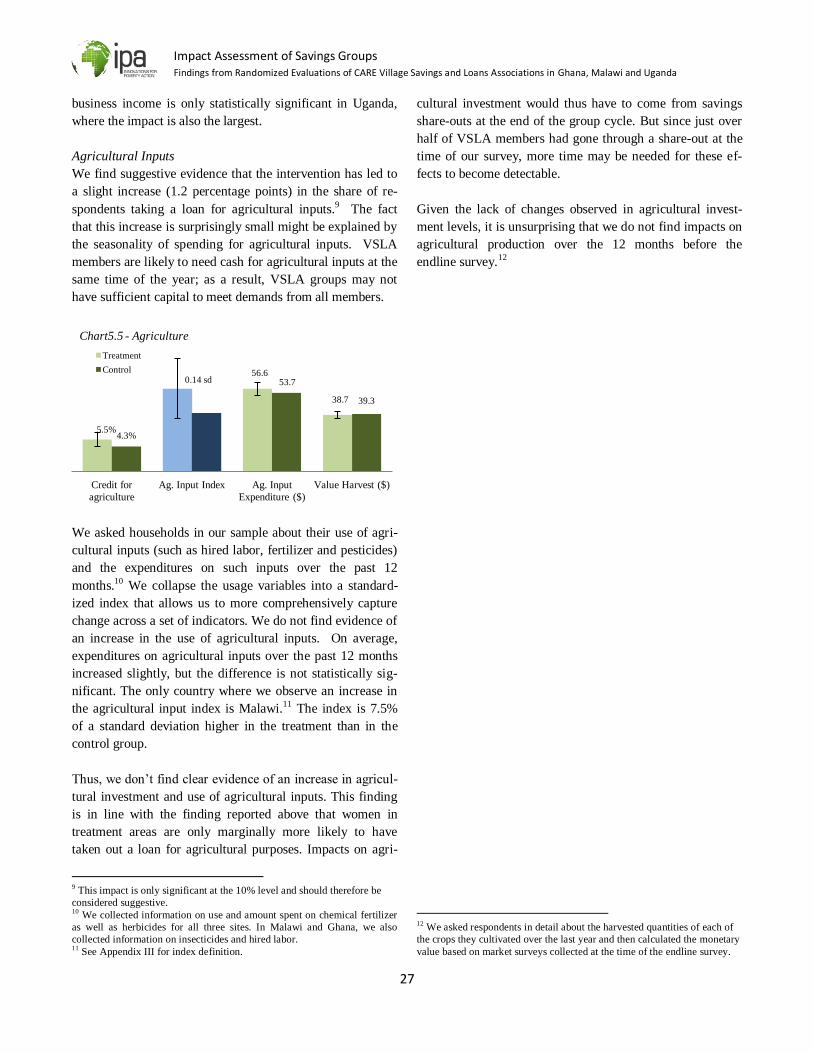
Impact Assessment of Savings Groups Findings from Randomized Evaluations of CARE Village Savings and Loans Associations in Ghana, Malawi and Uganda
27
business income is only statistically significant in Uganda,
where the impact is also the largest.
Agricultural Inputs
We find suggestive evidence that the intervention has led to
a slight increase (1.2 percentage points) in the share of re-
spondents taking a loan for agricultural inputs.9 The fact
that this increase is surprisingly small might be explained by
the seasonality of spending for agricultural inputs. VSLA
members are likely to need cash for agricultural inputs at the
same time of the year; as a result, VSLA groups may not
have sufficient capital to meet demands from all members.
We asked households in our sample about their use of agri-
cultural inputs (such as hired labor, fertilizer and pesticides)
and the expenditures on such inputs over the past 12
months.10 We collapse the usage variables into a standard-
ized index that allows us to more comprehensively capture
change across a set of indicators. We do not find evidence of
an increase in the use of agricultural inputs. On average,
expenditures on agricultural inputs over the past 12 months
increased slightly, but the difference is not statistically sig-
nificant. The only country where we observe an increase in
the agricultural input index is Malawi.11 The index is 7.5%
of a standard deviation higher in the treatment than in the
control group.
Thus, we don’t find clear evidence of an increase in agricul-
tural investment and use of agricultural inputs. This finding
is in line with the finding reported above that women in
treatment areas are only marginally more likely to have
taken out a loan for agricultural purposes. Impacts on agri-
9 This impact is only significant at the 10% level and should therefore be
considered suggestive. 10
We collected information on use and amount spent on chemical fertilizer
as well as herbicides for all three sites. In Malawi and Ghana, we also
collected information on insecticides and hired labor. 11
See Appendix III for index definition.
cultural investment would thus have to come from savings
share-outs at the end of the group cycle. But since just over
half of VSLA members had gone through a share-out at the
time of our survey, more time may be needed for these ef-
fects to become detectable.
Given the lack of changes observed in agricultural invest-
ment levels, it is unsurprising that we do not find impacts on
agricultural production over the 12 months before the
endline survey.12
12
We asked respondents in detail about the harvested quantities of each of
the crops they cultivated over the last year and then calculated the monetary
value based on market surveys collected at the time of the endline survey.
5.5%
0.14 sd 56.6
38.7
4.3%
53.7
39.3
Credit for
agriculture
Ag. Input Index Ag. Input
Expenditure ($)
Value Harvest ($)
Chart5.5 - Agriculture
Treatment
Control

Impact Assessment of Savings Groups Findings from Randomized Evaluations of CARE Village Savings and Loans Associations in Ghana, Malawi and Uganda
28
3. Women’s Empowerment
The empowerment of women is a key area of focus for
VSLA programming. The intervention may improve the
self-confidence of participants by both increasing the
frequency of their interactions with peers in the community,
and improving their abilities to manage their finances
independently from their husbands.
Through regular interaction with other group members and
access to the financial options offered by the group, VSLA
members may improve their influence over decisions within
their household. Women may also become more engaged in
their communities by participating more in public life,
groups, and community initiatives. These changes might also
lead to improvements in women’s perception of their
influence in their communities.
Influence over Decisions in the Household
In order to measure intra-household decision making, we
privately and confidentially ask the female primary
respondents about their influence over decisions taken in
their homes. We inquire about decisions concerning food
choices for the household, children’s school expenses, their
personal health, their children’s health, visits to their friends,
and business actions. For each category, we ask women to
indicate to what degree they believe that they can influence
the decision. We then recode their answers into a binary
variable representing whether the respondent feels she has
little or no control about decisions, or whether she has a high
degree of influence. We then combine these binary variables
into a standardized index in order to capture the overall
impact of the program on women’s influence over intra-
household decisions.13
We find that women in treatment communities have a
significantly higher degree of influence on household
decisions. The index on decision-making increases by 6% of
a standard deviation.
Disaggregating impacts by specific decision areas shows a
large 4.5 percentage point improvement in the share of
women who have a high degree of control over business
decisions. The share of women who report having a say on
food consumption and school expenditures is 3 percentage
points higher in treatment areas than in control areas. For
decisions about children’s health, we only find suggestive
evidence of a 2 percentage point increase in the fraction of
women with a high degree of influence. We find no effect on
the ability to decide independently to visit a friend.
When looking at these findings at the country level we find
that all three sites display point estimates of positive similar
magnitudes. However, Malawi is the only site where we find
statistically significant impacts in all of the indicators
discussed above. Ghana shows no significant increases in
the proportion of women with high influence over household
decisions. Likewise, in Uganda, business decisions form the
only realm in which we see women increasing their
decision-making influence, although we see suggestive
evidence of an increase over decisions about children’s
health expenditures as well.
13
See Appendix III for definitions.
0.06 sd
56.6%
45.3%
51.5%
46.6%
53.0%
42.0%
49.2%
42.1%
Index Food
consumption
School
expenses
Children's
health
Business
actions
Chart 5.6 - Share with high degree of influence over household decisions
Treatment
Control
Findings on Women’s Empowerment
We find that women in treatment areas increase their
influence on decisions over business actions in the
household. We also find suggestive evidence of
improved decision-making power on food and education
decisions.
In program areas, women’s participation in community
meetings increases slightly, but we do not find a general
increase in participation and social capital of respondents
in treatment areas. Women’s own perceptions of their
role in the community and empowerment are not affected
by the program.
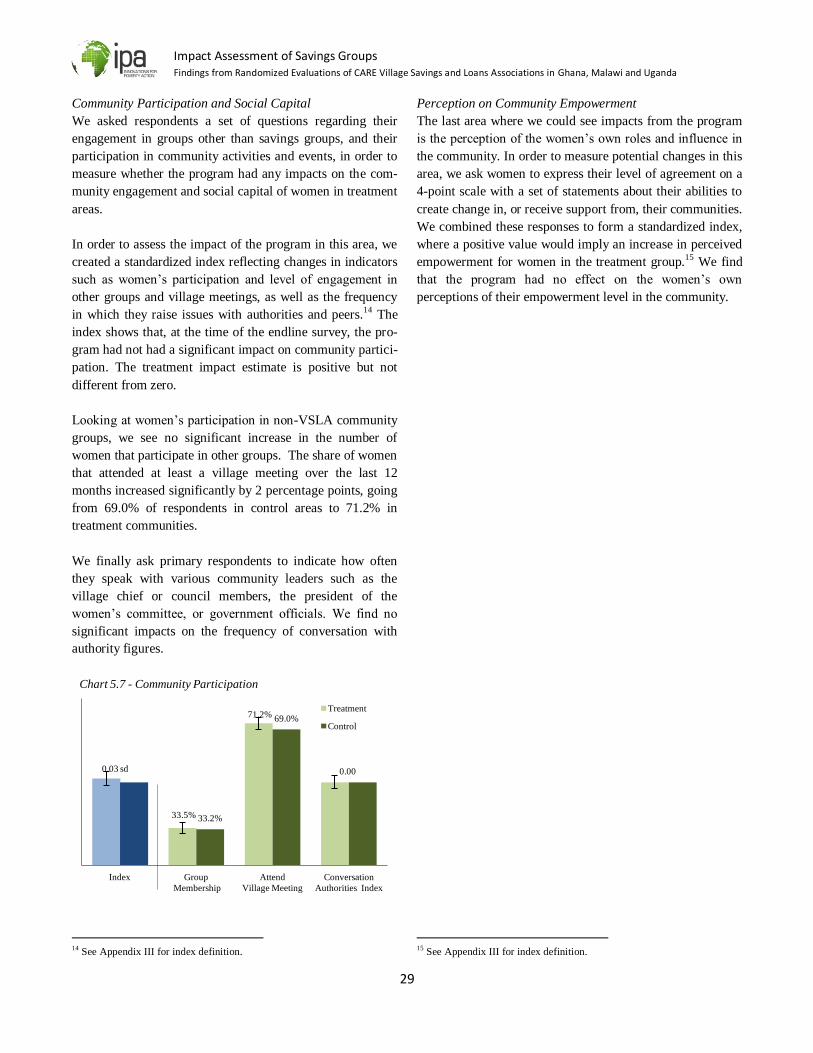
Impact Assessment of Savings Groups Findings from Randomized Evaluations of CARE Village Savings and Loans Associations in Ghana, Malawi and Uganda
29
Community Participation and Social Capital
We asked respondents a set of questions regarding their
engagement in groups other than savings groups, and their
participation in community activities and events, in order to
measure whether the program had any impacts on the com-
munity engagement and social capital of women in treatment
areas.
In order to assess the impact of the program in this area, we
created a standardized index reflecting changes in indicators
such as women’s participation and level of engagement in
other groups and village meetings, as well as the frequency
in which they raise issues with authorities and peers.14 The
index shows that, at the time of the endline survey, the pro-
gram had not had a significant impact on community partici-
pation. The treatment impact estimate is positive but not
different from zero.
Looking at women’s participation in non-VSLA community
groups, we see no significant increase in the number of
women that participate in other groups. The share of women
that attended at least a village meeting over the last 12
months increased significantly by 2 percentage points, going
from 69.0% of respondents in control areas to 71.2% in
treatment communities.
We finally ask primary respondents to indicate how often
they speak with various community leaders such as the
village chief or council members, the president of the
women’s committee, or government officials. We find no
significant impacts on the frequency of conversation with
authority figures.
14
See Appendix III for index definition.
Perception on Community Empowerment
The last area where we could see impacts from the program
is the perception of the women’s own roles and influence in
the community. In order to measure potential changes in this
area, we ask women to express their level of agreement on a
4-point scale with a set of statements about their abilities to
create change in, or receive support from, their communities.
We combined these responses to form a standardized index,
where a positive value would imply an increase in perceived
empowerment for women in the treatment group.15 We find
that the program had no effect on the women’s own
perceptions of their empowerment level in the community.
15
See Appendix III for index definition.
0.03 sd
33.5%
71.2%
0.00
33.2%
69.0%
Index Group
Membership
Attend
Village Meeting
Conversation
Authorities Index
Chart 5.7 - Community Participation
Treatment
Control
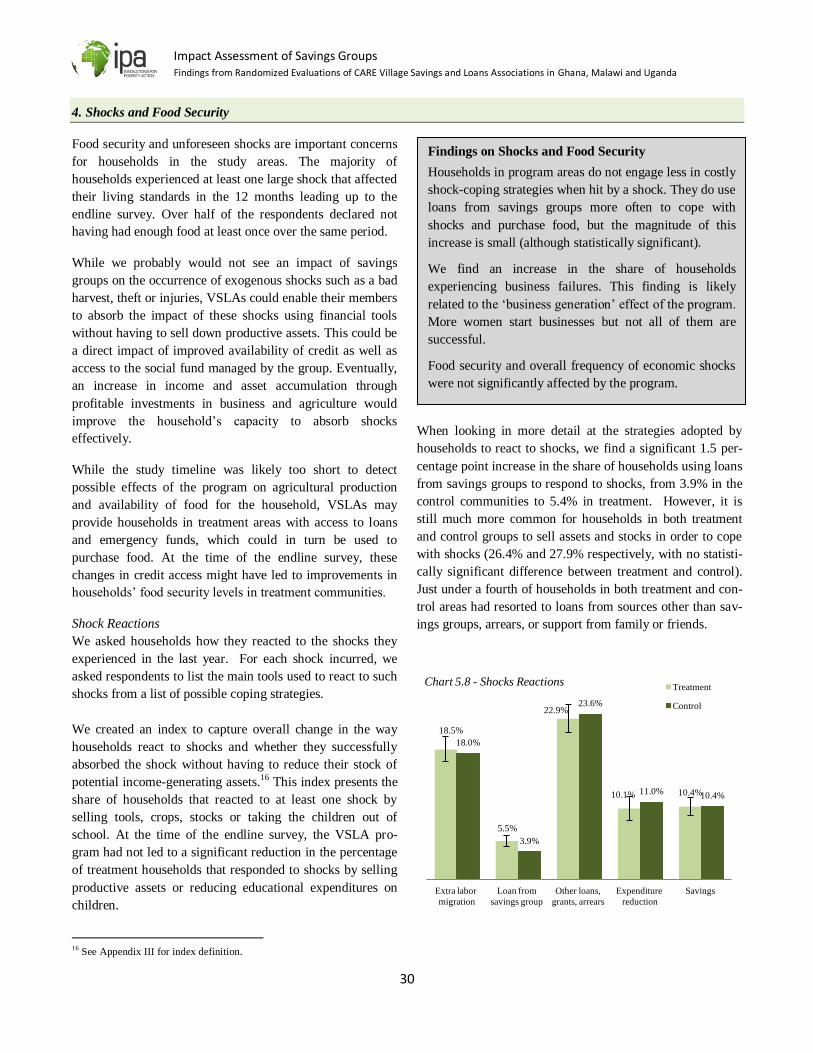
Impact Assessment of Savings Groups Findings from Randomized Evaluations of CARE Village Savings and Loans Associations in Ghana, Malawi and Uganda
30
4. Shocks and Food Security
Food security and unforeseen shocks are important concerns
for households in the study areas. The majority of
households experienced at least one large shock that affected
their living standards in the 12 months leading up to the
endline survey. Over half of the respondents declared not
having had enough food at least once over the same period.
While we probably would not see an impact of savings
groups on the occurrence of exogenous shocks such as a bad
harvest, theft or injuries, VSLAs could enable their members
to absorb the impact of these shocks using financial tools
without having to sell down productive assets. This could be
a direct impact of improved availability of credit as well as
access to the social fund managed by the group. Eventually,
an increase in income and asset accumulation through
profitable investments in business and agriculture would
improve the household’s capacity to absorb shocks
effectively.
While the study timeline was likely too short to detect
possible effects of the program on agricultural production
and availability of food for the household, VSLAs may
provide households in treatment areas with access to loans
and emergency funds, which could in turn be used to
purchase food. At the time of the endline survey, these
changes in credit access might have led to improvements in
households’ food security levels in treatment communities.
Shock Reactions
We asked households how they reacted to the shocks they
experienced in the last year. For each shock incurred, we
asked respondents to list the main tools used to react to such
shocks from a list of possible coping strategies.
We created an index to capture overall change in the way
households react to shocks and whether they successfully
absorbed the shock without having to reduce their stock of
potential income-generating assets.16 This index presents the
share of households that reacted to at least one shock by
selling tools, crops, stocks or taking the children out of
school. At the time of the endline survey, the VSLA pro-
gram had not led to a significant reduction in the percentage
of treatment households that responded to shocks by selling
productive assets or reducing educational expenditures on
children.
16
See Appendix III for index definition.
When looking in more detail at the strategies adopted by
households to react to shocks, we find a significant 1.5 per-
centage point increase in the share of households using loans
from savings groups to respond to shocks, from 3.9% in the
control communities to 5.4% in treatment. However, it is
still much more common for households in both treatment
and control groups to sell assets and stocks in order to cope
with shocks (26.4% and 27.9% respectively, with no statisti-
cally significant difference between treatment and control).
Just under a fourth of households in both treatment and con-
trol areas had resorted to loans from sources other than sav-
ings groups, arrears, or support from family or friends.
18.5%
5.5%
22.9%
10.1% 10.4%
18.0%
3.9%
23.6%
11.0% 10.4%
Extra labor
migration
Loan from
savings group
Other loans,
grants, arrears
Expenditure
reduction
Savings
Chart 5.8 - Shocks Reactions Treatment
Control
Findings on Shocks and Food Security
Households in program areas do not engage less in costly
shock-coping strategies when hit by a shock. They do use
loans from savings groups more often to cope with
shocks and purchase food, but the magnitude of this
increase is small (although statistically significant).
We find an increase in the share of households
experiencing business failures. This finding is likely
related to the ‘business generation’ effect of the program.
More women start businesses but not all of them are
successful.
Food security and overall frequency of economic shocks
were not significantly affected by the program.
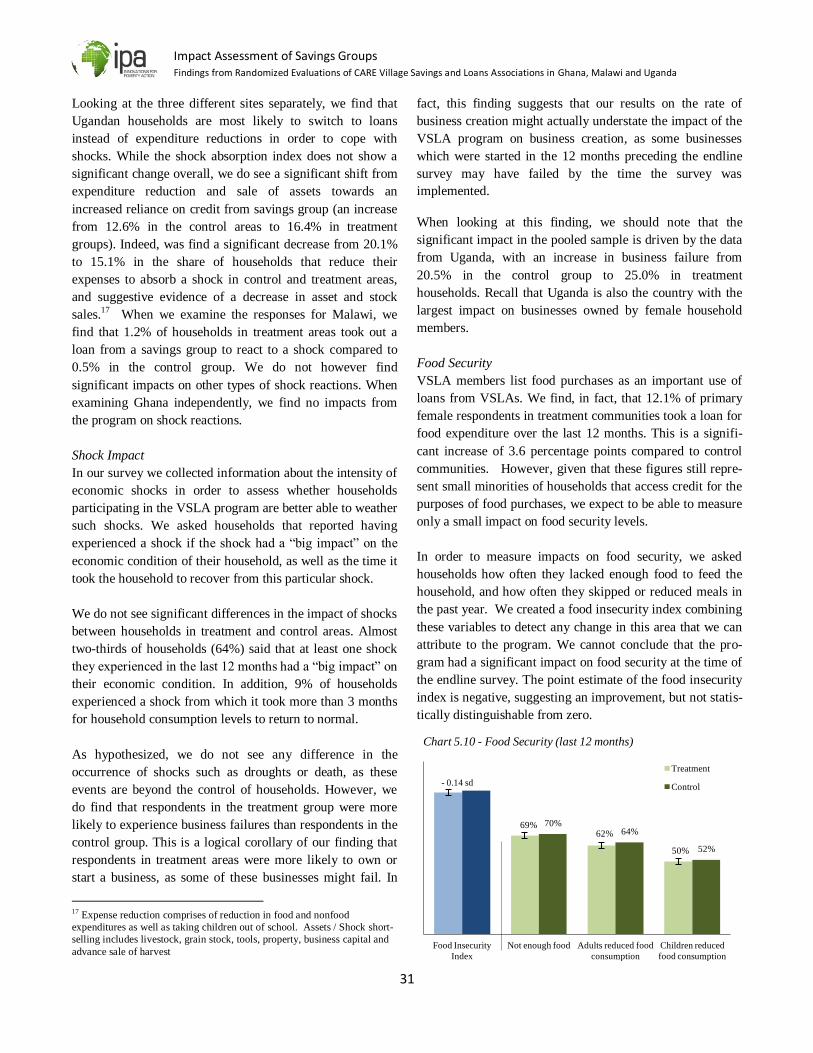
Impact Assessment of Savings Groups Findings from Randomized Evaluations of CARE Village Savings and Loans Associations in Ghana, Malawi and Uganda
31
Looking at the three different sites separately, we find that
Ugandan households are most likely to switch to loans
instead of expenditure reductions in order to cope with
shocks. While the shock absorption index does not show a
significant change overall, we do see a significant shift from
expenditure reduction and sale of assets towards an
increased reliance on credit from savings group (an increase
from 12.6% in the control areas to 16.4% in treatment
groups). Indeed, was find a significant decrease from 20.1%
to 15.1% in the share of households that reduce their
expenses to absorb a shock in control and treatment areas,
and suggestive evidence of a decrease in asset and stock
sales.17 When we examine the responses for Malawi, we
find that 1.2% of households in treatment areas took out a
loan from a savings group to react to a shock compared to
0.5% in the control group. We do not however find
significant impacts on other types of shock reactions. When
examining Ghana independently, we find no impacts from
the program on shock reactions.
Shock Impact
In our survey we collected information about the intensity of
economic shocks in order to assess whether households
participating in the VSLA program are better able to weather
such shocks. We asked households that reported having
experienced a shock if the shock had a “big impact” on the
economic condition of their household, as well as the time it
took the household to recover from this particular shock.
We do not see significant differences in the impact of shocks
between households in treatment and control areas. Almost
two-thirds of households (64%) said that at least one shock
they experienced in the last 12 months had a “big impact” on
their economic condition. In addition, 9% of households
experienced a shock from which it took more than 3 months
for household consumption levels to return to normal.
As hypothesized, we do not see any difference in the
occurrence of shocks such as droughts or death, as these
events are beyond the control of households. However, we
do find that respondents in the treatment group were more
likely to experience business failures than respondents in the
control group. This is a logical corollary of our finding that
respondents in treatment areas were more likely to own or
start a business, as some of these businesses might fail. In
17
Expense reduction comprises of reduction in food and nonfood
expenditures as well as taking children out of school. Assets / Shock short-
selling includes livestock, grain stock, tools, property, business capital and
advance sale of harvest
fact, this finding suggests that our results on the rate of
business creation might actually understate the impact of the
VSLA program on business creation, as some businesses
which were started in the 12 months preceding the endline
survey may have failed by the time the survey was
implemented.
When looking at this finding, we should note that the
significant impact in the pooled sample is driven by the data
from Uganda, with an increase in business failure from
20.5% in the control group to 25.0% in treatment
households. Recall that Uganda is also the country with the
largest impact on businesses owned by female household
members.
Food Security
VSLA members list food purchases as an important use of
loans from VSLAs. We find, in fact, that 12.1% of primary
female respondents in treatment communities took a loan for
food expenditure over the last 12 months. This is a signifi-
cant increase of 3.6 percentage points compared to control
communities. However, given that these figures still repre-
sent small minorities of households that access credit for the
purposes of food purchases, we expect to be able to measure
only a small impact on food security levels.
In order to measure impacts on food security, we asked
households how often they lacked enough food to feed the
household, and how often they skipped or reduced meals in
the past year. We created a food insecurity index combining
these variables to detect any change in this area that we can
attribute to the program. We cannot conclude that the pro-
gram had a significant impact on food security at the time of
the endline survey. The point estimate of the food insecurity
index is negative, suggesting an improvement, but not statis-
tically distinguishable from zero.
- 0.14 sd
69% 62%
50%
70% 64%
52%
Food Insecurity
Index
Not enough food Adults reduced food
consumption
Children reduced
food consumption
Chart 5.10 - Food Security (last 12 months)
Treatment
Control
Impact Assessment of Savings Groups Findings from Randomized Evaluations of CARE Village Savings and Loans Associations in Ghana, Malawi and Uganda
32
When comparing food security among household members
of different ages, we find that the share of households that
report adult members who reduce their food intake at some
point during the last year dropped slightly from 63.8% to
61.5%. We find no change in the share of households that
had children reduce meals.
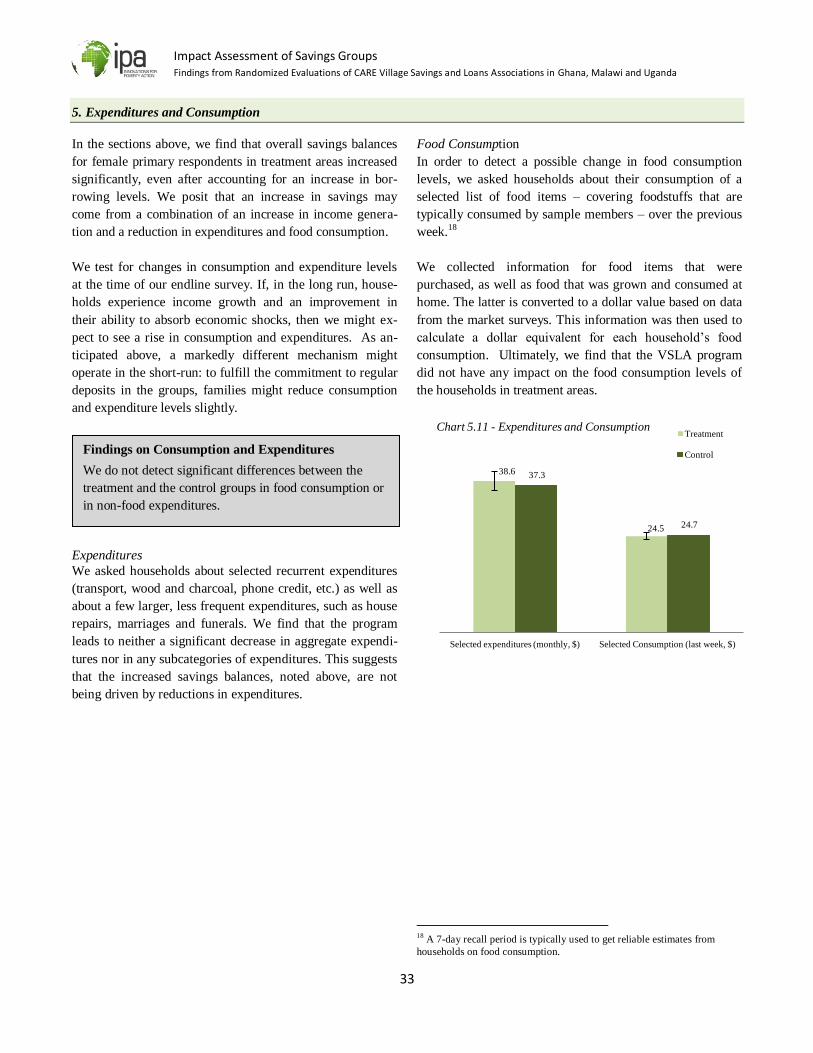
Impact Assessment of Savings Groups Findings from Randomized Evaluations of CARE Village Savings and Loans Associations in Ghana, Malawi and Uganda
33
5. Expenditures and Consumption
In the sections above, we find that overall savings balances
for female primary respondents in treatment areas increased
significantly, even after accounting for an increase in bor-
rowing levels. We posit that an increase in savings may
come from a combination of an increase in income genera-
tion and a reduction in expenditures and food consumption.
We test for changes in consumption and expenditure levels
at the time of our endline survey. If, in the long run, house-
holds experience income growth and an improvement in
their ability to absorb economic shocks, then we might ex-
pect to see a rise in consumption and expenditures. As an-
ticipated above, a markedly different mechanism might
operate in the short-run: to fulfill the commitment to regular
deposits in the groups, families might reduce consumption
and expenditure levels slightly.
Expenditures
We asked households about selected recurrent expenditures
(transport, wood and charcoal, phone credit, etc.) as well as
about a few larger, less frequent expenditures, such as house
repairs, marriages and funerals. We find that the program
leads to neither a significant decrease in aggregate expendi-
tures nor in any subcategories of expenditures. This suggests
that the increased savings balances, noted above, are not
being driven by reductions in expenditures.
Food Consumption
In order to detect a possible change in food consumption
levels, we asked households about their consumption of a
selected list of food items – covering foodstuffs that are
typically consumed by sample members – over the previous
week.18
We collected information for food items that were
purchased, as well as food that was grown and consumed at
home. The latter is converted to a dollar value based on data
from the market surveys. This information was then used to
calculate a dollar equivalent for each household’s food
consumption. Ultimately, we find that the VSLA program
did not have any impact on the food consumption levels of
the households in treatment areas.
18
A 7-day recall period is typically used to get reliable estimates from
households on food consumption.
Findings on Consumption and Expenditures
We do not detect significant differences between the
treatment and the control groups in food consumption or
in non-food expenditures.
38.6
24.5
37.3
24.7
Selected expenditures (monthly, $) Selected Consumption (last week, $)
Chart 5.11 - Expenditures and Consumption Treatment
Control

Impact Assessment of Savings Groups Findings from Randomized Evaluations of CARE Village Savings and Loans Associations in Ghana, Malawi and Uganda
34
6. Education
Educational attainment is fairly low throughout the sample,
with just over half the household members over the age of 6
in Malawi and Uganda able to read and write; the percentage
of literate members in Ghana is even lower, at 24%. En-
rollment rates average over 80% for children of primary
school age, and 76% and 79% for girls and boys of second-
ary school age respectively.
We test whether the VSLA program leads families to in-
crease investment in their children’s education. This could
happen through one of four channels: (1) the increased abil-
ity to accumulate savings then makes lump-sum investments
more feasible, (2) borrowing from the group, (3) eventually,
profits from any increases in enterprise or agricultural out-
put, if the VSLA leads to profitable firm or farm invest-
ments, and (4) increased intra-household decision-making
power of the adults in the household. Through focus group
discussions in Malawi, we anecdotally learned of one mem-
ber who reported using the savings to cover school expendi-
tures for her children.19
19
However, it should be noted that a non-randomized study in Tanzania
finds evidence of an increase in child labor for households participating in
VSLA leads to a negative impact on school attendance (Allen, 2009).
Financing of Education Expenses
We do not find a statistically significant impact on
educational expenditures. Households do not seem to have
increased investment in education compared to the control
group.
When examining education financing, we only consider the
pooled sample of households in Ghana and Uganda. In
Malawi, the survey only asked about education financing for
school fees. Given that only very small group of households
pay school fees, we decided that this information was not
comparable to Ghana and Uganda, where we asked about
education financing for both school fees and other educa-
tional expenses. For every child attending school, we asked
the household respondent to list how the child’s educational
expenditures – including school fees and other costs, such as
uniforms and transport – were met. We find that a larger
proportion of households in a VSLA used loans from sav-
ings groups to pay for educational expenses.
When examining each country individually, we find that the
pooled result is mostly driven by Ugandan households. We
detect a significant increase (4 percentage points) in the
fraction of households that use income sources to pay for
school expenses. This increase likely reflects the impact of
share-out income, as well as higher returns from businesses.
As seen in Table B, 27% of the VSLA members in Uganda
that had already gone through a share-out, reported having
spent these funds on education expenses.
School Enrollment
Despite the fact that we were not able to find a significant
impact on expenditure levels for children, there is evidence
of an increase in school enrollment levels. We see a signifi-
cant increase of 2.3 percentage points on primary school
gross enrollment for boys and a suggestive increase of 1.9
percentage points on primary school gross enrollment for
girls. These results are largely driven by the Ghana data.
While there is a suggestive increase in primary school en-
rollment for boys in Malawi (2.6 percentage points) and
increases across all three sites, we only find statistically
significant increases in Ghana. However, this result is not
robust to an alternate econometric specification, and thus we
consider this result as suggestive and in particular need of
87.8
27%
64%
3% 3% 6%
88.3
25%
63%
2% 3% 7%
Expenses ($) Income
generation
Sales Asset
and Stocks
Savings
groups loan
Transfers
and
other loans
Savings
Chart 5.12 - Financing of education
Treatment
Control
Findings on Education
We find evidence that households use loans and share-
out from the VSLAs to partially fund education expens-
es. However, we do not find a statistically significant
difference in the amounts spent by households in treat-
ment areas compared to those in the control. There is
suggestive evidence of an increase in primary school
enrollment for boys as well as for girls.

Impact Assessment of Savings Groups Findings from Randomized Evaluations of CARE Village Savings and Loans Associations in Ghana, Malawi and Uganda
35
85.5%
83.9%
77.9%
79.7%
83.6%
81.7%
76.3%
79.0%
Primary girls Primary boys Secondary girls Secondary boys
Chart 5.13 - School Enrollment Treatment
Control
further focus in future studies.20 Ghana is also the only coun-
try where educational expenses are seen to increase, alt-
hough not with statistical significance. With these caveats in
mind, there is some evidence – albeit only suggestive – of an
overall increase in educational investment in Ghana.
20
Throughout our analysis, we include a lagged variable in our regressions,
to control for baseline values of outcome variables. An alternative
specification, a difference-in-difference model, directly compares the
differences at endline to the differences at baseline. This specification is not
used through much of the analysis as it reduces statistical precision. In
general, we find little difference in our results using the two specifications.
The baseline imbalance in the treatment and control groups with respect to
educational outcomes in Ghana leads to the lack of robustness in our results
here.
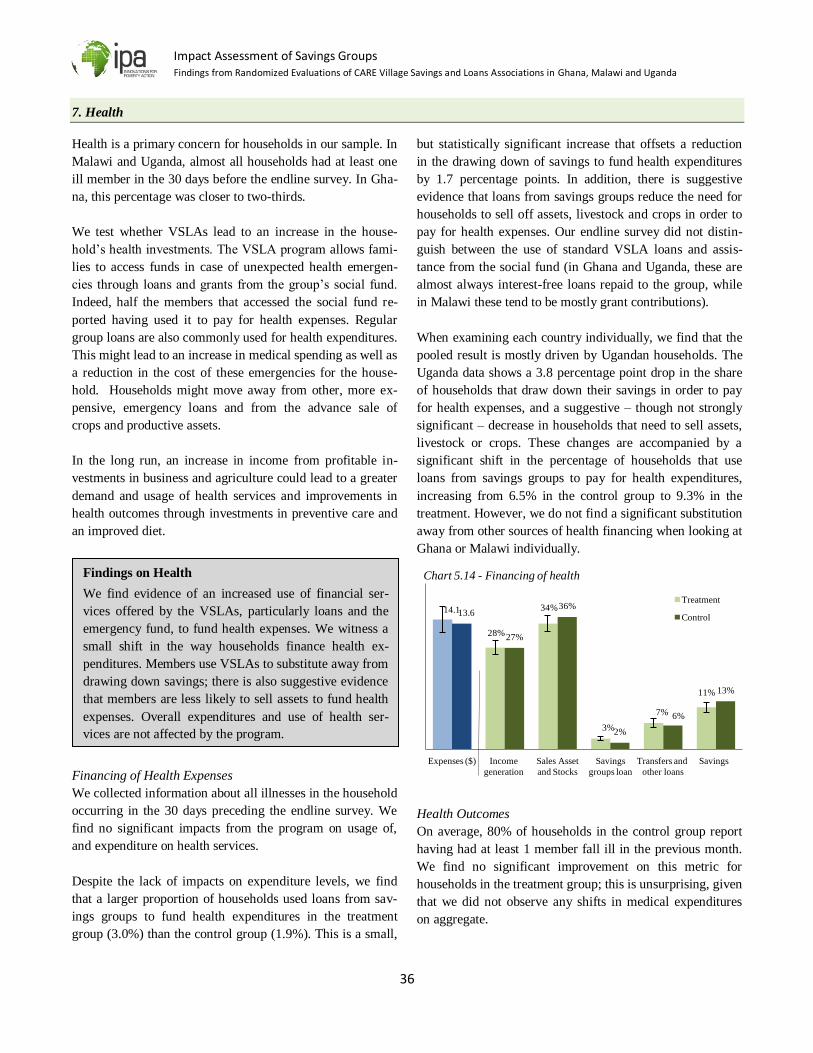
Impact Assessment of Savings Groups Findings from Randomized Evaluations of CARE Village Savings and Loans Associations in Ghana, Malawi and Uganda
36
7. Health
Health is a primary concern for households in our sample. In
Malawi and Uganda, almost all households had at least one
ill member in the 30 days before the endline survey. In Gha-
na, this percentage was closer to two-thirds.
We test whether VSLAs lead to an increase in the house-
hold’s health investments. The VSLA program allows fami-
lies to access funds in case of unexpected health emergen-
cies through loans and grants from the group’s social fund.
Indeed, half the members that accessed the social fund re-
ported having used it to pay for health expenses. Regular
group loans are also commonly used for health expenditures.
This might lead to an increase in medical spending as well as
a reduction in the cost of these emergencies for the house-
hold. Households might move away from other, more ex-
pensive, emergency loans and from the advance sale of
crops and productive assets.
In the long run, an increase in income from profitable in-
vestments in business and agriculture could lead to a greater
demand and usage of health services and improvements in
health outcomes through investments in preventive care and
an improved diet.
Financing of Health Expenses
We collected information about all illnesses in the household
occurring in the 30 days preceding the endline survey. We
find no significant impacts from the program on usage of,
and expenditure on health services.
Despite the lack of impacts on expenditure levels, we find
that a larger proportion of households used loans from sav-
ings groups to fund health expenditures in the treatment
group (3.0%) than the control group (1.9%). This is a small,
but statistically significant increase that offsets a reduction
in the drawing down of savings to fund health expenditures
by 1.7 percentage points. In addition, there is suggestive
evidence that loans from savings groups reduce the need for
households to sell off assets, livestock and crops in order to
pay for health expenses. Our endline survey did not distin-
guish between the use of standard VSLA loans and assis-
tance from the social fund (in Ghana and Uganda, these are
almost always interest-free loans repaid to the group, while
in Malawi these tend to be mostly grant contributions).
When examining each country individually, we find that the
pooled result is mostly driven by Ugandan households. The
Uganda data shows a 3.8 percentage point drop in the share
of households that draw down their savings in order to pay
for health expenses, and a suggestive – though not strongly
significant – decrease in households that need to sell assets,
livestock or crops. These changes are accompanied by a
significant shift in the percentage of households that use
loans from savings groups to pay for health expenditures,
increasing from 6.5% in the control group to 9.3% in the
treatment. However, we do not find a significant substitution
away from other sources of health financing when looking at
Ghana or Malawi individually.
Health Outcomes
On average, 80% of households in the control group report
having had at least 1 member fall ill in the previous month.
We find no significant improvement on this metric for
households in the treatment group; this is unsurprising, given
that we did not observe any shifts in medical expenditures
on aggregate.
Findings on Health
We find evidence of an increased use of financial ser-
vices offered by the VSLAs, particularly loans and the
emergency fund, to fund health expenses. We witness a
small shift in the way households finance health ex-
penditures. Members use VSLAs to substitute away from
drawing down savings; there is also suggestive evidence
that members are less likely to sell assets to fund health
expenses. Overall expenditures and use of health ser-
vices are not affected by the program.
14.1
28%
34%
3%
7%
11%
13.6
27%
36%
2%
6%
13%
Expenses ($) Income
generation
Sales Asset
and Stocks
Savings
groups loan
Transfers and
other loans
Savings
Chart 5.14 - Financing of health
Treatment
Control
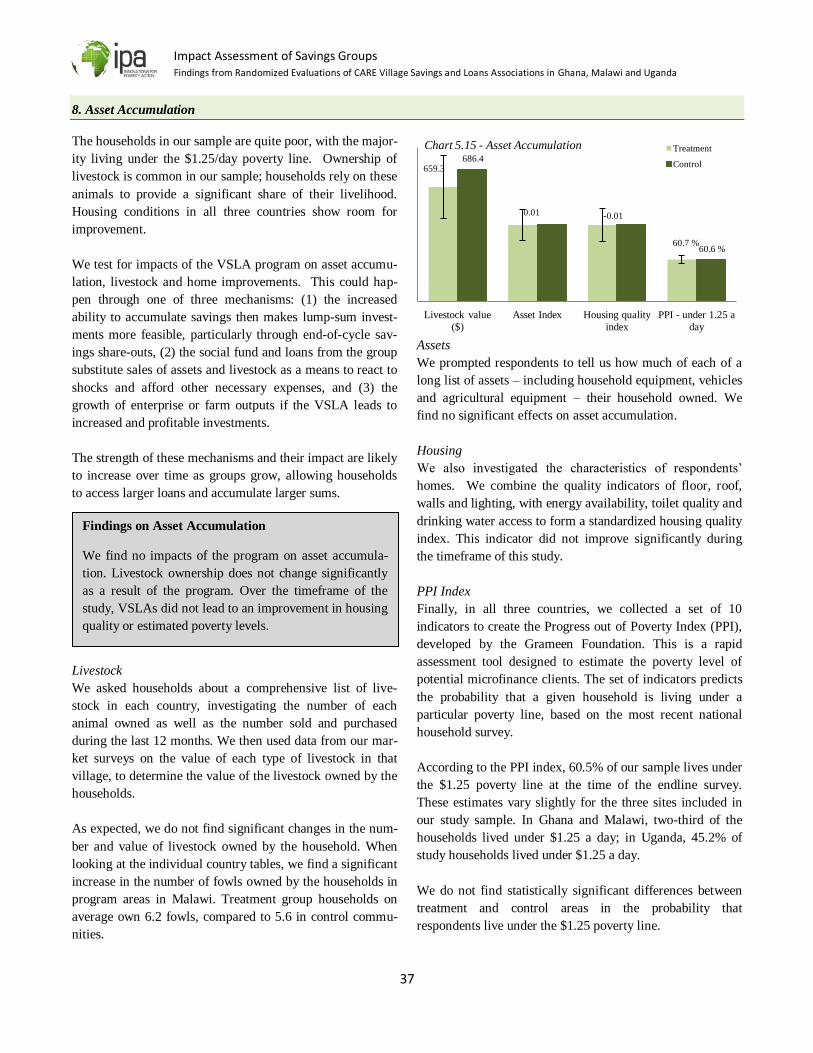
Impact Assessment of Savings Groups Findings from Randomized Evaluations of CARE Village Savings and Loans Associations in Ghana, Malawi and Uganda
37
8. Asset Accumulation
The households in our sample are quite poor, with the major-
ity living under the $1.25/day poverty line. Ownership of
livestock is common in our sample; households rely on these
animals to provide a significant share of their livelihood.
Housing conditions in all three countries show room for
improvement.
We test for impacts of the VSLA program on asset accumu-
lation, livestock and home improvements. This could hap-
pen through one of three mechanisms: (1) the increased
ability to accumulate savings then makes lump-sum invest-
ments more feasible, particularly through end-of-cycle sav-
ings share-outs, (2) the social fund and loans from the group
substitute sales of assets and livestock as a means to react to
shocks and afford other necessary expenses, and (3) the
growth of enterprise or farm outputs if the VSLA leads to
increased and profitable investments.
The strength of these mechanisms and their impact are likely
to increase over time as groups grow, allowing households
to access larger loans and accumulate larger sums.
Livestock
We asked households about a comprehensive list of live-
stock in each country, investigating the number of each
animal owned as well as the number sold and purchased
during the last 12 months. We then used data from our mar-
ket surveys on the value of each type of livestock in that
village, to determine the value of the livestock owned by the
households.
As expected, we do not find significant changes in the num-
ber and value of livestock owned by the household. When
looking at the individual country tables, we find a significant
increase in the number of fowls owned by the households in
program areas in Malawi. Treatment group households on
average own 6.2 fowls, compared to 5.6 in control commu-
nities.
Assets
We prompted respondents to tell us how much of each of a
long list of assets – including household equipment, vehicles
and agricultural equipment – their household owned. We
find no significant effects on asset accumulation.
Housing
We also investigated the characteristics of respondents’
homes. We combine the quality indicators of floor, roof,
walls and lighting, with energy availability, toilet quality and
drinking water access to form a standardized housing quality
index. This indicator did not improve significantly during
the timeframe of this study.
PPI Index
Finally, in all three countries, we collected a set of 10
indicators to create the Progress out of Poverty Index (PPI),
developed by the Grameen Foundation. This is a rapid
assessment tool designed to estimate the poverty level of
potential microfinance clients. The set of indicators predicts
the probability that a given household is living under a
particular poverty line, based on the most recent national
household survey.
According to the PPI index, 60.5% of our sample lives under
the $1.25 poverty line at the time of the endline survey.
These estimates vary slightly for the three sites included in
our study sample. In Ghana and Malawi, two-third of the
households lived under $1.25 a day; in Uganda, 45.2% of
study households lived under $1.25 a day.
We do not find statistically significant differences between
treatment and control areas in the probability that
respondents live under the $1.25 poverty line.
659.3
0.01 -0.01
60.7 %
686.4
60.6 %
Livestock value
($)
Asset Index Housing quality
index
PPI - under 1.25 a
day
Chart 5.15 - Asset Accumulation Treatment
Control
Findings on Asset Accumulation
We find no impacts of the program on asset accumula-
tion. Livestock ownership does not change significantly
as a result of the program. Over the timeframe of the
study, VSLAs did not lead to an improvement in housing
quality or estimated poverty levels.
Impact Assessment of Savings Groups Findings from Randomized Evaluations of CARE Village Savings and Loans Associations in Ghana, Malawi and Uganda
38
5C – Estimating the Impact on Participants
As we discuss in Section 3, VSLA members are significantly
different from non-members in a variety of ways (see Table
D for more detail). Members are also likely to be different
on a number of non-observable characteristics, such as
entrepreneurial drive. Hence, assessing the direct impact of
the VSLA program by comparing VSLA members to non-
members, or members in treatment villages to women in
control villages, might lead to biased estimates. The threat of
bias drove the decision to design a randomized evaluation.
A randomized evaluation relies critically on some element of
random assignment to either receive a treatment, or to be
offered a treatment. Since participation in a VSLA is clearly
voluntary, and occurs after a fairly involved community
outreach process, it is not viable to randomly allow some
individuals into a VSLA and others not. Furthermore, the
treatment is itself a community-level treatment in that the
outreach is to the community as a whole, and provides
services to all in the community. For this reason the focus of
the analysis has been on those offered participation, i.e., the
“ITT” estimates discussed above.
However, since a considerable fraction of people in
treatment areas do not become members of a VSLA, the
impacts on participating households might arguably be quite
different from the impacts on the average household in the
village. This is also an important estimate, although one that
requires stronger assumptions about how the program works
and who it impacts in order to be able to estimate in this
situation.
In this section, we present two approaches to ‘zoom in’ on
VSLA participants. These two approaches are
complementary to the ITT analysis presented above and rely
on the randomized design of the study to identify causal
effects. We discuss in turn the potential and the limitations
of each of these two methods. The estimates are presented in
Table 3.
Treatment Effects on the Treated
The treatment-on-the-treated (TOT) effect is the impact on
those who effectively received treatment – i.e. the difference
between a VSLA participant’s outcomes and what those
outcomes would have been in the absence of the program.
Since not everyone in VSLA communities participated in the
VSLA, the ITT impacts are different from the TOT impacts.
In the analysis of randomized experiments, the most
common method to estimate TOT parameters is an
instrumental variable (IV) approach where the random
assignment to receive a treatment offer is used as an
instrument for actually being treated. In our setting, we use
the treatment status of the village as an instrument for the
primary adult’s VSLA participation. The IV approach to
estimate TOT parameters and the ITT analysis are in fact
closely linked.
The TOT estimates can be obtained, approximately, by
multiplying the ITT estimates by the inverse of the
difference in take-up rates between treatment and control
villages. In other words, the TOT scales up the estimates by
the proportion of dilution that occurs by including more non-
participants in the treatment group than in the control group.
For instance, in our sample, take-up in the treatment group is
31.2% while take-up in the control group is 6.2%; the take-
up differential is 25 percentage points. As can be seen from
Table 3, the TOT estimates are indeed about 4 times (1/0.25)
the size of the ITT estimates.21
Strong caution is required, however, when interpreting the
TOT estimates presented in Table 3. For the individual-level
outcomes, the TOT estimates will only provide unbiased
estimates of the VSLAs’ impact on participants if all
benefits from participation accrue only to VSLA
participants, with no spillovers from the participants to non-
participants in the treatment villages. If benefits do spill
over, the TOT estimates will overestimate the impact of the
VSLA program on participants. For the household-level
outcomes, even stronger caution is needed. The instrumented
variable in our TOT analysis is whether or not the primary
respondent participates in a VSLA. In households where the
primary respondent is not a member of a VSLA, another
person in the household might be participating. Take-up at
the household level – defined as the proportion of
households with at least one member participating in a
VSLA – is thus likely to be higher than take-up among
primary respondents.22 Since our TOT analysis is based on
21
It is important to notice however that the standard errors of the TOT
estimates are also roughly about 4 times those of the ITT estimates. In
general, while the point estimates of the TOT effects are larger than the ITT
effects, the standard errors increase in roughly the same proportion and
there is no gain in statistical precision. 22
For household members other than the primary respondent, we have less
detailed information on the characteristics of the savings groups the person
Impact Assessment of Savings Groups Findings from Randomized Evaluations of CARE Village Savings and Loans Associations in Ghana, Malawi and Uganda
39
VSLA participation of the primary respondents – which is
almost surely lower than take-up at the household level – the
estimates of the TOT effects on the household-level
outcomes are in all likelihood over-estimates of the true
TOT effects and should be viewed as upper bounds.
Thus, for the reasons just noted, we do not recommend using
the treatment-on-the-treated estimates for decision making
or inference on the impact of the VSLA program. However,
for the sake of completeness, we report TOT estimates in
Table 3. As expected, we find significant TOT effects in the
same areas as in the ITT analysis and there are no cases
where a null result in the ITT analysis becomes significant in
the TOT analysis. The results become somewhat less precise
in the TOT analysis.
Treatment Effects on Those Who are Likely to Join a VSLA
An alternative approach to zoom in on VSLA participants is
to focus the analysis on people who are likely to join a
VSLA had the program been offered to them. This approach
consists of two steps. In the first step, based on analysis of
current VSLA members in treatment communities, we
identify people in both treatment and control communities
who have an above-average likelihood of joining a VSLA (if
it were offered in their community) based on their individual
or household characteristics. In the second step, we compare
these “high likelihood” households in the treatment areas
with similar households in the control areas. This approach
is effectively an ITT analysis on a subsample that has been
purposefully selected to yield higher take-up. Since the same
objective criteria are applied to both the treatment and
control groups to select high-likelihood households, no
selection bias is introduced.
The higher take-up in the high likelihood subsample means
that the effects of the VSLA program are less diluted than in
the overall sample. This acts to increase statistical power and
makes it easier to identify the direct effects of the VSLA
program upon participants. On the other hand, only a small
part of the overall sample falls into the high likelihood
category so we have fewer observations in our dataset,
which decreases statistical power. If the take-up rate in the
selected subsample is not much higher than in the overall
sample, the gain in statistical precision thanks to the higher
take-up may well be offset by the loss due to the smaller
sample size.
is participating in, precluding us from calculating household-level take-up
based on the VSLA definition we use for the primary respondents.
In order to select people with a high likelihood to participate
in a VSLA, we use the model that was discussed in Section 3
(results in Table E) to estimate the likelihood that primary
respondents in both the treatment and control groups would
join a VSLA.23 We then use these predicted likelihoods to
identify primary respondents with above-average likelihood
to join. In the second step, we run an ITT impact analysis on
the selected subsample. The results are presented in Table 3.
We find that the treatment group respondents in the high
likelihood subset are 34 percentage points more likely to
participate in a VSLA compared to the control group – an
increase from a 25 percentage point differential in the
analysis of the overall sample. This is reassuring, as the
purpose of our strategy was precisely to identify a subsample
with higher VSLA participation. However, the fact that the
take-up differential goes up by only 9 percentage points
indicates that our take-up model does not have great
predictive power and suggests that VSLA participation is
explained mostly by unobservable characteristics, such as
motivation or entrepreneurial spirit.
Given the modest increase in take-up rates, we would not
expect the high-likelihood strategy to yield much more
precise estimates of the direct impact of the VSLA program
than the ITT and TOT analysis. Indeed, in the high-
likelihood results in Table 3, we find significant changes in
broadly the same areas as the ITT and TOT analysis did. The
estimated impacts are most often larger than in the ITT
analysis – which is as expected given the higher take-up rate
in this subsample. Some impact estimates lose statistical
significance, and others become significant, but in general,
the picture that emerges from the high-likelihood approach
is not qualitatively different form the ITT approach. Since
the ITT estimates don’t rely on any assumptions about take-
up models and are most true to the original research design,
they remain our preferred set of estimates.
23
Recall that in this model we regress VSLA participation on baseline
village, household and individual characteristics using the treatment sample.
Impact Assessment of Savings Groups Findings from Randomized Evaluations of CARE Village Savings and Loans Associations in Ghana, Malawi and Uganda
40
SECTION 6. CONCLUSIONS
This final section synthesizes our findings and presents the
major lessons from the evaluation. Timeline is a key aspect
for interpreting the findings from this study. At the time of
the endline survey, after an average of two years of program
implementation in the three sites, one third of respondents
had joined a group. On average members had been part of a
group for 15 months and 61% of members had gone through
a full savings cycle, normally lasting between 8 and 12
months. The evaluation should thus be thought of as
assessing the relatively short-term impacts of the
intervention.
We first tested whether VSLAs change the financial
behavior of participants. We find that they do. Savings group
participation increases substantially in treatment villages.
Moreover, VSLAs do not seem to be dominated solely by
the better-off community members, although wealth,
education, age and business ownership are correlated with
participation.
We find that replication is occurring, with little evidence that
groups formed in peripheral areas lose quality. In the control
areas, we see about 6% of respondents participating in
savings groups. This diminishes our ability to detect impact
somewhat but, on the flipside, points to the popularity of the
program and the eagerness of community members to join
VSLAs.
VSLAs substantially increase the portfolio of financial
services available to participants. More people have access
to savings and loans, and average deposit and loan volumes
increase as a result of the program. Saving balances increase
significantly, even after subtracting outstanding debits.
The increased access to financial tools and perhaps the social
aspect of the VSLAs help women invest in their businesses.
We find that women with access to VSLAs are much more
likely to take out a loan for commerce. They are significant-
ly more likely to own a business. Income from businesses
goes up too. However, the increase in business activity is
accompanied by an increased likelihood to experience busi-
ness failure.
The presence of savings groups leads to improvements in
women’s intra-household decision-making power, but we
observe little change in their involvement in the community.
We see no significant impacts on households’ ability to
mitigate economic shocks, but we do witness some mild
improvements in food security, with households less likely
to reduce adults’ food consumption.
We find that households access more credit for a variety of
investment purposes, including for agriculture, health and
education. There is non-robust evidence that the intervention
increased the enrollment of children of primary-school age.
However, we do not detect changes in agricultural produc-
tion, livestock holdings or the accumulation of household
assets. In addition, use of health services and health expendi-
tures remain unaffected and we see no significant impact on
housing conditions, food consumption or non-food expendi-
tures.
As the timeframe of the study was two to three years, we
cannot exclude that more time is needed for the short-term
changes we observe to lead to changes in agricultural
incomes, holdings of non-financial assets, health outcomes
and consumption levels. The long-term welfare impacts of
the VSLA program are in need of further focus in future
research.

Impact Assessment of Savings Groups Findings from Randomized Evaluations of CARE Village Savings and Loans Associations in Ghana, Malawi and Uganda
41
APPENDIX I - STUDY AREAS
MALAWI
Mzimba District
Mchinji District
Lilongwe District
Zomba District
GHANA North
Lawra District
Builsa District
East Mamprusi District
Garu Tempane District
Bawku Municipal District
UGANDA West / Southwest East
Kamwenge District Bukedea District
Bushenyi District Kamuli District
Kanungu District Kumi District
Rukungiri District
Impact Assessment of Savings Groups Findings from Randomized Evaluations of CARE Village Savings and Loans Associations in Ghana, Malawi and Uganda
42
APPENDIX II - QUALITATIVE INSIGHTS FROM MALAWI AND UGANDA
To complement the data collection carried out throughout
this study, we conducted two sets of focus group discus-
sions. In Uganda the focus group contained approximately
90 people in 8 villages, while in Malawi the focus group was
comprised of 200 people in 12 program areas.
1. Uganda (July 2009, Month 1)
Use of Financial Instruments at Baseline
Immediately after completing the baseline survey in Uganda,
we conducted focus groups in an attempt to gather detailed
information on savings and credit access for households in
our study areas. In all, respondents use three main avenues
for savings and credit: informal options, savings groups and
formal institutions.
The majority of respondents saved in informal environments
by placing their savings with relatives, friends or neighbors,
in a hidden place at home or in the workplace or just perma-
nently keeping money in pockets, belts and other clothing.
Accessibility is the most important reason for these practic-
es, yet respondents were concerned about the safety of funds
saved in this way.
Friends and family members are considered an important
and relatively straightforward source of credit. They fre-
quently don’t charge interest rates and are considerate of the
needs of the borrowers. In contrast, traders and moneylend-
ers are considered as a last resort, as they offer very unfair
conditions.
Livestock purchases are also often considered by focus
group members as an interest-bearing savings option. Not
only is the money tied up in an animal until it is sold, inter-
est comes from both the higher worth of the animal as it gets
older, and from the value of the offspring or food produced
by the livestock.
Informal savings groups were also mentioned as a popular
savings environment, even though the villages in our sample
were selected explicitly for their lack of existing VSLA
programming. These groups included ROSCAs, ASCAs and
other programs; meet on a monthly basis; and were formed
by village members. According to respondents, these groups
are similar to VSLAs and allow members to earn returns on
small savings amounts, are easily accessible in case of
emergency and safer than other informal options.
In some cases, however, respondents mentioned misman-
agement, abuse from group officials, creditor defaults, and
liquidity issues, which limited their effectiveness. In addi-
tion, savings groups’ loans are often smaller and more ex-
pensive than those available at formal financial institutions.
Barriers to access to informal savings group are quite com-
mon, as these informal groups (particularly ROSCAs) often
require minimum amounts and service fees to enter a group.
In some cases, savings groups require that women come to
the group with their spouse, who stands as a guarantor in
case his spouse defaults.
Similarly, financial institutions such as savings and credit
cooperatives (SACCOs), microfinance institutions (MFIs),
and commercial banks have large barriers to entry in terms
of access fees and minimum balances. Transportation costs
to reach bank branches in larger cities are also considered an
important limit to financial institutions. Many respondents
are unfamiliar with banks, the language and technology they
adopt is difficult for respondents to understand, and bank
employees are often perceived as disrespectful. However,
banks are considered useful for protecting savings form theft
and are frequently used to receive remittances from relatives
in Kampala. In sum, banks allow respondents to deposit and
access larger amounts of money than do savings groups, but
can only be accessed by a few.
A key theme emerging from the interviews is that income
stability, especially with respect to agriculture seasonality, is
a considerable problem for respondents. The lack of stable
incomes restricts willingness to borrow and often increases
default rates for those who do take loans.
Several focus group participants emphasized that longer and
more flexible repayment periods would reduce the likelihood
of default. If the first harvest after a loan is a poor one, for
example, a longer payment period may allow them to recov-
er losses and pay back at the time of the next harvest.
Compared to formal institutions, savings group members
tend to understand each other’s problems and are often will-
ing to give out loans or adjust payments in order to help to
solve them. The process is supportive and familiar, especial-
ly compared to the distrust of clients shown by formal finan-
cial institutions.
Impact Assessment of Savings Groups Findings from Randomized Evaluations of CARE Village Savings and Loans Associations in Ghana, Malawi and Uganda
43
2. Malawi (November 2010, Month 17)
Profile of VSLA members and Uses of VSLAs
In Malawi, focus groups contained both VSLA members and
non-members. Members were selected from VSLAs at dif-
ferent stages of their development: Half of them were se-
lected from groups that had completed a cycle and shared-
out, while the other half had not completed a cycle yet.
Members and Non-Members
Discussions between members and non-members centered
on the reasons why the members had joined the VSLA and
non-members had not, even 17 months after the programs
had started.
The main reason cited by members for joining a VSLA was
the ease of use. Weekly meetings in the village (as opposed
to traveling into the city to do business at a formal
institution) and easy and favorable access to credit were both
attractive to members.
In general, the most common reason for not having joined a
VSLA was that respondents did not understand the rules and
characteristics of the group and decided not to join the
groups formed early in the process. It was also difficult for
community members to join when village chiefs did not
support the efforts of the implementing partner or village to
set up a VSLA. Although villagers mentioned that other
organizations were offering loans, none of these
organizations are implementing programs that can be
regarded as a VSLA scheme. The majority of non-members
said they witnessed improvements in the lives of members,
which enticed them to consider joining a group.
The ins and outs in VSLAs
It was very rare to find households with more than one
person participating in a VSLA, as it was difficult for
households to gather sufficient funds to deposit
simultaneously in more than one saving group. Therefore,
even if only one individual participates in a group, he or she
frequently represents the entire household. The main source
of savings among VSLA members is income from
agricultural activity or from the household’s business.
Most respondents reported having taken loans from VSLAs
in order to take advantage of new business opportunities,
especially sale of vegetables, mandazi (the Malawian
equivalent of a doughnut), or other snack foods. Members
often repay or plan to repay their loans using the revenues
from their new businesses.
Focus group participants also noted that emergencies and
unforeseen expenses (including food consumption in
difficult times) caused them to borrow from the VSLA.
As for share-outs, the most common use of these funds was
to start a new business or invest in existing activities.
Although share-outs were frequently invested, some parents
proudly noted that they were able to send their children to
school with this money. A fair number of community
members reported having used the share-outs to buy
households items such as soap, clothes and fertilizers.
As a broad signal that many were happy with the VSLA
program, members also commonly reported keeping a
portion of the share-outs to save in the next cycle.
Satisfaction and perceived impacts from the program
People were satisfied with the saving amounts they had
deposited, and the desire to increase the value of their shares
demonstrates that members at least had the intention of
saving regularly.
Based on the focus group discussions, as well as direct
observation, members appeared to be very satisfied with the
VSLAs. In some cases, though, participants were not fully
aware of the program’s rules (particularly those related to
interest rates or maximum loan amounts), especially within
those groups that had recently started borrowing. Episodes
of absenteeism were also mentioned as one of the main
challenges, as this reduces the amount of money contributed
to the VSLA. This absenteeism causes tension between
members who show up regularly and those who are often
absent.
The introduction of VSLAs promoted a change in behavior
that reflected the increased importance of savings. VSLA
members are likely to save regularly every week and work
hard to find money to deposit or to pay back the loans taken.
This change is seen by the rest of the village, and represents
an important accomplishment for members.
Finally, focus groups respondents displayed enthusiasm for,
and interest in, continued support from implementing
partners and village agents. Additional training in business
and management was requested in order to be able to use the
money accumulated with the groups more effectively by
identifying viable and profitable opportunities for
investment.
Impact Assessment of Savings Groups Findings from Randomized Evaluations of CARE Village Savings and Loans Associations in Ghana, Malawi and Uganda
44
APPENDIX III - GLOSSARY
Sample
Primary Respondent: refers to the household member selected to answer the adult survey. In Uganda, this household
member was randomly selected between the household head and his spouse. In Malawi and Ghana, only the spouse or the
female household head was chosen.
Female Primary Respondent: indicates female respondents to the adult survey.
Working-Age Women: refers to all female members of the household between the ages of 20 and 60 years.
Member: refers to a woman primary respondent who reported to be a member of a VSLA.
Non-Member: refers to a woman primary respondent who did not claim to be a member of a VSLA.
Impacts
Significant: refers to statistical significance. When we say that an impact or a difference is significant or statistically
significant, we do not make an observation on the magnitude of the impact or the relevance for the program. We indicate that
the said impact is statistically different from zero within a 95% confidence interval or more. In other words, we are 95% sure
that the difference was due to the intervention rather than to chance. We refer to a “suggestive” impact when said impact is
statistically different from zero only within a 90% confidence interval. The notations to express statistical significance in our
tables are:
*** Significant at the 1% level (within 99% confidence interval)
** Significant at the 5% level (within 95% confidence interval)
* Significant at the 10% level (within 90% confidence interval)
If an impact estimate has no stars, we cannot determine with an adequate level of confidence that the treatment group is in
fact different from the control group.
Confidence Interval: the confidence interval adjusts the difference between the treatment and control group for reasonable
noise in the data. For example: in a 95% Confidence Interval (Table 1) impact estimates that are not significant at the 5%
level will include a zero between the lower and upper bounds (i.e. the lower bound is negative and the upper is positive). This
means that we cannot exclude that the impact is equal to zero. A significant result will display lower and upper bounds that
are either entirely below or above zero, implying that we are 95% confident the intervention had an impact in this direction.
Exchange Rates
All currency amounts were measured in the local currency at nominal prices at the time of surveying; Ghanaian Cedi (GHC)
in Ghana, Malawi Kwacha (MWK) in Malawi and Ugandan Shilling (UGX) in Uganda. US Dollar amounts throughout this
report are calculated using the mean exchange rates over the endline survey period; $0.66 for 1 GHC in Ghana, $0.007 for 1
MWK in Malawi and $0.0004 for 1 UGX in Uganda.
Indices
Agricultural Inputs Index: a standardized index that includes use of chemical fertilizers, use of organic fertilizer and use of
herbicides.
Impact Assessment of Savings Groups Findings from Randomized Evaluations of CARE Village Savings and Loans Associations in Ghana, Malawi and Uganda
45
Influence Decisions Index: a standardized index that measures the extent to which female respondents can influence
household decisions regarding food consumption, general purchases, schooling expenses, expenditures on personal and
children’s health, and the ability to visit a friend.
Conversations with Authorities Index: a standardized index that incorporates the frequency with which female respondents
raise issues with village authorities, including the village chief, president of the women’s committee, and a local council
member. This index is incorporated in the community participation index mentioned below.
Community Participation Index: a standardized index that attempts to capture the extent to which female respondents are
involved in community affairs. This index incorporates the aforementioned index on conversations with authorities, as well
as dummies for whether or not the female respondent attends village meetings and participates in any social group (a
women’s group, or workers’ group for instance).
Empowerment Index: a standardized index that tries to capture the degree to which women feel a sense of community
empowerment. This index includes the degree to which women feel that they can effect change in the community, react to
something a neighbor says, feel that somebody in the community would provide assistance if it is needed, and feel that
women should be more involved in decision-making in the community.
Community Integration Index: an alternative index to capture the extent to which female respondents are integrated into the
community, incorporating measures of whether or not the female respondent attends village meetings, speaks at these
meetings, participates in any social group, votes in the district elections and a dummy for whether or not the respondent ever
raises issues with village authorities.
Unabsorbed Shock Index: a standardized index that incorporates measures of the size of the economic shocks experienced by
the household and the length of time that the household took to recover from a shock.
Food Insecurity Index: a standardized index that captures a household’s level of food insecurity by including measures of
whether or not adults and/or children in the household had to skip, or reduce, meals in the past 12 months.
Asset Index: a principal-component analysis (PCA) index of all assets owned by the household.
Housing Quality Index: a standardized index indicating quality of housing by including the quality of the household’s roof,
floor, walls, lighting and energy availability, toilets, and drinking water access.

Impact Assessment of Savings Groups Findings from Randomized Evaluations of CARE Village Savings and Loans Associations in Ghana, Malawi and Uganda
46
APPENDIX IV – TABLES
Descriptive Tables
Table A. Baseline Characteristics and Balance Check
Table A1. Tests for Balance Between Treatment and Control Groups and Ignorability of Attrition
Table B. Characteristics and Uses of VSLA
Table C. VSLA Uptake Over Time
Table D. Members Characteristics (baseline)
Table E. Likelihood to Participate in VSLAs
Table F. Replication Characteristics and Uses of VSLA
Impact Tables
Table 1. Impacts on Pooled Sample
Table 2. Impacts by Country
Table 3. Impacts on Participants

Table A. Baseline Characteristics and Balance Check
Mean Mean Mean Mean
Control Group Control Group Control Group Control GroupHousehold Demographics
Household size 5.729 0.070 13554 5.841 0.140 4487 5.323 -0.055 4513 6.030 0.127 4554(0.05) (0.12) (0.06) (0.09)
Number of Children 5 Years and Under 1.078 0.047 ** 13554 0.809 0.036 4487 1.273 0.040 4513 1.146 0.065 * 4554(0.02) (0.04) (0.03) (0.04)
School enrollment, primary age girls 0.849 0.032 *** 5530 0.790 0.047 * 1638 0.873 0.032 ** 2095 0.872 0.018 1797(0.01) (0.03) (0.01) (0.01)
School enrollment, primary age boys 0.837 0.023 ** 5695 0.783 0.051 * 1841 0.860 0.015 1994 0.863 0.006 1860(0.01) (0.03) (0.02) (0.02)
School enrollment, secondary age girls 0.717 0.013 4331 0.660 0.041 1473 0.638 0.028 1052 0.809 -0.018 1806(0.01) (0.03) (0.03) (0.02)
School enrollment, secondary age boys 0.792 0.009 4691 0.734 0.031 1869 0.818 0.000 1005 0.836 -0.008 1817(0.01) (0.03) (0.02) (0.02)
Household Head is a Woman 0.144 -0.002 13400 0.041 0.015 ** 4404 0.161 0.007 4511 0.227 -0.027 * 4485(0.01) (0.01) (0.01) (0.01)
Household Activities
Farming Household 0.988 -0.002 13522 0.999 0.000 4487 0.982 -0.005 4516 0.983 -0.001 4519(0.00) (0.00) (0.00) (0.00)
Had a business at baseline 0.259 0.010 13527 0.093 0.000 4487 0.385 0.009 4512 0.293 0.020 4528(0.01) (0.01) (0.02) (0.02)
Conducted paid work at baseline 0.441 -0.006 13541 0.161 0.006 4487 0.603 0.002 4515 0.551 -0.026 4539(0.01) (0.02) (0.02) (0.02)
Household Assets
Wealth Index (asset based index) -0.014 0.117 ** 13351 0.087 0.086 4329 -0.050 0.104 4529 -0.075 0.159 4493(0.06) (0.11) (0.08) (0.10)
Owned a cellphone 0.238 0.017 * 13464 0.153 0.008 4442 0.248 0.029 * 4529 0.310 0.013 4493(0.01) (0.02) (0.02) (0.02)
Owned a bicyle 0.575 0.000 13497 0.755 -0.008 4475 0.572 -0.009 4529 0.400 0.017 4493(0.01) (0.02) (0.02) (0.02)
House has Iron Sheet Roof 0.328 0.020 * 13429 0.163 0.015 4456 0.180 0.024 4498 0.644 0.022 4475(0.01) (0.01) (0.02) (0.02)
House has electricity 0.029 -0.007 13420 0.068 -0.025 4430 0.012 0.004 4499 0.009 0.000 4491(0.01) (0.02) (0.00) (0.01)
Primary Respondent's Demographics
Age 36.541 -0.224 13336 37.026 0.278 4373 32.383 -0.231 4493 40.351 -0.691 4470(0.25) (0.45) (0.36) (0.49)
Can read and write 0.434 0.022 ** 13320 0.104 0.015 4348 0.588 0.045 ** 4489 0.595 0.006 4483(0.01) (0.01) (0.02) (0.02)
Has at least 5 years of schooling 0.392 0.020 ** 13140 0.067 0.018 * 4350 0.654 0.020 4324 0.447 0.021 4466(0.01) (0.01) (0.02) (0.02)
Primary Respondent's Financial Services
Held savings at baseline 0.488 0.014 13232 0.347 0.025 4338 0.487 0.005 4406 0.624 0.012 4488(0.01) (0.02) (0.03) (0.02)
Saved with a Bank or MFI at baseline 0.035 0.003 13232 0.029 0.004 4338 0.040 0.011 4177 0.024 0.001 4488(0.00) (0.01) (0.01) (0.01)
Received a loan at baseline 0.187 0.001 13111 0.019 -0.002 4368 0.245 -0.010 4439 0.294 0.014 4304(0.01) (0.00) (0.01) (0.02)
Gave a loan at baseline 0.128 0.005 13202 0.014 0.002 4370 0.209 -0.009 4403 0.158 0.021 4429(0.01) 0.00 (0.01) (0.01)
Primary Respondent's Social Capital
Community Integration index 0.011 -0.003 13202 0.012 -0.004 4374 0.000 0.019 4340 0.049 -0.024 4488(0.02) (0.04) (0.04) (0.03)
Decision index -0.005 0.003 12251 0.005 -0.056 4116 0.000 0.012 4334 0.000 0.011 3801(0.02) (0.04) (0.04) (0.04)
Village Charactersitics
Village population 677.846 -42.234 392 683.273 6.507 156 776.492 -136.283 374 587.863 -42.234 388(59.25) (68.25) (112.29) (59.63)
Minutes to closest tarmac road (walking) 135.692 129.050 * 390 103.235 -37.338 170 102.754 34.579 376 193.802 129.050 * 386(66.20) (57.32) (27.13) (66.63)
Minutes to closest market (walking) 56.093 0.789 387 41.963 0.501 170 54.677 3.306 373 77.601 0.789 383(6.58) (6.72) (7.70) (6.62)
Primary School in the Village 0.480 -0.080 394 0.584 -0.093 * 173 0.323 0.077 376 0.512 -0.080 390(0.05) (0.05) (0.07) (0.05)
Malawi Uganda
Difference
Ghana
Difference Difference Difference
Pooled
Obs.T-C T-C T-C T-C
Obs. Obs. Obs.

Overall Treatment Control Overall Treatment Control Overall Treatment Control Overall Treatment Control
8.76% 8.93% 8.58% 9.16% 8.62% 9.69% 9.52% 10.30% 8.75% 7.60% 7.89% 7.31%
Balance1
Attrition
(Mean)2
Attrition
(Covariates)3 Balance
1Attrition
(Mean)2
Attrition
(Covariates)3 Balance
1Attrition
(Mean)2
Attrition
(Covariates)3 Balance
1Attrition
(Mean)2
Attrition
(Covariates)3
F-test (p value) 0.774 0.564 0.665 0.790 0.385 0.298 0.550 0.127 0.259 0.332 0.531 0.697
Observations 13,555 13,555 13,555 4,487 4,487 4,487 4,529 4,529 4,529 4,539 4,539 4,539
1 F-test for difference between treatment and control groups across all baseline variables in Table A. The null hypothesis is that treatment assignment is orthogonal to the set
of covariates in Table A. There is no evidence against the null hypothesis.
2 F-test for difference in mean attrition rates between treatment and control groups. The null hypothesis is that attrition rates are the same between treatment and contorl
groups. There is no evidence against the null hypothesis.
3 F-test for differential attrition between treatment and control groups across all covariates in Table A. The null hypothesis is that the covariates in Table A affect attrition in
the same way in treatment and control groups. There is no evidence against the null hypothesis.
Table A1:. Tests for balance between treatment and control groups and ignorability of attrition
Pooled Ghana Malawi Uganda
Pooled Ghana Malawi Uganda
Household
Attrition Rate

Table B: Characteristics and Uses of VSLA
Mean St. Dev. Obs. Mean St. Dev. Obs. Mean St. Dev. Obs. Mean St. Dev. Obs.
Savings group participation
Member of more than one VSLAs (0/1) 0.03 0.17 2491 0.00 0.04 1497 0.01 0.08 480 0.08 0.27 514
Member also in another ASCA (0/1) 0.15 0.36 2491 0.10 0.31 1497 0.03 0.16 480 0.32 0.47 514
Member also in a ROSCA (0/1) 0.1 0.31 2491 0.02 0.14 1497 0.02 0.14 480 0.26 0.44 514
VSLA Characteristics
Number of months since joined group 15.24 8.90 2438 20.04 8.23 1457 11.8 7.42 477 13.88 8.84 504
Number of members in group (median) 25 7.62 2489 23 8.03 1496 19 5.18 480 30 5.02 513
VSLA contributions (median $ per week) 0.66 4.21 2490 0.66 1.05 1496 0.66 5.81 480 0.84 4.26 514
Share-outs
Ever received a share-out (0/1) 0.61 0.49 2491 0.70 0.46 1497 0.57 0.50 480 0.56 0.50 514
Number of share-outs 1.32 0.86 1599 1.39 0.77 1037 1.21 0.68 272 1.34 1.08 290
Recent share amount (median $) 37.97 39.94 1604 31.91 31.93 1042 47.85 47.79 272 42.19 35.63 290
Share-out uses (0/1)
Food 0.16 0.37 1605 0.05 0.23 1043 0.30 0.46 272 0.16 0.37 290
Education 0.16 0.37 1605 0.14 0.34 1043 0.07 0.26 272 0.27 0.44 290
Livestock 0.07 0.26 1605 0.01 0.11 1043 0.04 0.19 272 0.17 0.38 290
Fertilizer 0.08 0.27 1605 0.03 0.18 1043 0.23 0.42 272 0.00 0.00 290
Other agriculture spending 0.14 0.35 1605 0.18 0.39 1043 0.12 0.33 272 0.10 0.3 290
Business 0.13 0.33 1605 0.19 0.39 1043 0.12 0.32 272 0.07 0.25 290
House repairs 0.11 0.31 1605 0.00 0.06 1043 0.19 0.39 272 0.16 0.36 290
Loans
Received a loan from VSLA (0/1) 0.68 0.47 2491 0.50 0.50 1497 0.67 0.47 480 0.85 0.36 514
Number of loans 1.82 1.12 1510 1.29 0.69 749 1.85 1.16 323 2.11 1.18 438
Median loan amount ($) 19.69 35.76 1510 19.74 17.17 749 18.21 31.26 323 20.75 45.2 438
Median interest payment ($) 0.10 0.10 1480 0.10 0.11 732 0.10 0.08 317 0.10 0.10 431
Loan uses (0/1)
Food 0.13 0.34 1510 0.18 0.38 749 0.20 0.40 323 0.06 0.24 438
Education 0.13 0.34 1510 0.08 0.27 749 0.03 0.16 323 0.24 0.43 438
Health 0.12 0.33 1510 0.09 0.29 749 0.07 0.25 323 0.18 0.38 438
Agriculture spending 0.09 0.28 1510 0.07 0.26 749 0.08 0.27 323 0.11 0.31 438
Business 0.29 0.45 1510 0.42 0.49 749 0.40 0.49 323 0.13 0.34 438
Social Fund (0/1)
VSLA has a social fund 0.89 0.31 2490 0.76 0.43 1497 0.99 0.12 480 0.93 0.25 513
Received money from social fund 0.38 0.48 2383 0.23 0.42 1461 0.27 0.45 424 0.61 0.49 498
Repaid money from social fund 0.73 0.44 756 0.86 0.35 335 0.11 0.32 116 0.92 0.27 305
Social fund uses (0/1)
Food 0.07 0.26 756 0.05 0.21 335 0.05 0.22 116 0.09 0.28 305
Education 0.08 0.27 756 0.1 0.31 335 0.00 0.00 116 0.10 0.30 305
Health 0.56 0.50 756 0.41 0.49 335 0.61 0.49 116 0.59 0.49 305
Funerals 0.17 0.37 756 0.33 0.47 335 0.26 0.44 116 0.07 0.26 305
Ghana Malawi UgandaPooled

Table C: Uptake of VSLAs Over TimeTable 28: Balance check
Bef. Apr 09 Apr-Sep 09 Oct 09-Mar 10 Apr-Sep 10 Oct 10-Jun 11 Total
Share of respondents who joined first VSLA:
Treatment 1.79% 6.21% 5.52% 9.48% 6.39% 29.38%
Control 0.35% 0.66% 0.72% 1.60% 1.81% 5.14%
Weekly contribution (median $) 0.84 0.66 0.84 0.66 0.84 0.66
Shared-out at least once (0/1) 94.29% 92.32% 92.73% 50.98% 14.62% 60.93%
Breakdown by country:Table 28: Balance check
Bef. Apr 09 Apr-Sep 09 Oct 09-Mar 10 Apr-Sep 10 Oct 10-May 11 Total
Share of respondents who joined first VSLA:
Treatment 2.53% 15.19% 3.85% 12.24% 1.98% 35.79%
Control 0.27% 1.59% 0.66% 4.26% 1.59% 8.36%
Weekly contribution (median $) 0.66 0.66 0.66 0.66 0.66 0.66
Shared-out at least once (0/1) 92.78% 93.18% 92.99% 42.52% 33.88% 69.64%
Bef. Apr 09 Apr-Sep 09 Oct 09-Mar 10 Apr-Sep 10 Oct 10-Jun 11 Total
Share of respondents who joined first VSLA:
Treatment 0.82% 2.09% 5.00% 6.68% 7.19% 21.79%
Primary village 1.15% 3.28% 6.40% 7.47% 8.45% 26.74%
Secondary village 0.27% 0.13% 2.70% 5.40% 5.13% 13.63%
Control 0.10% 0.15% 0.40% 0.50% 1.49% 2.64%
Weekly contribution (median $) 0.66 1.32 0.66 0.66 0.66 0.66
Shared-out at least once (0/1) 94.44% 88.64% 90.57% 69.50% 12.87% 56.67%
Bef. Apr 09 Apr-Sep 09 Oct 09-Mar 10 Apr-Sep 10 Oct 10-Jun 11 Total
Share of respondents who joined first VSLA:
Treatment 2.70% 4.66% 7.86% 11.46% 9.08% 35.76%Primary village 3.08% 5.17% 8.87% 12.56% 9.11% 38.79%
Secondary village 1.95% 3.66% 5.85% 9.27% 9.02% 29.76%
Control 0.82% 0.66% 1.32% 0.99% 2.56% 6.35%
Weekly contribution (median $) 0.84 0.84 1.05 0.84 0.84 0.84
Shared-out at least once (0/1) 95.35% 92.31% 94.64% 44.08% 11.27% 56.42%
Pooled1
Ghana
Malawi
Uganda
1 Take-up numbers for the pooled sample here use an alternative frequency weighting strategy from the one used in Table 1. Table 1 figures are used throughout the final report.
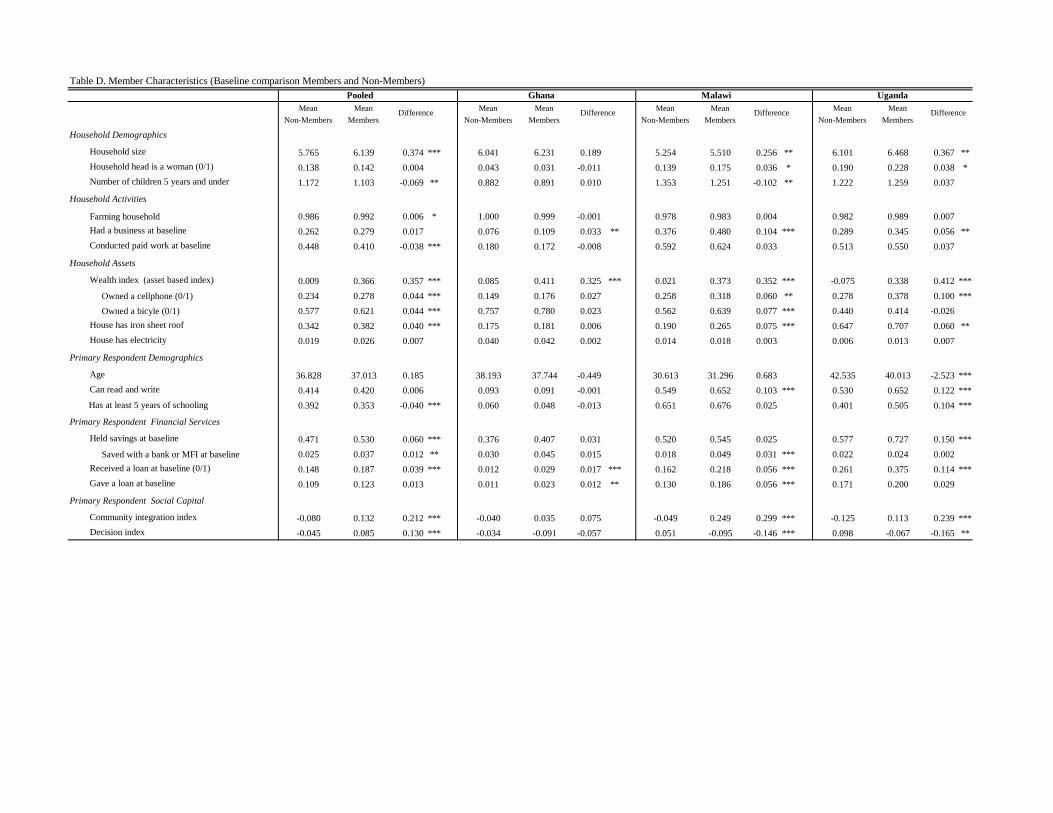
Mean Mean Mean Mean Mean Mean Mean Mean
Non-Members Members Non-Members Members Non-Members Members Non-Members Members
Household Demographics
Household size 5.765 6.139 0.374 *** 6.041 6.231 0.189 5.254 5.510 0.256 ** 6.101 6.468 0.367 **
Household head is a woman (0/1) 0.138 0.142 0.004 0.043 0.031 -0.011 0.139 0.175 0.036 * 0.190 0.228 0.038 *
Number of children 5 years and under 1.172 1.103 -0.069 ** 0.882 0.891 0.010 1.353 1.251 -0.102 ** 1.222 1.259 0.037
Household Activities
Farming household 0.986 0.992 0.006 * 1.000 0.999 -0.001 0.978 0.983 0.004 0.982 0.989 0.007
Had a business at baseline 0.262 0.279 0.017 0.076 0.109 0.033 ** 0.376 0.480 0.104 *** 0.289 0.345 0.056 **
Conducted paid work at baseline 0.448 0.410 -0.038 *** 0.180 0.172 -0.008 0.592 0.624 0.033 0.513 0.550 0.037
Household Assets
Wealth index (asset based index) 0.009 0.366 0.357 *** 0.085 0.411 0.325 *** 0.021 0.373 0.352 *** -0.075 0.338 0.412 ***
Owned a cellphone (0/1) 0.234 0.278 0.044 *** 0.149 0.176 0.027 0.258 0.318 0.060 ** 0.278 0.378 0.100 ***
Owned a bicyle (0/1) 0.577 0.621 0.044 *** 0.757 0.780 0.023 0.562 0.639 0.077 *** 0.440 0.414 -0.026
House has iron sheet roof 0.342 0.382 0.040 *** 0.175 0.181 0.006 0.190 0.265 0.075 *** 0.647 0.707 0.060 **
House has electricity 0.019 0.026 0.007 0.040 0.042 0.002 0.014 0.018 0.003 0.006 0.013 0.007
Primary Respondent Demographics
Age 36.828 37.013 0.185 38.193 37.744 -0.449 30.613 31.296 0.683 42.535 40.013 -2.523 ***
Can read and write 0.414 0.420 0.006 0.093 0.091 -0.001 0.549 0.652 0.103 *** 0.530 0.652 0.122 ***
Has at least 5 years of schooling 0.392 0.353 -0.040 *** 0.060 0.048 -0.013 0.651 0.676 0.025 0.401 0.505 0.104 ***
Primary Respondent Financial Services
Held savings at baseline 0.471 0.530 0.060 *** 0.376 0.407 0.031 0.520 0.545 0.025 0.577 0.727 0.150 ***
Saved with a bank or MFI at baseline 0.025 0.037 0.012 ** 0.030 0.045 0.015 0.018 0.049 0.031 *** 0.022 0.024 0.002
Received a loan at baseline (0/1) 0.148 0.187 0.039 *** 0.012 0.029 0.017 *** 0.162 0.218 0.056 *** 0.261 0.375 0.114 ***
Gave a loan at baseline 0.109 0.123 0.013 0.011 0.023 0.012 ** 0.130 0.186 0.056 *** 0.171 0.200 0.029
Primary Respondent Social Capital
Community integration index -0.080 0.132 0.212 *** -0.040 0.035 0.075 -0.049 0.249 0.299 *** -0.125 0.113 0.239 ***
Decision index -0.045 0.085 0.130 *** -0.034 -0.091 -0.057 0.051 -0.095 -0.146 *** 0.098 -0.067 -0.165 **
Table D. Member Characteristics (Baseline comparison Members and Non-Members)
Difference Difference Difference Difference
Pooled Ghana Malawi Uganda
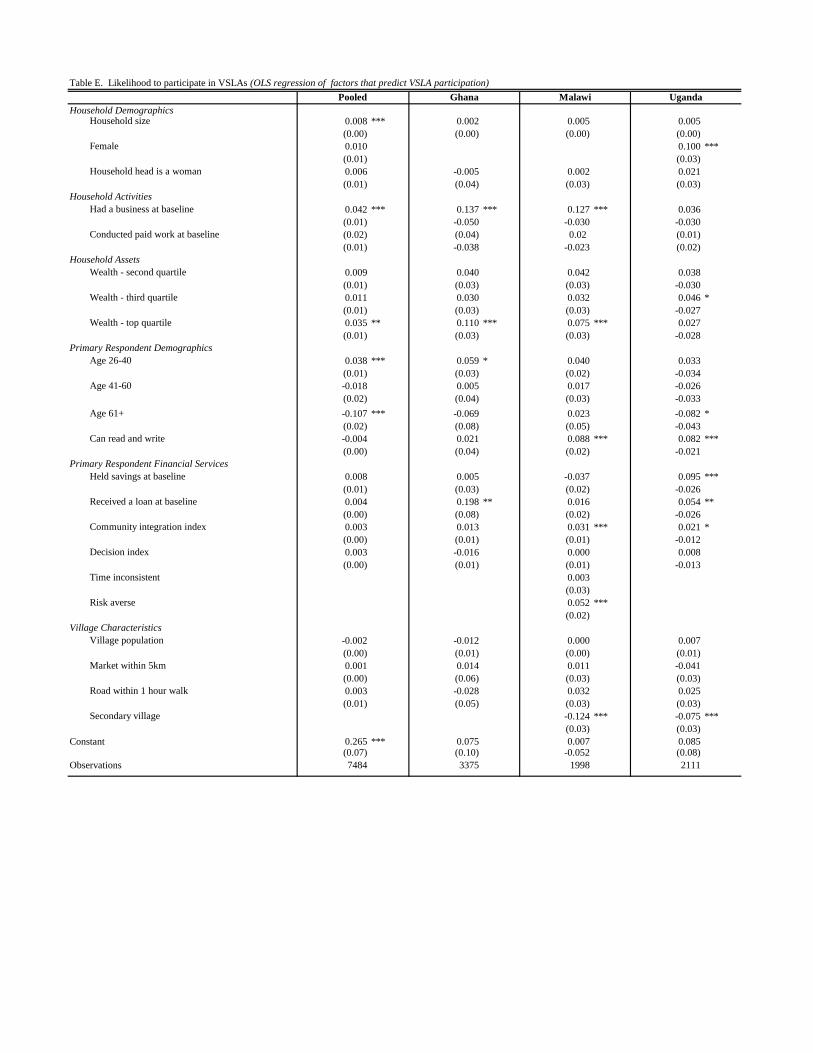
Household DemographicsHousehold size 0.008 *** 0.002 0.005 0.005
(0.00) (0.00) (0.00) (0.00)
Female 0.010 0.100 ***
(0.01) (0.03)
Household head is a woman 0.006 -0.005 0.002 0.021
(0.01) (0.04) (0.03) (0.03)
Household Activities
Had a business at baseline 0.042 *** 0.137 *** 0.127 *** 0.036
(0.01) -0.050 -0.030 -0.030
Conducted paid work at baseline (0.02) (0.04) 0.02 (0.01)
(0.01) -0.038 -0.023 (0.02)
Household Assets
Wealth - second quartile 0.009 0.040 0.042 0.038
(0.01) (0.03) (0.03) -0.030
Wealth - third quartile 0.011 0.030 0.032 0.046 *
(0.01) (0.03) (0.03) -0.027
Wealth - top quartile 0.035 ** 0.110 *** 0.075 *** 0.027
(0.01) (0.03) (0.03) -0.028
Primary Respondent Demographics
Age 26-40 0.038 *** 0.059 * 0.040 0.033
(0.01) (0.03) (0.02) -0.034
Age 41-60 -0.018 0.005 0.017 -0.026
(0.02) (0.04) (0.03) -0.033
Age 61+ -0.107 *** -0.069 0.023 -0.082 *
(0.02) (0.08) (0.05) -0.043
Can read and write -0.004 0.021 0.088 *** 0.082 ***
(0.00) (0.04) (0.02) -0.021
Primary Respondent Financial Services
Held savings at baseline 0.008 0.005 -0.037 0.095 ***
(0.01) (0.03) (0.02) -0.026
Received a loan at baseline 0.004 0.198 ** 0.016 0.054 **
(0.00) (0.08) (0.02) -0.026
Community integration index 0.003 0.013 0.031 *** 0.021 *
(0.00) (0.01) (0.01) -0.012
Decision index 0.003 -0.016 0.000 0.008
(0.00) (0.01) (0.01) -0.013
Time inconsistent 0.003
(0.03)
Risk averse 0.052 ***
(0.02)
Village Characteristics
Village population -0.002 -0.012 0.000 0.007
(0.00) (0.01) (0.00) (0.01)
Market within 5km 0.001 0.014 0.011 -0.041
(0.00) (0.06) (0.03) (0.03)
Road within 1 hour walk 0.003 -0.028 0.032 0.025
(0.01) (0.05) (0.03) (0.03)
Secondary village -0.124 *** -0.075 ***
(0.03) (0.03)
Constant 0.265 *** 0.075 0.007 0.085(0.07) (0.10) -0.052 (0.08)
Observations 7484 3375 1998 2111
Pooled Ghana Malawi Uganda
Table E. Likelihood to participate in VSLAs (OLS regression of factors that predict VSLA participation)

Table F: Replication Characteristics and Uses of VSLA (Primary and Secondary Villages)
Mean Mean Mean Mean
Primary Village Secondary Village Primary Village Secondary Village
Savings group participation
Member of more than one VSLAs (0/1) 0.01 0.01 0.00 0.09 0.09 0.00
Member also in another ASCA (0/1) 0.02 0.02 0.00 0.34 0.24 0.10 **
Member also in a ROSCA (0/1) 0.01 0.05 -0.04 *** 0.24 0.31 -0.07 *
VSLA Characteristics
Number of months since joined group 12.55 9.68 2.87 *** 14.52 12.82 1.70 *
Number of members in group (median) 19 19 0.00 30 30 0.00
VSLA contributions (median $ per week) 0.66 0.66 0.00 0.84 0.84 0.00
Share-outs
Ever received a share-out (0/1) 0.57 0.42 0.15 *** 0.59 0.48 0.11 **
Number of share-outs 1.05 0.83 0.22 1.39 1.17 0.23
Recent share amount (median $) 49.67 39.74 9.93 42.19 47.85 -4.22
Share-out uses (0/1)
Food 0.3 0.32 -0.03 0.15 0.24 -0.09 *
Education 0.07 0.05 0.02 0.25 0.27 -0.02
Livestock 0.04 0.02 0.02 0.18 0.22 -0.04
Fertilizer 0.25 0.17 0.08 0 0 0.00
Other agriculture spending 0.1 0.17 -0.07 0.09 0.08 0.02
Business 0.11 0.15 -0.04 0.06 0.08 -0.02
House repairs 0.22 0.07 0.15 ** 0.15 0.13 0.02
Loans
Received a loan from VSLA (0/1) 0.68 0.6 0.08 * 0.86 0.81 0.05
Number of loans 1.78 2 -0.22 2.11 2.06 0.05
Median loan amount ($) 19.87 13.25 6.62 ** 21.1 16.88 4.22 ***
Median interest payment ($) 0.1 0.1 0.00 0.1 0.12 -0.02
Loan uses (0/1)
Food 0.22 0.13 0.09 * 0.06 0.05 0.01
Education 0.03 0.04 0.00 0.27 0.19 0.08 *
Health 0.07 0.06 0.01 0.17 0.2 -0.03
Agriculture spending 0.08 0.06 0.02 0.1 0.13 -0.03
Business 0.38 0.48 -0.09 0.13 0.15 -0.03
Social Fund (0/1)
VSLA has a social fund 0.99 0.98 0.01 0.93 0.89 0.04
Received loan from social fund 0.28 0.21 0.07 0.61 0.56 0.05
Repaid money from social fund 0.11 0.15 -0.05 0.91 0.93 -0.02
Social fund uses (0/1)
Food 0.06 0.04 0.03 0.1 0.07 0.02
Education 0.00 0.00 0.09 0.12 -0.03
Health 0.61 0.65 -0.05 0.58 0.63 -0.05
Funerals 0.23 0.31 -0.07 0.08 0.08 0.00
Difference Difference
Malawi Uganda
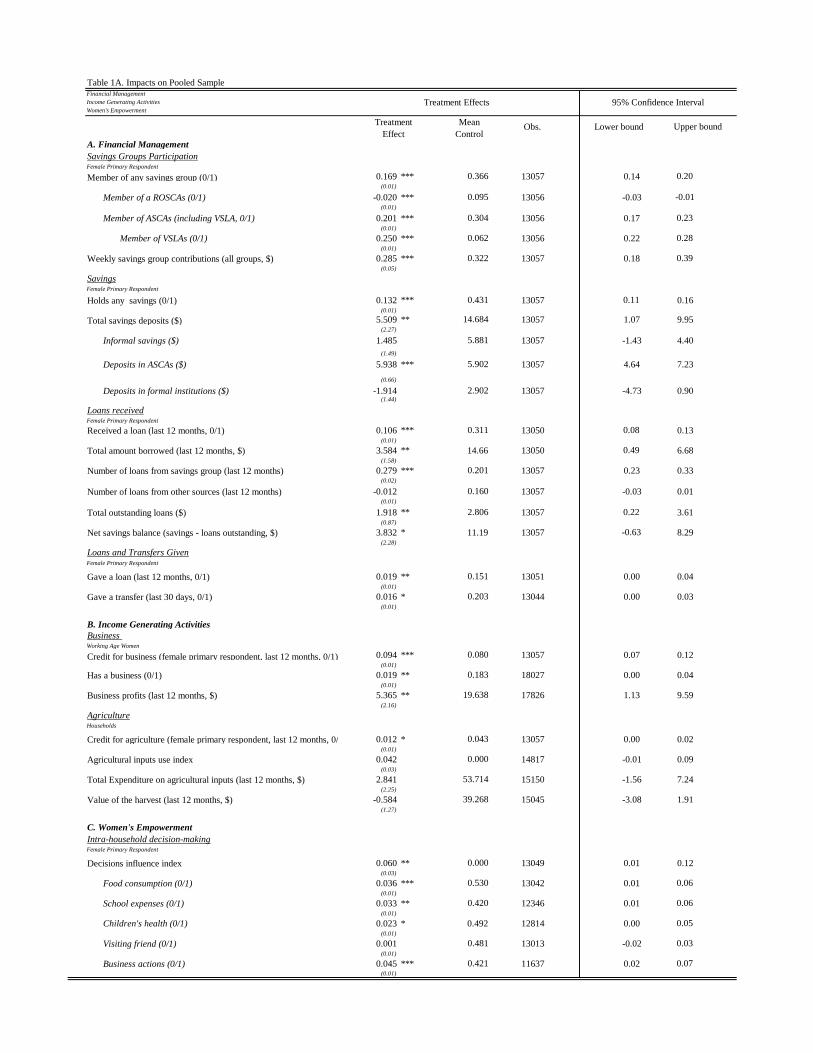
Table 1A. Impacts on Pooled Sample
Mean
ControlA. Financial Management
Savings Groups ParticipationFemale Primary Respondent
Member of any savings group (0/1) 0.169 *** 0.366 13057 0.14 0.20(0.01)
Member of a ROSCAs (0/1) -0.020 *** 0.095 13056 -0.03 -0.01(0.01)
Member of ASCAs (including VSLA, 0/1) 0.201 *** 0.304 13056 0.17 0.23(0.01)
Member of VSLAs (0/1) 0.250 *** 0.062 13056 0.22 0.28(0.01)
Weekly savings group contributions (all groups, $) 0.285 *** 0.322 13057 0.18 0.39(0.05)
SavingsFemale Primary Respondent
Holds any savings (0/1) 0.132 *** 0.431 13057 0.11 0.16(0.01)
Total savings deposits ($) 5.509 ** 14.684 13057 1.07 9.95(2.27)
Informal savings ($) 1.485 5.881 13057 -1.43 4.40
(1.49)
Deposits in ASCAs ($) 5.938 *** 5.902 13057 4.64 7.23
(0.66)
Deposits in formal institutions ($) -1.914 2.902 13057 -4.73 0.90(1.44)
Loans receivedFemale Primary Respondent
Received a loan (last 12 months, 0/1) 0.106 *** 0.311 13050 0.08 0.13(0.01)
Total amount borrowed (last 12 months, $) 3.584 ** 14.66 13050 0.49 6.68(1.58)
Number of loans from savings group (last 12 months) 0.279 *** 0.201 13057 0.23 0.33(0.02)
Number of loans from other sources (last 12 months) -0.012 0.160 13057 -0.03 0.01(0.01)
Total outstanding loans ($) 1.918 ** 2.806 13057 0.22 3.61(0.87)
Net savings balance (savings - loans outstanding, $) 3.832 * 11.19 13057 -0.63 8.29(2.28)
Loans and Transfers GivenFemale Primary Respondent
Gave a loan (last 12 months, 0/1) 0.019 ** 0.151 13051 0.00 0.04(0.01)
Gave a transfer (last 30 days, 0/1) 0.016 * 0.203 13044 0.00 0.03(0.01)
B. Income Generating Activities
Business Working Age Women
Credit for business (female primary respondent, last 12 months, 0/1) 0.094 *** 0.080 13057 0.07 0.12(0.01)
Has a business (0/1) 0.019 ** 0.183 18027 0.00 0.04(0.01)
Business profits (last 12 months, $) 5.365 ** 19.638 17826 1.13 9.59(2.16)
AgricultureHouseholds
Credit for agriculture (female primary respondent, last 12 months, 0/1) 0.012 * 0.043 13057 0.00 0.02(0.01)
Agricultural inputs use index 0.042 0.000 14817 -0.01 0.09(0.03)
Total Expenditure on agricultural inputs (last 12 months, $) 2.841 53.714 15150 -1.56 7.24(2.25)
Value of the harvest (last 12 months, $) -0.584 39.268 15045 -3.08 1.91(1.27)
C. Women's Empowerment
Intra-household decision-makingFemale Primary Respondent
Decisions influence index 0.060 ** 0.000 13049 0.01 0.12(0.03)
Food consumption (0/1) 0.036 *** 0.530 13042 0.01 0.06(0.01)
School expenses (0/1) 0.033 ** 0.420 12346 0.01 0.06(0.01)
Children's health (0/1) 0.023 * 0.492 12814 0.00 0.05(0.01)
Visiting friend (0/1) 0.001 0.481 13013 -0.02 0.03(0.01)
Business ActionsBusiness actions (0/1) 0.045 *** 0.421 11637 0.02 0.07(0.01)
Obs.
95% Confidence Interval
Lower bound Upper boundTreatment
Treatment Effects
Effect
Financial Management
Income Generating Activities
Women's Empowerment

Table 1B. Impacts on Pooled Sample
Mean
Control
Social Capital and Empowerment
Community participation index 0.026 0.000 13051 -0.02 0.08(0.02)
Participates in a group (0/1) 0.004 0.332 12778 -0.02 0.02(0.01)
Attend village meeting (last 12 months, 0/1) 0.022 ** 0.690 13048 0.00 0.04(0.01)
Conversations with authorities index 0.003 0.000 13042 -0.04 0.05(0.02)
Empowerment index -0.020 0.000 13049 -0.06 0.02
(0.02)
D. Shocks and Food Security
Reactions to ShocksHouseholds
Extra labor / migration (0/1) 0.006 0.180 15177 -0.01 0.02(0.01)
Loan from savings group (0/1) 0.015 *** 0.039 15177 0.01 0.02(0.00)
Other loans, grants, arrears (0/1) -0.007 0.236 15177 -0.03 0.01(0.01)
Assets / inventory sales (0/1) -0.015 0.279 15177 -0.04 0.01
(0.01)
Expenditure reduction (0/1) -0.009 0.110 15177 -0.03 0.01
(0.01)
Savings (0/1) 0.000 0.104 15177 -0.01 0.01(0.01)
Unabsorbed shock index -0.008 0.624 15177 -0.03 0.01(0.01)
Shock Impact and OccurrenceHouseholds
Shock with large negative impact (last 12 months, 0/1) -0.011 0.638 15177 -0.03 0.01(0.01)
Recovery from shock exceeded 3 months (last 12 months, 0/1) -0.005 0.090 15177 -0.02 0.01(0.01)
Business failure (last 12 months, 0/1) 0.018 *** 0.127 15177 0.00 0.03(0.01)
Food SecurityHouseholds
Credit for food (female primary respondet, last 12 months, 0/1) 0.036 *** 0.085 13057 0.02 0.05(0.01)
Food insecurity index -0.014 0.000 15175 -0.06 0.03
(0.02)
Not enough food (last 12 months, 0/1) -0.010 0.696 15175 -0.03 0.01
(0.01)
Adults reduced food consumption (last 12 months, 0/1) -0.023 ** 0.638 15175 -0.04 0.00
(0.01)
Children reduced food consumption (last 12 months, 0/1) -0.013 0.517 15175 -0.03 0.01(0.01)
E. Expenditures and Consumption
Non-Food ExpendituresHouseholds
Total selected expenditures (monthly est., $) 1.269 37.306 15182 -1.21 3.75(1.26)
Recurrent expenditures (last 7 days, $) 1.053 13.907 15186 -0.38 2.49(0.73)
House repairs (last month, $) 0.381 4.762 15105 -0.18 0.94(0.29)
Marriages (last 12 months, $) -2.925 26.420 15159 -7.33 1.48(2.25)
Funerals (last 12 months, $) 2.320 38.693 15084 -1.25 5.89(1.82)
Food ConsumptionHouseholds
Total food consumption (selected items, last 7 days, $ value) -0.211 24.727 15129 -1.06 0.64(0.43)
Grains (last 7 days, $ value) -0.111 7.203 15134 -0.41 0.19(0.15)
Nuts and beans (last 7 days, $ value) -0.038 1.971 15134 -0.17 0.09(0.07)
95% Confidence Interval
Upper boundLower bound
Treatment EffectsR
eact
ed t
o s
ho
ck b
y:
TreatmentObs.
Effect
Shocks and Food Security
Expenditures and Consumption
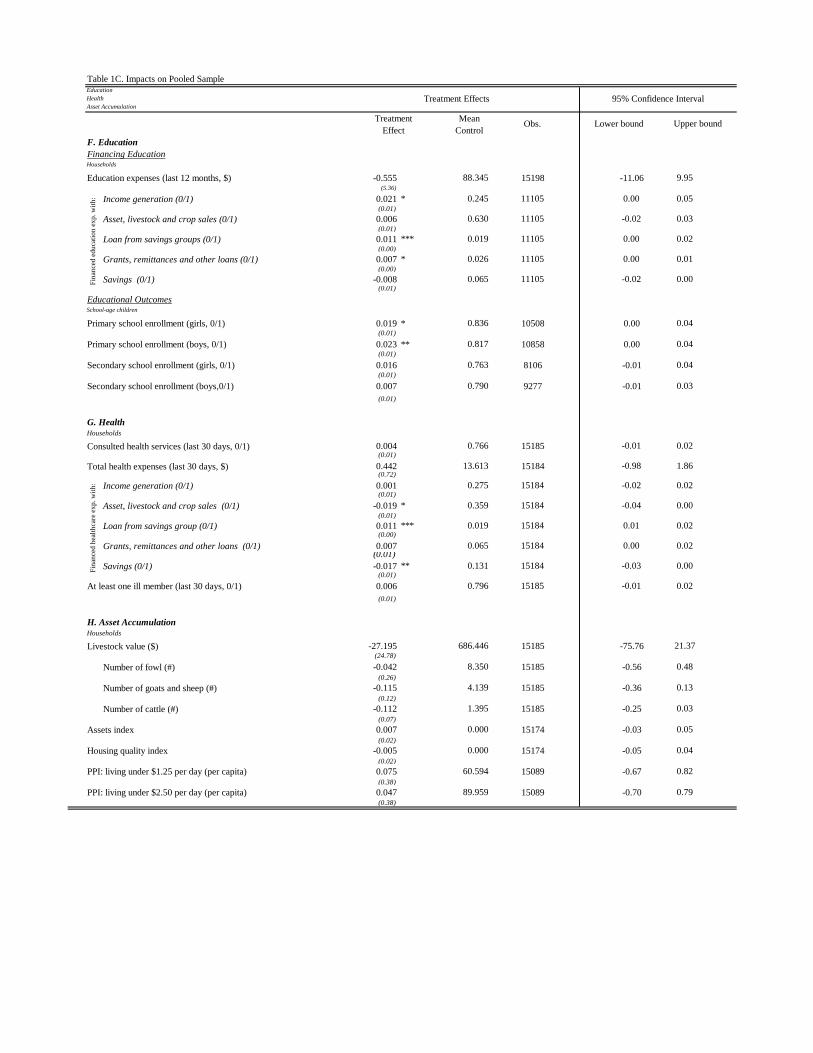
Table 1C. Impacts on Pooled Sample
Mean
Control
F. Education
Financing EducationHouseholds
Education expenses (last 12 months, $) -0.555 88.345 15198 -11.06 9.95(5.36)
Income generation (0/1) 0.021 * 0.245 11105 0.00 0.05(0.01)
Asset, livestock and crop sales (0/1) 0.006 0.630 11105 -0.02 0.03(0.01)
Loan from savings groups (0/1) 0.011 *** 0.019 11105 0.00 0.02(0.00)
Grants, remittances and other loans (0/1) 0.007 * 0.026 11105 0.00 0.01(0.00)
Savings (0/1) -0.008 0.065 11105 -0.02 0.00(0.01)
Educational OutcomesSchool-age children
Primary school enrollment (girls, 0/1) 0.019 * 0.836 10508 0.00 0.04(0.01)
Primary school enrollment (boys, 0/1) 0.023 ** 0.817 10858 0.00 0.04(0.01)
Secondary school enrollment (girls, 0/1) 0.016 0.763 8106 -0.01 0.04(0.01)
Secondary school enrollment (boys,0/1) 0.007 0.790 9277 -0.01 0.03
(0.01)
G. HealthHouseholds
Consulted health services (last 30 days, 0/1) 0.004 0.766 15185 -0.01 0.02(0.01)
Total health expenses (last 30 days, $) 0.442 13.613 15184 -0.98 1.86(0.72)
Income generation (0/1) 0.001 0.275 15184 -0.02 0.02(0.01)
Asset, livestock and crop sales (0/1) -0.019 * 0.359 15184 -0.04 0.00(0.01)
Loan from savings group (0/1) 0.011 *** 0.019 15184 0.01 0.02(0.00)
Grants, remittances and other loans (0/1) 0.007 0.065 15184 0.00 0.02(0.01)
Savings (0/1) -0.017 ** 0.131 15184 -0.03 0.00(0.01)
At least one ill member (last 30 days, 0/1) 0.006 0.796 15185 -0.01 0.02
(0.01)
H. Asset AccumulationHouseholds
Livestock value ($) -27.195 686.446 15185 -75.76 21.37(24.78)
Number of fowl (#) -0.042 8.350 15185 -0.56 0.48(0.26)
Number of goats and sheep (#) -0.115 4.139 15185 -0.36 0.13(0.12)
Number of cattle (#) -0.112 1.395 15185 -0.25 0.03(0.07)
Assets index 0.007 0.000 15174 -0.03 0.05(0.02)
Housing quality index -0.005 0.000 15174 -0.05 0.04(0.02)
PPI: living under $1.25 per day (per capita) 0.075 60.594 15089 -0.67 0.82(0.38)
PPI: living under $2.50 per day (per capita) 0.047 89.959 15089 -0.70 0.79(0.38)
Fin
ance
d h
ealt
hca
re e
xp
. w
ith
:F
inan
ced
ed
uca
tio
n e
xp
. w
ith
:
TreatmentObs.
Effect
95% Confidence Interval
Lower bound Upper bound
Education
Health
Asset AccumulationTreatment Effects
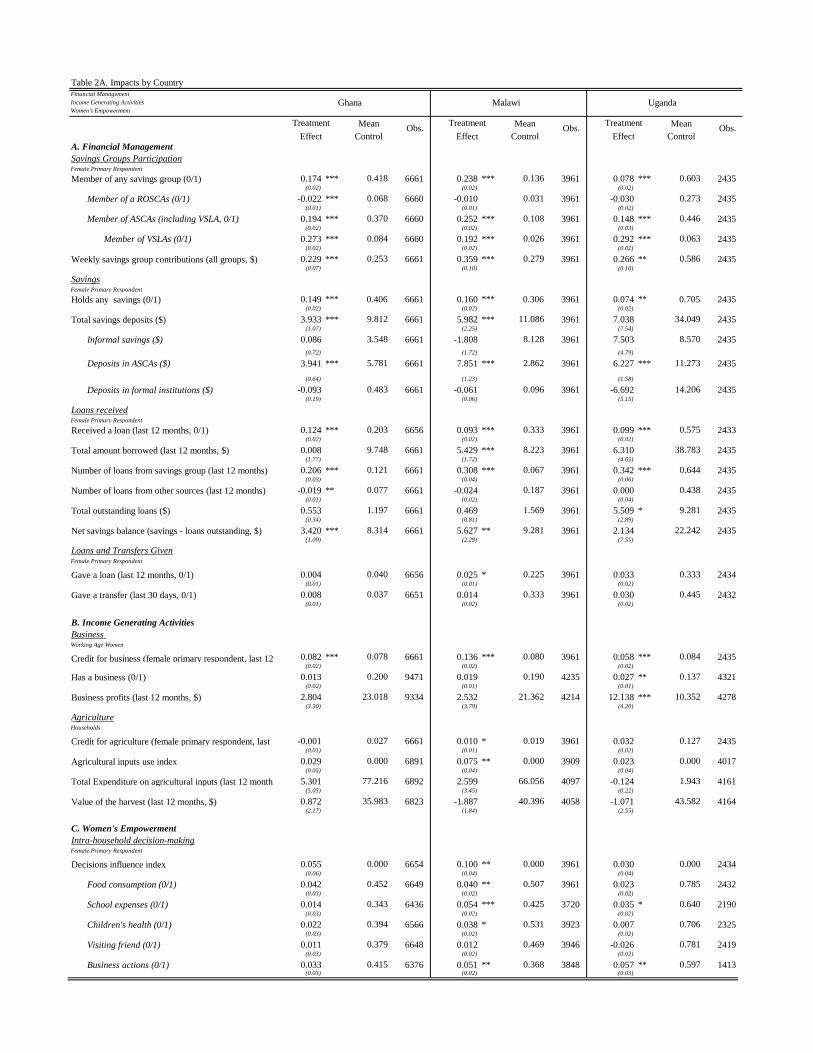
Table 2A. Impacts by Country
Mean Mean Mean
Control Control ControlA. Financial Management
Savings Groups ParticipationFemale Primary Respondent
Member of any savings group (0/1) 0.174 *** 0.418 6661 0.238 *** 0.136 3961 0.078 *** 0.603 2435(0.02) (0.02) (0.02)
Member of a ROSCAs (0/1) -0.022 *** 0.068 6660 -0.010 0.031 3961 -0.030 0.273 2435(0.01) (0.01) (0.02)
Member of ASCAs (including VSLA, 0/1) 0.194 *** 0.370 6660 0.252 *** 0.108 3961 0.148 *** 0.446 2435(0.02) (0.02) (0.03)
Member of VSLAs (0/1) 0.273 *** 0.084 6660 0.192 *** 0.026 3961 0.292 *** 0.063 2435(0.02) (0.02) (0.02)
Weekly savings group contributions (all groups, $) 0.229 *** 0.253 6661 0.359 *** 0.279 3961 0.266 ** 0.586 2435(0.07) (0.10) (0.10)
SavingsFemale Primary Respondent
Holds any savings (0/1) 0.149 *** 0.406 6661 0.160 *** 0.306 3961 0.074 ** 0.705 2435(0.02) (0.02) (0.02)
Total savings deposits ($) 3.933 *** 9.812 6661 5.982 *** 11.086 3961 7.038 34.049 2435(1.07) (2.25) (7.54)
Informal savings ($) 0.086 3.548 6661 -1.808 8.128 3961 7.503 8.570 2435
(0.72) (1.72) (4.79)
Deposits in ASCAs ($) 3.941 *** 5.781 6661 7.851 *** 2.862 3961 6.227 *** 11.273 2435
(0.64) (1.23) (1.58)
Deposits in formal institutions ($) -0.093 0.483 6661 -0.061 0.096 3961 -6.692 14.206 2435(0.19) (0.06) (5.15)
Loans receivedFemale Primary Respondent
Received a loan (last 12 months, 0/1) 0.124 *** 0.203 6656 0.093 *** 0.333 3961 0.099 *** 0.575 2433(0.02) (0.02) (0.02)
Total amount borrowed (last 12 months, $) 0.008 9.748 6661 5.429 *** 8.223 3961 6.310 38.783 2435(1.77) (1.72) (4.65)
Number of loans from savings group (last 12 months) 0.206 *** 0.121 6661 0.308 *** 0.067 3961 0.342 *** 0.644 2435(0.03) (0.04) (0.06)
Number of loans from other sources (last 12 months) -0.019 ** 0.077 6661 -0.024 0.187 3961 0.000 0.438 2435(0.01) (0.02) (0.04)
Total outstanding loans ($) 0.553 1.197 6661 0.469 1.569 3961 5.509 * 9.281 2435(0.34) (0.81) (2.89)
Net savings balance (savings - loans outstanding, $) 3.420 *** 8.314 6661 5.627 ** 9.281 3961 2.134 22.242 2435(1.09) (2.29) (7.55)
Loans and Transfers GivenFemale Primary Respondent
Gave a loan (last 12 months, 0/1) 0.004 0.040 6656 0.025 * 0.225 3961 0.033 0.333 2434(0.01) (0.01) (0.02)
Gave a transfer (last 30 days, 0/1) 0.008 0.037 6651 0.014 0.333 3961 0.030 0.445 2432(0.01) (0.02) (0.02)
B. Income Generating Activities
Business Working Age Women
Credit for business (female primary respondent, last 12 months, 0/1)0.082 *** 0.078 6661 0.136 *** 0.080 3961 0.058 *** 0.084 2435(0.02) (0.02) (0.02)
Has a business (0/1) 0.013 0.200 9471 0.019 0.190 4235 0.027 ** 0.137 4321(0.02) (0.01) (0.01)
Business profits (last 12 months, $) 2.804 23.018 9334 2.532 21.362 4214 12.138 *** 10.352 4278(3.30) (3.79) (4.20)
AgricultureHouseholds
Credit for agriculture (female primary respondent, last 12 months, 0/1)-0.001 0.027 6661 0.010 * 0.019 3961 0.032 0.127 2435(0.01) (0.01) (0.02)
Agricultural inputs use index 0.029 0.000 6891 0.075 ** 0.000 3909 0.023 0.000 4017(0.05) (0.04) (0.04)
Total Expenditure on agricultural inputs (last 12 months, $) 5.301 77.216 6892 2.599 66.056 4097 -0.124 1.943 4161(5.05) (3.45) (0.22)
Value of the harvest (last 12 months, $) 0.872 35.983 6823 -1.887 40.396 4058 -1.071 43.582 4164(2.17) (1.84) (2.55)
C. Women's Empowerment
Intra-household decision-makingFemale Primary Respondent
Decisions influence index 0.055 0.000 6654 0.100 ** 0.000 3961 0.030 0.000 2434(0.06) (0.04) (0.04)
Food consumption (0/1) 0.042 0.452 6649 0.040 ** 0.507 3961 0.023 0.785 2432(0.03) (0.02) (0.02)
School expenses (0/1) 0.014 0.343 6436 0.054 *** 0.425 3720 0.035 * 0.640 2190(0.03) (0.02) (0.02)
Children's health (0/1) 0.022 0.394 6566 0.038 * 0.531 3923 0.007 0.706 2325(0.03) (0.02) (0.02)
Visiting friend (0/1) 0.011 0.379 6648 0.012 0.469 3946 -0.026 0.781 2419(0.03) (0.02) (0.02)
Business ActionsBusiness actions (0/1) 0.033 0.415 6376 0.051 ** 0.368 3848 0.057 ** 0.597 1413(0.03) (0.02) (0.03)
Malawi Uganda
Treatment
EffectObs.
TreatmentObs.
Effect
TreatmentObs.
Effect
Financial Management
Income Generating Activities
Women's EmpowermentGhana
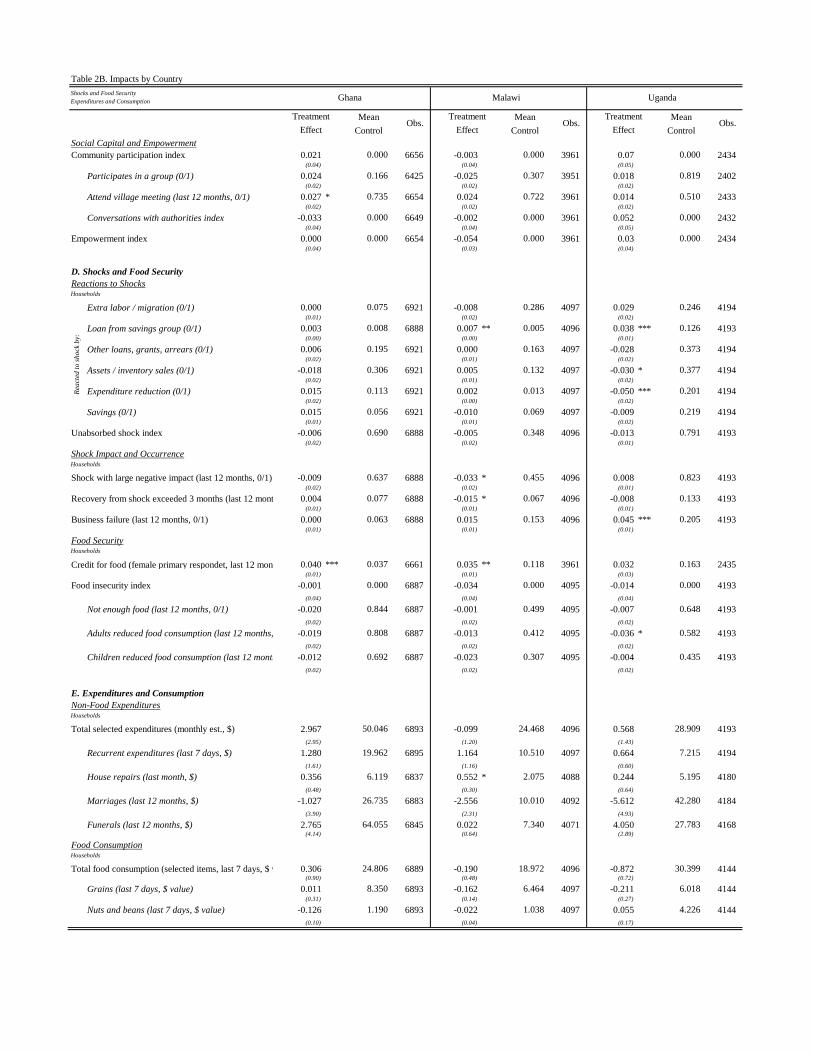
Table 2B. Impacts by Country
Mean Mean Mean
Control Control Control
Social Capital and Empowerment
Community participation index 0.021 0.000 6656 -0.003 0.000 3961 0.07 0.000 2434(0.04) (0.04) (0.05)
Participates in a group (0/1) 0.024 0.166 6425 -0.025 0.307 3951 0.018 0.819 2402(0.02) (0.02) (0.02)
Attend village meeting (last 12 months, 0/1) 0.027 * 0.735 6654 0.024 0.722 3961 0.014 0.510 2433(0.02) (0.02) (0.02)
Conversations with authorities index -0.033 0.000 6649 -0.002 0.000 3961 0.052 0.000 2432(0.04) (0.04) (0.05)
Empowerment index 0.000 0.000 6654 -0.054 0.000 3961 0.03 0.000 2434(0.04) (0.03) (0.04)
D. Shocks and Food Security
Reactions to ShocksHouseholds
Extra labor / migration (0/1) 0.000 0.075 6921 -0.008 0.286 4097 0.029 0.246 4194(0.01) (0.02) (0.02)
Loan from savings group (0/1) 0.003 0.008 6888 0.007 ** 0.005 4096 0.038 *** 0.126 4193(0.00) (0.00) (0.01)
Other loans, grants, arrears (0/1) 0.006 0.195 6921 0.000 0.163 4097 -0.028 0.373 4194(0.02) (0.01) (0.02)
Assets / inventory sales (0/1) -0.018 0.306 6921 0.005 0.132 4097 -0.030 * 0.377 4194(0.02) (0.01) (0.02)
Expenditure reduction (0/1) 0.015 0.113 6921 0.002 0.013 4097 -0.050 *** 0.201 4194(0.02) (0.00) (0.02)
Savings (0/1) 0.015 0.056 6921 -0.010 0.069 4097 -0.009 0.219 4194(0.01) (0.01) (0.02)
Unabsorbed shock index -0.006 0.690 6888 -0.005 0.348 4096 -0.013 0.791 4193(0.02) (0.02) (0.01)
Shock Impact and OccurrenceHouseholds
Shock with large negative impact (last 12 months, 0/1) -0.009 0.637 6888 -0.033 * 0.455 4096 0.008 0.823 4193(0.02) (0.02) (0.01)
Recovery from shock exceeded 3 months (last 12 months, 0/1)0.004 0.077 6888 -0.015 * 0.067 4096 -0.008 0.133 4193(0.01) (0.01) (0.01)
Business failure (last 12 months, 0/1) 0.000 0.063 6888 0.015 0.153 4096 0.045 *** 0.205 4193(0.01) (0.01) (0.01)
Food SecurityHouseholds
Credit for food (female primary respondet, last 12 months, 0/1)0.040 *** 0.037 6661 0.035 ** 0.118 3961 0.032 0.163 2435(0.01) (0.01) (0.03)
Food insecurity index -0.001 0.000 6887 -0.034 0.000 4095 -0.014 0.000 4193
(0.04) (0.04) (0.04)
Not enough food (last 12 months, 0/1) -0.020 0.844 6887 -0.001 0.499 4095 -0.007 0.648 4193
(0.02) (0.02) (0.02)
Adults reduced food consumption (last 12 months, 0/1) -0.019 0.808 6887 -0.013 0.412 4095 -0.036 * 0.582 4193
(0.02) (0.02) (0.02)
Children reduced food consumption (last 12 months, 0/1)-0.012 0.692 6887 -0.023 0.307 4095 -0.004 0.435 4193
(0.02) (0.02) (0.02)
E. Expenditures and Consumption
Non-Food ExpendituresHouseholds
Total selected expenditures (monthly est., $) 2.967 50.046 6893 -0.099 24.468 4096 0.568 28.909 4193
(2.95) (1.20) (1.43)
Recurrent expenditures (last 7 days, $) 1.280 19.962 6895 1.164 10.510 4097 0.664 7.215 4194
(1.61) (1.16) (0.60)
House repairs (last month, $) 0.356 6.119 6837 0.552 * 2.075 4088 0.244 5.195 4180
(0.48) (0.30) (0.64)
Marriages (last 12 months, $) -1.027 26.735 6883 -2.556 10.010 4092 -5.612 42.280 4184
(3.90) (2.31) (4.93)
Funerals (last 12 months, $) 2.765 64.055 6845 0.022 7.340 4071 4.050 27.783 4168(4.14) (0.64) (2.89)
Food ConsumptionHouseholds
Total food consumption (selected items, last 7 days, $ value) 0.306 24.806 6889 -0.190 18.972 4096 -0.872 30.399 4144(0.90) (0.48) (0.72)
Grains (last 7 days, $ value) 0.011 8.350 6893 -0.162 6.464 4097 -0.211 6.018 4144(0.31) (0.14) (0.27)
Nuts and beans (last 7 days, $ value) -0.126 1.190 6893 -0.022 1.038 4097 0.055 4.226 4144
(0.10) (0.04) (0.17)
Malawi Uganda
TreatmentObs.
TreatmentObs.
TreatmentObs.
Effect Effect Effect
Shocks and Food Security
Expenditures and Consumption
Rea
cted
to
sh
ock
by:
Ghana

Table 2C. Impacts by Country
Mean Mean Mean
Control Control Control
F. Education
Financing EducationHouseholds
Education expenses (last 12 months, $) 5.922 64.655 6911 -0.381 8.203 4097 4.165 3206.095 4194(5.44) (0.64) (77.71)
Income generation (0/1) 0.007 0.145 6911 0.039 ** 0.413 4194(0.02) (0.02)
Asset, livestock and crop sales (0/1) 0.033 * 0.687 6911 -0.028 0.536 4194(0.02) (0.02)
Loan from savings groups (0/1) 0.006 *** 0.002 6911 0.016 ** 0.048 4194(0.00) (0.01)
Grants, remittances and other loans (0/1) 0.006 * 0.012 6911 0.007 0.051 4194(0.00) (0.01)
Savings (0/1) -0.003 0.040 6911 -0.014 0.108 4194(0.01) (0.01)
Educational OutcomesSchool-age children
Primary school enrollment (girls, 0/1) 0.046 ** 0.794 4660 0.002 0.858 3135 0.005 0.884 2713(0.02) (0.01) (0.01)
Primary school enrollment (boys, 0/1) 0.037 ** 0.794 5150 0.026 * 0.805 2947 -0.001 0.873 2761
(0.02) (0.02) (0.01)
Secondary school enrollment (girls, 0/1) 0.030 0.725 4204 0.022 0.705 1151 -0.003 0.842 2751(0.02) (0.03) (0.02)
Secondary school enrollment (boys,0/1) 0.040 ** 0.761 5110 -0.029 0.784 1356 -0.016 0.847 2811(0.02) (0.02) (0.01)
G. HealthHouseholds
Consulted health services (last 30 days, 0/1) 0.013 0.640 6896 -0.012 0.859 4097 0.010 0.882 4192(0.02) (0.01) (0.01)
Total health expenses (last 30 days, $) 1.332 14.864 6894 -0.285 4.352 4097 -0.097 20.766 4193(1.57) (0.34) (1.28)
Income generation (0/1) -0.008 0.102 6894 -0.006 0.490 4097 0.018 0.347 4193
(0.01) (0.02) (0.02)
Asset, livestock and crop sales (0/1) -0.030 0.397 6894 0.014 0.150 4097 -0.038 * 0.503 4193(0.02) (0.01) (0.02)
Loan from savings group (0/1) 0.006 *** 0.000 6894 0.000 0.003 4097 0.028 *** 0.065 4193
(0.00) (0.00) (0.01)
Grants, remittances and other loans (0/1) 0.004 0.017 6894 -0.001 0.071 4097 0.020 0.138 4193(0.00) (0.01) (0.01)
Savings (0/1) -0.006 0.064 6894 -0.009 0.158 4097 -0.038 *** 0.215 4193
(0.01) (0.01) (0.01)
At least one ill member (last 30 days, 0/1) 0.018 0.647 6896 0.003 0.922 4097 -0.006 0.916 4192
(0.02) (0.01) (0.01)
H. Asset AccumulationHouseholds
Livestock value ($) -27.381 1115.173 6896 -18.324 200.063 4096 -23.114 457.458 4193(51.67) (14.28) (40.82)
Number of fowl (#) -0.684 12.893 6896 0.667 ** 5.570 4096 0.066 3.556 4193(0.59) (0.30) (0.32)
Number of goats and sheep (#) -0.293 7.285 6896 -0.066 1.112 4096 0.053 1.916 4193(0.31) (0.07) (0.11)
Number of cattle (#) -0.111 2.145 6896 -0.063 0.337 4096 -0.150 1.201 4193(0.14) (0.04) (0.14)
Assets index 0.028 0.000 6887 -0.021 0.000 4097 0.005 0.000 4190(0.05) (0.03) (0.03)
Housing quality index -0.002 0.000 6885 0.025 0.000 4096 -0.011 0.000 4193(0.05) (0.04) (0.04)
PPI: living under $1.25 per day (per capita) 0.188 66.489 6843 -0.213 66.125 4095 0.159 45.184 4151(0.70) (0.66) (0.54)
PPI: living under $2.50 per day (per capita) 0.124 89.761 6843 -0.167 93.249 4095 0.071 86.973 4151(0.70) (0.66) (0.54)
Obs.Effect
Uganda
Treatment
Fin
ance
d e
du
cati
on
ex
p. w
ith
:F
inan
ced
hea
lth
care
ex
p. w
ith
:
Ghana Malawi
TreatmentObs.
Effect
TreatmentObs.
Effect
Education
Health
Asset Accumulation
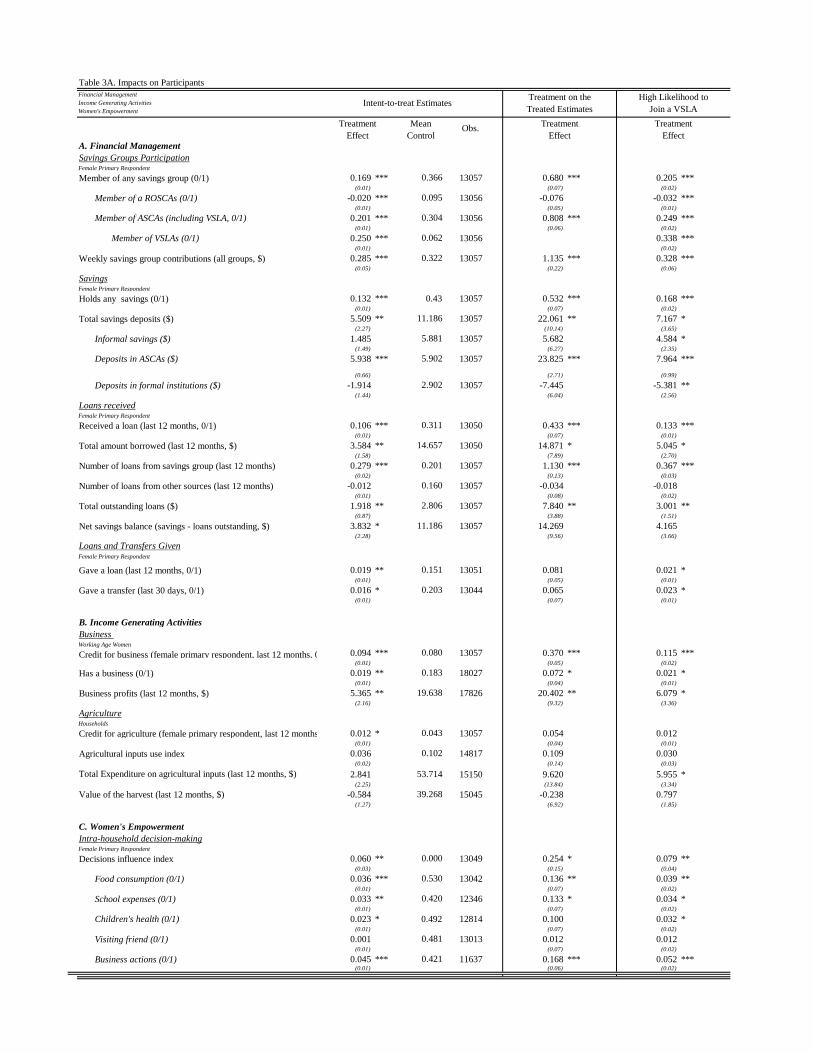
Table 3A. Impacts on Participants
Mean
ControlA. Financial Management
Savings Groups ParticipationFemale Primary Respondent
Member of any savings group (0/1) 0.169 *** 0.366 13057 0.680 *** 0.205 ***(0.01) (0.07) (0.02)
Member of a ROSCAs (0/1) -0.020 *** 0.095 13056 -0.076 -0.032 ***(0.01) (0.05) (0.01)
Member of ASCAs (including VSLA, 0/1) 0.201 *** 0.304 13056 0.808 *** 0.249 ***(0.01) (0.06) (0.02)
Member of VSLAs (0/1) 0.250 *** 0.062 13056 0.338 ***(0.01) (0.02)
Weekly savings group contributions (all groups, $) 0.285 *** 0.322 13057 1.135 *** 0.328 ***(0.05) (0.22) (0.06)
SavingsFemale Primary Respondent
Holds any savings (0/1) 0.132 *** 0.43 13057 0.532 *** 0.168 ***(0.01) (0.07) (0.02)
Total savings deposits ($) 5.509 ** 11.186 13057 22.061 ** 7.167 *(2.27) (10.14) (3.65)
Informal savings ($) 1.485 5.881 13057 5.682 4.584 *(1.49) (6.27) (2.35)
Deposits in ASCAs ($) 5.938 *** 5.902 13057 23.825 *** 7.964 ***
(0.66) (2.71) (0.99)
Deposits in formal institutions ($) -1.914 2.902 13057 -7.445 -5.381 **(1.44) (6.04) (2.56)
Loans receivedFemale Primary Respondent
Received a loan (last 12 months, 0/1) 0.106 *** 0.311 13050 0.433 *** 0.133 ***(0.01) (0.07) (0.01)
Total amount borrowed (last 12 months, $) 3.584 ** 14.657 13050 14.871 * 5.045 *(1.58) (7.89) (2.70)
Number of loans from savings group (last 12 months) 0.279 *** 0.201 13057 1.130 *** 0.367 ***(0.02) (0.13) (0.03)
Number of loans from other sources (last 12 months) -0.012 0.160 13057 -0.034 -0.018(0.01) (0.08) (0.02)
Total outstanding loans ($) 1.918 ** 2.806 13057 7.840 ** 3.001 **(0.87) (3.88) (1.51)
Net savings balance (savings - loans outstanding, $) 3.832 * 11.186 13057 14.269 4.165(2.28) (9.56) (3.66)
Loans and Transfers GivenFemale Primary Respondent
Gave a loan (last 12 months, 0/1) 0.019 ** 0.151 13051 0.081 0.021 *(0.01) (0.05) (0.01)
Gave a transfer (last 30 days, 0/1) 0.016 * 0.203 13044 0.065 0.023 *(0.01) (0.07) (0.01)
B. Income Generating Activities
Business Working Age Women
Credit for business (female primary respondent, last 12 months, 0/1) 0.094 *** 0.080 13057 0.370 *** 0.115 ***(0.01) (0.05) (0.02)
Has a business (0/1) 0.019 ** 0.183 18027 0.072 * 0.021 *(0.01) (0.04) (0.01)
Business profits (last 12 months, $) 5.365 ** 19.638 17826 20.402 ** 6.079 *(2.16) (9.32) (3.36)
AgricultureHouseholds
Credit for agriculture (female primary respondent, last 12 months, 0/1) 0.012 * 0.043 13057 0.054 0.012(0.01) (0.04) (0.01)
Agricultural inputs use index 0.036 0.102 14817 0.109 0.030(0.02) (0.14) (0.03)
Total Expenditure on agricultural inputs (last 12 months, $) 2.841 53.714 15150 9.620 5.955 *(2.25) (13.84) (3.34)
Value of the harvest (last 12 months, $) -0.584 39.268 15045 -0.238 0.797(1.27) (6.92) (1.85)
C. Women's Empowerment
Intra-household decision-makingFemale Primary Respondent
Decisions influence index 0.060 ** 0.000 13049 0.254 * 0.079 **(0.03) (0.15) (0.04)
Food consumption (0/1) 0.036 *** 0.530 13042 0.136 ** 0.039 **(0.01) (0.07) (0.02)
School expenses (0/1) 0.033 ** 0.420 12346 0.133 * 0.034 *(0.01) (0.07) (0.02)
Children's health (0/1) 0.023 * 0.492 12814 0.100 0.032 *(0.01) (0.07) (0.02)
Visiting friend (0/1) 0.001 0.481 13013 0.012 0.012(0.01) (0.07) (0.02)
Business ActionsBusiness actions (0/1) 0.045 *** 0.421 11637 0.168 *** 0.052 ***(0.01) (0.06) (0.02)
Financial Management
Income Generating Activities
Women's Empowerment
Treatment
Intent-to-treat Estimates
Effect
Treatment on the
Treated Estimates
High Likelihood to
Join a VSLA
Effect
TreatmentTreatment
EffectObs.
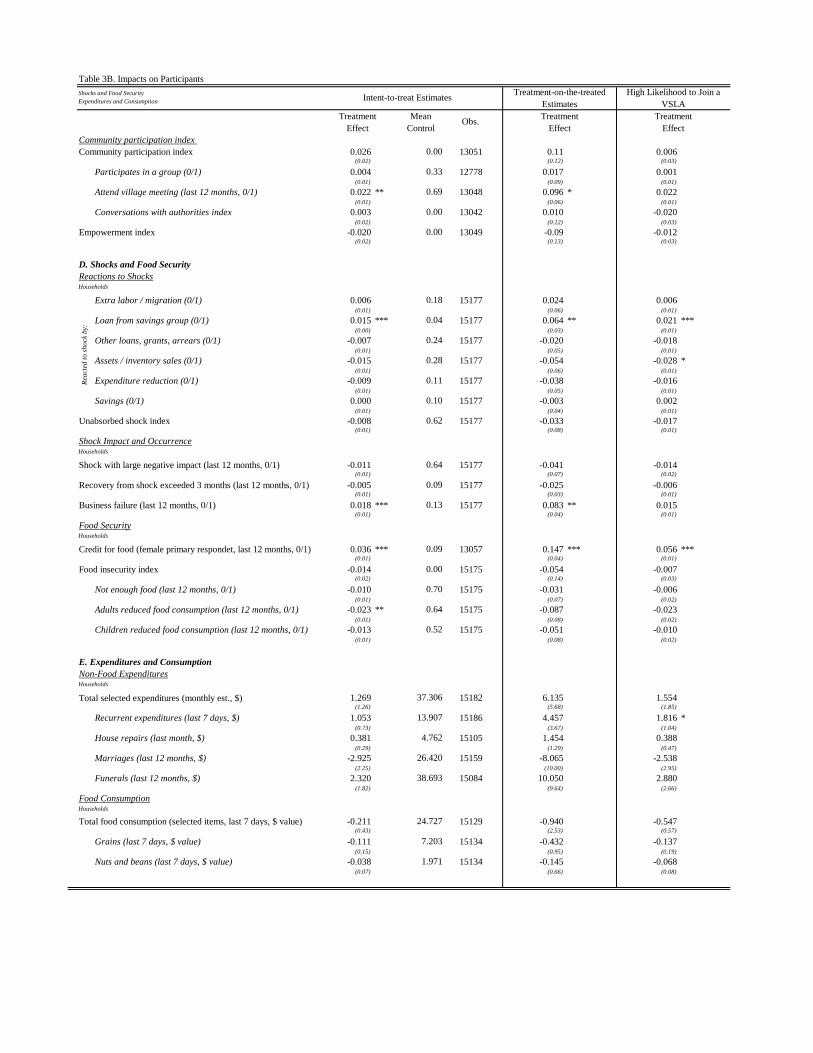
Table 3B. Impacts on Participants
Mean
Control
Community participation index
Community participation index 0.026 0.00 13051 0.11 0.006(0.02) (0.12) (0.03)
Participates in a group (0/1) 0.004 0.33 12778 0.017 0.001(0.01) (0.09) (0.01)
Attend village meeting (last 12 months, 0/1) 0.022 ** 0.69 13048 0.096 * 0.022(0.01) (0.06) (0.01)
Conversations with authorities index 0.003 0.00 13042 0.010 -0.020(0.02) (0.12) (0.03)
Empowerment index -0.020 0.00 13049 -0.09 -0.012(0.02) (0.13) (0.03)
D. Shocks and Food Security
Reactions to ShocksHouseholds
Extra labor / migration (0/1) 0.006 0.18 15177 0.024 0.006(0.01) (0.06) (0.01)
Loan from savings group (0/1) 0.015 *** 0.04 15177 0.064 ** 0.021 ***(0.00) (0.03) (0.01)
Other loans, grants, arrears (0/1) -0.007 0.24 15177 -0.020 -0.018(0.01) (0.05) (0.01)
Assets / inventory sales (0/1) -0.015 0.28 15177 -0.054 -0.028 *(0.01) (0.06) (0.01)
Expenditure reduction (0/1) -0.009 0.11 15177 -0.038 -0.016(0.01) (0.05) (0.01)
Savings (0/1) 0.000 0.10 15177 -0.003 0.002(0.01) (0.04) (0.01)
Unabsorbed shock index -0.008 0.62 15177 -0.033 -0.017(0.01) (0.08) (0.01)
Shock Impact and OccurrenceHouseholds
Shock with large negative impact (last 12 months, 0/1) -0.011 0.64 15177 -0.041 -0.014(0.01) (0.07) (0.02)
Recovery from shock exceeded 3 months (last 12 months, 0/1) -0.005 0.09 15177 -0.025 -0.006(0.01) (0.03) (0.01)
Business failure (last 12 months, 0/1) 0.018 *** 0.13 15177 0.083 ** 0.015(0.01) (0.04) (0.01)
Food SecurityHouseholds
Credit for food (female primary respondet, last 12 months, 0/1) 0.036 *** 0.09 13057 0.147 *** 0.056 ***(0.01) (0.04) (0.01)
Food insecurity index -0.014 0.00 15175 -0.054 -0.007(0.02) (0.14) (0.03)
Not enough food (last 12 months, 0/1) -0.010 0.70 15175 -0.031 -0.006(0.01) (0.07) (0.02)
Adults reduced food consumption (last 12 months, 0/1) -0.023 ** 0.64 15175 -0.087 -0.023(0.01) (0.08) (0.02)
Children reduced food consumption (last 12 months, 0/1) -0.013 0.52 15175 -0.051 -0.010(0.01) (0.08) (0.02)
E. Expenditures and Consumption
Non-Food ExpendituresHouseholds
Total selected expenditures (monthly est., $) 1.269 37.306 15182 6.135 1.554(1.26) (5.68) (1.85)
Recurrent expenditures (last 7 days, $) 1.053 13.907 15186 4.457 1.816 *(0.73) (3.67) (1.04)
House repairs (last month, $) 0.381 4.762 15105 1.454 0.388(0.29) (1.29) (0.47)
Marriages (last 12 months, $) -2.925 26.420 15159 -8.065 -2.538(2.25) (10.00) (2.95)
Funerals (last 12 months, $) 2.320 38.693 15084 10.050 2.880(1.82) (9.64) (2.66)
Food ConsumptionHouseholds
Total food consumption (selected items, last 7 days, $ value) -0.211 24.727 15129 -0.940 -0.547(0.43) (2.53) (0.57)
Grains (last 7 days, $ value) -0.111 7.203 15134 -0.432 -0.137(0.15) (0.95) (0.19)
Nuts and beans (last 7 days, $ value) -0.038 1.971 15134 -0.145 -0.068(0.07) (0.66) (0.08)
Effect Effect Effect
Intent-to-treat EstimatesTreatment-on-the-treated
Estimates
High Likelihood to Join a
VSLA
TreatmentObs.
Treatment Treatment
Shocks and Food Security
Expenditures and Consumption
Rea
cted
to
sh
ock
by:
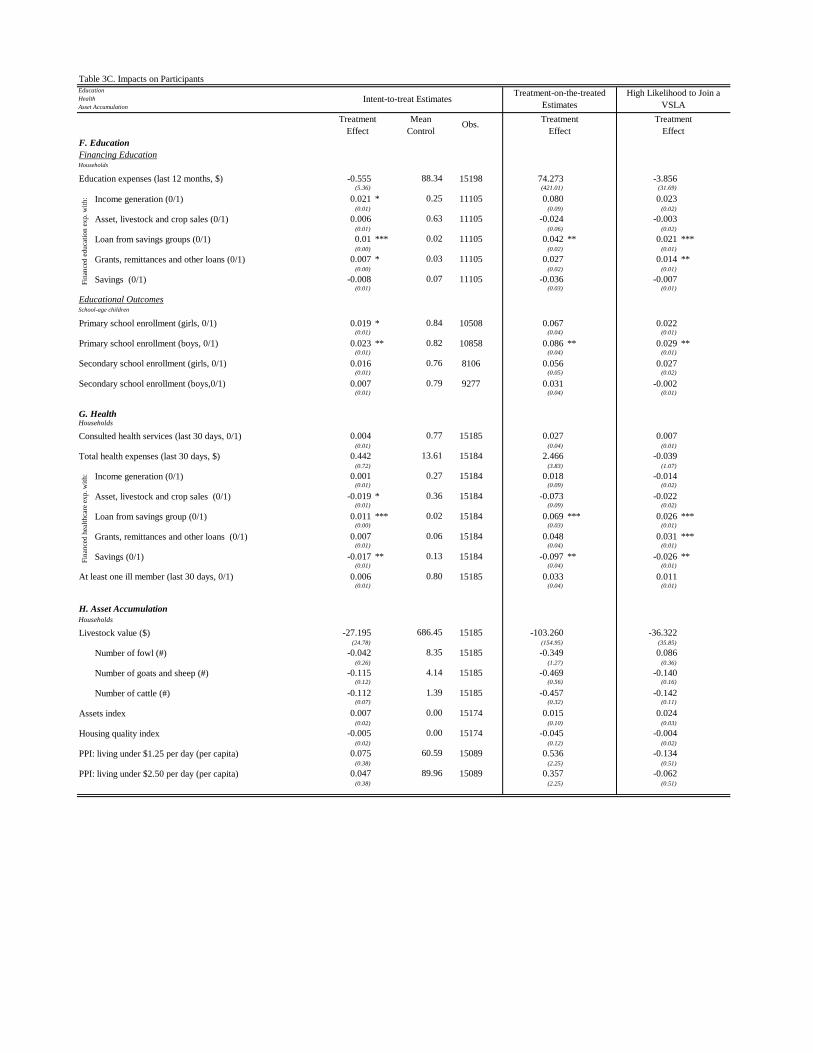
Table 3C. Impacts on Participants
Mean
Control
F. Education
Financing EducationHouseholds
Education expenses (last 12 months, $) -0.555 88.34 15198 74.273 -3.856(5.36) (421.01) (31.69)
Income generation (0/1) 0.021 * 0.25 11105 0.080 0.023(0.01) (0.09) (0.02)
Asset, livestock and crop sales (0/1) 0.006 0.63 11105 -0.024 -0.003(0.01) (0.06) (0.02)
Loan from savings groups (0/1) 0.01 *** 0.02 11105 0.042 ** 0.021 ***(0.00) (0.02) (0.01)
Grants, remittances and other loans (0/1) 0.007 * 0.03 11105 0.027 0.014 **(0.00) (0.02) (0.01)
Savings (0/1) -0.008 0.07 11105 -0.036 -0.007(0.01) (0.03) (0.01)
Educational OutcomesSchool-age children
Primary school enrollment (girls, 0/1) 0.019 * 0.84 10508 0.067 0.022(0.01) (0.04) (0.01)
Primary school enrollment (boys, 0/1) 0.023 ** 0.82 10858 0.086 ** 0.029 **(0.01) (0.04) (0.01)
Secondary school enrollment (girls, 0/1) 0.016 0.76 8106 0.056 0.027(0.01) (0.05) (0.02)
Secondary school enrollment (boys,0/1) 0.007 0.79 9277 0.031 -0.002(0.01) (0.04) (0.01)
G. HealthHouseholds
Consulted health services (last 30 days, 0/1) 0.004 0.77 15185 0.027 0.007(0.01) (0.04) (0.01)
Total health expenses (last 30 days, $) 0.442 13.61 15184 2.466 -0.039(0.72) (3.83) (1.07)
Income generation (0/1) 0.001 0.27 15184 0.018 -0.014(0.01) (0.09) (0.02)
Asset, livestock and crop sales (0/1) -0.019 * 0.36 15184 -0.073 -0.022(0.01) (0.09) (0.02)
Loan from savings group (0/1) 0.011 *** 0.02 15184 0.069 *** 0.026 ***(0.00) (0.03) (0.01)
Grants, remittances and other loans (0/1) 0.007 0.06 15184 0.048 0.031 ***(0.01) (0.04) (0.01)
Savings (0/1) -0.017 ** 0.13 15184 -0.097 ** -0.026 **(0.01) (0.04) (0.01)
At least one ill member (last 30 days, 0/1) 0.006 0.80 15185 0.033 0.011(0.01) (0.04) (0.01)
H. Asset AccumulationHouseholds
Livestock value ($) -27.195 686.45 15185 -103.260 -36.322(24.78) (154.95) (35.85)
Number of fowl (#) -0.042 8.35 15185 -0.349 0.086(0.26) (1.27) (0.36)
Number of goats and sheep (#) -0.115 4.14 15185 -0.469 -0.140(0.12) (0.56) (0.16)
Number of cattle (#) -0.112 1.39 15185 -0.457 -0.142(0.07) (0.32) (0.11)
Assets index 0.007 0.00 15174 0.015 0.024(0.02) (0.10) (0.03)
Housing quality index -0.005 0.00 15174 -0.045 -0.004(0.02) (0.12) (0.02)
PPI: living under $1.25 per day (per capita) 0.075 60.59 15089 0.536 -0.134(0.38) (2.25) (0.51)
PPI: living under $2.50 per day (per capita) 0.047 89.96 15089 0.357 -0.062(0.38) (2.25) (0.51)
Effect Effect Effect
Intent-to-treat EstimatesTreatment-on-the-treated
Estimates
High Likelihood to Join a
VSLA
Fin
ance
d e
du
cati
on
ex
p. w
ith
:F
inan
ced
hea
lth
care
ex
p. w
ith
:
TreatmentObs.
Treatment Treatment
Education
Health
Asset Accumulation