impact assessment of the gokwe integrated recovery action ...impact assessment of the gokwe...
TRANSCRIPT

Impact Assessment of the Gokwe Integrated Recovery Action Project Zimbabwe
John C Burns • Omeno W Suji
August 2007
Impact Assessment of Innovative Humanitarian projects in Sub-Saharan Africa
The Feinstein International Center in partnership with the Bill and Melinda Gates Foundation and Africare
Acknowledgements The authors would like to thank Sekai Chikowero, Paul Chimedza, Stanley Masimbe, and James Machichiko, of Africare Zimbabwe for all their assistance and support during the mid term visits and final impact assessment. In particular we would like to thank Timm Musori for his participation and valuable contributions during the exercise. Our gratitude also goes to the rest of the Africare, Zimbabwe team for their hospitality and administrative support in Gokwe and Harare. To Dr Justice Nyamangara of the University of Zimbabwe for availing himself during the various technical presentations held in Harare, and for working on the baseline and indicator validation exercises. Many thanks also to the enumerators, Frank Magombezi, Paradza, Kunguvas, and Enock Muzenda for their valuable contribution during the final impact assessment. From the Feinstein International Center, thanks to Dr Peter Walker, Dr Andrew Catley, and Dr Dawit Abebe, for providing technical support. We would also like to thank Regine Webster, Mito Alfieri, and Kathy Cahill from the Bill & Melinda Gates Foundation for all your support.
2

Contents
Summary.......................................................................................................... 6 1. INTRODUCTION .................................................................................... 7 1.1 Sub Saharan Africa Famine Relief Effort ............................................... 7 1.2 Impact Assessment of Humanitarian Projects in Sub-Saharan Africa..... 8 1.3 Gokwe Integrated Recovery Action Project............................................. 9 1.3.1 Project Background............................................................................ 9 1.3.2 Status of Project Implementation at the time of the Assessment.......11 2. ASSESSMENT METHODOLOGY ..........................................................15 2.1 Study Design ........................................................................................15 2.2 Research Questions ..............................................................................16 2.3 Study Areas .........................................................................................16 2.4 Sampling .............................................................................................16 2.4.1 Study Locations ...............................................................................16 2.4.2 Method and Size ...............................................................................17 2.5 Data Collection Methods.......................................................................17 2.6 Pre-Testing ..........................................................................................19 2.7 Triangulation.......................................................................................20 2.8 Data Analysis .......................................................................................20 3. RESULTS..............................................................................................21 3.1 Impact Indicators.................................................................................21 3.2 Project Benefits.....................................................................................22 3.4 Food Security .......................................................................................24 3.4.1 Duration of Food Secure Period.........................................................25 3.4.3 Ways of Accessing Food ....................................................................30 3.5 Income..................................................................................................31 3.5.1 Expenditure ......................................................................................33 3.6 Strengths and Weaknesses of the Project .............................................34 4. DISCUSSION ........................................................................................38 4.1 Assessment Constraints and Methodological Limitations ......................38 4.2 Overall Project Impact...........................................................................40 4.3 Impact on Household Food Security.....................................................41 4.4 Impact on Household Income................................................................44 5. Conclusions..........................................................................................45 6. Lessons Learned for Future Programming.............................................48 Endnotes .........................................................................................................50
List of Annexes Annex 1: Case Studies Annex 2: Data Collection Tools Annex 3: Map of Gokwe-South District Annex 4: Perceptions of Project Benefits by Gender Annex 5: Summary of Project Weaknesses and Threats Annex 6: Means Score of Different Project Activities
3

List of Tables Table 1.1 Objective 1: Promotion of crop cultivation a summary of key activities .............. 13 Table 1.2 Objective 2: Planting material multiplication..................................................... 14 Table 1.3 Objective 3: Agro-processing ............................................................................. 14 Table 1.4 Objective 4: Promoting drip irrigation .............................................................. 15 Table 2.1 Sampling for household interview (HHI) component ......................................... 17 Table 2.2 Sampling for focus group discussion (FGD) component..................................... 17 Table 2.3 Summary of methods used ............................................................................... 19 Table 3.1 Overall project benefits by focus group participants.......................................... 22 Table 3.2 Common household coping strategies in Gokwe-South District......................... 24 Table 3.3 Attribution table explaining changes in importance of different food sources .... 27 Table3.4 Perceived changes in the volume (quantity) of the household food basket.......... 28 Table 3.5 Attribution table for changes in overall quantity of the household food basket .. 28 Table 3.6 Attribution for changes in production of existing crops promoted by GIRA........ 29 Table 3.7 Changes in household income .......................................................................... 32 Table 3.8 Attribution table for any changes in income (increase/decrease) ....................... 32 Table 3.9 SWOT analysis Njelele I (n=4)........................................................................... 34 Table 3.10 SWOT analysis Njelele II (n=4) .......................................................................... 35 Table 3.11 SWOT analysis Nemangwe II (n=4) .................................................................... 36 Table 3.12 SWOT analysis Nemangwe III (n=4)................................................................... 38 Table 5.1 A summary of the key project impacts on livelihoods assets............................. 46 List of Figures Figure 3.1 Relative mean score of project benefits.............................................................. 22 Figure 3.2 Timeline of recent events – Njelele and Nemangwe ............................................ 23 Figure 3.3 Number of months of household food security .................................................. 25 Figure 3.4 Food basket changes Njelele (n=117)................................................................ 26 Figure 3.5 Food basket changes Nemangwe (n=145) .......................................................... 27 Figure 3.6 Perceived changes in household production (yields) between 2005 and 2007 .... 28 Figure 3.7 Changes in the relative importance of food sources (maize and other) .............. 30 Figure 3.8 Changes in income sources Njelele (n=117)...................................................... 31 Figure 3.9 Changes in income sources Nemangwe (n=145) ................................................ 31 Figure 3.10 Expenditure Njelele (n=117) .............................................................................. 33 Figure 3.11 Expenditure Nemangwe (n=145) ...................................................................... 33
4

Acronyms and Abbreviations used in the Report AREX Agricultural Extension Officers FGD Focus Group Discussion FIC, Tufts Feinstein International Center, Tufts University GIRA Gokwe Integrated Recovery Action HH Household HHI Household Interview IFAD International Fund for Agricultural Development M&E Monitoring and Evaluation OPV Open Pollinated Variety (Maize) PIA Participatory Impact Assessment PLWA People living with HIV/Aids RFP Request for Proposals SPSS Statistics Package for Social Sciences ZIMVAC Zimbabwe Vulnerability Assessment Committee
5

Summary This study was an impact assessment of the “Gokwe Integrated Recovery Action Project” (GIRA) a drought recovery and famine mitigation intervention being implemented by Africare in the Midlands Province of Zimbabwe. The assessment is one component of a broader applied research initiative “Impact Assessment of Innovative Humanitarian Projects in Sub-Saharan Africa” supported by the Bill & Melinda Gates Foundation. The research which is being carried out by the Feinstein International Center (FIC, Tufts) focuses on the development and application of a participatory assessment toolkit to measure the impact of seven projects in Africa being supported by the Gates Foundation under a separate grant; the “Sub-Saharan Africa Famine Relief Effort”. All seven projects have taken an integrated livelihoods approach to alleviating the immediate needs of the affected communities, and to addressing the longer term vulnerability issues resulting in famine and food insecurity. The GIRA project started in December 2005, and was designed to provide income and nutritional benefits to 10,000 drought affected people through improved crop production, utilization and marketing. The specific project activities included the introduction of new nutritious crop varieties such as soybean, the provision and promotion of drought tolerant cereal varieties, the distribution of drip irrigation kits and agro-processing equipment, and the provision of training in agronomy, agro-processing and business management. The impact assessment was conducted by GIRA project staff and Government Agricultural Extension (AREX) officers affiliated with the project. The assessment was supported by researchers from FIC, Tufts. Using a Participatory Impact Assessment (PIA) approach the study covered the four geographical areas (wards) where the project is being implemented. The assessment focused on the direct impact of the project on the livelihoods of the participating households. It did not explore the broader social, political or environmental implications that might be attributed to a humanitarian intervention. In spite of an ongoing drought in the area, the results of the assessment indicate that the project has had a significant impact on the livelihoods of the communities being assisted. This has manifested itself in both food security and income benefits. The findings also demonstrate that the project has had a greater impact in the two wards least affected by the drought; at least in terms of actual project derived food and cash transfers. In the two wards most affected by the ongoing drought the evidence suggests that the project has significantly improved the participating household’s ability to cope with the drought. In terms of the food security benefits, the project has improved both the quality and quantity of food being consumed in the participating households. This has had a positive impact on health, nutrition, hospitality and charity. The income and savings
6

benefits have allowed people to invest in livestock assets which has improved their resilience to drought and inflation as these can be (and are) converted back into cash or food during times of crisis. In the interim one can expect nutritional benefits from livestock products. The income benefits have enabled some people to set up small businesses and thereby diversify their livelihoods options. For others savings on food purchases has freed up cash which can be spent on school fees, farming implements, and home improvements. One of the most important project impacts identified by the participants was the skills and knowledge transfer provided by the agronomy and agro-processing training activities. Many considered this to be the most important benefit of the project. The impact of these training sessions was not limited to direct project participants, as nearly as many non-participants attended the trainings. The original goal of the project was to ‘ensure the short-term food security of the targeted project households, and to mitigate the effects of future droughts on these households’. Although this impact assessment took place before the project activities had been completed, the findings indicate that these project goals have been met.
1. INTRODUCTION
1.1 Sub Saharan Africa Famine Relief Effort The Sub Saharan Africa Famine Relief Effort “Close to the Brink” was launched towards the end of 2005 in response to a major famine affecting South Sudan, the Sahel and Southern Africa. Under this initiative the B&M Gates Foundation put out a Request for Proposals that called for ‘innovative projects that would prevent and reduce both the short term and long term severity and hardship of populations close to the brink of acute famine’i. Taking into account reports that an earlier response might have minimized the impact of the famine on the affected communities, the RFP suggested that projects assisting ‘populations facing an impending crisis’ would also be considered, stipulating that the “proposed interventions (would) be considered for their potential to serve as examples in mitigating such crises in similar settings and emergencies in the future and thus their ability to conduct rigorous evidence based impact assessment”ii. The project proposals were further evaluated on the basis of innovation, clarity of the objectives and implementation plan, organizational capacity, experience and ability to collaborate with other partners, a clear exit strategy, budget, and monitoring and evaluation (M&E) plan. The maximum allocation for each project was to be no more than $ US 1 million, and the project timeframe was to be approximately eighteen months. The RFP also indicated that fifteen percent of the budget be allocated towards
7

M&E, and other data collection activities - an unconventionally high proportion for a humanitarian assistance project budget. On the basis of this RFP process, project grants were awarded to seven projects (including the GIRA project), being implemented by six organizations in South Sudan, Mali, Niger, Malawi and Zimbabwe. In an attempt to address the multiple objectives of being ‘innovative, responding to short term suffering, and mitigating longer term crises’ all the projects elected for an integrated portfolio of interventions. Essentially these interventions were designed to alleviate suffering, and at the same time to support livelihoods, and build up peoples resilience to future shocks such as food insecurity and drought. All seven projects supported either agricultural or livestock production, others included either micro credit or micro lending, and two included health and therapeutic nutrition components. The overall goal of all seven projects was to improve the food security (or nutritional status) of the communities being assisted. All seven projects started either at the end of 2005 or early 2006.
1.2 Impact Assessment of Innovative Humanitarian Projects in Sub-Saharan Africa Under this research grant, the Feinstein International Center was commissioned to support the implementing partner organizations in developing their participatory evaluation techniques, to develop and field test an impact assessment toolkit, and to lead a final impact assessment of three or four selected projects1. The objective of these final assessments is to measure the true impact of the projects being implemented under the Sub-Saharan Africa Famine Relief Effort. The specific objectives of this research are: 1. The development of an impact assessment approach and methodology with the organizations implementing the Sub-Saharan Africa Famine relief projects. 2: The application of this methodology to selected agency projects to produce a comprehensive impact evaluation report. In order to meet these goals and objectives, FIC, Tufts has worked in partnership with, and provided support to the implementing organizations over the course of the project. The key components of this support can be summarized in the following three activities:
1 Under the original proposal, FIC, Tufts were to support the development of the project M&E plans, and baseline surveys in a way that would capture impact. However the grant for the research component was only approved once the agency M&E plans had already been developed and most of the baseline surveys had been done.
8

1. The Feinstein Center carried out an impact assessment training workshop in Addis Ababa in October 2006. This training was attended by representatives from all seven projects. The training was designed to familiarize the participants in the concepts of participatory impact assessment (PIA) and introduce them to a variety of tools which might be used to assess project impact. During the workshop the participants were asked to design a comprehensive PIA plan for at least one major component of their respective projects.
2. Feinstein Center researchers carried out ‘mid term’ visits to six of the seven
projects2. The primary objective of these visits was to work in partnership with the client communities to identify their own indicators of project impact. The visits did include other activities depending on the timing of the visit within the overall project timeframe. For example those projects that were visited prior to the PIA training workshop placed more emphasis on the basic concepts of measuring impact, whereas those visited towards the end of the project placed more emphasis on testing and demonstrating impact assessment tools, and training project staff in the use of these.
3. Using the PIA tools demonstrated during the training workshop and mid term visits,
the implementing partner organizations will carry out a final impact assessment of their projects. The Feinstein Center has selected to support a comprehensive impact assessment of four of these projects. This report is the outcome of the first of these exercises.
The overall goal of this research is to improve the ability of the humanitarian community to carry out impact assessment of its work and thus improve its effectiveness and accountability to the affected communities and donors.
1.3 Gokwe Integrated Recovery Action Project
1.3.1 Project Background Under the Sub-Saharan Africa Famine Relief Effort Africare Zimbabwe has been implementing a food security livelihoods support project aiming to assist drought affected communities in Gokwe-South District. The project was designed to achieve household income and nutritional benefits for 2000 households through crop diversification, increased production, agro-processing and marketing activities. The goal of the project is: ‘to ensure that 10,000 people (2,000 households) on the brink of famine are able to plant crops in the coming season (2005/06) and begin cultivation of
2 One of these mid term visits had to be cancelled at the last minute due to security considerations at the project site. The FIC researcher met with the project team in a neighboring country. As a result many of the objectives of the mid term visit were not met.
9

more drought resistant and nutritious cropsiii’. The specific objectives of the project were as follows: Objective # 1: Promote cultivation of crops such as open pollinated (OPV) maize, sunflower, soybeans, groundnuts, cassava, sweet potatoes, sorghum and vegetables for 2000 vulnerable households. Objective # 2: Assist communities in establishing planting material multiplication sites capable of supplying 2000 households for the 2006/7 season and beyond. Objective # 3: Facilitate value addition and increased consumption of target crops by promoting agro-processing (equipment and training) among at least 20 percent of the beneficiaries. Objective # 4: Promote use of drip kits to irrigate vegetable gardens for 400 households. When the project was formulated in 2005, the accumulated effects of three years of inadequate rainfall meant that Zimbabwean farmers living in semi-arid areas such as Gokwe, could no longer purchase sufficient agricultural inputs for the (2006) planting seasoniv. The deteriorating political and economic situation in the country also had a negative impact on the agricultural sector. Since 2002 the commercial farming sector had all but collapsed resulting in a shortage of seeds in the countryv. At the District level Gokwe-South had been identified as one of the most food insecure areas of the countryvi. Traditionally a commercial cotton producing area, farmers would rely on income from cotton sales to purchase agricultural inputs as well as food items. However, periodic droughts, depressed cotton prices on the world market, and inflation acted in concert to diminish this income sourcevii. Most of these farmers would rely on maize production to supplement their diet, but given maize’s low resilience to drought, and its low nutritional value, expanding on this livelihood option would not have had any significant influence on the food security and nutritional status of the communities living in Gokweviii. From their own assessments in the area, Africare, Zimbabwe determined that the diet of many of the children was protein deficient, in part as a result of this maize dependency. Based on this contextual assessment Africare Zimbabwe developed an integrated portfolio of interventions designed to address the specific needs of the drought affected communities in Gokwe. The two week RFP timeframe did not allow for a comprehensive participatory project formulation process. Therefore, Africare based the project design largely on their experience elsewhere in Zimbabwe. For example Africare had been promoting soy bean production in Zimbabwe in partnership with the International Fund for Agricultural Development (IFAD) and the Rockefeller Foundation. All four objectives and the activities attached to them were designed to improve crop production, reduce dependency on income generated from cotton and maize, and improve household food security and nutrition.
10

Historically some of the crops promoted by Africare such as sweet potato, cassava, groundnuts, open pollinated variety (OPV) maize and sorghum were traditionally grown in the area, but had declined in importance with the expansion in cotton production. The introduction of drip irrigation agriculture was added as a complementary dimension to the food security goals of the project, and the agro processing activities were included, having the potential to translate into both income and nutritional transfers at the household level. It was anticipated that the introduction of the drip irrigation kits would have a labor saving benefit, based on observations that farmers were manually irrigating with watering cans. Objective number 2, which promotes the establishment of planting material multiplication sites was designed to increase the availability of planting inputs, thus mitigating the constraint of seed availability, and improving overall seed security. This activity was seen as complementary to other objectives, and was expected to indirectly translate into both household nutritional and income benefits. Although the participating communities were not directly involved in the actual project formulation, they were represented by the local authorities who advised on targeting at both the project and household level. Interestingly enough the local authorities argued that productive farmers should be selected over the most vulnerable members of the community as these farmers would be more likely to adopt the new innovations making them a better target for replication and sustainability. In this context it was argued that the least vulnerable would be less likely to utilize the inputs provided by Africare in a productive way thus minimizing the overall impact of the project. The selection of recipient communities was originally based on the multi stakeholder Zim VAC assessment of 2005, which determined that Gokwe–South District was the sixth most food insecure of Zimbabwe’s fifty six rural districtsix. Africare originally selected four communities in Gokwe South, represented by a single chief. However when the project plans were presented to the local authorities for endorsement, the local council insisted on sharing the project benefits amongst communities represented by two chiefs. Although this was essentially a political decision, both communities were assessed to be food insecure. The actual selection of households was done in consultation with the partner communities, and involved the transparent process of presenting the process and criteria for selection in a public forum. The selection criteria were based on wealth and asset levels.
1.3.2 Status of Project Implementation at the time of the Assessment The RFP for the Sub-Saharan Africa Famine Relief Effort was launched in September 2005, and Africare started delivering project inputs by December. Although slightly late in the planting season, this quick response by Africare allowed farmers to make use of these inputs during the 2005/06 agricultural season. By the time FIC, Tufts visited the project in May 2006 project participants were harvesting and processing groundnuts, soy bean, and sweet potatoes from the inputs that Africare had provided. However, due
11

to the late delivery many farmers kept the seeds for the following season. Fortunately good precipitation in 2005/06 resulted in a fairly good harvest, unfortunately those that didn’t plant the (project) seeds didn’t benefit from this-the following season being a drought. One of the biggest challenges faced by the project was the difficulty in procuring project inputs due to in-country shortages. On the production side, Africare was unable to procure sorghum planting material, and only a limited amount of cassava planting material. The drip-kits procured came with missing parts and consequently the last of these kits were only delivered during the final week of the impact assessment. Under the agro-processing component, eighteen of the twenty presses for sunflower oil extraction also came with missing parts, and these parts were extremely difficult to come by. As a result of these procurement hitches, at the start of the assessment some of the delivery goals had not been met and hence production and impact from these inputs had not been realized. A no cost extension to the project has been granted to enable Africare to complete these activities. At the time of the assessment in June 2007 the bulk of the project activities, inputs and service delivery targets had been reached. In the case of the training activities most of these exceeded the set targets, as a considerable number of non project participants attended these training sessions. The following tables give a summary of the status of the key project deliverables at the time of the assessment3.
3 These do not include many of the software components of the project, such as community mobilization, awareness and sensitization, and M&E data collection activities.
12

Table 1.1 Objective 1: Promotion of crop cultivation a summary of key activities
Activity Expected Outputs Achievement
(%) Comments
Procurement and distribution of seeds
8t sorghum 4t sunflower 20t soy-bean 20.25t OPV maize 20t groundnuts 4000 bags sweet potato 200,000 cassava cuttings
Done (100%) Done (100%) Done (100%) Done (100%) Done (100%) Partial (96%) Partial (16%)
Distributed in 2005/06 season Distributed in 2005/06 season 20t in 2005/06 and 10t in 2006/07 Distributed in 2005/06 season Distributed in 2005/06 season 2125 in 2005/06 and 1725 as of 01/07 32,000 in 2006/07 (acute shortage of planting material)
Agronomy training
Train at least 1500 farmers Training of Trainers in agronomy, processing and utilization
2,699 trained (179%) Done (100%)
A large number of non project participants also attended the training
Planting of crops sourced through the GIRA project
800 ha sorghum 800 ha sunflower 300 ha soybean 800 ha maize 32 ha sweet potato 20 ha cassava
640 ha (80%) 720 ha (90%) 210 ha (70%) 796 ha (99.5%) 31 ha (96%) 3.2 ha (16%)
Most of it consumed due to hunger Only distributed in 2006/07 season Shortage of planting material
Crop Surveys Post harvest survey for 2005/06 done 2006/07 survey pending (50%)
Yield were below expectations due to excessive rains and consumption of seed due to hunger Can assume low yields due to drought4
Adapted from Africare (2007) GIRA progress report May 23 2007
4 Authors comment - the impact assessment was completed just before the post harvest survey.
13

Table 1.2 Objective 2: Planting material multiplication
Activity Expected Outputs Achievement
(%) Comments
Distribution of planting material
5 ha sweet potato 5 ha cassava 4 ha sorghum 10 ha OPV maize
5 ha (100%) 0.25 ha (5%) 0 ha (0%) 10 ha (100%)
Shortage of planting material Unable to procure
Adapted from Africare (2007) GIRA progress report May 23 2007
Table 1.3 Objective 3: Agro-processing
Activity Expected outputs Achievement Comments Training of Trainers (ToT) and follow up training of households in Business management
Trainers trained 400 households trained
100% 114 (29%)
Training still ongoing
Training in the utilization of cassava, sweet potato and soy bean products
1,500 households trained
2,699 (180%) trained
Very strong demand for training hence the inclusion of many non project participants
Training in the operation and maintenance of processing machines
400 machine recipients trained
636 (159%) trained
Again many non project participants attended the training
Loaning of agro-processing machines
20 ram presses loaned 20 peanut butter mills distributed
2 (10%) loaned 40 (100%) distributed
Still trying to purchase missing parts for the other ram presses
Production of processed goods
Each machine producing processed goods
69 bottles peanut butter produced 2005/06 No oil produced
Provision of peanut butter and oil to people living with HIV/Aids (PLWA)
Each processing center donating to PLWA
12 bottles (17% of total peanut butter production for 2005/06 donated)
This is a contractual obligation of the project in return for the loan of the equipment (FIC, Tufts comment)
Adapted from Africare (2007) GIRA progress report May 23 2007
14

Table 1.4 Objective 4: Promoting drip irrigation
Activity Expected outputs Achievement (%) Comments Procurement and loaning of drip kits
146 kits obtained and loaned
44 (30%) procured and 38 (26%) loaned
The estimate for the procurement of the kits only allowed for 26 kits to be purchased. Following a budget review an additional 120 kits were procured
Training in installation and maintenance of kits
146 households trained in the use of drip kits
146 (100%) trained
Establishment of nutrition gardens
146 gardens established
38 (26%) established
Production of vegetables
All gardens producing vegetables
Data not yet collected
Provision of produce to PLWA
All gardens donating vegetables to PLWA
Data not yet collected
This is a contractual obligation of the project in return for the loan of the equipment (FIC, Tufts comment)
Adapted from Africare (2007) GIRA progress report May 23 2007
2. ASSESSMENT METHODOLOGY
2.1 Study Design For the purpose of this study the following definition of impact was used; ‘those benefits and changes to people’s livelihoods, as defined by the project participants, and brought about as a direct result of the project’. Within the framework of this definition the assessment set out to measure the impact of the project against a set of community defined indicators. These indicators form the basis of the three research questions and focus on the food security and income benefits derived from the project.
15

2.2 Research Questions The impact assessment was formulated around the following research questions:
1. What impact has the project had on the food security and the nutritional status of the assisted communities?
2. What impact has the project had on income (and savings) of the assisted communities?
3. What impact has the project had on the livelihoods of the assisted communities?
2.3 Study Areas The impact assessment was conducted in all four wards of Gokwe-South District covered by the GIRA project, namely Njelele I and II and Nemangwe II and III. Gokwe District is located in the Midlands Province of Zimbabwe. The area is classified as semi arid, and the two main soil types are sandy loam of Kalahari origins (Arenosols/Regosols) and red clay soils (Alfisols/Lixisols)x. Annual precipitation is between 450-800 mm and in normal years a cereal surplus can be expectedxi. The dominant livelihood practice in the area is based on agricultural crop production, and to a lesser extent livestock production; out of two hundred and ninety eight community members interviewed in the project baseline survey between ninety three to a hundred percent (depending on the ward) identified themselves as farmers. In early 2006 the main crops grown in the four project wards were maize and cotton, with cotton being more important in the Nemangwe wards, which receive less rainfall and are at a lower elevation than Njelele I and II. Maize was considered the main food cropxii, but like cotton it is produced primarily as a cash cropxiii. Sorghum, millet, groundnuts, beans, pumpkins and sweet potatoes are also produced in smaller quantitiesxiv.The baseline survey indicated that household income in 2006 was primarily derived from these two crops as well as from the sale of livestock and livestock products. Sale of vegetables was also cited as an important source of incomexv.
2.4 Sampling
2.4.1 Study Locations The geographical sampling was stratified to cover all four wards being assisted by the GIRA project (Njelele I & II and Nemangwe II & III). The assessment team spent four days in each ward, covering all four sub areas per ward, except for Njelele where one area was visited twice. (Fifteen out of sixteen sub areas). These sub-areas are not administrative boundaries as such but have been defined for the purposes of AREX monitoring. The actual locations visited were; Simbe East and West and Chitapo (Njelele I), Njelele East and West, Gavave, and Gwehave (Njelele II), Svisvi, Half-way,
16
Kwaramba and Kasuwe (Nemangwe II), Tare, Ngani, Zarova, and the (CMB) Cotton Marketing Board location (Nemangwe III).
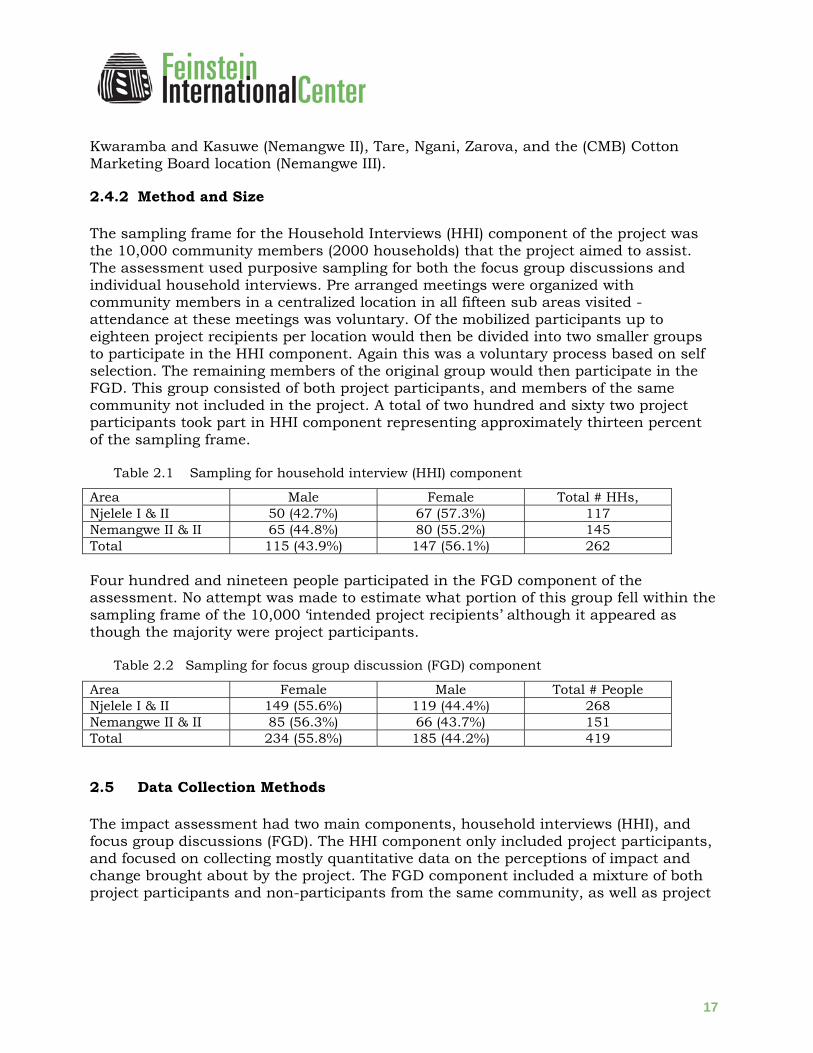
2.4.2 Method and Size The sampling frame for the Household Interviews (HHI) component of the project was the 10,000 community members (2000 households) that the project aimed to assist. The assessment used purposive sampling for both the focus group discussions and individual household interviews. Pre arranged meetings were organized with community members in a centralized location in all fifteen sub areas visited - attendance at these meetings was voluntary. Of the mobilized participants up to eighteen project recipients per location would then be divided into two smaller groups to participate in the HHI component. Again this was a voluntary process based on self selection. The remaining members of the original group would then participate in the FGD. This group consisted of both project participants, and members of the same community not included in the project. A total of two hundred and sixty two project participants took part in HHI component representing approximately thirteen percent of the sampling frame.
Table 2.1 Sampling for household interview (HHI) component
Area Male Female Total # HHs, Njelele I & II 50 (42.7%) 67 (57.3%) 117 Nemangwe II & II 65 (44.8%) 80 (55.2%) 145 Total 115 (43.9%) 147 (56.1%) 262 Four hundred and nineteen people participated in the FGD component of the assessment. No attempt was made to estimate what portion of this group fell within the sampling frame of the 10,000 ‘intended project recipients’ although it appeared as though the majority were project participants.
Table 2.2 Sampling for focus group discussion (FGD) component
Area Female Male Total # People Njelele I & II 149 (55.6%) 119 (44.4%) 268 Nemangwe II & II 85 (56.3%) 66 (43.7%) 151 Total 234 (55.8%) 185 (44.2%) 419
2.5 Data Collection Methods The impact assessment had two main components, household interviews (HHI), and focus group discussions (FGD). The HHI component only included project participants, and focused on collecting mostly quantitative data on the perceptions of impact and change brought about by the project. The FGD component included a mixture of both project participants and non-participants from the same community, as well as project
17
monitors from those communities. The FGD concentrated on collecting contextual and qualitative data. This component (FGD) was also used as a means of triangulating the data from the HHI, and some quantitative data was collected during these exercises. The non-project participants in the FGD were used as a comparative group to assist in the attribution of project impact. The FGD exercises were also used to collect information on the perceived strengths and weaknesses of the project. Typically two team members would facilitate one FGD. The other four enumerators would split up into two teams and interview up to eighteen individual households (HHI component) between them at each site. This was done by interviewing and collecting responses from a group of up to nine household representatives at one time, with one enumerator interviewing and the other recording responses. The primary data collection tool used at the household level (HHI) was a semi structured interview. These interviews were structured around a standardized set of exercises using two participatory methods, viz. ‘Before’ and ‘After’ scoring and impact scoring. These tools were used to capture perceptions of change in household food and income sources, and household food and income utilization. The ‘Before’ and ‘after’ exercises used two reference points, 2005 (before the project started) and 2007 (towards the end of the project). A description of how these exercises were conducted can be found in (Annex 2). After each exercise respondents were asked to explain (attribute) any changes that had been observed. Focus Group Discussions (FGD) were held at the community level. These discussions were structured around several exercises. The first of these was a SWOT analysis which looked at the Strengths, Weaknesses, Opportunities and Threats associated with the project. Comparative scoring exercises of project activities and project benefits were also done during these discussions. Community Mapping exercises and timelines were done with both male and female key informants, including village elders, agricultural extension officers, and project monitors. Individual Case Studies were used to collect qualitative data on project impact at the household level. Examples of these can be seen in annex 1. Semi structured interviews were also used during field visits and the final assessment to collect and validate indicators of project impact from the community. More details on how these indicators were collected can be found in annex 2. These indicators provided the basis for the participatory data collection tools used during the final impact assessment.
18

Table 2.3 Summary of methods used5 Method Use/Issue Sample
Njelele Sample
Nemangwe Impact scoring To determine the relative importance of different project
benefits at the household level 117 145
Simple ranking To determine the relative importance of project benefits at the community level
8 8
Ballot ranking To validate and rank community impact indicators6 170 74 Before and after Scoring
To measure: • relative changes in the importance of food
sources within the household food basket • relative changes in food sources • relative changes in income sources • relative changes in expenditure
117
145
Before and After scoring against a nominal baseline
To measure relative changes in: • the volume of the household food basket • production (yields) of existing crops • household Income
117
145
Scoring of household food security
To determine the duration (number of months) of household food security for project and non project participants
8 8
Focus group discussions
To : • collect qualitative community level perceptions
of project impact • to triangulate data from household interviews • collect data on the perceptions of non project
participants • collect data on the perceptions on the projects
strengths, weaknesses, opportunities and threats (SWOT analysis)
8
8
Key Informant Interviews
To: • develop project maps and timelines and
seasonal production calendars • cross check information
8
8
Individual case studies To: • collect richer qualitative data on project impact
at the household level
-
-
Semi structured interviews
Used to collect: • community defined indicators of project impact • information on household coping mechanisms
Used with all methods to determine attribution, cross check information and clarify responses.
117
145
2.6 Pre-Testing Field testing of the data collection tools was done during the actual assessment and took place in the first week in Njelele I. Seeing as the community defined indicators of impact had already been collected only some minor adjustments to the tools was
5 See annex 2 for a detailed explanation on how these methods were applied. 6 See annex 2 for more details on this exercise
19

necessary. The standardized recording sheets were refined and adapted to accommodate these changes.
2.7 Triangulation Various types of secondary data was used to cross-check the results of the assessment The first of these was project Monitoring and Evaluation (M&E) records and progress reports, which were used to match project service delivery and inputs with the changes (impact) captured during the assessment. Other project reports including the baseline survey, the impact indicator collection report, and the FIC, Tufts mid term visit report, these were used as references for comparison. Once the project has been completed the results will also be compared with the end of project (end-line) survey for further validation. Other resource documents that were used for triangulation were the ZIMVAC food security and vulnerability reports for 2004 and 2005, and the Zimbabwe Livelihoods Profiles, 2005. One of the objectives of the focus group discussions was to triangulate the data collected during the HHI. This was done by collecting more qualitative data on project impact, and comparing the perceptions of the FGD participants with the more quantitative perceptions captured in the household interviews. A third method of triangulation used was a comparison of the results of different exercises with each other to identify patterns and trends that concurred. For example if one exercise revealed that household food crop production had improved, it follows that an exercise on expenditure should show a decrease in the proportion of household income spent on food over the same period. This would then be cross checked using the attribution tables (explanation of changes) collected during the household interviews. A further validation exercise will be held with the community at the end of the project. Africare plans to organize a community meeting in all four wards covered by the project. The objective of these meetings will be to share the findings of the assessment with the communities and get their response. Any feedback from these meetings will be documented as a further means of validating and fine tuning the results.
2.8 Data Analysis Given the notable differences in terms of climate (precipitation), soil composition, elevation, and livelihood opportunities between Nemangwe and Njelele wards, the research team elected to analyze the household data from these two areas separately. By the same token-given the relative homogeneity in terms of production and livelihood opportunities, it was decided to aggregate the data from the wards in Nemangwe wards
20

and the two Njelele wards. This applied to the data collected using all the participatory tools except for data from the SWOT analysis which was left disaggregated by ward. The data from the before and after impact scoring exercises was tested for normal distribution using the P-P plot function in SPSS. A comparison of mean scores from the before and after food basket contributions, income and expenditure were all calculated at ninety five percent confidence interval using SPSS. For all other scoring exercises the mean score was calculated using Microsoft excel.
3. RESULTS
3.1 Impact Indicators From the mid term visits the most consistently mentioned indicators (expected benefits) can be summarized as follows:
• Better able to pay for school fees and books • Able to reinvest in agricultural equipment/inputs and other productive assets
(seeds, fencing, livestock and poultry, sewing machines) • Improved health and household food security
Other indicators frequently mentioned included, the ability to make improvements to homesteads, and the ability to support (provide charity) to orphans and other vulnerable members of the community1. During the indicator validation exercise carried out by Africare the community participants identified the ability to purchase livestock, agro processing equipment, pay for school fees, and improve their housing as the most important livelihoods benefits they expected from project derived income and savings. Women valued the ability to pay for school fees as the most important project benefit, while the men ranked the ability to purchase livestock the most important, with school fees second. The women ranked the ability to invest in agro-processing equipment (peanut butter mills) as the second most important benefit. Improved health was scored as the third most important project benefit by both male and female respondents, ‘better health’ being attributed to improved nutrition (see annex 2 for details on how these indicators were collected).
21
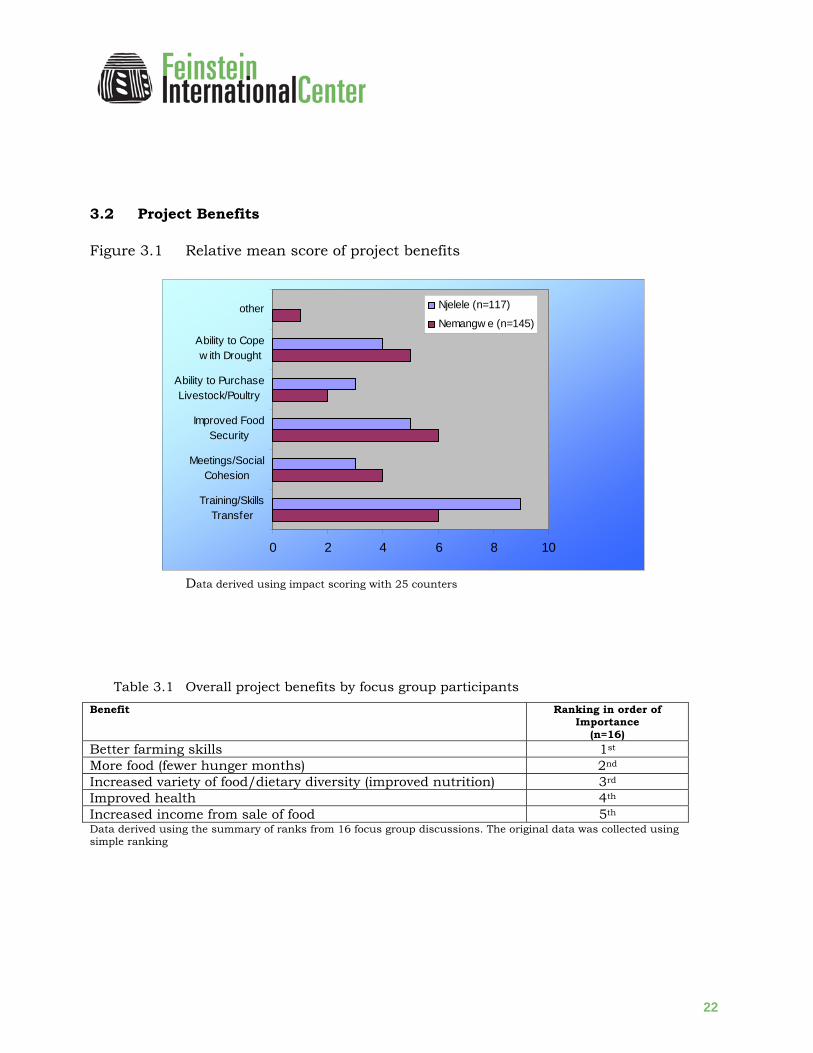
3.2 Project Benefits Figure 3.1 Relative mean score of project benefits
0 2 4 6 8 10
Training/SkillsTransfer
Meetings/SocialCohesion
Improved FoodSecurity
Ability to PurchaseLivestock/Poultry
Ability to Copew ith Drought
other Njelele (n=117)
Nemangw e (n=145)
Data derived using impact scoring with 25 counters
Table 3.1 Overall project benefits by focus group participants Benefit Ranking in order of
Importance (n=16)
Better farming skills 1st More food (fewer hunger months) 2nd Increased variety of food/dietary diversity (improved nutrition) 3rd Improved health 4th Increased income from sale of food 5th Data derived using the summary of ranks from 16 focus group discussions. The original data was collected using simple ranking
22

3.3 Timing of the Intervention Figure 3.2 Timeline of recent events – Njelele and Nemangwe National Referendum & Parliamentary Elections Presidential Elections Parliamentary Elections GIRA Project Started in December05 PIA May/Jun
2000 2002 2003 2004 2005
2006 2007
• Okay Harvest
• DROUGHT year, little or no harvest (March). Grains
(maize) ran out by November. People started selling livestock to buy grain and eating fewer meals. They also started consuming ‘Svozvii’. Some people moved to more productive neighboring areas in search of agricultural work. Concern started distributing in kind food assistance from December through to March 2003.
• Small Harvest in March, Grains (maize) ran out by
November, people started exchanging household items for grain; some sold ox carts, ploughs, window frames and roofs in order to purchase maize.
• Good Harvest
• DROUGHT year, little or no harvest, people selling livestock and belongings to purchase grains. In August Africare started developing the GIRA project proposal in partnership with the community. Concern started distributing in kind food assistance in November through to April 2006. Africare initiated the GIRA project in December 2005- distributing soy bean, sorghum and sweet potato seeds. Although late in the planting season, many farmers managed to plant at least some of these seeds. Distributions continued through to January 2006
• Good harvest in March, particularly for sorghum, sweet potato and soy beans. This was attributed to high rainfall, and the seeds distributed by Africare. Two bad years and one medium year implied that most farmers either had no seeds left or at least no good quality seeds. Africare did a second round of seed
23

distribution in September/October. (Soya beans, sweet potato, sunflower, maize and groundnuts)
• Bad maize harvest, as a result of poor rainfall. Soya
beans and sweet potato did well, groundnuts did okay. By June people already having to purchase maize.
GTZ have also been carrying out restocking interventions in the same wards as the Africare project however, there is no indication of any overlap in terms of assisted communities or individual household recipients.
3.4 Food Security Across all four wards the communities unanimously defined food security as ‘the availability of maize (sadza) within the household’. Community indicators of food security included ‘full granaries and maize cribs, good inter family relationships, cheerful children, shiny skin and the ability to offer hospitality (meals) to guests’. Typically the communities considered this concept of food security to be applicable to the months following the harvest. People generally considered themselves to be food insecure once the household had ‘run out of maize’. Once this happens – such as during ‘drought’ years people will resort to a variety of coping mechanisms:
Table 3.2 Common household coping strategies in Gokwe-South District
Coping Strategy 1 Sale of livestock in order to purchase grain 2 Sale of other household assets (including roofing, doors, windows, and
cooking utensils) in order to purchase grain. 3 Engage in agricultural work in neighboring communities less affected by
the drought, in exchange for maize meal. 4 Reduce the number of meals consumed (even down to one meal a day). 5 Increase vegetable production for consumption and sale. 6 Consumption of “Svozvii” an intoxicating wild fruit which induces a state of
unconsciousness, ‘allowing you to forget about your hunger’. Data on coping mechanisms derived from semi structured interviews and focus group discussions (not ranked in order of importance).
24

3.4.1 Duration of Food Secure Period Figure 3.3 Number of months of household food security
Njelele: A comparison between project participants and non participants
Duration of HH Food Security Njelele (n=8)
02468
10121416
Apr May Jun Jul Aug Sept Oct Nov Dec Jan Feb Mar
Mea
n Sc
ore
2004-2005 2006/07 Project Participants 2006/07 Non-Participants
Nemangwe: A comparison between project participants and non participants
Duration of HH Food Security Nemangwe (n=8)
02468
101214
Apr May Jun Jul Aug Sept Oct Nov Dec Jan Feb Mar
Mea
n Sc
ore
2004-2005 2006/07 Project Participants 2006/07 Non-Participants
The data was collected using twenty five counters which were used to represent a households’ post harvest cereal balance. The counters were then distributed along a calendar to indicate utilization up until depletion. The data was collected during focus group discussions, and the distribution of the counters was agreed upon by consensus of participants from each group.
25

3.4.2 Food Basket Contributions Figure 3.4 and 3.5 show changes in the relative ‘importance’ of different food sources in the food basket7. Figure 3.4 Food basket changes Njelele (n=117)
Data derived from before and after scoring using twenty five counters.
7 Note ‘importance’ may imply both volume and quality or a combination of both.
26

Figure 3.5 Food basket changes Nemangwe (n=145)
Data derived from before and after scoring using twenty five counters8.
Table 3.3 Attribution table explaining changes in the importance of different food sources
Factors
Number of responses
* Represents project related factors
Njelele (n=117)
Nemangwe (n=145)
Availability of new (drought tolerant) seeds from Africare * 10 40
Decrease - crops were affected by drought/ floods 8 39
Variety of food crops introduced- reduced dependence on maize * 22 24
Training in agronomy led to better crop production and higher yields * 10 24
I had no draught power and was unable to till as much land as I did in 2005 4 3
In 2005, inputs were delivered late; early delivery in 2007 * 9 -
I had to subdivide my land to introduce the new crops - led to lower production for some - 10 Data was derived using semi-structured interviews following the before and after scoring exercise on food sources. Factors scoring below 2% of the overall responses were not included in this table. Some people gave more than one response others gave none. (Number of responses Njelele, 70 Nemangwe, 145)
8 Note ‘importance’ may imply both volume and quality or a combination of both.
27

Table3.4 Perceived changes in the volume (quantity) of the household food basket
Location Variable Mean Score (increase) 95% CI Njelele (n=117) Changes in HH food basket
(volume) 16.4 (15.8, 16.9)
Nemangwe (n=145)
Changes in HH food basket (volume)
14.3 (13.5, 15.1)
Data derived by scoring a total of 20 counters against a given baseline of 10 counters
Table 3.5 Attribution table for changes in the overall quantity of the household food basket Factors
Number of responses
*Project related factors
Njelele (n=117)
Nemangwe (n=145)
Diversity of crops means that there is more food available at HH* 39 54
New skills and knowledge in agronomy - higher production* 25 35
Agro-processing (no need to spend limited income on processed foods)* 49 27 Decrease due to unsuitable soil-type and drought. 2 35
Data was derived using semi-structured interviews following the before and after scoring exercise on food basket changes. Factors scoring below 2% of the overall responses were not included in this table. Some people gave more than one response others gave none. (Number of responses Njelele, 115, Nemangwe, 152) Figure 3.6 Perceived changes in household production (yields) between 2005 and 2007
Changes in Production of Existing Crops Njelele (n=117)
0
5
10
15
20
Maize
Sorghum
Groundnuts
Swt Potat
o
Vegeta
blesMea
n C
rop
Prod
uctio
n Sc
ore
20052007
Production Changes in Existing Crops Nemangwe (n=145)
0
5
10
15
20
Maize
Sorghum
Groundnuts
Swt Potat
oMille
tMea
n C
rop
Prod
uctio
n Sc
ore
20052007
Data derived by scoring with 20 counters against a nominal baseline of 10 counters
28

Table 3.6 Attribution for changes in production of existing crops being promoted by GIRA
Factors Number of responses Project related factors*
Njelele (n=117)
Nemangwe (n=145)
Overall decrease due to drought 9 51
Decrease due to late planting because of late seed delivery 2 5
No fertiliser 4 1
Lack of Draught Power (decrease) 3 1
Increase due to getting more and a variety of new adequate seed on time* 53 62
Training in agronomy* 1 28
Early planting resulted in better harvest and higher yield - 10 Data derived using semi-structured interviews following the before and after scoring exercise on production changes. Factors scoring below 2% of the overall responses were not included in this table. Some people gave more than one response other gave none. (Number of responses Njelele, 106, Nemangwe, 170)
29
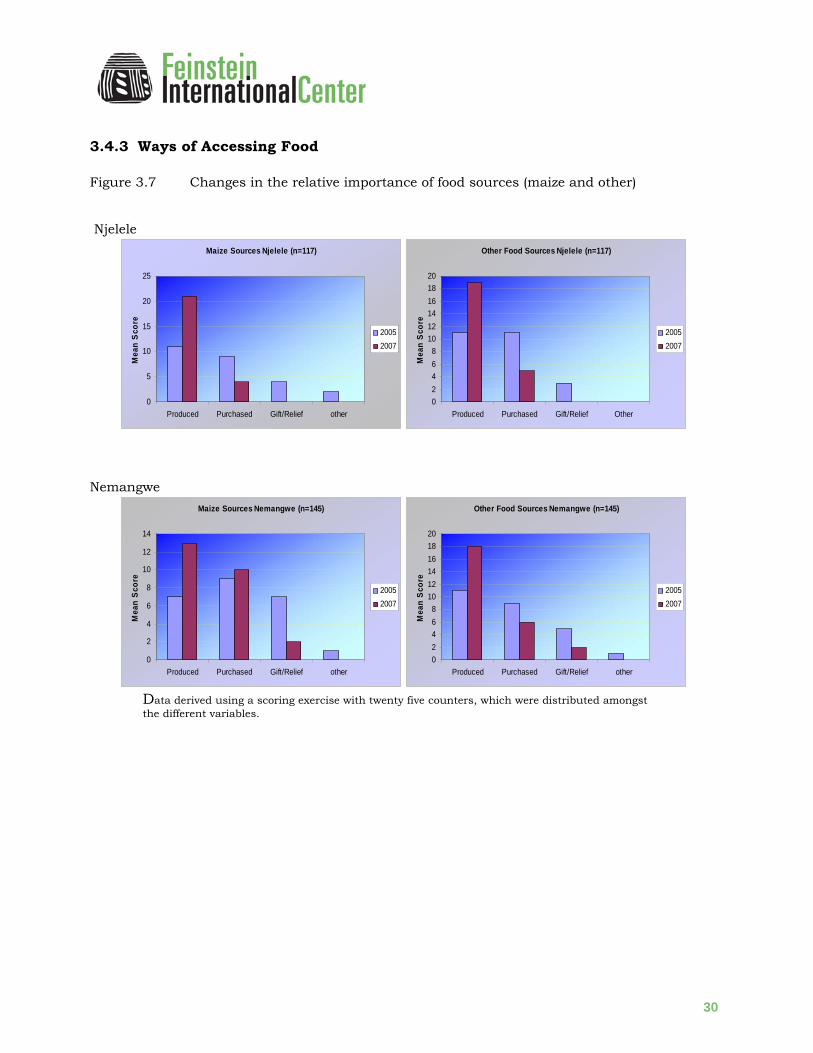
3.4.3 Ways of Accessing Food Figure 3.7 Changes in the relative importance of food sources (maize and other) Njelele
Maize Sources Njelele (n=117)
0
5
10
15
20
25
Produced Purchased Gift/Relief other
Mea
n S
core
20052007
Other Food Sources Njelele (n=117)
02468
101214161820
Produced Purchased Gift/Relief OtherM
ean
Sco
re
20052007
Nemangwe
Maize Sources Nemangwe (n=145)
0
2
4
6
8
10
12
14
Produced Purchased Gift/Relief other
Mea
n Sc
ore
20052007
Other Food Sources Nemangwe (n=145)
02468
101214161820
Produced Purchased Gift/Relief other
Mea
n Sc
ore
20052007
Data derived using a scoring exercise with twenty five counters, which were distributed amongst the different variables.
30

3.5 Income Figure 3.8 Changes in income sources Njelele (n=117)
Data derived from before and after scoring using 25 counters
Figure 3.9 Changes in income sources Nemangwe (n=145)
Data derived from before and after scoring using 25 counters
31

Table 3.7 Changes in household income
Location Variable Mean Score (increase) 95% CI
Njelele (n=117) Changes in HH Income 16.3 (15.9, 16.8) Nemangwe (n=145)
Changes in HH Income 15 (14.3, 15.7)
Data derived by scoring a total of 20 counters against a given baseline of 10 counters
Table 3.8 Attribution table for any changes in income (increase/decrease) Factors
Number of responses
*Project related factors
Njelele n=117
Nemangwe n=145
Decrease- Poor Yields due to drought - 14
Increase - marketing new crops (soya beans, sunflower, sweet potato) 69 66
Value addition to crops - fetching better prices 16 26
No change in income - but I make savings on food purchases 30 32
Cotton did well in 2007 and price per kilo was good 3 1 Data was derived using semi-structured interviews following the before and after scoring exercise on income changes. Factors scoring below 2% of the overall responses were not included in this table. Some people gave more than one response other gave none (number of responses; Njelele, 118, Nemangwe, 140)
32
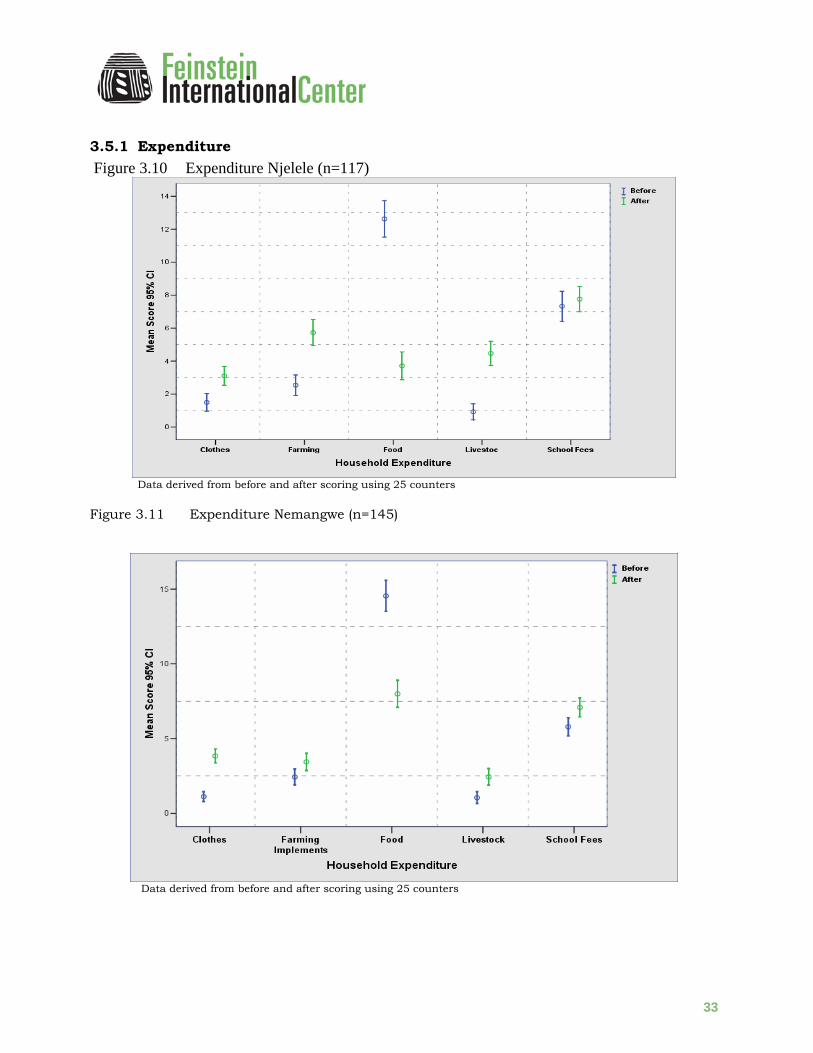
3.5.1 Expenditure Figure 3.10 Expenditure Njelele (n=117)
Data derived from before and after scoring using 25 counters
Figure 3.11 Expenditure Nemangwe (n=145)
Data derived from before and after scoring using 25 counters
33

3.6 Strengths and Weaknesses of the Project
Table 3.9 SWOT analysis Njelele I (n=4)
Strengths • We got the seed on time and therefore we planted on
time and got a good harvest • The project trained us on how to grow and use the
newly introduced crops • The OPV provided better food security for us in the
community • We can now support orphans in our community • The project enabled us to pay school fees • We were able to convert some of the harvest to livestock
to insure against inflation • Non project beneficiaries have been able to come and
learn from us – transfer of skills • Benefits are easily shared with non-beneficiaries as
some of them are now coming to borrow Soya beans seeds to plant in their own fields after tasting some of the confectioneries and wanting to try them in their households.
• From the sale of sweet potatoes, I have been able to buy poultry.
• The project has assisted in bringing us together as a community for development;
• I learned better crop production skills and I cannot exchange that for anything, I think it was the biggest benefit;
• I sold my harvest and with some of the proceeds, I managed to complete building my house
• I benefited from the drip kit component, I planted okra sold and used part of the proceeds to make home improvements.
Weaknesses • The project promised to provide drip kits
for the irrigation component and these have not arrived as yet.
• Targeting of beneficiaries was not very effective, some of those who got inputs did not have drought power and therefore did not implement the project;
• Some of us got the inputs late and there was no fertilizer supplied with the seed
• We had hoped that the organization would provide market for the new crops and this did not materialize.
• Distribution of the vegetable seeds was not equitable
• Market for sweet potatoes is flooded at the moment
• If the project had provided out inputs such as fertilizer, perhaps the yields would have been even higher
• We have to take our sunflower seeds to other oil presser and this is costing us a lot of money since our project did not provide oil presses
• We produced more potato vines than the project could buy so we have excess potato vines at the moment
Opportunities • We have improved nutrition through the introduction of
such Soya products as well as use of potato vines as vegetable.
• We see new business opportunities that can come through value addition and processing of the new crops
• Early maturing crops provide with the opportunity to improve our food security situation and reducing hunger months
• We are making savings in using sorghum to brew our own beer
• I learned that water used for soaking Soya beans overnight is good for skin toning
• We make refreshment drinks from sweet potatoes – something we did not do before
• We have better cash income which has reduced pressure on the sale of maize – our staple
Threats • Since the project did not cover everyone in
the community, it is causing disharmony in the community – non beneficiaries hate beneficiaries.
• Because the project was fully donor funded, it could create donor-dependence if we are not careful.
• Because our women are eating sweet potatoes, they seem to be experiencing difficult labor since the babies are too big
• We had problems persuading the community on using some of the crops such as cassava and the variety was different from what they are used to.
• Some of the sweet potato varieties are affected by potato weevils
34

• The project has brought unity in the community which we can build on for future development efforts
• We see the need and the possibility for forming Commodity Associations within the ward to not only market our produce jointly for better prices but also for sourcing inputs cheaper than is possible on an individual basis.
• Availability of seeds within the community is a great boost for our farming activities. We no longer have to wait to buy seeds but can plant as soon as the rains are here
• Because the OPV maize can only go for 3 seasons before it weakens and we have to source new seed, the sustainability of the projects might be affected although the seed is now more available in the Grain marketing Board (GMB) seed stores which might help deal with the threat of discontinuing the planting.
Table 3.10 SWOT analysis Njelele II (n=4)
Strengths • The project enhanced food security in the community through the
introduction of new varieties such as groundnuts. (I harvested 12 x 50kg bags of groundnuts on my 0.5 ha. plot of land
• The OPV maize seed was impressive although there was drought we still managed to harvest enough to keep seed for the next season
• The Soya beans harvest helped to bring in cash and we also learned many ways of using it at home in effect improving our health
• Although we planted the g/nuts late, we were still able to achieve an impressive harvests (23kg x 5 bags on the average for each beneficiary household).
• The availability of the new crops helped to diversify food at the household and reduced pressure on sale and consumption of maize resulting in fewer hunger months in our community.
• The new dishes made from Soya Beans, Sunflower and sweet potatoes have improved nutrition of our children.
• The project introduced new innovations on the use of crops we grew such as making cakes, milk, “coffee” from Soya beans; green vegetables from sweet potato leaves; extracting oil from Sunflower; refreshments and chips from sweet potatoes etc.
• The project has enhanced our capacity to support the less fortunate members of the community such as sick people; the project’s initiative of getting us to pay for the peanut butter machine through sharing with the less fortunate was especially helpful.
• Sweet potatoes have been sold at Bomba – the local market and also at Gokwe Centre availing cash for household and school needs.
• We harvested enough of the new seed varieties for food and some to keep for planting in the next season.
• We are now processing our own “DOVI” – peanut butter from ground nuts sourced from the community;
• The products and by-products of such new crops as Soya beans, Sunflower have diverse uses which have helped to diversify our livelihoods and can lead to sustainable food security if well
Weaknesses • The number of beneficiaries was too small
and this has tended to create some hatred in the community
• The project provided seeds and no fertilizer; it should have provided both that way the returns would perhaps have been much more;
• Drip Kits were too few; • Delivery of inputs was late • We have now planted and produced but the
markets for our produce are lacking although the project had promised to source markets for ground nuts and sunflower seeds
• The peanut butter processing machine does not produce very fine butter; some farmers have resorted to taking their groundnuts to commercial processors who charge them a lot of money.
• One sweet potato variety was initially resisted by the community as a myth had been spread about it to the effect that it would affect the potency of men in the community. This has since been proved wrong and the community now accepts the variety.
• If we are to be competitive in peanut butter production, the manual machines are not adequate, the project may need to introduce electric machines;
• Before the drip kits were distributed, Africare had made it a pre-condition that one has to have a shallow well, now various members of the community have dug shallow wells but Africare is not providing the kits to them.
35

planned and utilised. • Some of the potato vines brought into the ward from Simbe East area were infected with a disease and thus little harvest was realised.
Opportunities • The project has left us with skills to extract oil from sunflower
seeds, make peanut butter, create and maintain seed nurseries; skills we did not have before
• There is potential for creation of employment through small-scale industries at community level
• We also see an opportunity for the formation of a marketing cooperative to source inputs and sell our produce which will enable us to bargain for better prices
• Now that we have the seeds within the community we may be able to avail the seed to non-beneficiaries and in effect multiply the benefits of the project beyond the initial targeted beneficiaries
• We see an opportunity of getting completely out of the food insecurity situation in our ward through the use of skills for better utilization of Soya beans, sweet potatoes, sorghum and sunflower;
• We see opportunities for lobbying the government to repair our rural community roads to enable us get our produce to the market;
• We now have a processing group already trained in micro-enterprise and this can be the beginning of enterprise and marketing development
• We could actually buy trucks to ferry our goods to the market if we are better organized.
• Our farmers got a chance through this project to participate in and win the “Better Farmer” competitions held in the community.
• Introduction of OPV maize seed now makes it possible for us to plant maize without needing to go back for seed each season.
• The project has given a lot of hope for the resource-poor members of the community and therefore has contributed to the goal of reducing poverty – poverty can actually be eliminated if the benefits of the project are spread across the entire community.
• Before the project we would just sleep during the winter and wait for the planting season however the project has helped us to find something to do in the winter – work in the gardens. This helps us to double our outputs and is a good chance to eradicate poverty and improve food security.
Threats • The members of the community that did not
benefit tend to dislike those who were selected.
• There is enough crop and inadequate markets for it leading to low prices
• Because drip kits are few, few will be able to benefit and this could bring disharmony in the community.
• Because of the increased production of cash crops such as vegetables, sweet potatoes and ground nuts, our women have taken to business and are traveling a lot in search of markets and this could be a threat to family unity.
• Our area is poorly connected to the markets since there are no roads. This hampers marketing of farm produce and tended to dampen spirits for production
Table 3.11 SWOT analysis Nemangwe II (n=4)
Strengths • The project introduced new varieties of seeds such as
Soya beans, groundnuts and sunflower the community which helped us to cope with the drought.
• Sweet potatoes really helped in providing food during the dry months
• Being able to produce our own cooking oil from the Sunflower was very helpful since we were able to save money which would have been spent on buying oil.
• The project has enhanced working relations among community members as we are now able to meet and plan development; we are also able to borrow foodstuffs and seeds from one another which was not happening before the project.
Weaknesses • Sweet potato vines were delivered late so
they did not do as well as they would have done had they been delivered early
• The oil presses are too few and some have not even been delivered making it difficult for us to produce own oil.
• Because the presses were not available, many of us have had to take our seed to the market to commercial oil pressers who charge us a kilogram of sunflower seed for every kilogram processed and this is very expensive.
• There is only one peanut butter machine
36

• The project addressed a crucial target group in the community – orphans and vulnerable children in the community whose food security situation was dire prior to the project but has now improved.
• Since GMB had stopped giving seeds, we did not have seed at all until the Africare project started
• The project has helped to improve health in the community
• We have been able to reduce our vulnerability to drought through diversification – for example, through money saved, I was able to buy poultry
• The project introduced new skills for processing Sunflower and Soya beans products
• Because the OPV maize matured early, I got enough food to save my family despite the drought (4 x 50 kg bags) enough to tide my family through at least two months.
in one corner of the community – it is therefore not much use to the large majority of us who process our groundnuts using the old methods or take it to the market for commercial processing.
• The manual oil press is not efficient in expressing oil from the Sunflower seeds.
• The project did not provide fertilizer for all the seeds and this compromised the yields
• Only a limited number of households received the OPV seed
• Cassava cuttings and Sweet potato vines were delivered very late (April 2007) when the planting season was already over
Opportunities • The bread and buns made from Soya beans is a new food
and an opportunity for the community to improve nutrition.
• The by-products of Soya beans and Sunflower have also been very helpful in feeding poultry and livestock – this is new knowledge that we did not have before the project and could improve the quality of our animals if used in large quantities
• The project has ensured availability of fresh vegetables within the community – this serves as a source of food in the good seasons and as a source of cash income in the drier seasons of he year when we need money to buy maize seeds.
• Because we produced a lot of pea nut butter, the sales have improved family cash and health situations as we are able to serve nutritious meals of vegetables and porridge mixed with peanut butter without spending so much money in the market.
• Although the project targeted specific households, the benefits have been shared across the whole community as non-beneficiaries have been able to get seeds from the beneficiary households. This is an opportunity for passing on skills and improving the living standards of the entire community.
• I did not know that sweet potato leaves can be used as vegetable. I have learned that from the project and will now use the method
• The fact that we can re-plant the maize seeds from our harvest has been very helpful as I now do not need to go back to the shops to buy seed when the planting season comes
Threats • Some members of the community were
jealous of the beneficiaries for having been left out of the project, however this has reduced since the beneficiary households are sharing their produce and skills with non-beneficiary households.
37

Table 3.12 SWOT analysis Nemangwe III (n=4)
Strengths • The project introduced many new dishes from the soy-
beans that improved nutrition in the community. • Groundnuts, sunflower, and soy- beans were new cash
crops and also helped reduce demand for cash from the household to buy oil for vegetables from the market
• The project introduced drought tolerant crops that ensured better yields even in very difficult years that the community faced
• The project provided opportunities for us as a community to meet and discuss our food security and development.
• We have been able to store seed for planting in the next season.
• Vegetable sales have improved our cash income and enabled us to pay school fees for children.
• Some of us have been able to re-stock by buying goats to replace the ones we sold during the last drought.
Weaknesses • Seeds were distributed late after the
planting season had started • Seeds were not enough for all
beneficiaries • Maize was badly affected by drought in
the area • Some parts of the ram press have not
arrived compromising the quality of sunflower oil
Opportunities • The project introduced new crop production skills in the
community • The new ways growing and using a crop such as soy- beans
such as making confectioneries, milk, coffee provides us with the opportunity to try new dishes and better nutrition
• Because we are processing our own sunflower seeds now, we can use the by-products to feed our livestock and poultry.
Threats • The high production of soy-beans has
led to depressed local market prices • Because the project did not target all
members of the community, some non-beneficiaries have been very jealous of the beneficiaries
4. DISCUSSION
4.1 Assessment Constraints and Methodological Limitations (Please skip to the next section if not interested in methodological issues) A number of methodological compromises were made in order to achieve a larger sample size. For example the decision was made to conduct the household interviews with nine participants. This was done to economize on time and still collect data from as many people as possible. This undoubtedly resulted in ‘peer bias’ whereby people would agree with the responses of other participants. While some level of agreement is expected, it is unlikely that the level of concurrence in the results would have occurred if participants had been interviewed on an individual basis.
38

For practical reasons the assessment should probably have been carried out in two of the wards. However, for “political” reasons the assessment team was obliged to include all four wards covered by the project. In real terms this only gave the team four days of data collection in each ward which did put a time constraint on the assessment and influenced the decision to cluster the household interviews into groups of nine. Another issue that influenced this time saving compromise was an awareness of the cost benefits of the assessment to the participating communities. Six hundred and eighty one community members participated in the assessment. As far as the research team could determine participation was voluntary. However a conservative estimate is that this participation cost each person at least five hours of their time (including travel) - and this being during the most productive part of the day. At the community level this would translate into the loss of just over 283 days (assuming a twelve hour day). At the individual or household level it could be the difference between eating and missing a meal on the day of participation; which does raise some ethical questions on assessment design; particularly in communities that are experiencing food insecurity or drought. In light of this consideration the team actually modified one of the most time consuming exercises after the first week of the assessment, thus compromising the detail and richness of the data collected. The obligation to include all four wards in the assessment and the resulting time constraint also had implications on the field testing. This was done during the first week as part of the assessment. Consequently some of the data had to be discarded as it was being collected against a different set of variables. This time constraint also had implications on the amount of data entry and preliminary analysis that could be done during the assessment. The original assessment plan had allocated one day a week for data reviewing and analysis, this never materialized. Seeing as the enumerators all lived in different areas it was also unrealistic to hold these sessions at night, in any case there was rarely any electricity due to power rationing in the country. If these sessions had been possible it’s probable that the enumerators could have been sensitized to the issue of ‘peer bias’ and been more pro active in encouraging more independent responses. Furthermore once the data was entered and analyzed it was discovered that another of the more time consuming exercises didn’t yield a great deal of additional useful information. Again if this had been discovered earlier, ideally right after the field testing, this exercise would have been dropped from the toolkit. Although the representation of the respondents was fairly well balanced in terms of gender, and the assessment to some extent did capture the views of non-project participants, it did not capture the perceptions of impact from different sub groups within the community. Potential generational and socio economic disparities may have been overlooked, and the views of certain groups within the communities may have been excluded. This limitation in the assessment results is acknowledged. These omissions were justified on the basis of time sensitivities, both practical and ethical.
39

Aside from the FIC, Tufts researchers, all the enumerators were involved in the project in various capacities, and as such the possibility of reflexivity cannot be excluded. It should also be mentioned that aside from the FIC, Tufts researchers, the enumerators had little or no previous experience in participatory assessment methods, and none had attended the PIA training in Addis Ababa. Although they were quick to learn, it did imply that part of the assessment included an on the job training component. It also meant that more complex participatory methods were not included in the assessment. During the assessment it became evident that there was an expectation of continued assistance from the project participants, and this may have influenced their responses to certain questions. If this were the case it would be difficult to determine whether they would underestimate or exaggerate their perceptions on the impact of the project. Nevertheless it should be noted that this expectation did exist. Being the first of the four FIC, Tufts impact assessments being supported under this initiative, the exercise was certainly a valuable learning experience for the research team, and one which will inform the approach, design and planning of the other three assessments.
4.2 Overall Project Impact The findings of the assessment clearly indicate that the GIRA project has had a significant impact on the livelihoods of the participating households. The project benefits can be summarized as an improvement in household food security, and an increase in income and savings. More specifically the perceptions of the recipient households indicate that the project has improved the diversity of their household food basket resulting in better health and nutrition. The increase in food production brought about by the project has also enabled people to provide support to orphans and other vulnerable members of the community. The income and savings benefits have enabled people to pay school fees and cover other educational costs, purchase agricultural tools and inputs, invest in agro processing equipment, make improvements to their homes, and purchase livestock and poultry. This ability to purchase livestock has also improved people’s resilience to drought, as livestock assets are used as insurance against a bad harvest, in which case they are sold and the proceeds converted into maize meal. This strategy of converting cash into livestock assets is particularly important in the context of Zimbabwe’s current economic climate where hyper-inflation can devalue profits from the sale of a harvest in a matter of days. In the cotton producing area of Nemangwe, project participants noted the benefit of having a steady income from the sale of the new crops introduced by the project, in contrast to the one time annual cash transfer from the sale of their cotton harvest. In providing people with other livelihood options, the project has also been instrumental in
40
improving people’s resiliency –or ability to cope with drought. This has manifested itself in a reduced dependency on traditional drought coping mechanisms such as the sale of livestock and other assets, and the need to engage in on farm labor in neighboring (less affected) areas. One of the most important perceived benefits noted was the knowledge and skills transfer derived from the training activities of the project. Many participants also suggested that the project had brought the community closer together although they acknowledged that it had created ‘disharmony’ between project recipients and non participants. Nevertheless, the impact of these knowledge transfer benefits is unlikely to be limited to just direct project participants, as can be seen by the number of non participant community members that attended the training sessions (see tables 1.1 and 1.3). In the Njelele wards the training benefits scored highest whereas in the Nemangwe wards the food security benefits were considered more important. This in part can be explained by the fact that Nemangwe has been harder hit by the ongoing drought and so the food security benefits are more apparent in this area and at this particular point in time. Interestingly enough when the results were disaggregated by gender the analysis showed no significant difference in the scoring of project benefits between male and female respondents (see Annex 4).
4.3 Impact on Household Food Security The project contributed towards improved food security in various ways. Firstly an increase in production resulted in greater food availability allowing for fewer months of ‘food insecurity’. Although overall maize production only increased slightly as a result of the project, the other crops introduced or promoted by the project allowed people to stretch their household maize budget9. Secondly the project has improved the overall quality of the household food basket through both the introduction of new crop varieties, and agro-processing techniques. Most of the project participants acknowledged that this diversification in the food basket has had a positive impact on both health and nutrition. The assessment compared the number of months of household food security expected by project participants in comparison to members of the community not being assisted by the project (figure 3.3). In 2006-2007, project participants in the Nemangwe wards expect to be food secure for two months longer than non-project participants in the community. In Njelele project participants expect to be food secure for six months longer than the non recipient households. Based on these perceptions between project and non-project informants, in terms of aggregated impact the project has arguably
9 Note: availability of maize was identified as a key indicator of household food security
41

provided the assisted households with eight months of household food security across the four wards. In terms of the comparative changes in the household food basket since the project started (figures 3.4 and 3.5). The most significant dietary changes are the inclusion of soy beans and sunflower; two new crops introduced by the project. The results point to an increase in the amount of sweet potato and groundnuts being consumed, or at least a change in the relative importance of these food sources. Although groundnuts and sweet potatoes were not introduced by the project as such; they were promoted, and the agro-processing component focused on enhancing the utilization and consumption of these two crops. The results also illustrate a decline in the relative importance of both maize and vegetables to the household food basket. In terms of impact, a reduced dependency on maize in particular could be seen as positive. The diversification in diet most likely had a positive impact on nutritional status given the high protein content of both soy products and groundnuts. This benefit would be particularly important for households with family members living with HIV/AIDS. The primary reasons given for the positive changes in the food basket focused on the availability and quality of seeds, the introduction of new crop varieties, and increased production due to better farming techniques (table 3.3). These changes can largely be attributed to the GIRA project activities. The primary reason given for any negative changes experienced was the ongoing drought; this was particularly evident in the Nemangwe wards. Project recipients observed an increase in the amount of food available within the household (table 3.4). The principle reasons given for this increase can generally be attributed to the project (table 3.5). These included; the introduction of the new crops introduced by Africare, the availability of seeds, provided by the project, and an increase in crop production as a result of the training component of the project. It can also be assumed that a significant number of non project participants may have benefited from the training, as attendance was not restricted to registered participants. Also mentioned was the consumption of the processed foods from the agro-processing activities. Participants suggested that in the past processed goods such as peanut butter, sunflower oil, milk, and coffee would have to have been purchased with what limited cash resources they had; as a result people would consume less of these products. The agro-processing component taught participants to produce all the products mentioned, as well as a number of other confectionaries from soy beans and sweet potato, and mostly using only basic household utensils. Less than two percent of the respondents in Njelele suggested there had been a decrease in their food basket, whereas twenty three percent of respondents in Nemangwe indicated that they had experienced a reduction in the quantity of food in the household. The ongoing drought was given as the main reason for this reduction.
42
More or less the same reasons were given for any changes in production (figure 3.6) as those for changes in the quantity and diversity of the food basket. Positive changes were largely attributed to the project (table 3.6). In Nemangwe the effects of the drought had a negative impact on production, with thirty percent of the respondents indicating a decrease in yields. However an overall improvement in production was seen for all the crops promoted by the project, in particular groundnuts, which appear to do better than other food crops in Gokwe-South District. The results show changes in the ways in which households accessed food between 2005 and 2007 (figure 3.7).The main trends highlighted for both maize and ‘other food sources’ are a significant increase in the amount of food coming from own production, and a decline in the amount being purchased. These changes can be attributed to improved production, the introduction of new food crops, and the ability to process foods as opposed to purchasing them (see tables 3.3-3.6). Essentially the project has enabled the participating households to produce more food and different types of foods which in the past they would have had to purchase. The “other” food source contribution shown in (figure 3.7) exclusively represents food for (on farm) labor. This activity is considered a coping mechanism, and so the reduced dependency on this food source in Nemangwe and the elimination of it in Njelele suggests an increase in overall household food availability. An exception to the overall trend is in Nemangwe where slightly more maize was being purchased after the project. Although no specific attribution exercise was done for these results there are several possible reasons which might explain this, and which corresponds with the overall findings of the assessment. Firstly the primary cash crop in Nemangwe is cotton, whereas in Njelele it is maize. In Nemangwe the common practice is for people to fill their cereal deficit using income from cotton sales. The results also show a decrease in the contributions from relief and gifts as a food source. In part this can be explained by the fact that in kind food assistance was distributed in the area in 2005 and even though 2007 is considered a comparable ‘drought’ year, at the time of the assessment no relief food interventions had taken place. One might expect that people were purchasing more maize to compensate for the loss of this other grain source10. Secondly, the findings of this study reveal that the project has provided cash and savings benefits to the participants in Nemangwe (see figure 3.7). It’s likely that people
10 Interestingly, in Njelele only 6 out of 117 (5%) respondents mentioned relief/gift (maize) as a food source in 2007. In Nemangwe 29 out of 145 (20%) mentioned this food source for 2007, although further questioning revealed that this included food support from relatives, and the expectation (as opposed to the actual delivery) of in kind food assistance.
43

converted a portion of this income and savings into cereals which might explain the increase in the amount spent on maize after the project. Thirdly the assessment took place during the cotton harvest, and given the hyper-inflationary context; in the same way that people convert cash into livestock assets, given that the price of staple foods is government regulated, it’s probable that people would use some of the proceeds from cotton sales to fill their granaries, particularly in consideration of it being a drought year11.
4.4 Impact on Household Income The results of the assessment indicate that the project has had a significant impact on household income and savings. In terms of changes in the relative importance of different income sources (figures 3.8 and 3.9) the most significant trends show an increase in the importance of grains and sweet potatoes as a source of income, and a decline in the importance of livestock, labor and remittances. In both Njelele and Nemangwe grain sales have increased in importance. In Njelele this can be partly attributed to an increase in yields due to the introduction of improved (drought tolerant) cereal crops, and better farming techniques. However, this does not account for the same trend in Nemangwe where only a slight increase in cereal production was realized. Nevertheless the increase in production of other food crops has reduced dependency on maize for household consumption. This would allow for a greater portion of the household cereal budget to be diverted towards cash sales. - This would also apply to Njelele. Livestock sales, labor and remittances are all considered to be drought coping mechanisms, and so the decline in the importance of these is a strong indicator of project impact, particularly considering the drought context. Essentially these results support the premise that the project has improved people’s resiliency, and their ability to cope with drought. In Nemangwe where the effects of the drought are more pronounced there has been no change in the importance of vegetable sales as an income source. Expanding on the production and sale of vegetables is also considered a drought coping mechanism, and evidently in Nemangwe people are still actively employing this strategy. Nevertheless the decline in the importance of livestock sales, labor and remittances suggests that people are better off than they were in 2005, and this can largely be attributed to the project (see table 3.8). In Nemangwe sweet potatoes were introduced by the project, and promoted through the agro-processing activities, and as the results show this has provided the participating
11 Being more drought tolerant than maize, the 2007 cotton harvest in Nemangwe was good. Seeing as cotton can be converted into foreign currency, cotton merchants are offering favorable prices for the cotton in contrast to what was happening in 2004/2005. The government has also recently relaxed the foreign currency laws for commercial companies involved in the import/export sector, thereby providing cotton traders with an incentive to offer competitive prices to producers.
44
households with a new source of income (figure 3.9). Cotton remains at least as important a source of income in Nemangwe as it was in 2005. When analyzing the (mean) changes in income since 2005 the results indicate that project participants saw a significant increase in income (see table 3.7). In Njelele only two out of the hundred and seventeen households interviewed saw an overall decrease in income. In Nemangwe fifteen out of one hundred and forty five households (ten percent) interviewed saw a decrease in income. Those that did see a decrease in income mostly attributed this to inflation and drought. The ninety-plus percent of project participants that saw an increase in income attributed this to income derived from the sale of the crops introduced and promoted by the project, better prices (profit) realized through the value addition of the agro-processing component of the project, and savings on the food items produced and or processed as a result of the project (see table 3.8). The findings show a notable reduction in the proportion of income now being spent on food in both project areas (figures 3.10 and 3.11). The primary explanation for this is that households are now producing more of their own food as a result of the project. There has also been an increase in the proportion of income spent on livestock, farming implements and clothes. Again this can largely be attributed to the income and saving benefits from the project which, have enabled people to spend more on these items. Normally the priority expenses would have been on food and school fees. The increase in the proportion of income being spent on livestock is also an important indicator of an improvement in resilience or the ability to cope with drought (and inflation); as mentioned people invest in livestock assets as insurance against drought and other shocks, as these can later be converted into cash or food. There was a slight increase in the proportion being spent on school fees, although even in lean times people will prioritize education expenses. However it can be assumed that the income and savings benefits from the project have improved people’s ability to cover school fees and other related expenses. Many of the project recipients also invested project derived income in small enterprise (income generating activities). Although this was not captured in this exercise it was frequently mentioned. Under this category the most common investments were the purchase of sewing machines, and peanut butter grinding mills.
5. Conclusions In summary the project has had a significant impact on food security, income and savings of the participating households. It has allowed people to diversify their sources of income and their diet. It has enabled some people to adopt new livelihoods practices, and improved peoples’ resilience to shocks such as drought and inflation. The following table summarizes the key impacts of the project on the livelihoods of the participating households.
45

Table 5.1 A summary of the key project impacts on livelihoods assets
Capital Assets Project Impacts Human • Improvements in the quantity and quality of the household food
basket • Training benefits (skills transfer) in both agronomy and agro
processing Financial • Positive changes in income and expenditure
• New sources of income Social • Assistance to orphans
• Greater social cohesion and opportunities for community development
Physical • Livestock holdings and other assets from project related income Natural • Improved seed security and quality This impact assessment took place before the completion of the project activities and the results only provide a snapshot of the impact that has been achieved to date. Consistent with this, for this type of project it is also reasonable to expect much of the impact to be delayed sometimes even up to a year or so beyond the project end date. The reason being that many of the project activities such as the introduction of new crops, and farming and processing techniques need time to be adapted and incorporated into people’s overall production strategies. Given that there are risks involved in adopting new livelihoods practices it’s reasonable to expect a period of trial and experimentation, and this will usually take place during the project implementation period. Once people have witnessed the results of this experimentation, they are more likely to maximize on those practices that they perceive to be most beneficial. Again one would expect this to occur sometime after the project has ended. It should also be noted that the assessment took place during a drought, and shortly after the failed (maize) harvest. Seeing as the much of the project hinged on production activities, it’s reasonable to assume that with more favorable conditions one might have expected a greater impact. In some ways the findings of the assessment appear to support this assumption when comparing the results from Nemangwe and Njelele. The impact of the drought was more pronounced in Nemangwe, and the impact of the project was more pronounced in Njelele. Although a possible explanation could be that the project activities were better suited to the Njelele context; this may be an issue that is worth exploring with the Nemangwe community. Nevertheless when looking at the results from Nemangwe it’s important to consider impact in terms of resilience and not just the quantification of food and income benefits. In other words how would the project participants in Nemangwe have coped with the drought if there hadn’t been any project? When we compare the income earning activities between 2005 and 2007 we see a marked reduction in coping mechanisms –namely the sale of livestock and the need to engage in on farm labor
46
activities. These changes were more significant in Nemangwe than in Njelele. In part this can be attributed to better cotton prices in 2007, but the main reasons given were the alternative income sources provided by the project, and the better prices fetched for processed foods. Therefore, although the participating households in Njelele may have seen greater food and income benefits, given the different contexts, arguably the project had as much if not more of an impact in Nemangwe. These findings suggest that without the project the Nemangwe participants may well have had to sell their livestock assets, or engage in the unpopular practice of on farm labor. Although the assessment did not specifically set out to look at negative impact, one negative impact that was frequently mentioned was that the project had created some tension between project and non- project participants. Fortunately this has not escalated into physical violence, but it does demonstrate that where project resources are limited there is always the potential for conflict between project recipients and members of the community that have been excluded. The appreciation of the training benefits suggests that in many cases the software components of a project or even ‘by-products’ such as improved social cohesion may be more beneficial than the actual distribution of inputs. Conventional M&E processes are unlikely to capture or attribute the importance of training and knowledge transfer to the overall success of a project. In the case of the GIRA project a considerable number of non project participants attended these trainings effectively increasing the number of targeted households benefiting from this activity. From this perspective the training may have had a far greater impact than any of the other project activities. This could potentially have significant implications on project design, and on what portion of a project budget should be spent on training vis a vis other inputs. The original goal of the project was ‘to ensure the short-term food security of the targeted households and to mitigate the effects of future droughts among these same participating households’. The results of the assessment indicate that this goal has been realized. The short term food security benefits have been achieved through project derived food benefits, and the income and livelihoods opportunities created by the project have in various ways enabled people to better cope with the effects of the ongoing drought. One of the unintended impacts of the project is the transfer of skills to non-project participants through the projects training activities. The increase in household food and income, and the steady supply of these cash and food transfers not only helped people cope with the drought, but also provided a cushion against inflation. This could be seen as another unintended yet positive impact of the project.
47
6. Lessons Learned for Future Programming12 Although the results of this study may reveal some useful lessons which might inform future programming in the project area, it is the view of the FIC, Tufts researchers that these should be identified by the implementing partners in collaboration with the participating communities. The research team does not see much value in proposing specific programming recommendations based on the findings as they stand without a comprehensive stakeholder consultation. Having said this if Africare plans to continue the project activities under a separate grant, then FIC, Tufts would suggest that the findings of this assessment be used as a basis for discussion between Africare and their community partners with the objective of refining the project activities. If this transpires some of the weaknesses and threats identified in the SWOT exercises might be used as a starting point for these discussions. A summary of comments on project opportunities threats and weaknesses can also be found in annex 5 and may be used as a reference for dialogue between Africare and their clients. FIC, Tufts acknowledges that many of the issues and weaknesses identified during the assessment were beyond the control of Africare. For example the late distribution of inputs was directly related to the increasing difficulty of procuring these items in Zimbabwe, and this could not have been predicted when the project was formulated. The mid term visit and SWOT exercises revealed that there were some concerns about the targeting of project participants. One targeting concern was that some of the selected participants didn’t have the skills or draft animals to fully utilize the project inputs. In reality this represents a trade off as the most vulnerable members of the community are also those that are less likely to own draft animals or have the agronomy skills to maximize on the project inputs. Another targeting concern was that of exclusion. Africare had originally intended to work with two communities as opposed to four, and the inclusion of these two extra communities implied a reduction in the number of participants in the wards that were originally selected. This represents another trade off and one that applies to all types of humanitarian programming which in practical terms cannot hope to assist and include every member of a given community. Where resources are limited compromises do need to be made and there are no clear solutions to this dilemma; nevertheless where possible, greater efforts should be made to sensitize partner communities to the selection processes and criteria. Consistent with resource driven compromises and targeting exclusion concerns is the issue of resource allocation. The results from Njelele household interviews and the Focus Group Discussions indicate that the greatest project benefits were derived from
12 Lessons learned on the impact assessment process across all seven case studies will be documented in separate paper in early 2008.
48

the training activities. In Nemangwe the training component scored second (out of six). The training activities were also attended by a considerable number of non-project participants and may represent an opportunity to address some of the resource and targeting concerns mentioned. Again if there are plans to continue the project activities in Gokwe-South, the question of what portion of project resources be allocated to different project components is an issue worth exploring with the participating communities13. A ranking of the different project components by ward can be found in annex 6 and might also be used as reference material for stakeholder discussions on future programming.
13 Fifteen percent of the project budget was meant to be allocated towards M&E, although this is a considerably high proportion of a budget this is unique and one would expect between 3-5% of the budget to go towards data collection activities. Under this initiative 15% was allocated towards M&E with the objective of learning more about impact and developing the tools to measure impact. Nevertheless the question of what portion of a budget should be allocated towards M&E is an important one, as is the question of what kind of information is really needed and should be prioritized.
49

50
Endnotes
i Bill & Melinda Gates Foundation. (2005) Request for Proposals; Number GHS-05-01. Sub-Saharan Africa Famine Relief Effort “Close to the Brink, September 2005 ii Bill & Melinda Gates Foundation. (2005) Request for Proposals; Number GHS-05-01. Sub-Saharan Africa Famine Relief Effort “Close to the Brink, September 2005 iii Africare, Zimbabwe. (2005) Gokwe Integrated Recovery Action (GIRA); A proposal submitted to the Bill & Melinda Gates Foundation, October, 14th 2005 iv Africare, Zimbabwe. (2005) Gokwe Integrated Recovery Action (GIRA); A proposal submitted to the Bill & Melinda Gates Foundation, October, 14th 2005 v Africare, Zimbabwe. (2005) Gokwe Integrated Recovery Action (GIRA); A proposal submitted to the Bill & Melinda Gates Foundation, October, 14th 2005 vi ZIMVAC, (2005) Zimbabwe Rural Food Security and Vulnerability Assessments Report, June 2005 vii Africare, Zimbabwe. (2005) Gokwe Integrated Recovery Action (GIRA); A proposal submitted to the Bill & Melinda Gates Foundation, October, 14th 2005 viii Africare, Zimbabwe. (2005) Gokwe Integrated Recovery Action (GIRA); A proposal submitted to the Bill & Melinda Gates Foundation, October, 14th 2005 ix Africare, Zimbabwe. (2005) Gokwe Integrated Recovery Action (GIRA); A proposal submitted to the Bill & Melinda Gates Foundation, October, 14th 2005 x Nyamangara, J. (2006) Baseline Survey, Gokwe Integrated Recovery Action, Africare, Zimbabwe, February 2006. xi ZIMVAC, FEWSNET (2005) Zimbabwe Livelihoods Profiles (accessed on 02/08/07) available from http://www.fews.net/livelihoods/files/zw/profiling.pdf xii Nyamangara, J. (2006) Baseline Survey, Gokwe Integrated Recovery Action, Africare, Zimbabwe, February 2006. xiii xiii ZIMVAC, FEWSNET (2005) Zimbabwe Livelihoods Profiles (accessed on 02/08/07) available from http://www.fews.net/livelihoods/files/zw/profiling.pdf xiv xiv ZIMVAC, FEWSNET (2005) Zimbabwe Livelihoods Profiles (accessed on 02/08/07) available from http://www.fews.net/livelihoods/files/zw/profiling.pdf xvxvxv Nyamangara, J. (2006) Baseline Survey, Gokwe Integrated Recovery Action, Africare, Zimbabwe, February 2006.

51
Annexes Annex 1. Case Studies
Case Studies Case 1 Bova Primary School is in Njelele I Ward of Gokwe District. Mr. Bova Admore is the headmaster of the school and also a contact farmer with the Africare project. One of the project’s vegetable gardens is situated within the school compound and Mr. Bova is all praises for the project. But more important for him is the tangible change he has seen in the lives of the children and their parents since the beginning of the project. Before the project, parents had difficulty in paying fees, and many of them were in arrears; now, over 90% of the parents have paid their fees. He has also observed that the health of the pupils has improved greatly. Most of them are able to carry at least a snack to school made from the new soy bean dishes that their parents make such as soy cake. He has also observed children are healthier, more alert, and have new uniforms; something that their parents used to struggle to do before the project. His biggest cry now is that the project should find ways to help parents extract oil from the sunflower seed and not allow the farmers to be exploited by middle men and commercial oil extractors. He is also of the opinion that the project should be replicated within the ward to cover more farmers, as he believes it is a sure way of addressing the problem of poverty. Case 2 Kubatana Enterprises is one of the 25 project groups that have been trained in business development during the period of the project. The group of 20 members is based in Njelele East ward and is currently involved in peanut butter processing. Twice a week the agro-processing team meets at the home of the treasurer to collect ground nuts and process and package it into fine peanut butters using the two peanut butter machines donated to them by Africare. They process and package an average of 100 cans in a month most of the ground nuts sourced from the community. Each member of the project gets one bottle of peanut butter a month for their home consumption. The rest is sold at competitive prices in the community. For every 20 cans produced, the group donates one can to orphans in the community as a way of paying back for the processing machines. The group’s future plans is to acquire an electric peanut butter machine to increase output; they also have plans to move to a bigger rented property within the neighborhood where they can expand operations and buy peanuts from other non-project farmers in the community and thus provide a market for peanuts produced in the community. The PIA team was able to witness the processing since the PIA took place on a processing day. The group is also happy that Africare finally delivered the ram-press machine for pressing oil from sunflower. This will help to diversify the group’s production activities

52
Annex 2. Data Collection Tools To capture perceptions of the overall project benefits (figure 3.1), participants were asked to score a set of six frequently mentioned benefits (indicators) in order of importance by distributing twenty five counters between the six indicators. The indicator with the highest number of counters represented the most important project benefit, and the one with the lowest number of counters represented the least important benefit. To look at the changes in the household food basket (figures 3.4 and 3.5) - The participants were asked to distribute twenty five counters amongst the different food items being consumed within the household before the project. The same exercise was then repeated for after the project. The participants were then asked to explain and give reasons for any changes in the food basket. Visual aids were used to represent the different food sources. For example a head of sorghum might be placed in the basket representing that crop, a broad green leaf might be used to represent vegetables, and a simple picture of a hen on a card might be used to represent poultry production. The objective of this exercise was to capture any changes in diet (diversity), and the relative changes in the importance of different food items. The participants were then asked to explain any changes and these responses were recorded and tallied in the attribution tables. The same process was used to look at the changes in income and savings (figures 3.8 and 3.9) and expenditure (figures 3.10 and 3.11). For income sources seven frequently mentioned variables were used. This was followed up with a similar exercise on expenditure against some of the indicators identified by the community during the indicator collection exercises. For example the exercise looked at what proportion of income was being spent on school fees, farming implements, and livestock amongst other things. Again the participants were asked to explain any changes in expenditure, and these were recorded. The participants were also asked to show if there had been any increase or decrease in actual income since the project started (table 3.7). This was done by placing ten counters in one basket which represented their income before the project (2005). The participants were then given another ten counters and asked to show any relative changes in household income, by either adding counters to the original basket of ten, or removing them. So for example if someone were to add four counters to the original basket this would represent a forty percent increase in income. Alternatively if they were to remove four counters it would represent a forty percent decrease. The participants were then asked to account for these changes. The same exercise was done to see if there had been any increase or decrease in the (quantity) of the food basket (table 3.4). It was then repeated for crop production (figure 3.5) This exercise was done to show changes in production for those crops that were already being produced before the project. The objective of this exercise was to see if the drought tolerant seed varieties introduced by the project had resulted in greater yields. (The communities considered 2005 and 2007 as being comparable years so to some degree any positive impact on yields might be attributed to the improved seeds). Again the participants were asked to explain any changes. Another exercise looked at the ‘before’ and ‘after’ sources of maize and all other crops (Figure 3.7). Again twenty five counters were distributed amongst the following variables; (1) own production, (2) purchased,

53
(3) gift/relief and (4) other. The objective of this exercise was to capture any relative changes in the importance of these food sources. The participants were then asked to explain these changes. Identification of Community Impact Indicators Food and income benefits were identified as primary indicators of project impact (particularly the cash benefits). These indicators were initially collected in focus group discussions with project participants during the FIC, Tufts mid term visit to the GIRA project. This was done by asking project participants what benefits they expected from the project (considering their own significant investment in time and effort). The participants were then asked if these benefits were realized would they be good indicators of project impact. They were also asked to suggest any other possible indicators that would validate that the project had been beneficial to them. All the respondents contended that the expectation of “more cash in the pocket, and more food in the home” was the primary incentive for their participation. This slogan or slight variations on it was repeated in all seven locations visited during the mid term visit exercise. The participants were then asked how more food and cash would have an impact on their livelihoods, or what tangible benefits did they expect from these. The food security benefits were fairly straight forward - the expectation being that the household food basket would improve in terms of quality and quantity as a result of the project activities. This in turn would translate into better health and nutrition through diet diversity and an increase in the number of meals consumed per day, particularly during the lean season. Another expectation mentioned was an overall sense of wellbeing attributable to improved household food security. In order to better understand the expected income benefits, the participants were asked how they anticipated utilizing any project derived income (and savings). Again the project participants were asked to confirm if these benefits would serve as appropriate indicators of project impact. The indicators collected during the mid term visit were not ranked or scored, and so Africare followed up with a more systematic indicator selection exercise with approximately twelve percent of the participating project recipients. This was done with the objective of validating the indicators collected during the mid term visit, and ranking them in order of importance. This was done using a secret ballot, where the participants selected and wrote down what they perceived to be the single most important indicator of project impact. These were then tallied and disaggregated by gender.

54
Annex 3 Map of Gokwe South District
Source: Africare, 2005
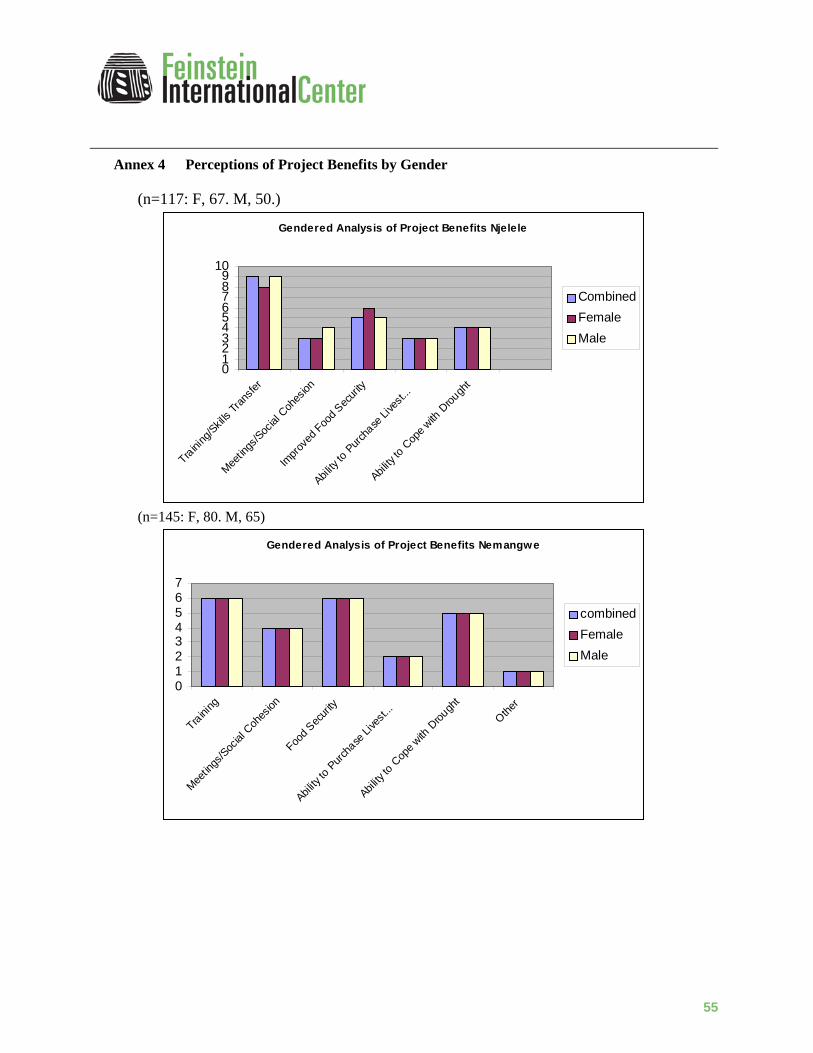
55
Annex 4 Perceptions of Project Benefits by Gender
(n=117: F, 67. M, 50.)
Gendered Analysis of Project Benefits Njelele
0123456789
10
Training
/Skills
Trans
fer
Meetin
gs/Soc
ial C
ohes
ion
Impro
ved F
ood S
ecuri
ty
Ability
to Purc
hase
Live
st...
Ability
to C
ope w
ith D
rough
t
CombinedFemaleMale
(n=145: F, 80. M, 65)
Gendered Analysis of Project Benefits Nemangwe
01234567
Training
Meetin
gs/Soc
ial C
ohes
ion
Food S
ecuri
ty
Ability
to Purc
hase
Live
st...
Ability
to C
ope w
ith D
rough
t
Other
combinedFemaleMale

56
Annex 5 Summary of Community Comments about the Project
Community Comments Njelele (n=8)
% of Total Comments
Nemangwe (n=8)
% of Total Comments
Late distribution of inputs and implements compromised outputs 7 21.88 10 24.39 Implements (ram press and peanut butter mill) were too few 5 15.63 2 4.88 Are there plans for more support since there was drought 5 15.63 10 24.39 No markets for our produce/ We need markets for our produce 1 3.13 3 7.32 Farm inputs such as fertilizer not supplied 6 18.75 3 7.32 Targeting of beneficiaries should be done better 4 12.50 1 2.44 Monitors should be supported with means of transport 1 3.13 1 2.44 Inputs and implements were not adequate 1 3.13 4 9.76 Implementation time was too short 0 0.00 2 4.88 Provide electric machines for value addition 0 0.00 5 12.20 Can we get livestock through this project? 1 3.13 0 0.00 Women have taken new roles due to the project - trade 1 3.13 0 0.00
TOTAL 32 100 41 100 Data derived from focus group discussions
Annex 6 Mean Score of Different Project Activities from Focus Group Discussions (ward
average) Component Njelele 1
(n=4) Njelele II
(n=4) Nemangwe II
(n=4) Nemangwe III
(n=4) Crop Production 5 10 6 8 Seed Multiplication 8 NA 8 7 Agro-Processing 12 4 10 10 Drip Irrigation NA 9 NA NA Data derived from Focus group discussions, project components were scored by distributing twenty five counters amongst the four different components. This distribution was agreed upon by consensus