impact damage detection in composite laminate … · impact damage detection in composite laminate...
TRANSCRIPT

7th ECCOMAS Thematic Conference on Smart Structures and Materials
SMART 2015
A.L. Araújo, C.A. Mota Soares, et al. (Editors)
© IDMEC 2015
IMPACT DAMAGE DETECTION IN COMPOSITE LAMINATE PLATES USING AN INTEGRATED PIEZOELECTRIC SENSOR AND ACTUATOR
COUPLE COMBINED WITH WAVELET-BASED FEATURES EXTRACTION APPROACH
Paolo Gaudenzi*, Davide Nardi*, Ilaria Chiappetta*, Sofiane Atek*, Luca Lampani*, Fabrizio Sarasini†,
Jacopo Tirillò†, Teodoro Valente†
*Department of Aerospace and Mechanical Engineering (DIMA), La Sapienza University of Rome
Via Eudossiana 18, Rome, Italy, 00184 [email protected]
†Department of Chemical Materials, Environmental Engineering (DICMA), La Sapienza University of Rome
Via Eudossiana 18, Rome, Italy, 00184 [email protected]
Key words: Structural health monitoring, Carbon-fibre-reinforced polymer, Low velocity impacts, Piezoelectric sensor patches, Wavelet Packet Transform, Linear Discriminant Analysis.
Summary: The identification of impact damage in composite laminates is a crucial issue for any structural health monitoring (SHM) program. In this paper, an experimental campaign developed for the delamination detection in carbon-fibre-reinforced polymer (CFRP) plates due to low velocity impacts (LVI) is presented. The damage identification concerns the detection of different damaged plates impacted with various energy values. The experimental procedure starts with the analysis of the suitable positions of the piezoelectric (PZT) sensor and actuator. A finite element model (FEM) of the laminated plate is implemented for the analysis of suitable areas for the location of the PZT devices. Then an algorithm based on the Wavelet packet transform (WPT) is applied to the vibrating dynamic response of the plate in order to extract Wavelet-based damage sensitive features, showing its considerable benefit with respect to Fourier-based damage detection. A Linear Discriminant Analysis (LDA) is then applied on the extracted features in order to build an efficient configurations classifier. A damage indicator based on the Euclidean distance is hence assessed by comparing the undamaged and damaged states. The obtained results show that the proposed pattern recognition procedure constitute a relevant SHM technique for structures subjected to LVI. 1 INTRODUCTION
Carbon-fibre-reinforced structures have been extensively used in the aeronautic and space industries over the last decades due to their prominent advantages with respect to other conventional materials, e.g. aluminium alloys, in terms of higher strength, higher stiffness and lower mass. However, composite material structures can undergo delaminations induced by low velocity impact (LVI) that are not observable from the surface layer and that can lead to a loss of structural performances throughout their service life [1].
A LVI damage can be considered as a combination of matrix cracking, delamination and fibre breakage, among which delamination represents a severe stiffness and strength degradation of the composite material [2].
In the past, several non-destructive testing (NDT) procedures were widely employed for impact damages in composite structures, such as acoustic emission [3], shearography and active

P. Gaudenzi, D. Nardi, I. Chiappetta, S. Atek, L. Lampani, F: Sarasini, J. Tirillò, T. Valente
2
thermography [4]. All of these techniques demand a priori knowledge of the damaged area and easy access to a specialist operator. It is clear that an in-service monitoring would result unfeasible [5].
In order to overcome such limitations, research has been focusing on the vibration-based NDT, taking advantage of the information contained in the dynamic vibration response of a structure, in terms of mass, stiffness and damping properties.
Since damage affects the physical properties of the structure, changes in the vibration response would hence indicate an effective state of damage. A depth investigation of vibration-based impact damage identification in composite plates can be found in [2]. This approach based on modal analysis features, namely the resonance frequencies, the modal damping ratios and the mode shapes, requires the installation of a proper number of sensors, e.g. accelerometers or piezoelectric patches. Moreover, it may not be always possible or feasible to measure the vibration response of the structure, and, even when that would be possible, a suitable modal-based damage sensitive model could be hard to obtain. In fact the extraction of local information due to small and localized damages from modal parameters, is not a smooth procedure [6]. A wavelet-based damage detection has been proven to provide more detailed information about non stationary signals which a Fourier-based approach would miss.
Basically, wavelet analysis consists of a breaking up of a vibration time-domain signal into a shifted and scaled type of a so-called mother wavelet [6]. The detection of discontinuities and breakdown points of data that are symptomatic of the presence of a localized damage, is successfully accomplished both with a continuous wavelet transform (CWT) - based approach and with a wavelet packet transform (WPT) - based approach on different types of test-structures, e.g. beams, plates and bridges, by using only one accelerometer [7], [8], [9].
A structural damage identification using piezoelectric sensors is carried out in [10] through a two-stage damage identification method. In order to properly detect the damage locations, the authors turned the numerical and experimental data in the time domain into the frequency domain.
The detection of crack damage in composite plates using embedded piezoelectric actuators/sensors is performed in [11] by means of a wavelet analysis. The proposed wavelet-based approach showed a better sensitivity with respect to a modal-based techniques in detecting small cracks.
Composite materials play a very critical role in the development of the technology of smart structures. In fact, the idea of a smart structure supposes the presence of different components in a structural system; the analogy with the different functions performed by the elements of a composite material is evident [12]. It is clear then, that the placement of piezoelectric actuators and sensors plays a key role in the design of the composite laminates conceived as smart structures. The best locations for piezo patches are those at which the mechanical curvature of the plate is the highest. Obviously it is uneasy to use one single actuator/sensor couple to examine a high number of modes of vibration and, basically, the larger is the number of modes that are to be controlled, the larger is the number of actuators and sensors needed, and less practical the approach becomes [13].
Finite element model is a useful tool for the extraction of the mode shapes of a dynamic system, in order to perform the best piezo placement strategy for taking into account the different curvature patterns of the selected mode shapes.
In this paper, the damage produced by LVI on CFRP composite plates is investigated. The laminates were realized in the laboratory of structural dynamics of the Department of Mechanical and Aerospace Engineering of Sapienza University of Rome (DIMA).
A pair of piezoelectric patches is placed on the surface of the laminates in order to realize an integrated actuation/sensing system. Such configuration is chosen since it represents a practical solution for an in-situ monitoring system of the health status of a structure, overcoming the complexity or the costs of a surveillance technique in real-world applications without prior indication of the presence of a potential damage.
A finite element model of the plate is implemented in order to select the proper positions for the piezoelectric patches for controlling the first four mode shapes.

P. Gaudenzi, D. Nardi, I. Chiappetta, S. Atek, L. Lampani, F: Sarasini, J. Tirillò, T. Valente
3
Three energies of impact are used for the experimental impact campaign performed in the Chemical, Material, Environmental Engineering Department of the Sapienza University of Rome (DICMA). The time-varying strain responses of the laminates are recorded before and after the impacts and are provided to a WPT-based algorithm for the identification of different damaged and undamaged configurations.
An additional NDT based on ultrasonic inspections is performed in order to effectively show the different delaminated area induced by different impact energies.
2 THEORETICAL BACKGROUND
2.1 Mathematical modelling of piezoelectric laminated composite plate Any description of the behaviour of a 3D piezo continuum body requires the identification of the
state variables of the physical system, which are the displacement vector at time t for each material point !!(!! , !) in its reference configuration in a Cartesian system (0, !!) (i=1,2,3), the strain represented by the linear part of the Green-Lagrange strain tensor !!,!(!! , !) and the Cauchy stress tensor !!,!(!! , !). The electrical variables are the electric potential !(!! , !), the electric field vector !(!! , !) and the vector of electric displacement !!(!! , !), representative of the flux of electric charge. On the piezo continuum act the body volume forces !!!(!! , !), the surface forces !!!(!! , !) and the imposed displacements !!∗(!! , !), by the surface charges !! !! , ! or the imposed electric potentials !∗ !! , ! [12]. The constitutive equations merge hence together the mechanical and the electrical behaviour that are apart represented in their own context.
In order to easily handle the physical behaviour of piezo material, the linear theory established by Voight for 3D piezoelectric continuum is assumed. Doing so, the equations describing the constitutive relations of a piezo body are given by:
!! = !!"!!! + !!"# !!" (1)
!!" = !!"#!! + !!"!!! !!!
(2)
where !! is the electric displacement (first-order tensor), !! is the electric field (first-order tensor), !!" is the stress (second-order tensor), !!" is the strain (second-order tensor), !!!" is the dielectricity (second-order tensor), !! !"!! is the elastic compliance (fourth-order tensor), !!"# is the piezoelectricity (strain) coefficient (third-order tensor) and i, j, h, k = 1, 2, 3. The superscript σ denotes that the dielectricity has been evaluated for zero stress, and superscript E denotes that the compliance has been evaluated at zero electrical field.
Equations (1) can be viewed as the sensor equation since, without an applied electrical field, it provides the charge per unit surface produced by the state of stress σ. On the other hand, equation (2) represents the actuator equation since it yields the strain produced by the electrical field with the mechanical strain produced by the applied stress.
In order to enhance the sensing and actuation mechanisms, in the absence of an electric field !, the stress ! plays a key role. Assuming a perfect bonding between the piezoelectric device and the surface of the laminate composite plates, the components of the stress second-order tensor can be expressed by means of the classical laminated plate theory (CLPT), based on the Kirchhoff assumptions [14]. A laminate constituted of N orthotropic layers with the principal material coordinates of the k-th lamina oriented at an angle !! to the laminate coordinate x is considered. The

P. Gaudenzi, D. Nardi, I. Chiappetta, S. Atek, L. Lampani, F: Sarasini, J. Tirillò, T. Valente
4
x-y plane is regarded as the undeformed mid-plane of the laminate with the z-axis taken positive upward from such a mid-plane.
The stress components result:
!!!!!!!!" !
=!!! !!" !!"!!" !!! !!"!!" !!" !!! !
!!!!
!!!!
!!"!+ !
!!!!!!!!"
(3)
where !!" represent the transformed reduced stiffnesses (m, n=1,2,6), !!!! , !!!! and !!!" the middle-surface strains, !!! , , !!! , and !!" the middle-surface curvatures, and z the coordinate through the k-th layers laminate thickness.
Although the CLPT adequately represents the kinematic behaviour of most laminates, in order to obtain a better representation of the plate kinematics, the generalized third-order shear deformation laminate theory (TSDT) can be used to get the governing equations of laminated plates with actuating and sensing layers. Further details can be found in [15].
2.2 Low Velocity Impact (LVI) damage mechanism in composite plates Even though composite materials provide appealing features for low-mass structural applications,
the damage produced by impacts is a very serious limitation. In fact LVIs are able to generate large areas of delamination, yielding to significant decrease of residual strength.
The ability of composites to tolerate plastic deformations is definitely limited such that the energy is often absorbed in creating large areas of fracture resulting in both strength and stiffness reduction [16]. The prediction of the post-impact load-bearing capability is another crucial characterization [17].
The analysis of the behaviour of composite laminates subjected to LVI is typically carried out with drop-weight set-up, where a weight is allowed to fall from a pre-determined height to strike the laminate clamped in the horizontal plane. If the impactor is properly instrumented, the force-time and force-displacement relations and the energy dissipation during the impact event can be determined [18].
Fractures tend to completely cross the thickness of the lamina where they are produced; they stop at the interface of laminae with different orientations and then they propagate as delamination of lenticular stretched-shape along the direction of the fibres of the lower lamina [19], see Figure 1.
Figure 1: LVI induced damages; referring to Tien-Wei S., Yu-Hao P. (2003) [20].
The genesis and the shape of the delaminations are subjects of noticeable significance. A possible
basic point is that the laminae tend to bend in different ways each other when subjected to a

P. Gaudenzi, D. Nardi, I. Chiappetta, S. Atek, L. Lampani, F: Sarasini, J. Tirillò, T. Valente
5
transverse load, due to their orthotropy [21]. In order to keep the consistency of the strain field, normal and shear stresses are then produced.
The mismatching coefficient M postulated in [21] is an index of the tendency to delamination between two adjacent laminae:
! =!!! !! − !!! !!!!! 0° − !!! 90°
(4)
where D11 is the term of the bending stiffness matrix and θb, θt are the orientations of the laminae above and below the intralaminar surface considered.
By means of equation (4) the shape assumed by the delaminations on the interlaminar surfaces is foreseen with good approximation and the influence of the type of reinforcing fibre and of the lamination sequence on the delaminations extension is further considered, i.e. the delamination between laminae with fibre aligned with the same orientation can not occur. More studies based on the relationship between the delamination area and the impact energy can be found in [22].
Delaminations are also source of possible failure in the case of compressive loading as described and modelled for istance in [23], [24], [25] and [26].
2.3 Wavelet transform-based signal processing
The vibrating time-domain response of the composite plates can be analysed through a wavelet transform-based analysis. Wavelet transform is based on basis functions formed by the dilation and the translation of a mother wavelet !(!), representing a reference function. The choice of different translations in time and scale continuous-parameters, i.e. τ and a respectively, leads to a short-duration high frequency and long-duration low-frequency family functions [27]:
!!,! ! ≡1!!
! − !! , ! > 0 , ! ∈ ℜ
(5)
From the Fourier transform, if
! ! ↔ Ψ Ω (6) carries the Fourier transform scaling property, then
1!!
!! ↔ !Ψ !Ω (7)
This means that a contraction in one domain (time/frequency) is coupled by an expansion in the other domain (time/frequency) in an uneven trend over the time-frequency plane. If a is greater than 1 the basis function becomes an extended version of the chosen mother wavelet, manifesting a low-frequency feature. On the other hand, if a is lower than 1 (but greater than 0) the basis function is a contracted version of the mother wavelet, showing a high-frequency feature.
The continuous wavelet transform (CWT) decomposes a time-domain signal into a 2-D function in the time-scale domain (a, τ):
Ψ !, ! ≡ ! ! !!,! ! !" (8)

P. Gaudenzi, D. Nardi, I. Chiappetta, S. Atek, L. Lampani, F: Sarasini, J. Tirillò, T. Valente
6
The CWT coefficient Ψ !, ! indicates the time-frequency essence in a signal defined by the scale and translation parameters. Therefore, a wavelet with large-scale parameter is associated to low-frequency content enabling to analyze signals with a wide duration function. On the contrary, short-duration function allows the analysis of high-frequency signals. The choice of scale and translation parameters based on power of two (dyadic scale), leads anyhow to an accurate time-frequency property wavelet function, reducing the amount of redundant data [27]:
!!,! ! ≡ 2!! ! 2!! − ! , !, ! ∈ ℤ (9)
The set of functions showed in (9) establish an orthonormal basis for L2 (ℜ) [28]. Every signal x(t) in L2 (ℜ) is then expressed in terms of the discrete wavelet transform (DWT):
! ! = !,!!,!!,!
!!,! ! (10)
An extensive discussion of the implementation of the DWT can be found in [28], [29] and [30]. One drawback inherent to the wavelet transform concerns the poor frequency resolution in the
high-frequency region. The analysis of signals having close high-frequency components finds thus some difficulties. In order to overcome such limitations the wavelet packets are employed as new bases due to their property of orthonormality and time-frequency localization, inherited for the corresponding wavelet functions.
A wavelet packet is a function indexed by three indices: integers j and k are interpreted as scale and translation parameters, respectively, and n is the modulation parameter:
!!,!! ! = 2!!!! 2!! − ! (11)
The wavelet packet coefficient of a generic signal g is calculated by taking the inner product of the signal and that particular basis function:
!!,!,! = !,!!,!! = ! ! !!,!! ! !" (12)
In other words, wavelet packet transform (WPT) decomposes the signal exploiting both the low-frequency components than the high-frequency components, producing an exhaustive collection of information with arbitrary time-frequency resolution.
Once the WPT is applied to the vibration data for the extraction of the relative time-frequency content, the wavelet packet node energy is selected as representative of the characteristics of the signal, emerging as its sensitive features. The wavelet packet node energy !!,! denotes the signal energy contained in a specific frequency band set by j and n parameters:
!!,! ≡ !!,!,!!
!
(13)
The proposed representation of the signal, in which every wavelet packet node energy value is a signal’s sensitive feature, provides a more robust tool for classification purposes, in contrast with a direct use of wavelet packet coefficients [27].
In this paper, an algorithm based on WPT is proposed for the identification of the undamaged and damaged configurations of composite laminate plates.

P. Gaudenzi, D. Nardi, I. Chiappetta, S. Atek, L. Lampani, F: Sarasini, J. Tirillò, T. Valente
7
4 EXPERIMENTAL PROCEDURE The performed experimental campaign involved seven main stages:
(i) the manufacturing of the composite plates, (ii) the preliminary investigation on piezo-patches suitable placement, (iii) the undamaged laminated plates vibration-response acquisition and characterization, (iv) the drop-weight impact tests, (v) the damaged laminated plates vibration-response acquisition and characterization, (vi) the vibration-based damage sensitive features extraction for the classification of the damaged configurations and (vii) the ultrasound delaminations inspection. Three laminated composite plates were employed for the impact tests.
All the stages are performed in the Smart Structures Laboratory (SSL) of the DIMA except the drop-weight impact test that is realized at the DICMA.
4.1 Manufacturing of the composite plates The dry lay-up process is the manufacturing process employed in this work for specimens
realization [31]. Cutting, laminating and curing cycle are the three main phases referred to such process. The curing phase is performed in the autoclave of DIMA.
In order to develop an active structural sensing diagnostic of the composite structures a built in network of piezoceramics sensors can be considered for the generation of known and controlled inputs signals to excite the structure and then record its response [32].
The manufacturing of three composite plates realized in this experimental campaign regards an active system with attached piezoelectric actuator and sensor onto the composite specimens through a non-conductive glue for insulation purposes.
4.2 Suitable piezoelectric sensor/actuator placement: finite element model approach Piezoelectric patches are slim and can be easily integrated on structures allowing the chance of an
automated online SHM system [33]. In this work two piezo-patches are placed on the same surface of the plate: one piezo-patch
provides the structural excitation while a second piezo-patch picks up the vibration response. A proper glue is used in order to prevent the electrically short-circuit of the piezo-patches caused by the graphite fibres.
The dynamic response of three plates subjected to three different impact energies is acquired in order to extract meaningful vibration-based damage parameters. The proper geometrical position that would permit a good employment of the piezo devices as actuator as well as sensor is that related to the high average strain region away from zero strain areas. Such “strain nodes” are obtained twice differentiating the analytic expressions of the structure’s mode shapes and then identifying the zero-crossing area of the resulting functions [34]. The proposed study is limited to the first four resonance modes.
The finite element model of the unidirectional Carbon/Epoxy plate is developed with Patran/Nastran software in order to employ the curvature mode shape functions as significant feature for the best piezo location. The plate is modelled defining a rectangular 2D surface and a 2D linearly elastic orthotropic material is used. The material properties are shown in Table 1. Modal damping ratio is not considered: such value can be obtained from experimental modal testing.
According to ASTM-D7136 standard procedure, the dimension and stacking sequence of the laminate are reported in Table 2. The laminate coordinate system is considered coinciding with the geometrical one, therefore longitudinal direction is aligned with the x-axis, while transverse direction is aligned with the y-axis (see Figure 2 and Table 2).

P. Gaudenzi, D. Nardi, I. Chiappetta, S. Atek, L. Lampani, F: Sarasini, J. Tirillò, T. Valente
8
E1 (Pa) 1.25 x10¹¹
E2 (Pa) 1.05 x10¹⁰
ν12 0.3 G12 (Pa) 5.25 x10⁹
G23 (Pa) 3.48 x10⁹
G31 (Pa) 5.25 x10⁹
ρ (Kg m-3) 1511
Length (cm) b=15 Width (cm) a=10 Thickness (cm) t=0.4 Number of plies n=16 Laminate stacking sequence [45°/0°/-45°/90°]2S
Table 1: Properties of the Carbon/Epoxy lamina.
Table 2: Composite laminate model.
After geometrical and mechanical properties definition, the mesh is created subdividing a and b in 20 and 40 segments, respectively. The plate elements used are the QUAD4 in order to consider both membrane than bending behaviour. Free-free boundary conditions are assumed, due to their experimentally high reproducibility level. The resultant resonance frequencies of the first four modes are reported in Table 3.
The eigenvectors of the modes are then evaluated. It results that, for the considered modes, the z-component is the most important component with respect to x and y components (about ten orders of magnitude higher). Therefore, the membrane contribution to the stress/strain field can be neglected, such that the bending behaviour only is considered to maximize the strain field, according to (3).
From the z-component eigenvectors values, a MatLab surface fitting tool is used to perform mode shape surfaces approximation through 2D polynomial functions of properly selected rank, in order to achieve the best surfaces approximation. Then an average surface curvature [35] is computed from the second derivatives of the approximated mode shapes:
!!"#$!%# = !! + !! (14) A 4th order 2D polynomial and a 5th order 2D polynomial are chosen for the first three modes and
for the fourth, respectively. Figures 3, 4, 5 and 6 show the polynomial surface approximation of the four modes and their average curvatures. The position of the piezo-patches has to guarantee a non-zero value of the computed average curvature of the four considered modes. Furthermore they have to ensure adequate sensing and actuation conditions.
Of course, employing one device only for both actuation than sensing a compromise solution becomes necessary. In addition, the central region of the laminated plate must be avoided because in this region the impact will occur according to ASTM-D7136 and the long edges too, due to the standard impact support fixture.
Figure 2: Finite element model of the composite laminate:
stacking sequence (above) and geometrical dimensions (below).
f 1 (Hz) f 2 (Hz) f 3 (Hz) f 4 (Hz)
993.13 1115.08 2189.35 2272.11
Table 3: Resonance frequencies of the numerical plate
model.

P. Gaudenzi, D. Nardi, I. Chiappetta, S. Atek, L. Lampani, F: Sarasini, J. Tirillò, T. Valente
9
Based on the obtained graphs and the previous assumptions, the position of the centre of the piezo-actuator was estimated to (x,y)=(1,5) cm, while the position of the centre of piezo-sensor was set to (x,y)=(14,9) cm, see Figure 7. The issue of the placement of piezo-devices on a thin plate is very crucial. Significant considerations are reported in [36] and [37], just to cite a few. The choice of the piezo-patches position presented in this work is based on a visual approach. More detailed investigations will be carried out in order to determine the optimal devices positions. The piezo devices are square patches of length equal to 1 cm and a thickness of 0.2 mm.
Figure 3: First mode shape surface fitting (left) and average curvature (right).
Figure 4: Second mode shape surface fitting (left) and average curvature (right).
Figure 5: Third mode shape surface fitting (left) and average curvature (right).

P. Gaudenzi, D. Nardi, I. Chiappetta, S. Atek, L. Lampani, F: Sarasini, J. Tirillò, T. Valente
10
Figure 6: Fourth mode shape surface fitting (left) and average curvature (right).
Figure 7: Piezo-patches placement.
4.3 Experimental set-up description Due to its higher test reproducibility level, a completely free-free plate configuration is chosen.
Elastic bands are used to hang the plates on a steel rigid bar. LMS TestLab software is employed to characterize the dynamic of the laminates. LMS SCADAS hardware and a signal amplifier complete the experimental system. A sketch of the described elements is shown in Figure 8.
Figure 8: Experimental set-up.
Type Random Level (V) 100 Bandwidth (Hz) 3200 Spectral Lines 2048 Resolution (Hz) 1.57
Table 4: LMS TestLab input excitation
signal characteristic.
The parameters of the dynamic actuation of the three laminated plates are reported in Table 4. For each analysed plate (C1, C2, C3) two configurations (before and after the impact) are considered. For

P. Gaudenzi, D. Nardi, I. Chiappetta, S. Atek, L. Lampani, F: Sarasini, J. Tirillò, T. Valente
11
each configuration, twenty time-histories and twenty frequency response functions (FRFs) are acquired (see Table 5), in order to deal with a significant statistical procedure.
C1 C1
Undamaged Damaged
20 time-histories, 20 FRF 20 time-histories, 20 FRF
C2 C2
Undamaged Damaged
20 time-histories, 20 FRF 20 time-histories, 20 FRF
C3 C3
Undamaged Damaged
20 time-histories, 20 FRF 20 time-histories, 20 FRF
Table 5: Experimental configurations and acquisitions
4.4 Drop-weight impact tests The drop-weight tests are performed in cooperation with DICMA by means of the CEAST 9340, a
floor standing impact system designed to release impact energies between 0.3 and 405 Joule. Impact energy values considered in this study are equal to 20 Joule for C1 plate, 12 Joule for C3 plate and 8 Joule for C2 plate. The characteristics of the impactor are shown in Table 6.
Shape emispherical Mass (Kg) 5.5 Diameter (mm) 16 Hardness (HRC) 60
Table 6: Impactor characteristics.
Table 7 reports a detailed description of the conducted impact test.
Specimens C1 C2 C3 Impact Energy (J) 20 8 12 Nominal Impact Velocity (m/s) 2.697 1.706 2.089 Nominal Impact Height (mm) 371 148 222 Peak Force (N) 8470.646 5161.103 6419.090 Damage Force (N) 36.498 14.887 15.195 Peak Energy (J) 19.74 8.092 12.033 Peak Displacement (mm) 4.325 2.707 3.463 Total Displacement (mm) 1.024 0.363 0.478
Table 7: Impact tests characteristics.
5 DAMAGE SENSITIVE FEATURES
5.1 Resonance frequencies shift The damage detection based on modal analysis is here only performed through the comparison of
the first four resonance frequencies f. These values are readily obtained with the peak-picking

P. Gaudenzi, D. Nardi, I. Chiappetta, S. Atek, L. Lampani, F: Sarasini, J. Tirillò, T. Valente
12
method [38] and can be employed for an online fast and cost-effective structural health monitoring procedure. However, the peak-picking method relies on the FRF peak values, which are affected by the employed frequency resolution. In this context the modal damping ratios computation would result more negatively affected from such drawback with respect to the identification of the resonance frequencies. Moreover, the analysis of the variation of the mode shapes would not lead to a damage detection as prompt as the damage detection provided by the resonance frequencies, not to mention the demanding of a proper number of sensors. Hence modal damping ratios and mode shapes variation are not considered in the present work as damage sensitive features.
The average FRFs computed from the twenty samples recorded before and after the impact of the three composite plates are shown in Figures 9, 10 and 11. The corresponding values are summarized in Table 8. Table 9 exhibits the absolute frequency percentage variation before and after the impacts.
Although the three composite plates are realized with standard geometrical dimensions and with the same material, the resonance frequencies values of the undamaged composite plates reported in Table 8 are different. Such difference can be sought in the cutting and in the laminating phases, both done manually. Anyhow, the mode shapes analysis is not affected. Moreover, the resonance frequencies are lower than those obtained from the numerical model (see Table 3) due to the presence of the piezo-patches.
The identification of a damage condition from the values of FRFs can be easily done for a considerable impact energy, i.e. 20 Joule. However, such result can be achieved for the third and the fourth mode only; the frequency shift for the first and the second mode is not prominent due to the limitation induced by the employed frequency resolution (see Tab. 8).
Considering lower impact energies, i.e. 12 Joule and 8 Joule, the frequency shift becomes smaller even for higher modes. Moreover, the absolute variation of all modes of all specimens is less than 1% (see Tab. 9). The resonance frequency change is not hence a suitable damage sensitive feature for the analysed induced damages.
Figure 9: Comparison between the average FRF of C1 undamaged (blue) and damaged (red).
Figure 10: Comparison between the average FRF of C2 undamaged (blue) and damaged (red).

P. Gaudenzi, D. Nardi, I. Chiappetta, S. Atek, L. Lampani, F: Sarasini, J. Tirillò, T. Valente
13
Figure 11: Comparison between the average FRF of C3 undamaged (blue) and damaged (red).
!! [Hz] !! [Hz] !! [Hz] !! [Hz] C1 pre-impact C1 post-impact (20 J)
985.6 986.3
1095.0 1094.7
2182.0 2167.5
2259.0 2246.4
C2 pre-impact C2 post-impact (8 J)
972.9 972.8
1090.5 1093.9
2142.2 2142.0
2216.1 2213.8
C3 pre-impact C3 post-impact (12 J)
971.6 971.6
1084.0 1086.3
2150.0 2151.3
2213.0 2213.5
Table 8: Average resonance frequencies of the composite plates before and after impact.
Δf1 (%) Δf2 (%) Δf3 (%) Δf4 (%)
C1 (20 J) 0.071 0.027 0.669 0.561 C2 (8 J) 0.010 0.312 0.009 0.104
C3 (12 J) 0 0.212 0.060 0.023
Table 9: Absolute percentage variation of the resonance frequencies of the undamaged and damaged plates.
5.2 Energy of wavelet packets The wavelet transform-based damage detection is proposed in order to overcome the limitations of
the resonance frequencies-based detection. The overall acquired time-histories are used to build a Wavelet Packet Tree (WPT) [39] with the corresponding energy of the wavelet packets. Each time signal is decomposed in 64 packets, i.e. 64 sub-signals, until the 6th level by setting the modulation parameter n to 6 (26 =64).
The wavelet function used in this paper is the Daubechies 4 (db4), which belongs to the Daubechies’s wavelet family employed in [11] for the crack damage in composite plates.
If the energy of the packets are directly considered as damage sensitive feature, it can be observed that the weight of each packet in defining the pattern recognition is in fact quite similar for all configurations (see Fig. 12), preventing an effective detection of the different configurations. It is therefore apparent that a classifier which associates directly the energy of the packets extracted from
Figure 12: Comparison between the average FRF of C1 undamaged (blue) and damaged (red). 12: Comparison between the average FRF of C1 undamaged (blue) and damaged (red).

P. Gaudenzi, D. Nardi, I. Chiappetta, S. Atek, L. Lampani, F: Sarasini, J. Tirillò, T. Valente
14
an "unknown" examined damaged configuration with the energy associated to the packets of a pattern built on reference configurations, would not result efficient, showing too many false positives, namely the most misleading results in a SHM procedure.
In order to increase the efficiency of a pattern recognition algorithm it is thus necessary to increase separability among classes (or configurations) so as to reduce the dimensionality of the problem. In this context, Linear Discriminant Analysis (LDA) is used to build a more effective classifier acting on the separability and on the dimensionality criteria.
Figure 12: Wavelet packet energy distribution.
5.2.1 Linear Discriminant Analysis (LDA)
The ability of classifying models in different classes (or configurations) is based on the hypothesis that different classes occupy distinct regions in the pattern space, in the present case the space of the energy of wavelet packets.
Intuitively, if classes are clearly separated, the chance of a positive recognition in the space of the pattern is higher. A procedure sharing this logic is based on the computation of a between-classes covariance matrix and of a within-classes covariance matrix.
The LDA approach consists in finding linear transformation that projects the samples of each class into a new sub-space of lower dimension where variability of data belonging to the same class is the smallest possible, ensuring at the same time the maximum dispersion among data of different classes. We can identify three different scatter matrices [4]: the class scatter matrix
!
Sc , the within-class scatter matrix
!
Sw and the between-class scatter matrix
!
Sb . The first one is defined as:
Sc =1Nc
xci !mci( ) xci !mc
i( )T
i=1
Nc
" (15)
where c is the number of classes,
!
xci is the sample vector belonging to class c, Nc is the number of
samples in class c and
!
mci =
1Nc
xcii=1
Nc
" is the mean vector of class c.
!
Sc expresses the scatter of the samples belonging to the same class (configuration). The within-class scatter matrix
!
Sw is the p-class probability weighted summation of previously defined class scatter matrix:

P. Gaudenzi, D. Nardi, I. Chiappetta, S. Atek, L. Lampani, F: Sarasini, J. Tirillò, T. Valente
15
Sw = pcSci=1
Nc
! (16)
!
Sb is defined as:
Sb = pc mc !m0( )c=1
L
" mc !m0( )T (17)
where
!
m0 is the weighted mean vector of the means, c is the number of classes, L is the total number of classes and pc is the probability of class c.
!
Sb expresses the scattering of mean vectors of classes with respect to the mean vector of the mean vectors (mixture mean).
Considering the product between the inverse matrix of
!
Sw and the matrix
!
Sb we obtain a 64x64 matrix (due to the choice of n=6) called V:
V = S!1w Sb (18)
Matrix V can be thought as the ratio of the scatter between classes and scatter within the same class. The classification procedure results to be efficient if the value of the scatter of samples collected between classes is large and, simultaneously, such value is small within every class. It is demonstrated [14] that the variables which maximize the discriminant power of the classifier (or, in other words, which maximize separability among classes) are the eigenvalues/eigenvectors of the matrix V. The eigenvectors of V are reported in matrix
!
A :
A64x64 =
! (1)v1 ... ... ! (64)v1
... ... ... ...
... ... ... ...! (1)v64 ... ... ! (64)v64
!
"
#####
$
%
&&&&&
(19)
Matrix
!
A ensures a shifting of the starting variables (the energy of packets of each class) in a sub-space in which separability among classes is highest. As long as 64 energy packets decomposition (6th level) are set, each experimental configuration is then described by a 64 components vector.
It is obviously desirable to work with a lower number of components without losing relevant information. In this sense, since any eigenvalue (with the corresponding eigenvector) is an index of the energy content of the whole process, a number of eigenvectors corresponding to an energy level assumed as satisfactory is chosen. It can be observed from Figure 13 that if the first 3 eigenvalues are considered in order to deal with a lower number of data, the energy content of the process is approximately 96% of the energy of the whole process, while it reaches 100% when the first 5 eigenvalues are taken into account. The selected eigenvalues represent hence the effective features. The space of reduced variables is then obtained from the
!
A matrix selecting the rows and the columns of the first P eigenvectors.

P. Gaudenzi, D. Nardi, I. Chiappetta, S. Atek, L. Lampani, F: Sarasini, J. Tirillò, T. Valente
16
Figure 13: Normalized cumulative energy content – 64 wavelet packets.
The resulting matrix called
!
T, is thus the 64xP matrix
T64xP =
! (1)v1 ... ! (P )v1
... ... ...
... ... ...! (1)v64 ... ! (P )v64
!
"
#####
$
%
&&&&&
(20)
5.2.2 Classification operations Separability of configurations’ samples (in terms of energy packets) is maximized within the sub-
space defined by the matrix
!
T and the dimensionality of the problem is associated with the preset energy level. The vectors containing the number of samples are then projected in this newly sub-space.
Classification operations consist in: (i) implementation of a new database taking the mean matrices (in the eigenvector reduced space) of each configuration; (ii) definition of ten matrices identical to that generated in
!
T sub-space; (iii) estimation of the difference between the transpose of each of the ten unknown matrices, defined in point (ii), and the transpose matrix of the reference database (defined in point (i)) holding the samples of all configurations, and normalized to unity. These matrices represent the normalized Euclidean distance between the unknown matrices and the reference database matrix. Such quantity is adopted to classify every unknown vector within a class as:
Dk =dk
max dk( )=
ai,k ! gi( )2i
P
"max dk( )
(21)
where
!
a is the unknown reduced configuration vectors,
!
g is the vector of pattern, and
!
d is the distance vector related to the kth vector of pattern. Finally, the last phase of the classification operation consists in (iv) estimating the minimum value for each configuration of the structure, one
P. Gaudenzi, D. Nardi, I. Chiappetta, S. Atek, L. Lampani, F: Sarasini, J. Tirillò, T. Valente
17
for every column. According to the minimum distance, the algorithm matches all the distances with the belonging configuration. To further clarify the described approach, it must be emphasized that the concept of successful percentage has a real meaning only during the algorithm testing phase, where perfect knowledge of the samples provided to the algorithm is possible.
5.2.3 Results The undamaged and damaged configurations of the three composite plates are the structural layout
to be identified. The classification results are expressed in terms of correct percentage identification, as reported in the last section.
Two cases are considered: in the former the number of eigenvalues selected is 3, while in the second one 5 eigenvalues are selected. In both of them the number of wavelet packets is set to 64. The training set is an additional parameter used to ascertain changes in the success percentage of the identification process when a lower number of samples is considered (5,10,15 or 20). Results reported in Table 10 and 11, show that a higher number of samples, i.e. the value of the training set, produce higher identification percentages.
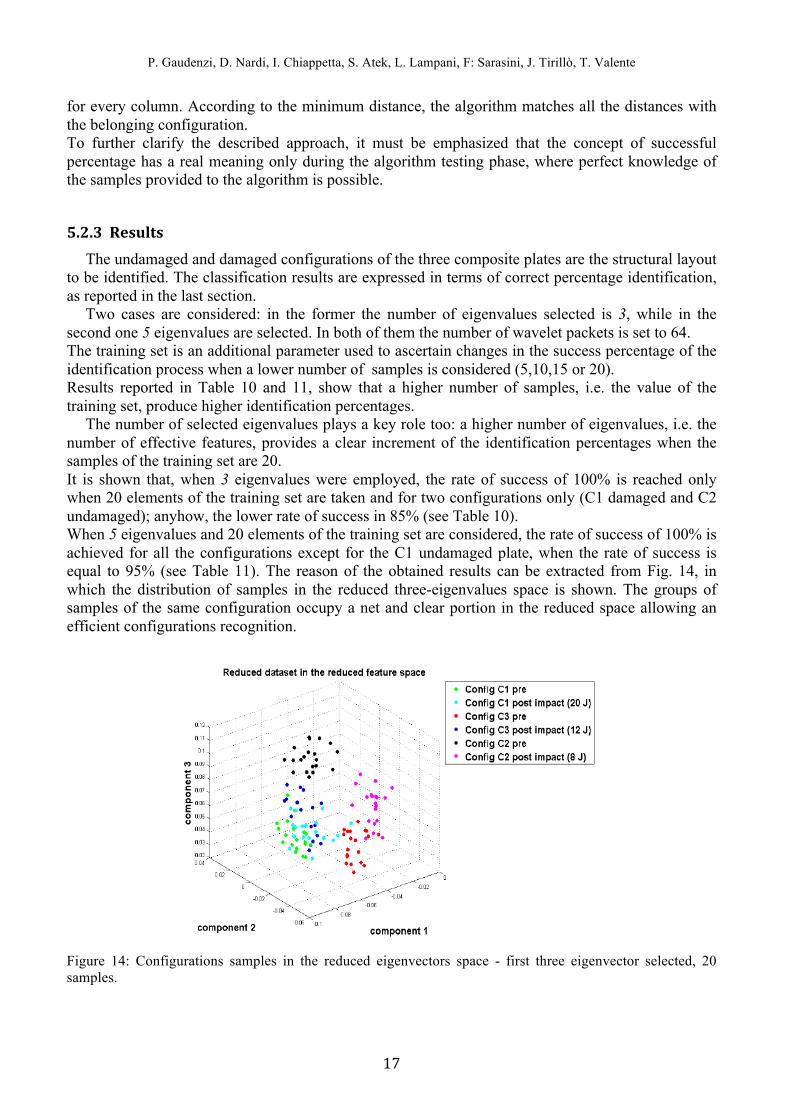
The number of selected eigenvalues plays a key role too: a higher number of eigenvalues, i.e. the number of effective features, provides a clear increment of the identification percentages when the samples of the training set are 20. It is shown that, when 3 eigenvalues were employed, the rate of success of 100% is reached only when 20 elements of the training set are taken and for two configurations only (C1 damaged and C2 undamaged); anyhow, the lower rate of success in 85% (see Table 10). When 5 eigenvalues and 20 elements of the training set are considered, the rate of success of 100% is achieved for all the configurations except for the C1 undamaged plate, when the rate of success is equal to 95% (see Table 11). The reason of the obtained results can be extracted from Fig. 14, in which the distribution of samples in the reduced three-eigenvalues space is shown. The groups of samples of the same configuration occupy a net and clear portion in the reduced space allowing an efficient configurations recognition.
Figure 14: Configurations samples in the reduced eigenvectors space - first three eigenvector selected, 20 samples.

P. Gaudenzi, D. Nardi, I. Chiappetta, S. Atek, L. Lampani, F: Sarasini, J. Tirillò, T. Valente
18
Since the number of eigenvalues is related to the process energy content, selecting a greater number of eigenvalues would not yield to a better identification percentages, due to the fact that the 100% of the energy of the whole process is already obtained with the first 5 eigenvalues. Wavelet packets
64
Effective features
3
Elements of Training Set
5 10 15 20 Correct Identification (%) of the configurations
C1 undamaged 45 70 80 95 C1 damaged (20 J) 50 65 75 100 C2 undamaged 55 60 85 100 C2 damaged (8 J) 35 70 75 85 C3 undamaged 45 65 75 95 C3 damaged 30 60 95 90
Table 10: Configurations identification results - 64 Wavelet packets, 3 effective features.
6 ULTRASOUND INSPECTION OF THE DAMAGED COMPOSITE PLATES In order to assure the effective damage state of each specimen, ultrasonic inspection are also
performed and C-Scan images are obtained. The effectiveness of Ultrasonic Non-Destructive technique in identifying damage delamination extension is shown in [40]. Figures 15, 16 and 17 show the levels of impact induced damages for the three considered composite plates. It can be noticed that the area of delamination increases with higher impact energies. Therefore the proposed wavelet analysis-based method has proved to be able to classify different delaminated plate configurations even with low levels of damage. Wavelet packets
64
Effective features
5
Elements of Training Set
5 10 15 20 Correct Identification (%) of the configurations
C1 undamaged 55 70 80 95 C1 damaged (20 J) 55 65 80 100 C2 undamaged 50 65 85 100 C2 damaged (8 J) 35 65 75 100 C3 undamaged 40 65 75 100 C3 damaged 35 60 90 100
Table 11: Configurations identification results - 64 Wavelet packets, 5 effective features.

P. Gaudenzi, D. Nardi, I. Chiappetta, S. Atek, L. Lampani, F: Sarasini, J. Tirillò, T. Valente
19
Figure 15, C-Scan specimen C1 – 20 J
Figure 16: C-Scan specimen C3 – 12 J.
Figure 17: C-Scan specimen C2 – 8 J.
The delamination areas are reported in Table 12. C1 (20 J) C3 (12 J) C2 (8 J)
Area (mm2) 1299.9 741.6 429.4 Perimeter (mm) 141.2 99.1 75.4
Table 12: Delamination area and perimeter of the composite specimen.
7 CONCLUSIONS In this paper a Wavelet Packet Transform-based approach is successfully used to extract damage
sensitive features within a SHM procedure performed on a CFRP composite plates. In particular, the energy related to each wavelet packet is employed as damage sensitive feature to correlate impact damage-induced changes in the structural configurations with the change of the energy content of the dynamic structural response signal x(t) decomposed through WPT. In this context, the first four resonance frequencies of the undamaged and damaged composite plates were analysed showing their inability for the identification of the proposed damaged pattern.
A statistical processing of such energies by means of Linear Discriminant Analysis is carried out to increase the discriminant power of the extracted wavelet packets. The damage considered is the delamination induced by three impact tests with different energy levels: 20 Joule, 8 Joule and 12 Joule, respectively. A preliminary investigation on the proper placement of piezoelectric devices on the composite structures for actuation and sensing purposes is conducted by means of a dedicated finite element model. The average strain curvature is considered as placement-sensitive feature.
The proposed identification procedure shows satisfactory percentages of success for the delamination-induced damage in composite plates.

P. Gaudenzi, D. Nardi, I. Chiappetta, S. Atek, L. Lampani, F: Sarasini, J. Tirillò, T. Valente
20
An initialization phase characterized by the identification of known damaged configuration is necessary to train the used algorithm.
Results obtained show the accuracy, cost-effectiveness and non-destructive nature of the proposed technique. The system emerges appealing for large-scale applications and for the certification and testing of high performances materials. The adopted piezoelectric smart technology can be employed for active and on-line detection of composite delamination without using external excitation equipment.
Future developments may involve the extension of such procedure to lower impact energies, the identification of the location where the impact occurs and the choice of the optimal wavelet functions to enhance the proposed SHM approach, in order to extend this methodology to a large full-scale composite structures, such as those employed in new generation airplanes.
REFERENCES [1] M. Lin, F.K. Chang, The manufacture of composite structures with a built-in network of piezoceramics. Composite Science and Technology 62 (2002) 919-939; [2] M.A. Perez, L.Gil, S. Oller, Impact damage identification in composite laminates using vibration teting. Composite Structures 108 (2014) 267-276; [3] I.M. De Rosa, C. Santulli, F. Sarasini, Acoustic emission for monitoring the mechanical behaviour of natural fibre composite: A literature review. Composite: Part A 40 (2009) 1456-1469; [4] Y. Hung, Y. Chen, S. Ng, L. Liu, Y. Huang, B. Luk, et al., Review and comparison of shearography and active thermography for nondestructive evaluation. Material Science and Engineering R 64 (2009) 73-112 ; [5] S.W. Doebling, C.R. Farrar, M.B. Prime, D.W. Shevitz, Damage identification and health monitoring of structural and mechanical system from changes in their vibration characteristics: a literature review. Los Alamos National Laboratory report, 2004; [6] H. Kim, H. Melhem, Damage detection of structures by wavelet analysis. Engineering Structures 26 (2004) 347-362; [7] M. Rucka, K. Wilde, Application of continuous wavelet transform in vibration based damage detection method for beams and plates. Journal of Sound and Vibration 297 (2006) 536-550; [8] Z. Sun, C.C. Chang, Structural damage assessment based on wavelet packet transform. J. Struct. Engineering (2002); 128 (10): 1354-61; [9] G. Facchini, L. Bernardini, S. Atek, P. Gaudenzi, Use of the wavelet packet transform for pattern recognition in a structural health monitoring application. Journal of Intelligent Material Systems and Structures, 2014; [10] H. Fukunaga, N. Hu, F-K. Chang, Structual damage identification using piezoelectric sensors. International Journal of Solids and Structures 39 (2002) 393-418; [11] Y.J. Yan, L.H. Yam, Online detection of crack damage in composite plates using embedded piezoelectric actuators/sensors and wavelet analysis. Composite Structures 58 (2002) 29-38; [12] P. Gaudenzi, Smart Structures. Physical behaviour, mathematical modelling and applications. Wiley 2009; [13] Y.H. Lim, Finite-element simulation of closed loop vibration control of a smart plate under transient loading. Smart Materials and Structures 12 (2003) 272-286; [14] R. M. Jones, Mechanics Of Composite Materials. Taylor and Francis, 1998; [15] J.N. Reddy, Mechanics of laminated plates: theory and analysis. CRC Press 1997; [16] P.W. Manders, W.C. Harris, A parametric study of composite performance in compression-after-impact testing. SAMPE Journal 22, 47-51, 1986; [17] J.G. Avery, Design Manual for Impact Damage Tolerant Aircraft Structures. AGARDograph No 23, NATO, 1981; [18] W.J. Cantwell, J. Morton, The impact resistance of composite materials – a review. Composites, Vol. 22, 347-362, 1991;

P. Gaudenzi, D. Nardi, I. Chiappetta, S. Atek, L. Lampani, F: Sarasini, J. Tirillò, T. Valente
21
[19] S. Abrate, Impact on composite structures. Cambridge University Press, 1998; [20] S. Tien-Wei, P. Yu-Hao, Impact resistance and damage characteristics of composite laminates. Compos. Struct. 62, 193–203, 2003; [21] D. Liu, Impact-induced delamination – A view of bending stiffness mismatching. Journal of Composite Materials, Vol. 22, 674-92, 1988; [22] W.J. Cantwell, J. Morton, The influence of varying projectile mass on the impact response of CFRP. Composite Structure, Vol. 12, 101-114, 1989; [23] P. Gaudenzi, On delamination buckling of composite laminates under compressive loading. Composite Structures, Vol. 36, No. 1-2, 21-30, 1997; [24] R. Barboni, R. Carbonaro, P. Gaudenzi, The Effects of Delaminations on the Fatigue Behavior of Composite Structures. Journal of Composite Material, Vol. 33, No. 3, 1999; [25] P. Gaudenzi, P. Perugini, F. Spadaccia, Post-buckling analysis of a delaminated composite plate under compression. Composite Structures, Vol. 40, No. 3-4, 231.238, 1998; [26] P. Gaudenzi, P. Perugini, A. Riccio, Post-buckling behaviour of composite panels in the presence of unstable delaminations. Composite Structures, Vol. 51, 301-309, 2001; [27] G. Yen, K.C. Lin, Wavelet Packet Feature Extraction for Vibration Monitoring. IEEE Transactions on Industrial Electronics, Vol. 47, No. 3, 2000; [28] I. Daubechies, Orthonormal bases of compactly supported wavelets. Communications on Pure and Apllied Mathematics, Vol. 41, Issue 7, 909-996, 1988; [29] S. G. Mallat, A theory for multiresolution signal decomposition: The wavelet representation. IEEE Trans. Pattern Anal. Machine Intell., Vol 11, 674-693, 1989; [30] A.N. Akansu, R.A. Haddad, Multiresolution Signal Decomposition: Transforms, Subbands, Wavelets. New York: Academic, 1992; [31]P.K. Mallick, Fiber-Reinforced Composites: Materials, Manufacturing and Design. Taylor and Francis Group, 2007; [32] M.Lin, F.K. Chang, The manufacture of composite structures with a built-in network of piezoceramics. Composite Science and Technology, Vol.62, 919-939, 2002; [33] Y. Lu, Z. Su, Crack identification in aluminum plates using Lamb wave signals of a PZT sensor network. Smart Materials and Structures 15, 839-849, 2006; [34] E. F. Crawley, J. De Luis, Use of Piezoelectric Actuators as Elements of Intelligent Structures. AIAA Journal, Vol. 25, No. 10, 1987; [35] S. Timoshenko, S. Woinowsky-Krieger, Theory of plates and shells. McGraw-Hill 2nd edition, 1987; [36] E. K. Dimitriadis, C. R. Fuller, C. A. Rogers, Piezoelectric Actuators for Distributed Vibration Excitation of Thin Plates. Journal of Vibration and Acoustic, Vol. 113, 100-107, 1991; [37] D. Halim, S. O. Reza Moheimani, An optimization approach to optimal placement of collocated piezoelectric actuators and sensors on a thin plate. Mechatronics, Vol. 13, 27-47, 2003; [38] J. He, Z.F. Fu, Modal analysis. Butterworth-Heinemann, 2001; [39] M. Misiti, Y. Misiti, G. Oppenheim, J.M. Poggi, Wavelet and their applications. ISTE Ltd, 2007; [40] P. Gaudenzi, M. Bernabei, E. Dati, G. De Angelis, M. Marrone, L. Lampani, On the evaluation of impact damage on composite materials by comparing different NDI techniques. Composite Structures, Vol. 118, p.257-266, 2014.