impact evaluation - documents.wfp.org · 1 wfp ffa guidance manual (2011) and “wfp policy on...
TRANSCRIPT

mea
suri
ng
res
ult
s, s
ha
rin
g l
esso
ns
IMPACT EVALUATION Evaluation of the Impact of Food for Assets on Livelihood
Resilience in Senegal (2005 – 2010)
A Mixed Method Impact Evaluation
Evaluation Report
January, 2014
Prepared by Le Groupe-conseil baastel Itée:
Anne Fouillard, Team Leader, Chantal Lewis, Natural Resources Specialise, Mark Daku,
Statistician, Khady Mgaye, Local Coordinator, A&B Consulting
Commissioned by the
WFP Office of Evaluation
Report number: OEV/2013/009

Acknowledgements
The evaluation team members (Chantal Lewis, Natural Resources Specialist/Agronomist; Mark Daku, Statistician; Dr. Khady Mbaye, Local Coordinator; and Anne Fouillard, Team Leader) would like to thank the Evaluation Manager Elise Benoit from the Office of the Evaluation of the World Food Programme headquarters for her overall support to the evaluation process. Our gratitude is extended to the whole team of the WFP Country Office in Senegal, for their enthusiasm and openness, in particular Isabelle Confesson Monitoring and Evaluation Officer, for her relentless cooperation and sustained support to the evaluation mission, as well as all other WFP Country Office and sub-offices staff and partners who collaborated and shared their experiences and knowledge.
Disclaimer
The opinions expressed are those of the evaluation team and do not necessarily reflect those of the World Food Programme. Responsibility for the opinions expressed in this report rests solely with the authors. Publication of this document does not imply endorsement by WFP of the opinions expressed. The designation employed and the presentation of material in the maps do not imply the expression of any opinion whatsoever on the part of WFP concerning the legal or constitutional status of any country, territory or sea area, or concerning the delimitation of frontiers.
Evaluation Management
Series Evaluation Management: Jamie Watts, Senior Evaluation Officer
Evaluation Manager Elise Benoit
Evaluation Research Analyst: Cinzia Cruciani
Director, Office of Evaluation: Helen Wedgwood
Table of Contents
Fact Sheet: WFP’s FFA Programme in Senegal ........................................ i
Executive Summary ............................................................................... ii
1. Introduction ........................................................................................ 1 1.1 Evaluation Features .......................................................................................... 1 1.2 Context in which FFA was implemented in Senegal 2005-2010 .................... 3 1.3 WFP’s FFA in Senegal [2005-2010]................................................................. 4
2. Results - Outcomes and Impact of FFA ................................................ 7 2.1 Beneficiaries and Participants of the Evaluation ............................................. 7 2.2 Outcomes and Impacts .................................................................................... 7 2.3 Biophysical Outcomes and Impacts ............................................................... 11 2.4 Agricultural Productivity Outcomes and Impacts ......................................... 15 2.5 Food Security Outcomes and Impacts ........................................................... 16 2.6 Outcomes and Impacts on Livelihoods ......................................................... 19 2.7 Social Cohesion Outcomes and Impacts ........................................................ 22 2.8 Outcomes and Impacts on Resilience (Tables 9a to 9g in Annex 6.9) ......... 24
3. How Does FFA Create Impact? .......................................................... 28 3.1 WFP FFA Implementation Strategy .............................................................. 28 3.2 Operational issues .......................................................................................... 31 3.3 The Role of Contextual Factors...................................................................... 34
4. Conclusions and recommendations ................................................... 38 4.1 Conclusions ................................................................................................... 38 4.2 Recommendations ......................................................................................... 41
List of Tables
Table 1 FFA Participants (2005 – 2010) .................................................................... 5
Table 2 Total Budgets and Metric Tonnes by project (actual vs. planned) ............... 5
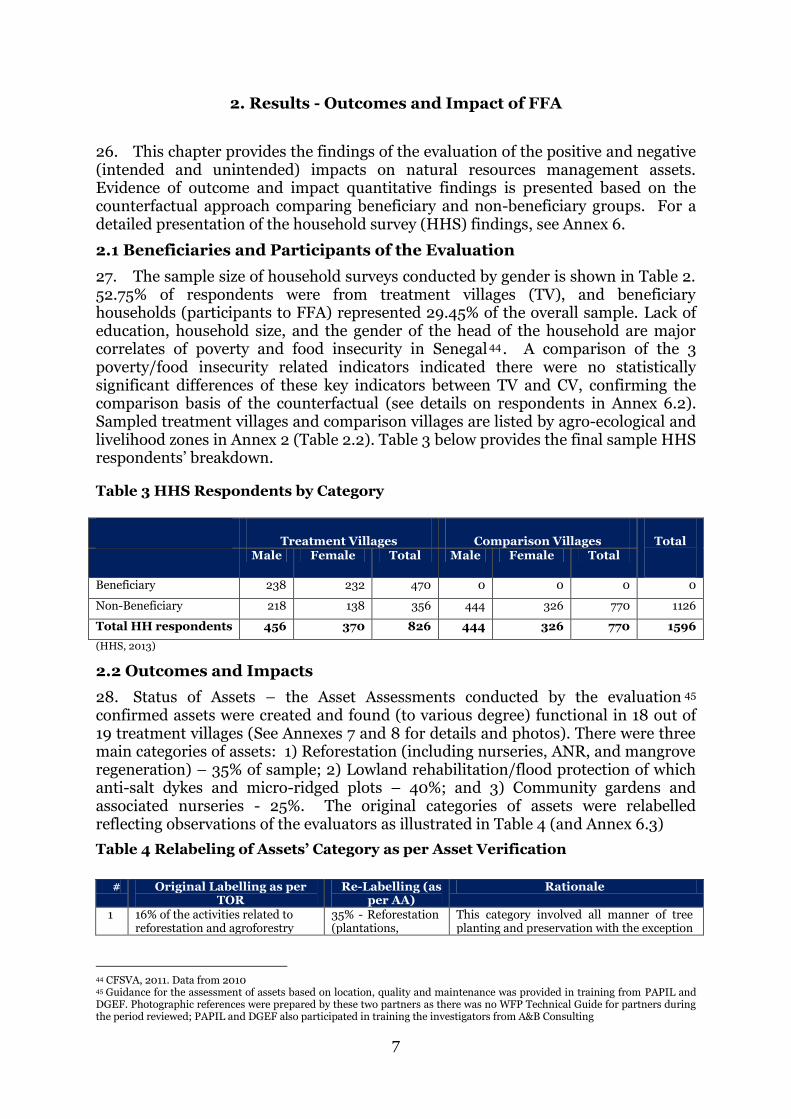
Table 3 HHS Respondents by Category ..................................................................... 7
Table 4 Relabeling of Assets’ Category as per Asset Verification .............................. 7
Table 5 Reforestation Assets (plantations, nurseries, ARN, mangrove
regeneration) – Scores assigned by field surveyors .................................................. 8
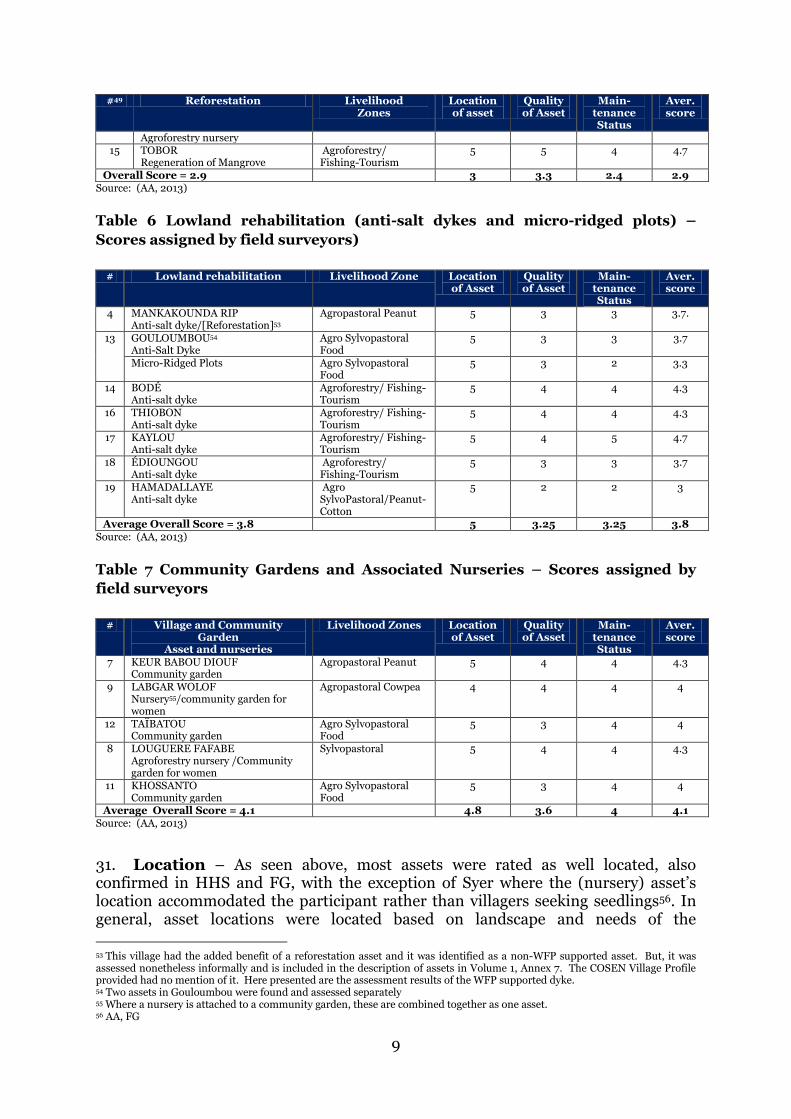
Table 6 Lowland rehabilitation (anti-salt dykes and micro-ridged plots) – Scores
assigned by field surveyors) ....................................................................................... 9
Table 7 Community Gardens and Associated Nurseries – Scores assigned by field
surveyors .................................................................................................................... 9
Table 8 Perception of asset condition by Treatment Villages’ Respondents .......... 10
Table 9 TV Respondents’ Perception of State of asset, by type of Asset ................. 10
Table 10 Perception of Biophysical Impacts (% of focus groups) ............................ 11
Table 11 FG respondents acknowledging biophysical impact of asset by livelihood
zones ......................................................................................................................... 12
Table 12 Number of Meals Eaten per Day by Age Group (%) ................................. 17
Table 13 Food Consumption Patterns Comparison ................................................. 17
Table 14 FG Perception that Food Security/Food Availability Improved ............... 18
Table 15 HHS Respondents – Perceived Improvement in Food Security .............. 19

Table 16 HHS Respondents – Perceived Improved Livelihood Status by Gender
(%) ............................................................................................................................ 20
Table 17 HHS Respondents Perceptions on Management of Household Food
Budget (%) ................................................................................................................ 22
Table 18 HHS Women Headed Households ............................................................ 23
Table 19 HHS Respondents Perception of Women’s Empowerment (%) ............... 23
Table 20 FG Respondents Perception of Impact on Resilience (%) ....................... 25
Table 21 FG Respondents Perception of Village’s Ability to Cope with Adversity (%)
.................................................................................................................................. 25
Table 22 FG Perception of Recovery Capacities/Coping Strategies ........................ 25
Table 23 HHS Respondents Perception – Migration as a current practice, by
Livelihood Zones (%)................................................................................................ 26
Table 24 – Perceptions of spillover, by village type and gender (in %) .................. 27
Table 25 Timing of Financial Contributions by Number of Donor Source ............. 35
Table 26 CCA Measures and potential linkages to FFA programming ................... 36
Table 27 FG Respondents Perception on Outcomes and Impacts of FFA .............. 38
List of Figures
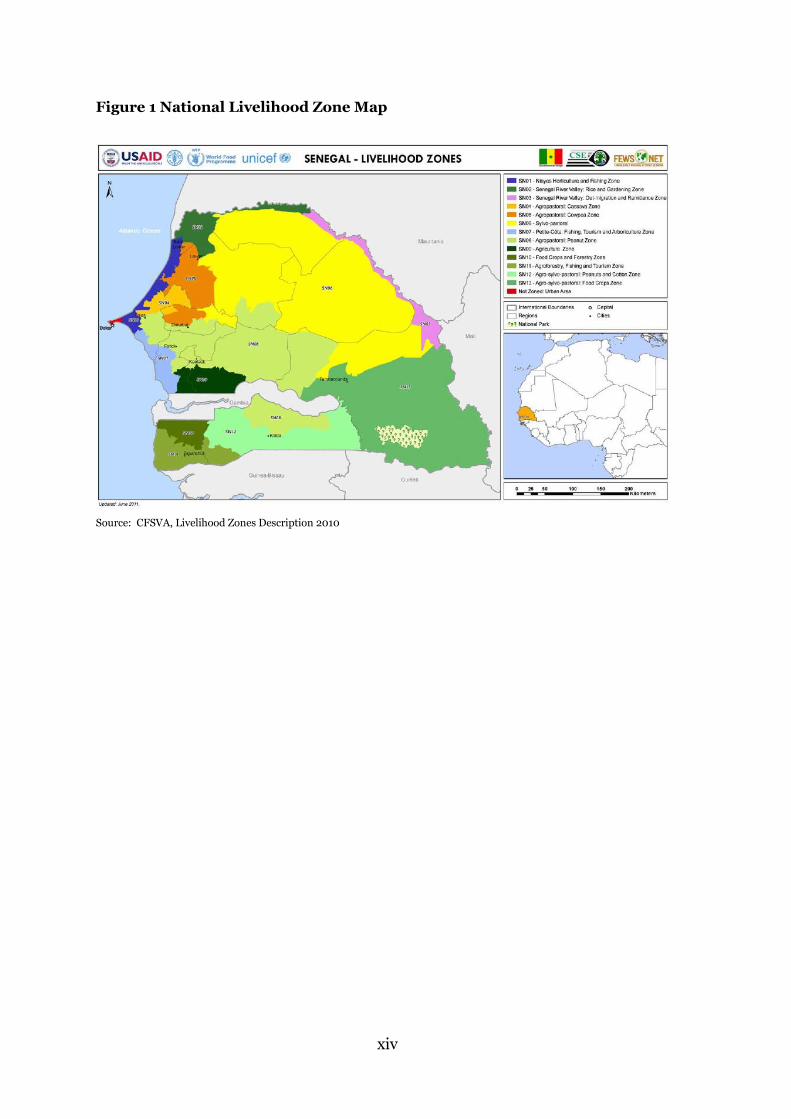
Figure 1 National Livelihood Zone Map ................................................................. xiv

List of Annexes (in separate Volumes)
Volume I. Main Annexes
Annex 1. Summary IE FFA Phase II Terms of reference
Annex 2. Summary of Theory of Change and Methodology
Annex 3. IE FFA in Senegal Evaluation Matrix
Annex 4. Evaluation findings, conclusions and recommendations
Annex 5. FFA context in Senegal past and current
Annex 5A. FFA context in Senegal (2005-2010) Annex 6. Supporting Data information from field data collection Annex 7. Asset Description (from verification exercise) Annex 8. Photographs of the assets found [A&B report]
Annex 13. List of people consulted
Annex 14. Bibliography
Annex 15. Acronyms
Volume II. Supplementary Annexes
Annex 3B. Adapted tools of the Evaluation Appendix A3B-1. Village Profile Appendix A3B-2. Asset Assessment Appendix A3B-3. Household Survey (HHS) Appendix A3B-4. Focus Group Discussions at Village level (FGD)
Annex 5B. Current FFA Implementation Context in Senegal (2013) Annex 5C. Livelihood Zones – Descriptions and Seasonal Calendars Annex 9. Reported FFA annual food distributions by asset types Annex 10. Ziguinchor Sub-Office Maps Locating Assets (2005-2010) Annex 11. FFA in Programs under review (2005 -2010) Annex 12. Potential Environmental Impacts associated with FFA assets

i
Reforestation and Agroforestry (ForestPlantations, Nurseries, A&R, MangroveRegeneration)
Flood Protection (Dyke Construction, Anti-SaltDykes)
Agriculture and Lowland Rehabilitation(Community Gardens)
16%
19%
65%
FFA Areas of Intervention
Fact Sheet: WFP’s FFA Programme in Senegal
Senegal
Table 3. Total Metric Tonnes Distributed – planned vs. actual
PLANNED 2005 2006 2007 2008 2009 2010 2011 TOTAL
CP 10451 5,179 6,451 6,554 7,092 6,221 31,497
PRRO 10188.1 11,724 12,457 12,797 36,978
PRRO 10612.0 18,302 15,731 17,985 18,236 70,254
ACTUAL 20 2006 2007 2008 2009 2010 2011 TOTAL
CP 10451 5,052 3,795 2,874 2,804 2,786 17,311
PRRO 10188.1 2,932 5,333 7,376 15,641
PRRO 10612.0 5,017 12,667 10,425 12,270 40,379 Source: SPR 2005-2011
WFP Programs under review
Title Total Final Budget Received
USD CP 10451 (2007-2011)
Country Programme
$14,347,308
PRRO 10188.1 (2005-2007)
Post-conflict Relief and Rehabilitation in the Casamance
$9,730,391
PRRO 10612.0 (2008-2011)
Post-conflict Rehabilitation in the Casamance Naturelle $45,798,997
2005 2006 2007 2008 2009 2010 2011
CP 10451.0 54,191 10,915 1,027 13,877 3,800
PRRO 10188.1 36,870 83,768 95,759
PRRO 10612.0 208,671 132,551 111,000 136,675
Table 1 2. WFP Operations as profiled (Sources: SPRs, TOR) Figure 1. Timeline of WFP operations with
FFAs under review
Table 2. FFA Participants (actual) involved in three programmes
WFP Partners: UNICEF, ILO, UNESCO, UNFPA, FAO, WHO, UNEP, UNHCR, UNDP, WORLD BANK, ADB
Government Agencies: Ministry of Economy and Finance and through this lead agency work with Ministries of Agriculture, Health,
Education, Women and Family, Rural Hydraulics,
Ajouter Commissariat à la Sécurité Alimentaire avant (CSA) Malnutrition Reduction Unit/Cellule Lute contre la Malnutrition (CLM,) Centre de Suivi Écologique (CSE), Système d’Alerte Précoce (SAP),
Ministère de l’Environnement et de la Protection de la Nature, Directions Régionales et Départementales du Développement Rural, Agence
Nationale de Conseil Agricole et Rural (ANCAR)
Donor organisations: Private Donors, Canada, Italy, Saudi Arabia, Senegal, Spain, Canada, Faroe Islands, Luxembourg, Czech Republic,
European Commission, Greece, Slovenia, Switzerland, Denmark
Non-Governmental Organizations/Project Partners: Caritas, UNHCR, ADB- PADERCA, ADB-PAPIL, PROGEDE, OXFAM GB, German-
funded PROCAS and ERACOD, World Vision, Catholic Relief Services, Christian Children’ s Fund, CARE-Canada, , Aide à l’action, Plan
International, ENDA Graff and district Committees, International Organisation for Migration, Helen Keller Foundation. Institute for Research in
Development (IRD), Rural Councils National Association, Food Technology Institute

ii
Executive Summary
Introduction
Evaluation Features
1. This evaluation assessed the impact of WFP’s food-for-assets (FFA) activities implemented in Senegal between 2005 and 2010. As one of a multi-country series, the evaluation’s objectives were to assess the outcomes and impacts of FFA on livelihoods resilience, identify changes needed for increasing these impacts, and generate lessons for better alignment with WFP’s 2011 FFA Guidance Manual and disaster risk reduction policy.1 Findings were assessed in the context of the Government’s resilience-building strategy2 and climate change adaptation measures.3 Three core questions were addressed:
What positive and negative impacts have FFA activities had on individuals within participating households and communities?
What factors were critical in affecting outcomes and impacts?
How could the FFA activities be improved to address the findings emerging from the first two questions?
2. Focusing on natural resource assets, the evaluation tested a theory of change to assess intended short-, medium- and long-term impacts, including on biophysical food security, livelihoods and resilience.
3. The mix of methods used included document review; a survey of 1,596 households – 826 in participant villages and 720 in comparison villages; 4 38 village profiles; 76 gender-disaggregated focus group discussions; 131 semi-structured interviews with major stakeholders; and 20 asset assessments.
4. WFP’s systems for reporting on protracted relief and recovery operations (PRROs) do not permit the tracking of resources and expenditure by component; combined with monitoring weaknesses, this lack presented major challenges, with limited asset-tracking records, gaps and inconsistencies throughout the project cycle.5 The evaluation examined 65 FFA villages for which the country office had records and the locations of assets created, but subsequent review of partners’ reports indicated that there may have been far more FFA villages.
5. These limitations were mitigated by sample validation, data triangulation and comparative cross-sectional analysis of participant and comparison households. The evaluation revealed considerable spillover effects, which reduced the analytical power of the comparative data, although significant differences were confirmed in several dimensions of the evaluation’s analysis.
1 WFP FFA Guidance Manual (2011) and “WFP Policy on Disaster Risk Reduction and Management” (WFP/EB.2/2011/4-A). The programmes evaluated were designed and implemented prior to adoption of the manual and policy, but their goals were broadly similar, and the evaluation terms of reference emphasized learning. 2 Launched in 2013 to address the underlying causes of vulnerability. 3 Including the 2006 National Adaptation Plan for Climate Change, the 2010 National Climate Change Adaptation Strategy,
and the World Bank/Global Facility for Disaster Reduction and Recovery 2011 Climate Risk and Adaptation Country Profile
for Senegal “Vulnerability, Risk Reduction and Adaptation to Climate Change”. 4 Participant villages are those in which at least one FFA activity occurred; comparison villages had very similar characteristics, but no FFA interventions. 5 For example, WFP Standard Project Reports (SPRs) reported 37,000 FFA activities with 209,000 participants during 2005–2010, while the country office’s monitoring database contained data on FFA activities for only 13,830 participants.

iii
Context
6. Senegal’s multi-ethnic population – of 13.6 million people in 2012 – was affected by cumulative shocks throughout the evaluation period, including the Casamance conflict, the 2008 food price crisis, and floods in 2009. WFP responded to a national emergency by reorienting PRRO 106120 – which originally focused on recovery and stabilization in Casamance – to cover 13 of Senegal’s 14 regions, and by merging the PRRO with country programme 104510 operations. This resulted in wider distribution of scarce resources across the country, and ultimately in smaller food transfers to targeted beneficiaries, including FFA participants.
WFP’s Food for Assets in Senegal, 2005–2010
7. The evaluation focused on the FFA components of three projects – country programme 104510 (2007–2011) and PRROs 101881 (2005–2007) and 106120 (2008–2011) – recorded as reaching between 37,000 and 209,000 participants a year 6 in fourteen departments, seven regions and six livelihood zones. Estimated expenditure was USD 7.62 million, representing 6 percent of the country office’s total expenditure throughout the evaluation period.
8. National-level geographical targeting was supported by food security analysis; community-level targeting was decided locally by WFP and field partners at annual meetings. Participant selection was by partners and/or village authorities applying the self-targeting principle. 7 Participants received a combination of food and other incentives, such as training and seedlings, for asset construction during the lean season, based on negotiated work norms.
Findings
Asset Categories and Functionality
9. Three asset categories were observed:
i) reforestation assets – nurseries, assisted natural regeneration (ANR),
mangrove regeneration – 35 percent of assets verified;
ii) lowland rehabilitation/flood protection assets – 40 percent; and
iii) community gardens and associated nurseries – 25 percent.
10. Of the assets assessed, 95 percent were still in use (see Table 1); gardens and lowland rehabilitation generally rated better than reforestation assets. 8 Eighty-five percent of assets – 94 percent of surviving ones – were well or very well located to serve landscape and community needs.9
6 The peak in beneficiary numbers coincides with the 2008 national emergency. 7 FFA was expected to attract only the able-bodied poor within a community, with entitlements presumed insufficient to attract others. 8 The asset assessment protocol is based on the village asset score methodology in WFP’s FFA Guidance Manual, Annex E-1. 9 Among reforestation assets, mangrove regeneration and ANR were well rated for location, but nurseries and tree planting fared poorly.

iv
Table 1: asset assessment scores*, by category
Number of assets
Asset category
Number of livelihood zones
Location Quality Maintenance Average
7 Reforestation
4: Agro-sylvopastoral/food crop; agropastoral peanut; agropastoral cowpea; agroforestry/fishing – tourism
3 3.3 2.4 2.9
8 Lowland rehabilitation
4: Agropastoral peanut; agro-sylvopastoral/food crop; agroforestry/fishing–tourism; agro-sylvopastoral/ peanut–cotton
5 3.25 3.25 3.8
5 Community gardens**
4: Agropastoral peanut; agropastoral cowpea; agro-sylvopastoral/food crop; sylvopastoral
4.8 3.6 4 4.1
* 5 = excellent; 4 = good; 3 = passable; 2 = mediocre; and 1 = very poor.
** A nursery attached to a community garden is counted as one asset.
Source: Asset verification, 2013.
11. Systematic maintenance strategies for longer-term sustainability were not found: in participant villages, 73.7 percent of respondents reported involvement in asset construction, but only 52 percent of village focus groups reported existing maintenance committees. The effects of this were evident, with nearly 95 percent of assessed dykes found unfinished.
Biophysical and Agricultural Effects
12. In participant villages, 82 percent of village focus groups perceived that asset construction had biophysical impacts on forest cover, soil stability, flooding, and water availability and use. Figure 1 indicates that a majority of household survey respondents acknowledged impact in all but the agropastoral/cowpea zone. While there were no statistical differences among livelihood zones, a significant relationship between asset condition and biophysical outcomes was found.
Figure 1: Perception of biophysical impact of assets, by livelihood zone
Source: Focus Group discussions 2013
0
10
20
30
40
50
60
70
80
% of households inparticipant villages reportinga positive impact

v
13. In comparison villages, 18 percent of respondents reported positive biophysical impacts – a spillover effect confirmed by the evaluation team, which found that comparison villages had copied successful or relevant assets, particularly ANR, reforestation and dykes.
14. Monitoring limitations hindered the measurement of changes in agricultural productivity resulting from asset establishment. However, through triangulation of household survey, focus group and secondary data, the evaluation found qualitative evidence of impact pathways between high-quality assets and improved agricultural productivity in participant villages, such that:
recovery of lowlands and mangroves contributed increased yields, greater biodiversity, access to water, desalinized soils, improved vegetation and reduction of coastal land degradation;
reforestation enabled better livestock maintenance and the use of plants for medicinal purposes and food;
anti-salt dykes contributed to reclamation of cultivable land and increased yields/numbers of harvests, resulting from FFA technical assistance and certified seeds; and
dykes contributed to groundwater replenishment, plot desalinization, rice production, fish farming, and irrigation of gardens and rice fields.
Food Security and Livelihood Effects
15. Eighty-five percent of survey respondents from participant households reported that FFA improved immediate food security, with no significant differences in men and women’s perceptions. Food consumption scores were reported in only one SPR for all activities analysed,10 preventing trend analysis. Qualitative information and partners’ documentation cited gardens and agroforestry assets as strong contributors to short- and medium-term food security improvements through dietary diversity and the production of surpluses for consumption or sale.
16. The evaluation’s dietary analysis found significant differences in numbers of meals eaten per day (Table 2) and items consumed:
between participant and comparison groups – beneficiary children ate more meals;
between participant and comparison villages – youth and children in participant villages ate more meals; and
among age groups in participant villages – although beneficiary adults ate fewer meals than non-beneficiary adults, data suggest that these meals were of better quality and/or that beneficiary adults were sharing food with children, who were reported to eat more meals than non-beneficiary children.
17. The most statistically significant difference in consumption was for fruit, which was consumed 5.8 times per week by beneficiaries, compared with 3.5 times for non-beneficiaries. Higher meat consumption was documented in participant villages and among beneficiaries.
10 Reported in one SPR for PRRO 106121 in 2010.

vi
Table 2: Numbers of Daily Meals by Age Group (% of respondents)
Numbers of meals 0 1-2 3 4-9 Total
Participant villages (non-beneficiaries)
Adults (> 18 years) 0 7.04 92.11 0.84 100
Youth (6–18 years) 0.85 3.95 91.53 3.67 100
Children (6 months–5 years) 1.43 1.43 66.29 30.35 100
Participant villages (beneficiaries)
Adults (> 18 years) 0 19.4 80.17 0.43 100
Youth (6–18 years) 0 0 8.66 91.03 100
Children (6 months–5 years) 0 5.13 56.88 38.00 100
Comparison villages (non-beneficiaries)
Adults (> 18 years) 0 24.03 75.84 0.13 100
Youth (6–18 years) 0.26 13.5 82.44 3.80 100
Children (6 months–5 years) 1.24 8.51 62.9 27.31 100
Source: Household survey, 2013.
18. Reported livelihood improvements associated with FFA assets were increased yields, surpluses and income generation. As shown in Table 3, there were significant differences in perceptions of improved livelihoods between respondent beneficiaries – of whom 88 percent reported them – and non-beneficiaries in participant villages, at 48 percent; and between respondents in participant and those in comparison villages, at 74 and 48 percent, respectively. Overall, women were slightly less positive about livelihood improvements than men. The effects perceived in comparison villages could be explained as spillover, and by the possible wider effects on the environment of initiatives such as mangrove rehabilitation.
Table 3: Perceptions of Livelihood Improvements Resulting from FFA (% of respondents)
Category Significant /some
None
Livelihood zone Agroforestry/fishing – tourism
75.6 24.4
Agropastoral/peanuts 54.5 45.5
Sylvopastoral 70.0 30.0
Agro-sylvopastoral/food 57.8 24.2
Agropastoral/cowpeas 65.6 34.4
Agro-sylvopastoral/peanut – cotton
82.3 17.7
Participant villages Beneficiaries 88.2 11.8
Non-beneficiaries 48.4 51.6
Subtotal 74.1 25.9

vii
Category Significant /some
None
Comparison villages 48.0 52.0
TOTAL 63.5 36.5
Source: Household survey, 2013.
19. Differences were also noted among livelihood zones, with more improvements reported in areas with lowland rehabilitation and garden assets. Beneficiaries reported higher levels of improvement than non-beneficiaries in all but two zones, where worse outcomes for beneficiaries were reported: the agropastoral cowpea zone, which is a deficit production area; 11 and the agroforestry/fishing – tourism zone, where ongoing conflict affects incomes for all groups.
20. Changes in income attributable to FFA could not be directly assessed because of constraints in the monitoring data. However, partners’ qualitative monitoring suggests the following:
Mangrove regeneration and the resulting biodiversity contributed to increased fishing and beekeeping for income generation.
Cashew plantations contributed to increased incomes while also providing a barrier against fires.
As well as protecting against fire, ANR created employment through forest harvesting and improved incomes from sales of forest by-products.
Despite some missed opportunities, such as fish farming, and 95 percent of observed dykes remaining unfinished, lowland rehabilitation and dyke/micro-ridged plots contributed to increased yields and associated income opportunities from restored rice paddies.12
Gardens associated with FFA contributed to improved livelihoods, particularly women’s incomes. Although never quantified, many testimonies of sales of surplus produce from gardens were recorded. Focus group discussions (see Table 4) also indicated differences in how men and women viewed the impact on women’s financial independence.
Social Cohesion and Resilience Effects
21. Most training associated with FFA was directed to women and covered technical asset construction, nutrition and hygiene; just under half of informants reported that FFA had contributed to women’s improved participation in decision-making, empowerment and self-organization. However, training in ANR was reported as not always being appropriately directed to those doing the work.
22. Migration is a long-established strategy for coping with rural food insecurity. Qualitative data from most informants suggest that in all asset categories and zones, FFA contributed to reduced migration, particularly while assets were being constructed, with the associated labour retention having positive effects on farm yields and reduced vulnerability in participant villages.
23. Establishing appropriate metrics for measuring resilience remains challenging in WFP and elsewhere. Rather than attempting direct estimation, the
11 WFP comprehensive food security and vulnerability analysis livelihood zones descriptions (2010). 12 SPRs reported 84,689 ha of land reclaimed for agriculture by lowland land clearing and development of rice paddies.
Projet d’appui à la petite irrigation reports included measured changes resulting from FFA, technical assistance and
certified seeds, such as rice yield increases from 800 kg/ha to 3.5 mt and from two to three crops a year.
viii
evaluation selected increased ability to handle shocks, coping strategies and livelihood opportunities as the main domains of resilience. It tested respondents’ perceptions, which were broadly consistent with the interpretations of focus groups – which understood resilience as improvements in food security and livelihoods opportunities.
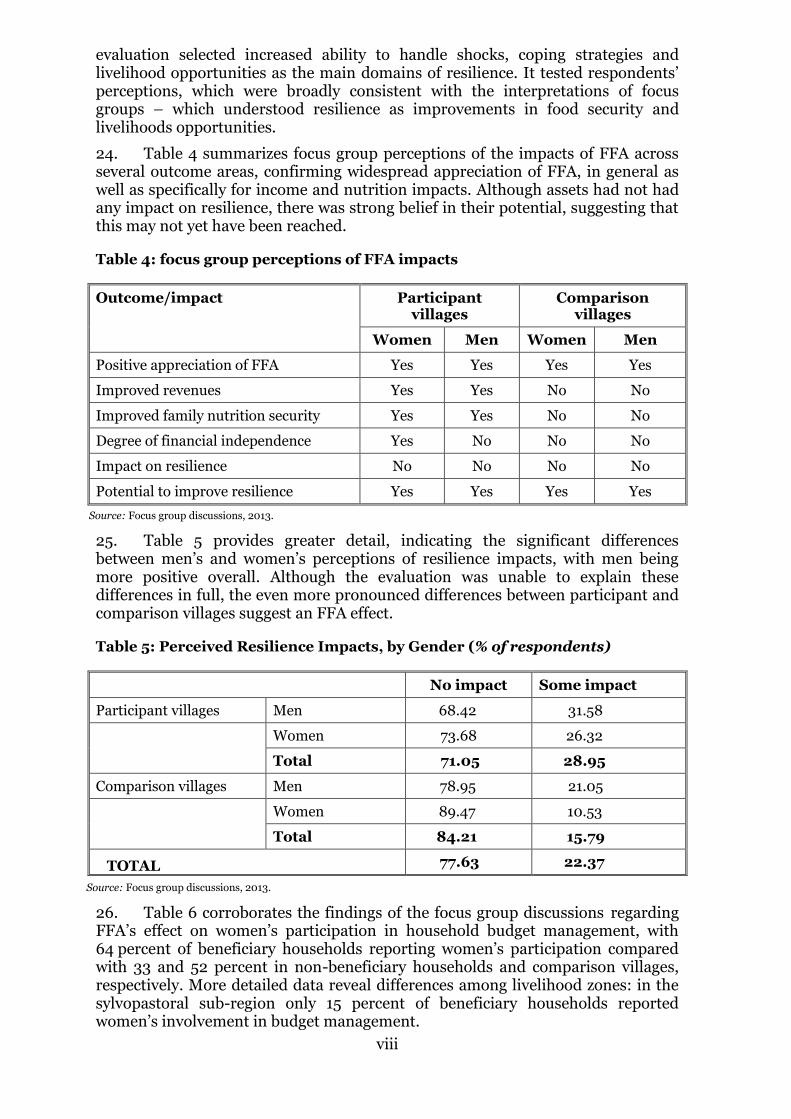
24. Table 4 summarizes focus group perceptions of the impacts of FFA across several outcome areas, confirming widespread appreciation of FFA, in general as well as specifically for income and nutrition impacts. Although assets had not had any impact on resilience, there was strong belief in their potential, suggesting that this may not yet have been reached.
Table 4: focus group perceptions of FFA impacts
Outcome/impact Participant villages
Comparison villages
Women Men Women Men
Positive appreciation of FFA Yes Yes Yes Yes
Improved revenues Yes Yes No No
Improved family nutrition security Yes Yes No No
Degree of financial independence Yes No No No
Impact on resilience No No No No
Potential to improve resilience Yes Yes Yes Yes
Source: Focus group discussions, 2013.
25. Table 5 provides greater detail, indicating the significant differences between men’s and women’s perceptions of resilience impacts, with men being more positive overall. Although the evaluation was unable to explain these differences in full, the even more pronounced differences between participant and comparison villages suggest an FFA effect.
Table 5: Perceived Resilience Impacts, by Gender (% of respondents)
No impact Some impact
Participant villages Men 68.42 31.58
Women 73.68 26.32
Total 71.05 28.95
Comparison villages Men 78.95 21.05
Women 89.47 10.53
Total 84.21 15.79
TOTAL 77.63 22.37
Source: Focus group discussions, 2013.
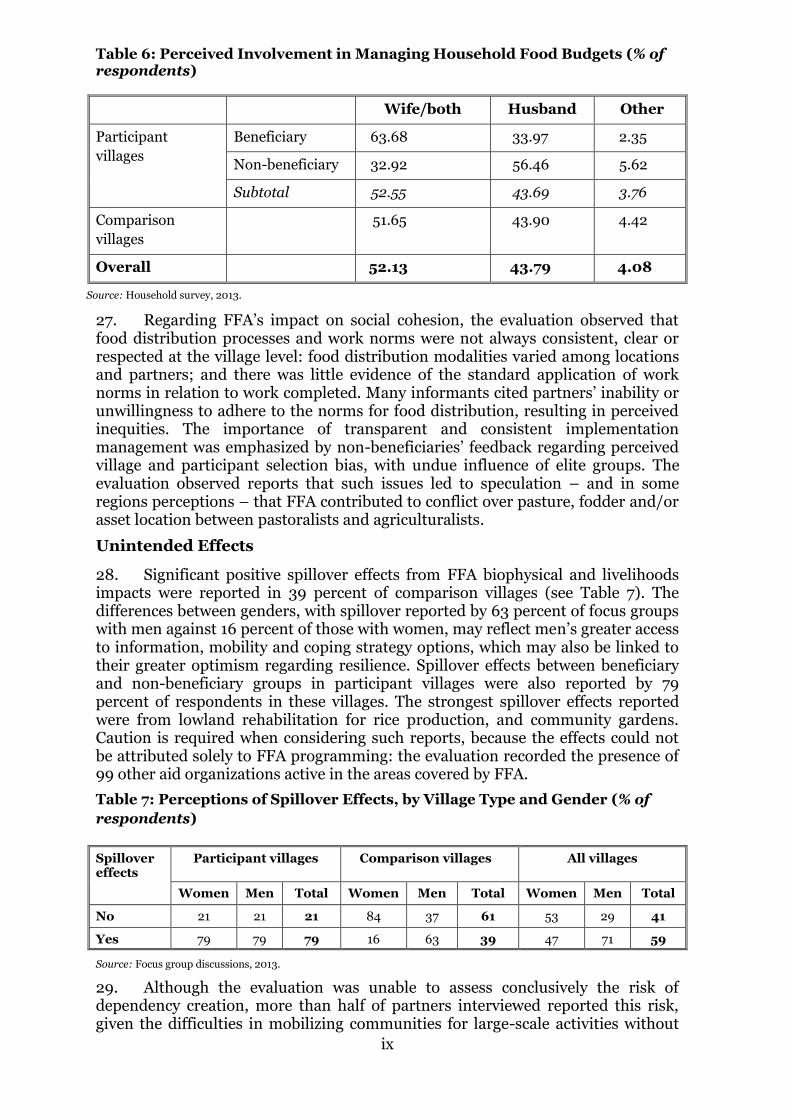
26. Table 6 corroborates the findings of the focus group discussions regarding FFA’s effect on women’s participation in household budget management, with 64 percent of beneficiary households reporting women’s participation compared with 33 and 52 percent in non-beneficiary households and comparison villages, respectively. More detailed data reveal differences among livelihood zones: in the sylvopastoral sub-region only 15 percent of beneficiary households reported women’s involvement in budget management.
ix
Table 6: Perceived Involvement in Managing Household Food Budgets (% of respondents)
Wife/both Husband Other
Participant
villages
Beneficiary 63.68 33.97 2.35
Non-beneficiary 32.92 56.46 5.62
Subtotal 52.55 43.69 3.76
Comparison
villages
51.65 43.90 4.42
Overall 52.13 43.79 4.08
Source: Household survey, 2013.
27. Regarding FFA’s impact on social cohesion, the evaluation observed that food distribution processes and work norms were not always consistent, clear or respected at the village level: food distribution modalities varied among locations and partners; and there was little evidence of the standard application of work norms in relation to work completed. Many informants cited partners’ inability or unwillingness to adhere to the norms for food distribution, resulting in perceived inequities. The importance of transparent and consistent implementation management was emphasized by non-beneficiaries’ feedback regarding perceived village and participant selection bias, with undue influence of elite groups. The evaluation observed reports that such issues led to speculation – and in some regions perceptions – that FFA contributed to conflict over pasture, fodder and/or asset location between pastoralists and agriculturalists.
Unintended Effects
28. Significant positive spillover effects from FFA biophysical and livelihoods impacts were reported in 39 percent of comparison villages (see Table 7). The differences between genders, with spillover reported by 63 percent of focus groups with men against 16 percent of those with women, may reflect men’s greater access to information, mobility and coping strategy options, which may also be linked to their greater optimism regarding resilience. Spillover effects between beneficiary and non-beneficiary groups in participant villages were also reported by 79 percent of respondents in these villages. The strongest spillover effects reported were from lowland rehabilitation for rice production, and community gardens. Caution is required when considering such reports, because the effects could not be attributed solely to FFA programming: the evaluation recorded the presence of 99 other aid organizations active in the areas covered by FFA.
Table 7: Perceptions of Spillover Effects, by Village Type and Gender (% of
respondents)
Spillover effects
Participant villages Comparison villages All villages
Women Men Total Women Men Total Women Men Total
No 21 21 21 84 37 61 53 29 41
Yes 79 79 79 16 63 39 47 71 59
Source: Focus group discussions, 2013.
29. Although the evaluation was unable to assess conclusively the risk of dependency creation, more than half of partners interviewed reported this risk, given the difficulties in mobilizing communities for large-scale activities without

x
0
10
20
30
40
50
60
70
80
90
CP 104510 Country Programme
2007–2011
PRRO 101881Post-Conflict Relief and
Rehabilitation in theCasamance
PRRO 106120 Post-Conflict
Rehabilitation in theCasamance Naturelle
Mill
ion
s
Approved budget
Total received
incentives, in targeted areas. In several villages and livelihood zones, the evaluation observed that work on and maintenance of the asset stopped when food distributions ended, as illustrated by the high proportion of unfinished dykes.
Factors Affecting Impact
External
30. External factors beyond WFP’s control included the cumulative burden of recurrent shocks – which constrained the impact of FFA interventions – and the challenging settings, particularly in Casamance where security remains volatile. The 2008 national emergency resulted in resources from the PRROs being used for emergency response. PRRO 101881 was under-resourced throughout the evaluation period, and was unable to fulfil its recovery targets for FFA.
31. All projects remained under-resourced against revised needs (see Figure 2), especially in the earlier years of the evaluation period. More than half of partners mentioned that funding shortfalls had repeatedly hampered the timely delivery of inputs for FFA implementation, resulting in reduced food remuneration for work done and delays in distribution.
Figure 2: Actual versus planned budgets, all activities (USD millions)
Sources: Project documents, budget revisions, SPRs.
Internal
32. Factors that are important for impact and are within WFP’s control include implementation strategy – partnerships, distribution processes, asset selection and targeting; and operational processes – delivery, guidance and training, monitoring and evaluation (M&E), and entitlements.
Implementation Strategy
33. Working with cooperating partners was an efficient strategy, enabling broad reach and serving as a catalyst for community mobilization, with FFA and partners’ objectives being mutually reinforcing. However, most assets were designed by partners, few of which had sufficient technical capacity for complex construction such as anti-salt dykes.
34. Lack of systematic implementation, clear communications and transparency in FFA distribution modalities and participant selection contributed to speculation, and ultimately perceptions, regarding FFA’s exacerbation of social tensions.

xi
35. The role of village leaders and alignment with decentralized development plans were not given adequate consideration in the planning of community and asset selection processes. This may have limited the ownership and systemic impact potential of FFA.
36. The impact of these implementation factors was compounded by the absence of clearly communicated FFA exit strategies, increasing the risk of undermining traditional community resilience mechanisms by creating expectations of incentives for community asset construction.
Operational Issues
37. The evaluation found that villages reporting few or no food distribution problems during the lean season showed more positive impacts. However, more than half of respondents reported repeated delays in food deliveries during the evaluation period, with some deliveries not coinciding with the lean season. Dispatch information confirms that there were fluctuations in the timeliness of dispatches.13
38. Technical guidance, particularly in French, was either not available or not widely communicated to beneficiaries and partners. The evaluation consistently observed that implementation partners were either not trained in or negligent of monitoring systems.
39. Few beneficiaries reported satisfaction with the FFA food basket, citing unclear or inappropriate distribution modalities and/or work norms, which at the field level often translated into receipt of a daily ration regardless of the work done. At 3 kg of rice/day/family, this ration was widely considered inadequate for family size.
Conclusions and Recommendations
40. Overall, WFP’s FFA successfully contributed to alleviating short-term hunger gaps. It also contributed to medium-term food security impacts, with participating families benefiting from greater dietary diversity and reported improvements in household nutrition from gardens and rice cultivation.
41. Natural resource interventions had positive impacts on land, livestock, and food consumption. Dyke construction for lowland rehabilitation contributed to improved rice yields. In addition to biophysical impacts in participant villages, positive spillover effects were identified in communities close to these villages.
42. Longer-term impacts on agricultural productivity associated with community gardens and nurseries were systematically reported as contributing to income opportunities, particularly for women.
43. Income generation related to asset creation contributed to improved livelihoods, with spillover effects for non-participants and comparison communities. Livelihoods were especially improved through lowland rehabilitation and gardens, which allowed sales of surpluses.
44. There were mixed effects on social cohesion. Despite concerns regarding targeting and transparency, beneficiaries, partners and agencies recognized benefits relating to mobilization for collective action and women’s improved participation in decision-making.
45. Most respondents perceived no impact on resilience, but all recognized FFA’s potential in this area. The evaluation evidence suggests that the combined
13 WFP Commodity Movement Processing and Analysis System records indicate that half of FFA tonnages in 2006 and 2009, three-quarters in 2007 and 2010, and most in 2008 were dispatched on time.

xii
impacts on productivity, livelihoods, community cohesion and reduced migration contributed to enhanced community resilience. The improved coping strategies acquired – diversified diets, land recovery techniques and income-generating opportunities – contributed to food security and enhanced livelihoods, which respondents considered important domains of resilience.
46. External contextual factors, and those within WFP’s control – such as weaknesses in programme strategy, operations, monitoring systems and community communications – limited the potential positive impacts, affected the ownership and sustainability of assets, and heightened the risk of conditional transfers affecting the incentives for longer-term community action for resilience.
Recommendations
47. Many of the lessons on design and implementation emerging from this evaluation are already being applied by the Senegal country office through updates to current programmes. WFP’s corporate guidance on FFA programming and gender programming has also been substantially changed since the period under review. The following recommendations are intended to support these ongoing efforts.
48. Recommendation 1: Develop a focused, multi-year, FFA-based resilience approach linked to the Government’s policies, strategies and decentralization processes, ensuring that local development plans are used along with corporate FFA guidance, and supported by a funding strategy and adequate monitoring systems. [Country office]
49. This approach should take a long-term perspective aligned with the National Adaptation Plan for Climate Change and the resilience-building strategy and oriented to providing guidance for decentralized integrated development plans. The approach should also complement the interventions of other agencies, including the United Nations Children’s Fund and the Food and Agriculture Organization of the United Nations, to ensure coherent support to targeted populations and enhanced technical capacities at the field level.
50. Recommendation 2: Implement WFP’s disaster risk reduction policy and corporate guidance for FFA programming by ensuring that WFP field staff are appropriately trained to apply corporate guidelines and provide technical assistance to partners and communities; and providing WFP guidance and best practices in French, adapted for partners and community audiences. [Country office, with Headquarters and Regional Bureau support]
51. This approach would contribute to the capacity development of WFP staff and partners and to the effective integration of disaster risk reduction and management and environmental concerns into FFA design and field implementation. Resources will be required for document translation, adaptation and dissemination, training, and ensuring adequate staff capacity for implementation at the field level.
52. Recommendation 3: Strengthen implementation accountability and transparency through: i) comprehensive and mutually accountable annual programme agreements with implementing partners; and ii) community-level participatory action plans that set clear roles and responsibilities for WFP, technical partners and community members in achieving and implementing agreed objectives, outputs and activities. [Country office]

xiii
53. Annual partnership agreements should cover programme implementation guidance (see recommendation 2); progress and outcome monitoring and reporting; and partnership evaluation schedules.
54. Recommendation 4: Develop an FFA education and communication strategy for community mobilization and enhanced transparency. [Country office]
55. The strategy should:
bring together key individuals from local authorities and different levels of administration and gender-balanced representatives of targeted FFA villages, to inform, consult and plan with villagers prior to signing FFA village action plans; and
simplify the FFA extension materials made accessible to community audiences using multiple media formats.
56. Recommendation 5: Over the medium term and in collaboration with partners, the country office M&E unit should support the establishment of a government-led comprehensive framework for FFA M&E that integrates interventions with national and local development plans; facilitates the monitoring of results; and involves all stakeholders – government, partners and communities. [Country office]
57. This will require a medium-term perspective and appropriate human resources working closely with the Agency for Rural Development to facilitate the integration of FFA activities into regional and local development plans, and eventual hand-over. Training of partners and communities will also have to be planned and budgeted.
58. Efforts will aim to establish and maintain:
a national database with sub-regional data banks;
nationally standardized, consistent and relevant monitoring indicators and systems; and
sustained training of partners at the central and sub-regional levels, and development of tools for involving targeted communities in M&E of assets at the most decentralized (village) level.
xiv
Figure 1 National Livelihood Zone Map
Source: CFSVA, Livelihood Zones Description 2010

1
1. Introduction
1.1 Evaluation Features
1. The Evaluation of Impact of Food for Assets on Livelihood Resilience in Senegal is one of five (5) evaluations addressing WFP’s work on food for assets commissioned by the WFP Office of Evaluation (OEV). The Terms of Reference (TORs) for the Senegal evaluation are presented in Annex 1. As for all evaluations of the series, it served accountability and learning purposes, with an emphasis on learning. The series objectives are to:
Evaluate the outcomes and impact achieved so far (intended or unintended) by FFA on livelihood resilience;
Identify changes needed to enable fulfilment of the potential impact of FFA on livelihoods resilience;
Provide information about how FFA activities can be better aligned with new policies and guidance14.
2. The intended users of this evaluation report include implementing partners, WFP staff at headquarters (HQ), regional (RB), country and sub-office levels, other UN agencies, key development partner agencies as well as government and non-government partners in Senegal.
3. This evaluation assessed the impacts associated with the food for assets (FFA) components implemented from 2005-2010 within three WFP projects in Senegal: the Country Programme (CP) 104651.0 (2007-2011), and two Protracted Relief and Recovery Operations (PRRO) 10188.1 (2005-2007) and 10612.0 (2008-2011). As per the TORs, a focus was given to the creation or recovery of natural resource assets, recognizing the contribution of infrastructure assets and access assets to livelihoods resilience 15 . At the request of the WFP Country Office (CO), the evaluation also contextualize the findings and recommendations within the framework of the recent 2013 Senegal’s Resilience Building Strategy process16 and Change Adaptation measures (CCA)17 adopted by the Government of Senegal and the evaluation findings.
4. The evaluation used as theory-of change based approach using the series’ TOR simplified logic model for FFA interventions (see Annex 2), derived from the 2011 FFA Guidance Manual and the Disaster Risk Reduction (DRR) Policy and validated during evaluation planning, and which addresses three core questions:
What positive and negative impacts have FFA activities had on individuals within participating households and communities?
What factors were critical in affecting outcomes and impact?
How could the FFA activities be improved to address the findings emerging from the first two questions?
14 The programmes being evaluated were designed and implemented prior to the adoption of the FFA Guidance Manual and DRR policy. However goals are broadly similar and the evaluation TOR emphasis is on learning. 15 Cereal banks were also considered as contextual factors, given their importance in Senegal 16 Senegal’s National Resilience Building Strategy was launched in May 2013 to address the underlying causes of vulnerability and WFP and other partners contributed to it, namely within a National Resilience Strategy Workshop planned after the evaluation Mission, but for which a discussion paper was shared with the evaluation - the Strengthening the Operationalization of WFP’s Resilience building Approach in Senegal (Draft 1- May 30, 2013) 17 These include: the 2006 National Adaptation Plan for Climate Change (NAPC 2006), the 2010 National Climate Change Adaptation Strategy and the 2011 Vulnerability, Risk Reduction and Adaptation to Climate Change
2
The evaluation matrix containing these and associated sub-questions is contained in Annex 3. Annex 4 illustrates findings, conclusions and recommendations based on the Theory of Change conceptual framework. 5. The evaluation was designed to test this theory of change (ToC), within which food inputs provided for work to construct assets were expected to: improve household food security in the short term; improve the biophysical environment, agricultural production and livelihood options in the medium term, and; achieve sustained improvement in livelihoods resilience, including improved ability to cope with crises in the longer term. Associated factors considered to be required to achieve intended changes/outcomes included: appropriate situational analysis and targeting; FFA activities and assets meet quality standards; technical assistance and other capacity; availability of food & non-food items, and; complementary inputs by WFP and other actors.
6. The mixed methods approach (see Annex 2) combined quantitative and qualitative data collection, including: document review, interviews, observation and survey. Household surveys (HHS) reached some 1596 individuals in both treatment 18 villages (TV) – where both beneficiaries and non-beneficiaries were interviewed - and in comparison villages19 (CV) – where only non-beneficiaries were interviewed. In total, 76 focus groups (FG) were held, 38 in treatment and 38 in comparison villages (half with women and half with men – i.e. 19 for each sex and set of village types). Thirty-eight village profiles were completed, and the number of Semi-structured Interviews (SSIs) totalled 13120. Asset assessments were conducted in 19 villages for a total of 20 asset assessments21 as 1 village had two assets. Adapted tools for data collection are found in Volume 2, Annex 3B.
7. The evaluation proceeded with a universe of 65 FFA villages for which the CO had records of locations and where assets were reported to have been created. A stratified sampling to select villages for a representative examination by departments22, as well as a purposive FFA selection to ensure a representative range of interventions were used. Sampling was identified by agro-ecological and livelihood zones. The final sample by population size and reorganization of administrative boundaries in 2008, as well as the adjustments made in the field due to security issues, covering the 6 livelihoods zones, 14 departments across 8 regions, and is found in Annex 2.
8. Constraints to the evaluation were several, of which: recall issues compounded by stakeholders rotation of personnel linked to the evaluations’ timeframe (5-7 years in the past), and insecurity in Casamance23 during the data collection process. This was mitigated by triangulation of information from multiple sources, and by the extension by 9 days of field data collection. The greatest constraint was the lack of WFP baseline and detailed monitoring reports (including asset location) for the period under review. The CO monitoring data base on FFA contained information on activities linked to 13,830 participants, in 65 locations, against WFP Standard
18 where a WFP FFA intervention had taken place 19 Comparable villages to the treatment ones, with the major difference being that there were no FFA implemented 20 See Annex 2 –Methodology and Annex 13 - List of persons met 21 There were 20 WFP supported assets evaluated, one which no longer existed (Kohel) and Gouloumbou where there were 2 assets. 22 Departments also overlap quite closely with different agro-ecological zones, which will allow for another level of analysis in the final report. 23 Owing to insecurity at the time of the field data collection, surveyors had to be accompanied by military contingents of more than 20 army personnel, in the two villages of Kaylou and Ediouma

3
Project Reports (SPR) which indicated up to 209,000 participants. The absence of village-level locations in the corporate reporting system for these assets/activities however did not allow the evaluation to use the SPR information as a basis for its field work. This was partially mitigated by a Reconnaissance mission prior to the evaluation field work to validate the universe, and allowed the evaluation to proceed. The desk review of internal reports from partners’ during the evaluation process, however appears to confirm that the actual FFA 2005-2010 universe might have been larger than the one used (see Annexes 9 and 11). Although this may limit the evaluation’s findings overall applicability to all of FFA actually implemented during the 2005-2010, it is reasonable to assume similarity of programme implementation approach; with appropriate comparative methods built into the evaluation design, the findings provide insights into impact of FFA interventions in Senegal, contributing to the learning purpose of the evaluation’s series’.
9. The evaluation revealed considerable spillover effects which reduced the analytical power of the comparative data; nonetheless significant differences were confirmed in several dimensions of the evaluation’s analysis.
10. This evaluation was conducted by an independent external team of Baastel over nine months, and included an inception mission (April 2013) for methodology refinement, a reconnaissance mission (May) for sample validation, field data collection (May/June), and the reporting phase. The data collection process was conducted by a hired national firm (A&B Consulting), under Baastel’s supervision who verified the data and conducted the final analysis.
1.2 Context in which FFA was implemented in Senegal 2005-2010
11. The multi-ethnic population of Senegal was estimated at 13.6 million24 in 2012. The short-lived confederation of the Senegambia, dissolved in 1989, initiated a conflict that still affects the southern region of Casamance today. Following the 2008 administrative reorganisation, Senegal is divided into 14 regions, 45 departments, 370 rural communities and 14,400 villages25.
12. The main sources of the foreign currency for Senegal are fishing26, tourism and groundnut production, the main cash crop. While agriculture employs 70% of the population, it only contributes 13.7% to the Gross Domestic Product (GDP) 27 . Chronic poverty, insecurity in Casamance, climate change, the crisis in groundnuts and cotton, the decrease in fish stocks, as well as rise in global food and fuel prices have significantly affected the country’s purchasing power and its ability to import staple foods. All of these factors have hindered development.
13. Food insecurity affects 28 percent of the population - with 50% percent of its population28 living in poverty and 15 percent in extreme poverty, with no significant poverty reduction since 2006. Seventy percent of the poor lived in rural areas in 2011, unchanged from 2001. Of the extreme poor, more than a third lived in regions of the Casamance. About 62 percent of people living in households with a head whose main occupation was agriculture were poor, compared to 33 percent for other occupations29.
24 WB, 2012 25 World Bank Country Partnership Strategy (FY2012-2017), 2013 26 Until 2007, fishing was the main source of foreign exchange earnings (22%of total value of exports). Fish resources also provided more than 70% of animal protein for Senegal. 27 CFSVA, 2011. Data from 2010 28 World Bank CPS 2013 29World Bank Country Partnership Strategy (FY2012-2017), 2013.
4
14. National data indicates that in 2011, 54% of people living in a household whose head had no formal education were poor. In rural areas, three quarters of heads of households have no education at all30, while 83% of the poor live in households with a non-educated head, a figure unchanged over the past decade. Surprisingly, the poverty rate of people living in female-headed households is 35%, compared to 51% for male-headed households31 . Among rural women, 67.9% of women are illiterate (compared to 78% in 1995 and 72% in 2001)32.
15. Senegal is prone to natural hazards, such as drought, flood and erratic rainfall, as well as the longer-term negative impacts of climate change. Natural disasters are further compounded by associated epidemics, coastal erosion and salinization of soils33. Indeed, during the period under review cumulative shocks34 (poor rains in 2006, high food prices globally in 2008, floods in 2009 receding rains and a resulting agricultural crisis, as well as the Casamance conflict) eventually resulted in a food and nutritional security crisis, which, given the increased needs, brought the WFP operations (CP 10451.0 and PRRO 10612.0) to operationally merge during the CP implementing period in 2008 (see Section 1.3 and section 3.3.2).
1.3 WFP’s FFA in Senegal [2005-2010]
16. The evaluation focused on the FFA components of three main projects implemented during 2005-2010: two Protracted Relief and Recovery Operations (PRROs) PRRO 10188.1 (20052007) and PRRO 10612.0 (2008-2011); and, one Country Programme (CP) 10451.0 (2007-2011).
17. The main areas of intervention 35 were linked to activities related to: 1) agriculture and lowland rehabilitation, community gardens, support to rice production and the building of anti-salt dykes (65%); 2) flood protection through the building of dykes (19%); and 3) reforestation and agroforestry through forest plantations, nurseries, assisted natural regeneration (ANR), and regeneration of mangroves (16%)36.
18. Table 1 provides an overview of participants involved in the three programs from 2005-2010, as reported in the SPR. From 37,000 to 209,00037 participants per year would have been reached by FFA between the three projects and the five years of implementation (reaching 14 departments, 7 regions and 6 livelihood zones38).
30 CFSVA, 2011 31 World Bank Country Partnership Strategy (FY2012-2017) 32 Women Environment and Development Organization (WEDO, 2008) http://www.wedo.org/about/about-us 33 World Bank Country Partnership Strategy (FY2012-2017), 2013. 34 See Annex 5 A for a listing of successive shocks from 2006-2012 35 COSEN data 36 TOR – and as reported and categorise in the projects SPR 37 Assuming an overlap between projects in 2008, given the operational merging of the two operations 38 As per the programme monitoring data of the CO

5
Table 1 FFA Participants (2005 – 2010)
FFA Participants (Actual)
2005 2006 2007 2008 2009 2010 2011
CP 10451.0 54,191 10,915 1,027 13,877 3,800
PRRO 10188.1 36,870 83,768 95,759
PRRO 10612.0 208,671 132,551 111,000 136,675 Source: SPR
19. Neither the SPR, nor the WFP financial systems identify amounts of funding dedicated specifically to FFA, nor do they provide details regarding resources diverted from FFA toward the emergency response. Furthermore, as the CP and PRRO were operationally merged, it made it difficult to assess or estimate what was directed to the original beneficiaries.
20. As reported by the WFP CO, allocations directed to FFA remained constant at a percentage rate of total budgets ranging from 6% for the period under review (2005-2010) 39. Based on this, and the SPR funding levels of the three approved projects budgets totalling $127 million from multiple donors [three quarters of which fell under the PRROs40], it is estimated that US$ 7.62 million would have been allocated to FFA. See Table 2 for total (non-specific to FFA) budgets and total tonnage (planned and actual) for each project.
Table 2 Total Budgets and Metric Tonnes by project (actual vs. planned)
Project
Original Approved
Budget US$
Revised approved
budget Total
Received %
funded
Total
metric tonnes (MT)
planned
Actual
Total MT distributed
% Actual
vs Planned
(MT) CP 10451 2007-2011
19,998,332 31,148,841 14,347,308 46% 31,497 17,311 55%
PRRO 10188.1 Post-conflict Relief and Rehabilitation in Casamance 2005-2007
18,633,292 18,639,619 9,730,391 52% 36,978 15,641 42%
PRRO 10612.0 Post-conflict Rehabilitation in the Casamance Naturelle 2008-2011
11,927,632 77,443,946 45,798,997 59% 70,254 40,379 57%
TOTAL 50,559,256 127,232,406 69,876,696 138,729 73,331 Source: Project documents, SPR
21. The two PRROs focused originally on assisting the most vulnerable in response to the on-going conflict in Casamance, with a focus on stabilisation and recovery activities (of which FFA). In response to the emerging food and nutrition emergency
39Financial information on proportion used on FFA was obtained from the CO with an estimated overall proportion of 6% for the evaluation period. An internal Excel table of contributions that may have been directed to FFA was also provided by the CO which itemised contributions (by donor by year and project). The 6% level is used, rather than the CO Excel table, as this information could not be reconciled with the overall SPR figures of financial resources received (by projects or in aggregate). This table reported a total estimated level of US$ 36 million directed to FFA which represented over 28% of all contributions received. Given that the current level of contributions used for FFA stood at 6.72% in 2012 in a stabilised context compared to the emergency context of 2005-2010, the evaluation used the overall estimate of 6% directed to FFA as reported by the CO, rather than the itemised (internal) table they had provided. 40 SPR
6
crisis of 2008 however, better funded on-going PRRO interventions were extended and new activities included covering food needs for all regions of Senegal41.
22. With regard to programs under review, the difference in implementation between short term PRRO and longer-term (CP) were imperceptible. This may have stemmed from the merging of operational implementation in the aftermath of the 2008 food and nutrition crisis which focused on emergency and relief operations and which resulted into increased resource mobilization.
23. FFA programme implementation was channelled through implementation partners. Geographical targeting at national level was supported by food security analysis from WFP and partners. FFA targeted villages were selected at yearly meetings of the Regional Council organized through WFP sub-offices; these were based on (a) geographical targeting of vulnerable areas, and (b) partners’ initial proposals for projects for the upcoming year. Subsequent to initial identification of potential villages for FFA implementation, field visits were then organized to validate choices.
24. Subsequently, detailed proposals were submitted to the WFP CO for final selection. At this point, training of partners on FFA implementation was organized42. Final participants’ selection was left to implementing partners and/or village authorities. For the period under review, the concept of ‘self-targeting’ of beneficiaries was used, under the assumption that FFA attracted the able-bodied poor within a community as others judged the food compensation insufficient for their needs. This approach represents certain challenges especially when demand for FFA support is greater than availability and/or when no complementary safety-nets are available for non-eligible to FFA vulnerable in a village.
25. Participants received a combination of food incentives and other inputs (such as training or seedlings) for work on the creation of an asset during the lean season, based on predetermined work norms to which an FFA entitlement was linked (a person/day corresponding to a set amount of food). Food distributions were organised by the partners at community level, but modalities varied among partners. See Annexes 5 and Annexes 6.15 and 6.16 on FFA implementation and targeting for details43.
41 SRP 2008 1 January-31 December 2008 – CP 1045.1 (2007-2011) and PRRO 10621.0 42 SSI, 2013 (see annex 6.14 on training) 43 SSI (aggregated from both partners, COSEN and regional sub-offices)
7
2. Results - Outcomes and Impact of FFA
26. This chapter provides the findings of the evaluation of the positive and negative (intended and unintended) impacts on natural resources management assets. Evidence of outcome and impact quantitative findings is presented based on the counterfactual approach comparing beneficiary and non-beneficiary groups. For a detailed presentation of the household survey (HHS) findings, see Annex 6.
2.1 Beneficiaries and Participants of the Evaluation
27. The sample size of household surveys conducted by gender is shown in Table 2. 52.75% of respondents were from treatment villages (TV), and beneficiary households (participants to FFA) represented 29.45% of the overall sample. Lack of education, household size, and the gender of the head of the household are major correlates of poverty and food insecurity in Senegal 44 . A comparison of the 3 poverty/food insecurity related indicators indicated there were no statistically significant differences of these key indicators between TV and CV, confirming the comparison basis of the counterfactual (see details on respondents in Annex 6.2). Sampled treatment villages and comparison villages are listed by agro-ecological and livelihood zones in Annex 2 (Table 2.2). Table 3 below provides the final sample HHS respondents’ breakdown.
Table 3 HHS Respondents by Category
Treatment Villages Comparison Villages Total
Male Female Total Male Female Total
Beneficiary 238 232 470 0 0 0 0
Non-Beneficiary 218 138 356 444 326 770 1126
Total HH respondents 456 370 826 444 326 770 1596
(HHS, 2013)
2.2 Outcomes and Impacts
28. Status of Assets – the Asset Assessments conducted by the evaluation 45 confirmed assets were created and found (to various degree) functional in 18 out of 19 treatment villages (See Annexes 7 and 8 for details and photos). There were three main categories of assets: 1) Reforestation (including nurseries, ANR, and mangrove regeneration) – 35% of sample; 2) Lowland rehabilitation/flood protection of which anti-salt dykes and micro-ridged plots – 40%; and 3) Community gardens and associated nurseries - 25%. The original categories of assets were relabelled reflecting observations of the evaluators as illustrated in Table 4 (and Annex 6.3)
Table 4 Relabeling of Assets’ Category as per Asset Verification
# Original Labelling as per
TOR Re-Labelling (as
per AA) Rationale
1 16% of the activities related to reforestation and agroforestry
35% - Reforestation (plantations,
This category involved all manner of tree planting and preservation with the exception
44 CFSVA, 2011. Data from 2010 45 Guidance for the assessment of assets based on location, quality and maintenance was provided in training from PAPIL and DGEF. Photographic references were prepared by these two partners as there was no WFP Technical Guide for partners during the period reviewed; PAPIL and DGEF also participated in training the investigators from A&B Consulting

8
# Original Labelling as per TOR
Re-Labelling (as per AA)
Rationale
through forest plantations, nurseries, ANR46 and regeneration of mangroves
nurseries, ANR, and mangrove regeneration
nurseries which were combined with village gardens. These were approached as one asset as these were largely associated with a community garden unless specified.
2 19% of activities focused on flood protection through the building of dykes
40% - Lowland rehabilitation which included anti-salt dykes and micro-ridged plots
This category was segregated from village gardens as these required a greater level of effort and more technology to maintain the dykes and restore the soils for agricultural purposes, namely rice cultivation.
3 65% of activities linked to agriculture and lowland rehabilitation, community gardens support to rice production and building of anti-salt dykes.
25% - Village gardens and associated nurseries including agroforestry in gardens
As these were more frequent, these were provided a category of their own. Often village gardens incorporated agroforestry models and nurseries as part of the overall asset.
29. In 18 of the 19 treatment villages of the sample, 23 assets were actually found; multiple assets in a given village were however generally assessed and reported as one asset per village except in Gouloumbou. Only one reforestation asset in Kohel had disappeared. On a village percentage basis, 95% of the assets were still in existence and use. (In total, 20 AA of 23 assets observed in 19 villages were made, including one for the asset that had disappeared).
30. Tables 5 to 7 below present, by (relabelled) asset category, the scores assigned by field surveyors during the AA. Scores were attributed for 1) location (determined by how advantageous it was for the overall community); 2) quality of asset (technical design); and 3) asset maintenance levels. Assets were evaluated and rated for a score47 of 1 to 5 as outlined in the legend48 of the developed AA tools by the surveyors on the basis of observation and Focus Groups discussions.
Table 5 Reforestation Assets (plantations, nurseries, ARN, mangrove
regeneration) – Scores assigned by field surveyors
#49 Reforestation Livelihood
Zones Location of asset
Quality of Asset
Main- tenance Status
Aver. score
1 MISSIRAH MOURIDE Reforestation /Nurseries (1 asset)50
Agro Sylvopastoral Food
3 3 2 2.7
2 MABO1 Assisted Natural Regeneration
Agropastoral Peanut 4 5 1 3.3
3 SAM THIALENE Assisted Natural Regeneration
Agropastoral Peanut 4 4 3 3.7
5 KOHEL51 Reforestation
Agropastoral Peanut 0 0 0 0
6 TELLAYARGOUYE Agroforestry /nursery52
Agropastoral Peanut 4 2 3 3
10 SYER 1 Agropastoral Cowpea 1 4 4 3
46 Assisted Natural Regeneration 47 The AA protocol is based on the “Village Asset Score” developed by the WFP in the FFA Manual-Annexes E-1. The asset was photographed, the location plotted and villages identified by GPS (reported in the village profiles). The asset was assessed for: 1) Location, 2) Design of asset in relation to quality standards; and 3) Current state of maintenance. Guidance was provided in training from PAPIL and DGEF who provided photographic references as there was no Technical Guide for partners for the period reviewed. 48 Legend: 5 – excellent, 4 – good, 3 - passable, 2 – mediocre, and 1 - very poor [Zero (0) was assigned to disappeared assets]. 49 Number is specific to the reference number used for each village in all tables 50 Standalone nurseries are included in reforestation assets only when these are projects on their own or if they are providing seedlings as the in the case for mangrove regeneration. However when nurseries are associated to a community garden, they are considered as part of the community garden assets category. 51 This asset no longer existed 52 In this case, it is reforestation asset as it was not linked to a community garden.
9
#49 Reforestation Livelihood Zones
Location of asset
Quality of Asset
Main- tenance Status
Aver. score
Agroforestry nursery 15 TOBOR
Regeneration of Mangrove Agroforestry/ Fishing-Tourism
5 5 4 4.7
Overall Score = 2.9 3 3.3 2.4 2.9 Source: (AA, 2013)
Table 6 Lowland rehabilitation (anti-salt dykes and micro-ridged plots) –
Scores assigned by field surveyors)
# Lowland rehabilitation Livelihood Zone Location
of Asset Quality of Asset
Main- tenance Status
Aver. score
4 MANKAKOUNDA RIP Anti-salt dyke/[Reforestation]53
Agropastoral Peanut 5 3 3 3.7.
13 GOULOUMBOU54 Anti-Salt Dyke
Agro Sylvopastoral Food
5 3 3 3.7
Micro-Ridged Plots Agro Sylvopastoral Food
5 3 2 3.3
14 BODÉ Anti-salt dyke
Agroforestry/ Fishing-Tourism
5 4 4 4.3
16 THIOBON Anti-salt dyke
Agroforestry/ Fishing-Tourism
5 4 4 4.3
17 KAYLOU Anti-salt dyke
Agroforestry/ Fishing-Tourism
5 4 5 4.7
18 ÉDIOUNGOU Anti-salt dyke
Agroforestry/ Fishing-Tourism
5 3 3 3.7
19 HAMADALLAYE Anti-salt dyke
Agro SylvoPastoral/Peanut-Cotton
5 2 2 3
Average Overall Score = 3.8 5 3.25 3.25 3.8 Source: (AA, 2013)
Table 7 Community Gardens and Associated Nurseries – Scores assigned by
field surveyors
# Village and Community
Garden Asset and nurseries
Livelihood Zones Location of Asset
Quality of Asset
Main- tenance Status
Aver. score
7 KEUR BABOU DIOUF Community garden
Agropastoral Peanut 5 4 4 4.3
9 LABGAR WOLOF Nursery55/community garden for women
Agropastoral Cowpea 4 4 4 4
12 TAÏBATOU Community garden
Agro Sylvopastoral Food
5 3 4 4
8 LOUGUERE FAFABE Agroforestry nursery /Community garden for women
Sylvopastoral 5 4 4 4.3
11 KHOSSANTO Community garden
Agro Sylvopastoral Food
5 3 4 4
Average Overall Score = 4.1 4.8 3.6 4 4.1 Source: (AA, 2013)
31. Location – As seen above, most assets were rated as well located, also confirmed in HHS and FG, with the exception of Syer where the (nursery) asset’s location accommodated the participant rather than villagers seeking seedlings56. In general, asset locations were located based on landscape and needs of the
53 This village had the added benefit of a reforestation asset and it was identified as a non-WFP supported asset. But, it was assessed nonetheless informally and is included in the description of assets in Volume 1, Annex 7. The COSEN Village Profile provided had no mention of it. Here presented are the assessment results of the WFP supported dyke. 54 Two assets in Gouloumbou were found and assessed separately 55 Where a nursery is attached to a community garden, these are combined together as one asset. 56 AA, FG

10
communities especially for community gardens, lowland rehabilitation, mangrove regeneration and ANR57. Overall 85% of assets (and 94% of surviving ones) were rated well (4) or very well (5) located.
32. Condition and Maintenance – Some 84.2% of HHS respondents in TV indicated the vast majority of assets were considered in relative good condition (both beneficiaries and non-beneficiaries), echoing the AA’s overall ratings (against an overall average score of 3.4 out of 5 for all assets as per AA). Of the 747 respondents who answered the question in treatment villages, women were slightly more positive (87.73 %) compared to men (81.47%) thinking the asset was in a good state. Ratings in the HHS (reported by survey respondents) followed a three point scale, whereas ratings in the AA (performed by the data collection team) observed a five point scale for greater precision. See Table 8.
Table 8 Perception of asset condition by Treatment Villages’ Respondents58
State of the Asset Gender
Male Female Total
Poor 28 10 38
6.65% 3.07% 5.09%
Passable 50 30 80
11.88% 9.2% 10.71%
Good 343 286 629
81.47% 87.73% 84.2%
Total 421 326 747 (HHS, 2013)
33. Table 9 provides respondents’ appreciation of asset condition, by type as collected from HHS from treatment villages. While most assets types were perceived to be in relatively good condition, reforestation assets related to plantations and nurseries stood out with 38 respondents (with declared knowledge linked to this asset type) having reported these assets in poor condition. This suggests that this asset type had particular difficulties for maintenance as confirmed from other sources by the evaluation (see Section 3).
Table 9 TV Respondents’ Perception of State of asset, by type of Asset
57SSI, AA, FG 58 Men reported that assets were in worse condition than woman did (MD = -0.098, t = -2.5897, p = 0.01).
State of the Asset
Type of Asset Poor Passable Good Total
Village Cereal Bank 2 0 0 2
Dyke 0 4 91 95
Anti-salt dyke 0 9 176 185
Anti-erosion dykes – micro-ridged plots 0 0 2 2
Village gardens 0 15 134 149
Firewalls 0 1 0 1

11
(HHS, 2013)
34. Maintenance strategies for longer-term sustainability were not systematically found: oof the respondents, 73.7% said the TV village population was involved in the construction of the asset, and 52% of TV reported a maintenance committee still existed to maintain the asset (see Annex 6.8). The assets which stood out as the best maintained according to HHS respondents were the anti-salt dykes, and the gardens /nurseries. This concurs with the AA results, where ratings were highest for the community gardens’ category, followed by the lowland-rehabilitation category (Tables 5-7). Lowland rehabilitation assets ranged from 2 to 5 with a good balance in the higher ranges.
35. Examining asset state by livelihood zones, assets reported as in poor or passable condition by the HHS respondents tended to be found in the Agropastoral/Peanut Livelihood Zone. This concurs with the AA ratings, where poor maintenance of assets in the peanut growing zones was of particular concern, especially in the reforestation category (see Table 5).
2.3 Biophysical Outcomes and Impacts
36. In treatment villages, 82% of focus groups perceived biophysical impacts compared to 18% in CV as illustrated in Table 10 (below). The latter relates to a spillover confirmed by the evaluation where comparison villages copied reforestation and low-land rehabilitation assets (whether it is ANR, reforestation, or a dyke)59, as supported by SPR and partner reports60. Biophysical impacts found in treatment villages were also perceived in 40%61 of comparison villages at proximity, indicating a spillover effect from treatment to comparison villages where non-beneficiary communities copied assets that were perceived successful or relevant, namely from reforestation and low-land rehabilitation assets.
Table 10 Perception of Biophysical Impacts (% of focus groups)
Was there a biophysical impact? Comparison
Villages Treatment
Villages Total
No 80 20 100
Yes 18.42 81.58 100
Total 47.95 52.05 100
(FG, 2013)
37. There was a high perception of biophysical impacts amongst the treatment villages’ informants. FG in treatment villages reported more biophysical impacts than comparison villages (t = 6.5854, p = 0.000). Further analysis suggested that this was likely related to the built asset: using the mean value of the perceived state of the asset as reported in the HHS, the evaluation examined whether or not the asset state was related to biophysical outcomes. While there was no statistical difference
59 A&B Report 60 AA, FG, SSI 61 A&B Report
Nurseries 6 27 107 140
Forest plantations 27 7 37 71
Mangrove regeneration 0 3 57 60
Assisted Natural Regeneration (ANR) 3 14 25 42
Total 38 80 629 747

12
between livelihood zones concerning the existence of biophysical outcomes, there was a substantial and significant relationship between the state of a village’s asset and the report of biophysical outcomes (t = 3.11, p =0.004) 62 . Thus, FG data confirmed that the existence and the quality of an asset did in fact contribute to positive biophysical impacts as seen in Table 11.
Table 11 FG respondents acknowledging biophysical impact of asset by
livelihood zones
Percentages
Livelihood Zone No Yes Total
Agroforestry / Fishing-Tourism 38.89 61.11 100
Agropastoral Peanut 50 50 100
Sylvo-Pastoral 50 50 100
Agro Sylvo-pastoral Food 43.75 56.25 100
Agropastoral Cowpea 75 25 100
Agro Sylvo-Pastorale/ Peanut-Cotton 33.33 66.67 100
Total 47.95 52.05 100
(FG, 2013)
38. These outcomes and impacts related to increased forest cover, soil stability, minimized flooding, increased levels in the water table63, improved water availability and desalinization of well-water in regions where sea level rise had caused salt water intrusion64. The specific biophysical impacts of each of the main category of assets are discussed below based on findings from the evaluation where appropriate measurement indicators were reported 65 ; partners’ reports and evaluations also contributed (see Annex 6.4 for details).
2.3.1 Reforestation Assets
39. Nurseries/Reforestation - Reforestation assets were measured and reported in SPR using varying and inconsistent indicators across projects, partners and years which included: number of ha reforested, number of plants produced in nurseries, and number of seedlings planted which made it difficult to assess the overall impact of assets. At the national global level, SPR reports indicated that every year trees were planted but most partners’ reports did not mention survival rates of plantations or seedlings.
40. Eucalyptus plantations allowed the restoration of salinized soils as the species is salt-resistant allowing recovery of once salinized soils and returning these to arable land66. Nursery assets were able to repatriate species that had been lost to the area such as Moringo Olifiera, Azadirachta Indica, and Acacia Mellifera67. Other species observed by the evaluation team were Acacia Seyal, Acacia Senegal, Acacia
62 Table 4a. Asset State and Impact on Biophysical Outcomes, controlling for Livelihood Zones in Annex 6 63 The planar, underground surface beneath which earth materials, as soil or rock, are saturated with water. (http://dictionary.reference.com/browse/water+table) 64 Saltwater intrusion is the movement of saline water into freshwater aquifers, which can lead to contamination of drinking water sources and other consequences, a phenomenon which occurs along salty water bodies and as exemplified in the deltas of Senegal. (http://ask.reference.com/web?q=Saltwater%20Intrusion&l=dir&qsrc=2891&o=10616 65 AA, HHS, FG, SSI and SPR for the period under review. 66 SSI PERACOD 67 A&B Report – Village profiles

13
raddiana, Acacia nilotica, Prosopis Africana (used as animal forage) et Eucalyptus sp68. These last two serve as firewood, fences, windbreaks and traditional medicine. PAPIL (2008)69 reported a great variability in tree survival rate (ranging from 4 to 51%), with possible non-negligible consequences on medium and long-term impacts of reforestation initiatives. Contributing factors included inability to contain animals for lack of fencing, bush fires, termites and low levels of rainfall. Within the Great Green Wall (GGW)70, the survival rate reported in 2008 was between 60 to 80% which is considered successful71. The PERACOD reported success in recovering salinized degraded collective lands with afforestation on lands provided to families by the rural community72.
41. Assisted Natural Regeneration (ANR) - ANR appeared as an activity under CP 10815.1 where, in 2008, 1,805 hectares were reported to have been protected. Although the assessment of the two ANR assets indicated these were not in the best of states (a score of 1 for Mabo and 3 for Sam Thialene), ANR was however reported by stakeholders to have contributed visibly to improved vegetative cover73. Its associated benefits included a greater availability of organic manure through foliage from reforested or maintained plants, improved availability of firewood, minimization of wind erosion, and the use of trees for traditional medicines. ANR also assisted in soil restoration and prevention against salinization as well as loss of arable land 74 , re-vegetating lands no longer usable. Positive biophysical impacts were also reported in the 2012 evaluation of the World Vision Beysatol project75 (2008-2011 implemented in Kaffrine) where ANR’s advantages are listed by percentages76 - the main one being fertilisation of soil. The World Vision77 evaluation report which promoted ANR as a technique - popularized by the General Direction of Forest and Water/Direction Générale des Eaux et Forêts (DGEF) - described an 85% success rate with FFW mentioned as factor of success78. However, overall, ANR’s success rate was somewhat mixed, as observed by the evaluation.
42. Firewalls79 - Although the evaluation did not have firewalls included in its sample, WFP did build firewalls with FFA to minimize bush fires from 2005-2010.
68 A&B Report – Village profiles 69 PAPIL/CSE, Environmental Monitoring Report/Rapport sur le suivi environnemental (2008) 70 GGW Agency / Agence de la Grande Muraille Verte - Inception report, 2009. The GGW is a multi-country initiative that covers an average width of 15 km between Dakar and Djibouti over a distance of 7000 km. Each participating country has developed a specific implementation strategy developed along the GGW requirements including biophysical, economic, social and cultural factors, and keeping within national policy. 71 The first implementation of the GGW’s new formula launched in August 2008, produced approximately 2,300,000 plants, with the plantation of 7 parcels for a total surface area of 5,200 hectares on village lands between Windou Thiengolly and Tessékéré, in the Rural Commune of Tessékéré, Arrondissement of Yang-Yang. Survival rates were measured at 60 à 80% depending on the parcel. 72 SSI 73FG supported by WFP staff in Tambacounda. 74A&B Report, 2013. Section on the Evaluation of Assets in the Bassin Arachidier 75 World Vision, Beysatol Evaluation Project/ Rapport d’évaluation de Beysatol (Oct. 2012) – Within this evaluation, 480 HHS in 48 communities were conducted. It revealed that the number of ANR adoptees went from 14% to 78% during the project implementation (yearly increase of 64%) among targeted communities. It is further reported that this would have had a great impact on surface land recovery (from 742 ha in 2008 to 39,315 ha in 2011, against a project target of 25 000 ha). This success is largely attributed to the ANR awareness training and capacity building provided to heads of households within the project (78% of HH surveyed reported having been trained, as well as some 4,852 village leaders and 1,104 leaders of local organizations). This report also emphasizes the role of FFA as a factor of success, and FFW was highlighted as a relevant and important initiative within the project. 76 World Vision, Beysatol Evaluation Project/ Rapport d’évaluation de Beysatol (Oct. 2012) – From HHS where ANR advantages are highlighted: soil fertilization (90.3%); rain is more plentiful (74.9%); increased yields (74.4%); minimized wind erosion (67.8%); provided fruit (63.6%), firewood (61.6%), animal fodder (60,8%) and wood for cabinetry (57.3%); had medicinal advantages (58.4%), and other additional sources of income (56.3%) 77 Although not in the sample, World Vision is a major implementation partner of WFP. 78 World Vision, Beysatol Evaluation Project/ Rapport d’évaluation de Beysatol (Oct. 2012) - 5,066 beneficiaries received FFW while only 2, 976 were originally targeted. 79 Creation of this asset, although supported from 2005-2010, was never evaluated79. Unfortunately, construction of firewalls does not seem have stopped the incidence of bush fires that still poses a threat to forests, habitats and homes.

14
One of the reported shocks confronting villages were bushfires, which at times, decimated people’s homes and crops during the period80 (see Annex 6.11, Table 6.11a for a synthesis of reported shocks in the sampled villages). In the projects’ SPR, these firewalls were measured by kilometers, number of trees produced in the protected area by firewalls, in number of ha of forest protected; or, in number of firewalls built81. Once again, the lack of specific (and meaningful indicators) is to be noted.
43. Mangrove regeneration - According to the SPR, mangrove regeneration took place over four years under the PRRO 10188.1 and PRRO 10612.0. A total of 1,576 ha were reportedly planted from 2005 to 2009; this activity was measured by number of plants but in 2008 the activity was also measured in number of seedlings, again making it difficult to assess impact based on the document review. Mangrove regeneration impacts reported to the evaluation related directly to an increased coastal protection and minimization of coastal erosion82. Based on the observations of actual FFA projects by the evaluators in the region of Ziguinchor, a major visible restoration of the marine ecosystem is underway83. The presence of a technical NGOs (OCEANIUM) alongside with other WFP partners contributed to this success. 2.3.2. Lowland rehabilitation/anti-salt dykes and micro-ridged plots
44. In the SPR, a wide range of assets refer to this category (dams, dykes, sea walls, anti-salt earthen dikes, flood protection dykes) – once again - with as many indicators: number of dykes, length of dykes (miles), number of ha protected and developed for both rice and banana cultivation, as well as measured in kg of rice.
45. Micro-ridged plots and anti-salt dykes were among the more popular assets84 largely attributable to the recovery of salinized soils and biodiversity85 found in the three programs86. The recovery of salinized soil seems to have been the greatest positive biophysical impact as perceived by beneficiaries resulting in the restoration of cultivable irrigated rice and dry land gardens 87 . Other biophysical impacts included: desalinization of water in wells, improvement of the vegetative cover, reduction of gully erosion, and enrichment of organic matter88. Beneficiaries also learned to master water management through the creation of dykes and micro-ridged plots89. The African Development Bank (ADB), who funds PAPIL, underlined the importance of building simple, appropriate and high demand assets such as anti-salt dykes which allow recovery of salinized soils along the many deltas of Senegal90.
2.3.3 Community gardens and associated nurseries
46. From 2005-2008, community gardens were supported according to the SPR, mainly through the CP 91 . These activities, largely measured in hectares, were reported to have resulted in 1,805 ha of gardens with agroforestry models that introduced trees into gardens. Although there is evidence of numerous gardens
80 FG and HHS 81 See Annex 11 based on SPR reviews by evaluation team 82 HHS, AA, SSI and partner project reports 83 As recorded in the film OCEANIUM has made of its success in improving biodiversity and as observed by evaluation team flying over Casamance 84 These assets were mentioned in SSI, AA, HHS as well as in the spillover effects where many had built dykes prior to receiving FFA. 85 Restoration of biodiversity of flora and fauna (fish, pelicans, cranes etc.). 86 SSI, FG, AA 87 SSI, document reports, FG, HHS 88 A&B Report, Section Impacts Biophysiques 89 SSI 90 SSI 91 SPR, 2005 to 2008
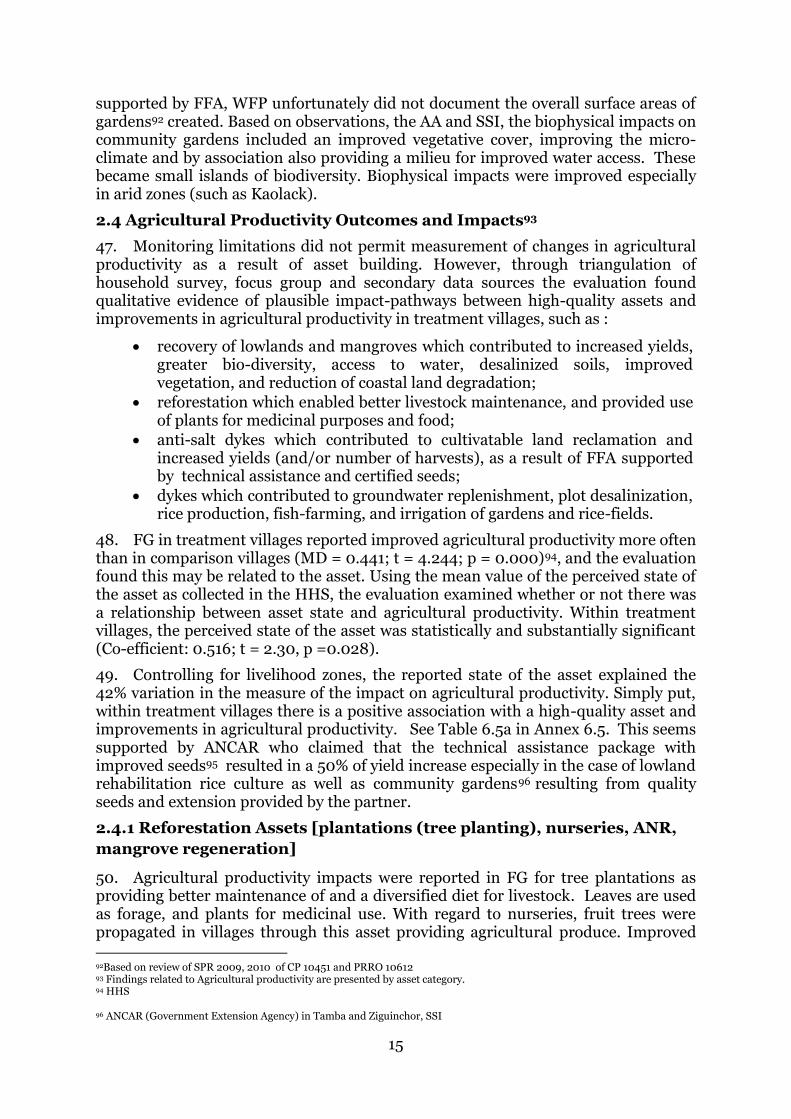
15
supported by FFA, WFP unfortunately did not document the overall surface areas of gardens92 created. Based on observations, the AA and SSI, the biophysical impacts on community gardens included an improved vegetative cover, improving the micro-climate and by association also providing a milieu for improved water access. These became small islands of biodiversity. Biophysical impacts were improved especially in arid zones (such as Kaolack).
2.4 Agricultural Productivity Outcomes and Impacts93
47. Monitoring limitations did not permit measurement of changes in agricultural productivity as a result of asset building. However, through triangulation of household survey, focus group and secondary data sources the evaluation found qualitative evidence of plausible impact-pathways between high-quality assets and improvements in agricultural productivity in treatment villages, such as :
recovery of lowlands and mangroves which contributed to increased yields, greater bio-diversity, access to water, desalinized soils, improved vegetation, and reduction of coastal land degradation;
reforestation which enabled better livestock maintenance, and provided use of plants for medicinal purposes and food;
anti-salt dykes which contributed to cultivatable land reclamation and increased yields (and/or number of harvests), as a result of FFA supported by technical assistance and certified seeds;
dykes which contributed to groundwater replenishment, plot desalinization, rice production, fish-farming, and irrigation of gardens and rice-fields.
48. FG in treatment villages reported improved agricultural productivity more often than in comparison villages (MD = 0.441; t = 4.244; p = 0.000)94, and the evaluation found this may be related to the asset. Using the mean value of the perceived state of the asset as collected in the HHS, the evaluation examined whether or not there was a relationship between asset state and agricultural productivity. Within treatment villages, the perceived state of the asset was statistically and substantially significant (Co-efficient: 0.516; t = 2.30, p =0.028).
49. Controlling for livelihood zones, the reported state of the asset explained the 42% variation in the measure of the impact on agricultural productivity. Simply put, within treatment villages there is a positive association with a high-quality asset and improvements in agricultural productivity. See Table 6.5a in Annex 6.5. This seems supported by ANCAR who claimed that the technical assistance package with improved seeds95 resulted in a 50% of yield increase especially in the case of lowland rehabilitation rice culture as well as community gardens96 resulting from quality seeds and extension provided by the partner.
2.4.1 Reforestation Assets [plantations (tree planting), nurseries, ANR,
mangrove regeneration]
50. Agricultural productivity impacts were reported in FG for tree plantations as providing better maintenance of and a diversified diet for livestock. Leaves are used as forage, and plants for medicinal use. With regard to nurseries, fruit trees were propagated in villages through this asset providing agricultural produce. Improved
92Based on review of SPR 2009, 2010 of CP 10451 and PRRO 10612 93 Findings related to Agricultural productivity are presented by asset category. 94 HHS 96 ANCAR (Government Extension Agency) in Tamba and Ziguinchor, SSI

16
pastures resulting from ANR reportedly were better maintained providing a higher and more diversified diet for livestock. Leaves are also used as forage, and plants for medicinal use97. According to SPR, ANR in the CP 10451.1, 1805 ha were protected in 200898.
2.4.2 Lowland rehabilitation [anti-salt dykes and micro-ridged plots]
51. Anti-salt dykes built in Casamance contributed to secure land for rice and banana cultivation with reported significant increased yields99 (see Annex 7). The 2006 SPR indicated 95 anti-salt dykes and 124 dykes reinforced as well as a production of 78,142 tons of rice; in 2007, 112 small dykes were built for total length of 192 km100. (See Tables 11.2 and 11.3, Annex 11). Documents established that 84,689 ha of land were reclaimed for agriculture by lowland, land clearing and development of rice paddies (often recorded as dykes and/or small dykes/micro-ridged plots) 101 . Water retention from dykes allowed rice production and fish farming 102 while also contributing to agricultural soil recovery and agricultural productivity. Irrigation of dry land gardens and rice cultivation resulted in significant rice yields increases (from 300Kg/ha in 2010 to over 3 tons/ha in 2012, in some cases increasing from two to three crops a year as a result of FFA intervention, technical assistance, and certified seeds103. Food contributed through FFA reportedly allowed better plot management in micro-ridged plots in the Fatick Region104. It should be noted that despite the above, 95% of the dykes observed remain unfinished105.
2.4.3 Community Gardens and Associated Nurseries
52. SPR and monitoring reports from WFP sub-offices had no information on the agricultural productivity of gardens but partners’ reports provided some information106. Agricultural productivity resulting from the creation of community gardens and associated nurseries proved to be the most beneficial (especially for women’s incomes) contributing to improved diversified nutritional habits with both short-term and long-term impacts. According to the HHS, many gardens are still operational providing fruit and vegetables to beneficiaries. Fruit trees such as oranges which had ceased to grow because of salinized soils are now growing again107.
2.5 Food Security Outcomes and Impacts
53. It is reported that in some instances, as a result of FFA in support to the creation of anti-salt dykes, participants went from 2 - 6 months’ range of food sufficiency to 9 months108 as confirmed through partner reports and through SSI (see Section 2.3/2.4on anti-salt dykes). Data on number of meals eaten was collected by the evaluation through HHS as illustrated in Table 12 below. Annex 6.6 (Tables –6.6a to 6.6f) presents additional food consumption and food security data.
97A&B Report, section Évaluation des actifs dans la zone du bassin arachidier 98 SPR 2008. CP 10451.1 99SSI, observations of team, AA 100 SPR 2007 of PRRO 10888.1 101 SPR 2005-2010 102 SSI PAPIL 103 PAPIL Impact Study on the Fatick region (2010) 104 PAPIL SSI, 2013 105 A&B Report 2013 106 Namely the 2012 WV Evaluation Report (Beysatol) which provided figures on the production levels of community gardens. 107 FG, SSI. 2013 108 PAPIL, SSI, 2013.

17
Table 12 Number of Meals Eaten per Day by Age Group (%)
0 1 2 3 4 5 6 7 8 9 Total
Treatment Villages Non-Beneficiaries
Adults (> 18 years) 0 0 7.04 92.11 0.56 0.2
8
0 0 0 0 100.0
0
Youth (6 - 18 years) 0.8
5
0 3.95 91.5
3
3.39 0.2
8
0 0 0 0 100.0
0
Children (6 months - 5
years)
1.43 0 1.43 66.2
9
27.2
1
3.14 0 0 0 0 100.0
0
Treatment Villages Beneficiaries
Adults (> 18 years) 0 0.2
1
19.19 80.1
7
0.43 0 0 0 0 0 100.0
0
Youth (6 - 18 years) 0 0 0 8.66 87.0
1
3.4
6
0.4
3
0.1
3
0 0 100.0
0
Children (6 months - 5
years)
0 0 5.13 56.8
8
31.2
4
6.0
6
0 0.7 0 0 100.0
0
Comparison Villages Non-Beneficiaries
Adults (> 18 years) 0 3.2
5
20.7
8
75.8
4
0.13 0 0 0 0 0 100.0
0
Youth (6 - 18 years) 0.2
6
1.31 12.19 82.4
4
3.54 0.1
3
0 0 0 0.1
3
100.0
0
Children (6 months - 5
years)
1.24 0.2
8
8.23 62.9 21.3
8
5.1 0.4
1
0.2
8
0 0.1
4
100.0
0
(HHS, 2013)
54. A significant difference between non-beneficiaries and beneficiaries within treatment villages, with beneficiary adults eating fewer meals each day than non-beneficiaries (t = 5.193, p =0.00) was observed. While this seems counter-intuitive, adults were eating fewer meals of better quality and/or sharing food with children (reported to eat more meals than the non-beneficiaries children). See Table 15.
55. Within treatment villages, there is no statistical difference between the number of meals eaten each day by youth (t = 0.018). However, the difference between treatment and comparison villages is significant, if small (t = 3.50, p = 0.00). Youth in treatment villages, on average, eat 0.1 more meals per day than their counterparts in the comparison villages (Annex 6.6 - Table 6.6c).
56. Looking at the number of meals eaten by children each day, we see a strong effect of being a beneficiary on the number of meals eaten. Beneficiaries within treatment villages reported their children ate more meals than non-beneficiaries (mean difference = 0.127, t = 2.47, p = 0.014). A similar trend was seen between comparison and treatment villages, with treatment villages reporting that their children ate more meals than comparison respondents (mean difference = 0.131, t = 3.24, p = 0.001) (See Annex 6.6 – Table 6.6d).
57. From the HHS, there were significant differences in food consumption patterns between non-beneficiary and beneficiaries, as well as between treatment and comparison villages, as shown in Table 13:
Table 13 Food Consumption Patterns Comparison

18
Beneficiaries vs. non-Beneficiaries
Treatment vs. Comparison
Cereals -1.1773 0.217
Starches -4.8098*** -3.2629***
Legumes (Pulses) -8.2836*** -3.1707***
Leaves and green vegetables, cabbage and other vegetables
-4.0836*** 0.4880
Fruits 12.0783*** 0.4270
Meat, Fish, Eggs, etc. 1.9113** 3.1247***
Milk, curd, etc. -4.4042*** -3.2259***
Sugar and other sugar products -4.4573*** -0.2193
Oils, fats, butter, etc. -2.8753*** 1.1545
** p = 0.95, *** p = 0.99
HHS, 2013
58. Table 13 above shows that people in the treatment villages tended to eat less starch, with direct beneficiaries eating less than the non-beneficiaries. The same pattern was true for pulses and milk products. While there appeared to be no significant difference between treatment and comparison villages in terms of vegetable, sugar or fat consumption, within treatment villages, beneficiaries consumed these food items less often than non-beneficiaries, a potential indicator of poverty. The largest difference reported relates to fruit consumption, with beneficiaries eating fruit much more often than non-beneficiaries. There were no differences between treatment and comparison groups. Indeed, beneficiaries reported that they ate fruit an average of 5.67 times per week, versus the non-beneficiary average of 3.45 times. Comparison villages consumed fruit an average of 4.65 times per week. Figures disaggregated by agro-ecological zones are provided In Annex 6.6. In particular, community gardens and agroforestry which promoted both fruit and nut trees are reported to have contributed to greater food security109.
59. There were also higher rates of meat consumption in treatment villages, and within the beneficiary group. The difference between the beneficiary and non-beneficiary groups was lower, however, with the benefit of higher meat consumption being distributed to the entire community. When asked about food availability as it affected food security, 68% of men in treatment villages versus 53% of women thought food security had improved (no gender difference in comparison villages). Table 14 illustrates that overall, FG respondents in CV, had a grimmer perception on their food security than those in TV.
Table 14 FG Perception that Food Security/Food Availability Improved
Percentage
Treatment Villages: Male 68.42
Treatment Villages: Female 52.63
Treatment Villages: Total 60.53 Comparison Villages: Male 36.84 Comparison Villages: Female 36.84 Comparison Villages: Total 36.84
(FG, 2013)
109 SSI, HHS, FG

19
60. In general, (85%) of HHS respondents felt that FFA improved their food security at the time it was received in treatment villages, without real difference between men and women’s perceptions. See Table 15.
Table 15 HHS Respondents – Perceived Improvement in Food Security
Did FFA improve your food security? Gender
Male Female Total
No 16.81 12.93 14.89
Yes 83.19 87.07 85.11
Total 100 100 100
(HHS 2013)
61. FG responses on how food security was affected by FFA included increased diversity in foods and surplus foods sold although how frequently this occurred was not measurable. Some reported increased yields providing more food for the family but exact measurements of this improved yield could also not be proven through HHS. Food security may have been less than described especially as so many dyke assets remained unfinished and where commitment to work and or maintenance without food distribution was low. In the case of nurseries, efforts to maintain these fell to a small number of beneficiaries, many of whom claimed food entitlements were marginal, perhaps explaining the low survival rates.
62. Fifty percent of women in FG in treatment villages perceived an overall impact on vulnerability110 (Annex 6.6 – Table 6.6g).
2.6 Outcomes and Impacts on Livelihoods
63. Evaluation questions on livelihoods focused on– Would FFA contribute to enhanced and restored livelihoods to the extent that: (1) increased yields from rice culture from recovered land enabled food production; (2) gardens would provide a sustainable production of fruits and vegetables for family consumption and surplus for sale; (3) plantations would provide a sustainable source of income from wood, fruit, and forage; and (4) regenerated mangroves would restore marine biodiversity and aquatic ecosystems providing increased amounts of fish and seafood. According to studies on the Sahel111, ANR allowed for a better protection against drought providing firewood and other products which could be sold in the event of a crisis.
64. Perceptions of improved livelihoods varied between beneficiary/non-beneficiary groups and between treatment and comparison villages, with beneficiaries and treatment villages faring better, as shown in Annex 6.7 – Table 6.7a; beneficiaries of TV thought livelihoods had significantly improved by almost 59% compared to non-beneficiaries (43%), and compared with 39% for non-beneficiaries of the comparison villages. Overall, the perceived improvement to livelihoods by respondents in treatment villages was higher by some 13% over respondents in comparison villages. This may be attributable to the Hawthorne effect 112 . Perceived effects in non-treatment villages could be explained by
110 There is no information on vulnerability with regard to men, nor was this information obtained from comparison villages. 111 Chris, Reij, November 2012. Pathways to scaling re-greening successes in Africa’s dryland, in African re-greening update, NO.5 112 The Hawthorne effect (commonly referred to as the observer effect) is a form of reactivity whereby subjects improve or modify an aspect of their behaviour, which is being experimentally measured, in response to the fact that they know that they are being studied,[1][2] not in response to any particular experimental manipulation. http://en.wikipedia.org/wiki/Hawthorne_effect
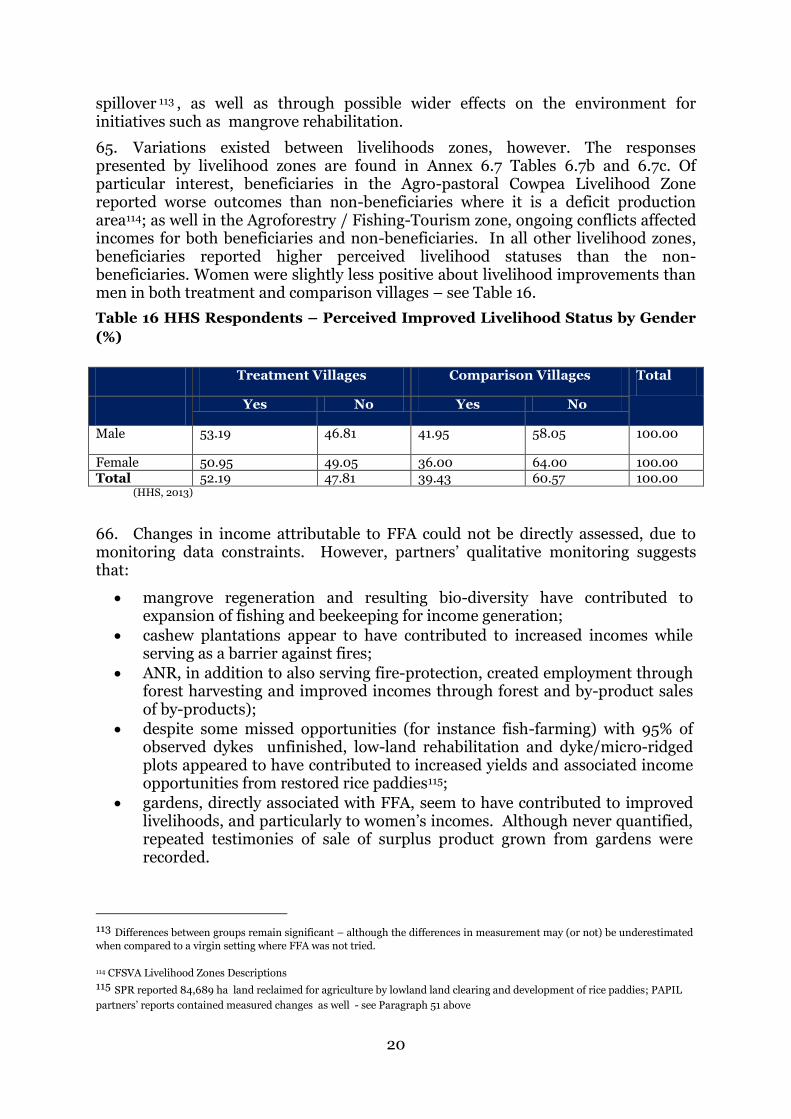
20
spillover 113 , as well as through possible wider effects on the environment for initiatives such as mangrove rehabilitation.
65. Variations existed between livelihoods zones, however. The responses presented by livelihood zones are found in Annex 6.7 Tables 6.7b and 6.7c. Of particular interest, beneficiaries in the Agro-pastoral Cowpea Livelihood Zone reported worse outcomes than non-beneficiaries where it is a deficit production area114; as well in the Agroforestry / Fishing-Tourism zone, ongoing conflicts affected incomes for both beneficiaries and non-beneficiaries. In all other livelihood zones, beneficiaries reported higher perceived livelihood statuses than the non-beneficiaries. Women were slightly less positive about livelihood improvements than men in both treatment and comparison villages – see Table 16.
Table 16 HHS Respondents – Perceived Improved Livelihood Status by Gender
(%)
Treatment Villages Comparison Villages Total
Yes No Yes No
Male 53.19 46.81 41.95 58.05 100.00
Female 50.95 49.05 36.00 64.00 100.00 Total 52.19 47.81 39.43 60.57 100.00
(HHS, 2013)
66. Changes in income attributable to FFA could not be directly assessed, due to monitoring data constraints. However, partners’ qualitative monitoring suggests that:
mangrove regeneration and resulting bio-diversity have contributed to expansion of fishing and beekeeping for income generation;
cashew plantations appear to have contributed to increased incomes while serving as a barrier against fires;
ANR, in addition to also serving fire-protection, created employment through forest harvesting and improved incomes through forest and by-product sales of by-products);
despite some missed opportunities (for instance fish-farming) with 95% of observed dykes unfinished, low-land rehabilitation and dyke/micro-ridged plots appeared to have contributed to increased yields and associated income opportunities from restored rice paddies115;
gardens, directly associated with FFA, seem to have contributed to improved livelihoods, and particularly to women’s incomes. Although never quantified, repeated testimonies of sale of surplus product grown from gardens were recorded.
113 Differences between groups remain significant – although the differences in measurement may (or not) be underestimated
when compared to a virgin setting where FFA was not tried.
114 CFSVA Livelihood Zones Descriptions
115 SPR reported 84,689 ha land reclaimed for agriculture by lowland land clearing and development of rice paddies; PAPIL
partners’ reports contained measured changes as well - see Paragraph 51 above
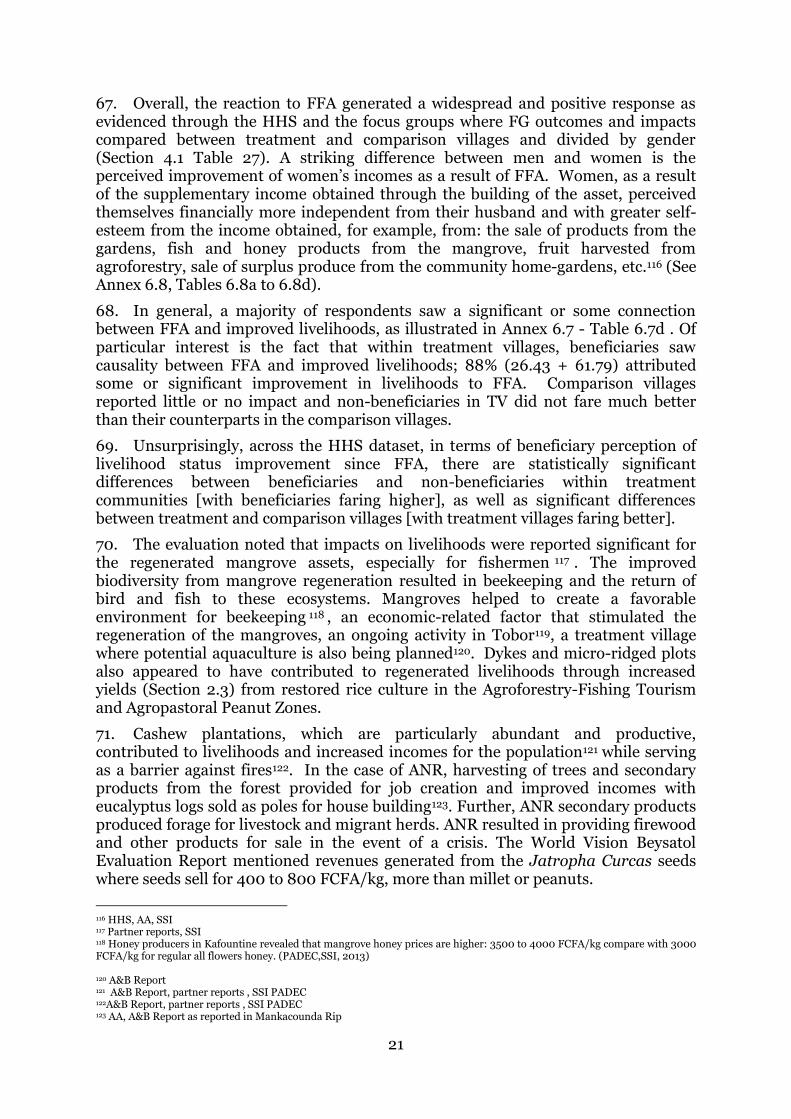
21
67. Overall, the reaction to FFA generated a widespread and positive response as evidenced through the HHS and the focus groups where FG outcomes and impacts compared between treatment and comparison villages and divided by gender (Section 4.1 Table 27). A striking difference between men and women is the perceived improvement of women’s incomes as a result of FFA. Women, as a result of the supplementary income obtained through the building of the asset, perceived themselves financially more independent from their husband and with greater self-esteem from the income obtained, for example, from: the sale of products from the gardens, fish and honey products from the mangrove, fruit harvested from agroforestry, sale of surplus produce from the community home-gardens, etc.116 (See Annex 6.8, Tables 6.8a to 6.8d).
68. In general, a majority of respondents saw a significant or some connection between FFA and improved livelihoods, as illustrated in Annex 6.7 - Table 6.7d . Of particular interest is the fact that within treatment villages, beneficiaries saw causality between FFA and improved livelihoods; 88% (26.43 + 61.79) attributed some or significant improvement in livelihoods to FFA. Comparison villages reported little or no impact and non-beneficiaries in TV did not fare much better than their counterparts in the comparison villages.
69. Unsurprisingly, across the HHS dataset, in terms of beneficiary perception of livelihood status improvement since FFA, there are statistically significant differences between beneficiaries and non-beneficiaries within treatment communities [with beneficiaries faring higher], as well as significant differences between treatment and comparison villages [with treatment villages faring better].
70. The evaluation noted that impacts on livelihoods were reported significant for the regenerated mangrove assets, especially for fishermen 117 . The improved biodiversity from mangrove regeneration resulted in beekeeping and the return of bird and fish to these ecosystems. Mangroves helped to create a favorable environment for beekeeping 118 , an economic-related factor that stimulated the regeneration of the mangroves, an ongoing activity in Tobor119, a treatment village where potential aquaculture is also being planned120. Dykes and micro-ridged plots also appeared to have contributed to regenerated livelihoods through increased yields (Section 2.3) from restored rice culture in the Agroforestry-Fishing Tourism and Agropastoral Peanut Zones.
71. Cashew plantations, which are particularly abundant and productive, contributed to livelihoods and increased incomes for the population121 while serving as a barrier against fires122. In the case of ANR, harvesting of trees and secondary products from the forest provided for job creation and improved incomes with eucalyptus logs sold as poles for house building123. Further, ANR secondary products produced forage for livestock and migrant herds. ANR resulted in providing firewood and other products for sale in the event of a crisis. The World Vision Beysatol Evaluation Report mentioned revenues generated from the Jatropha Curcas seeds where seeds sell for 400 to 800 FCFA/kg, more than millet or peanuts.
116 HHS, AA, SSI 117 Partner reports, SSI 118 Honey producers in Kafountine revealed that mangrove honey prices are higher: 3500 to 4000 FCFA/kg compare with 3000 FCFA/kg for regular all flowers honey. (PADEC,SSI, 2013) 120 A&B Report 121 A&B Report, partner reports , SSI PADEC 122A&B Report, partner reports , SSI PADEC 123 AA, A&B Report as reported in Mankacounda Rip
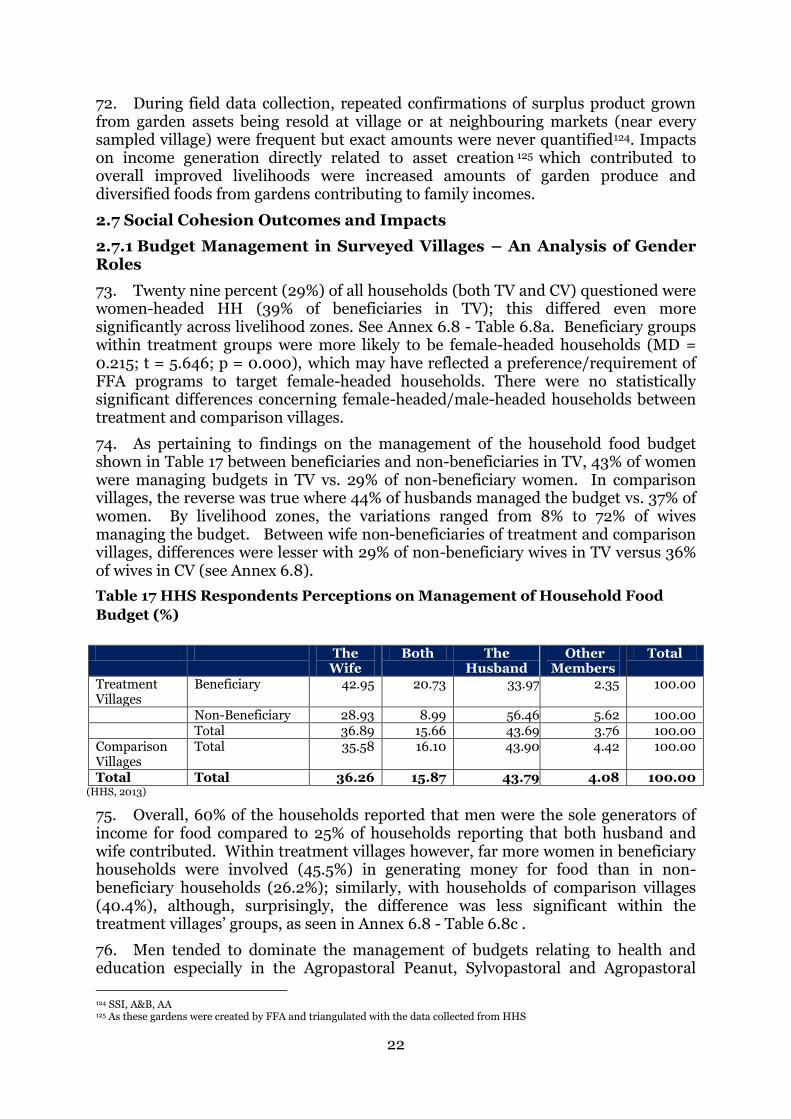
22
72. During field data collection, repeated confirmations of surplus product grown from garden assets being resold at village or at neighbouring markets (near every sampled village) were frequent but exact amounts were never quantified124. Impacts on income generation directly related to asset creation 125 which contributed to overall improved livelihoods were increased amounts of garden produce and diversified foods from gardens contributing to family incomes.
2.7 Social Cohesion Outcomes and Impacts
2.7.1 Budget Management in Surveyed Villages – An Analysis of Gender Roles
73. Twenty nine percent (29%) of all households (both TV and CV) questioned were women-headed HH (39% of beneficiaries in TV); this differed even more significantly across livelihood zones. See Annex 6.8 - Table 6.8a. Beneficiary groups within treatment groups were more likely to be female-headed households (MD = 0.215; t = 5.646; p = 0.000), which may have reflected a preference/requirement of FFA programs to target female-headed households. There were no statistically significant differences concerning female-headed/male-headed households between treatment and comparison villages.
74. As pertaining to findings on the management of the household food budget shown in Table 17 between beneficiaries and non-beneficiaries in TV, 43% of women were managing budgets in TV vs. 29% of non-beneficiary women. In comparison villages, the reverse was true where 44% of husbands managed the budget vs. 37% of women. By livelihood zones, the variations ranged from 8% to 72% of wives managing the budget. Between wife non-beneficiaries of treatment and comparison villages, differences were lesser with 29% of non-beneficiary wives in TV versus 36% of wives in CV (see Annex 6.8).
Table 17 HHS Respondents Perceptions on Management of Household Food
Budget (%)
The Wife
Both The Husband
Other Members
Total
Treatment Villages
Beneficiary 42.95 20.73 33.97 2.35 100.00
Non-Beneficiary 28.93 8.99 56.46 5.62 100.00
Total 36.89 15.66 43.69 3.76 100.00
Comparison Villages
Total 35.58 16.10 43.90 4.42 100.00
Total Total 36.26 15.87 43.79 4.08 100.00 (HHS, 2013)
75. Overall, 60% of the households reported that men were the sole generators of income for food compared to 25% of households reporting that both husband and wife contributed. Within treatment villages however, far more women in beneficiary households were involved (45.5%) in generating money for food than in non-beneficiary households (26.2%); similarly, with households of comparison villages (40.4%), although, surprisingly, the difference was less significant within the treatment villages’ groups, as seen in Annex 6.8 - Table 6.8c .
76. Men tended to dominate the management of budgets relating to health and education especially in the Agropastoral Peanut, Sylvopastoral and Agropastoral
124 SSI, A&B, AA 125 As these gardens were created by FFA and triangulated with the data collected from HHS

23
Cowpea Zones. In treatment villages overall, 51% of men dominated decision making in health and education – however the extensive women’s involvement in beneficiary groups in treatment villages was noted (59%), compared to the overall sample where only 49% of women were engaged). For health and education, budgets were managed similarly as seen in Annex 6.8 Table 6.8d where husbands tended to dominate decision making in most zones, except in the Agroforestry/Fishing Tourism zone where the sharing of decision making appeared more egalitarian – 29.89% vs. 25.26%.
2.7.2 The role of FFA in Women and Decision-making
77. Some 39% of beneficiary households in TV were female headed, compared with an average of 29% for all HHS respondents (Table 6.8a. Annex 6.8). As illustrated in Table 18, beneficiaries within treatment villages were more likely to be women-headed than non-beneficiaries within treatment villages (MD = 0.312, t = 5.646, p = 0.99) which may indicate that women-headed households were actively being targeted by FFA programs.
Table 18 HHS Women Headed Households
Beneficiary vs. Non-Beneficiary (Treatment
Villages)
Treatment Villages vs. Comparison Villages
Female Headed Households
0.312***
(5.646)
0.045
(1.683) Mean values reported, t-test in parentheses; ** p = 0.95, *** p = 0.99(HHS 2013)
78. The high levels of female-headed households of the Agroforestry-Fishing-Tourism Zone in Casamance may be explained by the outmigration of men who seek work outside the war zone indicating that the FFA targeting strategy may be reaching some of the vulnerable. Some projects also ensured women were signatories for receiving food as a means of ensuring its proper use for the family126.
79. Generally, gender balanced participation in FFA provided opportunities for women to participate not only in the construction of assets but in decisions surrounding these. FFA seems to have contributed to improved decision making ability of women and improved organisation as confirmed by 44% of respondents in HHS and 42% of FG. In the Sylvopastoral and Agropastoral Cowpea Zones, women’s decision-making potential was not reported possibly because of the majority of male respondents to HHS. See Table 19.
Table 19 HHS Respondents Perception of Women’s Empowerment (%)
Improvements in Decision-Making or ability of women to express themselves since
FFA %s
Are women better organized after FFA? %
No Yes Total No Yes Total Livelihood Zone
Agroforestry / Fishing Tourism
60.00 40.00 100.00 60.00 40.00 100.00
Agropastoral Peanut
60,00 40.00 100.00 66.67 33.33 100.00
Sylvo Pastoral 100.00 0.00 100.00 100.00 0.00 100.00
Agro-Sylvopastoral/Food
25.00 75.00 100.00 25.00 75.00 100.00
Agropastoral 100.00 0.00 100.00 100.00 0.00 100.00
126 Although, this practice of having women sign for food distribution is encouraged in WFP guidelines, it was not a requirement.

24
Improvements in Decision-Making or ability of women to express themselves since
FFA %s
Are women better organized after FFA? %
No Yes Total No Yes Total Cowpea
Agro Sylvo-Pastorale / Peanut-Cotton
0.00 100.00 100.00 0.00 100.00 100.00
Total Total 55.56 44.44 100.00 57.89 42.11 100.00 (HHS, 2013 - Question 1) (Female FG 2013, Question 2)
80. Amongst beneficiaries in treatment villages, most of the respondents felt that the impacts of FFA were distributed equitably between men and women. Again, the variations were non-negligible variations between livelihood zones (See Annex 6.8 , Table 6.8j).
81. Finally, relating to FFA impact on social cohesion, the evaluation observed that at the village level, FFA food distribution processes and work norms were not always consistent, clear or respected; actual food distribution modalities varied between places and partners, and there was little evidence of standard application of work norms in relation to work completed. Many informants cited partner inability or unwillingness to adhere to norms at times of distribution resulting in perceived inequities of food distribution. The importance of transparent and consistent implementation management was further illustrated by non-beneficiary feedback of perceived village and participant selection bias, with undue influence by elite interests. The evaluation observed reports that such issues fed speculation and ultimately in some regions to perceptions that FFA contributes to conflicts between pastoralist and agriculturists over pasture, fodder and/or asset location.
2.7.3 Social and Institutional Analysis
82. Participation in FFA required the development of working committees that received and distributed the food, thereby encouraging village organizations to form and evolve. However, the role of women in the village’s organisation did not provide new evidence as all villages had women’s groups except one comparison village; therefore, these could not be directly linked to FFA interventions. An overview of other organizations involved in both treatment and comparison villages numbered 99 organizations 127 which may have influenced the welfare and livelihoods in sampled villages. For a complete discussion on social and organizational impacts, see Annex 6.8 tables 6.8f to 6.8k.
2.8 Outcomes and Impacts on Resilience (Tables 9a to 9g in Annex 6.9)
2.8.1 Impacts on Vulnerability
83. Appropriate metrics for resilience measurement remain problematic in WFP and elsewhere. The main domains selected by the evaluation were: increased ability to handle shock, coping strategies and livelihoods’ opportunities. The evaluation tested perceptions rather than attempting a direct estimation and the results were broadly demonstrated through a consistent focus group participants’ interpretation. Table 20 shows that men felt more resilient than women as they also did in food security and livelihoods in both treatment and comparison villages, with a greater gap in the latter.
127 From a compilation of aid-related organizations reported in HHS
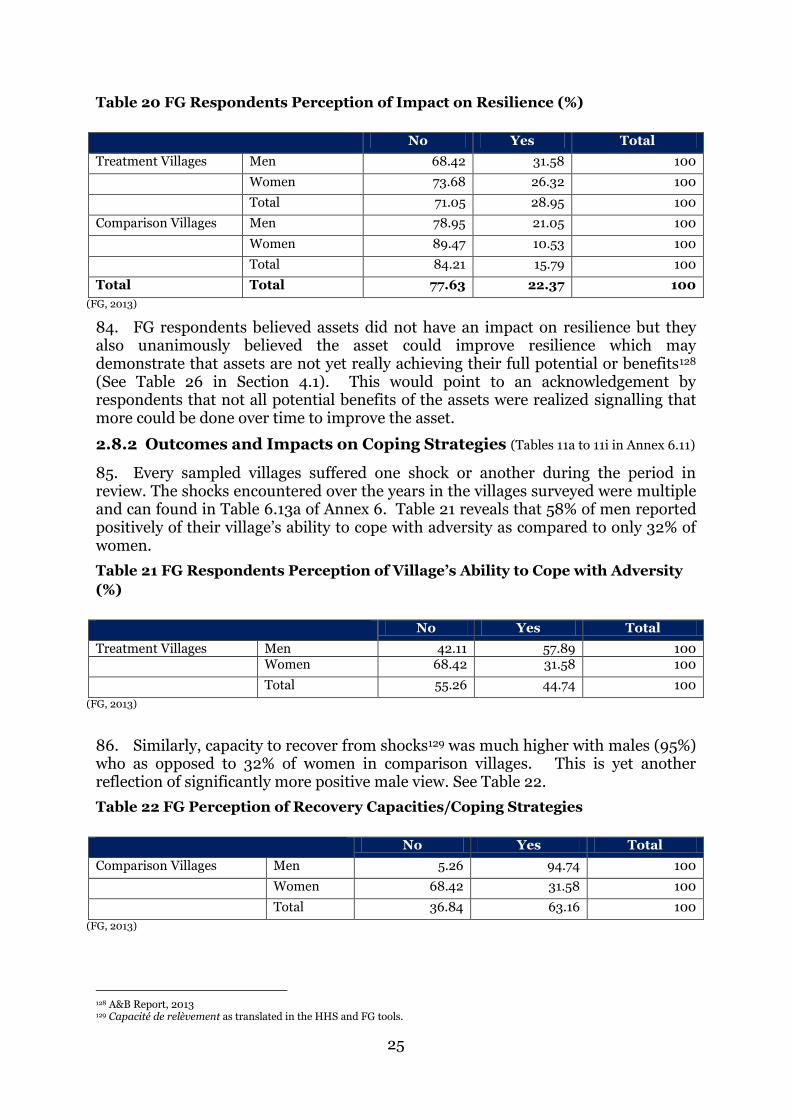
25
Table 20 FG Respondents Perception of Impact on Resilience (%)
No Yes Total
Treatment Villages Men 68.42 31.58 100
Women 73.68 26.32 100
Total 71.05 28.95 100
Comparison Villages Men 78.95 21.05 100
Women 89.47 10.53 100
Total 84.21 15.79 100
Total Total 77.63 22.37 100
(FG, 2013)
84. FG respondents believed assets did not have an impact on resilience but they also unanimously believed the asset could improve resilience which may demonstrate that assets are not yet really achieving their full potential or benefits128 (See Table 26 in Section 4.1). This would point to an acknowledgement by respondents that not all potential benefits of the assets were realized signalling that more could be done over time to improve the asset.
2.8.2 Outcomes and Impacts on Coping Strategies (Tables 11a to 11i in Annex 6.11)
85. Every sampled villages suffered one shock or another during the period in review. The shocks encountered over the years in the villages surveyed were multiple and can found in Table 6.13a of Annex 6. Table 21 reveals that 58% of men reported positively of their village’s ability to cope with adversity as compared to only 32% of women.
Table 21 FG Respondents Perception of Village’s Ability to Cope with Adversity
(%)
No Yes Total
Treatment Villages Men 42.11 57.89 100 Women 68.42 31.58 100
Total 55.26 44.74 100
(FG, 2013)
86. Similarly, capacity to recover from shocks129 was much higher with males (95%) who as opposed to 32% of women in comparison villages. This is yet another reflection of significantly more positive male view. See Table 22.
Table 22 FG Perception of Recovery Capacities/Coping Strategies
No Yes Total
Comparison Villages Men 5.26 94.74 100
Women 68.42 31.58 100
Total 36.84 63.16 100
(FG, 2013)
128 A&B Report, 2013 129 Capacité de relèvement as translated in the HHS and FG tools.

26
2.8.4 Migration
87. Migration is a rural coping strategy of the lean season and a means of adaptation to food insecurity. According to the A&B Report130, outmigration is a current and important recourse in surveyed villages to shocks which caused severe economic repercussions during the lean season. See Table 23 (and Annex 6.11), as well as Annex 6.6 (table 6.6g).
Table 23 HHS Respondents Perception – Migration as a current practice, by
Livelihood Zones (%)
Yes No Total Agroforestry / Fishing-Tourism
11.88 88.12 100.00
Agro-Sylvo Pastoral / Food 12.50 87.50 100.00 Agro Sylvo-Pastorale / Peanut-Cotton
11.11 88.89 100.00
Total 11.84 88.16 100.00 (HHS, 2013)
88. Unfortunately, with respect to migration, the question was not asked across the sample across all zones despite migration being a usual strategy of coping during lean times across the country131. According to many informants however, all assets in all zones would have contributed to reduced levels of outmigration especially during the season of food distribution132. Food distributions had a positive impact on lessening temporary migrations and augmented participation in building the asset. FFA benefits for the community allowed the father and sometimes the mother to remain at home during the lean season, as it provided an employment opportunity and immediate source of food. Moreover, participants who stayed in the village to cultivate their fields consequently reaped better crops than if they had migrated133.
Unintended Effects
89. A spillover effect impact can be explained by virtue of proximity of treatment toward comparison villages (neighborly relationships, kinship possible sharing of food between family and villages at the time of the FFA distributions and through emulation of assets). Other types of food distributions may have occurred which caused people to assume their entitlement was linked to the asset creation where villagers from nearby villages may have contributed, as they had traditionally done with asset construction134. Respondents had difficulty recalling donors and projects, limiting the ability of the evaluation to attribute FFA impacts directly to FFA.
90. Concerning FFA biophysical and livelihoods impacts, significant positive spillover effects were reported in 39% of comparison villages, as summarised in Table 24. This suggests that FFA programs do a good job in improving the outcomes for more than simply the beneficiaries in the treatment villages 135 . However, treatment villages reported much higher levels of spillover effects (on non-
130 FG, SSI, AA 131 This data was not asked as part of the HHS except for Casamance but was collected informally by the local coordinator who supervised the A&B data collection team. HHS question 8.21 .21. Votre village a-t-il connu des migrations ou des déplacements dus au conflit en Casamance?/Did your village experience outmigration due to the conflict in Casamance? 132 SSI, A&B Report 133 SSI, AA, FG 134 A&B Report 135 Data on spillover was collected from FG so there is no differentiation between beneficiaries and non-beneficiaries. The distance of TV to CV was not systematically collected but one criteria for CV selection was to be 1 km from the TV - where reported, it is provided in the A&B Report
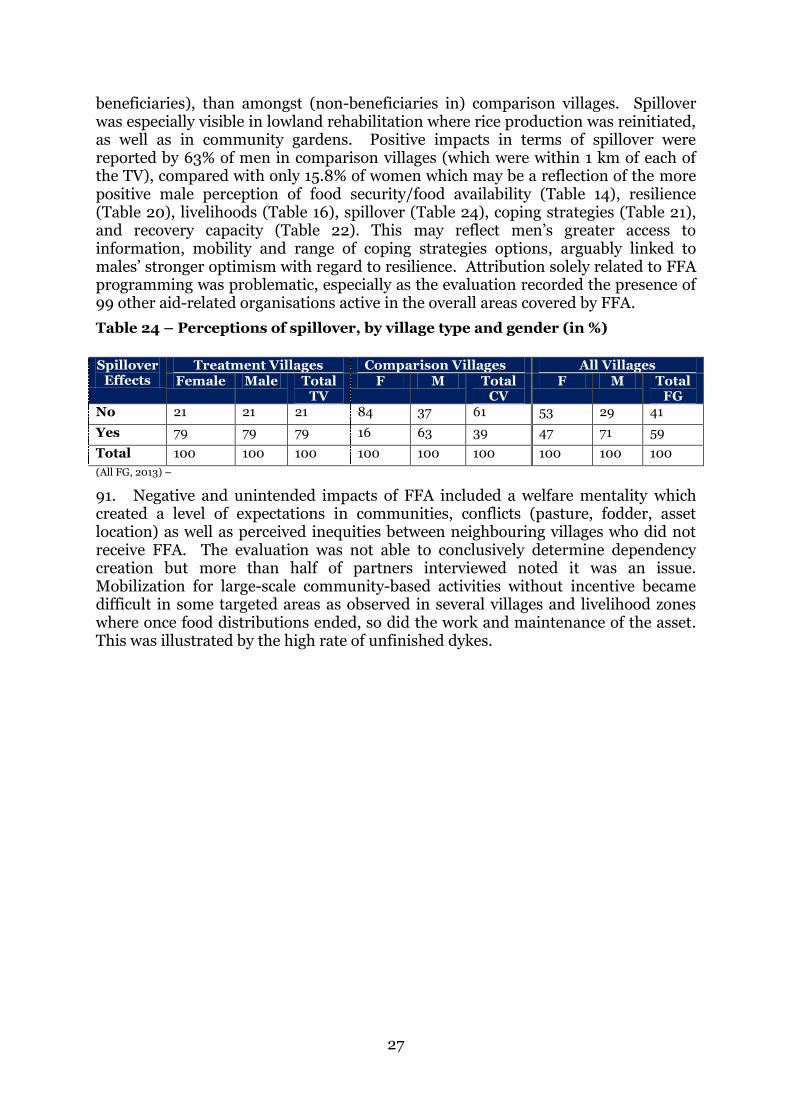
27
beneficiaries), than amongst (non-beneficiaries in) comparison villages. Spillover was especially visible in lowland rehabilitation where rice production was reinitiated, as well as in community gardens. Positive impacts in terms of spillover were reported by 63% of men in comparison villages (which were within 1 km of each of the TV), compared with only 15.8% of women which may be a reflection of the more positive male perception of food security/food availability (Table 14), resilience (Table 20), livelihoods (Table 16), spillover (Table 24), coping strategies (Table 21), and recovery capacity (Table 22). This may reflect men’s greater access to information, mobility and range of coping strategies options, arguably linked to males’ stronger optimism with regard to resilience. Attribution solely related to FFA programming was problematic, especially as the evaluation recorded the presence of 99 other aid-related organisations active in the overall areas covered by FFA.
Table 24 – Perceptions of spillover, by village type and gender (in %)
Spillover
Effects Treatment Villages Comparison Villages All Villages
Female Male Total TV
F M Total CV
F M Total FG
No 21 21 21 84 37 61 53 29 41
Yes 79 79 79 16 63 39 47 71 59
Total 100 100 100 100 100 100 100 100 100
(All FG, 2013) –
91. Negative and unintended impacts of FFA included a welfare mentality which created a level of expectations in communities, conflicts (pasture, fodder, asset location) as well as perceived inequities between neighbouring villages who did not receive FFA. The evaluation was not able to conclusively determine dependency creation but more than half of partners interviewed noted it was an issue. Mobilization for large-scale community-based activities without incentive became difficult in some targeted areas as observed in several villages and livelihood zones where once food distributions ended, so did the work and maintenance of the asset. This was illustrated by the high rate of unfinished dykes.
28
3. How Does FFA Create Impact?
92. The evaluation identified several factors which had impact on the overall results, sustainability and resilience in Senegal. Some are more directly related to the CO’s control, such as the implementation strategy and the operational levels. Other contextual factors, less within the control of the CO, such as funding, but must nonetheless be considered.
3.1 WFP FFA Implementation Strategy (See Annex 6.15 and 6.16)
3.1.1 Use of Implementing Partners and FFA Contracting Arrangements
93. Working through partners represented an efficient and effective strategy for implementation for WFP as the evaluation team believes it allowed WFP to work more broadly across the country through a contract approach with partners. FFA as a source of food served as motivator and catalyzer for farmers while implementing partners benefitted from farmers’ labour thereby reinforcing partners’ objectives and also serving WFP implementation needs. Finding the right partners was not always easy. The WFP partnership with PAPIL undertook with villages to build micro-ridged plots and anti-salt dykes that were improved with FFA; however dependence on FFA often resulted. Few partners had the capacity to be full counterparts in hydro-ecological constructions such as anti-salt dykes136. A detailed overview of how partners help FFA implementation is provided in Annex 6.16, Partners as Implementers of FFA.
94. The Field Level Agreement (FLA) corporate template signed with partners is the same used for all activities, including FFA. The agreement provides a legal framework that addresses logistical parameters; it does not provide program/asset information on the activity to be implemented. FLAs signed with a partner provide figures on targeted beneficiaries, tonnage and budget. As the asset description is not included, one must review the partner project proposal or a project summary prepared by CO for information on actual assets to be built. FLA agreements reviewed by the evaluation included no project proposal summaries. Therefore without a description of assets to be built, and without related performance indicators or a baseline, it was impossible to evaluate the partner or the assets based on a starting point.
95. Communication at community level: The use of partners also weakens WFP’s profile at community level and WFP’s message is left to the partners’ communications strategy. In daily implementation through partners, WFP lost visibility in the communities. Most villages had little understanding of the FFA program and its implementation. WFP as a donor is little known to beneficiaries with the exception of those in Casamance. Partners are seen as the donors at the village level, as they represent the role of the benefactor at the village level, and act as the main interface with the communities (refer to Section 3.1.1 on programme implementation).
96. Support to programme implementation costs, procurement modalities and local purchases: FFA expenditures reported by the CO were relatively modest for the programme under review (6 % of WFP’s total annual budget for the period of 2005-2010137). Both in the past and currently, WFP’s capacity to deliver is dependent on its ability to forecast deliveries. Partners can only deliver
136 ADB, SSI. 137 Figures provided by COSEN Department of Finance with similar levels of investments in 2012 at 6.71%

29
during the lean season as planned, if food stocks are available in warehouses and WFP budgets are in hand to pay for FFA, tools, training and monitoring. With adequate funding, the CO maintains that partnership agreements of 2 to 3 years would allow WFP to improve its delivery and timeliness138 (See Annex 5A).
3.1.2 Food Distribution Processes and perceived inequity issues
97. At the village level, FFA food distribution modalities were not always respected by WFP sub-offices and implementing partners – for example: work norms in exchange for work completed, participants’ levels of actual contribution to asset creation; actual food distributions modalities (these changed from place to place) which resulted in little evidence of a standard application of these norms139. The absence of clear communications about food entitlements to communities also lent itself to all sorts of speculation at the village level140. Perceptions of injustice and unfairness in food distribution were frequent in 1) selection of beneficiaries in chosen villages141; (2) between neighbouring villages; and (3) FFA standards and norms not applied systematically142. In at least 5 villages, food rations originally expected for FFA participation were not delivered in full, both in food and other inputs143. This confirmed that treatment villages without food distribution issues generally had more positive and perceptible impacts during the lean season.
98. While in the overall household survey dataset, there was no significant difference between men and women on adequate food distribution (entitlements received), examining the differences by livelihood zone showed that perceptions within specific zones were very different. Importantly, in the Agropastoral Peanut zone, women reported that there was adequate food delivered at a much higher rate than men did (mean difference = -0.252). The opposite trend was true in the AgroSylvo-pastoral Food zone, where men reported that food distribution was adequate at a higher rate than women did (mean difference = 0. 265). Thus, this demonstrated great variation per livelihood zone.
99. FFA Distribution Conflicts - Indirect and unintended effects of FFA were reported between farmers and pastoralists: (a) conflicts for pasture where created assets prevented pastoralists and livestock holders to access the traditional pastures forcing them to take longer detours to reach destinations (Refer to Annex 12); (b) conflicts for fodder - ANR preserved trees were being cut for animal fodder causing conflicts between ANR farmers and pastoralists who fed their livestock during transhumance from these trees. Resolving conflicts often required the intervention of local authorities; and, c) problems related to location of built asset.
100. FFA losses144 - Although diversion of food or corruption were reported145 in all Livelihood Zones during the period under review (and now as well), either
138 For example, JICA has provided this longer type funding for current lowland rehabilitation. 139 In certain villages, clear records are kept of reception and distribution of the food with occasional minutes of meetings; A&B Report, SSI, FG, HHS, AA. 140 Communicating FFA entitlements for work completed could make use of community radio programs aimed at farmers and rural people of the targeted communities as practised by PAPIL to communicate with beneficiaries. 141 FG, HHS, SSI in comparison villages 142Although “work norms” might have indicated a specific food entitlement for a defined level of work, the lack of training of partners or their inability to observe these norms caused conflicts resulting in numerous and prevalent inequities of food distribution in at least three sets of treatment villages within and between the beneficiaries, as well as comparison villages not included in FFA. 143 HHS and FG respondents 144 Difficulties related to project implementation support other evidence of delays, losses and lack of respect for food entitlements found throughout the evaluation process (PAPIL FFA reports [2007 to 2009]). 145 Respondents in all livelihood zones reported losses but cannot be identified due to promised anonymity (HHS, SSI, FG).

30
through stealing from warehouses, or hijacking food shipments, or selling of food146, a level of WFP sub-office monitoring was able to assess losses and take action147 to rectify misdemeanours. In many villages, non-beneficiaries believed choices related to village and participants’ selection were influenced by the rich who tended to keep benefits for themselves. These were reported to include wholesale traders, transporters, wholesale producers, politicians, and staff from partner agencies who were perceived to divert food away from beneficiaries who themselves feared denouncing persons in positions of authority.
101. Food Dependency - In some cases, FFA seemed to have generated a welfare mentality within targeted communities, where expectations that more FFA would be implemented in the future to assist the village caused an unintended impact. In some villages, after they had experienced FFA, it became difficult to mobilize people for large-scale community-based activities without food distributions seen in several villages [and various livelihood zones] where, once the food distribution stopped, so did the work and the maintenance of the asset, as illustrated by the 95% ratio of unfinished dykes. This phenomenon was exacerbated in villages where there were difficulties in the distribution of food entitlements. As an indication of the extent of the problem, out of 11 partners interviewed, six noted the issue of villagers’ dependence on the food as a prerequisite for working, and a few further said they would not work with FFA again for this reason.
3.1.3 Linkages, Asset Selection & Targeting
102. Asset Linkages to the Government’s Resilience Building Strategy and National Adaptation Plan for Climate Change (NAPC 2006) - Anti-salinization dykes, firewalls, and regenerated mangroves, proven adaptation strategies of the NAPC 2006 were also successful with FFA assets such as community gardens and dykes in FFA when these were maintained. Dykes originally started by villages without FFA demonstrated the high interest of the affected populations and positive adaptations to the advanced salinization especially in Fatick 148 , Tambacounda, and Ziguinchor regions 149 where partners helped communities consolidate and reinforce the variable quality of dykes (See Annexes 7 and 8). Many of these dykes were reinforced extended with FFAs year after year150.
103. Role of village in Asset Selection and Planning - The role of village leaders and of the Regional/Local Integrated Development Plans (LIDP) (discussed under Section 1.2) were not given much consideration in FFA planning (Annex 6.15 Partners as Implementers of FFA), nor, were village leaders consulted in the choice of assets. There were no clear exit strategies (nor maintenance plans) articulated by partners to the village beneficiaries. Note that 95% of the dykes remained unfinished151 indicating the inability of villages to self-motivate without FFA.
104. Asset designs were largely generated by partners depending on levels of technical difficulty without engineers to supervise these constructions. In treatment villages, FG results suggested only 42% of village authorities were consulted in the selection of the asset, while 53% of FG said that their village organization likely
146 PAPIL, SSI, AA, FG. 147 SSI, FG, AA, SPR
31
would have selected a different asset had they been consulted152. Of the respondents, 73.7% said the TV village population was involved in the construction of the asset, and 52% of villages reported a maintenance committee still existed to maintain the asset. See Table 6.13a in Annex 6.13 on population’s participation in building of asset.
105. In the Agro-Pastoral Peanut Zone, where there were ANR assets, many farmers would have preferred a village forest plantation rather than ANR, and as most are faced with firewood shortages, this would have helped sourcing firewood. Women’s involvement as main users of and collectors of firewood was not considered. In the absence of kindling or dead logs which serve as energy sources for cooking, women were then relegated to cutting the trees preserved by the ANR asset.
106. Table 6.13c (Annex 6.13) reports various t-tests concerning the current state of the assets (mean values as reported by HHS). The results revealed that: 1) a village population's participation in the choice of the asset did not have a statistically significant effect on the current state of the asset, nor; 2) did the receipt of training. What did matter was: 3) a population's involvement in the construction of the asset and the existence of a maintenance committee. Both were statistically and substantially significant, and their existence resulted in better reported asset outcomes.
107. Targeting Beneficiaries and Selecting Villages - Although FFA villages were selected at yearly meetings of the Regional Council organized through WFP sub-offices, based on geographical targeting of vulnerable areas for FFA implementation. However, once a village was selected, under the assumption of the ‘self-targeting’ approach of the FFA programme, a standardized approach and/or selection criteria to assist partners in targeting FFA participants was not apparent. The mission observed that final selection of beneficiaries was often left to village authorities who usually appointed one person per family153. See Annex 6.16 on Village Selection and Targeting Beneficiaries154
3.2 Operational issues
3.2.1 Deliveries and distributions at community level
108. Food Distribution Delays - Out of 11 partners, six mentioned issues with delays in food distribution155. Delays in deliveries were reported pervasive with all partners over the whole period under review. Rarely did food deliveries coincide with the planned lean period when most needed. Delays had multiple reported causes: distance of warehouses to end distribution point, terrain (bad roads, loss of accessibility during rains and robberies), insecurity, as well as operational implementation weaknesses (i.e. lack of storage facility to off-load trucks at site meant that distribution committees had to mobilise participants for distributions at the time of delivery 156 ). Evidence 157 gathered from FG also corroborated this finding158 where a WFP sub-office reported a 90% loss of seedlings159 in reforestation
155 SSI 156 PAPIL reports however that learning by doing has meant that overall implementation and delivery processes have improved year by year. 157 HHS, SSI 158 HHS, SSI

32
109. assets for several nursery and plantation projects160 in FFA over the years and across the country161
3.2.2 Capacity Building/Technical assistance/extension generated by FFA
110. Technical guidance in the form of manuals and pamphlets for beneficiaries as well as for partners was neither available during the evaluation period, nor widely known to partners in regards to the guidance produced since, such as: the WFP FFA Manual (2011), the 2012 Catalogue of Technologies for FFA162, nor CO’s Practical Guide for Implementing Food For Work Activities/Guide Pratique pour la réalisation des activités du concept “Vivres Contre Travail”. With the exception of the latter, none were available in French at the time of the evaluation163.
111. Training for Partners was largely generated by partner staff through training of trainers (to be replicated to field staff) with some inputs from the CO. Partners were provided with minimum training so they could develop Annual Work plans, harmonize procedures, conduct rapid assessments, and target and select beneficiaries. Capacity building and training and WFP requirements for project reporting were a means of professionalizing both local and international partner NGOs, especially the local ones. Partners who worked together reported benefits in collaboration and partnering with each other reinforcing FFA as together they were able to add value as well to advance their organizational goals. Food distribution also facilitated reaching partner’s organizational objectives with food as a motivator as well as a form of payment in exchange for labour. Partners’ inputs also motivated beneficiaries through various levels of monitoring/extension, facilitation and training, as well as supplementary inputs such as well construction and provision of seeds and seedlings for gardens.
112. Training for beneficiaries -Across treatment and comparison groups, only 44% of villages reported receiving training but training occurred more often in treatment villages: 54% of respondents had received training in TV versus 34% in CV 164 . Most of the training was directed to women in treatment villages in construction, nutrition, and hygiene while little specific information was available for men only. (See Table 6.15a to 6.15c, in Annex 6). In the case of ANR, the targeting of extension recipients was not always directed to the right beneficiaries165.
3.2.3 Monitoring and evaluation
113. CO’s FFA monitoring system was found lacking for the period under review. Almost no data for 2005-2010 was made available. With regard to site identification, nature of assets built, records from monitoring during implementation, evaluation or
159 As a result of this type of on-going failure year after year, WFP decided to discontinue support to nurseries in reforestation assets in 2008 as well as partnerships with DGEF after several years of poor success and overall lack of reporting, monitoring, delays and losses. 160 Difficulties in getting seedlings to beneficiaries, issues with fencing and roaming livestock, and lack of water were among the many constraints observed. Stakeholders noted that a lack of monitoring was in part responsible as the survival rate could not be observed or measured. Monitoring reports also reported low survival rates and low monitoring on the part of DGEF and other implementing partners in this category of asset, an issue that could have been anticipated given their lack of capacity. (SSI, FG, HHS, AA and supported by partners’ reports) 161 In regards to reforestation assets, these were by large implemented and managed by the Ministry of Agriculture’s Direction for Water, Forests and Hunting/Direction Générale des Eaux, Forêts et Chasse (DGEF) in cooperation with national/international non-governmental organisations and initiatives such as the Great Green Wall (GGW), PAPIL, and World Vision. With respect to nurseries, only small numbers of participants (1 to 5 beneficiaries) were engaged directly within the FFA, the trees produced however ultimately benefitted the communities as a whole. 162 Prepared for COSEN by Arega Yirga, November 12, 2013 163 PAPIL had however developed an extension manual for the period after 2010. 164 HHS, FG 165 Where extension on ANR modern techniques was directed to the elders through the mosque rather than to the young farmers actually doing ANR field work, old techniques such as land clearing were used rather than the conservation methods of ANR.
33
post-evaluation, each represented some level of difficulty where measurement of specific FFA asset outputs and recording proved extremely problematic. Lack of standardised nomenclature and –relevant - indicators (outputs and outcomes) were of particular concern. Measurement indicators changed from year to year and from one project to another. (See Section 1.3, and Annex 6.1 Difficulties Understanding and Measuring FFA, as well as Annexes 9, 10, 11 in Volume 2166). With the CO’s new Monitoring and Evaluation Unit (established in 2012), some of these issues may be rectified in future167 (See Annex 5B, Volume 2).
114. Partners in Extension and Monitoring of FFA – Although monitoring is a contractual and paid responsibility of partners, an overall lack of supervision and monitoring of assets at creation and post-establishment were observed throughout. The sustainability of assets fell short in part because of the short-term nature of FFA interventions attributed to several factors: partners were not always trained at an adequate technical level for the asset creation contributing to a lesser grade asset or negligence to monitor assets as seen especially in some reforestation assets.
115. Evaluating partners is a recent addition in CO since 2010. Prior to this, few evaluations were conducted and these were not shared with partners (Refer to Annex 5B for more information - Volume 2). Many partners believe that WFP requires inordinate amounts of reports and documentation for the amount invested in the partnership. With the exception of reports required during the 2012 crisis, the evaluation team agrees with the level of reporting required by WFP, as it is not too complicated and is a minimum accountability measure for partners.
3.2.3 FFA Entitlements
116. Quality, quantity and relevance of the WFP Food Basket: Very few beneficiaries spoke with full satisfaction of the FFA food basket 168 where beneficiaries reported unclear guidelines during food distributions for food received in exchange for work done169, signalling a concern with communications at the village level. While most reported that FFA improved their situations, more than half of the respondents to the household survey did not think that the food received was enough. Fatick beneficiaries noted salt was hardly needed given they were salt producers. Different concerns about food satisfaction were voiced by the Bambara and Malinke whose eating habits are centered on rice and corn and who recommended that if rice is unavailable, millet should be substituted in lieu of corn. (Tables 6.12a to 6.12c - Annex 6.12)
117. Imported foods did not satisfy local consumption tastes170 where in some cases, partners clarified that WFP current allocations of 3 kg of rice per day did not satisfy the need171. The WFP norm for a family of 6 to 10 was insignificant when some families numbered up to 35 persons 172. (Local purchasing 173 was offered as a potential solution for satisfying local tastes but it is very planning intensive for WFP).
166 These represent findings of the mission on specific assets found through various methods. 167 Current progress is being made and a measurement framework to measure results, the development of detailed monitoring forms, and the future involvement of ARD throughout the country to conduct M&E are underway. However, there is still no plan for post- intervention assessment of these assets. 168 HHS, SSI, FG - as food entitlements or work norms which governed food distribution were not always clear 169 HHS, AA, SSI - where at no time was there any uniformity in the interventions nor was there standard criteria applied by partners in distributing food rations in relation to a certain level of work activity: In one case, in villages surveyed where CRS "Cash for Work" was implemented, individuals were allocated 5000 FCFA for every metre of dyke built. 170 SSI, FG, AA, partner reports 171 PAPIL, SSI, 2103 172 A&B Report, SSI, FG

34
118. Many partners of this evaluation noted that WFP Cash for Work 174 had potential negative impacts as the cash would more often be used for other products rather than feeding the family. The options for corruption were also perceived as greater (as reported by the authorities)175. Ultimately, as reported by partners, the preferred incentives for asset building seemed to be food over cash for the very reason that food is the preserve of women who ensure its proper use for feeding the family176. This is echoed by the HHS data that reports that some 64% of beneficiary [of FFA] households included women (either as main decision maker or in tandem with the husband) in the management of the food budget, compared with only 38% of the non-beneficiary ones177.
3.3 The Role of Contextual Factors
3.3.1 The overall context
119. Funding and resourcing strategy factors at national level are – important contextual factors as WFP global and national are dependent on voluntary donor contributions for resources. As international donations to WFP are voluntary178, this is a situation over which the CO does not have full control. International purchasing is another, also not fully controlled by WFP due to international purchasing179. Other contributing factors are recurrent shocks such as climate change and the food price crisis, which also constrained the ability of WFP to maximise impacts of FFA interventions 180 . Other contextual factors relate to policy issues around decentralization and FFA potential linked to Local Development Plans (LDPs). The other policy gap to date which may now be closing is that of climate change and the G0vernment NAPC (Section 1.1 and Annex 5.B)
3.3.2 WFP Funding
120. As presented in Section 1.3 (Table 2), WFP operations remained under-funded throughout the period under review, but especially in the earlier period, as suggested by SSI, as well as by the donors’ diversification trends of Table 25 (which showed a sharp increase in 2008/2009, in the aftermath of the food and nutrition security crisis), as well as by spot checks of the historical information on projects’ shortfalls during the evaluation period: as an example, PRRO7 (2005-2007)181 closed and was under-resourced by 48% (after four years of implementation), yet eighteen months after inception its SPR indicated a 64.55% resource shortfall (on a then lower requirement).
173 The majority of stakeholders would appreciate an increase in WFP local purchasing of food products. Over the past two years, progress has been seen with Purchase Africa for Africans (financed by Brazil circa $US 500K) or Purchase for Progress at the regional bureau level. In the regions where cereal production is low, small farmers are encouraged to produce surplus that can be sold In the case of PAPIL, a progressive increase in rice cultivation is predicted that could result in commercialization of surpluses in the Fatick and Casamance regions. Efforts should be made to coordinate local purchases between aid organizations to ensure a coordinated approach (and ensure fair pricing) 174 Only one incidence of a Cash-for-work was observed, in Syer (nursery); hence perceptions reported stem from SSI 175 SSI 176 A&B Report, SSI, FG 177 See Table 6.8b in Annex 6 (volume 1) 178 This is a very important factor in that there are no percentage allocations going to WFP as with other agencies. Rather these are donor dependent based on a donor’s commitment within a specific country. 179 Many factors affect purchases, types of purchases as well as timely delivery of these to port prior to allocation and distribution through partners. 180 When projects were funded for Casamance, the food crisis forced a diversion and dilution of funds which contributed to lesser than promised rations to beneficiaries and therefore diminished impacts. 181 As noted in Budget Revision 2: PRRO 10188.1 due to end on 31 December 2006, was originally approved for a period of 2 years (2005/2006), and extended by 2 years.
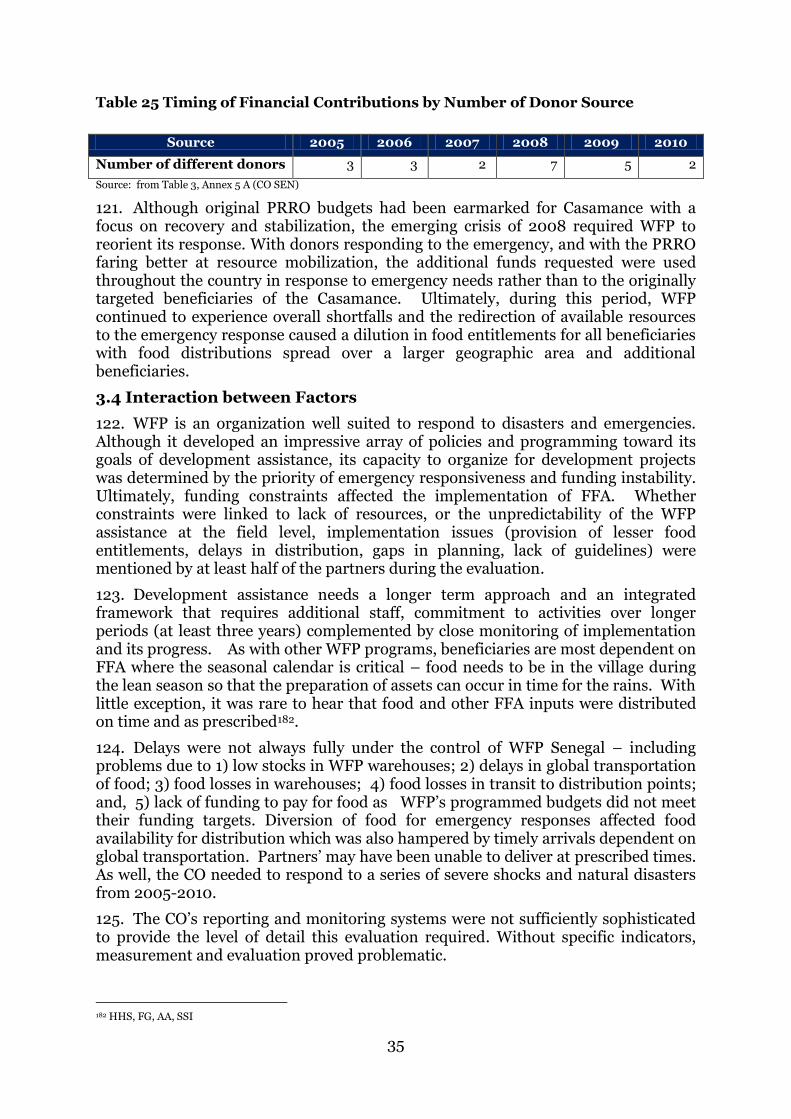
35
Table 25 Timing of Financial Contributions by Number of Donor Source
Source 2005 2006 2007 2008 2009 2010
Number of different donors 3 3 2 7 5 2
Source: from Table 3, Annex 5 A (CO SEN)
121. Although original PRRO budgets had been earmarked for Casamance with a focus on recovery and stabilization, the emerging crisis of 2008 required WFP to reorient its response. With donors responding to the emergency, and with the PRRO faring better at resource mobilization, the additional funds requested were used throughout the country in response to emergency needs rather than to the originally targeted beneficiaries of the Casamance. Ultimately, during this period, WFP continued to experience overall shortfalls and the redirection of available resources to the emergency response caused a dilution in food entitlements for all beneficiaries with food distributions spread over a larger geographic area and additional beneficiaries.
3.4 Interaction between Factors
122. WFP is an organization well suited to respond to disasters and emergencies. Although it developed an impressive array of policies and programming toward its goals of development assistance, its capacity to organize for development projects was determined by the priority of emergency responsiveness and funding instability. Ultimately, funding constraints affected the implementation of FFA. Whether constraints were linked to lack of resources, or the unpredictability of the WFP assistance at the field level, implementation issues (provision of lesser food entitlements, delays in distribution, gaps in planning, lack of guidelines) were mentioned by at least half of the partners during the evaluation.
123. Development assistance needs a longer term approach and an integrated framework that requires additional staff, commitment to activities over longer periods (at least three years) complemented by close monitoring of implementation and its progress. As with other WFP programs, beneficiaries are most dependent on FFA where the seasonal calendar is critical – food needs to be in the village during the lean season so that the preparation of assets can occur in time for the rains. With little exception, it was rare to hear that food and other FFA inputs were distributed on time and as prescribed182.
124. Delays were not always fully under the control of WFP Senegal – including problems due to 1) low stocks in WFP warehouses; 2) delays in global transportation of food; 3) food losses in warehouses; 4) food losses in transit to distribution points; and, 5) lack of funding to pay for food as WFP’s programmed budgets did not meet their funding targets. Diversion of food for emergency responses affected food availability for distribution which was also hampered by timely arrivals dependent on global transportation. Partners’ may have been unable to deliver at prescribed times. As well, the CO needed to respond to a series of severe shocks and natural disasters from 2005-2010.
125. The CO’s reporting and monitoring systems were not sufficiently sophisticated to provide the level of detail this evaluation required. Without specific indicators, measurement and evaluation proved problematic.
182 HHS, FG, AA, SSI
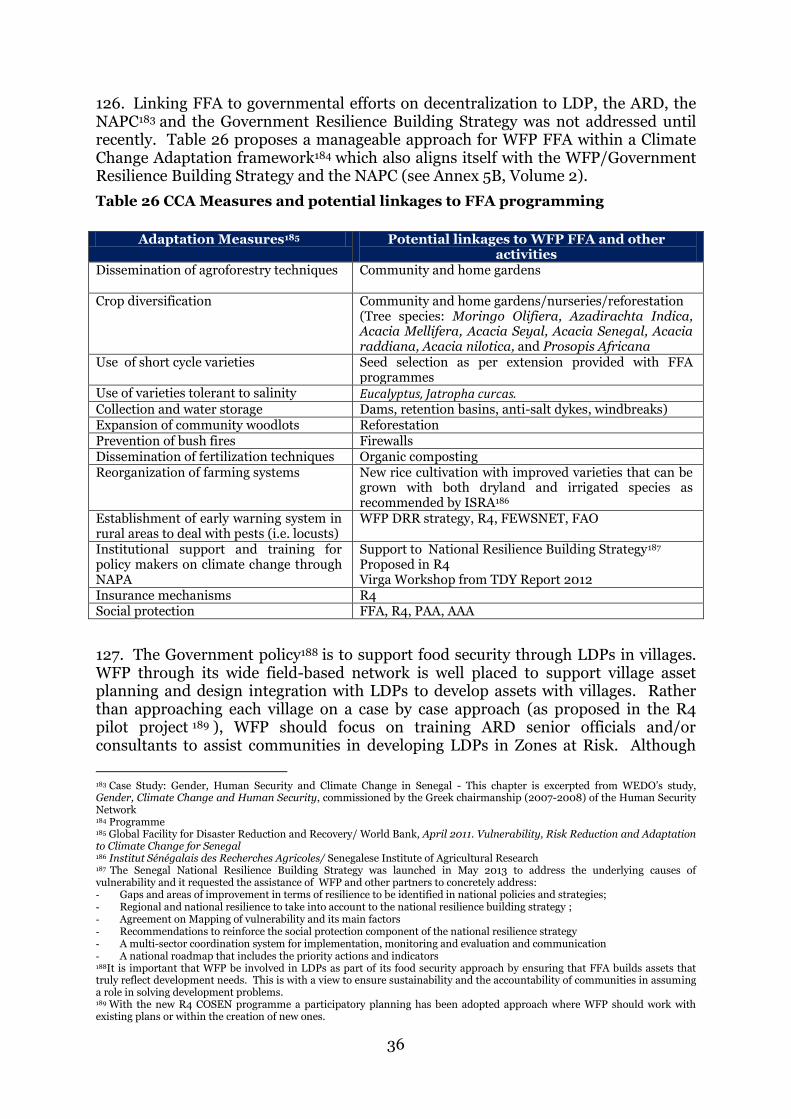
36
126. Linking FFA to governmental efforts on decentralization to LDP, the ARD, the NAPC183 and the Government Resilience Building Strategy was not addressed until recently. Table 26 proposes a manageable approach for WFP FFA within a Climate Change Adaptation framework184 which also aligns itself with the WFP/Government Resilience Building Strategy and the NAPC (see Annex 5B, Volume 2).
Table 26 CCA Measures and potential linkages to FFA programming
Adaptation Measures185 Potential linkages to WFP FFA and other activities
Dissemination of agroforestry techniques
Community and home gardens
Crop diversification Community and home gardens/nurseries/reforestation (Tree species: Moringo Olifiera, Azadirachta Indica, Acacia Mellifera, Acacia Seyal, Acacia Senegal, Acacia raddiana, Acacia nilotica, and Prosopis Africana
Use of short cycle varieties Seed selection as per extension provided with FFA programmes
Use of varieties tolerant to salinity Eucalyptus, Jatropha curcas. Collection and water storage Dams, retention basins, anti-salt dykes, windbreaks) Expansion of community woodlots Reforestation Prevention of bush fires Firewalls Dissemination of fertilization techniques Organic composting Reorganization of farming systems New rice cultivation with improved varieties that can be
grown with both dryland and irrigated species as recommended by ISRA186
Establishment of early warning system in rural areas to deal with pests (i.e. locusts)
WFP DRR strategy, R4, FEWSNET, FAO
Institutional support and training for policy makers on climate change through NAPA
Support to National Resilience Building Strategy187 Proposed in R4 Virga Workshop from TDY Report 2012
Insurance mechanisms R4 Social protection FFA, R4, PAA, AAA
127. The Government policy188 is to support food security through LDPs in villages. WFP through its wide field-based network is well placed to support village asset planning and design integration with LDPs to develop assets with villages. Rather than approaching each village on a case by case approach (as proposed in the R4 pilot project 189 ), WFP should focus on training ARD senior officials and/or consultants to assist communities in developing LDPs in Zones at Risk. Although
183 Case Study: Gender, Human Security and Climate Change in Senegal - This chapter is excerpted from WEDO’s study, Gender, Climate Change and Human Security, commissioned by the Greek chairmanship (2007-2008) of the Human Security Network 184 Programme 185 Global Facility for Disaster Reduction and Recovery/ World Bank, April 2011. Vulnerability, Risk Reduction and Adaptation to Climate Change for Senegal 186 Institut Sénégalais des Recherches Agricoles/ Senegalese Institute of Agricultural Research 187 The Senegal National Resilience Building Strategy was launched in May 2013 to address the underlying causes of vulnerability and it requested the assistance of WFP and other partners to concretely address: - Gaps and areas of improvement in terms of resilience to be identified in national policies and strategies; - Regional and national resilience to take into account to the national resilience building strategy ; - Agreement on Mapping of vulnerability and its main factors - Recommendations to reinforce the social protection component of the national resilience strategy - A multi-sector coordination system for implementation, monitoring and evaluation and communication - A national roadmap that includes the priority actions and indicators 188It is important that WFP be involved in LDPs as part of its food security approach by ensuring that FFA builds assets that truly reflect development needs. This is with a view to ensure sustainability and the accountability of communities in assuming a role in solving development problems. 189 With the new R4 COSEN programme a participatory planning has been adopted approach where WFP should work with existing plans or within the creation of new ones.

37
few LDPs were found during the evaluation, if funding permits, the evaluation team believes WFP should not be inventing new plans but it should partner with UNICEF and FAO and donors in financing LDPs and Regional Integrated Development Plans as legitimate decentralization planning instruments for advancing FFA through these plans and reinforcing local development at the same time.

38
4. Conclusions and recommendations
128. Despite management and monitoring gaps, using a reconstructed set of data on FFA implemented during the evaluation period, the evaluation was able to find 95% of the assets in the sample treatment villages. Beneficiary recall and confusion with other programs and projects made it difficult to attribute impact solely to FFA, nonetheless contribution to expected impacts was reported and observed, confirming that the Theory of Change for FFA is relevant in the context of Senegal. Based on findings above, the following conclusions and recommendations are made. (See Annex 4 - Evaluation findings, Conclusions and Recommendations based on TOC).
4.1 Conclusions
129. Overall, the evaluation concluded that the WFP FFA Strategy was successful in Senegal within the means it had at the time. WFP FFA overall successfully contributed to short-term hunger gap alleviation. It also contributed to medium-term food security impacts, with participating families benefitting from greater dietary diversity and reported improved household nutrition from gardens and rice cultivation.
130. The evaluation team believes that with the emergence of latest policies, a highly motivated government, consolidated partnerships between government, UN agencies and other donors, and a clear actionable FFA plan with adequate monitoring during and after establishment of assets, FFA could be implemented more effectively in the current context. Table 27 illustrates how the respondents viewed the positive impacts of FFA (supported by a testimonial from SPR190).
Table 27 FG Respondents Perception on Outcomes and Impacts of FFA
Outcomes and Impacts identified in focus groups
Treatment Villages
Comparison Villages
Women Men Women Men Positive appreciation of FFA YES YES YES YES Impact on time dedicated to the building of the asset
None None
Improvement of revenues as a result of the asset YES YES NO NO Improvement of family’s nutritional security as a result of the asset
YES YES NO NO
Improvement of food availability through FFA during the lean period
YES YES YES YES
A certain level of financial independence from the husband
YES NO NO NO
Impact on resilience NO NO NO NO Believed the asset could improve resilience YES YES YES YES191 (A&B Report, 2013)
190 'Story Worth Telling' (WFP, 2010, SPR PRRO 10612): Bassirou Samou, Mangagoulack village says: "There used to be a lot of rain before, the valleys were fertile and seeds were available. We used to grow different varieties of rice. Now after several years of drought, I can't even cover three months of my families food needs. Thanks to WFP food during the lean season, I could improve my land and increase my production through the building of anti-salt dykes. And when you create an anti-salt dyke, it's one big weight off our shoulders. Our river used to be full of fish. After the drought in the 1970's, we had to go very far to find fish and feed our families. When WFP came with the food assistance, they helped us to regenerate the mangroves. Now our basins are full of fish, oysters and shrimp. What we had before has come back to life. Thanks to fishing, I am making money I can use to cover my family's needs: food, books, medication, contributions to the school canteen and uniforms and investments in beef and goat farming. With what I am earning now from my land and the river, I am proud to support my family." 191 In treatment villages

39
4.1.1 Biophysical Impacts
131. Quality of assets contributed to positive biophysical impacts in both treatment and comparison villages as shown in section 2.3. These included, depending of the assets created: desalinization, productive land reclamation, improved vegetative cover. In particular, impact was reported and observed within FFA using technical partners such as PAPIL and OCEANIUM in lowlands and mangroves recovery respectively (which also contributed to significantly higher yields) with the following biophysical impacts: better access to water, desalinized soils, improved vegetation, and an overall reduction of the degradation spiral of agricultural lands from the sea-level rise192 along the many deltas of Senegal.
4.1.2 Agricultural productivity
132. The evaluation found that within treatment villages, there is a positive association between the quality of an asset and improved agricultural productivity (see Section 2.4). Agricultural productivity impacts included: higher yields, livestock diet diversification, soil recovery, staple and garden crop production; these were found in some cases to be significant. The creation of community gardens and associated nurseries proved to be most beneficial especially for women’s incomes and nutritional habits for both short and long-term impacts. Many gardens were still operational providing fruit and vegetables to beneficiaries.
4.1.3 Food Security
133. The impacts on food security in the short-term were an immediate alleviation of hunger during the lean season for beneficiaries. Participating families experienced not only an immediate impact from the food transfer, they also benefitted on a longer-term basis from nutritional (diet) diversity through improved agricultural productivity from gardens and rice culture (a preferred staple food). Children of beneficiary households were found to eat more meals a day, and there was a significant difference of food consumption patterns of beneficiary/non-beneficiary within and between treatment/comparison villages (higher consumption of meat and fruits within beneficiary groups). Overall, the positive impact on food security contributed to improved nutrition of the family with vegetables and fruit products especially in gardens and in lowland rehabilitation where rice cultivation became possible again. (See Section 2.5).
4.1.4 Livelihoods
134. Although not directly measured, there appears to have been impacts on income generation directly related to asset creation which contributed to overall improved livelihoods. The positive economic repercussions from the asset creation also served as a motivating factor - not only within the treatment village but also as seen in a spillover effect in surrounding communities. Livelihoods were reported improved especially with mangrove and lowland rehabilitation and community gardens where surplus food, forage and secondary forest products could be sold. (See Section 2.6).
4.1.5 Social Cohesion
135. Benefits attributed to FFA on social cohesion were clearly recognized by beneficiaries, executing partners and decentralized agencies. FFA did mobilize the
192 According to the SPR, a wide range of assets (dams, dykes, sea walls, anti-salt earthen dikes, flood protection dykes) with as many indicators to describe these: number of dykes, length of dykes (miles), number of ha protected and developed for rice and banana lands, and kg of rice produced were found.

40
community to work together and promoted solidarity in the village 193 . Social cohesion194 was enhanced as assets were able to mobilize a significant number of the population to participate in their creation because: 1) Food motivated people for collective action; 2) Community participation in construction of assets contributed to community-building and generated capacity in the village; 3) Positive economic repercussions from asset creation served to motivate beneficiaries and non-beneficiaries in TV but also non-beneficiaries in comparison and other surrounding communities who also participated at times in TV villages and copied assets in their own comparison villages; and 4) Emergence of community leaders, especially in rice cultivation areas, where a permanent social dialogue was facilitated, as well as other income generation in the community195. In the case of women, decision making ability improved as a result of FFA. Women in beneficiary households were reported to contribute more to income, and to have greater participation in the households’ budget management than those in non-participating households (see Section 2.7).
4.1.6 Resilience
136. The immediate impact of FFA was alleviation of short-term hunger following food distributions. Although the majority (78%) of focus groups respondents perceived no significant longer-term impact on their resilience, rather a potential of FFA to do so, the evaluation concludes that reported combined impacts on productivity, livelihoods, community cohesion (as well as reduction of migration) have positively enhanced the community’s resilience and ability to face shocks. Long-term impacts reported included: 1) a perception of greater reduction of vulnerability in the treatment villages; 2) asset creation spillover which stimulated development of other community-based initiatives generating more development initiatives196; and 3) long term capacity building and enhanced coping strategies. Communities saw an improved ability to feed their families and diversify their diets. Enhanced coping strategies were afforded by these assets as beneficiaries and non-beneficiaries were exposed to ways of improving their food security, recovering their land and in some cases, and engaging in planning for enhanced livelihoods in their communities. (See Section 2.8).
4.1.7 Conclusions on factors contributing to FFA Impact
137. Most villages had little understanding of the FFA program and its implementation. WFP as a donor was little known to beneficiaries with the exception of those in Casamance. Partners were seen as the donors at the village level. Having the right partners for the higher tech assets was another issue especially for the assets requiring higher-tech interventions (e.g.: dykes).
138. Hindering factors included contextual factors: recurrent shocks which redirected FFA resources to respond to the food crisis for a good part of the evaluated period; and WFP funding constraints. Others factors of implementation and operational nature are more directly within WFP’s control and include: weaknesses in partner contracts, WFP and partner inability to deliver FFA on time, and technical and extension and monitoring issues. Whether these constraints were linked to funding issues which translated into problems at the field level, or whether it was the
193 SSI, FG, AA as recognized by beneficiaries, executing partners and decentralized agencies 194 SSI, FG, HHS 195 SSI, FG, A&B Report 196 FG, SSI, A&B Report and FG. In Casamance, where working together to build of anti-salt dykes generated some thinking among people of the possibilities for modernizing rice cultivation with further mechanization and developing aquaculture. Similarly, with gardens that are managed by women in Thiobon.

41
unpredictability of the very nature of WFP programs, the final provision of lesser food entitlements, or delays in distribution were constants mentioned by at least half of the partners. The promotion of sustainability through assets fell short by virtue of the short-term nature of FFA interventions and the lack of extension and monitoring.
139. The overall lack of communication at the village level, as well as the targeting of participants and the food distribution mechanisms in treatment villages were issues of concern reported to the evaluation.
140. Assets which were more successful such as anti-salt dykes and micro-ridged plots (which contributed to land recovery, and rice culture); mangrove regeneration (which contributed to regenerated biodiversity and aquaculture potential), and home gardens (nutrition diversity, income-generation) should now be the primary focus for asset construction, and a basis for community discussion on asset selection, because these generally work.
141. FFA must however remain a simple workable tool for village populations who see fairly immediate results from the construction of assets and from their sustained maintenance. Although it is tempting to build complex resilience models197, there is no need for a cash-strapped organization like WFP to change the FFA model that has worked so well in the Senegal context. CO must now communicate clearly how FFA is its primary resilience building tool.
4.2 Recommendations
142. Many of the lessons on design and implementation emerging from this evaluation are already being applied by Senegal through updates to current programming. WFP’s corporate guidance on FFA programming and gender programming have also been substantially changed since the period under review. The following recommendations are intended to support these on-going efforts.
Recommendation 1: Develop a focused, multi-year, FFA-based resilience approach linked to the Government’s policies, strategies and decentralisation processes, ensuring that local development plans are used along with corporate FFA guidance, and supported by a funding strategy and adequate monitoring systems. [Country office]
143. This approach should take a long-term perspective aligned with the National Adaptation Plan for Climate Change and the resilience building strategy, and oriented to providing guidance for decentralized integrated development plans. The approach should also complement the interventions of other agencies, including United Nations Children’s Fund and the Food and Agriculture Organization of the United Nations, to ensure coherent support to targeted populations and enhanced technical capacities at the field level.
Recommendation 2: Implement WFP’s disaster risk reduction policy and corporate guidance within FFA programming by ensuring that WFP field staff are appropriately trained to apply corporate guidelines and provide technical assistance to partners and communities; and providing WFP guidance and best practice in French, adapted for partners and community audiences. [Country office, with Headquarters and Regional Bureau support]
197 As observed with AAA and R4

42
144. This approach would contribute to the capacity development of WFP staff and partners and to the effective integration of disaster risk reduction and management and environmental concerns into FFA design and field implementation. Resources will be required for document translation, adaptation and dissemination, training, and ensuring adequate staff capacity for implementation at the field level.
Recommendation 3: Strengthen implementation accountability and transparency through: i) comprehensive and mutually accountable annual programme agreements with implementing partners; and ii) community-level participatory action plans that set clear roles and responsibilities for WFP, technical partners and community members in achieving and implementing agreed objectives, outputs and activities. [Country office]
145. Annual partnerships agreements should cover programme implementation guidance (see recommendation 2); progress and outcome monitoring and reporting; and partnership evaluation schedules.
Recommendation 4: Develop an FFA Education and Communication
Strategy for community mobilisation and enhanced transparency.
[Country office]
146. The strategy should:
bring together key individuals from local authorities and different levels of
administration and gender-balanced representatives of targeted FFA villages, to
inform, consult and plan with villagers prior to signing FFA village action plans;
and
simplify the FFA extension materials made accessible to community audiences
using multiple media formats.
Recommendation 5: Over the medium term and in collaboration with partners, the country office M&E unit should support the establishment of a government-led comprehensive framework for FFA M&E that integrates interventions with national and local development plans; facilitates the monitoring of results; and involves all stakeholders -government, partners, and communities. [Country office]
147. This will require a medium-term perspective and appropriate human resources working closely with the Agency for Rural Development to facilitate the integration of FFA activities into regional and local development plans, and eventual handover. Training of partners and communities will also have to be planned and budgeted.
148. Efforts will aim to establish and maintain:
a national database with sub-regional databanks;
nationally standardized, consistent and relevant monitoring indicators and
systems; and
sustained training of partners at central and sub-regional levels, and
development of tools for involving targeted communities in M&E of assets at the
most decentralized (village) level.

Office of Evaluation www.wfp.org/evaluation
Ro
me
, Ja
nu
ar
y 2
014
, OE
V/2
013
/00
9