impact evaluation of usaid/malawi local government
TRANSCRIPT

PHOTO CREDIT: LOCAL GOVERNMENT AND ACCOUNTABILITY PROJECT (LGAP)
IMPACT EVALUATION OF USAID/MALAWI LOCAL GOVERNMENT ACCOUNTABILITY AND PERFORMANCE (LGAP) ACTIVITY FINAL REPORT
Prepared under Contract No. GS-10F-0033M / Order No. AID-OAA-M-13-00013, Tasking N030
DISCLAIMER This publication was produced for review by the United States Agency for International Development. It was prepared by NORC at the University of Chicago. The authors’ views expressed in this publication do not necessarily reflect the views of the United States Agency for International Development or the United States Government.

DRG LEARNING, EVALUATION, AND RESEARCH (DRG-LER) ACTIVITY
IMPACT EVALUATION OF USAID/MALAWI
LOCAL GOVERNMENT ACCOUNTABILITY AND PERFORMANCE
(LGAP) ACTIVITY
FINAL REPORT
January 2020
DRG Learning, Evaluation, and Research (LER) Activity
Tasking N030
Contract No. GS-10F-0033M/AID-0AA-M-13-00013
Submitted to: Brandy Witthoft, COR
Submitted by: Lucy Martin, NORC Principal Investigator (University of North Carolina at Chapel Hill) Brigitte Seim, NORC Principal Investigator (University of North Carolina at Chapel Hill) Simon Hoellerbauer, NORC Research Associate (University of North Carolina at Chapel Hill)
Contractor: NORC at the University of Chicago Attention: Renee Hendley, Program Manager Bethesda, MD 20814 Tel: 301634-9489 E-mail: [email protected] DISCLAIMER The authors’ views expressed in this publication do not necessarily reflect the views of the United States Agency for International Development or the United States Government.
CONTRACT No. GS-10F-0033M / ORDER No. AID-OAA-M-13-00013
USAID.GOV DRG-LER TASKING N030 IMPACT EVALUATION OF USAID/MALAWI LGAP ACTIVITY – FINAL REPORT | i
TABLE OF CONTENTS
TABLES .................................................................................................................................................................... III
FIGURES ..................................................................................................................................................................IV
ACRONYMS ............................................................................................................................................................ V
EXECUTIVE SUMMARY ....................................................................................................................................... 1
I. INTRODUCTION .......................................................................................................................................... 3
2. BACKGROUND ON THE MALAWI CONTEXT ................................................................................. 5
Past Interventions in Tax Collection in Malawi ....................................................................................... 6
3. EXPERIMENTAL INTERVENTIONS AND EVALUATION DESIGN ................................................ 7
Theory of Change ........................................................................................................................................... 7
Evaluation Objectives ..................................................................................................................................... 7
Experimental Treatments and Components ............................................................................................ 8
Bottom-Up Treatments ............................................................................................................................................ 8
Top-Down Treatments .......................................................................................................................................... 11
Bundled Treatments ............................................................................................................................................... 13
Sample Size and Treatment Assignment .................................................................................................. 13
4. DEVIATIONS FROM RESEARCH DESIGN AND INTERVENTION PLAN ................................. 15
5. DATA COLLECTION STRATEGY .......................................................................................................... 16
Baseline and Endline Surveys ...................................................................................................................... 16
Market Vendors Survey ......................................................................................................................................... 16
Tax Collectors Survey ............................................................................................................................................. 17
District Council Survey ........................................................................................................................................... 17
Monitoring Data ............................................................................................................................................ 17
Data Exchange ........................................................................................................................................................ 18
Market Visits ............................................................................................................................................................ 19
6. DATA ANALYSIS ......................................................................................................................................... 21
Outcome Measures ...................................................................................................................................... 21
Methodology ................................................................................................................................................... 23
7. KEY FINDINGS ............................................................................................................................................. 25
Intervention Effects on Vendor Tax Compliance .................................................................................. 25
Intervention Effects on Bottom-Up Intermediate Outcomes ............................................................ 30
Intervention Effects on Top-Down Intermediate Outcomes ............................................................. 33
8. INTERPRETING EFFECTS AND RECOMMENDATIONS ................................................................... 36
Intervention Value-for-money .................................................................................................................... 36

CONTRACT No. GS-10F-0033M / ORDER No. AID-OAA-M-13-00013
USAID.GOV DRG-LER TASKING N030 IMPACT EVALUATION OF USAID/MALAWI LGAP ACTIVITY – FINAL REPORT | ii
Disaggregating Intervention Components ............................................................................................... 37
Understanding Differentiated Effects for the Both Treatment Group ............................................. 40
9. CONCLUSIONS .............................................................................................................................................. 43
APPENDIX A: MALAWI BACKGROUND ................................................................................................... 44
Local Government in Malawi ...................................................................................................................... 45
Local Revenue Collection in Malawi ......................................................................................................... 46

CONTRACT No. GS-10F-0033M / ORDER No. AID-OAA-M-13-00013
USAID.GOV DRG-LER TASKING N030 IMPACT EVALUATION OF USAID/MALAWI LGAP ACTIVITY – FINAL REPORT | iii
TABLES
Table 1. Two-by-two Factorial Experiment Design ..................................................................................... 7 Table 2. Main Outcomes .................................................................................................................................. 21 Table 3. Bottom-Up Intermediate Outcomes ............................................................................................. 22 Table 4. Top-Down Intermediate Outcomes.............................................................................................. 22 Table 5. Hypothesis I Results Table: Individual-Level and Market-Level DID ..................................... 25 Table 6. Market Revenue Results Table ....................................................................................................... 29 Table 7. Bottom-Up Intermediate Outcomes: Government ................................................................... 32 Table 8. Bottom-Up Intermediate Outcomes: Services and Tax Morale ............................................. 33 Table 9. Top-Down Intermediate Outcomes: Vendors ............................................................................ 34 Table 10. Top-Down Intermediate Outcomes: Tax Collectors ............................................................... 35 Table 11. Vendor Survey Treatment Component Question Averages, by Treatment Group.......... 38 Table 12. Tax Collector Survey Treatment Component Question Averages, by Treatment
Group .................................................................................................................................................... 39 Table 13. Breakdown of Responses to "Who is primarily responsible for construction or
improvements [in this market]?" by Treatment Group ............................................................ 39 Table 14. Breakdown of Responses to "Who primarily funded this construction [in this
market]?" by Treatment Group ...................................................................................................... 40 Table 15. Breakdown of Responses to " How often does your supervisor transfer money
collected from market fees to the district?” by Treatment Group ....................................... 40

CONTRACT No. GS-10F-0033M / ORDER No. AID-OAA-M-13-00013
USAID.GOV DRG-LER TASKING N030 IMPACT EVALUATION OF USAID/MALAWI LGAP ACTIVITY – FINAL REPORT | iv
FIGURES
Figure 1. Self-Reported Tax Compliance: Baseline and Endline ............................................................... 27 Figure 2. Group-Perceived Tax Compliance: Baseline to Endline ........................................................... 27 Figure 3. Evidence of Recent Receipt: Baseline and Endline ..................................................................... 28 Figure 4. Market Revenue (Market Fee Units), Treatment Group Averages ....................................... 29

CONTRACT No. GS-10F-0033M / ORDER No. AID-OAA-M-13-00013
USAID.GOV DRG-LER TASKING N030 IMPACT EVALUATION OF USAID/MALAWI LGAP ACTIVITY – FINAL REPORT | v
ACRONYMS BU Bottom-Up
CDF Constituency Development Fund
DC District Council
DEC District Executive Committee
DID Difference in Differences
DIM Difference in Means
FGD Focus Group Discussion
IPA Innovations for Poverty Action
ITT Intent-to-Treat
LGAP Local Government Accountability and Performance
MP Member of Parliament
MWK Malawian Kwacha
PSR Public Sector Reform
RA Research Associate
SMS Short Message Service (text messaging using standard communication protocols)
TD Top-Down
UNICEF United Nations Children’s Fund
USAID United States Agency for International Development
USD U.S. Dollar
WGI Worldwide Governance Indicators

CONTRACT No. GS-10F-0033M / ORDER No. AID-OAA-M-13-00013
USAID.GOV DRG-LER TASKING N030 IMPACT EVALUATION OF USAID/MALAWI LGAP ACTIVITY – FINAL REPORT | 1
EXECUTIVE SUMMARY This report presents the findings from a randomized field experiment conducted by Principal Investigators Lucy Martin and Brigitte Seim at the University of North Carolina at Chapel Hill on behalf of NORC at the University of Chicago. The two-by-two factorial experiment tested the effectiveness of two different approaches to improving tax compliance: bottom-up (BU) interventions focused on increasing vendors’ willingness to pay taxes, and top-down (TD) interventions focused on improving the government’s ability to enforce and collect taxes. This experiment was randomized at the level of the market, across 128 markets in eight districts in Malawi.
The experiment’s interventions were implemented by the Local Government Accountability and Performance (LGAP) activity of the United States Agency for International Development’s mission in Malawi (USAID/Malawi). The aim of LGAP is to support the Government of Malawi in determining the best ways to improve service delivery and democratic practice at the local level. NORC conducted this study in partnership with USAID’s Center of Excellence on Democracy, Human Rights, and Governance (DRG), USAID/Malawi, and DAI Global LLC, LGAP’s implementing partner.
This report begins with a brief discussion of the relevant attributes of the background and context of Malawi. In Malawi, as in many sub-Saharan African countries, fees from open-air markets are one of the largest sources of own revenue for local (in this case, district) governments. However, current tax compliance levels are low,1 limiting the ability of local governments to fund service provision or invest in higher bureaucratic capacity to collect more taxes. Potential taxpayers, in turn, are reluctant to pay taxes until they see their tax payments’ ‘return on investment’ in the form of government-provided public services. Market taxation is also an excellent candidate for improving revenues. Market vendors are assembled in dense, observable locations. This should make it relatively less costly for governments to collect revenues, if they invest in sufficient capacity. Market vendors also have relatively homogeneous preferences in that they wish a share of their tax revenues to be spent on market improvements, and qualitative research indicates high theoretical willingness to pay taxes, provided they see benefits in return.
The experiment was designed to test two theories of how governments can increase tax revenues. First, governments can bargain with citizens, providing public goods or other desired policies in return for compliance with taxation. Second, governments can invest in bureaucratic capacity and monitoring to decrease the costs of collection, including waste and corruption, thereby increasing the percent of each dollar paid that goes to the government. Historically, governments have relied on a mixture of these two approaches. Yet, we know little about which of these approaches works best in today’s developing countries.
We used these theories of change to develop two sets of interventions: a BU intervention that focused on increasing vendors’ willingness to pay taxes, and a TD intervention that focused on improving the government’s capacity to enforce tax collection and tax collectors’ efforts in collecting daily fees, as well as reducing money lost through corruption. Each treatment arm consisted of a bundle of related interventions. The BU intervention bundle focused on kick-starting vendors’ willingness to pay taxes and included facilitating communication between market vendors and government; constructing new public goods in markets; and increasing transparency regarding
1 For example, baseline data collection for the intervention shows that only 60 percent of market vendors reported full compliance with the market fee, and only 27 percent could produce a recent tax receipt.
CONTRACT No. GS-10F-0033M / ORDER No. AID-OAA-M-13-00013
USAID.GOV DRG-LER TASKING N030 IMPACT EVALUATION OF USAID/MALAWI LGAP ACTIVITY – FINAL REPORT | 2
revenue levels and spending. The TD intervention bundle aimed to improve the local governments’ ability to collect, track, and manage market revenue collection. It included rolling out a mobile-based market fee payment system to make tracking revenue easier, initiating monthly vendor counts to generate revenue targets, and using these targets to create an incentive scheme for tax collectors to improve effort and reduce corruption.
We assess the impacts of these interventions through a randomized field experiment. Working in eight districts, we created a sample of 128 markets, favoring larger markets that met daily. These were divided at random into four equally-sized groups of 32 markets: a control group that received no intervention; a group that only received the BU intervention, a group that only received the TD intervention; and a group that received both interventions. We collected baseline data from vendors, tax collectors, and district governments in late 2017. LGAP started rolling out the intervention components in October 2017 and the components were all in place by mid-2018. Endline data was collected in late 2018. While several implementation challenges resulted in modifications and delays to the treatment components, we note these issues likely bias against finding treatment effects, meaning that the results presented in this report likely represent the lower bound of potential effects.
We find encouraging evidence that the interventions increased tax compliance, especially in the BU group. At endline, vendors in the BU treatment markets are more likely to have a tax payment receipt, which is the measure of tax compliance least vulnerable to measurement error and therefore the most trustworthy. While we also find higher revenues in the treatment markets at endline, we cannot eliminate the possibility that the markets in the treatment groups had different rates of revenue collection at baseline, in which case the interventions did not in fact increase revenues. Thus, while we are confident that the BU treatment increased tax compliance, we are not sure whether this additional revenue actually reached the government. In the TD group, we find no effect on individual compliance. While it is possible that we did increase the revenues that actually reach the government, the uncertainty surrounding revenue data quality means that we cannot say for certain. Finally, markets that received both the BU and the TD treatments did not experience significant increases in either tax compliance or revenue collection, which could be because the two treatments cancelled each other out or because the complicated nature of the interventions made it challenging to implement both, especially with proper attention to how the vendors might receive different components.
The interventions also affected intermediate outcomes consistent with our theory of change. The BU interventions significantly increased vendors’ satisfaction with services and their belief that paying taxes is a duty. In the TD treatment group, vendors were more likely to report that they paid taxes because there were consequences if they did not, tax collectors report working longer hours, and vendors perceive lower bribe-taking. In the TD+BU group, we find some, but not all, of the same intermediate effects as in the BU group, but none of the intermediate effects found in the TD-only group. These findings suggest that local revenue collection can be kickstarted even from a low baseline, particularly by enhancing accountability and transparency surrounding tax revenue to, in turn, increase taxpayers’ willingness to pay taxes.
An infographic for this Impact Evaluation that can be found at https://pdf.usaid.gov/pdf_docs/PA00XF63.pdf

CONTRACT No. GS-10F-0033M / ORDER No. AID-OAA-M-13-00013
USAID.GOV DRG-LER TASKING N030 IMPACT EVALUATION OF USAID/MALAWI LGAP ACTIVITY – FINAL REPORT | 3
I. INTRODUCTION Conducted in Malawi between October 2017 and December 2018, this randomized control trial sought to increase tax compliance among vendors in open air markets. In Malawi, as in many sub-Saharan African countries, fees from open-air markets are one of the largest sources of own revenue for local (in this case, district) governments. However, low levels of tax compliance limit the ability of local governments to fund service provision. Potential taxpayers, in turn, are reluctant to pay taxes until they see a ‘return on investment’ of their tax payments in the form of government-provided public services. While individual market fees are small—typically 14-28 cents per day—the sheer number of markets and vendors suggests the potential for significant revenue gains. Across the 8 districts in our sample, we estimate that there are approximately 23,000 market vendors.2 If each vendor made one additional USD0.20 tax payment per week, the districts would increase own revenue by USD242,450 per year—enough to drill 80 new boreholes.3
This field experiment was conducted as one component of the Local Government Accountability and Performance (LGAP) activity of the United States Agency for International Development’s Mission in Malawi (USAID/Malawi). USAID/Malawi developed the LGAP activity to support improved democratic accountability and local government capacity to effectively and efficiently deliver public services, for improved government performance. The aim of LGAP is to support the Government of Malawi in determining the best ways to improve service delivery and democratic practice. LGAP focuses primarily on three areas: 1) supporting citizen engagement and advocacy for accountable local government; 2) building the capacities of local government to transparently deliver on their mandates; and 3) supporting decentralization policy and process reforms as required by the Public Sector Reform (PSR) agenda. LGAP is a five-year activity (2016-2021) with a total budget of approximately USD15 million (at contract award). LGAP is implemented by DAI Global LLC.
The two-by-two factorial experiment assessed the effectiveness of two different approaches to improving tax compliance: bottom-up (BU) measures focused on increasing vendors’ willingness to pay taxes, and top-down (TD) measures focused on improving the government’s ability to enforce and collect taxes. This experiment was randomized at the level of the market, across 128 markets in eight districts in Malawi. The experiment was designed to test two theories of how governments can increase tax revenues. First, governments can bargain with citizens, providing public goods or other desired policies in return for voluntary compliance with taxation. Second, governments can invest in bureaucratic capacity and monitoring to decrease the costs of collection, including waste and corruption, thereby increasing the percent of each dollar paid that goes to the government.
2 This is a conservative estimate generated using vendor counts for TD and BU/TD from October 2018. We took the average of the market day (the day(s) of the week designated as the primary day of market operation) and non-market day (the day(s) of the week there are a smaller subset of vendors operating) vendor counts, and then assumed each market has one market day and six non-market days. To get an estimate of the average number of vendors active each day, we then divided this number by seven. Assuming that the sixty-four TD and BU/TD markets are roughly the same, we then multiply this estimate by two to arrive at the final estimate. We are fairly confident that this is a conservative estimate because we know that the sum of the average number of vendors active on market days (multiplied by two) is 53,400. Because vendor counts were done across a series of days, however, we cannot know whether these are 53,400 unique individuals. 3 We obtained this estimate by multiplying the estimate of the total number of vendors by USD0.20 and then by 52, to estimate a USD0.20 increase per vendor in each week. We assume each borehole costs approximately USD3000.

CONTRACT No. GS-10F-0033M / ORDER No. AID-OAA-M-13-00013
USAID.GOV DRG-LER TASKING N030 IMPACT EVALUATION OF USAID/MALAWI LGAP ACTIVITY – FINAL REPORT | 4
Historically, governments have relied on a mixture of these two approaches. Yet, we know little about which of these approaches works best in today’s developing countries.
This impact evaluation report provides findings from both baseline and endline data collection. First, this report summarizes the context of tax compliance in Malawi, including descriptive information regarding compliance levels and vendor attitudes prior to the intervention’s launch. These data show low baseline levels of tax compliance and suggest that there are two main barriers to tax compliance; on the citizen side, vendors do not see the benefits from paying market fees, and have low trust in government. On the government side, capacity and information is low and tax collectors are not well paid or motivated.
Second, this report outlines the two interventions designed to address these issues and increase both vendor fee compliance and the revenues that actually reach government, and summarizes the research design for the impact evaluation. We also briefly discuss the differences between the proposed research design and the ultimate treatments received by markets as well as their causes, and their relevance to our findings.
Finally, this report describes the causal impact of each treatment arm (only BU intervention, only TD intervention, and both interventions together) on levels of tax compliance compared to control markets (i.e., those that did not receive any intervention). The experimental design of these interventions—that is to say, their randomization across markets—provides a credible basis for causal inference.
We find encouraging evidence that the interventions increased tax compliance, especially in the BU group. At endline, vendors in the BU treatment markets are more likely to have a tax payment receipt, which is the measure of tax compliance least vulnerable to measurement error and therefore the most trustworthy. While we also find higher revenues in the treatment markets at endline, we cannot eliminate the possibility that the markets in the treatment groups had different rates of revenue collection at baseline, in which case the interventions did not in fact increase revenues. Thus, while we are confident that the BU treatment increased tax compliance, we are not sure whether this additional revenue actually reached the government. In the TD group, we find no effect on individual compliance. While it is possible that we did increase the revenues that actually reach the government, the uncertainty surrounding revenue data quality means that we cannot say for certain. Finally, markets that received both the BU and the TD treatments did not experience significant increases in either tax compliance or revenue collection, which could be because the two treatments cancelled each other out or because the complicated nature of the interventions made it challenging to implement both, especially with proper attention to how the vendors might receive different components.
The interventions also affected intermediate outcomes consistent with our theory of change. The BU interventions significantly increased vendors’ satisfaction with services and their belief that paying taxes is a duty. In the TD treatment group, vendors were more likely to report that they paid taxes because there were consequences if they did not, tax collectors report working longer hours, and vendors perceive lower bribe-taking. In the TD+BU group, we find some, but not all, of the same intermediate effects as in the BU group, but none of the intermediate effects found in the TD-only group. These findings suggest that local revenue collection can be kickstarted even from a low baseline, particularly by enhancing accountability and transparency surrounding tax revenue to, in turn, increase taxpayers’ willingness to pay taxes.

CONTRACT No. GS-10F-0033M / ORDER No. AID-OAA-M-13-00013
USAID.GOV DRG-LER TASKING N030 IMPACT EVALUATION OF USAID/MALAWI LGAP ACTIVITY – FINAL REPORT | 5
2. BACKGROUND ON THE MALAWI CONTEXT The 2019 UNDP Human Development Report estimates that approximately 53 percent of the population in Malawi is multi-dimensionally poor, while an additional 28 percent of the population is vulnerable to multi-dimensional poverty. Moreover, Malawi is among the most aid-dependent countries in the world. According to UNICEF, between FY2014/15 and FY2018/2019, donor contributions constituted 17 percent of Malawi’s national budget, on average. Donor contributions for FY2018/2019 were forecasted to represent approximately 75 percent of government expenditure on development projects alone. This may have consequences for government effectiveness: as measured by the World Bank’s Worldwide Governance Indicators (WGI), Government Effectiveness in Malawi has declined, relative to other countries, since 2010. While Malawi was ranked in the 42nd percentile globally in 2010, its ranking in 2017 placed it in the 24th percentile.
Part of the issue is that local governments in Malawi struggle with local revenue collection. In many districts, the largest current source of local revenue is fees collected from markets.4 As such, increasing local revenue collection and improving the delivery of public services has the potential to support Malawi’s long-term economic and political development. Below, this report outlines the barriers to tax collection and compliance identified during baseline, and describes the ways in which the impact evaluation interventions was designed to address them. The interventions sought to address both the barriers that stand in the way of effective tax collection and those that make vendors unwilling to pay taxes.
In practice, tax compliance in markets is often relatively low. In most markets, vendors are supposed to pay a fixed fee for each day they sell in the market (typically equivalent to between USD0.14 and USD0.27). Our baseline survey, completed before treatment assignment and before rollout of the interventions, indicated that, on average, only 67 percent of vendors were paying their fees consistently, with significant respondent level variation (standard deviation is 25 percent).5 Preliminary fieldwork identified two main categories of barriers to higher tax compliance: vendors are unwilling to pay voluntarily and local governments lack the capacity to enforce the tax and collect it efficiently. Ultimately, low tax compliance is driven by the breakdown of the relationship between local government and market vendors.
Focusing on government-side factors, there were two significant issues with the tax collection process at baseline. The normal system—whereby a vendor pays cash and the collector issues a receipt—is prone to corruption (in the form of bribery, under-payment, and evasion). Neither market masters nor the district government seemed to have a good understanding of how many vendors are present in the market, making it difficult to know how much revenue to expect. Moreover, tax collectors themselves had low capacity to enforce compliance and little motivation to work hard. Baseline surveys of tax collectors indicated daily earnings equivalent to between USD0.80 and USD1.35 per day. Finally, at the district level, there was no established, rigorous, and transparent system for tracking funds. While districts are supposed to have a computerized system to track revenues, few used the system in practice, owing to a lack of technical expertise and working computers. This made it easier for money to ‘leak’ from the vendor to government pipeline.
4 Additional details describing local government and revenue collection in Malawi are available in Appendix A. 5 This estimate is based on a measure of perceived group compliance, which should suffer less from social desirability bias than self-reported tax compliance. Indeed, self-reported tax compliance is higher, 76 percent, and also shows higher variation (standard deviation is 33 percent).

CONTRACT No. GS-10F-0033M / ORDER No. AID-OAA-M-13-00013
USAID.GOV DRG-LER TASKING N030 IMPACT EVALUATION OF USAID/MALAWI LGAP ACTIVITY – FINAL REPORT | 6
The effects of low government capacity on tax collection could be mitigated if market vendors were willing to pay their fees voluntarily. However, at baseline, we found that vendors’ willingness to pay taxes remained low for several reasons. First, vendors perceived that they received little value in return from their tax payments. At baseline, 61 percent of respondents reported being dissatisfied with market services. As described in focus group discussions, the lack of public services in markets served to decrease vendors’ trust in government, and eroded the legitimacy of the market tax itself. The problem of poor service delivery was compounded by a belief that both tax collectors and local government are not accountable to citizens. In practice, vendors trusted neither their tax collectors to deliver revenues to their local government, nor did they trust local government to spend this revenue on service delivery. Over time, these two barriers have compounded each other. Finally, preliminary fieldwork and baseline surveys indicated that vendors felt excluded from the tax collection system. Respondents argued that market vendors associations had been excluded from tax collection institutions and processes, and that this was a barrier to achieving ‘buy-in’ from many vendors. Without input, or at least insight, into the tax collection system, vendors viewed the system as a corrupt and mismanaged ‘black box.’
PAST INTERVENTIONS IN TAX COLLECTION IN MALAWI
Despite the importance of own-source revenue for districts, our fieldwork suggested that very few interventions addressed low tax compliance in markets specifically. However, we did learn of one high-achieving District Revenue Manager who attempted to increase tax compliance in the markets in his district through commission pay and ‘pep talks’ with tax collectors. Despite the short-term and unstructured nature of his efforts, he appeared to have succeeded in increasing tax compliance among market vendors significantly. This suggested that there was significant potential for improvement.

CONTRACT No. GS-10F-0033M / ORDER No. AID-OAA-M-13-00013
USAID.GOV DRG-LER TASKING N030 IMPACT EVALUATION OF USAID/MALAWI LGAP ACTIVITY – FINAL REPORT | 7
3. EXPERIMENTAL INTERVENTIONS AND EVALUATION DESIGN
THEORY OF CHANGE
The pre-intervention barriers to tax compliance in Malawian markets line up with two main theories of tax compliance: governments can raise revenues either through increasing citizens’ willingness to pay taxes voluntarily or through increasing government capacity—which can either increase the costs of tax evasion or decrease leakage and corruption. Our field experiment took the form of a two-by-two factorial experiment consisting of two cross-cutting treatment arms that were randomized at the market level. The BU arm was designed to increase vendors’ willingness to pay taxes; the TD arm was designed to improve government capacity to collect taxes efficiently. Each treatment arm had several components, outlined below. Random assignment of treatments generated four groups of markets: those that received neither treatment (control markets); only the BU intervention (BU markets); only the TD intervention (TD markets); or both BU and TD interventions (BOTH markets). Table 1 shows the sizes of the groups.
Table 1. Two-by-two Factorial Experiment Design
Treatment 2: Top-Down Activities
Yes No
Treatment 1: Bottom-Up Activities
Yes Group 1
32 markets
Group 2
32 Markets
No Group 3
32 Markets
Group 4
32 Markets
The experiment associated with this impact evaluation is one of the only tax compliance experiments to conduct interventions at the community (here, the market) rather than individual level. This is critical because many theories of tax compliance rely on community-level variables like the level of public goods provision, or beliefs about whether others are also paying. Thus, this research design allows us to test a key element of tax compliance theory that cannot be addressed through experiments that rely on treating individuals.
EVALUATION OBJECTIVES
The objective of this impact evaluation is to determine the validity of the theory of change. Our theory suggests that the interventions should cause individuals to be more likely to pay market fees and should increase the revenue base for the district governments. As such, we seek to identify whether the interventions delineated above truly caused an increase in tax compliance among market vendors and revenue flowing to the districts. We test for these effects in a variety of ways. Beyond simply seeing whether there is an increase in tax compliance and revenue, however, a further goal of this impact evaluation is to assess why or why not any effects may have occurred. Therefore, in the descriptions of the interventions below, we delineate the path through which each of the treatment components could be expected to affect tax compliance and revenue. Although the bundled nature of the treatment may make it difficult to conclude definitively which parts of each treatment drive any potential effects, the richness of the data at our disposal allows us to see the intervention’s impact on a series of intermediate outcomes that shed light on the causal mechanisms through which the interventions have an effect on tax compliance and revenue.

CONTRACT No. GS-10F-0033M / ORDER No. AID-OAA-M-13-00013
USAID.GOV DRG-LER TASKING N030 IMPACT EVALUATION OF USAID/MALAWI LGAP ACTIVITY – FINAL REPORT | 8
EXPERIMENTAL TREATMENTS AND COMPONENTS
BOTTOM-UP TREATMENTS
We designed the first intervention bundle to increase vendors’ willingness to pay market taxes voluntarily. Above, we identified three key reasons for low compliance: vendors feel that they receive little in return for tax payments, especially with regards to market services; they do not see the government as accountable to vendors (citizens) and do not trust it to provide market services in the absence of stronger accountability; and they feel excluded from the tax system’s structure. To address these barriers, we implemented a four-component BU intervention. Markets assigned to receive the BU treatments received all of the components described below except for Step 1: Facilitating Market Committee Elections, which only markets without valid market committees received.
We designed a bundled intervention because our pilot research with vendors suggested that each component was unlikely to have a large impact on its own. A successful intervention needed to first identify grievances and problems between market vendors and district governments through the meetings, then provide a costly signal of government commitment through the construction grants, and finally, improve transparency. Improved transparency would help sustain any positive changes as well as empower vendors to monitor and sanction local officials for how they use market revenues.
STEP 1: FACILITATE MARKET COMMITTEE ELECTIONS
Not all markets in the BU and BOTH treatment groups had valid market committees. Invalid market committees are those that were formed without following council approved procedures—such as committees that were directly imposed on markets by the government—or whose terms had expired. As these market committees should serve to represent the market vendors’ interests and interact with the government, it is important that vendors see these committees as legitimate extensions of their own interests. Only the markets in Mulanje district had valid market committees. As such, between October 2017 and December 2017, new elections were held in the 54 BU and BOTH markets that did not have valid market committees. All newly elected market committees received a training in which committee members learned about the proper organizational structure for the committee and the roles and responsibilities of the market committees. These trainings, co-run by the district councils’ district capacity building staff and LGAP district staff, took place in December 2017 and January 2018. Trainings emphasized that regulations governing committees are government-sanctioned, which aimed to increase their validity and signal to committee members that they themselves are legitimate actors in the governing structure. As the market committees played key roles in some of the other BU interventions, vendors had to be able to see them as an interface between them and the government.
STEP 2: FACILITATE MEETINGS BETWEEN VENDORS, MARKET COMMITTEES, AND LOCAL GOVERNMENT
After ensuring that each treatment market had a valid market committee, the implementation partner facilitated public meetings to address vendors’ exclusion from the taxation system. These meetings included vendors, market vendors’ committees, and local government officials at BU and BOTH markets. The local officials included a representative from the District Finance Office, the market’s tax collectors, the market/zone managers, the local ward councilor, and group village headmen. These meetings, which took place between January and February 2018, were observed by the LGAP district coordinator and included the following:

CONTRACT No. GS-10F-0033M / ORDER No. AID-OAA-M-13-00013
USAID.GOV DRG-LER TASKING N030 IMPACT EVALUATION OF USAID/MALAWI LGAP ACTIVITY – FINAL REPORT | 9
A speech by the ward councilor in which they reminded vendors of the connection between taxes and development in the market.
A discussion of the roles and responsibilities of vendors and government officials, including vendors’ obligation to pay market fees whether or not they sold any goods.
A discussion of the perceived problems with the current tax collection system, in particular barriers faced by vendors.
An explanation of the BU intervention and the way it will impact market operations. This included discussing the way the council uses funds from market fees and introducing the mHub Short Message Service (SMS) Market Revenue Reporting and Grievance Reporting systems.6 At the end of the meeting, vendors were able to register for the SMS system. A total of 2,435 vendors signed up for the SMS system at the kickoff meetings, with a median of 44 registrations per market. Not all vendors registered for the system. The median proportion of vendors in attendance who signed up for the system was 0.729.
Documentation and discussion of the state of market services, including toilets, sanitation, security, and infrastructure. Vendors had the opportunity to develop a list of priorities—from an approved list of six project types7—for how the government should upgrade markets. This list was used to decide which infrastructure project a market would receive.8
This piece of the intervention resembles the classic case of tax bargaining, in which governments make policy concessions to vendors in return for tax revenues. We anticipated that this part of the intervention would increase citizens’ sense that they have a say in how markets are run, alleviating the sense of exclusion that leads to low tax compliance. It may also have increased trust in local officials, especially if vendors viewed these meetings as ‘good faith gestures’ from local government. Finally, vendors received information about how revenues are used. A total of 3,515 vendors attended these kickoff meetings in 52 of the 64 markets that received the BU treatment bundle, with a median attendance of 61.5 vendors.9
STEP 3: JUMP START SERVICE DELIVERY IN MARKETS
The meetings in Step 2 would be ineffective if vendors did not subsequently see improvements in services. Our scoping research indicated that increased revenues should be sufficient to maintain better services once infrastructure investments are made.10 However, the condition of services in many markets at this point was so poor that even drastically improved tax compliance would be insufficient to fund necessary infrastructure improvements: low tax compliance leaves local government without funds for improvements, but citizens refuse to pay until services improve. This
6 See Step 4 for more information. 7 Market shed, borehole, electricity, pathways, concrete slab, and refuse bins. 8 See Step 3 for more information. 9 These statistics exclude 11 M’mbelwa markets and one Mulanje market. These markets had kickoff meetings, but complete kickoff meeting reports were not available. 10 For example, we estimate that ten days of fees from ten vendors would cover the cost of a month of periodic trash pickup across several markets in an area, and that 25 days of fees from ten vendors would cover the cost of a security guard for one market.

CONTRACT No. GS-10F-0033M / ORDER No. AID-OAA-M-13-00013
USAID.GOV DRG-LER TASKING N030 IMPACT EVALUATION OF USAID/MALAWI LGAP ACTIVITY – FINAL REPORT | 10
suggests the need to ‘jump-start’ the tax-service provision loop by funding infrastructure improvements.
The initial meetings in Step 2 generated a list of priorities in each market. LGAP worked with the local government to implement priority projects in each market. Vendors were able to choose between a market shed, a borehole for water access, electricity, improved formal pathways, concrete slabs for stalls, and refuse bins. Forty-six markets chose a borehole. The other 18 chose a mix of the remaining project types. Each BU market was allotted USD5,000 for these infrastructure projects. These grants were clearly small and therefore not sufficient to completely rehabilitate markets. Rather, they were designed to be sufficient for small-scale infrastructure improvements. Construction specialists scoped and visited the markets during the summer of 2018 to complete the necessary field assessments. A competitive bidding process between July and September 2018 led to the selection of the appropriate construction firms. Construction began in September 2018 and finished in March 2019. However, almost all markets saw at least some construction progress prior to endline data collection in November-December 2018. Each project was bookended by an opening ceremony and a handover ceremony, attended by government officials and vendors. Market committees were responsible for monitoring the state of the projects, and, upon their completion, developed a maintenance plan in conjunction with the district council. We anticipated that this part of the intervention would serve as a costly signal of the government’s commitment to improving service provision in markets.11
STEP 4: INCREASE TRANSPARENCY IN THE TAXATION SYSTEM VIA SMS REVENUE REPORTING AND GRIEVANCE REPORTING SYSTEMS
If local governments build new market infrastructure, but fail to maintain market services by providing ongoing sanitation and security services, tax compliance is unlikely to increase. To strengthen citizens’ trust that their tax funds are being used well, and to facilitate BU accountability between vendors and local government, citizens must also have information about government revenue and spending on an ongoing basis; a one-off meeting is unlikely to yield long-term gains.
To improve citizens’ access to information, we implemented an SMS messaging system designed to keep citizens informed about revenue collection and the type of expenditures made by district governments. mHub, an organization in Malawi that works with businesses and other organizations on information and communication technology projects, developed and managed the system.12 At the meetings in Step 2, vendors were able to sign up for the SMS service. All vendors who signed up received the SMS messages unless they opted out.13,14 Each subsequent month, vendors received a message with the amount of revenues the government raised from the market in the previous month, along with information on how the money generally was allocated and spent. The text of these messages was designed to become more specific over the intervention period, as vendors
11 Improved infrastructure may also have downstream effects on vendors’ economic outcomes. In focus groups, customers cited poor sanitation as a reason for avoiding certain markets. 12 http://www.mhubmw.com/ 13 An initial pilot of this idea in two markets demonstrated that vendors were eager to bear this small cost to sign up for this service. 14 Although the opt-out rate was not directly tracked, we have reason to believe that the retention rate per market was quite high. We estimated the retention rate by dividing the total number of individuals who signed up for the SMS service during the kickoff meetings by the total number individuals who were receiving messages in a market in December 2018. The market-level average was 84 percent, with a standard deviation of 26 percent. Twenty percent of markets increased SMS recipients from beginning to end of intervention.

CONTRACT No. GS-10F-0033M / ORDER No. AID-OAA-M-13-00013
USAID.GOV DRG-LER TASKING N030 IMPACT EVALUATION OF USAID/MALAWI LGAP ACTIVITY – FINAL REPORT | 11
became more comfortable with the system. One of the main advantages of the SMS system was that, once data on market revenues were collected, the system for passing information to vendors was centrally managed and required few steps. Messages were first sent out in January 2018,15 and were last sent out in November 2018.
In addition to obtaining information on market revenues, vendors were able to use a related SMS system, also set up and managed by mHub, to report complaints and grievances about local government service delivery. Vendors were informed about this system in the meetings in Step 2, and markets were given materials to explain the system’s use. During the intervention period, grievances were passed on to district government officials designated by LGAP. mHub, in conjunction with the district governments, followed up with complainants when issues had been resolved.
This component of the BU intervention was designed to improve transparency and information regarding how revenues were used. If revenues were being used well, this should have helped to sustain high willingness to pay taxes among vendors. If, however, funds were not being used well, it may have had the opposite effect.16 The grievance system was designed to give vendors more agency and enable them to make sure that revenues were used well.
Collectively, the four steps in the BU intervention had the potential to significantly improve vendors’ willingness to pay taxes. Overall, the intervention was designed to increase tax revenues; improve market services; increase vendor satisfaction with local governments; and empower vendors to hold officials accountable for how funds are spent. Increases in market services may have had additional benefits for vendors, including attracting more customers, increasing profits and improving public health in and around markets.
TOP-DOWN TREATMENTS
The second treatment arm was designed to improve district governments’ capacity to collect taxes, to reduce the leakage of revenues as they were transferred to the district governments, and to reduce corruption on the part of the tax collectors and market masters. Above we identified three key barriers to collection: inefficient collection systems; lack of knowledge of vendor numbers and expected revenues; and lack of incentives for tax collectors to work hard. All markets assigned to receive the TD treatment (the TD and BOTH groups) received the following four components, which worked together closely.
STEP 1: ROLL OUT MOBILE-BASED MARKET FEE PAYMENT SYSTEM
To address the widespread potential for evasion, corruption, and inefficiency at the market level, markets in the TD condition shifted to remitting market fees via mobile technology. Airtel Malawi was engaged to collect fees on behalf of the district council. Tax collectors still collected fees from vendors and then gave the money to the market manager, who was then responsible for transferring the money to the Airtel agent17 responsible for the market. The money was then transferred to the
15 In markets where kickoff meetings had already taken place. 16 In our scoping and buy-in meetings, multiple stakeholders emphasized the importance of conveying the information about revenue clearly and simply, so that it would not be misunderstood by vendors and cause perverse effects, even in markets where the council is actually improving and contributing to market maintenance regularly. 17 No market vendors were recruited as Airtel agents.
CONTRACT No. GS-10F-0033M / ORDER No. AID-OAA-M-13-00013
USAID.GOV DRG-LER TASKING N030 IMPACT EVALUATION OF USAID/MALAWI LGAP ACTIVITY – FINAL REPORT | 12
district council bank accounts. Airtel earned two percent of the fees as payment. Besides making payment of fees and their transfer to the district governments much more regulated and straightforward, this system was designed to allow the government to more reliably track how much each market collects in fees. It also made it easier to see if certain markets were not transferring fees as regularly as they should. Markets started using the mobile money in March 2018 and continued using it until December 2018.18
STEP 2: PROVIDE ACCURATE AND RELIABLE MARKET VENDOR COUNTS
One barrier to efficiently collecting market fees is the lack of a reliable estimate of anticipated revenue, which is required to determine collector benchmarks, monitor collector performance, and forecast local government revenue. The size of the market (measured in the number of vendors) changes over the course of the week, month, and year. Because of this, a formal registration system seemed cumbersome and likely to either marginalize irregular vendors or place an undue burden on them. Nevertheless, market size estimates are necessary to generate revenue targets and forecast revenue. To address this issue, LGAP hired and trained vendor counters, who could not be market vendors or government staff. Counters visited each market at least four times a month — twice each on a market day and on a non-market day.19 These vendor counters used a ‘walk-around’ method, systematically walking through the market and recording the number of vendors by type of business. On each visit, they counted vendors twice at different times of the day to obtain a more accurate count. Vendor counting started in February 2018 and continued until October 2018.
STEP 3: FORECAST REVENUE AND GENERATE REVENUE TARGETS BASED ON VENDOR NUMBERS
The figures produced in Step 2 were used to determine collector compensation schemes, forecast local government revenue, and track LGAP performance. The counts, once transferred to the government, were fed into a revenue target calculator that estimated the expected monthly revenue. The calculator adjusted targets for each market based on the revenues that were collected in the previous month and the number of market days per week. These targets were then communicated to market masters and revenue collectors. Producing these revenue estimates was designed to serve multiple purposes. First, it should have allowed local governments to know how much revenue to expect. Second, it provided a way to evaluate the performance of a market, both in terms of vendors’ tax compliance and tax collectors’ ability to collect fees. For the latter group, it ideally provided a check against corruption and served as an incentive for better performance. Targets were first sent to markets starting in April 2018. The last targets were communicated in November 2018.
STEP 4: INTRODUCE INCENTIVES FOR TAX COLLECTORS
Under the pre-treatment system, tax collectors lacked incentives to enforce revenue collection. In some markets, tax collectors received a fixed wage, with no incentives based on the revenues raised. In others, they received commission pay. However, among both groups tax collectors were paid less than USD1 a day, and in vendor focus groups, vendors frequently noted that they believed that
18 Some markets continued using mobile money after December 2018, but LGAP stopped tracking which markets were doing so, as the evaluation period had ended. 19 Vendor counters visited markets about every two weeks. Some markets were visited five or six times in one month. Most Malawian markets have “market days,” when large numbers of vendors come to the market to sell their goods or services, and “non-market” days, when (in some cases considerably) fewer vendors sell in the market.

CONTRACT No. GS-10F-0033M / ORDER No. AID-OAA-M-13-00013
USAID.GOV DRG-LER TASKING N030 IMPACT EVALUATION OF USAID/MALAWI LGAP ACTIVITY – FINAL REPORT | 13
collectors were driven to bribery out of desperation and a need for supplementary income. Salaries are also often late, reducing the incentive to work hard. Many tax collectors detailed the additional effort required to fully enforce tax compliance and punish the non-compliers; they hinted that they were possibly not as motivated as they could be, due to low incomes.
To address these issues, we implemented a bonus-type incentive system using the revenue targets created in Step 3. These incentives were non-monetary in nature and were applied at two levels: market and individual. After the first month, if a market met or surpassed its monthly revenue target, the market team received a wheelbarrow and a bicycle.20 Each successive month that a market met its target, it would receive another wheelbarrow-bicycle pair. These incentives were designed to make tax collectors’ job easier and inspire them to perform their jobs without having to resort to bribery.21
BUNDLED TREATMENTS
We recognize that bundling several components into each treatment arm will make it harder to detect the separate effect of each component on tax compliance. However, given the limited previous experimental research on group-level tax compliance, particularly in sub-Saharan Africa, we argue that it is more important to provide a strong initial test of each theory of tax compliance. The decision to bundle treatments in the manner described above was made for two reasons. First, the lack of clear evidence on effective methods for increasing tax collection made it important to provide a strong test of each potential mechanism. Thus, if the bundle of BU treatments below was implemented correctly and yet there was no increase in tax compliance, it would suggest that BU strategies may simply not be effective in this context. Unbundling would require choosing one component for the intervention; if it failed, it would not be clear whether this was because the overall approach is ineffective, or whether the treatment was simply too weak. A factorial version of an unbundled experiment would have required an unrealistically large sample, otherwise power would be significantly affected by small treatment group size. Second, our qualitative fieldwork prior to the start of the project suggested that each approach (TD and BU) would only be successful if it solved multiple problems simultaneously. Baseline and endline data collection were designed to provide information about the elements of each bundle that appear to have the largest effect on outcomes. If these interventions succeed in increasing revenue collection, future research can disaggregate the bundles to determine which aspects of each treatment arm are driving the effect.
SAMPLE SIZE AND TREATMENT ASSIGNMENT
In May 2017, LGAP conducted a market listing and mapping exercise in the eight sample districts. First, LGAP staff spoke to district officials and locals, allowing them to identify all markets in these
20 During the first month, markets received wheelbarrows, and tax collectors received individualized incentives such as mattresses or bicycles. After April, the district governments complained that these incentives were individualized and stipulated that tax collectors’ incentives had to be tied to the market. Markets that received incentives received a wheelbarrow and one bicycle, even if it had more than one tax collector. As such, the incentives were no longer tax collector-focused. This may have weakened the top-down treatment. 21 We note that the incentives were supposed to have been delivered to the markets and tax collectors who met their targets in the subsequent month. In actuality, the incentives were delivered between one and four months later. In addition, the implementing partner found in an audit after the intervention had been completed that a significant proportion that received incentives actually did not meet their targets, and that some markets that had met their targets did not receive incentives. They were not able to find a systematic explanation for why this occurred. It is possible that the delay and lack of congruence between incentives and market revenues weakened the top-down treatment.

CONTRACT No. GS-10F-0033M / ORDER No. AID-OAA-M-13-00013
USAID.GOV DRG-LER TASKING N030 IMPACT EVALUATION OF USAID/MALAWI LGAP ACTIVITY – FINAL REPORT | 14
districts.22 Using this information and following up with visits to the markets, LGAP created a market databank, which includes information on market days, number of vendors, and market conditions. We used this information to create a list of 128 markets, with 128 markets giving us sufficient power.23 The selection of markets was not random. We first chose markets that had at least one market day a week and that had at least 100 vendors on market days (i.e., they were large markets), although the fact that we had to ensure that each district had a number of markets that was divisible by four meant that not all markets in the sample have at least 100 vendors on a market day.24 The number of markets selected in each district is not the same, as there were more markets in some districts than in others.25
For treatment assignment, we followed the recommendations of Imbens (2011) and used stratified (block) random assignment. We stratified on district and the baseline level of tax compliance to create four groups of 32 markets each.26 Stratification ensured that higher or lower levels of tax compliance were not, due to randomness, more or less represented in any one treatment group.
22 There are a total of 209 markets in these eight districts. Of these, 149 are large (more than 100 vendors on a market day) markets, while 60 are small. 23 Power calculations assumed baseline tax compliance of 0.46 (i.e., 46 percent) with a standard deviation of 0.2; this was based on qualitative fieldwork prior to baseline data collection. We wanted to have 80 percent power to detect a ten percentage-point increase in tax compliance. This required a sample of at least 126 markets. 24 For example, Blantyre has six large and six small markets. To get a multiple of four, and to allow for better randomization, we selected five of the six large markets (one large market could not be picked as it was being privatized) and three of the smaller markets. 25 In the end, Balaka had 12 of 20 markets selected for the sample; Blantyre had 8 of 12 markets selected; Kasungu had 24 of 50 markets selected; Lilongwe had 16 of 21 markets selected; Machinga had 8 of 10 markets selected; Mulanje had 20 of 31 markets selected; M’mbelwa had 24 of 37; and Zomba had 16 of 28. 26 We used the ability of respondents in the baseline survey to present a valid receipt for paying taxes to operationalize tax compliance for the purpose of this stratification.
CONTRACT No. GS-10F-0033M / ORDER No. AID-OAA-M-13-00013
USAID.GOV DRG-LER TASKING N030 IMPACT EVALUATION OF USAID/MALAWI LGAP ACTIVITY – FINAL REPORT | 15
4. DEVIATIONS FROM RESEARCH DESIGN AND INTERVENTION PLAN
This was a highly complex project with multi-faceted interventions, several implementing partners (including government agencies at various levels), and significant information tracking requirements. In many markets, the project was indeed rolled out as intended and the information required for the impact evaluation was fully available. In other markets, however, interventions were delayed or modified or there were information gaps. For a complete discussion regarding these deviations, please see the pre-analysis plan associated with this impact evaluation, available at https://egap.org/registration/5997. Here, we note three things about these implementation challenges:
(1) The issues that arose during the implementation of this project, while problematic for our purposes, cannot be seen as unique to the Malawian context; on the contrary, similar issues may arise whenever such a complex project involving multiple stakeholders is implemented in a low state capacity environment.
(2) These issues are likely to bias against finding treatment effects rather than making it likely to find artificial treatment effects. In other words, the results we present below likely represent the lower bound of the potential effects of such interventions.
(3) The effect of these deviations and the robustness of our findings would be useful areas for further exploration by exploiting qualitative and quantitative data on intervention compliance and spillover in future phases of the analysis.

CONTRACT No. GS-10F-0033M / ORDER No. AID-OAA-M-13-00013
USAID.GOV DRG-LER TASKING N030 IMPACT EVALUATION OF USAID/MALAWI LGAP ACTIVITY – FINAL REPORT | 16
5. DATA COLLECTION STRATEGY
The data for the evaluation come from three sources. First, we implemented baseline and endline surveys to collect individual-level data from vendors, tax collectors, and local government officials. These surveys were carried out by our data collection partner, Innovations for Poverty Action (IPA). Second, LGAP provided ongoing information on the experiment’s implementation and facilitated the transfer of vital data from the district governments. Finally, IPA also performed monitoring visits to each of the sample markets, furnishing further data during the course of implementation. This all resulted in a rich tapestry of information upon which we draw in our analysis.
BASELINE AND ENDLINE SURVEYS
MARKET VENDORS SURVEY
In each of the 128 markets, the goal was to sample 100 vendors for a total of 12,800 interviews at both baseline and endline. Different individuals were surveyed at baseline and endline, unless the same individual was chosen by chance. At random, eighty of these vendors were given a ‘short’ (15-minute) version of the survey that primarily measures tax compliance and a handful of demographic variables. The remaining 20 respondents in each market received a ‘long’ (one-hour) version of the survey that includes more detailed data collection on demographics; economic, political, and social variables; and tax perceptions and payments.27 Vendors were selected using a modified random walk. Enumerator teams of ten scoped out the general shape of the market and then divided the market into five sections for pairs of enumerators. Each pair then divided their section into two, planned out a path that would take them past all vendors in their section, and then determined a skip pattern that meant that they would interview ten vendors each. Markets were visited on their market days to ensure that the sample estimates reflected markets when the largest number of vendors were present.28 Vendors received a small airtime voucher in return for completing the survey (MWK20029 for the short survey and either MWK300 or MWK600 for the long survey, depending on a delayed gratification experiment embedded in the long survey).
At baseline, 12,389 surveys were successfully completed. Not all markets had 100 vendors when they were visited. At endline, 12,370 surveys were successfully completed. Once again, not all markets had 100 vendors. In addition, one market was mistakenly visited on a non-market day. We use this survey to test the main hypotheses. See the Outcome Measures section for more information.
27 The long version of the survey also included a conjoint survey experiment: the conjoint at baseline tested the factors that affect perceived willingness to comply with taxation, including a measure of time horizons; at endline, the conjoint tested vendor attitudes toward civil society organizations. 28 We decided to do this as we considered it possible that vendors that do not come every day are either less likely to pay taxes consistently because they do not feel as connected to the market, or more likely to pay taxes, as they might feel less secure. Analysis of the baseline data showed that vendors who report working at a market more frequently were less likely to self-report paying taxes, although we were unable to determine the cause of this. Regardless, the baseline data showed that individuals who come less frequently are different from those who do, justifying this sampling strategy. 29 At the time of data collection, the exchange rate was USD1=MWK720, so these compensation rates varied from USD0.28-USD0.83.

CONTRACT No. GS-10F-0033M / ORDER No. AID-OAA-M-13-00013
USAID.GOV DRG-LER TASKING N030 IMPACT EVALUATION OF USAID/MALAWI LGAP ACTIVITY – FINAL REPORT | 17
TAX COLLECTORS SURVEY
Up to seven tax collectors in each market took a 20-30 minute survey including questions on knowledge of tax law; knowledge of customer service practices; number points of contact with market vendors and businesses; rejection rate in tax collection attempts; perceived proportion of market vendors paying taxes per day; amount collected in local taxes; and perceived barriers to tax compliance.30 Tax collector surveys also included a list experiment designed to elicit a measure of corruption within a market. We describe the list experiment and discuss our findings in Section 7.
At baseline, 302 tax collector surveys were completed, with an average of 2.44 per market. At endline, 264 tax collector surveys were completed, with an average of 2.06 per market.
DISTRICT COUNCIL SURVEY
All elected ward councilors, as well as selected appointed district officials31, were given a 20-30 minute survey at baseline and endline measuring: knowledge of tax law; awareness of tax roles and responsibilities; ability to forecast and track local taxes; awareness of tax compliance levels, and revenues collected, in each market in their jurisdiction; knowledge and perceptions of market services; frequency of interactions with each market; and perceived priorities for spending market tax revenues.
At baseline, 298 ward councilors and district government officials completed the survey.32 IPA attempted to contact 306 councilors and officials, representing a response rate of 97.4 percent. At endline, 352 ward councilors and district government officials were interviewed.33 It is likely that a significant number of individuals were interviewed both at baseline and at endline, especially councilors, as there was no election in between, although there was some turnover among district government officials. Nevertheless, this survey data could be considered a panel.
This survey included some market-level outcomes but as district councilors likely have both control and treatment markets in their wards, these data are primarily used descriptively, as a manipulation check, and to improve our understanding of how the intervention has affected district governance and officials’ incentives. We believe that this data is too noisy to use for analysis of our hypotheses. Although ward councilors were asked about all markets in their ward, district officials were—for the sake of time—not asked about specific markets in their district. In addition, we cannot ensure that ward councilors had the correct market in mind when answering market-specific questions.
MONITORING DATA
Throughout the intervention period between baseline and endline data collection, we collected and received information that allowed us to monitor compliance with the interventions and track changes in market behavior and tax compliance between baseline and endline. These data were
30 Most markets have fewer than seven tax collectors. For time purposes, if a market has more than seven tax collectors, seven are chosen at random. At endline, seven tax collectors were interviewed in only one market. Another market saw nine interviewed. Although we do not know why protocol was broken, it might be that the supervisor had more time. 31 IPA attempted to identify and contact all district officials involved with revenue collection, accounting, and finance. 32 One hundred one ward councillors and 197 local government officials. 33 One hundred eight ward councilors and 244 local government officials. The number at endline is larger because we were able to obtain a more comprehensive sampling frame for local government officials.

CONTRACT No. GS-10F-0033M / ORDER No. AID-OAA-M-13-00013
USAID.GOV DRG-LER TASKING N030 IMPACT EVALUATION OF USAID/MALAWI LGAP ACTIVITY – FINAL REPORT | 18
useful for us during the implementation phase, but are also crucial for our analysis, as they allow us to account for issues in implementation. LGAP provided us with information on intervention status on a monthly basis. They also collected government records relating to tax collection on a monthly basis for the entire period between baseline and endline data collection. In addition, we carried out periodic focus groups with vendors and interviews with tax collectors, market committee members, and market managers to monitor implementation of the project.
DATA EXCHANGE
LGAP provided key information that helped facilitate monitoring of the project’s roll-out. In particular, this information helped us evaluate any spillover or violations to the project’s planned interventions.34 LGAP also served as the intermediary for data from the district governments, including market revenues. These data are important beyond even monitoring the impact evaluation’s roll-out; they allow us to assess how revenues change for each market throughout the intervention period and are thus a crucial part of the post-intervention analysis.
On a monthly basis, LGAP collected the following information at the market level, for each market:
• The estimated number of vendors. This information was only available for TD markets, in the form of the number of vendors counted by the vendor counters employed as part of Step 2 of the TD interventions;
• The number of tax collectors; • The revenue targets (only for TD markets); • Total revenues from fees for each month; • Data on how market revenues have been allocated/spent. This is especially important in terms of
maintenance spending. This information was only available on the sub-office level;35 • Details on LGAP impact evaluation intervention activities that have occurred in each market; • Details on other LGAP intervention activities that have occurred within 10km of the market; • Details on non-LGAP activities within 10km of the market; and • Information about protests or complaints by vendors.
In addition, LGAP provided information at the district level, including the following:
• Summary of intervention activities; • Whether the rainy season has begun; • If treatment assignment has been altered, or if the incorrect market received a certain
intervention; • Whether tax collectors or market managers are transferring to other markets; • Whether large numbers of vendors have been noticed moving to sell in different markets; and • Whether any markets belonging to different treatment groups have begun to share information
about the different elements of the interventions.
34 In reality, this information was often delayed, which meant that we were often not able to react as quickly to issues as we would have liked. It was, however, invaluable to our analysis. 35 Markets within districts are organized into sub-offices. Even after LGAP began their assistance to the district governments, including professionalization education and capacity building—a component of LGAP not evaluated here—spending was tracked most consistently at the sub-office level. The spending information was not well reconciled and had significant gaps, so full exploration of these data is not possible at this time.

CONTRACT No. GS-10F-0033M / ORDER No. AID-OAA-M-13-00013
USAID.GOV DRG-LER TASKING N030 IMPACT EVALUATION OF USAID/MALAWI LGAP ACTIVITY – FINAL REPORT | 19
MARKET VISITS
IPA also carried out market visits throughout the intervention period. These visits supplement the quantitative analysis, allowing us to assess local perception of the interventions, provide an additional check of treatment compliance, and identify which mechanisms were being affected by the interventions.
Between November 2017 and July 2018, IPA visited each district approximately four times; once every two months). Each time, IPA representatives visited a random assortment of markets across treatment groups in that district. This means that approximately 25 percent of the study markets were visited during every two-month period. Thus, over the course of the eight months, all 128 were visited. These visits were unannounced, so that market staff could not prepare and ‘dress-up’ the market, and to avoid any changes in vendor and staff behavior that would endanger the accuracy of the observations. The visits took place on market days to maximize the number of vendors present and to observe the market at the height of its activity. The order in which markets in each district would be visited was randomly determined.
These market visits lasted roughly three hours. About two hours were devoted to observing the market and carrying out short interviews, while the last hour was reserved for a focus group discussion with a small group of market vendors. Each visit had the following format:
(1) Anonymous Walk (Duration 45 Min): The anonymous walks allowed us to assess for ourselves how the intervention was progressing in each market without having information filtered through individuals who may have a vested interest in the project’s success. IPA’s Research Associate (RA) anonymously walked around the market to collect the following information:
(a) Estimated number of vendors
(b) Quality of toilets and other services, including the availability of water and the condition of market security
(c) Evidence of recent changes/construction
(d) Presence of posters for SMS campaign
(e) Overall economic activity in the market
Data entry was done via tablet using Survey CTO.
(2) Market Manager Interview (Duration 20 Min): After the anonymous walk was complete, the RA informed the market manager of his presence and did a short interview with the market manager. The interview covered relations in the market between tax collectors, the manager, and the market committee, changes in the market—including any construction—, fee collection, revenue targets, and mobile money. It also addressed spillovers, particularly vendor and tax collectors moving to different markets. Interviews were programmed in tablets; the majority of items were close-ended, but some involved open-ended responses. Data entry was via Survey CTO.
(3) Market Committee Chairperson Interview (Duration 20 Min): Next, the RA conducted an interview with the market committee chairperson (if absent, another member of the market committee leadership). This survey focused on similar topics to the market manager survey. The

CONTRACT No. GS-10F-0033M / ORDER No. AID-OAA-M-13-00013
USAID.GOV DRG-LER TASKING N030 IMPACT EVALUATION OF USAID/MALAWI LGAP ACTIVITY – FINAL REPORT | 20
instrument was coded in tablets; the majority of items were close-ended, but some were open-ended responses. Data entry took place using Survey CTO.
(4) Tax Collector Interviews (Duration 20-60 Min): The RA then performed one to three interviews with tax collectors, depending on how many tax collectors are working the market. These interviews once again covered similar topics to the one with the market manager, but also include questions on job satisfaction. The instrument was programmed in tablets using Survey CTO; most items were coded, but some involved open-ended responses.
(5) Focus Group Discussion (FGD) (Duration 45 Min): Finally, the RA organized and moderated a focus group discussion with eight market vendors. After the RA had chosen a space for the FGD with the assistance of the market manager, he strategically chose a diverse set of participants to best represent the market, while at the same time selecting vendors qualified enough to contribute to the data gathering effort. The discussion focused on documenting which intervention activities are occurring in that market, how vendors felt about those interventions, and whether vendors had noticed any change in fee collection / compliance. IPA provided additional personnel for translation in M’mbelwa and Machinga markets, as languages different from Chichewa—the language common to most of the other districts where this project was carried out—are common there (Chitumbka and Chiyao, respectively). IPA provided a token of appreciation to FGD participants.36 IPA recorded the FGD and used the recording to produce notes following guidelines provided by the research team. Summary notes were recorded in Excel.
IPA was responsible for immediately alerting NORC of any observed violations of the research design (e.g., control markets that were receiving treatment or markets selected to a treatment not receiving it, intervention components that were being executed in a manner inconsistent with the intended design) revealed via market visits or that IPA became aware of through other means. This required that IPA’s RA developed a good grasp of the evaluation design and was aware of the randomization results and general intervention timeline. Only three violations were reported—one in a TD market and two in control markets. These appear to be isolated, minor anomalies and should have no substantive implications on the analysis below.37
36 The FGD moderator bought each FGD participant a snack or a soft drink of their choice. 37 In one TD market, vendors reported receiving SMS messages with revenue information. In one control market, a market manager said that the old committee quit because LGAP had announced that there would be elections. Lastly, fee collectors from a nearby TD market were sent to a control market because the district council distrusted the management of the control market and believed that they were not remitting enough fees.

CONTRACT No. GS-10F-0033M / ORDER No. AID-OAA-M-13-00013
USAID.GOV DRG-LER TASKING N030 IMPACT EVALUATION OF USAID/MALAWI LGAP ACTIVITY – FINAL REPORT | 21
6. DATA ANALYSIS
OUTCOME MEASURES
The analysis presented here focuses on key outcome variables from the vendor and tax collector surveys, in addition to some of the data received from the district governments.38 Of primary interest was whether tax compliance and market revenues increased as a result of the intervention. As individual- and also market-level tax compliance can be difficult to measure, we use a variety of different outcome measures. Table 2 below lists each of these outcome measures, along with the source of the data and the level at which the analysis is performed.
Table 2. Main Outcomes
Outcome Assessed Source Level of Analysis
Self-Reported Tax Compliance Vendor Survey Individual and Market
Perceived Group Tax Compliance Vendor Survey Individual and Market
Evidence of Fee Receipt from Within Past 7 Days (Proxy for Tax Compliance)
Vendor Survey Individual and Market
Market Fees Received by District Government, Standardized by Market Fee Amount
District Governments, via Data Exchange
Market
An additional objective was to investigate how the two treatment arms affected intermediate outcomes such as vendor behaviors and attitudes regarding tax compliance, their satisfaction with market services, and their relationship with the local government. This should help us understand the mechanisms behind changes in tax compliance. These intermediate outcomes are divided below into whether they assess aspects that could theoretically be moved by either the BU treatment or the TD treatment. These intermediate outcome measures are drawn largely from the vendor survey. To make the vendor survey more efficient, most of the survey items associated with these outcome measures were only included in the long version of the vendor survey. Because there were only 20 responses for the long version of the vendor survey per market at most, market-level estimates generated by aggregating individual-level responses would have large margins of error. As such, all of these outcomes will be assessed at the individual level.
The BU interventions were designed to give market vendors better access to information about fees, to give them better ownership over fee payment by tying them closer to the government and thus being able to hold them more accountable, and to show vendors how services can be improved with more regular fee payment. Table 3 contains the BU intermediate outcome measures.
38 We have a breadth of information at our disposal that we have yet to explore. We look forward to doing so in further expansions of this impact evaluation.

CONTRACT No. GS-10F-0033M / ORDER No. AID-OAA-M-13-00013
USAID.GOV DRG-LER TASKING N030 IMPACT EVALUATION OF USAID/MALAWI LGAP ACTIVITY – FINAL REPORT | 22
Table 3. Bottom-Up Intermediate Outcomes
Outcome Assessed Source
Trustworthiness of District Government Vendor Survey (Long Version)
Trustworthiness of Ward Councilor (Local Elected Representative)
Vendor Survey (Long Version)
Perception of How Well District Government Manages Funds Collected via Taxes
Vendor Survey (Long Version)
Perception of How Transparent District Government Is About Using Funds from Taxes
Vendor Survey (Long Version)
Perception of How Transparent District Government is with Respect to Collecting Funds
Vendor Survey (Long Version)
Satisfaction with Market Services/Development Vendor Survey (Long Version)
Perception of the Amount of Spending on Market Services Vendor Survey (Long Version)
Tax Morale Vendor Survey
Perception That Paying Tax is a Duty Vendor Survey (Long Version)
The TD interventions are designed to make it easier for the government—and its representatives, including tax collectors, market managers, and district councilors—to collect taxes. This means that vendors should not be able shirk fee payment, that corruption should decrease, and that government representatives should exert more effort to collect taxes. Table 4 contains the TD intermediate outcome measures.
Table 4. Top-Down Intermediate Outcomes
Outcome Assessed Source
Perception of Individual Ability to Evade Tax Vendor Survey (Long Version)
Perception of Group Ability to Evade Tax Vendor Survey (Long Version)
Motivation for Paying: Because of Potential Consequences Vendor Survey (Long Version)
Perception of Amount of Money from Fees Actually Reaching Government
Vendor Survey (Long Version)
Tax Collectors Accepting Bribes (List Experiment) Tax Collector Survey
Hours Tax Collectors Spend in Market Tax Collector Survey
Number of Vendors Tax Collector Visits Each Day Tax Collector Survey

CONTRACT No. GS-10F-0033M / ORDER No. AID-OAA-M-13-00013
USAID.GOV DRG-LER TASKING N030 IMPACT EVALUATION OF USAID/MALAWI LGAP ACTIVITY – FINAL REPORT | 23
METHODOLOGY
In addition to descriptive analysis and basic difference-in-means (DIM) tests between treatment groups, we employ regression analysis to assess the causal effects of the intervention.
Because our sample is not a panel (i.e., the individuals from baseline were not re-interviewed for endline), all individual-level regressions are performed only using the results of the endline survey. All individual-level regressions take the following form:
Yijkl = β0 + β1 * BUj + β2 * TDj + β3 * BOTHj + βk * ENUMk + βl * Blockl + ϵijkl Where Yijkl represents one of the outcomes in Tables 2, 3, or 4 for vendor i in market j in block l, interviewed by enumerator k, measured at endline. TDj, BUj, and BOTHj are indicators that are 1 if market j was in that treatment group and 0 if not. For ease of interpretation, we include separate dummies for the three different treatment groups. We include enumerator fixed effects (ENUMk) because enumerator skill and general behavior can impact respondents’ answers. We include block fixed effects (Blockl) because there might be unobservable differences between the blocks.39 Because treatment was assigned at the market level, we cluster standard errors at that level. This ensures that standard error estimates are not too small and therefore overly optimistic.
We perform two separate types of market-level regression analyses. First, we perform a simpler version of the individual-level analysis, with the endline outcomes averaged to the market level. These regressions take the following form:
Yjl = β0 + β1 * BUj + β2 * TDj + β3 * BOTHj + βl * Blockl + ϵjl
Yjl represents the average endline outcome for market j in block l. As above TDj, and BOTHj are indicators that are 1 if market j was in that treatment group and 0 otherwise we once again include block fixed effects to control for differences between the districts.
Second, we estimate a difference-in-differences (DID) model. The actual model is the same as the market-level endline model described above, but Yjl is now the difference in the average endline outcome between endline and baseline for market j.40 This is equivalent to the typical one-time period DID estimator and is more easily interpretable. In this model, β1, β2, and β3, represent changes in the changes from Baseline to Endline in the BU, TD, and BOTH groups compared to the control group.41
39 We do observe significant enumerator and block effects. We do not report these results here because they are incidental to the results of the experiment. 40 In other words, in these models, Yjl = Yjl(Endline) −Yjl(Baseline). 41 As robustness checks, we also ran individual-level DID models for all outcome variables for which we had endline and baseline data. Unlike in our market-level DID models, we cannot use the difference between baseline and endline as the unit of analysis because we do not have panel data. Instead, this approach treats the two samples as coming from the same population and uses all individual-level data to estimate treatment group means at endline and baseline. Because the individuals are different at endline and baseline, and only the overall populations are, by assumption, the same, the data are much noisier. As such, these models are extremely conservative tests. In addition, we ran models with the first specification above, but including the average baseline value of the outcome variable as a control (in effect, an individual-level DIM with baseline outcome as a control). We do not present the full results in this report but we mention them briefly below.

CONTRACT No. GS-10F-0033M / ORDER No. AID-OAA-M-13-00013
USAID.GOV DRG-LER TASKING N030 IMPACT EVALUATION OF USAID/MALAWI LGAP ACTIVITY – FINAL REPORT | 24
The coefficient estimates for all the treatment indicators represent intent-to-treat (ITT) estimates—this is because we know that roll-out was imperfect for some markets, and ITT estimates represent the most conservative estimates.

CONTRACT No. GS-10F-0033M / ORDER No. AID-OAA-M-13-00013
USAID.GOV DRG-LER TASKING N030 IMPACT EVALUATION OF USAID/MALAWI LGAP ACTIVITY – FINAL REPORT | 25
7. KEY FINDINGS
INTERVENTION EFFECTS ON VENDOR TAX COMPLIANCE
First, we assess the impact of the intervention on tax compliance among vendors using three different measures: self-reported tax compliance, perceived group-level tax compliance, and a verified measure of whether vendors can produce a recent tax receipt. Table 5 shows that we find mixed results for tax compliance, with the strongest results in the verified receipt measure.
Table 5. Hypothesis I Results Table: Individual-Level and Market-Level DID
Dependent variable:
Self-Reported Full Tax Compliance
Perception of Others’ Always Complying
Evidence of Receipt from Past 7 Days
Individual DIM Market DID Individual
DIM Market DID Individual DIM Market DID
BU 0.119
(0.079)
-0.076
(0.150)
0.194
(0.132)
-0.016
(0.217)
0.108***
(0.031)
0.112*
(0.044)
TD 0.158*
(0.075)
0.114
(0.150)
0.050
(0.1114)
-0.056
(0.217)
0.079**
(0.030)
0.037
(0.044)
BOTH 0.037
(0.094)
-0.023
(0.150)
0.064
(0.142)
-0.054
(0.217)
0.060
(0.031)
0.054
(0.044)
Observations 11,822 128 12,294 128 12,370 128
Adjusted R2 0.113 0.049 0.115 0.024 0.271 0.237
Notes: *p<0.05; **p<0.01; ***p<0.001
Individual-level models include enumerator and block fixed-effects. Individual-level models have SEs clustered on market. Market-level models include block fixed-effects. Self-Reported Full Tax Compliance is an integer from 0 to 5. Perception of Other’s Always Complying is an integer from 0 to 10. Evidence of Receipt from Past 7 Days is a 1-0 indicator.
First, we outright asked vendors how many times they had paid the full market fee in the last five times they had sold at the market. There is a significant increase in self-reported full tax compliance in the TD treatment group, although not in the BU treatment arm. Substantively, vendors in TD markets reported paying the full fee 0.173 more days out of five than the control group vendors; this translates into an additional 10.8 payments a year for a vendor working 6 days a week. However, the difference-in-difference (DID) estimate, which accounts for levels of compliance before the intervention began, shows that there was no significant change in this variable from baseline to endline, making the result most likely spurious.42 However, this measure suffers from social
42 Note that this model weights each market the same, The individual-level DID, which allows markets with more respondents to influence the estimate more strongly, shows a similar result, however. There was an average of 96.6 respondents per market, with a standard deviation of 13.5. Most markets had around 100 respondents. Four markets had significantly more and 14 had significantly less. Responses to the individual

CONTRACT No. GS-10F-0033M / ORDER No. AID-OAA-M-13-00013
USAID.GOV DRG-LER TASKING N030 IMPACT EVALUATION OF USAID/MALAWI LGAP ACTIVITY – FINAL REPORT | 26
desirability bias—respondents might have felt pressured to report high compliance rates—and ceiling effects—the full sample average was 3.94 days out of five, with 55.9 percent reporting that they had paid the full fee all five of the previous five days.
The perception of other people’s paying of the market fee was not different among the different treatment groups. This is easily explainable: perceptions of other’s tax compliance may have more to do with intrinsic beliefs and values, and so might have been hard to move by the intervention components. The DID supports a lack of difference between treatment groups. Descriptive analysis does show that perceived tax compliance decreased very slightly overall from baseline, going from a mean of 6.89 to a mean of 6.51. An individual-level DID analysis (not shown here) shows that the change from baseline to endline was not significant, however.
The strongest evidence for an increase in tax compliance via the intervention comes from the test using evidence of a receipt from the past seven days as the outcome variable. Compared to the control group vendors, BU vendors were 10.8 percent more likely to be able to show a receipt from within the past seven days, those in the TD group were 7.9 percent more likely to produce a receipt, and those in the BOTH group were six percent more likely to have a valid receipt, although this effect falls just short of statistical significance.43 In the DID model, the coefficient for the BU treatment arm is significant, with a similar effect size.44 We view this as the most compelling evidence for the intervention’s positive impact on tax compliance, as this was a behavioral measure that required vendors to show enumerators the physical receipt itself. It is important to note that this measure of tax compliance is most likely a conservative one in and of itself, as it requires individuals to retain receipts. Out of the three survey-based measures evaluated here, it estimates overall tax compliance to be at the lowest level (32.5 percent); the self-reported measure estimates it to be 78.9 percent, and the group-perceived estimate is 65.1 percent.
Figures 1, 2, and 3 show the market-level results for the three main outcome variables. In these figures, there are four columns of data: one for each group in the study. Each circle represents one market in the study, and the circle diameter is proportional to the number of respondents from that market. The circles are vertically placed to indicate the market-level average outcome value at baseline (red) or endline (blue). The solid dots indicate the treatment group mean, weighted according to the number of respondents per market, and lines surrounding the dot indicate the 95 percent confidence interval on this mean, calculated using cluster-adjusted standard errors. As can be seen, the figures support the above analysis. Figure 1 shows that self-reported tax compliance does rise overall from baseline to endline in all markets, but the difference is small, and does not differ across treatment groups.
outcome questions varied more due to item nonresponse. The highest item nonresponse was observed for the self-reported tax compliance question. 43 The p-value is 0.0500638. 44 The DID estimates rely on market-level averages and are inherently more conservative. The individual-level DID models show almost identical results.
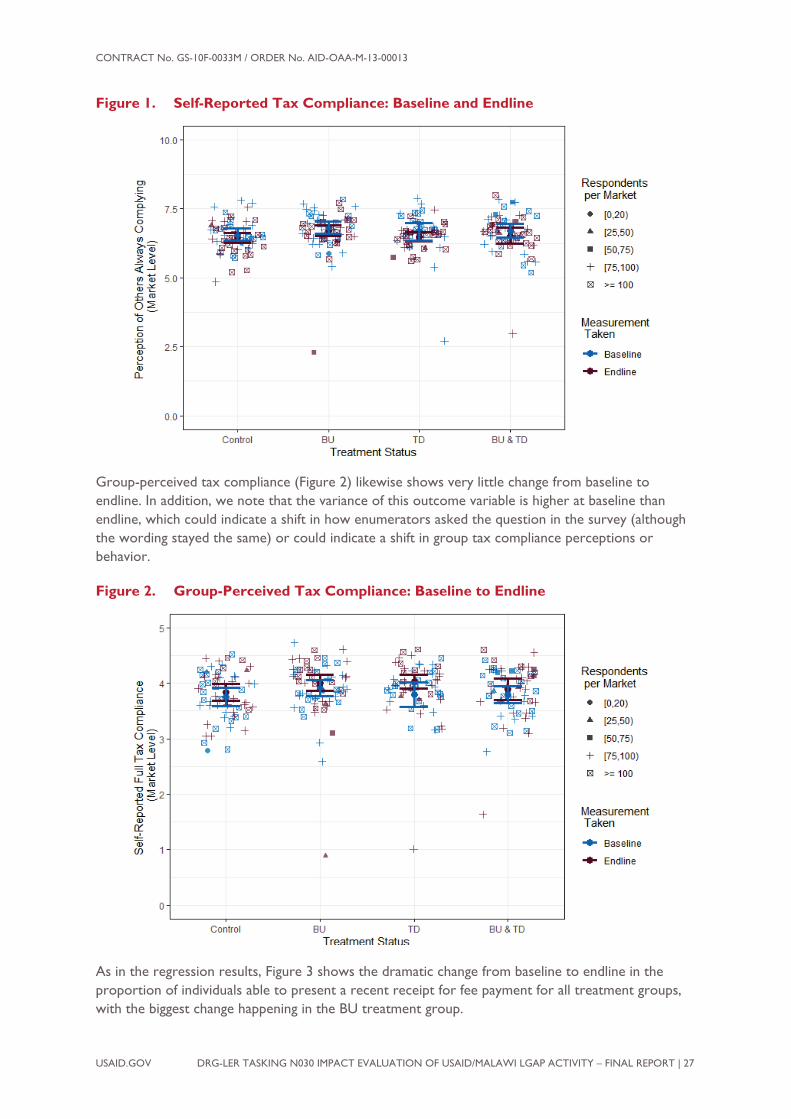
CONTRACT No. GS-10F-0033M / ORDER No. AID-OAA-M-13-00013
USAID.GOV DRG-LER TASKING N030 IMPACT EVALUATION OF USAID/MALAWI LGAP ACTIVITY – FINAL REPORT | 27
Figure 1. Self-Reported Tax Compliance: Baseline and Endline
Group-perceived tax compliance (Figure 2) likewise shows very little change from baseline to endline. In addition, we note that the variance of this outcome variable is higher at baseline than endline, which could indicate a shift in how enumerators asked the question in the survey (although the wording stayed the same) or could indicate a shift in group tax compliance perceptions or behavior.
Figure 2. Group-Perceived Tax Compliance: Baseline to Endline
As in the regression results, Figure 3 shows the dramatic change from baseline to endline in the proportion of individuals able to present a recent receipt for fee payment for all treatment groups, with the biggest change happening in the BU treatment group.

CONTRACT No. GS-10F-0033M / ORDER No. AID-OAA-M-13-00013
USAID.GOV DRG-LER TASKING N030 IMPACT EVALUATION OF USAID/MALAWI LGAP ACTIVITY – FINAL REPORT | 28
Figure 3. Evidence of Recent Receipt: Baseline and Endline
Altogether, the individual-level analysis suggests an increase in vendor tax compliance in the BU and TD groups, particularly in the receipt measure, although the evidence is strongest in the BU treatment group. Interestingly, for all tax compliance outcome measures, markets that were exposed to both treatment markets saw lower increases to tax compliance than those markets that were exposed only to one treatment arm. We can see several potential reasons for this. First, given the low level of state capacity in Malawi, it is possible carrying out both treatments was too demanding, resulting in the treatment backfiring due to ineffective execution. It is also possible that one treatment crowded out the other. For example, it is possible that while the BU treatments caused tax morale to increase, adding in the TD treatments, which can lead to higher pressure on vendors, dampened these effects by undermining vendors’ sense that they were paying for their own development. Finally, it is possible that the delay in the construction component, in conjunction with the increased TD pressure, meant that vendors faced increased enforcement after they had been promised new public goods, but before those public goods were actually delivered.
Next, we assess whether the intervention also led to higher revenues actually reaching district governments in treatment markets. To account for differing fee rates across markets (typically 100 or 200 Malawian kwacha), we divide the revenue collected by the daily fee amount; this generates a measure of how many ‘fee payments per market’ reach each district government. Before presenting the results of this analysis, we hasten to note that there are baseline differences across groups on the revenue figures, and that this artificially inflates the estimated treatment effects in the DIM models. These differences can be seen in Figure 4, which plots the market fee units throughout the intervention period. Because the first intervention activities began in markets in October 2017 and market-level revenues were not tracked until November 2017, the November 2017 measures cannot be considered truly pre-treatment. In addition, we did not receive most of the revenue data until six months after the revenue had been collected, making it very likely that there is some measurement error. We are also missing November 2017 or November 2018 data for 20 markets, which raises concerns about bias and imprecision of our baseline estimates. With these caveats in mind, we proceed in presenting the effects on revenue as they are estimated.
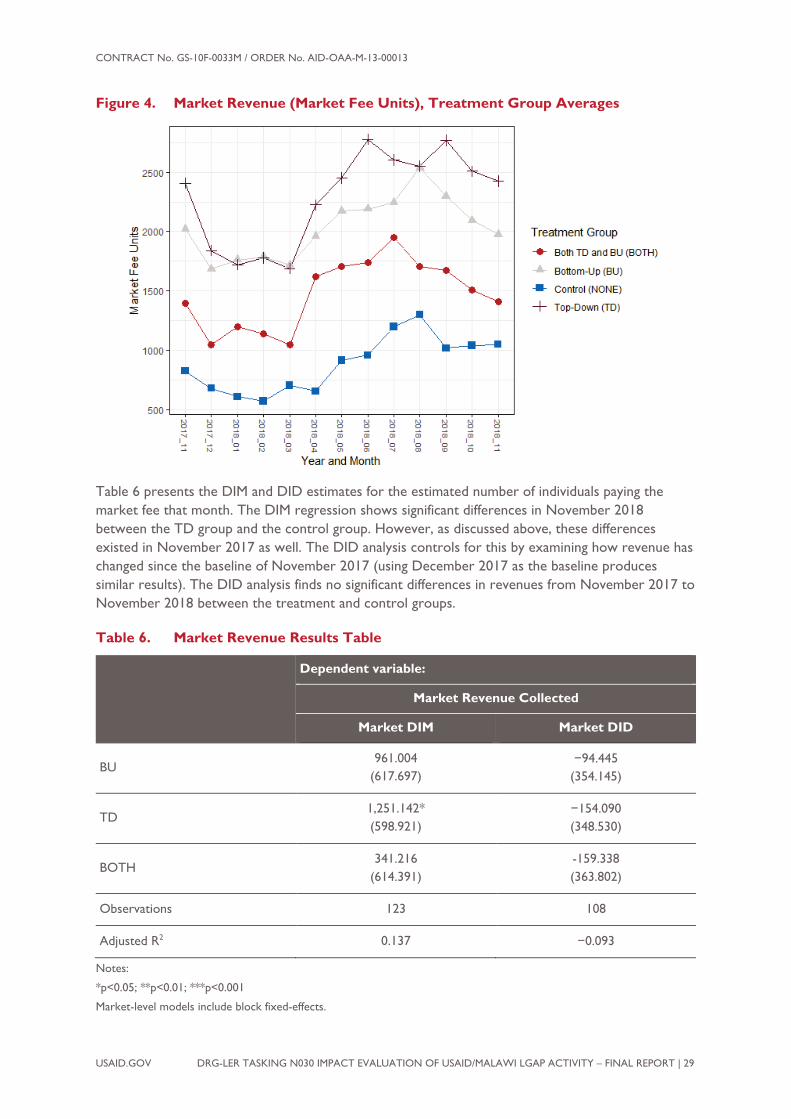
CONTRACT No. GS-10F-0033M / ORDER No. AID-OAA-M-13-00013
USAID.GOV DRG-LER TASKING N030 IMPACT EVALUATION OF USAID/MALAWI LGAP ACTIVITY – FINAL REPORT | 29
Figure 4. Market Revenue (Market Fee Units), Treatment Group Averages
Table 6 presents the DIM and DID estimates for the estimated number of individuals paying the market fee that month. The DIM regression shows significant differences in November 2018 between the TD group and the control group. However, as discussed above, these differences existed in November 2017 as well. The DID analysis controls for this by examining how revenue has changed since the baseline of November 2017 (using December 2017 as the baseline produces similar results). The DID analysis finds no significant differences in revenues from November 2017 to November 2018 between the treatment and control groups.
Table 6. Market Revenue Results Table
Dependent variable:
Market Revenue Collected
Market DIM Market DID
BU 961.004
(617.697) −94.445
(354.145)
TD 1,251.142* (598.921)
−154.090 (348.530)
BOTH 341.216
(614.391) -159.338 (363.802)
Observations 123 108
Adjusted R2 0.137 −0.093
Notes:
*p<0.05; **p<0.01; ***p<0.001
Market-level models include block fixed-effects.

CONTRACT No. GS-10F-0033M / ORDER No. AID-OAA-M-13-00013
USAID.GOV DRG-LER TASKING N030 IMPACT EVALUATION OF USAID/MALAWI LGAP ACTIVITY – FINAL REPORT | 30
Together, these results suggest two possible interpretations. First, it is possible that the treatments really did increase government revenues, and that the baseline numbers are not accurate, or simply indicate revenue levels after parts of the BU and TD intervention bundles had already started. Second, it is possible that the treatment did not affect market revenues at all, and the DIM results reflect pre-existing differences in revenue. Looking at the evolution of market revenue over the full course of the intervention cannot help us determine which of these possibilities is correct. Figure 4 shows that there is a substantial drop off after treatment ends in TD markets, which could suggest that the interventions were successful. However, there is a similar (albeit slightly smaller) drop-off between November 2017 and December 2017, which could indicate that the drop is instead a result of the rainy season.
While it is unsatisfying to be unable to determine the interventions’ effect on revenue transfers to the district governments, one implication of this discussion regarding revenue is perhaps more encouraging. In the process of implementing these interventions and tracking revenue data, it appears that LGAP significantly improved the record-keeping and data analysis capacities of the district governments. Over the course of the intervention period, revenue data became more precise and accessible. Future interventions of this kind may benefit from building these capacities prior to implementing the interventions, so that outcomes can be tracked more effectively.
INTERVENTION EFFECTS ON BOTTOM-UP INTERMEDIATE OUTCOMES
Our theory of change proposed a number of mechanisms that could drive any changes in tax compliance. This section examines these mechanisms to better understand the effects discussed above. In this section, we focus on the outcomes that the BU treatment could have affected, including attitudes toward the government and satisfaction with market services.
Overall, the BU intermediate outcomes paint a complex picture, with several key variables seeing significant differences between control and treatment groups, while others do not. Table 7 shows that, at endline, trust in the district government and in the ward councilor was significantly higher in markets exposed to the BU treatment.45 In addition, Table 8 shows that vendors in the BU treatment markets were more likely to view paying taxes as a duty, one of our operationalizations of tax morale.
Finally, Table 8 also shows that vendors exposed to the BU treatment were more satisfied with market services in general than those in the control group; they were also more satisfied with their
45 The individual-level DID models show similar effects. The treatment group coefficients are not statistically significant in the individual-level DID, most likely because of the additional noise and the possibility that the assumption of the same baseline and endline populations is incorrect. The treatment group effects in the version of the model with the baseline market-level outcome variable as a control are statistically significant, strengthening our confidence in these results.

CONTRACT No. GS-10F-0033M / ORDER No. AID-OAA-M-13-00013
USAID.GOV DRG-LER TASKING N030 IMPACT EVALUATION OF USAID/MALAWI LGAP ACTIVITY – FINAL REPORT | 31
access to clean water.46,47 We interpret these results as supporting the intended causal mechanism for the BU treatment: in interacting more with district government officials and experiencing more responsiveness and transparency surrounding revenue collection and service provision, vendors feel more trusting, satisfied, and duty-bound vis-a-vis their government. We note that those vendors who did not experience the BU treatment did not display similar spikes in trust, satisfaction, or tax morale. Although vendors in the different treatment groups did not view district government as doing a better job at managing funds and being more transparent, it is possible that these questions were either too technical for vendors, or that other factors, such as support for the party in power, are better predictors for answers to these questions.
46 We also ran models for satisfaction with garbage collection, the condition of the paths, condition of market stalls, and market security. None of these models show significant results, which we explain as follows. First, with respect to security, the intervention was not structured to address this issue. Second, most of the construction projects that were part of the BU treatment did not begin until the endline survey was in the field. A significant portion of markets (43 of 64) elected to receive a new borehole (although due to issues with finding water, only 29 were successfully drilled). The borehole projects were the fastest projects and thus were the first to be completed, many during enumeration. This might explain the significant results for satisfaction with clean water access but not with other services. 47 Both the individual-level DID model and the individual-level endline model that includes the average baseline outcome show a similar result for these three outcomes, with the BU treatment group coefficient consistently in the same direction. The coefficient was not statistically significant for the individual-level DID model for Paying Tax as a duty, but as above, we note that there is much more noise in this model. In all, these robustness checks increase our confidence in these findings.

CONTRACT No. GS-10F-0033M / ORDER No. AID-OAA-M-13-00013
USAID.GOV DRG-LER TASKING N030 IMPACT EVALUATION OF USAID/MALAWI LGAP ACTIVITY – FINAL REPORT | 32
Table 7. Bottom-Up Intermediate Outcomes: Government
Dependent variable:
Trust Local Gov.
Trust in Ward Councilor
DC Manages Funds Well
DC Transparent Using Funds
DC Transparent Collecting
Funds
OLS OLS OLS OLS OLS
BUs 0.176**
(0.063)
0.168*
(0.070)
−0.087
(0.058)
−0.076
(0.067)
−0.058
(0.063)
TD 0.001
(0.068)
−0.117
(0.062)
−0.008
(0.058)
−0.025
(0.069)
−0.026
(0.054)
BOTH 0.142*
(0.059)
0.103
(0.066)
-0.061
(0.056)
-0.039
(0.056)
-0.071
(0.050)
Observations 2,509 2,447 2,521 2,518 2,510
Adjusted R2 0.182 0.112 0.332 0.373 0.381
Notes: *p<0.05; **p<0.01; ***p<0.001
Individual-level models include enumerator and block fixed-effects. Individual-level models have SEs clustered on market. All outcomes are on a 4-point scale. DC Transparency Using Funds and DC Transparency with Respect to Collecting Funds were not included at baseline.

CONTRACT No. GS-10F-0033M / ORDER No. AID-OAA-M-13-00013
USAID.GOV DRG-LER TASKING N030 IMPACT EVALUATION OF USAID/MALAWI LGAP ACTIVITY – FINAL REPORT | 33
Table 8. Bottom-Up Intermediate Outcomes: Services and Tax Morale
Dependent variable:
Services Satisfaction
Satisfaction with Clean Water
Access
Perception of Spending on
Services
Paying Tax as Duty
Pay Tax Even if Disagree with Government
OLS OLS OLS OLS OLS
BU 0.293**
(0.095)
0.654***
(0.160)
27.576
(15.538)
0.072*
(0.035)
0.002
(0.012)
TD 0.104
(0.087)
0.161
(0.129)
7.046
(15.020)
0.041
(0.030)
0.007
(0.011)
BOTH 0.173
(0.092)
0.315*
(0.148)
−0.515
(14.205)
0.044
(0.033)
0.022
(0.013)
Observations 12,365 2,517 2,411 2,531 12,355
Adjusted R2 0.161 0.140 0.290 0.111 0.082
Notes: *p<0.05; **p<0.01; ***p<0.001
Individual-level models include enumerator and block fixed-effects. Individual-level models have SEs clustered on market. Outcomes 1, 2, and 4 are on a 4-point scale. Outcome 3 is a number out of 100. Outcome 5 is dichotomous.
INTERVENTION EFFECTS ON TOP-DOWN INTERMEDIATE OUTCOMES
The TD interventions were designed to help market staff, and the district government, collect and manage taxes. In general, however, we find weaker evidence for the effectiveness of the TD intervention, at least among vendors. Table 9 shows that the intervention had no impact on vendor’s beliefs about their ability to refuse to pay the fee, either alone or together. This could be due to floor effects: the large majority of vendors disagreed with the assertion that noncompliance was possible. Norms for paying fees in Malawian markets might also force these effects towards zero. In addition, there was no change in the vendors’ perception of how much of the money collected actually reaches the district government, which was one of our indicators of corruption. Vendors in TD treatment markets were more likely to report that they paid taxes because they would face consequences if they did not. This does hint at an increase in government pressure in TD markets, although we note that the effect size is substantively small (a relatively small fraction of a multi-point Likert scale). In addition, vendors in BOTH treatment markets reported that they thought more money flowed to the government than in control markets, a possible sign that vendors perceive corruption as being less pervasive. Once again, however, the effect size is substantively small.48
48 The individual-level DID and individual DIM with baseline as control results for the ‘Pay Because Consequences’ variable are inconclusive, making us less confident in this result. The ‘Money Flowing to Government’ measure was not included at baseline.

CONTRACT No. GS-10F-0033M / ORDER No. AID-OAA-M-13-00013
USAID.GOV DRG-LER TASKING N030 IMPACT EVALUATION OF USAID/MALAWI LGAP ACTIVITY – FINAL REPORT | 34
Table 9. Top-Down Intermediate Outcomes: Vendors
Dependent variable:
Could Refuse to Pay Group
Noncompliance Possible
Pay Because Consequences
Money Flowing to Government49
BU −0.052
(0.057)
0.016
(0.059)
0.036
(0.027)
18.371
(13.759)
TD −0.055
(0.052)
0.059
(0.057)
0.056*
(0.025)
−2.808
(12.106)
BOTH -0.046
(0.058)
−0.058
(0.060)
0.041
(0.028)
26.126*
(21.333)
Observations 2,514 2,524 2,518 2,463
Adjusted R2 0.123 0.144 0.308 0.257
Notes: *p<0.05; **p<0.01; ***p<0.001
Individual-level models include enumerator and block fixed-effects. Individual-level models have SEs clustered on market. Models 1, 2, and 3 are on a 4-point scale. Model 4 is a real number out of 1000.
Results from the tax collector survey, shown in Table 10, are somewhat more informative. Tax collectors did not report visiting more vendors in treatment markets than in control markets. Although we had taken this as an indicator for tax collector effort, it is possible that tax collectors already simply visit as many vendors as possible. The survey shows that tax collectors do report spending more time in the market in TD markets than in control markets.50 This could be because tax collectors in TD markets felt more pressure from market management due to incentives and more scrutiny from the district government. Given that they do not report visiting more vendors, this is a sign that tax collectors in TD markets seemingly spend more time with the vendors they do visit. This may have implications for tax collector and vendor rapport, which have not been explored yet. It also seems to indicate that tax collectors may be spending more time trying to collect the full fee from vendors.
49 Not included in baseline survey, so balance at baseline is unknown. 50 The two robustness check models show somewhat inclusive results. The individual-level DIM with lagged outcome model does show a significant difference between the TD group and the control group, but the individual-level DID does not, although the effect is similarly sized and in the same direction. It could be that the noisiness of the individual-level DID is masking results.

CONTRACT No. GS-10F-0033M / ORDER No. AID-OAA-M-13-00013
USAID.GOV DRG-LER TASKING N030 IMPACT EVALUATION OF USAID/MALAWI LGAP ACTIVITY – FINAL REPORT | 35
Table 10. Top-Down Intermediate Outcomes: Tax Collectors
Dependent variable:
Hours Working in Market A Day Vendors Visited Per Day
BU 0.304
(0.581)
59.100
(64.785)
TD 1.154*
(0.494)
85.199
(59.896)
BOTH 0.609
(0.562)
162.246
(116.823)
Observations 264 261
Adjusted R2 0.367 0.256
Notes: *p<0.05; **p<0.01; ***p<0.01
Individual-level models include enumerator and block fixed-effects. Individual-level models have SEs clustered on market.
Finally, we included a list experiment to attempt to determine the level of tax collector corruption. In the list experiment, tax collectors were read a series of things that could happen during their day, and were asked how many items had happened to them in the past week, without specifying which ones. Half the collectors heard a list of four innocuous activities, like purchasing airtime or meeting someone from another country. Half of the collectors heard a list of five activities—the four innocuous ones, and a fifth item that asked about bribe-taking. We can then compare, for each intervention group, the difference in number of items that happened to tax collectors in the ‘control’ and ‘treatment’ versions of the list. This provides a treatment-group-level estimate of bribe-taking.51 If we group all intervention groups together, approximately 14 percent of tax collectors report accepting money from a vendor seeking to avoid paying the market fee, although lack of power makes it impossible to be confident in this estimate.52 If we look at the differences by treatment group, we find estimates that are substantively different; however, we are again underpowered to test whether these differences are statistically significant. We find corruption estimates of about zero percent in the TD group; four percent in the BOTH group; 18 percent in BU markets; and 36 percent in control markets.53
51 This estimate is obtained by subtracting the treatment group mean from the control group mean. 52 The results were similar at baseline, where it was ten percent. The difference was not significant then either, however. 53 For the TD markets, the difference is negative. This may indicate that tax collectors were extra wary of reporting that they had taken a bribe from a vendor, causing them to be slightly less likely to pick other items as well. It is also possible that this is just sampling error—after all, the difference is not statistically significant.

CONTRACT No. GS-10F-0033M / ORDER No. AID-OAA-M-13-00013
USAID.GOV DRG-LER TASKING N030 IMPACT EVALUATION OF USAID/MALAWI LGAP ACTIVITY – FINAL REPORT | 36
8. INTERPRETING EFFECTS AND RECOMMENDATIONS
The results presented in the previous section suggest mixed effects of the interventions. The BU intervention group shows higher trust in local government, higher satisfaction with services, and higher tax morale. We also find that vendors are more likely to be able to present a recent tax receipt, suggesting higher tax compliance in BU markets. However, we do not find increases in self-reported tax compliance, or in the revenues that actually reach district governments. In the TD intervention group, we see higher work effort by market tax collectors, and some evidence that vendors feel that they will face consequences for evading the fee. We also find that district governments receive higher revenues from TD markets at endline, though we cannot eliminate the possibility that there were pre-existing differences in revenue collection across treatment groups at baseline. In contrast, we find little evidence of treatment effects in BOTH markets that received both the BU and the TD intervention bundles.
As USAID and other development practitioners consider scaling the impact evaluation interventions, these results allow us to address several key policy questions. First, which of these intervention bundles offer the best value-for-money? Second, which components in each intervention bundle (BU vs. TD) are driving the effects? Finally, what explains the diminished (and sometimes null) effects in the BOTH treatment group which received the BU and TD bundles? We consider each of these policy questions in the subsections below.
INTERVENTION VALUE-FOR-MONEY
As the impact evaluation team, we are able to speak to the impact of the interventions, which relates to the ‘value’ in the value-for-money consideration. Regarding the interventions’ value, we offer two primary conclusions. First, each intervention bundle is more valuable individually than they are in combination. We discuss potential explanations for this result in a separate subsection below. Even without fully unpacking this puzzling pattern, however, our preliminary recommendation would be to scale either the TD bundle or the BU bundle, but not both in combination.
Second, the treatment effects on tax compliance in the BU group appear to be more robust than in the TD group. Further, the BU intervention bundle seems to consistently affect intermediate outcomes such as citizen trust, tax morale, and satisfaction with government services, while the effects of the TD intervention bundle on intermediate outcomes are more limited. It is certainly possible that this difference is driven by our focus on particular intermediate outcomes—that an evaluation on the full universe of outcomes would reveal intermediate effects of the TD outcome that we were not able to capture. It is also possible that some outcomes might be more ‘valuable’ to achieve than others. For example, perhaps USAID would value increasing the work hours of government employees more than improving citizen trust in government. We leave it to USAID and other development practitioners to decide whether the effects captured in our impact evaluation are worth considering in decisions about intervention scaling. With these caveats noted, however, the evidence we have gathered indicates that the BU intervention may be more consistently valuable for a range of outcomes than is the TD intervention.
Finally, we do not have contextual knowledge surrounding the monetary, personnel, or political costs associated with these interventions. Our only cost-related insight is that that the sensitization and monitoring associated with running a robust impact evaluation was costly. The LGAP team and government counterparts incurred extensive personnel, transportation, and administrative costs associated with the impact evaluation activities. We would anticipate these costs would be significantly reduced if the interventions were scaled in the absence of an impact evaluation.

CONTRACT No. GS-10F-0033M / ORDER No. AID-OAA-M-13-00013
USAID.GOV DRG-LER TASKING N030 IMPACT EVALUATION OF USAID/MALAWI LGAP ACTIVITY – FINAL REPORT | 37
DISAGGREGATING INTERVENTION COMPONENTS
When considering whether or not to scale these intervention bundles, it is important to understand which of the components in each bundle is driving effects. In other words, would it be possible to achieve the effects we observe by only scaling a subset of the components? Obtaining a definitive answer to this question would require an impact evaluation with a full factorial design in which each component was randomized independently, and each market could receive any combination of the components. In the absence of this kind of evidence, we hesitate to speak to the contributions of each component. We are confident only about the effects of the components when bundled.
Nonetheless, we can draw on our endline data to provide suggestive evidence regarding the relative impact of various components within each bundle. In Tables 11 and 12 we present means by treatment group for a series of questions asked at endline about which intervention components the respondents recall.54 These questions allow us to examine which components appear to be particularly memorable—and therefore possibly particularly effective (or ineffective) —for those involved in the study. While remembering a component is not the same as altering attitudes or behavior in response to a component, we assert that memorability is a compelling outcome as well.
Within the BU intervention bundle, there were four components: market committee elections and trainings; market kickoff meetings; the SMS transparency campaign; and market infrastructure projects. Table 11 indicates that nearly all vendors—regardless of treatment group—believe the market committee to be elected. However, as expected, vendors in the BU and BOTH groups appear more likely to report that the market committee was trained in the past year. Vendors in the BU and BOTH groups are also more likely to report a meeting between vendors and local government, although we note that fewer than one-third of vendors report such a meeting in any of the treatment groups, and that 14.8 percent of vendors in TD markets report such meetings. Interestingly, tax collectors appear to be more aware of these meetings; as shown in Table 12, in BU and BOTH markets, tax collectors are highly likely to report a meeting between the local government and vendors took place in the last year.
Among vendors who report the occurrence of such a meeting and that they attended it, we see those in the BU and BOTH treatment groups are likely to report vendors selected an infrastructure project at the meeting. Tables 13 and 14 respectively show that vendors in the BU and BOTH treatment groups are more likely to attribute responsibility for market construction to district government, and responsibility for funding market construction to USAID.
Back to Table 11, vendors in the BU and BOTH treatment groups are more likely to report being aware of a way to find out how much revenue is collected from the market and receiving a SMS from the district about revenue in the past six months, though we note that both of these are reported at relatively low rates. Collectively, these patterns indicate that the market infrastructure projects are likely contributing to treatment effects in the BU group. The market kickoff meetings and the SMS transparency campaign could also be contributing to treatment effects, but this contribution is likely driven by a large effect on a minority of vendors rather than by a moderate effect on all vendors.
Within the TD intervention bundle, there were also four components: vendor counting; revenue targets for tax collectors; tax collector incentives for meeting targets; mobile money revenue
54 To avoid over-interpretation of these patterns, we refrain from conducting difference-in-means tests across treatment groups, and instead just make qualitative statements about easily observed patterns.

CONTRACT No. GS-10F-0033M / ORDER No. AID-OAA-M-13-00013
USAID.GOV DRG-LER TASKING N030 IMPACT EVALUATION OF USAID/MALAWI LGAP ACTIVITY – FINAL REPORT | 38
transfers. In general, as shown in Table 12, data from the tax collectors survey indicates that the tax collectors recall most of the components of the TD intervention bundle. Tax collectors in the TD or BOTH markets are more likely to report vendor counting. However, they are not more likely to report being incentivized to meet targets for revenue collection: in fact, almost no tax collectors report being paid with incentives. Tax collectors in TD and BOTH markets are more likely to report their managers transfer revenue to the district via mobile money, and they report more frequent transfers. Table 15 indicates that the modal frequency of transfers in the Control and BU markets is once a month, while in TD and BOTH markets it is every 3-4 days. Collectively, these patterns indicate that the vendor counting and mobile money components of the TD intervention were most salient for the tax collectors.
Table 11. Vendor Survey Treatment Component Question Averages, by Treatment Group
Question (Response Range) Control BU TD Both
Is there an active market committee in the market? (1/0) 0.863 0.897 0.855 0.936
Is the market committee elected? (1/0) 0.959 0.968 0.974 0.98
Has market committee received any training this past year? (1/0) 0.075 0.174 0.080 0.243
In the past year, have there been any meetings between local government and vendors in this market? (1/0)
0.090 0.205 0.148 0.233
At the meeting, did vendors select an infrastructure project for the government to build in the market? (1/0)
0.476 0.883 0.526 0.867
Is there a way vendors can find out how much the district is collecting from this market, or how the money is spent? (1/0)
0.013 0.053 0.019 0.083
In the past six months, did you ever receive an SMS message about market revenue? (1/0)
0.005 0.056 0.020 0.074

CONTRACT No. GS-10F-0033M / ORDER No. AID-OAA-M-13-00013
USAID.GOV DRG-LER TASKING N030 IMPACT EVALUATION OF USAID/MALAWI LGAP ACTIVITY – FINAL REPORT | 39
Table 12. Tax Collector Survey55 Treatment Component Question Averages, by Treatment Group
Question (Response Range) Control BU TD Both
In the past year, have there been any meetings between local government and vendors in this market? (1/0)
0.270 0.692 0.265 0.655
Were you paid for any of your work over the past year with incentives? 0.016 0.000 0.000 0.000
Does your supervisor transfer market fee revenues to the district via mobile money? (1/0)
0.063 0.078 0.700 0.725
How often does your supervisor transfer market fee revenues to the district government? (1-9)56
2.734 3.106 5.431 5.661
In the past year, has anyone come and counted all vendors in the market? (1/0)
0.293 0.562 0.959 0.966
Table 13. Breakdown of Responses to "Who is primarily responsible for construction or improvements [in this market]?" by Treatment Group57
Response Category Control BU TD Both
Market Manager 14.5% 13.2% 19.4% 6.3%
Ward Councilor 26.6% 19.8% 29.6% 19.5%
Other District Government 30.6% 41.9% 32.4% 42.1%
Member of Parliament 10.5% 5.4% 7.4% 6.3%
USAID/DAI/LGAP 4% 10.8% 0.9% 18.9%
Market Vendors/Market Committee 12.9% 9% 10.2% 6.3%
Traditional Leaders/Chiefs 0.8% 0% 0% 0.6%
55 There were 64 respondents from the Control group, 67 respondents from the BU group, 74 from the TD group, and 59 from the BOTH group. 56 Once a year = 1, Once every few months = 2, Once a month = 3, A few times a month (2-3 times per month) = 4, Once a week = 5, Every 5-6 days = 6, Every 3-4 days = 7, Every other day = 8, Every day = 9. 57 Only individuals who answered yes to the question asking whether there had been any construction in the market during the past year were asked this question.

CONTRACT No. GS-10F-0033M / ORDER No. AID-OAA-M-13-00013
USAID.GOV DRG-LER TASKING N030 IMPACT EVALUATION OF USAID/MALAWI LGAP ACTIVITY – FINAL REPORT | 40
Table 14. Breakdown of Responses to "Who primarily funded this construction [in this market]?" by Treatment Group58
Response Category Control BU TD Both
Market Manager 4.8% 6.2% 7.3% 2%
Ward Councilor 14.3% 8.9% 11.5% 10.8%
Other District Government 42.9% 47.9% 45.8% 45.9%
Member of Parliament 6.7% 5.5% 6.2% 4.1%
USAID/DAI/LGAP 10.5% 23.3% 4.2% 28.4%
Market Vendors/Market Committee 20% 8.2% 25% 8.8%
Traditional Leaders/Chiefs 1% 0% 0% 0%
Table 15. Breakdown of Responses to " How often does your supervisor transfer money collected from market fees to the district?” by Treatment Group
Response Category Control BU TD Both
Once a year 3.1% 0% 0% 0%
Once every few months 42.2% 39.4% 4.2% 0%
Once a month 46.9% 42.4% 25% 23.7%
A few times a month (2-3 times per month) 1.6% 0% 0% 0%
Once a week 1.6% 9.1% 12.5% 15.3%
Every 5-6 days 1.6% 4.5% 11.1% 8.5%
Every 3-4 days 3.1% 4.5% 47.2% 52.5%
Every other day 0% 0% 0% 0%
Every day 0% 0% 0% 0%
UNDERSTANDING DIFFERENTIATED EFFECTS FOR THE BOTH TREATMENT GROUP
In the results presented above, effects in the markets that received both the BU and the TD interventions (the BOTH group) are often either substantively smaller or statistically insignificant compared to the groups that received only one bundle of interventions (BU or TD). This pattern runs contrary to our expectation, which was that the two bundles would complement each other and, in combination, would have the greatest effect.
58 Only individuals who answered yes to the question asking whether there had been any construction in the market during the past year were asked this question.

CONTRACT No. GS-10F-0033M / ORDER No. AID-OAA-M-13-00013
USAID.GOV DRG-LER TASKING N030 IMPACT EVALUATION OF USAID/MALAWI LGAP ACTIVITY – FINAL REPORT | 41
We posit four explanations for this pattern in the BOTH markets:
(1) Crowding Out Explanation: In the BOTH markets, it is possible vendors were more inclined to pay taxes voluntarily due to the BU components, but this effect on voluntary tax compliance was counteracted (‘crowded out’) by the focus on consequences and monitoring in the TD bundle. This explanation is supported in academic literatures from diverse fields.59
(2) Vendor Capacity Explanation: In the BOTH markets, it is possible that having eight intervention components roll out in one year was overwhelming for vendors, and their response was to ignore some of the components.
(3) State Capacity Explanation: Planning, staffing, and managing all of the BU and TD components in the BOTH markets was resource-intensive, and it is possible district government delivered weaker versions of the treatments as a result.
(4) Intervention Timing Explanation: The timing of the intervention rollout was such that some of the BU components (elections, kickoff meetings, SMS transparency campaign) rolled out before the TD interventions rolled out, and that many of the market infrastructure projects had not been completed prior to endline data collection. This means that, in the BOTH markets, vendors learned about their rights and responsibilities surrounding government revenue collection, then government focus on revenue collection was ramped up, but without the corresponding service improvements vendors were promised. This experience may have been particularly demoralizing for the vendors in the BOTH markets, especially in light of the Crowding Out Explanation (explanation (1)).
Without additional research, it is not possible to definitively determine which of these explanations is correct. Further, it is highly likely that all of these explanations are at play to some extent. In lieu of adjudicating between these explanations, we present excerpts from the qualitative data about the real-time experiences and perceptions of vendors and tax collectors collected during the monitoring period (discussed in Section 5). We emphasize that we have only processed and analyzed a fraction of these data: the 125 focus group discussions yielded over 375 pages of single-spaced text, and the more than 500 interviews yielded thousands of pages of text. We provide indicative quotes from the vendor focus group discussions in the BOTH markets to support the plausible explanations presented above:
“l have been expecting to see [the development] the people have been talking [about] but there is nothing, so when paying the fees l become angry since it’s like wasting my money on something that l don’t understand.”
“Most [of the] relationship between the local government and the [market] committee is about the fee collection, not the good of the market. Like when the local government come here they talk about the fees collection only, not the welfare of the vendors.”
“It hurts when we heard that this market makes a lot of money but [the local government] can’t support it when there is a need.”
59 Agrawal, Arun, Ashwini Chhatre, and Elisabeth Gerber. 2015. “Motivational Crowding in Sustainable Development Interventions.” American Political Science Review 109(3):470-487; Frey, Bruno S. and Reto Jegen. 2001. “Motivation Crowding Theory.” Journal of Economic Surveys 15(5):589-611; Ostrom, Elinor. 2000. “Crowding Out Citizenship.” Scandinavian Political Studies 23(1):3-16.

CONTRACT No. GS-10F-0033M / ORDER No. AID-OAA-M-13-00013
USAID.GOV DRG-LER TASKING N030 IMPACT EVALUATION OF USAID/MALAWI LGAP ACTIVITY – FINAL REPORT | 42
“We have been paying in the market daily and there is a lot of money collected here but the district is failing to fix problems in this market.”
“There are no infrastructures here, there are no good toilets here, but yet we have been paying and we have been told that this money will be used here.”

CONTRACT No. GS-10F-0033M / ORDER No. AID-OAA-M-13-00013
USAID.GOV DRG-LER TASKING N030 IMPACT EVALUATION OF USAID/MALAWI LGAP ACTIVITY – FINAL REPORT | 43
9. CONCLUSIONS
This report evaluates an ambitious set of interventions designed to increase tax revenues and tax compliance in markets in Malawi. Implementation challenges were significant, with delays and changes to the interventions likely resulting in the final interventions being weaker than originally designed. Yet, even given this challenging environment, we find some promising results. In particular, the intervention significantly increased vendors’ ability to provide a receipt indicating tax payment. This bodes well for the relationship between vendors and the government and paves the way for more accountability. Our results indicate that the BU and TD intervention bundles can each affect revenue collection. At the same time, the two treatment bundles in combination resulted in null effects.
The wealth of data in this impact evaluation could be used to further explore these results. Specifically, further analysis could help better understand how variation in intervention strength may condition the strength of effects and whether the intervention affected some types of markets, or vendors, more than others. In addition, more work could be done to further investigate which of the bundled components affected the various outcomes and why the two bundles in combination appear to have weaker effects. In the previous section, we presented some preliminary findings surrounding these questions, but given the wealth of both quantitative and qualitative data available, much more is possible.
Now that we have evidence that these treatments can work, future experiments should unbundle the treatment arms and assess the effectiveness of the individual components in an experimental framework. Future work should also explore how lasting these results are. Infrastructure projects were just beginning during the endline survey enumeration period, meaning vendors were likely feeling particularly positive towards the government. If the infrastructure projects did not align with their expectations, then these feelings might turn negative quickly. For example, vendors in Msundwe market protested in December 2018 after they found out that the slab they had been promised as part of the services component was smaller than expected.
In summary, the Malawi LGAP impact evaluation suggests that local revenue generation can be kickstarted, even in an informal market. Addressing the willingness of vendors to pay taxes appears to be the most effective approach to increase tax compliance, and it also affects intermediate outcomes such as vendors’ satisfaction with services and their belief that paying taxes is a duty. These results provide encouraging evidence that analogous interventions in other contexts may be similarly effective.

CONTRACT No. GS-10F-0033M / ORDER No. AID-OAA-M-13-00013
USAID.GOV DRG-LER TASKING N030 IMPACT EVALUATION OF USAID/MALAWI LGAP ACTIVITY – FINAL REPORT | 44
APPENDIX A: MALAWI BACKGROUND

CONTRACT No. GS-10F-0033M / ORDER No. AID-OAA-M-13-00013
USAID.GOV DRG-LER TASKING N030 IMPACT EVALUATION OF USAID/MALAWI LGAP ACTIVITY – FINAL REPORT | 45
LOCAL GOVERNMENT IN MALAWI
The Malawi government developed the National Decentralization Policy and passed the Local Government Act in 1998. The Policy and related laws devolve administrative, fiscal, and political power and authority to local government for service delivery as well as empower citizens to become involved in development decisions and implementation of development projects. While some decentralization activities seem promising, progress in the implementation of decentralization has been slow. Decentralization has been rolled out in a disjointed fashion over the last 16 years, with fiscal decentralization lagging far behind administrative and political decentralization. This means that local government has significant authority over development in Malawi but is entirely reliant on central government to fund it, and the funds received are completely insufficient to address local needs. In a series of interviews conducted in 2015 and 2016, local government officials indicated that this lack of fiscal autonomy creates a sense of dependency and a barrier to accountability. While local governments continue to seek increased fiscal transfers, they are also able to raise local revenue via market fees, business licenses, property taxes and other fees. Own-source revenues currently make up a small percentage of rural districts’ budgets, but it is widely acknowledged that tax collection and administration could be expanded and improved, providing the local governments with badly needed revenue.
Malawi has three levels of elected government: councilors are elected in single-member wards to serve on district councils; members of parliament are elected in single-member constituencies to serve on parliament; and the president is elected at the national level. District government, which is the lowest level of government, forms the basis for this project. The elected district council consists of representatives from each ward, and is advised by appointed officials from the ministries. After the Local Government Act created the position of elected ward councilor within Malawi’s district government, the first local government elections were held in 2000. These officials served until 2005, when the next local government elections were cancelled by then-President Bingu wa Mutharika. From 2005 to 2014, elected local government did not exist. Local government consisted entirely of appointed government officials, selected by the ruling party. Each district’s appointed local government officials were led by an appointed district commissioner. During this period, the appointed officials took on many of the roles and responsibilities given in the constitution to elected officials. The Local Government Act was revised in 2010, with widespread demand to reinstate elected councilors as part of the revisions. Local government elections were held in May 2014, and 462 ward councilors were elected in single-member wards within the 28 district councils and 7 city councils across the country.
While the election of local councilors in 2014 provides a renewed opportunity to strengthen local governance, it also has affected the power structures that developed in their absence, creating an institutionally complex environment. In the absence of councilors, Members of Parliament (MPs) stepped in to provide representation at the local level and now are not keen to have that authority challenged, especially recognizing that their reelection often stems from the delivery of local development projects, most often accomplished through the Constituency Development Fund (CDF). Some MPs are also concerned that local councilors will run against them in the next election and therefore see them as political rivals. Likewise, district council and district executive committee (DEC) staff were operating without councilors for nine years, and while some welcome their presence and the political legitimacy they bring to the local level, tensions have flared elsewhere. In other cases, there simply isn’t the institutional habit of working together. Finally, barriers such as the cost of holding committee hearings limits the frequency of engagement between councilors and DEC staff.

CONTRACT No. GS-10F-0033M / ORDER No. AID-OAA-M-13-00013
USAID.GOV DRG-LER TASKING N030 IMPACT EVALUATION OF USAID/MALAWI LGAP ACTIVITY – FINAL REPORT | 46
LOCAL REVENUE COLLECTION IN MALAWI
In many districts, the largest current source of local revenue is fees collected from markets. Markets in Malawi are typically open-air collections of stalls, with vendors providing a wide range of goods and services, from vegetables, grains, and meat to household goods, hairdressing, and welding services. In most markets, vendors are supposed to pay a fixed fee for each day they sell in the market (typically MK100 - MK150, or about USD0.14 - USD0.21), and the local government in return is supposed to provide basic services in the market. Each market is run by between one and eight full-time tax collectors60 and a Market Master, all government employees. These in turn report to a Revenue Collector or Zone Manager, who typically oversees about five markets. These managers in turn report to the District Revenue Manager. Each day, tax collectors are supposed to walk around the market collecting fees and giving out receipts. At the end of the day, they are responsible for depositing the cash in the bank and bringing a receipt to the zone manager.
However, in practice, tax compliance in markets is low. Preliminary fieldwork conducted in ten markets suggests that, on average, only 35 percent of vendors pay their fees consistently (standard deviation is eight percent); this suggests the potential for significant improvement. Our preliminary fieldwork identified two main categories of barriers to higher tax compliance: vendors are unwilling to pay voluntarily, and local governments lack the capacity to enforce the tax and collect it efficiently. These are described in more detail below. We highlight that the size of the market tax is not a significant reason for non-compliance: in focus group discussions, vendors consistently (if begrudgingly) acknowledged that it was not the fee amount that caused low compliance, and that even raising the (currently very modest) fee would not result in lower compliance. In other words, low tax compliance is driven by the breakdown of the relationship between local government and market vendors, not economic reasons.
60 These individuals are called ‘Fee Collectors’ in Malawian markets, but referred to as tax collectors throughout this report

CONTRACT No. GS-10F-0033M / ORDER No. AID-OAA-M-13-00013
USAID.GOV DRG-LER TASKING N030 IMPACT EVALUATION OF USAID/MALAWI LGAP ACTIVITY – FINAL REPORT | 47
U.S. AGENCY FOR INTERNATIONAL DEVELOPMENT
1300 Pennsylvania Avenue, NW
Washington, DC 20523