impact of agribusiness training programmes on youth
TRANSCRIPT
Impact of Agribusiness Training Programmes on Youth Empowerment in Nigeria: The
case of Fadama GUYS Programme
Dolapo .F. Adeyanjua, *, John Mburua, Djana Mignounab
aDepartment of Agricultural Economics, College of Agriculture and Veterinary Science,
University of Nairobi, Kenya
bInternational Institute of Tropical Agriculture, Ibadan, Nigeria.
*Corresponding author
Email Address: [email protected] (Adeyanju D.F.)
i
Abstract
Within the framework of potential strategies to reduce the high dependency of young people on
white-collar jobs as well as increase employment opportunities in the non-formal sector,
agripreneurship is increasingly recognised as an important and valuable strategy which could
help create sustainable employment as well as improve the livelihood of young people. Based on
this, stakeholders have come to support agripreneurship in recent times by organizing
agribusiness training programmes which specifically targets this category of the population.
Despite the numerous training interventions, there is a dearth of empirical evidence on what
worked or what did not. Using the case of Fadama Graduate Unemployed Youth and Women
Support (GUYS) programme, this study investigated the impact of agribusiness training
programmes on youth empowerment in Nigeria. A total of 977 respondents comprising of 455
participants and 522 non-participants were sampled across three states in Nigeria. Data were
analysed using Propensity Score Matching (PSM) method. Model results show that after
controlling for all confounding factors, participation in the programme led to about 11 percent
increase in youth empowerment index score implying a positive change in the economic status
and livelihoods of the youths who participated in the programme. On this note, this study suggests
that programmes such as the Fadama GUYS programme (FGP) should be encouraged and
invested in as it can inspire youths to engage in agribusiness thereby, reducing the rate of
unemployment as well as contributing to youth empowerment.
Keywords: Agribusiness, Youth empowerment, Youth unemployment, Agribusiness training

1
1.0 Introduction
Nigeria remains the most populous country in Africa with a population of about 195,874,7401.
The country is enormously endowed with abundant resources capable of empowering the youths
for positive outcomes which can bring about sustainable social and economic development
(Odeh & Okoye, 2014). As reported by Awogbenle & Iwuamadi (2010), about 60% of the
Nigeria population is regarded as youths (between 18 and 35years) based on the Nigeria Youth
Policy Document (2009). Hence, it can be inferred that Nigeria is largely a youthful country
(Emeh & Eke, 2012). Despite many studies proving that youths are valuable assets which is
germane to successful and sustainable nation-building (Mutuku, 2011; Hope, 2012), the general
characteristics of Nigeria youths depicted by a high rate of unemployment and underemployment
clearly indicate that this segment of the population is faced with tough economic challenges. The
National Bureau of Statistics (2018) reported that as at the third-quarter of 2018, 55.4 per cent of
young people were either underemployed or unemployed (doing nothing) compared to 52.6 per
cent in the same period of the previous year (2017). This report shows an increased
unemployment rate of about 5 per cent in the space of one year. As a matter of fact, one notable
challenge Nigeria continues to struggle with is youth unemployment. A large number of young
people graduate from higher institution yearly with little or no expectation of securing
sustainable employment (Inegbenebor & Ogunrin, 2011). Over the years, unemployment has
eaten really deep into the fabric of Nigeria thereby pushing many young people to either roam
the streets meaninglessly searching for a living (Ali & Salisu, 2019) or engage in illegal activities
and thereby increasing crime rate in the country. In view of this, stakeholders have come to
realize that the most challenging policy question that has to be addressed as soon as possible is
1 https://data.worldbank.org/indicator/SP.POP.TOTL?locations=NG&view=chart visited on July 25, 2019
2
the growing rate of youth unemployment. Hope (2012) affirms that to mitigate the several
challenges faced by young people in Nigeria, government and development partners would have
to focus on developing and implementing relevant and sustainable strategies, policies and
programmes which favours this large segment of the population. According to the author, failure
to do this could lead to enormous political, social, economic, and cultural consequences which is
already evident in the country. It is for these reasons that trainings such as vocational and
entrepreneurial training came into being. This will help to convey relevant skills to young people
which will not only reduce unemployment – a severe national scourge - but will also aid youth
empowerment. It is believed that youth agripreneurship development for instance has a very
important role to play in reducing unemployment, empowering youths and reducing crime rate
among young people.
Entrepreneurship development has been closely linked to social and economic development. It is
believed that a lasting solution to youth unemployment is embedded in helping young people to
create their own jobs (become Entrepreneurs). This is well articulated by Maigida, et al. (2013)
who argued that the only sustainable way to empower Nigerian youths is to provide them with
adequate and qualitative training and education which will enable them to be job creators instead
of seekers. At the centre of all these job creation initiatives is the agricultural sector which has
been identified as one of the sectors capable of generating sustainable employment opportunities
for a large number of young people (Yami et al., 2019). Based on this, agribusiness training has
become one of the important government initiatives to empower young people as well as inspire
them to become job creators.
It is indeed true that youth empowerment has become a key item on both national and
international policy agenda as the national and global community moves towards the sustainable
3
development goals (SDGs). Alsop & Heinsohn (2005) define empowerment as enhancing the
capacity of individuals so as to enable them to make choices which in the long run would
transform into desired personal and economic outcomes. Also, Maigida et al. (2013) define
Youth empowerment as a structural, attitudinal, and cultural process through which young
people gain the ability to make their own employment changes and decisions. Thus, from these
definitions, it is clear that embarking on empowerment programmes will not only help Nigeria in
reducing youth unemployment but also in securing its future prosperity (Ibrahim, 2013). This
corroborates the position of Awogbenle & Iwuamadi (2010) that Youth development and
empowerment are important stages of human capacity building which will allow young people to
become better leaders, avoid poverty and most importantly, enjoy a more fulfilling life. The
Nigerian government with the support of development partners have shown their political
commitment towards empowering young people through agribusiness training. According to
Yami et al. (2019), there are increasing investment on agricultural programmes aimed at
promoting youth participation in agribusiness in an effort to solve youth unemployment
problems and subsequently empower this category of the population. In recent times, the country
has seen a remarkable number of interventions by both the private and public sectors. Examples
include; Npower, Youth Commercial Agriculture Development Programme (YCAD),
Youth Employment in Agriculture Programme (YEAP), Youth Initiatives for Sustainable
Agriculture (YISA) and The Livelihood Improvement Family Enterprise (LIFE). Between 1986
and now, there have been a number of remarkable initiatives by various administrations to
promote youth empowerment through the generation of gainful self-employment (Awogbenle &
Iwuamadi, 2010). This also corroborates the findings of Yami et al. (2019) that indeed there have
been numerous interventions aimed at achieving youth empowerment through agribusiness in
4
Nigeria. However, according to these authors, there is a dearth of empirical evidence as to what
worked or what did not, making it difficult to make practical policy recommendations from these
interventions. In an effort to fill this research gap, this study investigated the impact of
agricultural programmes on youth empowerment, taking the case of Fadama Graduate
Unemployed Youth and Women Support (GUYS) programme. It is worth noting that there is
very scanty literature on youth empowerment in Nigeria, particularly studies related to the
current objective (Emeh & Eke, 2012; Okoli & Okoli, 2013; Ibrahim, 2013; Hashim, 2014).
Thus, this study will serve as a guide to those aiming to research similar subject as well as
provide practical evidence on the impact of the intervention, thereby, driving evidence-based
policy making.
1.1 The Intervention (Fadama GUYS Programme)
In an effort to reduce youth unemployment and empower young people through agribusiness, the
Fadama GUYS programme was introduced in 2017 by the Federal government of Nigeria, in
collaboration with the World Bank and state governments. Funding was through a tri-partite
agreement between each state government, the federal government and the World Bank. The
programme covered a total of twenty-three states across Nigeria and targeted young people
between 18 and 35 years of age. The training covered different agribusiness fields which include;
Agricultural production (Crop and livestock), agricultural marketing, crop and livestock
processing and financial management.
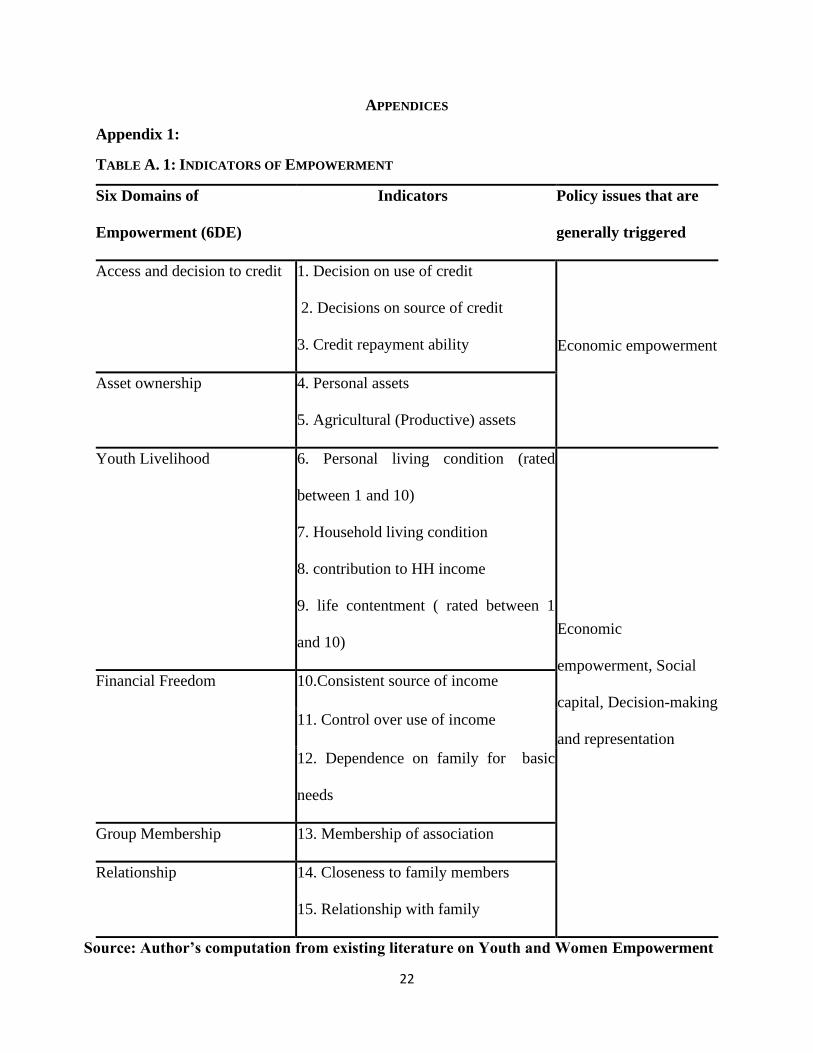
1.2 Measures of Youth Empowerment
Youth empowerment was measured with 15 indicators. Based on existing literature on youth
empowerment indicators, a list which describes the important aspects of youth empowerment
was developed (see International Labour Office, 2018 and; Muiruri, 2015). These indicators are
5
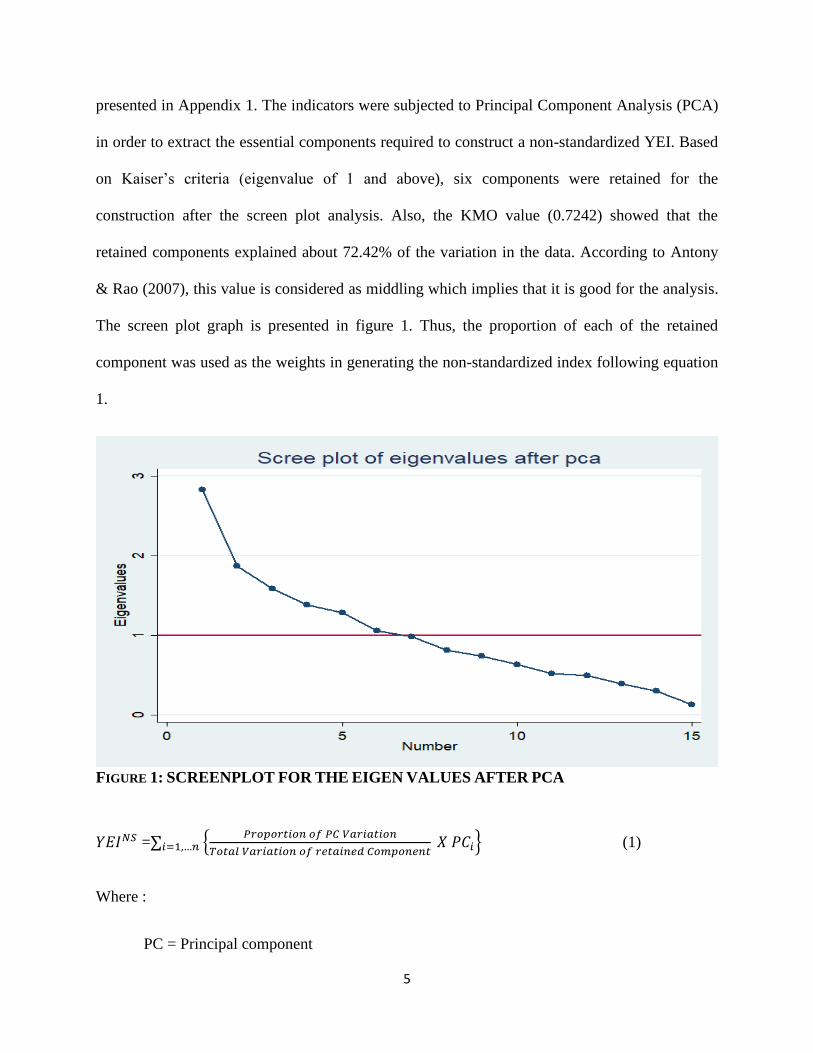
presented in Appendix 1. The indicators were subjected to Principal Component Analysis (PCA)
in order to extract the essential components required to construct a non-standardized YEI. Based
on Kaiser’s criteria (eigenvalue of 1 and above), six components were retained for the
construction after the screen plot analysis. Also, the KMO value (0.7242) showed that the
retained components explained about 72.42% of the variation in the data. According to Antony
& Rao (2007), this value is considered as middling which implies that it is good for the analysis.
The screen plot graph is presented in figure 1. Thus, the proportion of each of the retained
component was used as the weights in generating the non-standardized index following equation
1.
FIGURE 1: SCREENPLOT FOR THE EIGEN VALUES AFTER PCA
𝑌𝐸𝐼𝑁𝑆 =∑𝑖=1,…𝑛 {𝑃𝑟𝑜𝑝𝑜𝑟𝑡𝑖𝑜𝑛 𝑜𝑓 𝑃𝐶 𝑉𝑎𝑟𝑖𝑎𝑡𝑖𝑜𝑛
𝑇𝑜𝑡𝑎𝑙 𝑉𝑎𝑟𝑖𝑎𝑡𝑖𝑜𝑛 𝑜𝑓 𝑟𝑒𝑡𝑎𝑖𝑛𝑒𝑑 𝐶𝑜𝑚𝑝𝑜𝑛𝑒𝑛𝑡 𝑋 𝑃𝐶𝑖} (1)
Where :
PC = Principal component
6
i = Value of retained PC
𝑌𝐸𝐼𝑁𝑆 = Non-standardized Youth Empowerment Index
2.0 Materials and Method
2.1 Study Area
The study was conducted in three states across Nigeria between January and March 2019. These
include Abia, Ekiti and Kebbi States representing the South-eastern, South-western and North-
western regions respectively. Abia state occupies a total land area of about 4,900 sq km. The
estimated population as of 2016 was about 3,699,168 people (National Bureau of Statistics,
2011). Ekiti state is mainly an upland zone with a total land area of about 5,435 sq km. As of
2006, the state had a population of 2,398,957 people (National Bureau of Statistics, 2011) of
which more than 75 percent were actively engaged in Agriculture. Kebbi state is located in the
north-western part of Nigeria with a total land area of about 36,985 km sq out of which 12,600
km sq is cultivated for agricultural purposes. According to the National Bureau of Statistics
(2011), the state had a total population of 3,256,541 following the 2006 population census.
According to UNDP (2018), as of 2017, the unemployment rate in these states were of 39.6
percent, 18.6 percent and 11.6 percent respectively.
2.2 Sampling and Data Collection
Primary data was sourced from a total of 977 respondents comprising of 455 participants and
522 non-participants in the study areas. The survey included detailed information on key youth
empowerment variables and other relevant socioeconomic characteristics such as age, gender,
education and marital status. The questions were programmed on Open data kit and data were
collected using phones and tablets by trained enumerators across the three states.
7
The study adopted a multi-stage sampling technique. In the first stage, three states were
purposively selected. To ensure representativeness, a state was considered each in the Northern,
Eastern and Western regions of the country. In the second stage, the study population was
divided into two strata: participants and non-participants. The third stage involves random
selection of youths from two sampling frames to make a sample size of 977 which was
determined based on the error margin formula proposed by Bartlett, et al. (2001). The first
sampling frame consisting of a complete list of youths who were trained under the FGP in 2017
was used in gathering the treated group and a second sampling frame consisting the list of
community youths obtained from the local governments where the training was conducted was
used in gathering the control group. The random selection of both the treatment and control
group was done via random numbers generated using Microsoft Excel.
2.3 Econometric Estimation
2.3.1 Propensity Score Matching Procedure
This study adopted the Propensity Score Matching (PSM) method to generate the control group
as well as to deal with the problem of selection bias since participation in any programme may
not be random. Many impact evaluation studies have adopted this method in analysing the
impact of interventions or programmes (Asfaw & Shiferaw, 2010; Ahmed & Haji, 2014; Haji &
Legesse, 2017; Balde, at al., 2019).
The method is one of the non-parametric estimation procedures which relaxes the assumptions of
functional forms imposed by parametric models and it is not restricted by distributional
assumptions (El-Shater et al., 2015). It helps in comparing the observed outcomes of the
participants with the outcomes of the non-participants (Heckman, Ichimura, & Todd, 1998). The
basic idea behind this approach is to find in the group of participants, those who have similar
8
relevant pre-treatment observable characteristics with the non-participants (Haji & Legesse,
2017). PSM essentially estimates youths’ propensity to participate in the programme and it is
commonly estimated using either the Probit of Logit regression model as a function of the
observable characteristics of the youths and then matches youths with similar propensities. The
PSM produces a variable called the propensity score which is the probability that a youth would
participate in the programme and based on the youth’s observable characteristics. We adopted
the three widely used matching methods or algorithm for the purpose of comparison and
robustness (NNM, CBM and KBM).
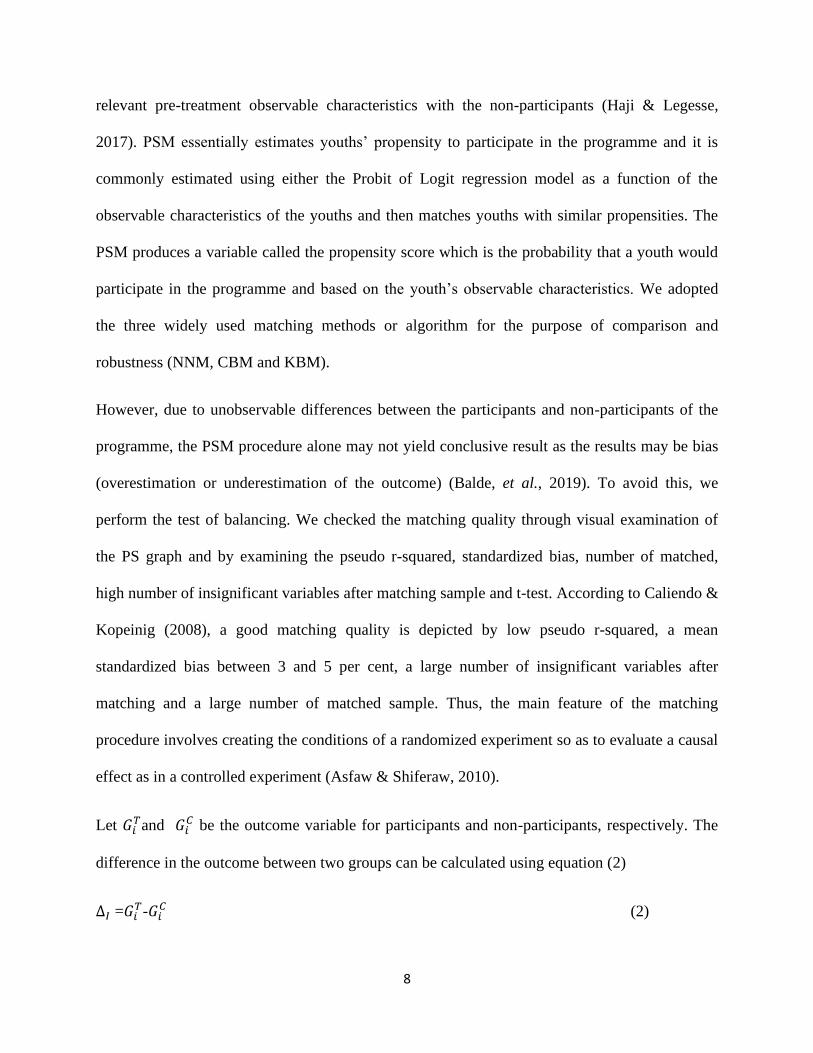
However, due to unobservable differences between the participants and non-participants of the
programme, the PSM procedure alone may not yield conclusive result as the results may be bias
(overestimation or underestimation of the outcome) (Balde, et al., 2019). To avoid this, we
perform the test of balancing. We checked the matching quality through visual examination of
the PS graph and by examining the pseudo r-squared, standardized bias, number of matched,
high number of insignificant variables after matching sample and t-test. According to Caliendo &
Kopeinig (2008), a good matching quality is depicted by low pseudo r-squared, a mean
standardized bias between 3 and 5 per cent, a large number of insignificant variables after
matching and a large number of matched sample. Thus, the main feature of the matching
procedure involves creating the conditions of a randomized experiment so as to evaluate a causal
effect as in a controlled experiment (Asfaw & Shiferaw, 2010).
Let 𝐺𝑖𝑇and 𝐺𝑖
𝐶 be the outcome variable for participants and non-participants, respectively. The
difference in the outcome between two groups can be calculated using equation (2)
∆𝐼 =𝐺𝑖𝑇-𝐺𝑖
𝐶 (2)
9
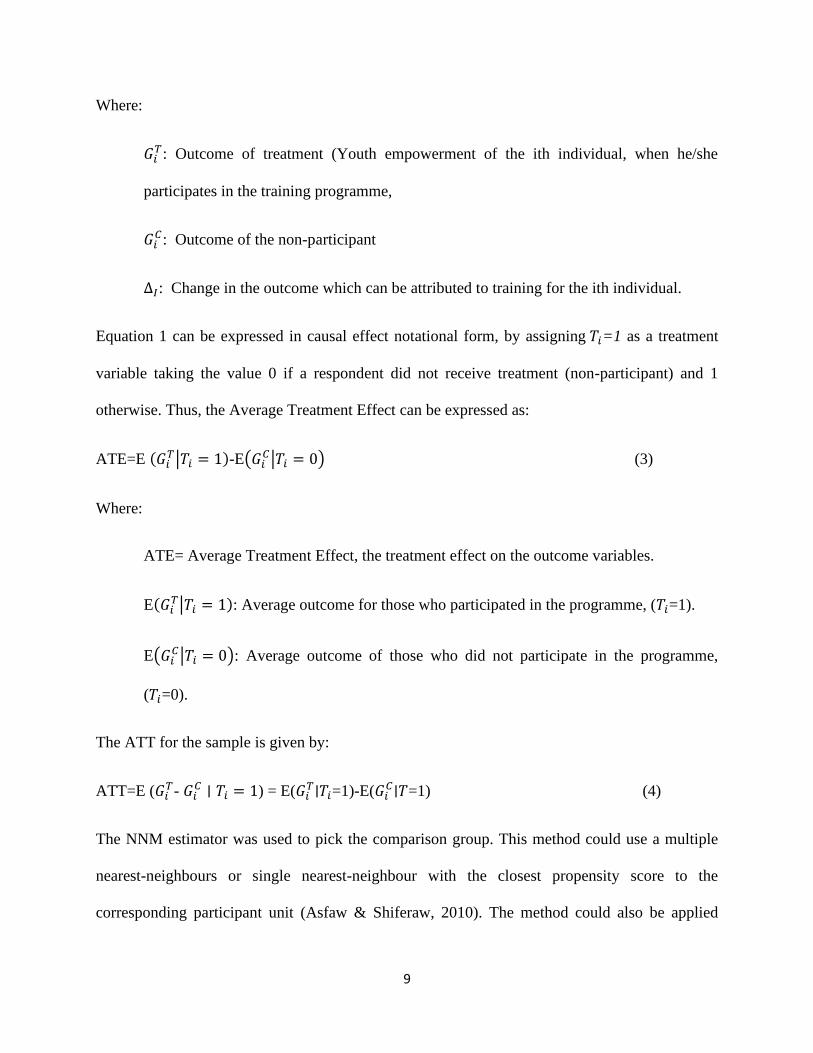
Where:
𝐺𝑖𝑇: Outcome of treatment (Youth empowerment of the ith individual, when he/she
participates in the training programme,
𝐺𝑖𝐶: Outcome of the non-participant
∆𝐼: Change in the outcome which can be attributed to training for the ith individual.
Equation 1 can be expressed in causal effect notational form, by assigning 𝑇𝑖=1 as a treatment
variable taking the value 0 if a respondent did not receive treatment (non-participant) and 1
otherwise. Thus, the Average Treatment Effect can be expressed as:
ATE=E (𝐺𝑖𝑇|𝑇𝑖 = 1)-E(𝐺𝑖
𝐶|𝑇𝑖 = 0) (3)
Where:
ATE= Average Treatment Effect, the treatment effect on the outcome variables.
E(𝐺𝑖𝑇|𝑇𝑖 = 1): Average outcome for those who participated in the programme, (𝑇𝑖=1).
E(𝐺𝑖𝐶|𝑇𝑖 = 0): Average outcome of those who did not participate in the programme,
(𝑇𝑖=0).
The ATT for the sample is given by:
ATT=E (𝐺𝑖𝑇- 𝐺𝑖
𝐶 ∣ 𝑇𝑖 = 1) = E(𝐺𝑖𝑇∣𝑇𝑖=1)-E(𝐺𝑖
𝐶∣𝑇=1) (4)
The NNM estimator was used to pick the comparison group. This method could use a multiple
nearest-neighbours or single nearest-neighbour with the closest propensity score to the
corresponding participant unit (Asfaw & Shiferaw, 2010). The method could also be applied
10
with or without replacement where the former allows a given non-participants to match with
more than one participants (Adebayo, et al., 2018; Austin, 2014; Asfaw & Shiferaw, 2010;
Caliendo & Kopenig, 2005). To check the robustness of our result, the impact estimate
calculated using the NNM method was compared to the estimates of the CBM and KBM
estimators.
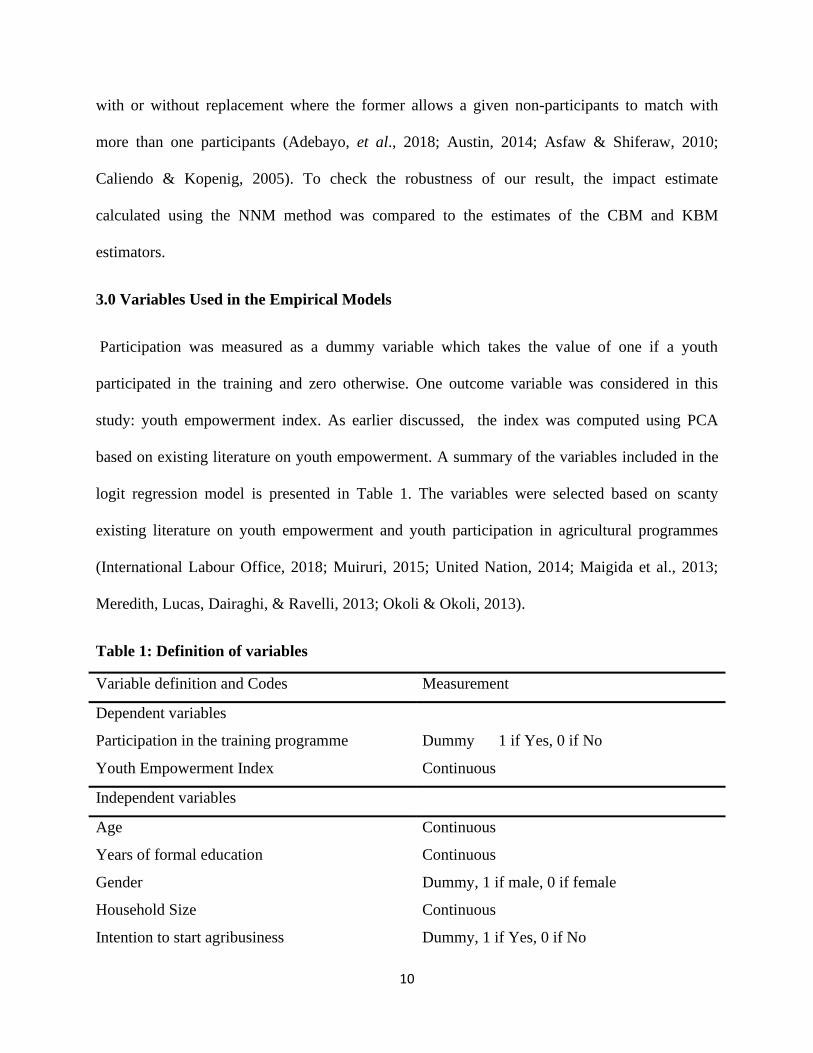
3.0 Variables Used in the Empirical Models
Participation was measured as a dummy variable which takes the value of one if a youth
participated in the training and zero otherwise. One outcome variable was considered in this
study: youth empowerment index. As earlier discussed, the index was computed using PCA
based on existing literature on youth empowerment. A summary of the variables included in the
logit regression model is presented in Table 1. The variables were selected based on scanty
existing literature on youth empowerment and youth participation in agricultural programmes
(International Labour Office, 2018; Muiruri, 2015; United Nation, 2014; Maigida et al., 2013;
Meredith, Lucas, Dairaghi, & Ravelli, 2013; Okoli & Okoli, 2013).
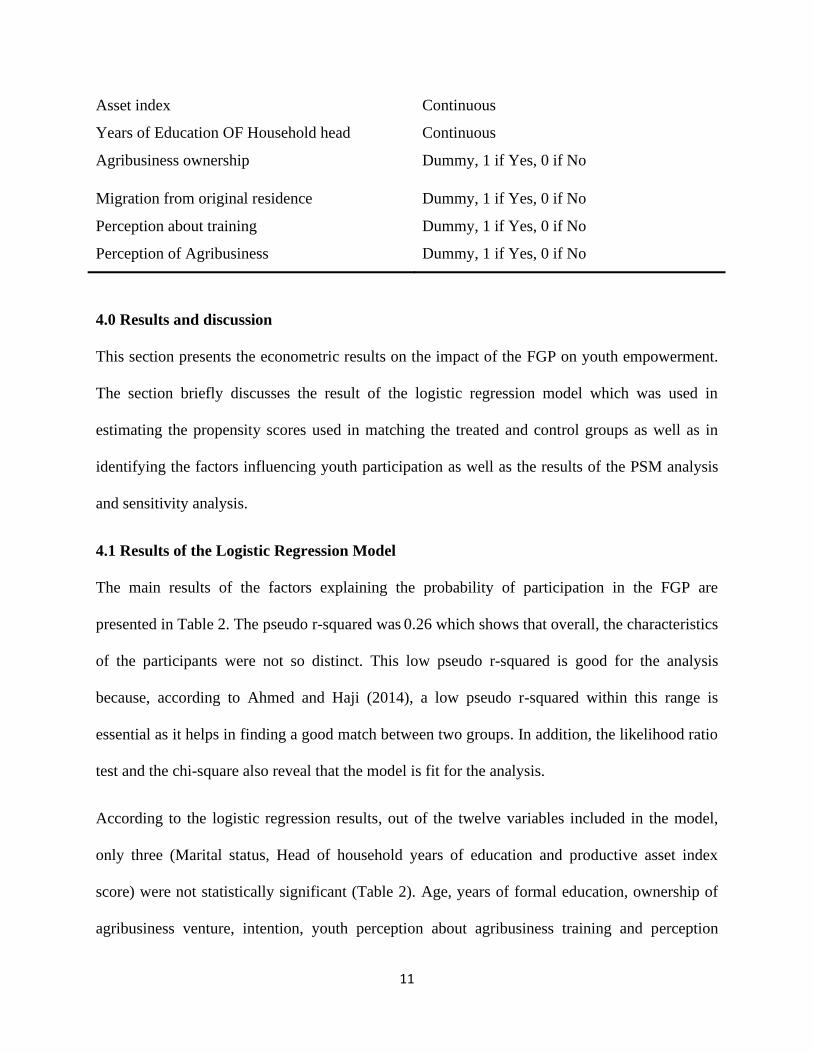
Table 1: Definition of variables
Variable definition and Codes Measurement
Dependent variables
Participation in the training programme Dummy 1 if Yes, 0 if No
Youth Empowerment Index Continuous
Independent variables
Age Continuous
Years of formal education Continuous
Gender Dummy, 1 if male, 0 if female
Household Size Continuous
Intention to start agribusiness Dummy, 1 if Yes, 0 if No
11
Asset index Continuous
Years of Education OF Household head Continuous
Agribusiness ownership Dummy, 1 if Yes, 0 if No
Migration from original residence Dummy, 1 if Yes, 0 if No
Perception about training Dummy, 1 if Yes, 0 if No
Perception of Agribusiness Dummy, 1 if Yes, 0 if No
4.0 Results and discussion
This section presents the econometric results on the impact of the FGP on youth empowerment.
The section briefly discusses the result of the logistic regression model which was used in
estimating the propensity scores used in matching the treated and control groups as well as in
identifying the factors influencing youth participation as well as the results of the PSM analysis
and sensitivity analysis.
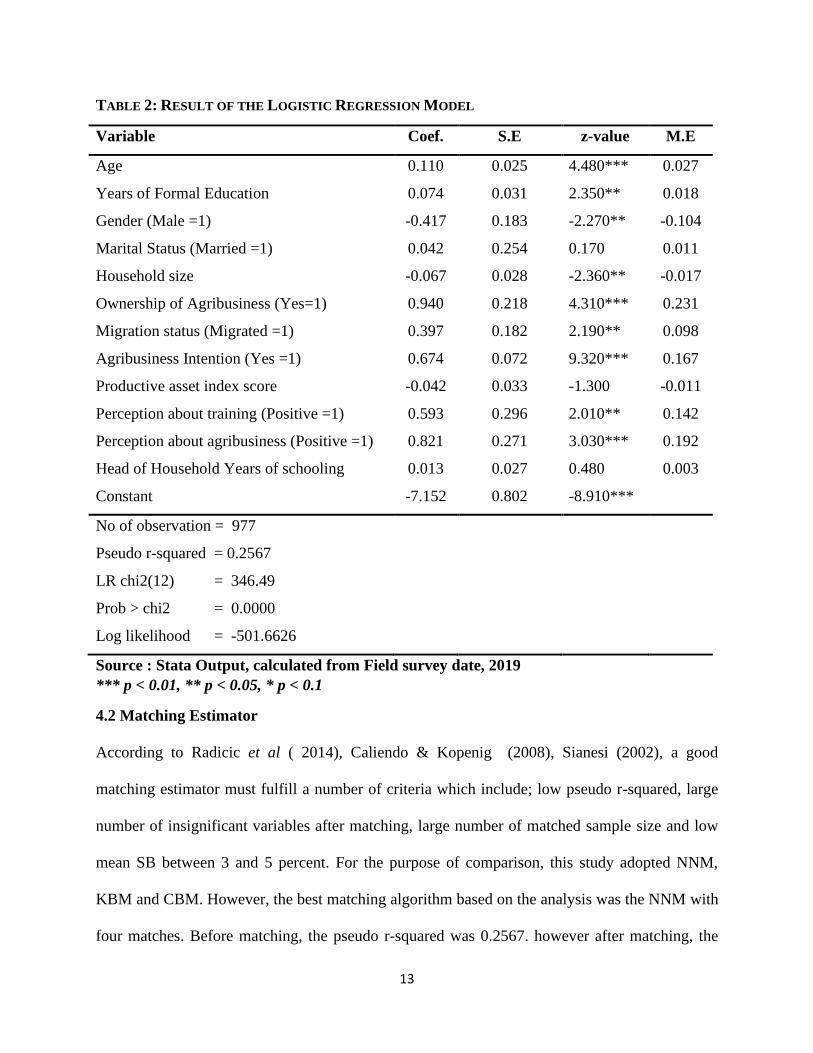
4.1 Results of the Logistic Regression Model
The main results of the factors explaining the probability of participation in the FGP are
presented in Table 2. The pseudo r-squared was 0.26 which shows that overall, the characteristics
of the participants were not so distinct. This low pseudo r-squared is good for the analysis
because, according to Ahmed and Haji (2014), a low pseudo r-squared within this range is
essential as it helps in finding a good match between two groups. In addition, the likelihood ratio
test and the chi-square also reveal that the model is fit for the analysis.
According to the logistic regression results, out of the twelve variables included in the model,
only three (Marital status, Head of household years of education and productive asset index
score) were not statistically significant (Table 2). Age, years of formal education, ownership of
agribusiness venture, intention, youth perception about agribusiness training and perception

12
about agribusiness were factors which positively and significantly influenced youth participation
in the FGP while gender, household size had a negative and significant influence on
participation.
13
TABLE 2: RESULT OF THE LOGISTIC REGRESSION MODEL
Variable Coef. S.E z-value M.E
Age 0.110 0.025 4.480*** 0.027
Years of Formal Education 0.074 0.031 2.350** 0.018
Gender (Male =1) -0.417 0.183 -2.270** -0.104
Marital Status (Married =1) 0.042 0.254 0.170 0.011
Household size -0.067 0.028 -2.360** -0.017
Ownership of Agribusiness (Yes=1) 0.940 0.218 4.310*** 0.231
Migration status (Migrated =1) 0.397 0.182 2.190** 0.098
Agribusiness Intention (Yes =1) 0.674 0.072 9.320*** 0.167
Productive asset index score -0.042 0.033 -1.300 -0.011
Perception about training (Positive =1) 0.593 0.296 2.010** 0.142
Perception about agribusiness (Positive =1) 0.821 0.271 3.030*** 0.192
Head of Household Years of schooling 0.013 0.027 0.480 0.003
Constant -7.152 0.802 -8.910***
No of observation = 977
Pseudo r-squared = 0.2567
LR chi2(12) = 346.49
Prob > chi2 = 0.0000
Log likelihood = -501.6626
Source : Stata Output, calculated from Field survey date, 2019
*** p < 0.01, ** p < 0.05, * p < 0.1
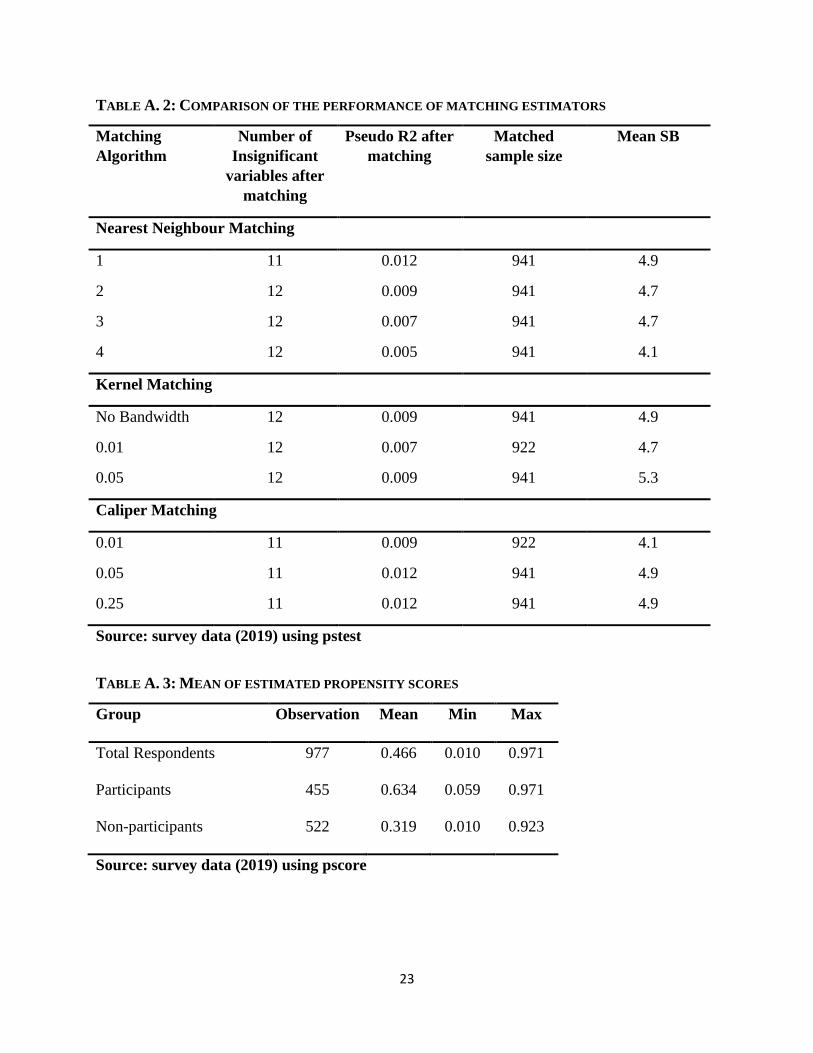
4.2 Matching Estimator
According to Radicic et al ( 2014), Caliendo & Kopenig (2008), Sianesi (2002), a good
matching estimator must fulfill a number of criteria which include; low pseudo r-squared, large
number of insignificant variables after matching, large number of matched sample size and low
mean SB between 3 and 5 percent. For the purpose of comparison, this study adopted NNM,
KBM and CBM. However, the best matching algorithm based on the analysis was the NNM with
four matches. Before matching, the pseudo r-squared was 0.2567. however after matching, the

14
pseudo r-squared was reduced to 0.005 (see Table A.2). Also, the likelihood ratio after matching
shows that all the regressors in the treatment group were statistically insignificant which implies
that the null hypothesis of joint significance could be rejected (Caliendo & Kopenig, 2005). The
mean bias after matching was reduced to 4.1 percent from the initial value of 38.1 which
indicates that there was an 89 per cent reduction and falls within the recommended mean bias of
between 3-5 per cent.
4.3 Matching Participants and Non- Participants
The estimated mean, minimum and maximum values of the propensity scores for all sampled
youths were 0.466, 0.010 and 0.971 respectively (see Table A.3). The corresponding figures for
participants were 0.634, 0.059 and 0.971 respectively while that of the non-participants were
0.319, 0.010 and 0.923. Thus, the common support region lies between 0.059 and 0.971. To
obtain a good quality match between participants and non- participants, the estimated propensity
scores should satisfy the common support condition. Therefore, observations whose estimated
propensity scores were not within the common support region was discarded so as to avoid bad
matches. Subsequently, respondents with estimated propensity scores of less than 0.059 and
greater than 0.971 were not considered for the matching.
4.4 Testing for Common Support
Table A.2 shows that only 36 cases representing four per cent of the entire sample size were lost
to common support restriction using the NNM estimator. This indicates that using the NNM
estimator, only 36 respondents has a propensity score which lies outside the common support
region (between 0.059 and 0.971). These cases were excluded from the analysis to avoid bad
matches. However, there was enough overlap for the matching exercise. Using the other two
15
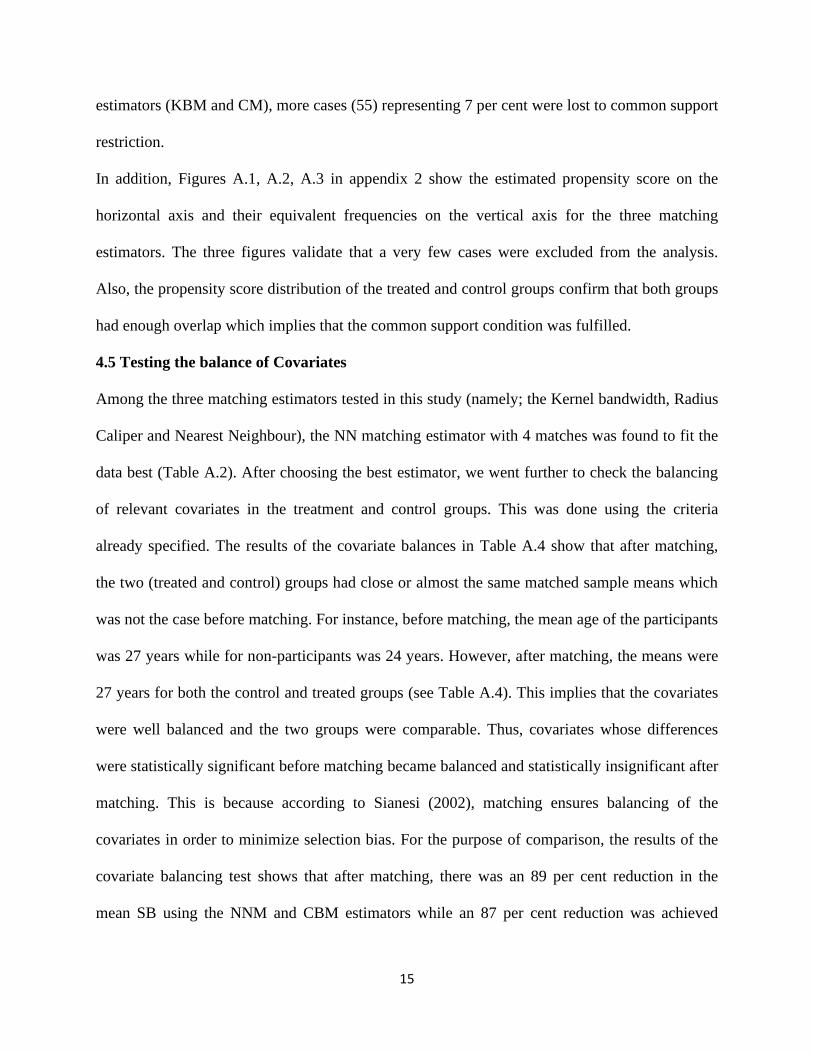
estimators (KBM and CM), more cases (55) representing 7 per cent were lost to common support
restriction.
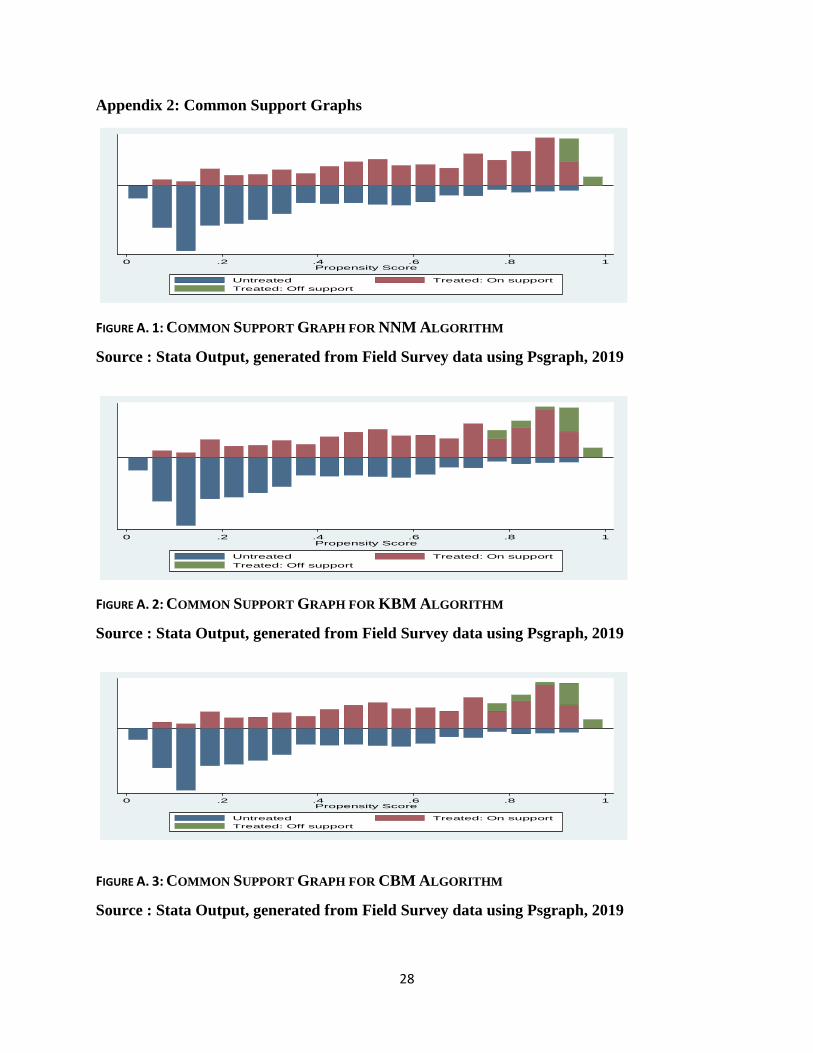
In addition, Figures A.1, A.2, A.3 in appendix 2 show the estimated propensity score on the
horizontal axis and their equivalent frequencies on the vertical axis for the three matching
estimators. The three figures validate that a very few cases were excluded from the analysis.
Also, the propensity score distribution of the treated and control groups confirm that both groups
had enough overlap which implies that the common support condition was fulfilled.
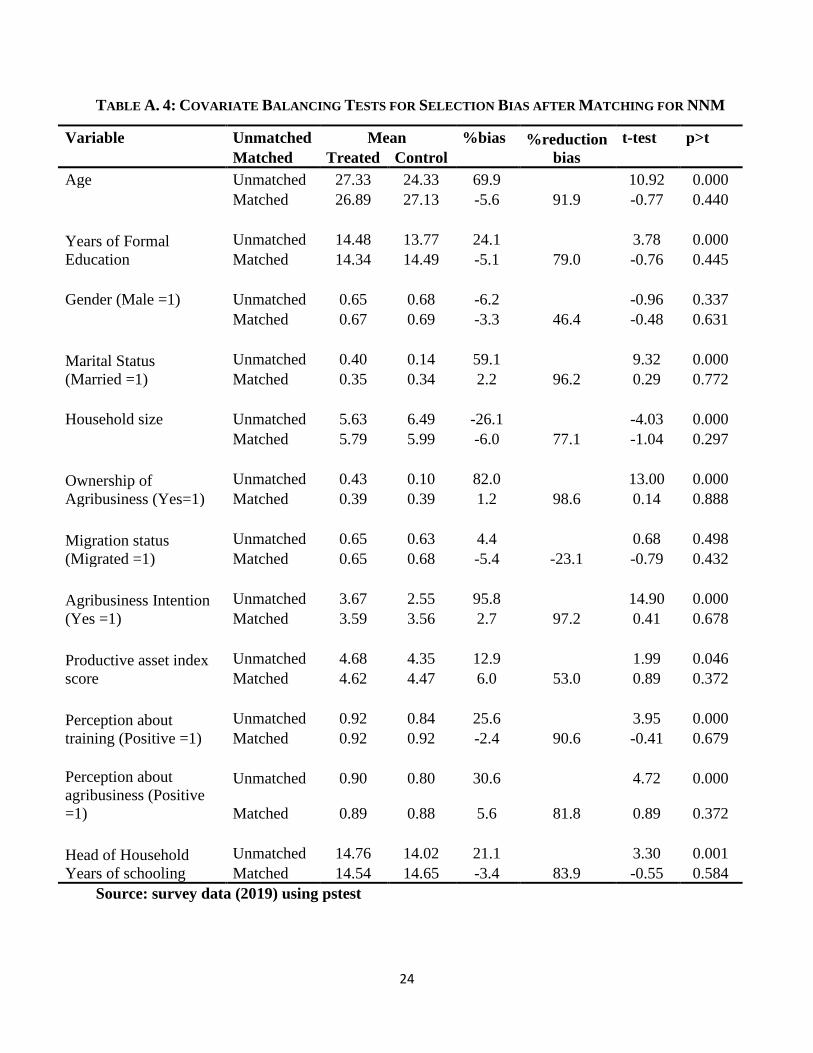
4.5 Testing the balance of Covariates
Among the three matching estimators tested in this study (namely; the Kernel bandwidth, Radius
Caliper and Nearest Neighbour), the NN matching estimator with 4 matches was found to fit the
data best (Table A.2). After choosing the best estimator, we went further to check the balancing
of relevant covariates in the treatment and control groups. This was done using the criteria
already specified. The results of the covariate balances in Table A.4 show that after matching,
the two (treated and control) groups had close or almost the same matched sample means which
was not the case before matching. For instance, before matching, the mean age of the participants
was 27 years while for non-participants was 24 years. However, after matching, the means were
27 years for both the control and treated groups (see Table A.4). This implies that the covariates
were well balanced and the two groups were comparable. Thus, covariates whose differences
were statistically significant before matching became balanced and statistically insignificant after
matching. This is because according to Sianesi (2002), matching ensures balancing of the
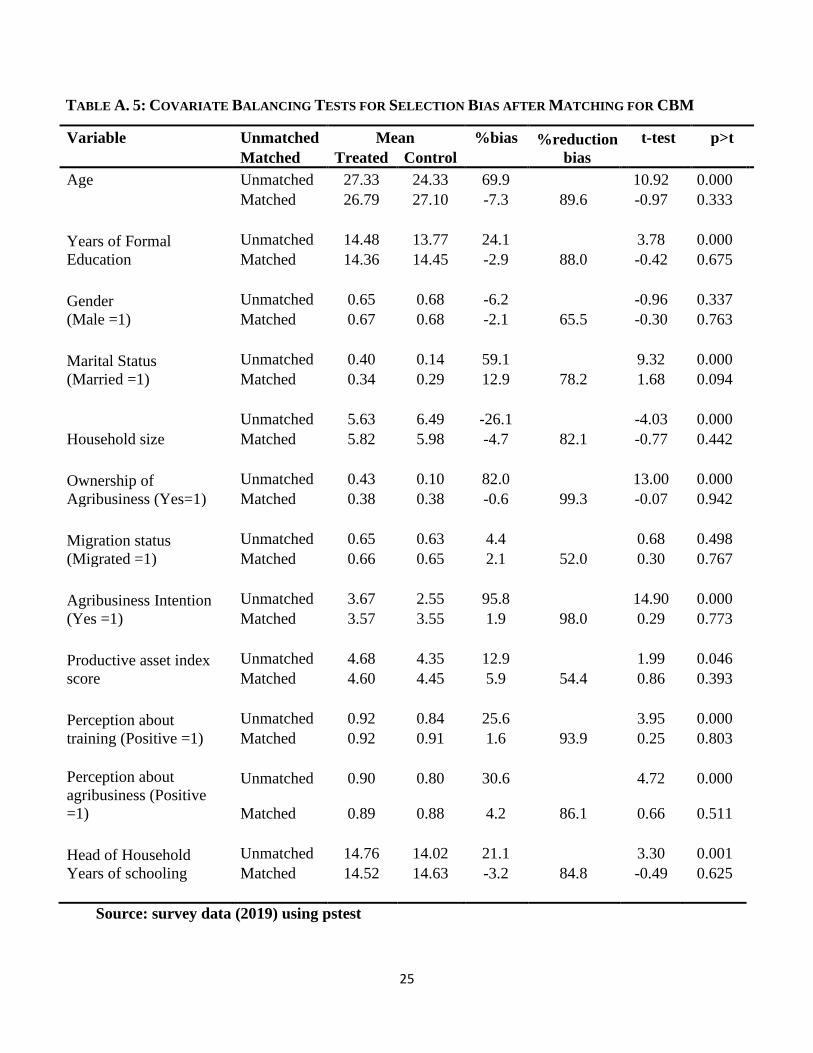
covariates in order to minimize selection bias. For the purpose of comparison, the results of the
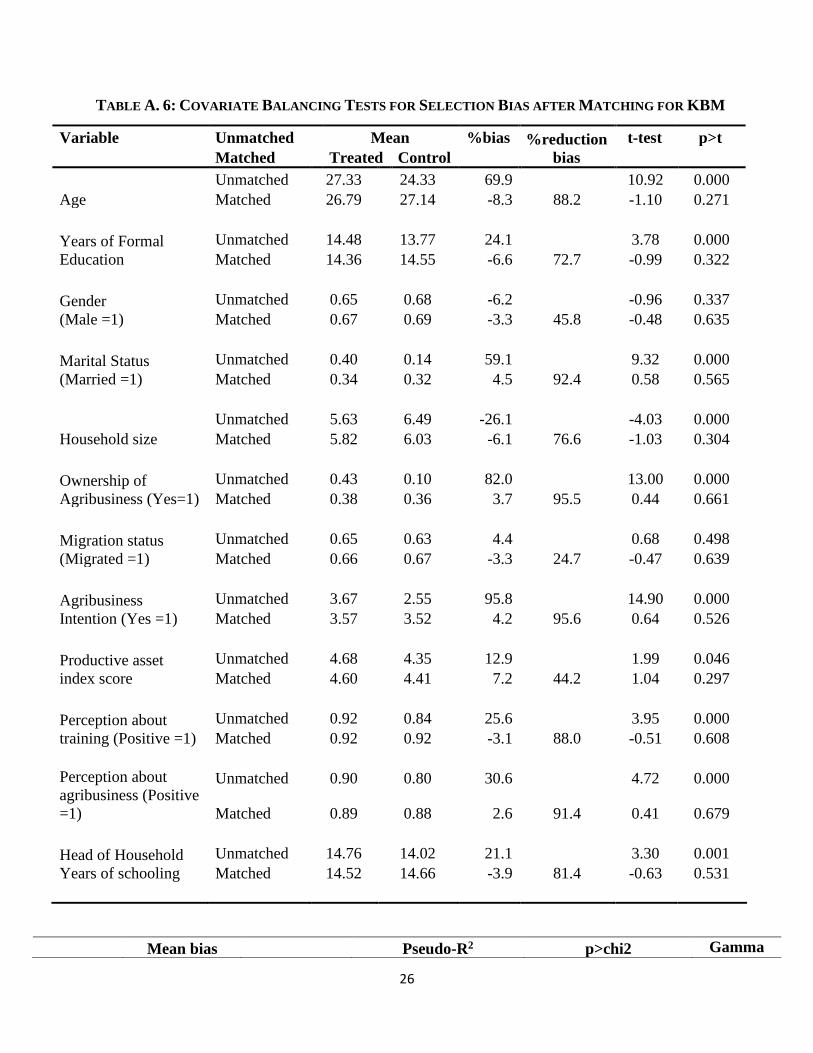
covariate balancing test shows that after matching, there was an 89 per cent reduction in the
mean SB using the NNM and CBM estimators while an 87 per cent reduction was achieved
16
using the KBM estimator (Table A.7). This implies that after matching there was no observable
differences in characteristics of the participants and non-participants. It was also observed that
after matching, using NNM and KBM estimators (Tables A.4 and A.6), all the variables became
statistically insignificant which was not the case before matching, therefore indicating a good
counterfactual. However, using the CBM estimator, one out of the 12 variables (see Table A.5)
included in the model remained statistically significant.
4.6 Testing for Hidden Bias (Sensitivity Analysis)
One limitation of PSM is that it only compares the treated and control units based on observable
characteristic (Asfaw & Shiferaw, 2010). Thus, it does not account for unobserved
characteristics which may likely influence the decision to participate in the programme which
may lead to hidden bias. Therefore, raising questions about the consistency and robustness of
the PSM estimates.
However, conducting a sensitivity analysis helps to examine whether the inferences about
participation impacts may be questionable due to unobserved characteristics or variables in the
data set. This study adopted the Rosenbaum bounds (rbounds) test to check the sensitivity of the
estimates, testing the null hypothesis that unobserved characteristics have no effect on the
outcome estimate. According to Hujer, et al. (2004), the gamma level, which is the odd ratio of
differential treatment effect due to unobservable characteristics, is reported at the point where 10
per cent level of significance is exceeded.
The results of the sensitivity analysis on hidden bias reported in A.7 shows that the critical level
of gamma (γ) for the impact of FGP on youth empowerment varies between 2.90 and 2.95. This
implies that for the impact estimates to be nullified, the unobservable variable would have to
increase the odds ratio of participation in the programme by up to 195 per cent. We, therefore,
17
conclude that even large amounts of unobserved heterogeneity would not change the inference
about the impact estimate of FGP on level of youth empowerment.
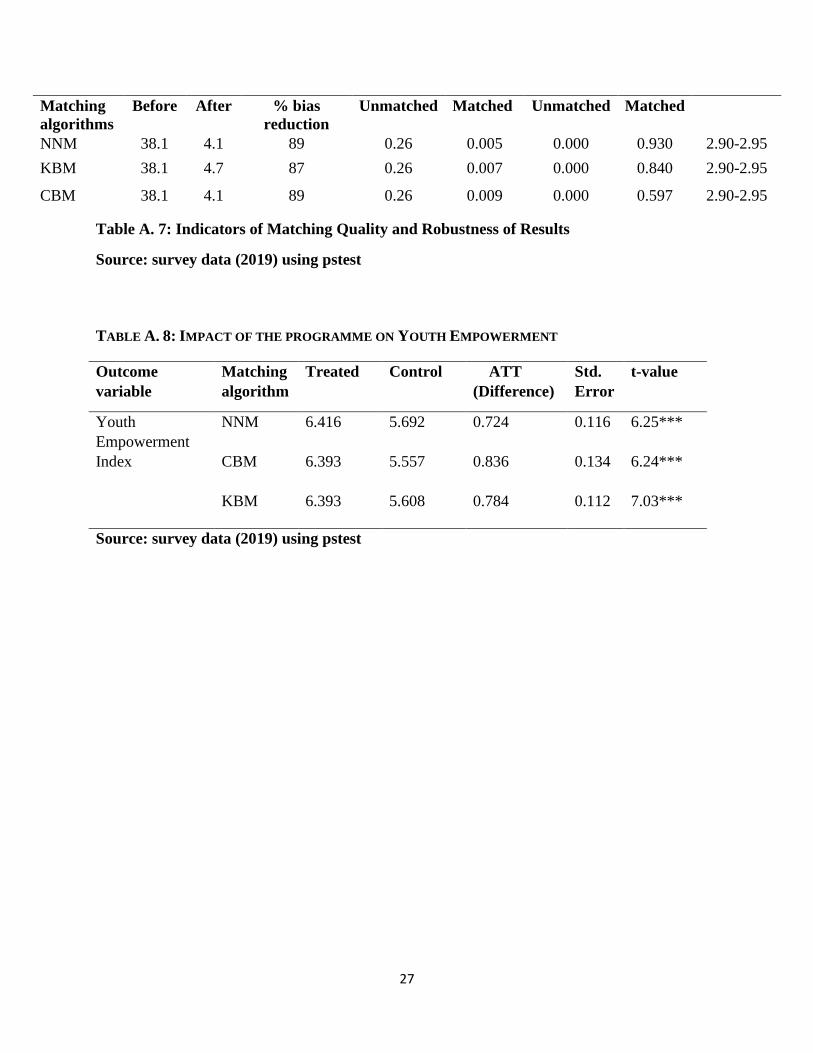
4.7 Estimation of Treatment Effects
After controlling for observable confounding factors, Table A.8 shows the results of the Average
Treatment of the Treated (ATT) of the three matching estimators on the outcome variable, Youth
empowerment. The impact of youth’s participation in the FGP on their empowerment is revealed
by the difference between the ATT of the control and the treated groups. The results of the
NNM, CBM and KBM estimators in Table A.8 show that the participants of FGP had higher
empowerment index score than non-participants. The positive difference in ATT obtained from
the three estimators implies that participation in the programme resulted in a positive increment
in the youth empowerment index score. The results further show that the difference in the ATTs
of the three estimators were statistically significant at 1 per cent (Table A.8) which agrees with
the findings of Judith (2014) and Caliendo & Kopenig (2005) that the three estimators should
give similar results with only slight differences based on the efficiency of the matching estimator
involved. These findings show that the FGP had a positive impact on the youth empowerment.
5.0 Conclusion and Policy Recommendations
This paper used a case study of the Fadama GUYS programme (FGP) conducted in 2017 to
evaluate the impacts of agribusiness programmes on youth empowerment. To measure the
impacts of the programme on the outcome variable, the propensity score matching (PSM)
method was used. After controlling for all confounding factors, the causal impact estimation
from the PSM showed that participants of the FGP have significantly higher empowerment index
score compared to the non-participants. Also, result from the sensitivity analysis on hidden bias,
which shows the critical levels of gamma at which the causal inference of significant impact of
18
participation in the FGP may be questioned implies that the impact estimate is robust against
hidden bias.
The results from this analysis generally confirms the potential direct impact of agribusiness
programmes on improving youth empowerment. It is believed that these programmes are likely
to inspire young people to engage in agribusiness as well as enable them to acquire the relevant
skills required as an agripreneur, thereby, opening up employment opportunities and sustainable
means to generate income. The policy implication of our result is that government, development
partners and other stakeholders should consider agribusiness programmes as one of the priority
interventions and strategies of youth empowerment.
Funding
This research is funded by the International Fund for Agricultural Development (IFAD) under
the grant number 2000001374 “Enhancing Capacity to Apply Research Evidence (CARE) in
Policy for Youth Engagement in Agribusiness and Rural Economic Activities in Africa” Project
in the International Institute of Tropical Agriculture (IITA).
19
References
Adebayo, O., Bolarin, O., Oyewale, A., & Kehinde, O. (2018). Impact of irrigation technology
use on crop yield, crop income and household food security in Nigeria: A treatment effect
approach. AIMS Agriculture and Food, 3(2), 154–171.
http://doi.org/10.3934/agrfood.2018.2.154
Ahmed, B., & Haji, J. (2014). Impact of Small-Scale Irrigation on Farm Households’ Technical
Efficiency: The Case of Eastern Oromia, Ethiopia. Asian Journal of Agricultural Biology,
2(4), 224–234.
Ali, M. A., & Salisu, Y. (2019). Women Entrepreneurship and Empowerment Strategy for
National Development. Journal of Economics, Management and Trade, 1–13.
Alsop, R., & Heinsohn, N. (2005). Measuring empowerment in practice: Structuring analysis
and framing indicators. The World Bank.
Antony, G. M., & Visweswara Rao, K. (2007). A composite index to explain variations in
poverty, health, nutritional status and standard of living: Use of multivariate statistical
methods. Public Health, 121(8), 578–587. http://doi.org/10.1016/J.PUHE.2006.10.018
Asfaw, S., & Shiferaw, B. (2010). Agricultural Technology Adoption and Rural Poverty:
Application of an Endogenous Switching Regression for Selected East African Countries. In
3rd African Association of Agricultural Economists (AAAE) and 48th Agricultural
Economists Association of South Africa (AEASA) Conference, Cape Town, South Africa (pp.
12–23).
Austin, P. C. (2014). A comparison of 12 algorithms for matching on the propensity score.
Statistics in Medicine, 33(6), 1057–1069. http://doi.org/10.1002/sim.6004
Awogbenle, A. C., & Iwuamadi, K. C. (2010). Youth unemployment: Entrepreneurship
development programme as an intervention mechanism. African Journal of Business
Management, 4(6), 831–835.
Balde, B., Diawara, M., Rossignoli, C., & Gasparatos, A. (2019). Smallholder-Based Oil Palm
and Rubber Production in the Forest Region of Guinea: An Exploratory Analysis of
Household Food Security Outcomes. Journal of Agriculture, 9(2), 41.
http://doi.org/10.3390/agriculture9020041
Bartlett, J. E., Kotrlik, J. W., & Higgins, C. C. (2001). Organizational Research: Determining
Appropriate Sample Size in Survey Research. Information Technology, Learning, and
Performance Journal, 19(1), 43–50. http://doi.org/10.1007/BF00471876
Caliendo, M., & Kopeinig, S. (2008). Some Practical Guidance for the Implementation of
Propensity Score Matching. Journal of Economic Surveys, 22(1), 31–72.
http://doi.org/10.1111/j.1467-6419.2007.00527.x
Caliendo, M., & Kopenig, S. (2005). Some Practical Guidance for the Implementation of
Propensity Score Matching (Discussion Paper Series No. No. 1588). IZA Discussion Paper.
Bonn Germany. Retrieved from
http://ftp.iza.org/dp1588.pdf%5Cnpapers3://publication/uuid/B68613C9-4FF0-4002-B086-
20
60831932B7D5
El-Shater, T., Yigezu, A., Mugera, A., Piggin, C., Haddad, A., Khalil, Y., & Aw-Hassan, A.
(2015). Livelihoods Effects of Zero Tillage among Small and Medium Holder Farmers in
the Developing World. In 89th Annual Conference of the Agricultural Economics Society,
University of Warwick, England (pp. 1–30). Warwick.
Emeh, I., & Eke, J. (2012). Tackling Youth Unemployment in Nigeria: The Lagos State
Development and Empowerment Programmes Initiatives. Afro Asian Journal of Social
Sciences, 3(34), 2229–5313.
Haji, J., & Legesse, B. (2017). Impact of sedentarization program on the livelihood and food
security of Ethiopian pastoralists. Journal of Arid Environments, 136, 45–53.
http://doi.org/10.1016/j.jaridenv.2016.10.007
Heckman, J. J., Ichimura, H., & Todd, P. (1998). Matching as an econometric evaluation
estimator. The Review of Economic Studies, 65(2), 261–294.
Hope, K. R. (2012). Engaging the youth in Kenya: Empowerment, education, and employment.
International Journal of Adolescence and Youth, 17(4), 221–236.
http://doi.org/10.1080/02673843.2012.657657
Hujer, R., Caliendo, M., & Thomsen, S. L. (2004). New evidence on the effects of job creation
schemes in Germany - A matching approach with threefold heterogeneity. Research in
Economics, 58(4), 257–302. http://doi.org/10.1016/j.rie.2004.07.001
Ibrahim, A. I. (2013). Youth empowerment and development drive: An invaluable step to secure
Nigeria’s future prosperity. Unpublished Essay, CIPMN, Nigeria.
Inegbenebor, A., & Ogunrin, F. (2011). Entrepreneurial attitudes and intentions among Nigerian
undergraduates. Ghana Journal of Development Studies, 7(2), 67–81.
http://doi.org/10.4314/gjds.v7i2.66883
International Labour Office. (2018). Women’s and Youth Empowerment in Rural Tunisia-An
assessment using the Women’s Empowerment in Agriculture Index (WEAI). Geneva.
Judith, M. (2014). Impact of World Food Programme’s Purchase for Progress Pilot Project on
Farm Incomes in Uasin Gishu and Narok counties, Kenya. University of Nairobi.
Maigida, J. F., Saba, T. M., & Namkere, J. U. (2013). Entrepreneurial skills in technical
vocational education and training as a strategic approach for achieving youth empowerment
in Nigeria. International Journal of Humanities and Social Science, 3(5), 303–310.
Meredith, K. L., Lucas, B., Dairaghi, J., & Ravelli, P. (2013). Youth Empowerment: The theory
and its implementation.
Muiruri, M. P. D. (2015). Mapping of the Honey Value Chain and Analysis of Changes in
Gender Roles and Factors Infuencing Women Empowerment among Beekeepers in Kitui
County, Kenya. University of Nairobi.
Mutuku, C. M. (2011). Youth Perspectives on their Empowerment in Sub-Saharan Africa: The
Case of Kenya. Kent State University.
21
National Bureau of Statistics. (2011). Annual Abstract of Statistics. Retrieved April 15, 2019,
from www.nigerianstat.gov.ng,
National Bureau of Statistics. (2018). Labor Force Statistics Unemployment and
Underemployment Report.
Nigeria Youth Policy Document. (2009). Second National Youth Policy. Retrieved from
http://nigeria.unfpa.org/pdf/snyp2009.pdf
Odeh, M. A., & Okoye, C. O. (2014). Poverty reduction policy and youth unemployment in
Nigeria. Public Policy and Administration Research, 3(4), 92–103.
Okoli, D. I., & Okoli, E. I. (2013). Youth Empowerment through Entrepreneurial Development
in Nigeria. Journal of Educational and Social Research, 19, 224–233.
http://doi.org/10.5901/jesr.2013.v3n9p147
Radicic, D., Pugh, G., & Douglas, D. (2014). Evaluating the effectiveness of public support on
inbound open innovation: evidence from Spanish manufacturing SMEs, 44(0), 1–33.
http://doi.org/10.13140/2.1.3714.1768
Sianesi, B. (2002). An Evaluation of the Swedish system of active labour network programmes
in the 1990s. The Review of Economics and Statistics, 86(1), 133–155.
United Nation. (2014). Impact of access to financial services, including by highlighting
remittances on development: Economic empowerment of women and youth. In Impact of
Access to Financial Services, including by Highlighting Remittances on Development:
Economic Empowerment of Women and Youth (Vol. 6). Geneva.
United Nations Development Programme. (2018). National Human Development Report 2018.
United Nations Development Programme. Abuja, Nigeria.
Yami, M., Feleke, S., Abdoulaye, T., Alene, A., Bamba, Z., & Manyong, V. (2019). African
Rural Youth Engagement in Agribusiness: Achievements, Limitations, and Lessons.
Sustainability, 11(1), 185.
Yusuf Alhaji Hashim, P. (2014). Examining the Adequacy of National Open Apprenticeship
Scheme in Training Youth for Economic Empowerment in Nigeria\n. IOSR Journal of
Business and Management (IOSR-JBM), 16(10), 54–59. http://doi.org/10.9790/487X-
161025459
22
APPENDICES
Appendix 1:
TABLE A. 1: INDICATORS OF EMPOWERMENT
Six Domains of
Empowerment (6DE)
Indicators Policy issues that are
generally triggered
Access and decision to credit 1. Decision on use of credit
2. Decisions on source of credit
3. Credit repayment ability Economic empowerment
Asset ownership 4. Personal assets
5. Agricultural (Productive) assets
Youth Livelihood 6. Personal living condition (rated
between 1 and 10)
7. Household living condition
8. contribution to HH income
9. life contentment ( rated between 1
and 10) Economic
empowerment, Social
capital, Decision-making
and representation
Financial Freedom 10.Consistent source of income
11. Control over use of income
12. Dependence on family for basic
needs
Group Membership 13. Membership of association
Relationship 14. Closeness to family members
15. Relationship with family
Source: Author’s computation from existing literature on Youth and Women Empowerment
23
TABLE A. 2: COMPARISON OF THE PERFORMANCE OF MATCHING ESTIMATORS
Matching
Algorithm
Number of
Insignificant
variables after
matching
Pseudo R2 after
matching
Matched
sample size
Mean SB
Nearest Neighbour Matching
1 11 0.012 941 4.9
2 12 0.009 941 4.7
3 12 0.007 941 4.7
4 12 0.005 941 4.1
Kernel Matching
No Bandwidth 12 0.009 941 4.9
0.01 12 0.007 922 4.7
0.05 12 0.009 941 5.3
Caliper Matching
0.01 11 0.009 922 4.1
0.05 11 0.012 941 4.9
0.25 11 0.012 941 4.9
Source: survey data (2019) using pstest
TABLE A. 3: MEAN OF ESTIMATED PROPENSITY SCORES
Group Observation Mean Min Max
Total Respondents 977 0.466 0.010 0.971
Participants 455 0.634 0.059 0.971
Non-participants 522 0.319 0.010 0.923
Source: survey data (2019) using pscore
24
TABLE A. 4: COVARIATE BALANCING TESTS FOR SELECTION BIAS AFTER MATCHING FOR NNM
Variable Unmatched Mean %bias %reduction
bias
t-test p>t
Matched Treated Control
Age Unmatched 27.33 24.33 69.9 10.92 0.000
Matched 26.89 27.13 -5.6 91.9 -0.77 0.440
Years of Formal
Education
Unmatched 14.48 13.77 24.1 3.78 0.000
Matched 14.34 14.49 -5.1 79.0 -0.76 0.445
Gender (Male =1) Unmatched 0.65 0.68 -6.2 -0.96 0.337
Matched 0.67 0.69 -3.3 46.4 -0.48 0.631
Marital Status
(Married =1)
Unmatched 0.40 0.14 59.1 9.32 0.000
Matched 0.35 0.34 2.2 96.2 0.29 0.772
Household size Unmatched 5.63 6.49 -26.1 -4.03 0.000
Matched 5.79 5.99 -6.0 77.1 -1.04 0.297
Ownership of
Agribusiness (Yes=1)
Unmatched 0.43 0.10 82.0 13.00 0.000
Matched 0.39 0.39 1.2 98.6 0.14 0.888
Migration status
(Migrated =1)
Unmatched 0.65 0.63 4.4 0.68 0.498
Matched 0.65 0.68 -5.4 -23.1 -0.79 0.432
Agribusiness Intention
(Yes =1)
Unmatched 3.67 2.55 95.8 14.90 0.000
Matched 3.59 3.56 2.7 97.2 0.41 0.678
Productive asset index
score
Unmatched 4.68 4.35 12.9 1.99 0.046
Matched 4.62 4.47 6.0 53.0 0.89 0.372
Perception about
training (Positive =1)
Unmatched 0.92 0.84 25.6 3.95 0.000
Matched 0.92 0.92 -2.4 90.6 -0.41 0.679
Perception about
agribusiness (Positive
=1)
Unmatched 0.90 0.80 30.6 4.72 0.000
Matched 0.89 0.88 5.6 81.8 0.89 0.372
Head of Household
Years of schooling
Unmatched 14.76 14.02 21.1 3.30 0.001
Matched 14.54 14.65 -3.4 83.9 -0.55 0.584
Source: survey data (2019) using pstest
25
TABLE A. 5: COVARIATE BALANCING TESTS FOR SELECTION BIAS AFTER MATCHING FOR CBM
Variable Unmatched Mean %bias %reduction
bias
t-test p>t
Matched Treated Control
Age Unmatched 27.33 24.33 69.9 10.92 0.000
Matched 26.79 27.10 -7.3 89.6 -0.97 0.333
Years of Formal
Education
Unmatched 14.48 13.77 24.1 3.78 0.000
Matched 14.36 14.45 -2.9 88.0 -0.42 0.675
Gender
(Male =1)
Unmatched 0.65 0.68 -6.2 -0.96 0.337
Matched 0.67 0.68 -2.1 65.5 -0.30 0.763
Marital Status
(Married =1)
Unmatched 0.40 0.14 59.1 9.32 0.000
Matched 0.34 0.29 12.9 78.2 1.68 0.094
Household size
Unmatched 5.63 6.49 -26.1 -4.03 0.000
Matched 5.82 5.98 -4.7 82.1 -0.77 0.442
Ownership of
Agribusiness (Yes=1)
Unmatched 0.43 0.10 82.0 13.00 0.000
Matched 0.38 0.38 -0.6 99.3 -0.07 0.942
Migration status
(Migrated =1)
Unmatched 0.65 0.63 4.4 0.68 0.498
Matched 0.66 0.65 2.1 52.0 0.30 0.767
Agribusiness Intention
(Yes =1)
Unmatched 3.67 2.55 95.8 14.90 0.000
Matched 3.57 3.55 1.9 98.0 0.29 0.773
Productive asset index
score
Unmatched 4.68 4.35 12.9 1.99 0.046
Matched 4.60 4.45 5.9 54.4 0.86 0.393
Perception about
training (Positive =1)
Unmatched 0.92 0.84 25.6 3.95 0.000
Matched 0.92 0.91 1.6 93.9 0.25 0.803
Perception about
agribusiness (Positive
=1)
Unmatched 0.90 0.80 30.6 4.72 0.000
Matched 0.89 0.88 4.2 86.1 0.66 0.511
Head of Household
Years of schooling
Unmatched 14.76 14.02 21.1 3.30 0.001
Matched 14.52 14.63 -3.2 84.8 -0.49 0.625
Source: survey data (2019) using pstest
26
TABLE A. 6: COVARIATE BALANCING TESTS FOR SELECTION BIAS AFTER MATCHING FOR KBM
Variable Unmatched Mean %bias %reduction
bias
t-test p>t
Matched Treated Control
Age
Unmatched 27.33 24.33 69.9 10.92 0.000
Matched 26.79 27.14 -8.3 88.2 -1.10 0.271
Years of Formal
Education
Unmatched 14.48 13.77 24.1 3.78 0.000
Matched 14.36 14.55 -6.6 72.7 -0.99 0.322
Gender
(Male =1)
Unmatched 0.65 0.68 -6.2 -0.96 0.337
Matched 0.67 0.69 -3.3 45.8 -0.48 0.635
Marital Status
(Married =1)
Unmatched 0.40 0.14 59.1 9.32 0.000
Matched 0.34 0.32 4.5 92.4 0.58 0.565
Household size
Unmatched 5.63 6.49 -26.1 -4.03 0.000
Matched 5.82 6.03 -6.1 76.6 -1.03 0.304
Ownership of
Agribusiness (Yes=1)
Unmatched 0.43 0.10 82.0 13.00 0.000
Matched 0.38 0.36 3.7 95.5 0.44 0.661
Migration status
(Migrated =1)
Unmatched 0.65 0.63 4.4 0.68 0.498
Matched 0.66 0.67 -3.3 24.7 -0.47 0.639
Agribusiness
Intention (Yes =1)
Unmatched 3.67 2.55 95.8 14.90 0.000
Matched 3.57 3.52 4.2 95.6 0.64 0.526
Productive asset
index score
Unmatched 4.68 4.35 12.9 1.99 0.046
Matched 4.60 4.41 7.2 44.2 1.04 0.297
Perception about
training (Positive =1)
Unmatched 0.92 0.84 25.6 3.95 0.000
Matched 0.92 0.92 -3.1 88.0 -0.51 0.608
Perception about
agribusiness (Positive
=1)
Unmatched 0.90 0.80 30.6 4.72 0.000
Matched 0.89 0.88 2.6 91.4 0.41 0.679
Head of Household
Years of schooling
Unmatched 14.76 14.02 21.1 3.30 0.001
Matched 14.52 14.66 -3.9 81.4 -0.63 0.531
Mean bias Pseudo-R2 p>chi2 Gamma
27
Table A. 7: Indicators of Matching Quality and Robustness of Results
Source: survey data (2019) using pstest
TABLE A. 8: IMPACT OF THE PROGRAMME ON YOUTH EMPOWERMENT
Source: survey data (2019) using pstest
Matching
algorithms
Before After % bias
reduction
Unmatched Matched Unmatched Matched
NNM 38.1 4.1 89 0.26 0.005 0.000 0.930 2.90-2.95
KBM 38.1 4.7 87 0.26 0.007 0.000 0.840 2.90-2.95
CBM 38.1 4.1 89 0.26 0.009 0.000 0.597 2.90-2.95
Outcome
variable
Matching
algorithm
Treated Control ATT
(Difference)
Std.
Error
t-value
Youth
Empowerment
Index
NNM 6.416 5.692
0.724 0.116 6.25***
CBM 6.393
5.557 0.836 0.134 6.24***
KBM 6.393 5.608 0.784 0.112 7.03***
28
Appendix 2: Common Support Graphs
FIGURE A. 1: COMMON SUPPORT GRAPH FOR NNM ALGORITHM
Source : Stata Output, generated from Field Survey data using Psgraph, 2019
FIGURE A. 2: COMMON SUPPORT GRAPH FOR KBM ALGORITHM
Source : Stata Output, generated from Field Survey data using Psgraph, 2019
FIGURE A. 3: COMMON SUPPORT GRAPH FOR CBM ALGORITHM
Source : Stata Output, generated from Field Survey data using Psgraph, 2019
0 .2 .4 .6 .8 1Propensity Score
Untreated Treated: On support
Treated: Off support
0 .2 .4 .6 .8 1Propensity Score
Untreated Treated: On support
Treated: Off support
0 .2 .4 .6 .8 1Propensity Score
Untreated Treated: On support
Treated: Off support