impact of asset liability management for the growth · pdf fileimpact of asset liability...
TRANSCRIPT

IJER © Serials Publications13(1), 2016: 347-360
ISSN: 0972-9380
IMPACT OF ASSET LIABILITY MANAGEMENTFOR THE GROWTH OF SELECTED PRIVATESECTOR BANKS IN INDIA
K. Balanagagurunathan1, M. Selvaraj2 and S. Sathyakala3
Abstract: The bank plays an important role in mobilization of deposits and disbursementof credit to various classes of customers in the economy. The financial strength of the bankis the first line of defense against financial risks. The banks should be smart enough toprotect themselves against the financial risks. As we all know the primary source of fundsfor the bank is coming from customers as deposits and majority of the deposits are shortterm in nature and results in shortest maturity period. On the other side banks usuallyprovide loans which are long term in nature leads to longest maturity. The risk for thebanks starts at this juncture. The situation of providing long term loan with short maturityfunds is called as Asset liability mismatch and managing this mismatches by the bank isAsset liability management. The Asset Liability Management (ALM) process in a bank ismultidimensional in nature. The objective of this research is to find the relative importanceof rate sensitivity assets, rate sensitivity liabilities, interest sensitivity ratio, net interestincome ratio, net interest margin ratio in managing the mismatches of the selected top 5private sector banks in India like ICICI Bank, HDFC Bank, City Union Bank, KarnatakaBank and Lakshmi Vilas Bank. For this study, the secondary data has been collected fromCapitaline between 2004-05 and 2013-14. For examining the asset liability management ofthe selected banks, Rate sensitivity assets, Rate sensitivity liabilities, Interest SensitivityRatio, Net Interest Income Ratio, Net Interest Margin Ratio and Gap Analysis have beencalculated and to examine its impact with the help of mean, standard deviation and co-efficient of variation. The graphical representation of the result is also included in analysis.The research found that ICICI recorded positive gap and HDFC, Karnataka Bank, CityUnion Bank, Lakshmi Vilas Bank have negative gap. The study also suggested the Banks totake necessary steps to reduce the asset liability mismatches that will lift the bank to retainits market in the public.
Key Words: Asset Liability Management, Private Sector Banks, RSA, RSL, NII, GAPanalysis.
1 Professor in Finance, Alliance School of Business2 Joint Director, Sona college of Technology3 Assistant Professor, Sona college of Technology

348 K. Balanagagurunathan, M. Selvaraj and S. Sathyakala
1. INTRODUCTION
Asset Liability Management (ALM) is a comprehensive and dynamic framework formeasuring, monitoring and managing the market risk of a bank. The management of(liabilities and assets) in a structured way so that the net earnings from interest ismaximized within the overall risk-preference of the institutions is normally referredas ALM. The ALM has diverse functions which includes management of Credit riskInterest rate risk, Liquidly risk, Market risk and so on. The concept of ALM is of recentorigin in India and it has been introduced in Indian Banking industry with effect from1st April, 1999. ALM is dynamic in nature and it needs to be closely integrated withthe banks’ business strategy.
Banks provide various services which results in various kinds of risks also. Themajor risks associated with banks are credit risk, interest risk and liquidity risk. Assetliability management is an approach that provides institutions with protection andhelps the bank to accept the risk at tolerant level. Asset-liability management modelsprovide suitable strategies for bank’s efficient management. The Reserve Bank of India(RBI) has implemented the Basel norms for the regulation of Indian banks whichprovided a framework for banks to develop sound ALM policies. It is a first step inthe long-term strategic planning process so it can be considered as a planning functionfor an intermediate term.
2. RELATED REVIEWS
According to Prasad (2013), the Asset-Liability Management (ALM) is concerned withstrategic management of assets and liabilities of banks, against risks caused by changesin the liquidity position of the bank, interest rates, and exchange rates, and againstcredit risk and contingency risk. The authors suggested that An effective ALMtechnique aims to manage the volume, mix, maturity, rate sensitivity, quality andliquidity of the assets and liabilities as a whole so as to attain a predetermined acceptablerisk/reward ratio.
Amit Kumar Meena and Joydip Dhar (2014) reported in their research on theanalysis and comparison of liquidity ratios and asset liability management practicesin top three banks from public, private and foreign sector in India. The analysis isbased upon the liquidity ratios calculation and the determination of maturity gapprofiles for the banks under study. The research also compares these banks maturitygap profiles with their corresponding group’s maturity gap profiles. Also, theyidentified the interest rate sensitivity of the balance sheet items of these banks todetermine the gap between rate sensitive assets and rate sensitive liabilities. The resultsof this research suggest that overall banks in India have very good short term liquidityposition and all banks are financing their short term liabilities by their long termassets.

Impact of Asset Liability Management for the Growth of Selected Private Sector... 349
Giokas, D., and Vassiloglou, M. (1991) Asset and liability management is one ofthe most important issues in bank strategic planning. In the past, this problem hasoften been addressed through conventional mathematical programming, i.e. linearprogramming. However, bank management typically involves several conflicting goals,such as the maximisation of returns, minimisation of risk, expansion of deposits andloans, etc. The complexity of this problem can be captured more adequately by multiobjective mathematical programming. This paper discusses the construction andapplication at the Commercial Bank of Greece of a goal programming model thattakes into account the essential institutional, financial, legal and bank policyconsiderations.
Narayanan (2014) observed that Asset-Liability Management (ALM) is a frameworkfor measuring, monitoring and managing the market risk of a bank. Author furtherfound in the research that all transactions of the banks revolve around to raise and todeploy the funds, ALM gains more significance as an initiative towards the riskmanagement practices by the Indian banks. Author also inferred risks and maintainingAsset Quality so as to ensure profitability with the help of ALM techniques and theeffectiveness of Asset Liability Management plays a vital role to the progress anddevelopment of the Indian banking sector in particular and the economy in general.
Clarke (2009) Asset/liability management is the art of structuring a bank’s balancesheet to take advantage of the current environment and to be successful as the economyand interest rates change. This article focuses on the interest rate environment, whichshould be “Job One” for most ALCOs. In the fall of 2007, the subprime crisis surfacedand the economy began to weaken. On Sep 18, 2007, the Federal Reserve took the firststep in what would be a substantial lowering of short-term interest rates. Liability-sensitive banks benefit as rates fall, as was the case in 2008, but experience a decliningmargin when rates rise. With all the problems facing banks, especially the largestbanks, there are opportunities for the ALCO to consider, but also some unique threats.The past few years have kept ALCO members on their toes, but 2009 and 2010 may bethe toughest test they have faced in three decades.
3. OBJECTIVES OF THE STUDY
• To explore the Asset Liability Management for the selected private sectorbanks in India.
• To identify the performance of the selected private sector banks through gapanalysis.
4. RESEARCH DESIGN
The study considered top 5 private sector banks in India viz., ICICI Bank, HDFC Bank,City Union Bank, Karnataka Bank and Lakshmi Vilas Bank which are having the highestnet profit during the study period of 2004-05 to 2013-14. The financial data havecollected from Capitaline database.

350 K. Balanagagurunathan, M. Selvaraj and S. Sathyakala
5. TOOLS USED
The tools employed in this study to understand the impact of ALM in determininingthe banks profitability condition are
• Rate Sensitivity Assets
• Rate Sensitivity Liabilities
• Interest Sensitivity Ratio
• Net Interest Income Ratio
• Net Interest Margin Ratio
• Gap Analysis
The statistical tools like mean, standard deviation, co-efficient of variation hasalso been used.
6. RESULTS AND DISCUSSION
6.1 Rate Sensitivity Assets
Assets held by a bank that are vulnerable to changes in interest rates. This change canoccur either when the asset matures or when it is repriced according to an index rate.The value of these assets is adjusted according to the rise or fall of a published rate orindex. Rate sensitivity assets have been calculated through the addition of advancesand investments and the results are discussed in the following table.
Rate Sensitivity Assets = Advances + Investments
Table 1Rate Sensitivity Assets (in Crores)
Year ICICI HDFC City Union Bank Karnataka Bank LVB
2004-05 141892.50 44916.11 3115.20 10843.16 3498.572005-06 217710.50 63455.22 3607.01 13340.15 4232.692006-07 287123.44 77509.58 4636.23 14600.84 4922.002007-08 337070.42 112820.44 6255.02 16805.68 5552.472008-09 321369.16 157700.60 8042.71 20771.54 7108.892009-10 302098.40 184438.21 10043.89 24427.73 9260.722010-11 351051.86 230912.04 12871.69 28854.41 11613.272011-12 413287.70 292902.94 16723.65 33561.93 14583.802012-13 461643.04 351334.24 20512.86 38640.16 16027.352013-14 515724.47 423951.34 22050.40 43572.27 18577.87Mean 334897.15 193994.07 10785.87 24541.79 9537.76SD 110402.50 128932.86 6975.43 11288.69 5389.17CV (%) 32.97 66.46 64.67 46.00 56.50
Source: Annual Report of the respected banks.

Impact of Asset Liability Management for the Growth of Selected Private Sector... 351
The mean value of rate sensitivity assets of ICICI is Rs. 334897.15 crores, HDFC isRs. 193994.07 crores, City Union Bank is Rs. 10785.87 crores, Karnataka Bank is Rs.24541.79 crores and LVB is Rs. 9537.76 crores. During the study period, all the selectedbanks accounted fluctuating trend. The co-efficient of variation of rate sensitivity assetsendowed by 32.97 per cent in ICICI followed by 66.46 per cent in HDFC, 64.67 percent in City Union Bank, 46.00 per cent in Karnataka Bank and 56.50 per cent in LVB.It clears that the rate sensitivity assets of 32.97 per cent in ICICI is constant against66.46 per cent in HDFC. All other selected private sector banks’ rate sensitivity assetsare moderate during the study period. The pictorial representation of the rate sensitivityassets is given below.
Chart 1Rate Sensitivity Assets
6.2 Rate Sensitivity Liabilities
The short-term deposit held by a bank pays a variable rate of interest to the customer.Interest sensitive liabilities include money market certificates, savings accounts andthe super now account. The rate sensitivity liabilities have been calculated by usingthe following formula and results are discussed in the following table.
Rate Sensitivity Liabilities = Deposits + Borrowings

352 K. Balanagagurunathan, M. Selvaraj and S. Sathyakala
Table 2Rate Sensitivity Liabilities (in Crores)
Year ICICI HDFC City Union Bank Karnataka Bank LVB
2004-05 133363.28 41644.26 3117.43 11080.72 3564.872005-06 203605.08 60357.30 3592.92 13425.85 4341.682006-07 281766.22 71113.33 4719.22 14458.18 5099.622007-08 310079.48 105247.46 6427.60 17158.39 5671.282008-09 285671.51 145497.42 8206.77 20337.26 7393.502009-10 296280.17 180320.13 10324.62 24072.29 9409.312010-11 335156.39 222980.47 13100.44 28422.78 11874.622011-12 395664.87 270552.96 16689.46 32755.39 14694.142012-13 437955.12 329253.58 20781.50 37635.98 16098.982013-14 486672.71 406776.47 22321.87 42498.02 19030.98Mean 316621.48 183374.34 10928.18 24184.49 9717.90SD 104995.40 122804.71 7041.19 10821.73 5444.99CV (%) 33.16 66.97 64.43 44.75 56.03
Source : Annual Report of the respected banks.
The mean value of rate sensitivity liabilities of ICICI is Rs. 316621.48 crores, HDFCis Rs. 183374.34 crores, City Union Bank is Rs. 10928.18 crores, Karnataka Bank is Rs.24184.49 crores and LVB is Rs. 9717.90 crores. During the study period, the selectedbanks viz., HDFC, City Union Bank, Karnataka Bank and LVB accounted fluctuatingtrend except ICICI. The co-efficient of variation of rate sensitivity liabilities endowedby 33.16 per cent in ICICI followed by 66.97 per cent in HDFC, 64.43 per cent in CityUnion Bank, 44.75 per cent in Karnataka Bank and 56.03 per cent in LVB. It clears thatthe rate sensitivity liabilities of ICICI as 33.16 percent is constant and on the otherhand fluctuating in HDFC as 66.97 percent. The other selected private sector banks’rate sensitivity liabilities are moderate during the study period. The pictorialrepresentation of the rate sensitivity liabilities is given below.
6.3 Interest Sensitivity Ratio
A measure of how much the price of a fixed-income asset will fluctuate as a result ofchanges in the interest rate environment. Securities that are more sensitive will havegreater price fluctuations than those with less sensitivity. Normally this type ofsensitivity must be taken into account when selecting a bond or other fixed-incomeinstrument that the investor may sell in the secondary market. The interest sensitivityratio is calculated by using following formula and the results are discussed in thefollowing table.
Interest Sensitivity Ratio = Rate Sensitivity Assets/Rate Sensitivity Liability
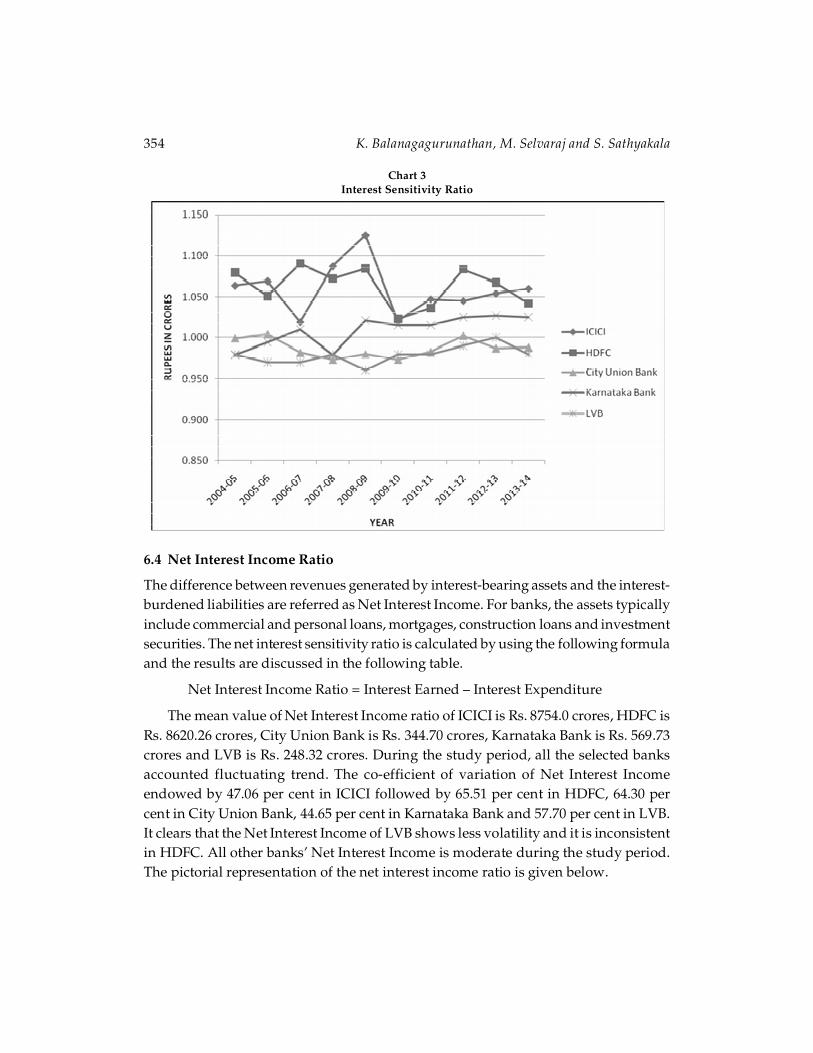
The mean value of interest sensitivity ratio of ICICI is 1.06 times, HDFC is 1.06times, City Union Bank is 0.99 times, Karnataka Bank is 1.01 times and LVB is 0.98times. It is evident that all the banks are fluctuating regard o sensitivity ratio. Theco-efficient of variation of interest sensitivity ratio endowed by 2.95 per cent in ICICIfollowed by 2.18 per cent in HDFC, 1.14 per cent in City Union Bank, 1.83 per cent in

Impact of Asset Liability Management for the Growth of Selected Private Sector... 353
Chart 2Rate Sensitivity Liabilities
Table 3Interest Sensitivity Ratio (in Times)
Year ICICI HDFC City Union Bank Karnataka Bank LVB
2004-05 1.064 1.079 0.999 0.979 0.982005-06 1.069 1.051 1.004 0.994 0.972006-07 1.019 1.090 0.982 1.010 0.972007-08 1.087 1.072 0.973 0.979 0.982008-09 1.125 1.084 0.980 1.021 0.962009-10 1.020 1.023 0.973 1.015 0.982010-11 1.047 1.036 0.983 1.015 0.982011-12 1.045 1.083 1.002 1.025 0.992012-13 1.054 1.067 0.987 1.027 1.002013-14 1.060 1.042 0.988 1.025 0.98Mean 1.06 1.06 0.99 1.01 0.98SD 0.03 0.02 0.01 0.02 0.01CV (%) 2.95 2.18 1.14 1.83 1.08
Source: Annual Report of the respected banks
Karnataka Bank and 1.08 per cent in LVB. It clears that the interest sensitivity ratio ofLVB as 1.08 percent which is moderate on the other hand ICICI recorded as 2.95 percent.All other selected banks’ interest sensitivity ratio is moderate during the study period.The pictorial representation of the interest sensitivity ratio is given below.
354 K. Balanagagurunathan, M. Selvaraj and S. Sathyakala
6.4 Net Interest Income Ratio
The difference between revenues generated by interest-bearing assets and the interest-burdened liabilities are referred as Net Interest Income. For banks, the assets typicallyinclude commercial and personal loans, mortgages, construction loans and investmentsecurities. The net interest sensitivity ratio is calculated by using the following formulaand the results are discussed in the following table.
Net Interest Income Ratio = Interest Earned – Interest Expenditure
The mean value of Net Interest Income ratio of ICICI is Rs. 8754.0 crores, HDFC isRs. 8620.26 crores, City Union Bank is Rs. 344.70 crores, Karnataka Bank is Rs. 569.73crores and LVB is Rs. 248.32 crores. During the study period, all the selected banksaccounted fluctuating trend. The co-efficient of variation of Net Interest Incomeendowed by 47.06 per cent in ICICI followed by 65.51 per cent in HDFC, 64.30 percent in City Union Bank, 44.65 per cent in Karnataka Bank and 57.70 per cent in LVB.It clears that the Net Interest Income of LVB shows less volatility and it is inconsistentin HDFC. All other banks’ Net Interest Income is moderate during the study period.The pictorial representation of the net interest income ratio is given below.
Chart 3Interest Sensitivity Ratio

Impact of Asset Liability Management for the Growth of Selected Private Sector... 355
Table 4Net Interest Income Ratio (in Crores)
Year ICICI HDFC City Union Bank Karnataka Bank LVB
2004-05 2839.00 1777.93 110.82 316.89 106.662005-06 4187.05 2545.84 139.78 365.97 105.502006-07 6635.79 3709.57 167.49 419.86 130.002007-08 7304.10 5227.88 204.97 469.10 124.132008-09 8366.62 7421.16 242.57 473.57 153.542009-10 8114.36 8386.60 278.14 335.63 249.132010-11 9016.90 10543.13 420.03 612.49 365.002011-12 10734.15 12296.77 499.75 744.01 371.232012-13 13866.42 15811.12 624.01 903.73 392.002013-14 16475.56 18482.63 759.39 1056.07 486.01Mean 8754.00 8620.26 344.70 569.73 248.32SD 4119.63 5647.23 221.65 254.38 143.27CV (%) 47.06 65.51 64.30 44.65 57.70
Source : Annual Report of the respected banks
Chart no. 4Net Interest Income Ratio
6.5 Net Interest Margin Ratio
Net interest margin (NIM) is a measure of the difference between the interest incomegenerated by banks or other financial institutions and the amount of interest paid outto their lenders (for example, deposits), relative to the amount of their (interest-earning)

356 K. Balanagagurunathan, M. Selvaraj and S. Sathyakala
assets. It is similar to the gross margin (or gross profit margin) of non-financialcompanies. It is usually expressed as a percentage of what the financial institutionearns on loans in a time period and other assets minus the interest paid on borrowedfunds divided by the average amount of the assets on which it earned income in thattime period (the average earning assets). The net interest margin ratio is calculated byusing the following formula and the results are discussed in the following table.
Net Interest Margin Ratio = Interest Income – Earning Assets
Table 5Net Interest Margin Ratio (in Times)
Year ICICI HDFC City Union Bank Karnataka Bank LVB
2004-05 2.599 0.045 0.033 0.027 0.0282005-06 2.341 0.042 0.036 0.026 0.0232006-07 2.618 0.049 0.033 0.027 0.0242007-08 2.654 0.047 0.029 0.025 0.0202008-09 3.354 0.047 0.027 0.021 0.0192009-10 3.563 0.046 0.025 0.013 0.0252010-11 3.584 0.046 0.030 0.021 0.0302011-12 3.714 0.045 0.028 0.021 0.0242012-13 4.168 0.048 0.028 0.023 0.0232013-14 4.381 0.045 0.031 0.024 0.024Mean 3.30 0.05 0.03 0.02 0.02SD 0.71 0.00 0.00 0.00 0.00CV (%) 21.54 4.15 11.43 18.47 13.52
Source : Annual Report of the respected banks
The mean value of net interest margin ratio of ICICI is 3.30 times, HDFC is 0.05times, City Union Bank is 0.03 times, Karnataka Bank is 0.02 times and LVB is 0.02times. During the study period, all the selected banks accounted fluctuating trend.The co-efficient of variation of net interest margin ratio accounted by 21.54 per cent inICICI followed by 4.15 per cent in HDFC, 11.43 per cent in City Union Bank, 18.47 percent in Karnataka Bank and 13.52 per cent in LVB. The co-efficient of variation ofHDFC indicates that the Net Interest Margin ratio has less consistent during the studyperiod. I is observed that ICICI has high volatile during the study period. All otherbanks’ net interest margin ratio is moderate during the study period. The pictorialrepresentation of the net interest margin ratio is given below.
6.6 Gap Analysis
Gap analysis is a method that conveys the difference between rate sensitive assets andrate sensitive liabilities over a period of time.
The following table shows the gap analysis of the selected banks during the studyperiod 2004-05 to 2013-14.
Gap Analysis = Rate Sensitivity Assets – Rate Sensitivity Liabilities

Impact of Asset Liability Management for the Growth of Selected Private Sector... 357
Chart 5Net Interest Margin Ratio
Table 6Gap Analysis (in Crores)
Year ICICI HDFC City Union Bank Karnataka Bank LVB
2004-05 8529.2 3271.9 –2.230 –237.560 –66.3002005-06 14105.4 3097.9 14.090 –85.700 –108.9902006-07 5357.2 6396.3 –82.990 142.660 –177.6202007-08 26990.9 7573.0 –172.580 –352.710 –118.8102008-09 35697.7 12203.2 –164.060 434.280 –284.6102009-10 5818.2 4118.1 –280.730 355.440 –148.5902010-11 15895.5 7931.6 –228.750 431.630 –261.3502011-12 17622.8 22350.0 34.190 806.540 –110.3402012-13 23687.9 22080.7 –268.640 1004.180 –71.6302013-14 29051.8 17174.9 –271.470 1074.250 –453.110Mean 18275.7 10619.73 –142.32 357.30 –180.14SD 10357.2 7465.59 124.46 499.56 120.85CV (%) 56.7 70.30 –87.45 139.81 –67.09
It could be found from the above table that among the five selected private sectorbanks ICICI and HDFC Banks are having positive GAP. The Karnataka bank, fromthe period of 2004-05 to 2007-08 recorded negative GAP and remaining years withpositive GAP. In City Union Bank, the years 2005-06 and 2011-12 are with positiveGAP and rest of the years with negative GAP. In LVB, all the years are recorded withnegative GAP.

358 K. Balanagagurunathan, M. Selvaraj and S. Sathyakala
In analyzing with mean values, ICICI, HDFC and Karnataka banks are havingpositive GAP and City Union Bank and LVB are having negative GAP. Whileconsidering the co-efficient of variation, ICICI bank has less volatile and Karnatakabank has more volatile for its GAP during the study period. The pictorial representationof the gap analysis is given below.
Chart 6Gap Analysis
7. FINDINGS
• The Rate Sensitivity assets mean value of all the banks are fluctuating duringthe study period. The rate sensitivity assets are 32.97 per cent in ICICI and66.46 per cent in HDFC.
• It is noticed from the rate sensitivity liabilities that the mean value of all theselected banks are also fluctuating during the study period. The ratesensitivity liabilities are 33.16 per cent in ICICI and 66.97 per cent in HDFC.
• It is observed from the interest sensitivity ratio that the mean value recordedas high in ICICI and HDFC bank and it is lowest in Lakshmi Vilas Bank. Theco-efficient of variation indicates that the interest sensitivity ratio has lessconsistent in Lakshmi Vilas Bank and high volatile in ICICI Bank.
• It could be noticed from the net interest income ratio that the mean valuerecorded as high in ICICI Bank and it is lowest in Lakshmi Vilas Bank. The co-

Impact of Asset Liability Management for the Growth of Selected Private Sector... 359
efficient of variation indicates that the net interest income ratio has lessconsistent in Karnataka bank and HDFC Bank with high volatility.
• It is divulged from the analysis of Net Interest Margin that the mean valuerecorded as high in ICICI Bank and it is lowest in Karnataka Bank andLakshmi Vilas Bank. The co-efficient of variation indicates that the NetInterest Margin ratio has less consistent in HDFC Bank and high volatile inICICI bank.
• It is found from the GAP analysis that the mean values of the ICICI, HDFCand Karnataka banks are having positive GAP and City Union Bank and LVBare having negative GAP. While considering the co-efficient of variation,ICICI bank has less volatile and Karnataka bank has more volatile for its GAPduring the study period.
8. POLICY IMPLICATIONS
• The banks should try to integrate Liquidity management as a part of banksasset liability management. The bank’s asset and liability management policyshould clearly define the role of liquid assets along with setting clear targetsand limits. .
• The banks should reduce the ALM gap by increasing the deposits from thepublic.
• It is suggested that the banks may increase the current account holders fromthe public. These funds can be utilized by the bank to increase their incomewithout any payment of interest to the current account holders.
• The bank should function independent of the Treasury department to trackthe magnitude of various risks on real time basis. It is also recommended tothe selected banks to increase the performance of the asset liabilitymanagement by strictly adhering to the guidelines of RBI.
• It is suggested to the banks to encourage their customers to start cash inCertificate of Deposits (CDs) and other time deposit products with longestmaturity period by providing high interest rate.
• All the selected banks should focus more on reducing the mismatches becauseit creates risks for the banks and it should be addressed immediately.
References
Prasad, G.V., Bhavani, and Veera, D. (2013), Asset and Liability Management in Indian Banks:Emerging Issues. Journal of Venture Capital & Financial Services. 7(1/2), 17-25.
Zhiguo He and Wei Xiong (2013), Delegated asset management, investment mandates, andcapital immobility. Journal of Financial Economics, 107(2013) 239-258.

360 K. Balanagagurunathan, M. Selvaraj and S. Sathyakala
Amit Kumar Meena, Joydip Dhar (2014), An Empirical Analysis and Comparative Study ofLiquidity Ratios and Asset-Liability Management of Banks Operating in India.International Journal of Social, Human Science and Engineering, 8(1), 2014.
Baser, N. (2014), Asset-Liability Management in the Indian Commercial Banks. Asian Journal ofResearch in Banking and Finance, 4(2), 165-177.
Narayan, B. (2014), Asset-Liability Management in the Indian Commercial Banks.