impact of climate change on water resources. anjali p.pdf · impact of climate change on water...
TRANSCRIPT
Impact of Climate Change on Water Resources
XIII Triennial Conference of the Indian Women Scientists’ Association on
“Sustainable Development in India: Role of Science and Technology”
December 3rd, 2016, Vashi, Navi Mubai

The Flow
• Water– Green, Blue and Grey
• Global Perspectives – Developed Countries
– Water for food
• TERI’s initiatives

Hydrological Cycle

Water harvesting has been an age old techniqueExamples from India:
• 10th century AD Chandragiri Fort in the south Indian state of Andhra Pradesh.
• A community well created by Agrasen in Delhi• One of the oldest water harvesting systems is found about
130 km from Pune along Naneghat in the Western Ghats.
There is an evidence of 9000 year old water harvesting system in the mountains of Southern Jordan.


Global Perspectives Developed Countries


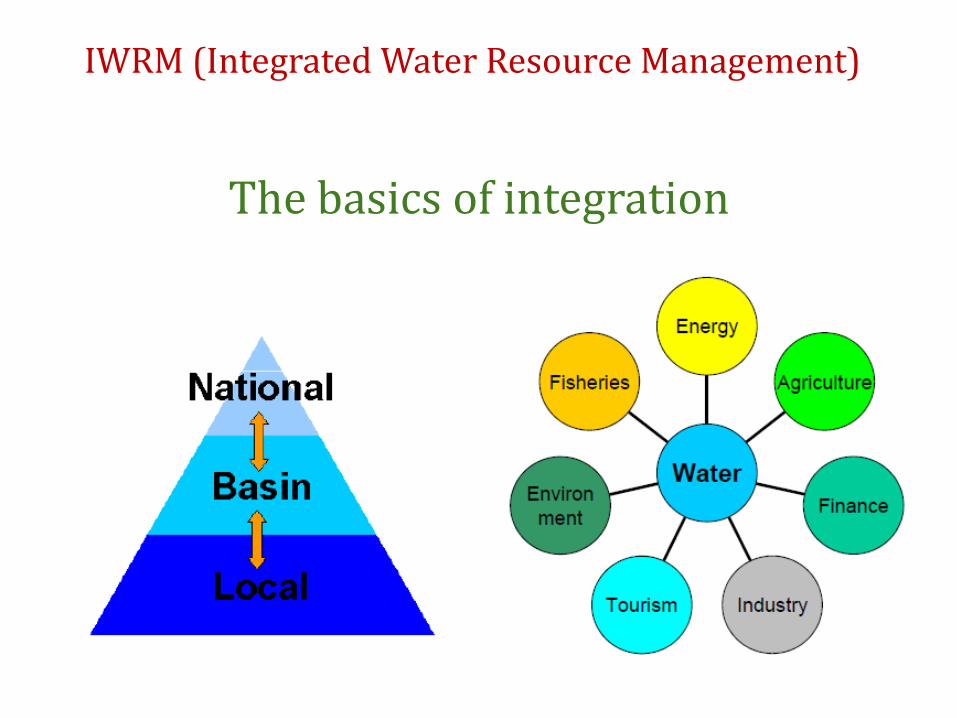
IWRM (Integrated Water Resource Management)
The basics of integration

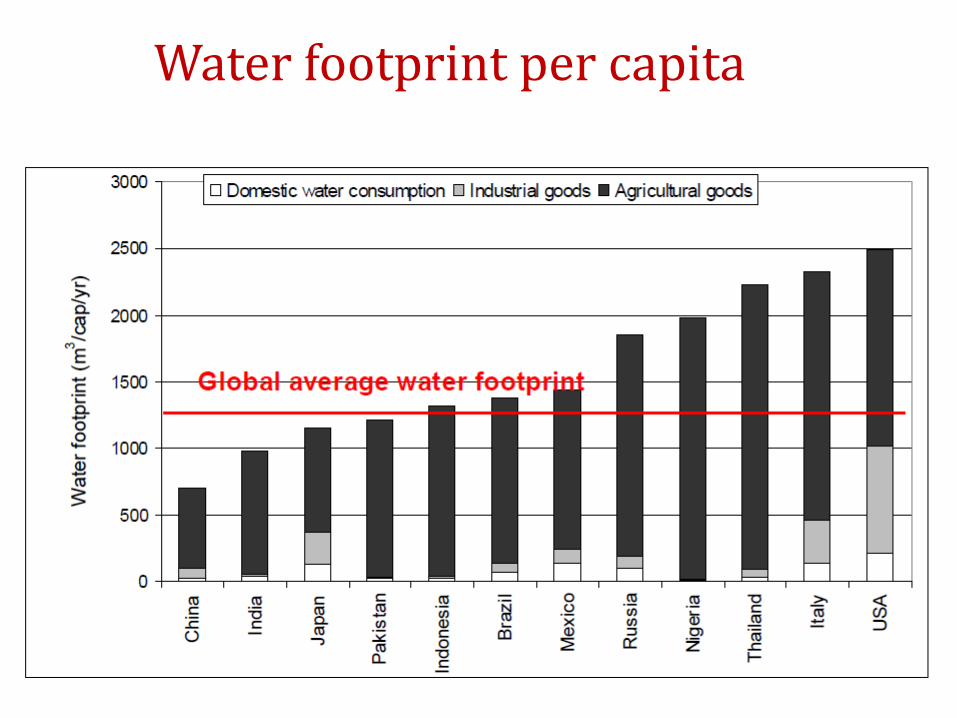
Water footprint per capita


Competing freshwater uses
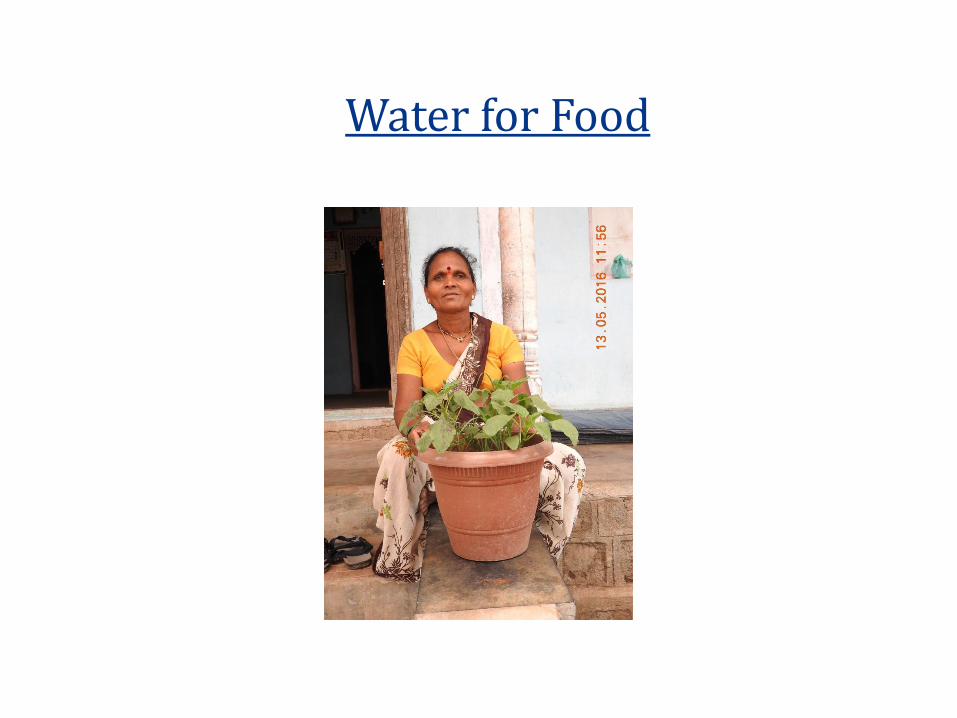
Water for Food

Water for food
Source: http://www.simplesteps.org/photo-essays/how-much-water-does-your-food-consume
0
500
1000
1500
2000
2500
3000
3500
4000
4500
Tea Apple Beer Coffee Wheat Chicken Beef
30
7075 140
1300
3900
15500
Qu
an
tity
of
wa
ter
in l
itre
s
(Wheat, Chicken & Beef in kg)

• Pathardi is the remote tribal village in Mokhada
block of Palghar district, Maharashtra, India with
partial electric supply.
• Accessibility, quality and quantity of water is a
great challenge especially during dry summer
months.
• Women daily fetch more than 80 lit of water per
family from an average distance of 1.5 km, thus
suffering from immense physical stress.
• Scarcity of water and stress discourages them to
cultivate vegetables in their backyard for self-
consumption
• This is one of the major reasons of severe
malnourishment.
Challenges faced by the communities of Pathardi
Women travel long distance
to fetch water

Construction of Man-made Wetland to recycle grey water
The concept of Manmade-wetland was introduced effectively through
installation of grey-water treatment system at household level.
Achieved benefits:
• Making water available for
growing veggies evenduring the dry season.
• Provide water for
secondary purposes.
• Minimize the trips of
fetching water for
secondary purposes.
• The requirement of
fetching water was
reduced by 40%.
Women carrying liters of water for
the family.
Food grown in the backyard -A sustainable initiative

Global Perspectives
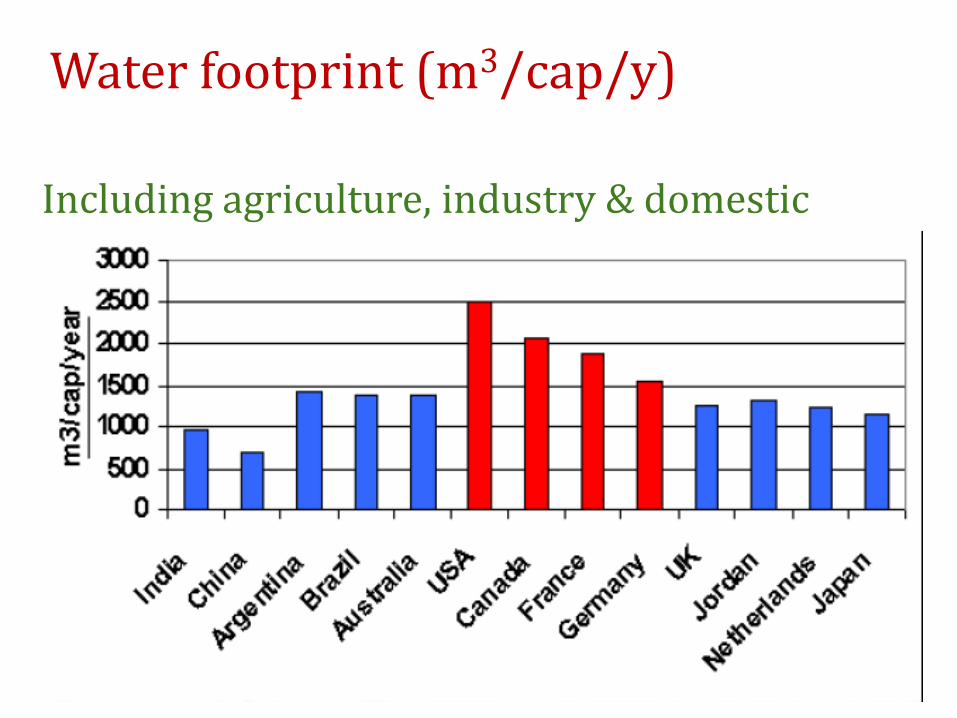
Water footprint (m3/cap/y)
Including agriculture, industry & domestic

Water self-sufficiency vs. Water import dependent
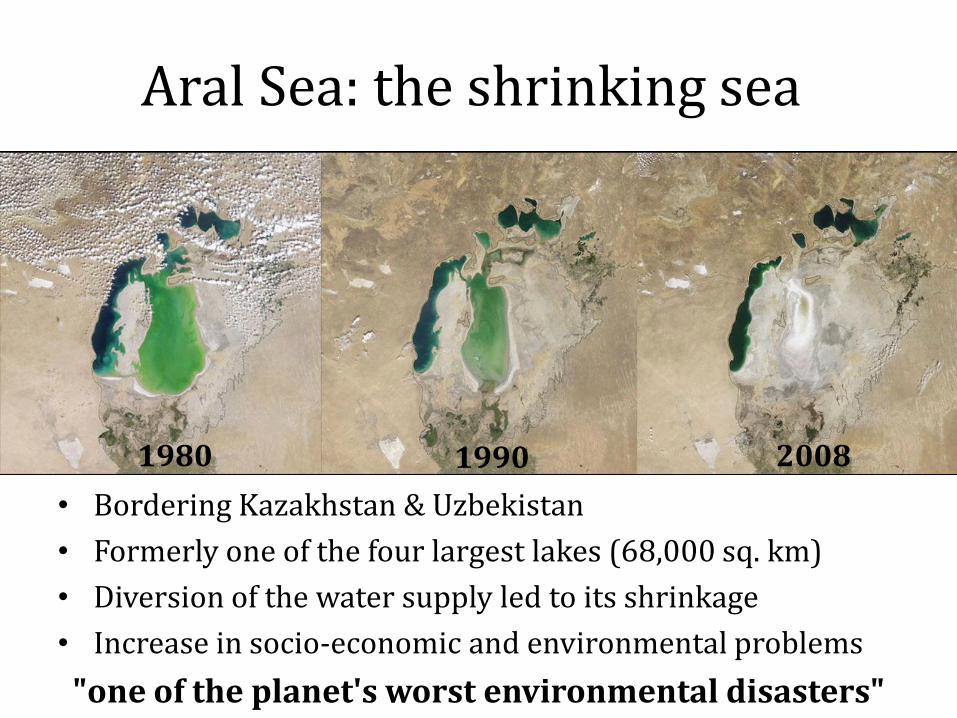
Aral Sea: the shrinking sea
• Bordering Kazakhstan & Uzbekistan
• Formerly one of the four largest lakes (68,000 sq. km)
• Diversion of the water supply led to its shrinkage
• Increase in socio-economic and environmental problems
"one of the planet's worst environmental disasters"
1980 1990 2008

Matrix- Water Resource AssessmentRisks Impacts
Vulnerabilities
Govt. InterventionsAdaptation Strategies
Increased precipitati
on (10-40%)
1. Increased
surface runoff
in some partsof the State
2.Increa
sed soil
erosion
1. Loss of top soil and hence
decreased fertility
1. Vegetative Filter Strip in place of diversion drain 2. Vegetative Contour Hedges with Furrows 3. Gully Control Measures 4. Continuous Contour Trench 5. Pasture Development 6. Forestation 7. Tree Plantation along with nalabank8. Contour Vegetative Hedges (4% Sloppy Land) 9. Contour Vegetative Hedges Supported by Trenches, Ditches, bund (4-8% Sloppy Land)10. Repairs of Existing Conservation Measures Built by Farmers 11. Contour Dead Furrows 12. Contour Cultivation
Increased use of soil
conservation techniques2. Increased
siltation in water
reservoirs

Matrix- Water Resource Assessment
Risks Impacts Vulnerabil
itiesGovt. Interventions
Adaptation
Strategies
Increased temperatur
es (min, max, mean)
Increased rate of evapo-
transpiration
1. Decreased soil moisture
1. Shivkalin Water Harvesting Scheme2. State Accelerated Watershed Development Programme3. Marathwada and VidharbhaWatershed Development Missions4. Artificial Groundwater Recharge Scheme5. National Watershed Development Programme for Rainfed Areas6. Rashtriya Krishi Vikas Yojana
Increase the number
of rainwater harvesting measures
2. Increase the crop
water requirement
3. Decreased water
availability

Actions Proposed
• Promote IWRM practices – enhance storage
• Focus on;
1.Wetlands and buffer zones
2.Renaturalization of water bodies by
establishing Riparian Zones
3.Rejuvenation and Restoration of Common
Property Resources with a focus on Water
4.Enhanced ground water recharge through
emphasis on artificial recharge and rain
water harvesting
5.Promotion of water efficient technologies

• Scarcity/limited resources
• Depletion of ground water
• Capacities of dams/ reservoirs
• Trans boundary • Poor maintenance• Siltation• Vulnerable to climate
change
• Leakages• Outdated pipes• Outburst of pipes • Unmetered
distribution• Trans boundary
• Over extraction• Poor maintenance
• Untreated disposal of waste water
Sources DisposalDistribution Consumers
Integrated Water Resource Management

Recommendations for the wetlands management
• To integrate wetlands in the overall water resource management plan.
• To develop single window apex body for conservation of wetland.
• To clearly define the rules and regulations for wetland conservation and the surrounding areas.
• To develop sustainable revenue-generation models for local/ dependent communities.
• To develop a white paper/ policy paper on the status of wetlands in Maharashtra especially the drought prone areas like Marathwada.
• To build capacity through imparting training to various stakeholders and government officials on wetland management.
• To identify sites for dumping of waste in wetlands to avoid turning of wetlands into wastelands.

Climatic Impacts on the Coastal Region

Result of Step 1: 1. Coastal impacts assessment (MMR region) - Sea Level Rise (SLR)
Observations
- AVISO (satellite)- PSMSL (Tide Gauge)
Time series of MSL (in cm) averaged over the two regions using a 10point smooth filter
Time series of monthly MSL (cm) from 1878 and 2006 over Mumbai tidal station, using a 10point smooth filter.
Past records indicate an increase in SLR of 0.13-2 cm
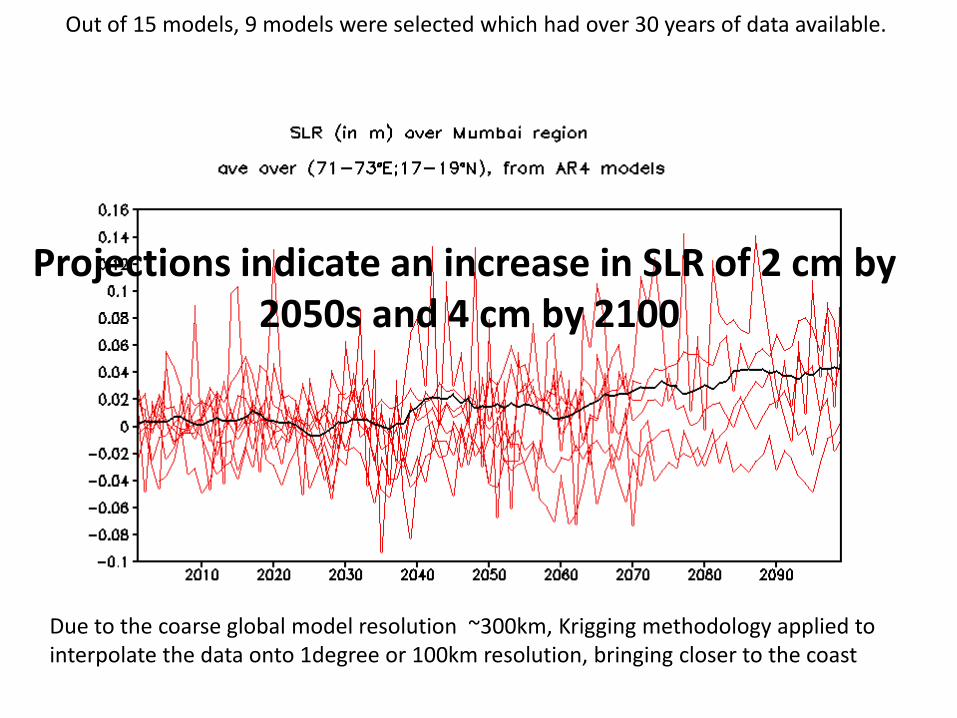
Out of 15 models, 9 models were selected which had over 30 years of data available.
Due to the coarse global model resolution ~300km, Krigging methodology applied to interpolate the data onto 1degree or 100km resolution, bringing closer to the coast
Projections indicate an increase in SLR of 2 cm by 2050s and 4 cm by 2100

2. High Tide Level (HTL) –MMR
Year
Highest
rainfall
in mm
Date of
highest
rainfall
Station
High tide
level in
mtrs
Time of
high tidePost Event Headlines in Media
2005 944.2 7/27/2005Santacruz,
Mumbai
3.7 4:13 AM Rains wreak havoc in Mumbai; 150 killed in Konkan4.1 4:16 PM
2006 231 7/5/2006Santacruz,
Mumbai
3.1 7:05 AM Heavy rains lash Mumbai, schools remain close
Rain causes havoc in Mumbai, 24 killed3.4 6:15 PM
2008 249.7 7/28/2008Colaba,
Mumbai
3.7 8:17 AM Wet weekend spells good news for lake levelsWaterlogging, during the high tide in the
afternoon, was reported.3.4 7:24 PM
2009 439.1 7/16/2009Dahanu,
Thane
3.45:51 AM
Heavy rains lashed the city
3.6 5:20 PM
2010 236 6/24/2010Dahanu,
Thane
4.2 10:56 AM The city also witnessed waterlogging and wall
collapses in several areas following the
downpour3.5 10:22 PM
2011 232.68/29/2011
(New Moon)
Santacruz,
Mumbai4.7 11:58 AM
Mumbai weather: Incessant rainfall leaves city in deep water

Flooding in selected coastal locations

Validation of Flood simulation with Observations of flooded area as reported by the National Institute of Disaster Management

Thank you