impact of diesel/power subsidy withdrawal on production ...22.4.2015).pdf · impact of diesel/power...
TRANSCRIPT

AERC STUDY No. 33
IMPACT OF DIESEL/POWER SUBSIDY WITHDRAWAL ON
PRODUCTION COST OF IMPORTANT CROPS IN PUNJAB
D K GROVER
J M SINGH
JASDEV SINGH
SANJAY KUMAR
Agro-Economic Research Centre
Department of Economics and Sociology
Punjab Agricultural University
Ludhiana
March, 2015
DATA COLLECTION/COMPILATION TEAM
PARMINDER SINGH
SATWINDER SINGH
TEJINDER KAUR DHALIWAL
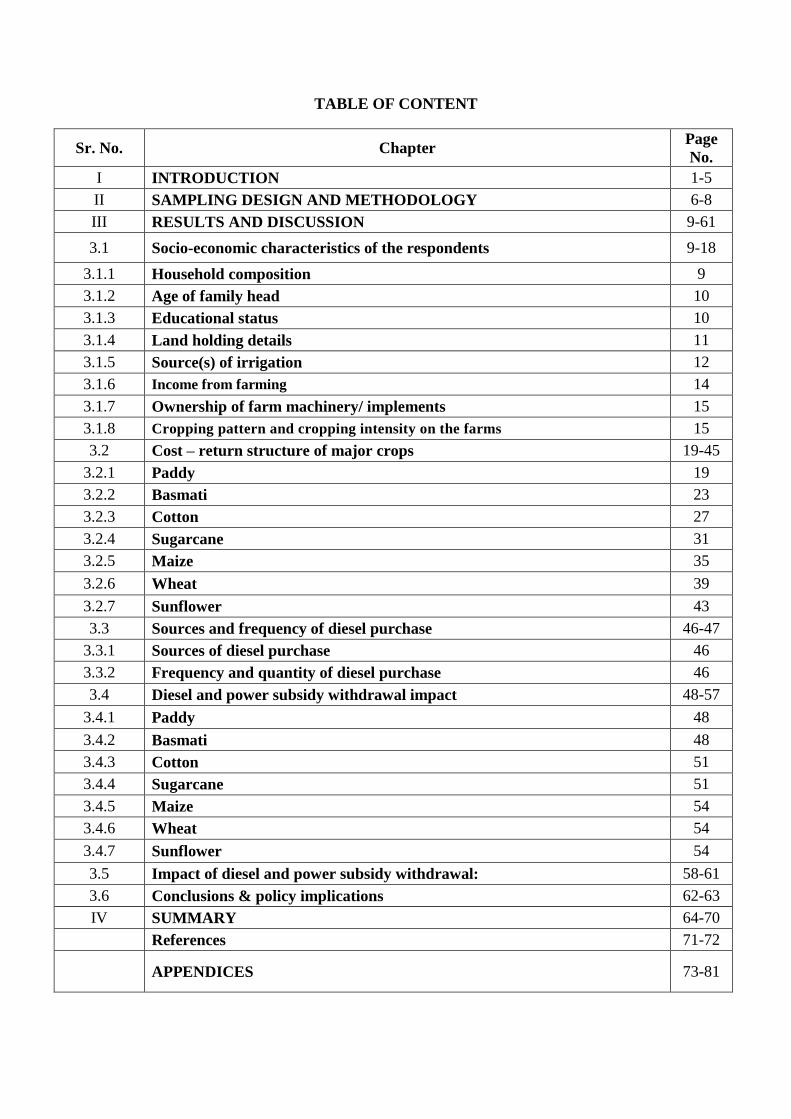
TABLE OF CONTENT
Sr. No. Chapter Page
No.
I INTRODUCTION 1-5
II SAMPLING DESIGN AND METHODOLOGY 6-8
III RESULTS AND DISCUSSION 9-61
3.1 Socio-economic characteristics of the respondents 9-18
3.1.1 Household composition 9
3.1.2 Age of family head 10
3.1.3 Educational status 10
3.1.4 Land holding details 11
3.1.5 Source(s) of irrigation 12
3.1.6 Income from farming 14
3.1.7 Ownership of farm machinery/ implements 15
3.1.8 Cropping pattern and cropping intensity on the farms 15
3.2 Cost – return structure of major crops 19-45
3.2.1 Paddy 19
3.2.2 Basmati 23
3.2.3 Cotton 27
3.2.4 Sugarcane 31
3.2.5 Maize 35
3.2.6 Wheat 39
3.2.7 Sunflower 43
3.3 Sources and frequency of diesel purchase 46-47
3.3.1 Sources of diesel purchase 46
3.3.2 Frequency and quantity of diesel purchase 46
3.4 Diesel and power subsidy withdrawal impact 48-57
3.4.1 Paddy 48
3.4.2 Basmati 48
3.4.3 Cotton 51
3.4.4 Sugarcane 51
3.4.5 Maize 54
3.4.6 Wheat 54
3.4.7 Sunflower 54
3.5 Impact of diesel and power subsidy withdrawal: 58-61
3.6 Conclusions & policy implications 62-63
IV SUMMARY 64-70
References 71-72
APPENDICES 73-81

LIST OF TABLES
Table No. Title
Page
No.
2.1.1 List of selected districts, blocks and villages in Punjab, 2012-13 8
3.1.1 Household composition of respondent farmers, Punjab, 2012-13 9
3.1.2 Age of the family head on sample farms, Punjab, 2012-13 10
3.1.3 Educational status of head of the family on sample farms, Punjab, 2012-13 11
3.1.4 Land holding details of the sample farms, Punjab, 2012-13 12
3.1.5 Various sources of irrigation on the sample farms, Punjab, 2012-13 13
3.1.6 Income (Annual) from farming and other sources on sample farms, Punjab, 2012-13 14
3.1.7 Ownership of farm machinery/ implements on the sample farms, Punjab, 2012-13 16
3.1.8 Cropping pattern and cropping intensity on the sample farms, Punjab, 2012-13 17
3.1.9 Cropping pattern of the sample farms, Punjab, 2012-13 (Percent to gross cropped
area) 18
3.2.1 Physical input use in paddy cultivation on sample farms, Punjab, 2012-13
(Hours/ha) 20
3.2.2 Cost- return structure of paddy cultivation on sample farms, Punjab, 2012-13 22
3.2.3 Physical input use in basmati cultivation on sample farms, Punjab, 2012-13
(Hours/ha) 24
3.2.4 Cost and return structure of basmati cultivation, sample farmers, Punjab, 2012-13
(Rs/ha) 26
3.2.5 Physical input use in cotton cultivation on sample farms, Punjab, 2012-13
(Hours/ha) 28
3.2.6 Cost and return structure of cotton cultivation on sample farms, Punjab, 2012-13 (Rs/ha) 30
3.2.7 Physical input use in sugarcane cultivation on sample farms, Punjab, 2012-(Hours/ha) 32
3.2.8 Cost - return structure of sugarcane cultivation on sample farms, Punjab, 2012-13
(Rs/ha) 34
3.2.9 Physical input use in maize cultivation on sample farms, Punjab, 2012-13
(Hours/ha) 36
3.2.10 Cost- return structure of maize cultivation on sample farms, Punjab, 2012-13 (Rs/ha) 38
3.2.11 Physical input use in wheat cultivation on sample farms, Punjab, 2012-13
(Hours/ha) 40
3.2.12 Cost-return structure of wheat cultivation on sample farms, Punjab, 2012-13 (Rs/ha) 42
3.2.13 Physical input use of sunflower cultivation, sample farmers, Punjab, 2012-13
(Hours/ha) 44
3.2.14 Cost- return structure of sunflower cultivation on sample farmers, Punjab, 2012-13
(Rs/ha) 45
3.3.1 Source of diesel purchase and distance of petrol pump from farmer’s house, Punjab, 2012-13
(Number) 46
3.3.2 Frequency and one-time quantity of diesel purchase on the sample farms, Punjab, 2012-13
(Number) 47
3.4.1 Changing diesel prices and its impact on (Simulations- cetris paribus) cost of production
of paddy in Punjab, 2012-13 (Rs./ ha) 49
3.4.2 Changing diesel prices and its impact on (Simulations- cetris paribus) cost of production
of basmati in Punjab, 2012-13 (Rs./ ha) 50
3.4.3 Changing diesel prices and its impact on (Simulations- cetris paribus) cost of production
of cotton in Punjab, 2012-13 (Rs./ ha) 52
3.4.4 Changing diesel prices and its impact on (Simulations- cetris paribus) cost of production
of sugarcane in Punjab, 2012-13 (Rs./ ha) 53

3.4.5 Changing diesel prices and its impact on (Simulations- cetris paribus) cost of
production of maize in Punjab, 2012-13 (Rs./ ha) 55
3.4.6 Changing diesel prices and its impact on (Simulations-cetris paribus) cost of
production of wheat in Punjab, 2012-13 (Rs./ ha) 56
3.4.7 Changing diesel prices and its impact on (Simulations-cetris paribus) cost of production
of sunflower in Punjab, 2012-13 (Rs./ ha) 57
3.4.8 Impact of diesel subsidy withdrawal on cost of production, important crops, Punjab,
2012-13 (Rs/qtl) 59
3.4.9 Impact of power subsidy on cost of production, important crops, Punjab, 2012-13
(Rs/qtl) 60
3.4.10 Impact of diesel & power subsidy withdrawal on cost of production, important crops,
Punjab, 2012-13 (Rs/qtl) 61

PREFACE
Punjab being a major paddy and wheat producing state has helped the country in
achieving self-sufficiency in food grains production. The emergence of paddy and wheat
monoculture has resulted in shifting area from traditionally cultivated crops towards these
crops. But, this development has entailed increased use of chemical fertilisers, agro-
chemicals etc. due to increased incidence of weeds, pest and diseases, and consequent use of
higher amount of these inputs to raise the crop productivity. There is a sharp decline in
underground water table in the state due to over exploitation of this vital natural resource
especially for raising paddy crop. Punjab farmers are spending handsome amount to purchase
diesel to run their tube wells during kharif season and Punjab Govt. purchase electricity at
higher rates for free power supply to agricultural sector. Lately, the union government has
been emphasizing to withdraw various subsidies in a phased manner. It is worthwhile to
mention that withdrawal of diesel subsidy will hit hard the agricultural sector by significantly
increasing the cost of cultivation/ production of various crops.
Keeping the above mentioned scenario into consideration, the present study is devoted
to estimate the impact of diesel/power subsidy withdrawal on production cost of important
crops in Punjab. Nevertheless, this attempt can be a basis for the policy planners for framing
requisites policies in the interest of farming community especially in the event of such
subsidies extraction.
We express our gratitude to the Directorate of Economics and Statistics, Ministry of
Agriculture, Government of India, New Delhi for their financial support to take up this study.
.
Authors

IMPACT OF DIESEL/POWER SUBSIDY WITHDRAWAL ON PRODUCTION
COST OF IMPORTANT CROPS IN PUNJAB
Abstract
Punjab agriculture has been passing through a phase of severe ecological crisis exemplifying ever declining
water table, excessive use of nitrogenous fertilizers, agro-chemicals, scarcity of labour and stagnant crop
productivity. This, in spite of the fact that, Punjab agriculture has been subsidized to a large extent in the form of
fertilizer, diesel and power subsidies. Lately, the union government has been contemplating to withdraw
subsidies in a phased manner. The withdrawal of diesel subsidy will hit hard the agricultural sector by
significantly increasing the cost of cultivation/ production of various crops. Oil Marketing Companies (OMCs)
are increasing per litre diesel prices by Rs. 0.5 per month from January, 2013 and diesel subsidy is likely to be
completely removed with automatic deregulation of fuel in next few months if the rupee continue to strengthen
and monthly price hikes continue. Power supply to agricultural sector in Punjab is free and state government
incurs huge subsidy bill every year. Keeping this in view, the present investigation entails to see the impact of
diesel and power subsidy withdrawal and its likely impact on cost of cultivation/ production of important crops
in Punjab agriculture. To meet the specific objectives of the study, six districts, two blocks, cluster of villages
were selected randomly. In aggregate, sample of 300 farmer households with equal representation from all the
farm categories were selected. Data on different components of cost-return structure of various crops were
collected. Simple tabular analysis was conducted to analyse the results. Simulations with changing diesel prices
were undertaken to work out the cost of production/ cultivation of various crops by keeping prices of all the
other cost components at constant level from the time of data collection and just varying diesel prices only in
order to see the impact of diesel subsidy withdrawal on cost of production of crops and also worked out ‘diesel
price hike coefficient’. Similarly, the impact of power subsidy withdrawal on cost of production of major crops
in Punjab was also investigated by calculating the cost of the electricity consumed for irrigating various crops
and adding it to the total variable cost. The results of the study brought out that the simulations regarding change
in diesel prices, keeping prices of all other inputs at constant level (cetris-paribus), the cost of production of
paddy increased by 7.06 per cent with the withdrawal of diesel subsidy while in case of basmati it was 5.18 per
cent; 3.52 per cent in cotton, 2.63 per cent in sugarcane, 5.83 per cent in maize, 7.90 per cent in wheat and 8.81
per cent in sunflower. The changing diesel prices and its impact on cost of production of paddy, basmati, cotton,
sugarcane, maize, wheat and sunflower was seen at I (base) level (1st February, 2013), secondly at II (current)
level (1st June, 2014) and thirdly at III (proposed) level with zero diesel subsidy. In absolute terms, the cost of
production of paddy was Rs. 494 per quintal at I level which increased to Rs. 517 per quintal at II level and to
Rs. 528 at III level. In basmati crop, the cost of production was Rs. 890 per quintal at I level which increased to
Rs. 921 at II level and further Rs.936 at III level. Similarly, the cost of production of cotton was Rs. 2859 per
quintal at I level which increased to Rs. 2927 at II level due to increase in diesel price and Rs. 2959 at III level
if there was complete withdrawal of diesel subsidy. Also, the cost of production of sugarcane was Rs. 125 per
quintal at I level which increased to Rs. 127 at II level and further enhanced to Rs. 128 per quintal at III level. In
maize crop, the cost of production was Rs. 714 per quintal at I level which increased to Rs. 742 at II level and
further Rs.756 at III level. The cost of production of wheat was Rs. 572 per quintal at I level which increased to
Rs. 603 at II level and further Rs.618 at III level with no diesel subsidy. In sunflower crop, the cost of
production was Rs. 1631 per quintal at I level which increased to Rs. 1729 at II level and further Rs.1775 at III
level. The diesel price hike coefficient showed that with one rupee increase in diesel price, the resultant cost of
production of paddy increased by Rs.2.53; while increase was by Rs. 3.36 in basmati, Rs.7.31 in cotton, Rs. 0.24
in sugarcane, Rs. 3.03 in maize, Rs.3.29 in wheat and Rs. 10.45 in case of sunflower crop. The increase in cost
of production of different crops under various farm categories due to withdrawal of diesel subsidy did not show
any specific trend of increase or decline according to size of the farm category. The major impact of power
subsidy withdrawal was seen on increase in cost of production of paddy (25.30%) due to more number of
irrigations applied to this crop followed by basmati (21.24%), sunflower (9.07%), wheat (6.64%), maize
(3.50%), sugarcane (3.28%) and cotton (1.75%). In absolute terms, the cost of production of paddy increased
from Rs. 494 per quintal to Rs. 619 per quintal due to withdrawal of power subsidy while in basmati the
increase was from Rs. 890 to Rs. 1079, in cotton Rs. 2859 to Rs. 2909, in sugarcane Rs. 125 to Rs. 126, in
maize Rs. 714 to Rs 739, in wheat Rs. 572 to Rs. 610 and in sunflower from Rs. 1631 to Rs. 1779. The impact
of power subsidy withdrawal was more on semi-medium, medium and large farm categories as compared to
marginal and small farms. In relative terms, the cost of production of paddy increased by 25.30 per cent due to
withdrawal of power subsidy while in basmati this increase was by 21.24 per cent followed by sunflower
(9.07%), wheat (6.64%), maize (3.50%), sugarcane (3.28%) and cotton (1.75%). In aggregate, the cost of
production of paddy increased by 32.35 per cent due to withdrawal of both diesel and power subsidy. Similarly,

the increase in cost of production of basmati was by 26.42 per cent followed by sunflower (17.88%), wheat
(14.55%), maize (9.33%), sugarcane (5.97%) and cotton (5.26%). In absolute terms, the cost of production of
paddy increased from Rs. 494 per quintal to Rs. 654 per quintal due to withdrawal of both diesel and power
subsidy while in basmati the increase was from Rs. 890 to Rs. 1125, in cotton Rs. 2859 to Rs. 3009, in
sugarcane Rs. 125 to Rs. 129, in maize Rs. 714 to Rs 781, in wheat Rs. 572 to Rs. 655 and in sunflower from
Rs. 1631 to Rs. 1923.The farm category-wise analysis showed that the impact of power and diesel subsidy
withdrawal was more on large and medium farmers as compared to marginal and small farmers. The major
policy issues drawn was that Punjab government should emphasize the union government to increase the
minimum support price of crops, in commensurate with the diesel price hike coefficient. In case, power subsidy
is withdrawn by the state government, farmers especially marginal and small one’s should be compensated
according to the electricity usage bill generated for irrigating various crops on their farms. It was emphasized
that for keeping marginal and small farmers in farming business, subsidies especially power subsidy should not
be withdrawn, however, their form can be changed for the benefit of these farmers.

1
CHAPTER-I
INTRODUCTION
India is one of the largest consumer of energy especially the fuel products in the world. With
high economic growth and rising incomes, the consumption of commercial energy in country
has increased four times since 1980-81. While the industrial sector continues to be the biggest
consumer of commercial energy, its share has declined from 54 per cent in 1980-81 to 47 per
cent in 2008-09. On the other hand, the share of agriculture sector has increased from 2 per
cent to 7 per cent during this period (Jha et al, 2012). Oil is the largest energy source in India
with a share of about 30.5 per cent in primary energy consumption basket. With stagnant
indigenous production of crude oil/fuel products the increased demand for oil has to meet
through increase in imports of crude oil. For an emerging economy like India, this gap is
increasing over the years. Consumption of petroleum products during 2012-13 was 157.1
million metric tonnes (MMT) which was 6.0 per cent higher as compared to the 148.1 MMT
consumed during 2011-12. During 2012-13 the country imported 184.8 MMT of crude oil
against 171.7 MMT during 2011-12. High speed diesel oil being the major source of energy,
accounted for 43.98 per cent of the total consumption of all types of petroleum products in
India during 2012-13. This was followed by Petrol, LPG and Naphtha accounting for 10.02
per cent, 9.93 per cent and 7.82 per cent respectively (Ministry of Petroleum & Natural Gas,
2013).
Energy has always been essential for agricultural production. Traditionally, the primary
energy inputs for agriculture were sun, manure and the human/ animal muscle power.
However, the modern agriculture supplemented with agro-processing being highly energy
intensive; traditional sources of energy, power and inputs do not meet its requirements to
achieve production and productivity levels, which assures food and nutrition security in the
country like India (NAAS, 2008). Thus, use of commercial energies in agriculture becomes
inevitable with electricity, fertilizer and diesel oil as the main sources of it. Over the period of
two and half decade, the contribution of electricity and fossil energy in agricultural
production has gone up to 86 per cent and of agricultural workers and draught animals has
come down to 6 per cent and 8 per cent, respectively (Jha et al, 2012a). Commercial energy
used in agriculture can be divided in two categories, viz. direct use of energy for pumping
and mechanization (tractors, power tiller, pump sets etc.) and indirect use of energy in the
form of fertilizers and pesticides (Grace Communication Foundation, 2012).

2
Most of the modern farm machinery runs on diesel (tractors, combine harvesters and diesel
pump sets) and electricity (electric motors/submersible pumps, etc). In a span of two and a
half decades i.e. from 1980-81 to 2006-07, the share of diesel has increased from 1.5 per cent
to 20 per cent of total energy-use in Indian agriculture. Although on all-India basis, tractor
penetration remains low, still better irrigated states like Punjab have a high tractor density of
over 1 per 1,0 ha of net sown area. Besides their use for traction power in farming, tractors
are also being used for drawing irrigation water and rural transportation. Pumps in Indian
agriculture are being used prominently for irrigation purpose. The number of farmers using
diesel powered pumps is high in villages with limited access to electricity. Further, due to
electricity shortage especially during the peak periods, even the electric pump sets require
power backup of diesel powered generators. Also, there is rise in use of farm tools that run on
diesel. As per the all India study report, after transport agriculture sector is the second major
consumer of diesel accounting for about 13 per cent of total diesel consumption in the
country. Of this, tractors consume 7.4 per cent followed by pump-sets and agriculture
implements accounting for 2.9 per cent and 2.7 per cent respectively (Ministry of Petroleum
& Natural Gas, 2013).
Consequent upon the Green Revolution, Punjab agriculture became the most energy intensive
with abundant use of modern inputs like irrigation, fertilizers, farm power and agro-
chemicals. It has been transformed from subsistence farming which was entirely dependent
on animals for draft power, to mechanized farming using mainly inanimate power sources
like tractors, diesel engines, electric motors etc. (Sharma et al., 2005). From being 0.22 lakh
in 1970-71, the total numbers of tractors rose by almost 20 times to 4.34 lakh in 2010-11. As
compared to only 18 tractors per 000’ hectares of net sown area in country, Punjab had 104
tractors in 2010-11. Irrigation forms the backbone of agriculture in Punjab and tube wells is
the prime source of assured irrigation throughout the state with exception of a few south-
western districts facing problem of brackish underground water. The tube wells in the state
run on electricity and diesel energy. From merely 0.97 lakh in 1970-71, the overall number of
electric tube wells has risen by almost 12 times to 11.42 lakh in 2010-11. Maximum number
of tube wells (3.77 lakh) were installed during the 2000s, the reason being free of cost supply
of electricity to the agricultural sector since the late nineties. However, during peak periods,
shortage of electric supply leads to use of diesel powered gen sets to run the electric tube
wells. In contrast, over time, diesel engine - run tube wells have lost their popularity due to
high operational costs involved in comparison to the electric ones. Though the diesel engine
tube wells increased during the period from 1970s, their number reduced from 3.2 lakh in
3
1980-81 to 2.0 lakh in 1990-91 and to 1.70 lakh in 2010-11 (Anonymous, 2012). Besides,
state agriculture employs variety of other farm equipments/machinery being run on diesel oil.
With this level of mechanization, the energy particularly the diesel constitutes sizeable part of
cost of agriculture production in the state.
Subsidizing consumers of petroleum products including diesel has been a common
phenomenon in many developing and emerging economies. Fuel subsidies generally arise out
of desire to shield consumers, especially poor households, from high and often volatile fuel
costs for lighting, cooking, and transportation. However, fuel subsidies are both inefficient
and inequitable (Anand et al, 2013). Such subsidies encourage over consumption of fuel,
delay the adoption of energy-efficient technologies, and crowd out high-priority public
spending on physical infrastructure, education, health and social protection. Most of the
benefits of fuel subsidies also go to higher income groups who tend to consume more fuel
(Arze et al, 2012). Recognition of these shortcomings has led to an active debate in India as
to the merits of replacing these subsidies with better targeted safety net measures. Fuel
subsidy reforms have been on Indian government’s policy reform agenda over the last
decade.
Diesel retail prices continue to be regulated by the government of India since early 1970s and
hence contributed in a major way towards the building up of fuel subsidies over the years.
Government of India has recently taken a number of reform measures in fuel subsidy system.
In June 2010, petrol pricing was liberalized and the intention to liberalize diesel prices
announced. In its 2012-13 budget speech, the government stated its intention to limit all
central subsidies (including those on fuels) to less than 2 percent of GDP in 2012-13, and
reducing them to less than 1.75 percent of GDP over the next three years. In January 2013,
the government announced that Oil Marketing Companies (OMCs) would have greater
flexibility in setting diesel prices and that bulk users of diesel would pay unsubsidized prices.
However, the government has yet to set out a clear plan and timeline for reforming remaining
fuel subsidies (IMF, 2013).
OMCs increased per litre diesel prices by Rs. 0.5 per month from January, 2013 onwards
with some exceptions. Since then, the diesel prices had risen by a cumulative Rs 10.12 per
litre in 16 instalments and the diesel subsidy is likely to be completely removed with
automatic deregulation of fuel in next few months if the rupee continue to strengthen and
monthly price hikes continue (Daily Post, 2014,). The elimination of diesel subsidies will also
help addressing large existing distortions in relative petrol and diesel prices which has

4
resulted in a substantial substitution of diesel for petrol automobiles and further exacerbated
the fiscal cost of diesel subsidies. However, the full liberalization of pricing has its own
challenges that need to be anticipated. Full liberalization may transfer the volatility of
international prices to domestic consumers with a short time lag and thus, may generate
substantial public resistance and possibly undermine liberalization. It may be more of a
concern for diesel as compared to petrol as all income groups are affected through increases
in the prices of other goods and services.
The subsidy on diesel is financed by the government of India, while electric power subsidy to
agriculture is financed by the State Governments. During the recent decade impact of
electricity subsidy to agriculture on financial health of state economy has been the most
debated issue in Punjab. Benefits of electric power subsidy tended to favour cultivation of
water intensive crops particularly rice. The uncontrolled withdrawal of ground water for crop
production supported by subsidised electricity in the farm sector leads to rapid decline in the
water level in different parts of the country (Kumar, 2007). The growing dependency on
groundwater threatened land productivity, water resource sustainability and power sector
viability. Agricultural power supplied at flat rate or free and viewed as entitlement must
increasingly be managed as a scarce input (World Bank, 2011). Raising power tariffs in the
farm sector to achieve efficiency and sustainability of groundwater use is the need of hour
from social, economical and environmental point of view (Singh et al, 2014). Many Indian
states are considering re-introduction of electricity metering in the farm sector to manage
groundwater demand. The logic behind this is that at higher power tariff, with induced
marginal cost of electricity and water, farmers will improve water use efficiency and enhance
the water productivity (Kumar et al, 2011).
However, any policy changes with respect to energy pricing may have serious implications
on farm level profitability through significant increase in cost of cultivation. The cost of
cultivation data of the Commission for Agricultural Costs and Prices (CACP) reveal that
expenses on energy based inputs have registered a spectacular increase since the 1990s (Jha
et al, 2012b). Therefore, there is a need to assess the likely impact of energy price policy
changes on the Indian agriculture. Punjab agriculture, being on forefront in terms of
diesel/electricity energy consumption may hit hard due to policy changes resulting into the
increase of cost of agricultural production. Subsequently, it will squeeze the profit margins of
the farmers necessitating the government to increase minimum support price for various
crops. In this context, the present study has been taken to analyse the likely impact of
5
diesel/electricity energy price hike policy on cost-profitability relationship of major crops in
Punjab.
Specific objectives:
1. To study the status of electricity and diesel use for various crop-production
activities in the state.
2. To examine the impact of squeezing diesel subsidy/enhancing diesel price on the
cost of agricultural production and profitability, and;
3. To estimate the likely impact of power subsidy withdrawal (Hypothetical) on the
cost of cultivation/production and profitability of major crops in the state.

6
CHAPTER-II
SAMPLING DESIGN AND METHODOLOGY
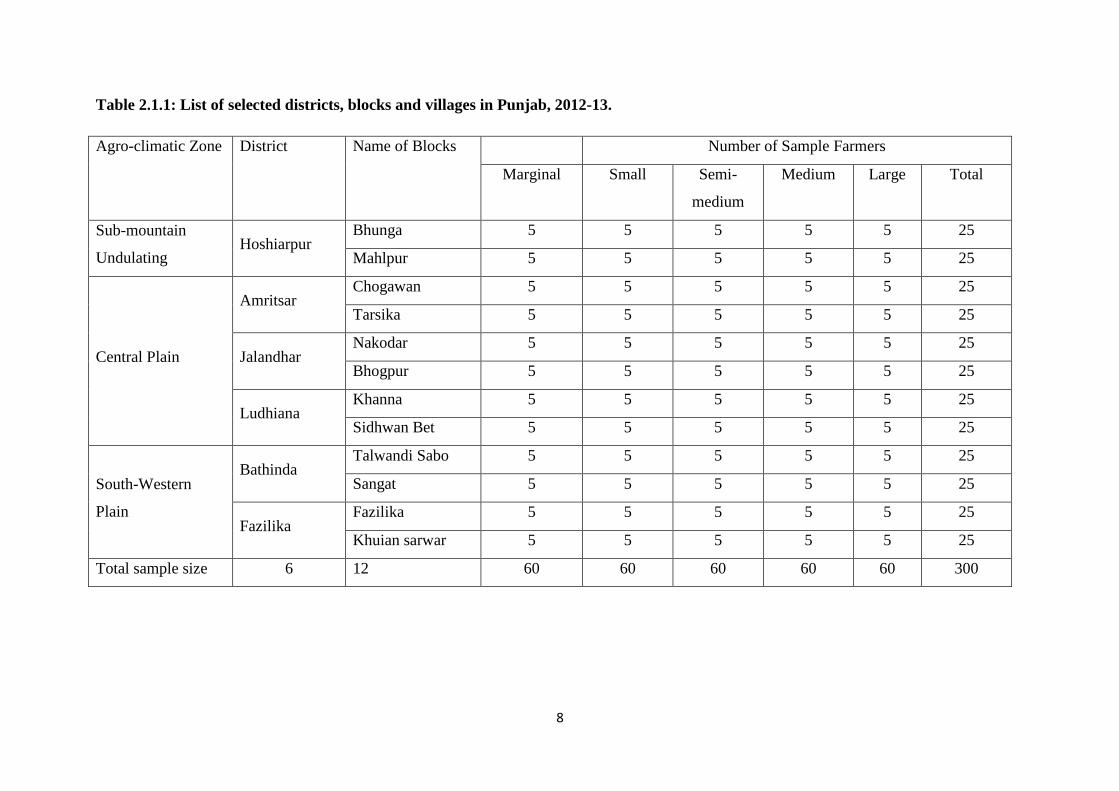
To meet the specific objectives of the study, multi stage random sampling technique was
followed. At first stage six districts (of total 22) representing various agro-climatic regions of
state were taken ( Hoshiarpur represents the sub-mountain undulating zone, Amritsar,
Jalandhar and Ludhiana represent the largest central plain zone and Bathinda and Fazilika
represent South-western plain zone).. At second stage, from each of the selected district two
development blocks were selected randomly. Thereafter, from each selected block a cluster of
2-3 villages was chosen randomly for the farm household survey. Finally from each of the
selected village cluster, 25 cultivators comprising 5 cultivators representing each of different
categories as per standard national level definition of operational holdings viz., marginal (< 1
ha), small (1- 2 ha), semi-medium (2- 4 ha), medium (4 - 10 ha) and large (> 10 ha) were
taken randomly. Thus, overall from the state, total sample of 300 farmer households
comprising 60 farmers each of marginal, small, semi-medium, medium and large categories
forms the basis for the present enquiry. The detail of sampled districts, blocks and villages is
provided in Table 1.The important crops of the state like wheat, paddy, cotton, maize,
sugarcane and major oilseeds/pulses were selected for the detailed analysis. In order to
accomplish the objectives of the study, the required information pertaining to the year 2012-
13 has been collected from the sample farm households by personal interview method using
well structured pre-tested schedules.
2.1 Data Analysis
To work out composition of the structure of cost of cultivation of selected crops and
contribution of diesel energy in the same, the tabular analysis was employed. For this purpose
all the components of variable cost in value terms as well as physical terms (wherever
possible) were considered. These included labour cost (own and hired), owned and hired
machine power (tractors, combine harvesters, electric/submersible and diesel pumps, etc)
charges with special emphasis on hourly use and input involved (particularly diesel), seed
manure, fertilizers, insecticides, weedicides, irrigation, interest on working capital and other
miscellaneous costs.
The gross returns from each crop enterprise have been worked out by multiplying the
physical output, both main as well as by-product with the respective average prices. Simple

7
statistical tools such as averages and percentages were used for the interpretation of the
results.
To assess the likely impact of recent diesel price policy changes on the Punjab agriculture,
different synthetic situations were generated through considering partial and fully unregulated
diesel prices along with other assumptions (like exchange rate of rupee). These synthetic
situations were used to quantify the impact of recent diesel oil policy on the cost of
cultivation of selected crops and subsequent squeeze of the profit margins of the farmers in
Punjab. Impact of de-subsidised electricity supply to agriculture sector on cost of production
of important crops in Punjab was also worked out. For this purpose per hectare electricity
consumption for irrigation of a crop on sample farms was worked out as following:
Electricity use in irrigation (Kwh/ha) = Use of electric pump (electric motor or submersible) for
irrigation of crop (hours/ha) x HP of electric pump
x 0.746 kwh + 20 % inefficiency
Cost of electricity consumption for each crop was estimated through multiplying the
per hectare electricity consumption with the subsidy amount of Rs 4.18/kwh, which was
approved by the Punjab State Electricity Regulatory Commission for electricity supplied to
the farm sector in Punjab during year 2012-13 (PSERC-Tariff Order for FY 2013-14).
8
Table 2.1.1: List of selected districts, blocks and villages in Punjab, 2012-13.
Agro-climatic Zone District Name of Blocks Number of Sample Farmers
Marginal Small Semi-
medium
Medium Large Total
Sub-mountain
Undulating Hoshiarpur
Bhunga 5 5 5 5 5 25
Mahlpur 5 5 5 5 5 25
Central Plain
Amritsar Chogawan 5 5 5 5 5 25
Tarsika 5 5 5 5 5 25
Jalandhar Nakodar 5 5 5 5 5 25
Bhogpur 5 5 5 5 5 25
Ludhiana Khanna 5 5 5 5 5 25
Sidhwan Bet 5 5 5 5 5 25
South-Western
Plain
Bathinda Talwandi Sabo 5 5 5 5 5 25
Sangat 5 5 5 5 5 25
Fazilika Fazilika 5 5 5 5 5 25
Khuian sarwar 5 5 5 5 5 25
Total sample size 6 12 60 60 60 60 60 300

9
CHAPTER-III
RESULTS AND DISCUSSION
The results have been discussed under various sub-heads:
3.1 Socio-economic characteristics of the respondents
3.2 Cost - return structure of major crops
3.3 Sources and frequency of diesel purchase
3.4 Diesel and power subsidy withdrawal impact
3.5 Conclusions and policy implications
3.1 Socio-economic characteristics of the respondents
It is very important to look into the socio-economic characteristics of the sample respondents
to investigate about their adoption level of agricultural technology to peep into the level of
resource use especially diesel consumption.
3.1.1 Household composition
The household composition of the respondent farmers has been shown in Table 3.1.1. In an
overall scenario it was seen that there were about 40 per cent adult males in the families of
respondent farmers followed by about 35 per cent adult females and 25 per cent minors. This
shows the skewed sex ratio among the respondent farmer families. The farm category-wise
Table 3.1.1: Household composition of respondent farmers, Punjab, 2012-13
(Number/farm)
Family
composition
Marginal Small Semi-
medium
Medium Large Overall
Adult male 2.17
(44.22)
2.28
(41.39)
2.23
(41.74)
2.62
(36.01)
3.07
(37.55)
2.47
(39.64)
Adult female 1.77
(36.05)
2.00
(36.25)
1.88
(35.20)
2.45
(33.72)
2.92
(35.71)
2.20
(35.31)
Minor 0.97
(19.73)
1.23
(22.36)
1.23
(23.06)
2.20
(30.27)
2.18
(26.74)
1.56
(25.05)
Total 4.90
(100.00)
5.52
(100.00)
5.35
(100.00)
7.27
(100.00)
8.17
(100.00)
6.24
(100.00)
Figures in parentheses are percentages of the total

10
analysis revealed that relative proportion of adult males as compared to adult females was
more among marginal, small and semi-medium categories as compared to medium and large
farm categories. But in absolute terms the number of household members was highest on
large farms (8.17) as compared to lowest (4.90) on marginal farms. Thus, due to higher size
of holding on large farms there was more number of people dependent on it.
3.1.2 Age of family head
The age of the family head is also an important indicator of the type of farm activities
undertaken on the farm. The age of the family head has been given in Table 3.1.2. A perusal
of the table reveals that in overall, about 38 per cent of the family heads were more than 50
years old while about 35 per cent were aged between 36-50 years and remaining 27 per cent
were quite young and aged up to 35 years. The category-wise analysis also reveals that the
relative proportion of number of family heads with more than 50 years age was more among
all the farm categories which shows that involvement of older people was more in the
decision making process on the sample farms.
Table 3.1.2: Age of the family head on sample farms, Punjab, 2012-13
(Numbers)
Age groups Marginal Small Semi-
medium Medium Large Overall
Up to 35 years 16
(26.67)
18
(30.00)
19
(31.67)
15
(25.00)
13
(21.67)
81
(27.00)
36-50 years 20
(33.33)
17
(28.33)
22
(36.66)
21
(35.00)
24
(40.00)
104
(34.67)
>50 years 24
(40.00)
25
(41.67)
19
(31.67)
24
(40.00)
23
(38.33)
115
(38.33)
Total 60
(100.00)
60
(100.00)
60
(100.00)
60
(100.00)
60
(100.00)
300
(100.00)
Figures in parentheses are percentages of the total.
3.1.3 Educational status
The educational status of the head of the family has been shown in Table 3.1.3. A perusal of
the table reveals that in overall, the relative proportion of the respondents with education up
to matriculate was higher (48.00%) followed by education up to secondary (15.66%), primary
(9.67%), graduation (9.67%) and post- graduation (2.00%) level. The farm category-wise
analysis also reveals that majority of the respondents were educated up to matriculate level
with higher relative proportion on marginal (58.33%) farms as compared to lowest (38.33%)

11
on large farm category. Also, the proportion of respondents with education up to graduation
level was higher (18.34%) on large farms as compared to other farm categories.
Table 3.1.3: Educational status of head of the family on sample farms, Punjab, 2012-13
(Numbers)
Particulars Marginal Small Semi-
medium
Medium Large Overall
Illiterate 12
(20.00)
9
(15.00)
8
(13.38)
9
(15.00)
7
(11.67)
45
(15.00)
Primary 4
(6.67)
7
(11.67)
5
(8.33)
8
(13.33)
5
(8.33)
29
(9.67)
Matriculate 35
(58.33)
28
(46.66)
30
(50.00)
28
(46.67)
23
(38.33)
144
(48.00)
Secondary 8
(13.33)
6
(10.00)
7
(11.66)
12
(20.00)
14
(23.33)
47
(15.66)
Graduate 0
(0.00)
7
(11.67)
8
(13.33)
3
(5.00)
11
(18.34)
29
(9.67)
Post Graduate 1
(1.67)
3
(5.00)
2
(3.33)
0
(0.00)
0
(0.00)
6
(2.00)
Total 60
(100.00)
60
(100.00)
60
(100.00)
60
(100.00)
60
(100.00)
300
(100.00)
Figures in parentheses are percentages of the total
3.1.4 Land holding details
The land holding details of the sample farms have been given in Table 3.1.4. A perusal of the
table reveals that the total operational holding per farm was 5.62 hectares with land owned
being 3.61 hectares; land leased-in 2.13 hectares and land leased-out 0.12 hectares. The
relative proportion of the land leased-in was more than land leased-out on the sample farms.
The entire area under cultivation was irrigated with average rental value of land leased-in
being Rs. 68,180 and that of land leased-out being Rs. 71,430 per hectare. The average per
hectare rental value of land leased-in was highest (Rs.72, 148) on large farms and lowest
(Rs.60,000) on marginal farms.

12
Table 3.1.4: Land holding details of the sample farms, Punjab, 2012-13
(Ha/farm)
Particulars Marginal Small Semi-
medium Medium Large Overall
Land owned (a) 0.98 1.49 2.62 4.68 8.30 3.61
Land leased-in (b) 0.06 0.22 0.67 2.23 7.46 2.13
Land leased-out (c) 0.30 0.00 0.03 0.28 0.00 0.12
Total operational holding
(a+b-c) 0.74 1.71 3.26 6.62 15.77 5.62
Irrigation intensity (%) 100.00 100.00 100.00 100.00 100.00 100.00
Average rental value of
land leased-in (Rs/ Ha) 60000 64845 63370 69285 72148 68180
Average rental value of
land leased-out (Rs/ Ha) 74375 0 55000 73750 0 71430
Figures in parentheses are percentages of the total
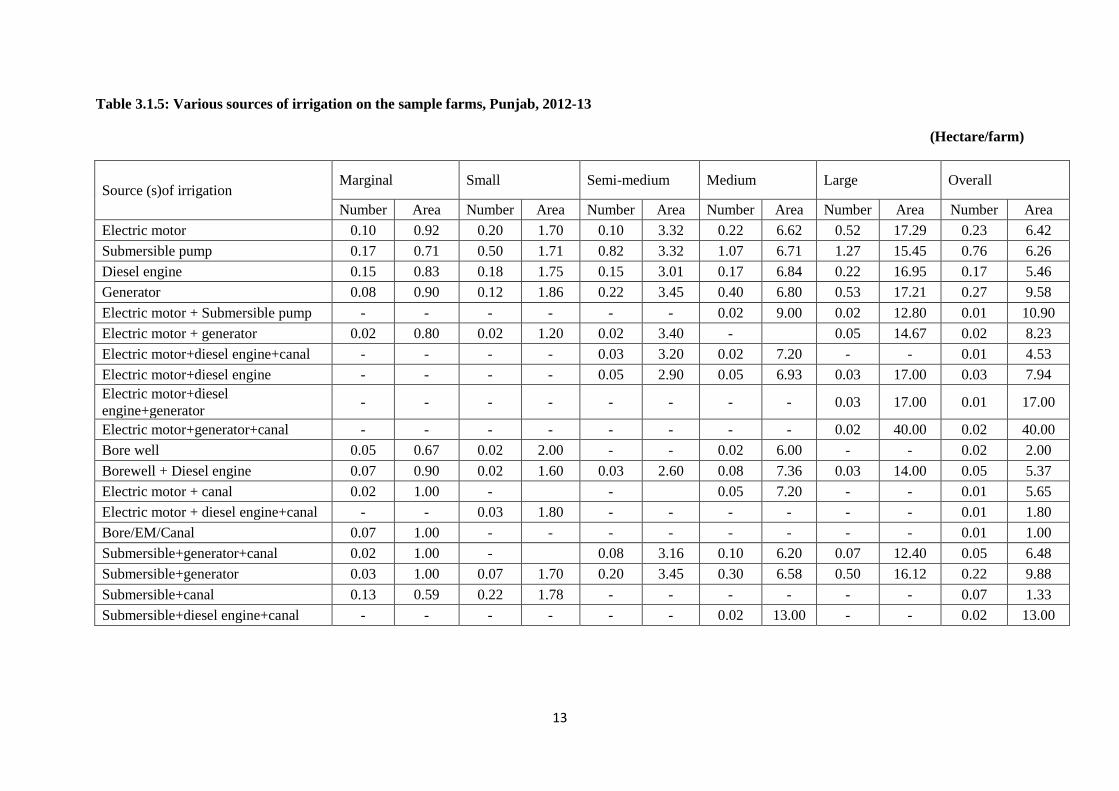
3.1.5 Source(s) of irrigation
Irrigation is an important component of successful farming. The respondent farmers were
enquired about the availability of various sources of irrigation on their farms (Table 3.1.5). It
is quite obvious from the table that electric motor, submersible pump, diesel engine,
generator and canals were the various sources of irrigation on the sample farms. These
sources were used alternatively, collectively and as and when required on the sample farms.
The numbers of submersible pumps per farm were highest (0.76) in an overall scenario
followed by generator (0.27) electric motor (0.23) and diesel engine (0.17). The area
coverage by combined use of electric motor, submersible pump, diesel engine and generator
in various permutations and combinations was higher as compared to using these irrigation
sources individually. However, generator use was higher on large and medium farms as
compared to other farm categories due to higher number of generators owned on these farms.
13
Table 3.1.5: Various sources of irrigation on the sample farms, Punjab, 2012-13
(Hectare/farm)
Source (s)of irrigation Marginal Small Semi-medium Medium Large Overall
Number Area Number Area Number Area Number Area Number Area Number Area
Electric motor 0.10 0.92 0.20 1.70 0.10 3.32 0.22 6.62 0.52 17.29 0.23 6.42
Submersible pump 0.17 0.71 0.50 1.71 0.82 3.32 1.07 6.71 1.27 15.45 0.76 6.26
Diesel engine 0.15 0.83 0.18 1.75 0.15 3.01 0.17 6.84 0.22 16.95 0.17 5.46
Generator 0.08 0.90 0.12 1.86 0.22 3.45 0.40 6.80 0.53 17.21 0.27 9.58
Electric motor + Submersible pump - - - - - - 0.02 9.00 0.02 12.80 0.01 10.90
Electric motor + generator 0.02 0.80 0.02 1.20 0.02 3.40 -
0.05 14.67 0.02 8.23
Electric motor+diesel engine+canal - - - - 0.03 3.20 0.02 7.20 - - 0.01 4.53
Electric motor+diesel engine - - - - 0.05 2.90 0.05 6.93 0.03 17.00 0.03 7.94
Electric motor+diesel
engine+generator - - - - - - - - 0.03 17.00 0.01 17.00
Electric motor+generator+canal - - - - - - - - 0.02 40.00 0.02 40.00
Bore well 0.05 0.67 0.02 2.00 - - 0.02 6.00 - - 0.02 2.00
Borewell + Diesel engine 0.07 0.90 0.02 1.60 0.03 2.60 0.08 7.36 0.03 14.00 0.05 5.37
Electric motor + canal 0.02 1.00 -
-
0.05 7.20 - - 0.01 5.65
Electric motor + diesel engine+canal - - 0.03 1.80 - - - - - - 0.01 1.80
Bore/EM/Canal 0.07 1.00 - - - - - - - - 0.01 1.00
Submersible+generator+canal 0.02 1.00 -
0.08 3.16 0.10 6.20 0.07 12.40 0.05 6.48
Submersible+generator 0.03 1.00 0.07 1.70 0.20 3.45 0.30 6.58 0.50 16.12 0.22 9.88
Submersible+canal 0.13 0.59 0.22 1.78 - - - - - - 0.07 1.33
Submersible+diesel engine+canal - - - - - - 0.02 13.00 - - 0.02 13.00

14
3.1.6 Income from farming
The income from farming and other sources have been depicted in Table 3.1.6. A perusal of
the table reveals that in overall Rs.8,01,364 was the total income of the sample farms from
farming, dairy farming, service, business and other sources. The relative share of farming in
the total income was 99.20 per cent followed by dairy farming (0.43%), service sector
(0.15%), business (0.14%) and other sources (0.08%). The category-wise analysis reveals that
the relative share of farming in total income was lowest (74.19%) on marginal farms and
highest on the large farms (99.80%). On the contrary, the relative share of dairy farming,
service sector, business and other sources in total income was highest (75.81%) on marginal
farms as compared to other farm categories. Therefore, farming was the major component of
income on the sample farms followed by other sources.
Table 3.1.6: Income (Annual) from farming and other sources on sample farms, Punjab, 2012-
13
(Rs. / farm)
Particulars Marginal Small Semi-
medium Medium Large Overall
Farming 80702
(74.19)
213962
(93.65)
426062
(98.28)
929966
(99.42)
2357674
(99.80)
794923
(99.20)
Dairy
farming
11777
(10.83)
6853
(3.00)
4752
(1.10)
2484
(0.27)
2887
(0.12)
3485
(0.43)
Service sector 7522
(6.91)
4876
(2.13)
516
(0.12)
2094
(0.22)
320
(0.09)
1229
(0.15)
Business 2136
(1.96)
2384
(1.04)
614
(0.14)
805
(0.09)
1108
(0.05)
1084
(0.14)
Other sources 6643
(6.11)
389
(0.17)
1564
(0.36)
0
(0.00)
467
(0.02)
643
(0.08)
Total 108780
(100.00)
228464
(100.00)
433508
(100.00)
935349
(100.00)
2362456
(100.00)
801364
(100.00)
Figures in parentheses are percentages of the total
15
3.1.7 Ownership of farm machinery/ implements
The ownership of farm machinery/ implements on the sample farms has been given in
Table 3.1.7. A perusal of the table reveals that in overall, average number of tractors per
farm was 0.79 with 43.94 H.P. and present value being Rs.1,94,106. The category wise
analysis reveals that the number of tractors per farm was 1.38 on large, 1.07 on medium,
0.90 on semi-medium, 0.45 on small and 0.13 on marginal farms. Thus, all the
respondents on medium and large farms owned at least one tractor while very few
respondents on marginal, about fifty per cent on small and almost every respondent,
except a few, on semi-medium farm category owned a tractor. The average number of
tractor drawn implements was 5.70 on large, 4.20 on medium, 3.70 on semi-medium, 1.32
on small, 0.18 on marginal and 2.89 in an overall scenario. Therefore, the present value of
tractor drawn implements was more on large farms due to their higher number as
compared to other farm categories.
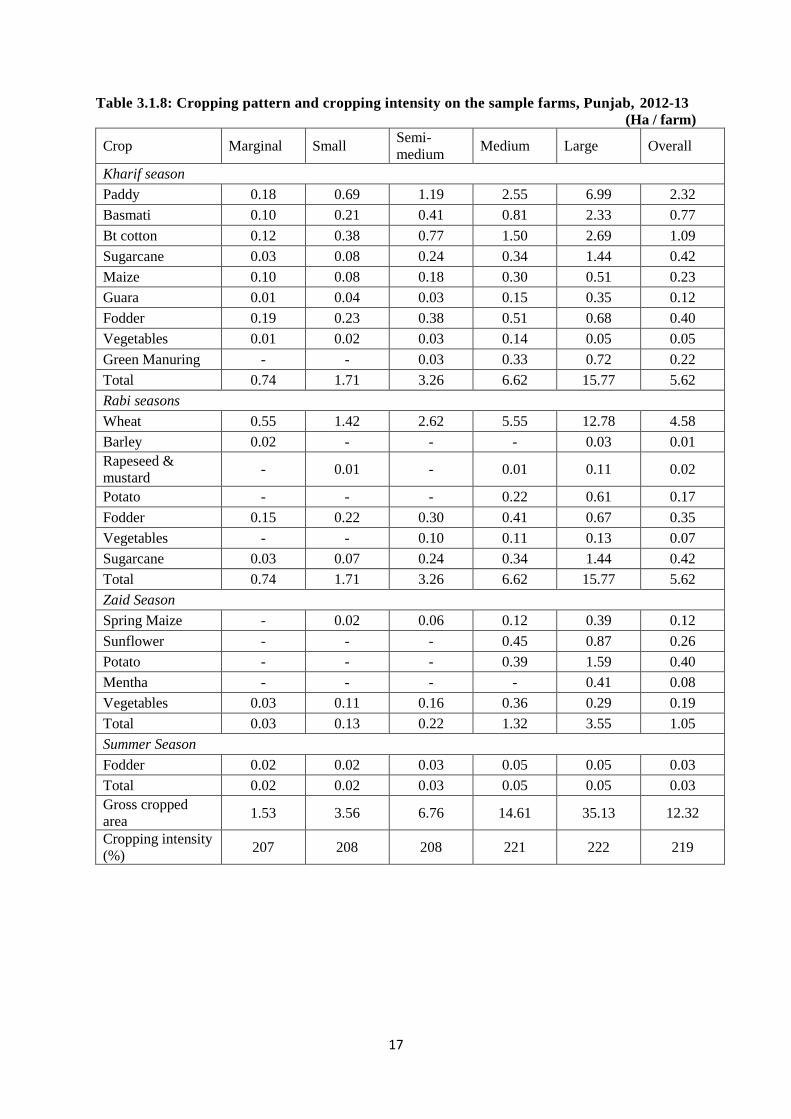
3.1.8 Cropping pattern and cropping intensity on the farms
Cropping pattern and cropping intensity on the sample farms have been shown in Table
3.1.8 and 3.1.9. A perusal of the table 1.8 reveals that during kharif season paddy was the
major crop occupying 2.32 hectares (18.83% of gross cropped area) of the operational
holding in overall scenario followed by 1.09 hectares (8.85%) under Bt cotton, 0.77
hectares (6.26%) under Basmati and rest 1.44 hectares under other kharif season crops
such as; sugarcane (3.44%), maize (1.90%), guara (0.94%), fodder (3.23%), vegetables
(0.41%) and green manuring crops (1.69%) of the gross cropped area. The farm category
wise analysis revealed that paddy was major crop sown on all the farm categories
followed by Bt cotton, basmati and maize crops. During rabi season wheat was the major
crop sown on 4.58 hectares (37.20 % of the gross cropped area) in overall scenario
followed by fodder (0.35 ha), potato (0.17 ha) and other minor crops. The crops sown
during zaid season in overall scenario were; potato (0.40 ha), sunflower (0.26 ha), spring
maize (0.12 ha), vegetables (0.19 ha) and mentha (0.08 ha). The percentage share of zaid
season crops was 8.51 per cent of the gross cropped area on the sample farms. Fodder
(0.03 ha) was the only crop sown in the summer season to cater to the needs of the cattle.
The cropping intensity was 219.24 per cent in an overall scenario with highest on large
farms (222.81%) and lowest on marginal (206.84%) farms.

16
Table 3.1.7: Ownership of farm machinery/ implements on the sample farms, Punjab, 2012-13
(Per Farm)
Particulars
Marginal Small Semi-medium Medium Large Overall
No.
Present
value
(Rs)
No. Present
value No.
Present
value No.
Present
value No.
Present
value No.
Present
value
Tractor 0.13
(39.38) 19333
0.45
(36.15) 68166
0.90
(40.98) 181200
1.07
(43.34) 255417
1.38
(49.29) 446417
0.79
(43.94) 194107
Tractor
drawn
implements
0.18 603 1.32 20161 3.07 73450 4.20 96625 5.70 191182 2.89 76404
Irrigation
Machinery 0.70 13812 1.05 43122 1.32 61347 2.03 89292 2.87 129938 1.59 67502
Combine
Harvester &
others
0.33 2847 0.65 5253 0.75 5768 0.85 38747 1.20 213023 0.76 53128
Figures in the parentheses indicate the average HP of the tractor
17
Table 3.1.8: Cropping pattern and cropping intensity on the sample farms, Punjab, 2012-13
(Ha / farm)
Crop Marginal Small Semi-
medium Medium Large Overall
Kharif season
Paddy 0.18 0.69 1.19 2.55 6.99 2.32
Basmati 0.10 0.21 0.41 0.81 2.33 0.77
Bt cotton 0.12 0.38 0.77 1.50 2.69 1.09
Sugarcane 0.03 0.08 0.24 0.34 1.44 0.42
Maize 0.10 0.08 0.18 0.30 0.51 0.23
Guara 0.01 0.04 0.03 0.15 0.35 0.12
Fodder 0.19 0.23 0.38 0.51 0.68 0.40
Vegetables 0.01 0.02 0.03 0.14 0.05 0.05
Green Manuring - - 0.03 0.33 0.72 0.22
Total 0.74 1.71 3.26 6.62 15.77 5.62
Rabi seasons
Wheat 0.55 1.42 2.62 5.55 12.78 4.58
Barley 0.02 - - - 0.03 0.01
Rapeseed &
mustard - 0.01 - 0.01 0.11 0.02
Potato - - - 0.22 0.61 0.17
Fodder 0.15 0.22 0.30 0.41 0.67 0.35
Vegetables - - 0.10 0.11 0.13 0.07
Sugarcane 0.03 0.07 0.24 0.34 1.44 0.42
Total 0.74 1.71 3.26 6.62 15.77 5.62
Zaid Season
Spring Maize - 0.02 0.06 0.12 0.39 0.12
Sunflower - - - 0.45 0.87 0.26
Potato - - - 0.39 1.59 0.40
Mentha - - - - 0.41 0.08
Vegetables 0.03 0.11 0.16 0.36 0.29 0.19
Total 0.03 0.13 0.22 1.32 3.55 1.05
Summer Season
Fodder 0.02 0.02 0.03 0.05 0.05 0.03
Total 0.02 0.02 0.03 0.05 0.05 0.03
Gross cropped
area 1.53 3.56 6.76 14.61 35.13 12.32
Cropping intensity
(%) 207 208 208 221 222 219

18
Table 3.1.9: Cropping pattern of the sample farms, Punjab, 2012-13
(Percent to gross cropped area)
Crop Marginal Small Semi-
medium Medium Large Overall
Kharif season
Paddy 11.61 19.32 17.57 17.45 19.91 18.83
Basmati 6.67 5.82 5.99 5.57 6.63 6.26
Bt cotton 7.75 10.62 11.39 10.23 7.65 8.85
Sugarcane 1.74 2.10 3.50 2.30 4.11 3.44
Maize 6.51 2.25 2.71 2.03 1.45 1.90
Guara 0.65 1.12 0.39 1.00 1.01 0.94
Fodder 12.47 6.34 5.67 3.51 1.93 3.23
Vegetables 0.87 0.47 0.44 0.94 0.15 0.41
Green
Manuring - - 0.49 2.28 2.05 1.77
Total 48.35 48.04 48.16 45.31 44.88 45.61
Rabi seasons
Wheat 35.79 39.90 38.77 37.94 36.38 37.20
Barley 1.26 - - - 0.08 0.07
Rapeseed
mustard - 0.19 - 0.05 0.30 0.19
Potato - - - 1.51 1.74 1.35
Fodder 9.56 6.03 4.41 2.78 1.90 2.81
Vegetables - - 1.48 0.73 0.38 0.55
Sugarcane 1.74 1.92 3.50 2.30 4.11 3.43
Total 48.35 48.04 48.16 45.31 44.88 45.61
Zaid Season
Spring Maize - 0.47 0.84 0.84 1.12 0.96
Sunflower - - - 3.10 2.47 2.14
Potato - - - 2.66 4.53 3.25
Mentha - - - - 1.16 0.66
Vegetables 1.95 3.04 2.37 2.46 0.84 1.54
Total 1.95 3.51 3.20 9.06 10.11 8.51
Summer Season
Fodder 1.36 0.42 0.47 0.32 0.13 0.26
Total 1.36 0.42 0.47 0.32 0.13 0.26
Gross cropped
area 100.00 100.00 100.00 100.00 100.00 100.00

19
3.2 Cost – return structure of major crops
3.2.1 Paddy
The physical input use in paddy cultivation on sample farms have been shown in Table 3.2.1.
It is quite obvious that human labour use per hectare of paddy cultivation worked out to be
313.85 hours in an overall scenario while category wise analysis revealed that highest number
of 344.33 hours were spent on human labour on medium farms followed by 317.89 hours on
semi medium farms, 303.11 hours on small farms, 302.24 on large farms and 282.78 hours on
marginal farms which were the lowest. The use of human labour was more on medium and
semi medium farms due to higher availability of family and hired labour on these farms. In
paddy cultivation human labour was mostly required in transplanting of seedlings,
fertilization, plant protection measures and frequent irrigations. In case of machine labour
(tractor), overall 13.14 hours were utilized in various field operations with highest (13.90
hrs.) on medium farms and lowest (12.68 hrs.) on small farms. Similarly, in overall scenario
combine harvesting hours for paddy crop were 1.77 per hectare with highest on marginal
(1.88 hrs.) and lowest on large (1.50 hrs.) farms. The irrigation hours using electric motor/
submersible pump were 255.97 per hectare in an overall situation while farm category wise
analysis revealed that highest number (270.14 hours) of irrigation hours were utilized on
raising paddy crop on marginal farms and lowest number (254.24 hours) on large farm
category due to more under area under paddy crop. Diesel engine and generator hours utilized
for irrigating one hectare of paddy crop on sample farms was estimated at10.07 and 11.11
hours, respectively. Diesel engine use in irrigating paddy crop was more on marginal (13.05
hrs.) farms while generator use was more on large (15.70 hrs) farms due to its higher
availability on this farm category. Similarly, diesel consumption per hectare on owned and
hired machinery taken together was 155.50 litres in overall scenario while the diesel
consumption was highest on large (185.55 hrs.) farms and lowest on small (142.61 hrs.)
farms due to higher use of diesel engine on small farms and that of generator on large farms.
The proportion of hired machine use (including tractor) in terms of total diesel consumption
per hectare was more on marginal farms vis-a-vis other farm categories. The yield obtained
per hectare was 62.47 qtls. in an overall scenario while it was highest (64.58 qtls.) on
medium farms and lowest (62.32 qtls.) on small farms among various farm categories.

20
Table 3.2.1: Physical input use in paddy cultivation on sample farms, Punjab, 2012-13
(Hours/ha)
Particulars Marginal Small Semi medium Medium Large Overall
Human Labour 282.78 303.11 317.89 344.33 302.24 313.85
Machine use (Tractor) 13.32 12.68 13.50 13.90 13.07 13.14
Combine harvester 1.88 1.75 1.79 1.77 1.50 1.77
Irrigation (Electric
motor/Submersible) 270.14 255.96 259.19 261.79 254.24 255.97
Diesel engine 13.05 7.90 6.47 7.88 7.29 10.07
Generator 3.47 4.99 9.26 12.98 15.70 11.11
Use of diesel (litre)
Owned 86.94 97.17 139.85 133.32 165.96 124.76
Hired 55.67 47.44 24.71 24.33 19.59 30.74
Total 142.61 144.61 164.56 157.65 185.55 155.50
Seed (Kg) 14.86 13.24 14.34 15.38 14.54 14.47
Manure & Fertilisers (Kg)
Urea 354.17 303.68 310.66 328.53 317.07 319.73
DAP 121.53 124.26 136.40 134.62 125.79 124.32
MOP - 5.51 - 8.01 4.57 4.14
Zinc 20.83 14.49 16.62 20.51 19.45 18.25
Others 0.56 1.47 0.59 0.64 4.09 1.64
FYM (qtl) 16.80 8.70 17.70 22.20 5.40 13.80
Weedicides (No.) 0.78 1.03 0.76 0.98 0.88 0.90
Insecticides (No.) 2.17 2.03 2.53 3.33 3.00 2.69
Yield (Qt/ha) 63.47 62.32 63.42 64.58 63.49 62.47

21
The cost-return structure of paddy cultivation on sample farms has been shown in Table
3.2.2. A perusal of the table reveals that relative share of human labour use in total variable
cost was 39.27 per cent in overall situation while according to farm category, on medium
farms its share was 41 per cent which was highest and that on marginal farms it was 34.52
per cent, which was lowest among various farm categories. The per cent share of hired
machine charges (except diesel) in total variable cost was 5.53 per cent in overall situation
while on marginal farms its share was 14.84 per cent which was highest due to higher hired
machine use on these farms while on large farms it was 3.31 per cent which was being lowest
due to higher availability of owned machine on these farms. In overall, the proportionate
share of diesel consumption in total variable cost was 23.47 per cent while its share was
lowest (20.53%) on small farms and highest (27.86%) on large farms. Thus, diesel use in
paddy cultivation was higher on large farms as compared to other farm categories. The total
variable cost in paddy cultivation was estimated at Rs.30835 per hectare in overall scenario
while farm category wise analysis revealed that total variable cost was highest (Rs.32629) on
medium farms and lowest (Rs.30532) on small farms. The returns over variable cost (ROVC)
in paddy cultivation were estimated at Rs.49626 in an overall scenario while these were
highest (Rs. 50702) on semi-medium farms and lowest (Rs. 50034) on medium farms,
however, the difference in returns among various farm categories was not so high. The
benefit-cost (B:C) ratio was 1.61 in an overall scenario and it was highest (1.64) on small
farms and lowest (1.53) on medium farms.

22
Table 3.2.2: Cost- return structure of paddy cultivation on sample farms, Punjab, 2012-13
(Rs/ha)
Particulars Marginal Small Semi medium Medium Large Overall
Value percent Value percent Value percent Value percent Value percent Value percent
Human labour 11076 34.52 11367 37.23 12438 40.06 13378 41.00 11702 37.72 12110 39.27
Machine use
Hired Machine
Charges* 4761 14.84 3852 12.62 1202 3.87 1210 3.71 1026 3.31 1706 5.53
Use of diesel
Owned 4049 12.62 4525 14.82 6513 20.98 6209 19.03 7729 24.92 5810 18.84
Hired machinery 2593 8.08 1744 5.71 1151 3.71 1133 3.47 912 2.94 1432 4.64
Total 6641 20.70 6269 20.53 7664 24.68 7342 22.50 8641 27.86 7242 23.49
Seed 510 1.59 477 1.56 585 1.88 541 1.66 557 1.80 537 1.74
Manure & Fertilizers 6138 19.13 5420 17.75 5759 18.55 6023 18.46 5245 16.91 5666 18.38
Weedicides 599 1.87 582 1.90 478 1.54 480 1.47 503 1.62 519 1.68
Insecticides 1808 5.64 2041 6.68 2387 7.69 3093 9.48 2813 9.07 2525 8.19
Interest @ 7% for
half the period of
crop
552 1.72 525 1.72 534 1.72 561 1.72 534 1.72 530 1.72
Total variable cost 32084 100.00 30532 100.00 31047 100.00 32629 100.00 31019 100.00 30835 100.00
Gross returns 82384
80580
81748
82662
81267
80461
ROVC 50300
50048
50702
50034
50248
49626
Benefit-cost ratio 2.57
2.64
2.63
2.53
2.62
2.61
* Except diesel

23
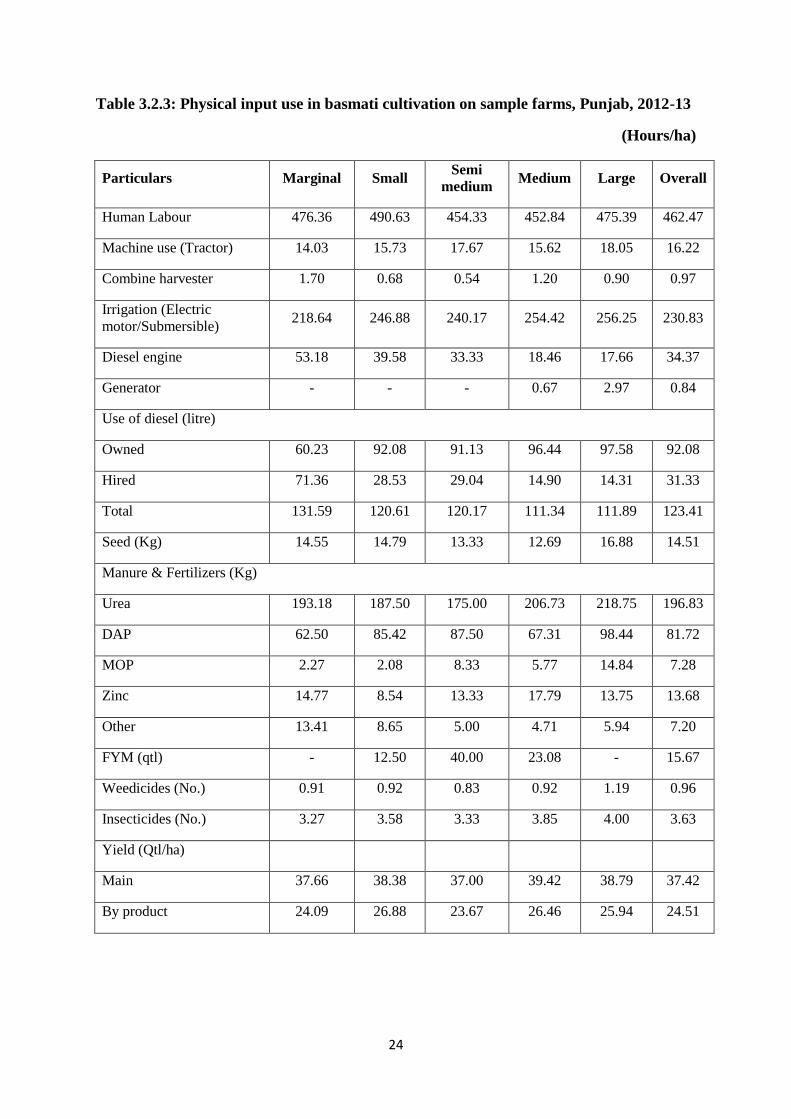
3.2.2 Basmati
The physical input use in basmati cultivation on sample farms have been shown in Table
3.2.3. A perusal of the table reveals that in overall, 462.47 human labour hours per hectare
were spent on various farm related operations in basmati crop. The category-wise analysis
revealed that highest numbers of 490.63 human labour hours were estimated to have been
utilized in basmati cultivation on small farm category while lowest numbers of 452.84 hours
were spent on medium farm category. Basmati is highly labour intensive crop and mostly
labour is required for transplanting of seedlings, fertilization, plant protection measures,
frequent irrigations and harvesting and threshing of the crop when harvested manually. The
tractor use on sample farms was estimated at 16.22 hours per hectare in an overall situation
while farm category wise analysis revealed that it was highest (18.05 hrs.) on large farms and
lowest (14.03 hrs.) on marginal farm category. The combine harvester hours in overall were
estimated at 0.97 hours per hectare while on marginal farms it was 1.70 hours due to large
number of the sample farmers going for manual harvesting of basmati while these hours were
lowest (0.54 hrs.) on semi-medium farms. The total irrigation hours using electric motor/
submersible pumps in basmati cultivation were 230.83 hours per hectare in an overall
situation while these hours were 256.25 on large farms which were highest among various
farm categories and 218.64 on marginal farms which were lowest. Diesel engine and
generator hours utilized for irrigating basmati crop were estimated at 34.37 hours and 0.84
hours, respectively. Diesel engine use in irrigating basmati crop was more on marginal (53.18
hrs.) farms while generator use was highest on large (2.97 hrs) farms category. The diesel
consumption per hectare including owned and hired machinery was 123.41 litres in overall
situation. The category-wise analysis revealed that diesel consumption was highest on
marginal (131.59 ltrs.) farms and lowest on medium (111.34 ltrs.) farms due to higher use of
diesel engine on marginal farms as compared to other farm categories. On marginal farms
higher (71.36 ltrs.) quantity of diesel was consumed by way of hiring farm machinery for
various farm operations as compared to lowest (14.31 ltrs.) consumption on large farms. So,
in basmati crop use of hired machinery for different farm operations declined with the
increase in size of holding. The per hectare basmati yield obtained on the sample farms was
estimated at 37.42 qtls in overall scenario while it was highest (39.42 qtls.) on medium farms
and lowest (37 qtls.) on semi-medium farm category.
24
Table 3.2.3: Physical input use in basmati cultivation on sample farms, Punjab, 2012-13
(Hours/ha)
Particulars Marginal Small Semi
medium Medium Large Overall
Human Labour 476.36 490.63 454.33 452.84 475.39 462.47
Machine use (Tractor) 14.03 15.73 17.67 15.62 18.05 16.22
Combine harvester 1.70 0.68 0.54 1.20 0.90 0.97
Irrigation (Electric
motor/Submersible) 218.64 246.88 240.17 254.42 256.25 230.83
Diesel engine 53.18 39.58 33.33 18.46 17.66 34.37
Generator - - - 0.67 2.97 0.84
Use of diesel (litre)
Owned 60.23 92.08 91.13 96.44 97.58 92.08
Hired 71.36 28.53 29.04 14.90 14.31 31.33
Total 131.59 120.61 120.17 111.34 111.89 123.41
Seed (Kg) 14.55 14.79 13.33 12.69 16.88 14.51
Manure & Fertilizers (Kg)
Urea 193.18 187.50 175.00 206.73 218.75 196.83
DAP 62.50 85.42 87.50 67.31 98.44 81.72
MOP 2.27 2.08 8.33 5.77 14.84 7.28
Zinc 14.77 8.54 13.33 17.79 13.75 13.68
Other 13.41 8.65 5.00 4.71 5.94 7.20
FYM (qtl) - 12.50 40.00 23.08 - 15.67
Weedicides (No.) 0.91 0.92 0.83 0.92 1.19 0.96
Insecticides (No.) 3.27 3.58 3.33 3.85 4.00 3.63
Yield (Qtl/ha)
Main 37.66 38.38 37.00 39.42 38.79 37.42
By product 24.09 26.88 23.67 26.46 25.94 24.51

25
The cost-return structure of basmati cultivation on sample farms has been given in Table
3.2.4. It is quite obvious from the table that in an overall scenario, relative share of human
labour use in total variable cost was 48.52 per cent in overall situation while farm category
wise analysis revealed that on large farms its share was highest (51.74%) and it was lowest
(44.28%) on marginal farms which showed that there was more use of human labour on large
farms during various farm operations in basmati cultivation as compared to other farm
categories. The per cent share of hired machine charges (Except diesel) in total variable cost
was 4.64 per cent in overall situation while farm category wise analysis revealed that on
marginal farms its share was 12.81 per cent which was highest and that on large farms it was
1.28 per cent which was lowest. The relative share of diesel consumption in total variable
cost was found to be 17.26 per cent in an overall scenario while according to the various farm
categories, its share was lowest (15.22%) on large farms and highest (18.17%) on marginal
farm category. Thus, diesel use was more on marginal farms in basmati cultivation due to
higher use of hired machinery as compared to other farm categories. The total variable cost in
basmati cultivation was worked out at Rs.33296 per hectare in overall situation while it was
highest (Rs.34229) on large farms and lowest (Rs.31600) on medium farm category. The
returns over variable cost (ROVC) in basmati cultivation were estimated at Rs.56898 in an
overall scenario. However, returns were highest (Rs.64061) on small farms and lowest
(Rs.55725) on semi-medium farms due to lower gross returns as compared to other farm
categories. In overall, benefit-cost (B:C) ratio was 1.71 in basmati cultivation while farm
category wise analysis revealed that benefit-cost ratio was highest (1.97) on medium farms
and lowest (1.68) on large farms due to higher total variable cost and lower gross returns on
this farm category.

26
Table 3.2.4: Cost- return structure of basmati cultivation, sample farmers, Punjab, 2012-13
Rs/ha
Particulars Marginal Small Semi medium Medium Large Overall
Value percent Value percent Value percent Value percent Value percent Value percent
Human Labour 14933 44.28 15383 47.00 15107 46.88 15774 49.92 17710 51.74 16154 48.52
Machine use
Hired Machine
Charges* 4320 12.81 2016 6.16 1749 5.43 502 1.59 438 1.28 1546 4.64
Use of diesel
Owned 2805 8.32 4288 13.10 4244 13.17 4491 14.21 4544 13.28 4288 12.88
Hired machinery 3323 9.85 1329 4.06 1352 4.20 794 2.51 666 1.95 1459 4.38
Total 6128 18.17 5617 17.16 5596 17.37 5285 16.73 5211 15.22 5747 17.26
Seed 745 2.21 923 2.82 917 2.84 910 2.88 1222 3.57 961 2.89
Manure &
Fertilizers 3360 9.96 4512 13.79 4753 14.75 4311 13.64 4575 13.37 4353 13.07
Weedicides 580 1.72 500 1.53 477 1.48 510 1.61 648 1.89 545 1.64
Insecticides 3077 9.13 3217 9.83 3074 9.54 3764 11.91 3836 11.21 3416 10.26
Interest @ 7% for
half the period of
crop
580 1.72 563 1.72 554 1.72 543 1.72 589 1.72 573 1.72
Total variable cost 33723 100.00 32730 100.00 32227 100.00 31600 100.00 34229 100.00 33296 100.00
Gross returns
Main 94248
95156
86580
92322
89766
88638
By product 1397
1635
1373
1612
1805
1556
Total 95645
96792
87953
93934
91570
90194
ROVC 61922
64061
55725
62334
57342
56898
Benefit-cost ratio 2.84
2.96
2.73
2.97
2.68
2.71
* Except diesel
27
3.2.3 Cotton
The physical input use in cotton cultivation on the sample farms have been shown in Table
3.2.5. It is quite obvious from the table reveals that overall 547.95 human labour hours were
estimated to be have been utilized while raising cotton crop on the sample farms. The
category-wise analysis revealed that highest (576.75 hrs.) number of labour hours were spent
on large farms while lowest (500.26 hrs.) on the marginal farms. This shows the higher
availability of the labour on large farms for undertaking various field operations in cotton
crop. Labour is required to undertake various field operations such as; sowing, fertilization,
plant protection measures and picking of cotton. The tractor use was 25.15 hours in overall
scenario while on large farms tractor was used for 35 hours which was highest and 20.52
hours on marginal farms which were lowest among various farm categories. The irrigation
hours estimated for the use of electric motor/ submersible pump were 27.03 hours while farm
category wise analysis revealed that on large farms irrigation hours were highest (29.33 hrs.)
and on marginal farms lowest (26.21hrs.). Diesel engine and generator were used for
irrigation purpose by some of the respondents as supplementary source of irrigation and their
use was estimated at 15.03 and 5.50 hours respectively, in an overall scenario. The diesel
engine use was more than generator use on various farm size categories for irrigation in
cotton crop. The total diesel consumption in cotton cultivation in overall situation was
estimated at 118.64 litres constituting 91.15 litres from owned and 27.49 litres from hired
sources. On large farms, the diesel consumption from owned sources was 129.50 litres which
was maximum on all the farm categories while on marginal farms diesel consumption was
41.63 litres and it was minimum level of diesel consumption from owned sources. The diesel
consumption through hired sources was 76.73 litres per hectare on marginal farms which was
highest among all the farm categories while no hired diesel consumption was on large farms.
There was not much variation in cotton yield obtained on various farm categories. In overall,
cotton yield was estimated at 16.52 qtls per hectare with a maximum of 16.96 qtls on
marginal and a minimum of 16.14 qtls on medium farm size category.

28
Table 3.2.5: Physical input use in cotton cultivation on sample farms, Punjab, 2012-13
(Hours/ha)
Particulars Marginal Small Semi
medium Medium Large Overall
Human Labour 500.26 550.00 541.15 560.59 576.75 547.95
Machine use (Tractor) 20.52 20.83 21.77 30.49 35.00 25.15
Irrigation (Electric
motor/Submersible) 26.21 28.68 27.08 27.39 29.33 27.03
Diesel engine 11.88 15.00 15.83 18.06 17.50 15.03
Generator 1.67 1.18 7.36 9.86 8.67 5.50
Use of diesel (litre)
Owned 41.63 73.60 90.45 114.10 129.50 91.15
Hired 76.73 33.99 24.15 12.17 0.00 27.49
Total 118.36 107.59 114.60 126.29 129.50 118.64
Seed (kgs) 4.20 4.423 4.212 4.486 4.158 4.305
Manure & Fertilisers (Kg)
Urea 296.88 268.38 270.83 253.47 258.33 267.97
DAP 125.00 120.59 128.47 120.83 118.17 120.00
MOP - 7.35 6.94 13.89 7.17 7.03
Zinc 3.13 2.94 10.42 5.97 5.00 5.72
Other 20.83 - 13.89 0.35 2.17 6.73
FYM (qtl) 8.70 11.10 11.70 7.50 9.90 10.90
Weedicides (No.) 0.75 0.65 0.72 1.06 1.07 0.85
Insecticides (No.) 5.17 6.29 5.39 5.61 6.07 5.73
Yield (Qtl/ha)
Main 16.96 16.84 16.72 16.14 16.25 16.52
By product 37.71 47.79 53.47 49.86 50.33 48.50

29
The cost-return structure of cotton cultivation on sample farms has been shown in Table
3.2.6. It is quite obvious from the table that relative share of human labour in total variable
cost was 35.62 per cent while among various farm categories the highest (38.13%) share was
on large farms while the lowest (32.91%) share was on marginal farms. This shows the
greater availability of human labour with increase in the farm size. The hired machine
charges (Excluding diesel charges) were 3.03 per cent of the total variable cost in overall
situation while category-wise analysis showed that highest share (8.04%) was on marginal
farms and there was no hired machine use on large farms. The relative share of diesel use was
11.70 per cent of total variable cost in overall scenario which constituted 8.99 per cent from
owned sources and 2.71 per cent from hired one. The highest share (12.47%) of diesel use in
total variable cost was on medium farms while lowest share (10.80%) was found on small
farms. The total variable cost was estimated at Rs. 47225 per hectare in overall situation
while among various farm size categories, highest total variable cost (Rs.49663) was
estimated at large farms and lowest (Rs.46271) at marginal farms. In overall, the returns over
variable cost (ROVC) worked out to be Rs.24883 per hectare from cotton cultivation with
highest (Rs.30048) on marginal farms and lowest (Rs.21809) on large farms due to lower
gross returns and higher total variable cost on large farms. The benefit-cost (B:C) ratio was
1.53 in an overall situation in cotton cultivation while farm category wise analysis brought
out that B:C ratio was highest (1.65) on marginal and lowest (1.44) on large farms.

30
Table 3.2.6: cost-return structure of cotton cultivation on sample farms, Punjab, 2012-13
(Rs/ha)
Particulars Marginal Small Semi medium Medium Large Overall
Value percent Value percent Value percent Value percent Value percent Value percent
Human Labour 15230 32.91 16437 35.41 15838 34.58 17461 37.04 18939 38.13 16821 35.62
Machine use
Hired Machine
Charges* 3718 8.04 2093 4.51 1841 4.02 193 0.41 0 0.00 1433 3.03
Use of diesel
Owned 1939 4.19 3428 7.38 4212 9.20 5314 11.27 6031 12.14 4245 8.99
Hired 3573 7.72 1583 3.41 1125 2.46 567 1.20 0 0.00 1280 2.71
Total 5512 11.91 5010 10.80 5337 11.65 5880 12.47 6031 12.14 5525 11.70
Seed 5750 12.43 5824 12.55 5406 11.80 6333 13.43 6008 12.10 5868 12.43
Manure &
Fertilizers 9214 19.91 8994 19.38 9926 21.67 8445 17.91 9461 19.05 9442 19.99
Weedicides 490 1.06 463 1.00 497 1.09 747 1.58 737 1.48 590 1.25
Insecticides 5563 12.02 6794 14.64 6174 13.48 7271 15.42 7633 15.37 6734 14.26
Interest @ 7% for
half the period of
crop
796 1.72 798 1.72 788 1.72 811 1.72 854 1.72 812 1.72
Total variable cost 46271 100.00 46414 100.00 45806 100.00 47141 100.00 49663 100.00 47225 100.00
Gross returns
Main 74204
71991
70642
70050
68543
69815
By product 2116
2139
2248
2069
2929
2293
Total 76320
74130
72890
72120
71472
72108
ROVC 30048
27716
27083
24979
21809
24883
Benefit-cost ratio 1.65
1.60
1.59
1.53
1.44
1.53
* Except diesel

31
3.2.4 Sugarcane
The physical input use in sugarcane cultivation has been given in Table 3.2.7. A perusal of
the table reveals that in overall, 1122.92 human labour hours per hectare were spent on
various sugarcane cultivation related farm operations. The farm category wise analysis
revealed that on large farms maximum i.e. 1063.07 labour hours were utilized to undertake
various farm operations while on marginal farms labour hours spent were 952.50, which were
minimum among all the farm categories. This shows that sugarcane is highly labour intensive
crop and major farm operations included; sowing, fertilization, plant protection measures,
harvesting, loading, transportation and marketing. The tractor hours spent on various farm
operations were 22.23 in an overall situation while among various farm categories, a
maximum of 22.72 hours was the tractor use on large farms and a minimum of 16.46 hours
on marginal farms. As irrigation is very crucial for raising each crop, therefore, in sugarcane
cultivation also 138.06 hours were spent during irrigation using electric motor/ submersible
pump while category wise analysis revealed that a maximum of 146.09 hours were utilized
on large farms and a minimum of 137.50 hours were spent for irrigating sugarcane crop on
small farms. On the other hand, diesel engine and generator use was for 9.82 and 13.91 hours
for irrigating sugarcane fields in overall situation while generator use was maximum (13.13
hrs.) on large farms and minimum (6.67 hrs.) on small farms. The diesel engine use was
20.11 hours on semi-medium farms which was maximum among various farm categories. In
overall, 192 litres of diesel was consumed per hectare in sugarcane cultivation with 176.59
litres from owned sources and 15.41 litres while using hired machinery. The category-wise
analysis revealed that a maximum of 205.91 litres of diesel was consumed for various farm
operations on medium farms while on small farms diesel use was 191.76 litres which was
minimum among various farm categories. The proportion of diesel consumption from hired
sources was more on marginal and small farms as compared to other farm categories. The
sugarcane yield obtained was 832.29 quintals per hectare in an overall situation while among
various farm categories highest cane yield (859.04 qtls.) was obtained on medium farms and
lowest (820.83 qtls) on marginal farms.

32
Table 3.2.7: Physical input use in sugarcane cultivation on sample farms, Punjab, 2012-
(Hours/ha)
Particulars Marginal Small Semi medium Medium Large Overall
Human Labour 952.50 1084.50 1072.16 1047.47 1063.07 1122.92
Machine use
(Tractor) 16.46 20.38 21.19 22.53 22.72 22.23
Irrigation (Electric
motor/Submersible) 139.17 137.50 137.73 139.81 146.09 138.06
Diesel engine - - 20.11 16.35 2.34 9.82
Generator 6.67 7.00 15.68 8.46 13.13 13.91
Use of diesel (litre)
Owned 110.00 138.38 186.65 190.53 192.15 176.59
Hired 83.75 53.38 8.76 15.38 1.30 15.41
Total 193.75 191.76 195.41 205.91 193.45 192.00
Seed (qtls) 83.33 85.00 90.90 90.38 87.11 88.41
Manure & Fertilizers (Kg)
Urea 445.54 425.00 446.36 500.00 492.19 450.52
DAP 270.00 280.00 284.09 292.50 269.53 273.96
MOP 0.00 12.50 17.05 4.81 23.44 14.32
Zinc 13.33 10.00 4.55 3.85 7.81 7.81
Others - - 1.14 - 39.06 13.28
FYM (qtl) - - 62.27 69.23 23.44 50.00
Weedicides (No.) 1.00 0.80 0.82 1.23 0.88 0.96
Insecticides (No.) 2.00 2.20 2.36 2.31 3.06 2.54
Yield (qtl/ha)
Main 820.83 850.50 840.27 859.04 858.13 832.29
By product 91.67 87.50 82.29 89.42 86.72 88.54

33
The cost and return structure of sugarcane cultivation has been given in Table 3.2.8. A
perusal of the table reveals that the share of human labour in total variable cost was 46.79 per
cent. The farm category-wise analysis showed that on medium farms the share of human
labour in total variable cost was 47.44 per cent which was highest while on marginal farms
this share was 42.25 per cent which was lowest. The proportion of hired machine charges
(Excluding diesel) in total variable cost was just 2.05 per cent in overall situation and this
proportion declined with farm size with maximum (11.43%) on marginal farms and minimum
(0.12%) on large farm category. The relative share of diesel use in total variable cost was
found to be 8.60 per cent with larger share from owned machinery (7.91%) and smaller share
from hired machine use (0.69%). The farm category wise analysis revealed that share of
diesel consumption in total variable cost was highest (9.13%) on marginal farms and lowest
(8.93%) on small farm category. This shows that farmers on small farms were using diesel
judiciously as compared to their counterparts. Overall, total variable cost in sugarcane
cultivation was estimated at Rs. 104012 per hectare with a maximum of Rs.105303 on
medium farms and a minimum of Rs.99842 on marginal farms. The returns over variable
cost (ROVC) in sugarcane cultivation were Rs. 110258 per hectare in overall situation while
among various farm categories; returns were Rs.118775 on small farms which were highest
among farm categories and Rs. 112783 on marginal farms which were lowest. Overall,
benefit-cost (B:C) ratio was 2.06 in sugarcane cultivation with 2.19 on small farms, which
was maximum and 2.10 on medium farms, which was lowest among various farm categories.

34
Table 3.2.8: Cost - return structure of sugarcane cultivation on sample farms, Punjab, 2012-13
(Rs/ha)
Particulars Marginal Small Semi medium Medium Large Overall
Value percent Value percent Value percent Value percent Value percent Value percent
Human Labour 41757 42.25 43893 43.90 45012 45.06 49960 47.44 48009 46.29 48663 46.79
Machine use
Hired Machine
Charges* 11300 11.43 3964 3.97 1398 1.40 2059 1.96 126 0.12 2132 2.05
Use of diesel
Owned 5123 5.18 6444 6.45 8692 8.70 8873 8.43 8948 8.63 8224 7.91
Hired machinery 3900 3.95 2486 2.49 408 0.41 716 0.68 61 0.06 718 0.69
Total 9023 9.13 8930 8.93 9100 9.11 9589 9.11 9009 8.69 8941 8.60
Seed 18750 18.97 24750 24.76 24943 24.97 22894 21.74 25113 24.21 24038 23.11
Seed treatment 1250 1.26 1450 1.45 682 0.68 996 0.95 1395 1.35 1120 1.08
Manure &
Fertilizers 9286 9.39 9356 9.36 10606 10.62 10784 10.24 10165 9.80 10193 9.80
Weedicides 833 0.84 800 0.80 756 0.76 1327 1.26 1008 0.97 1004 0.97
Insecticides 3300 3.34 3450 3.45 4023 4.03 4133 3.92 5391 5.20 4404 4.23
Interest @ 7% for
half the period of
crop
3342 3.38 3381 3.38 3378 3.38 3561 3.38 3508 3.38 3517 3.38
Total variable cost 98842 100.00 99975 100.00 99898 100.00 105303 100.00 103723 100.00 104012 100.00
Returns
Main 205208
212625
210063
214760
214533
208073
By product 6417
6125
5760
6259
6070
6198
Total 211624
218750
215823
221019
220603
214270
ROVC 112783
118775
115925
115717
116880
110258
Benefit-cost ratio 2.14
2.19
2.16
2.10
2.13
2.06
* Except diesel
35
3.2.5 Maize
The physical input use in maize cultivation on the sample farms have been depicted in Table
3.2.9. A perusal of the table reveals that overall 311.84 human labour hours were used while
conducting various farm operations in maize crop on the sample farms. The category-wise
analysis revealed that highest (314.27 hrs.) numbers of labour hours were spent on large
farms for raising maize crop while lowest (283.50 hrs.) on the small farms. This shows the
higher availability of labour on large farms for undertaking various farm operations as
compared to other farm categories. Overall, tractor use was 11.19 hours in undertaking
various cultivation practices in maize cultivation while among various farm categories, on
medium farms tractor use was 14.20 hours, which was maximum and 8.39 hours on marginal
farms which was minimum. The combine harvester use was 1.29 hours in overall scenario
while a maximum of 2.35 hours were spent on small farm category during harvesting using
combine harvester. On the other hand combine harvester was not used on semi-medium farms
for maize harvesting. The irrigation hours estimated on the use of electric motor/ submersible
pumps were 33.88 hours in overall situation while on large farms, these were highest (38.75
hrs.) and lowest on small farms (31.25 hrs.). Diesel engine and generator were used for
irrigation purpose by some of the respondents and their use was estimated at 6.54 and 6.20
hours respectively in an overall scenario. The diesel engine use was highest (10.25 hrs.) on
semi-medium farms among various farm size categories while generator use for irrigating
maize crop was maximum (8.23 hrs.) on medium farms. The total diesel consumption on the
sample farms in overall scenario was 125.83 litres in maize cultivation constituting 94.41
litres from owned sources and 31.42 litres from hired machinery. The farm category-wise
analysis revealed that highest (139.02 litrs.) diesel consumption was on small farms and
lowest (92.08 ltrs.) on marginal farms. On medium farms, the diesel consumption from
owned sources was 115.75 litres which was maximum among various farm categories while
on marginal farms diesel consumption was 24.91 litres and it was minimum level of diesel
consumption from owned sources. The diesel consumption from hired machinery was 67.17
litres per hectare on marginal farms, which was highest among all the farm categories, while
a minimum of 10.42 litres was the hired diesel consumption on large farms. The highest
yield (43.63 qtls) of maize was on semi-medium farms and lowest (40.79 qtls) on medium
farms while in an overall situation, 42.32 quintal was the maize yield on sample farms.

36
Table 3.2.9: Physical input use in maize cultivation on sample farms, Punjab, 2012-13
(Hours/ha)
Particulars Marginal Small Semi
medium Medium Large Overall
Human Labour 295.51 283.50 299.89 309.19 314.27 311.84
Machine use (Tractor) 8.39 9.58 12.13 14.20 10.67 11.19
Combine Harvester 2.16 2.35 - 1.25 1.04 1.29
Electric
motor/Submersible 34.77 31.25 36.88 32.92 38.75 33.88
Diesel engine 2.73 - 10.25 7.29 5.00 6.54
Generator 6.82 8.00 4.69 8.23 6.33 6.20
Use of diesel (litre)
Owned 24.91 93.08 101.56 115.75 112.47 94.41
Hired 67.17 45.94 12.40 23.18 10.42 31.42
Total 92.08 139.02 113.96 138.93 122.89 125.83
Seed (kg) 22.27 23.75 23.13 29.58 21.46 24.20
Seed treatment 0.23 - - 0.21 0.42 0.21
Manure & Fertilizers (Kg)
Urea 240.32 265.63 250.00 296.88 260.42 252.93
DAP 101.14 93.75 193.75 183.33 145.83 148.67
MOP 2.27 - - 15.63 - 4.52
Zinc - - - 6.25 - 1.60
Other - - - 2.29 0.42 0.69
FYM (qtl) 27.27 - 18.75 25.00 - 15.96
Weedicides (No.) 0.91 1.00 0.63 1.17 0.58 0.85
Insecticides (No.) 0.73 1.00 0.75 1.58 1.42 1.15
Yield (qtl/ha)
Main 42.50 41.50 43.63 40.79 40.83 42.32
By product 14.09 12.00 10.00 8.25 9.92 9.06
The cost-return structure of maize cultivation on sample farms has been given in Table
3.2.10. It is clear from the table that the relative share of human labour in total variable cost
was 35.67 per cent in overall situation while according to farm categories; this share was
highest (37.73%) on large farms and lowest (32.74%) on medium farms. The hired machine
charges (Excluding diesel charges) were 5.59 per cent of the total variable cost in overall
scenario while category wise analysis revealed that highest share (15.99%) was on marginal
farms and lowest (1.74%) share on large farm category. In overall, the relative share of diesel
use in total variable cost was 19.39 per cent of total variable cost further constituting 14.55
per cent from owned sources and 4.84 per cent from hired machinery. The highest share
(22.21%) of diesel use in total variable cost was on small farms and lowest share (15.44%) on

37
marginal farms. The total variable cost was estimated at Rs.30217 per hectare in an overall
situation while according to farm size categories, total variable cost was Rs 32606 per hectare
on medium farms, which was highest, however, Rs. 28467 was the total variable cost on large
farms which was lowest. In overall, the returns over variable cost (ROVC) were about
Rs.21019 per hectare from maize cultivation while farm category-wise analysis showed that
returns were highest (Rs.23869) on semi-medium farm category and lowest (Rs.16372) on
medium farms. The benefit-cost (B:C) ratio in maize cultivation was 1.70 in an overall
scenario, while according to farm size category, B:C ratio was highest (1.83) on semi-
medium farms and lowest (1.69) on marginal farms.

38
Table 3.2.10: Cost- return structure of maize cultivation on sample farms, Punjab, 2012-13
(Rs/ha)
Particulars Marginal Small Semi medium Medium Large Overall
Value percent Value percent Value percent Value percent Value percent Value percent
Human Labour 10396 33.76 9923 34.05 10361 36.10 10676 32.74 10742 37.73 10777 35.67
Machine use
Hired Machine
Charges* 4925 15.99 3142 10.78 704 2.45 1143 3.51 494 1.74 1689 5.59
Use of diesel
Owned 1160 3.77 4335 14.87 4730 16.48 5390 16.53 5238 18.40 4397 14.55
Hired machinary 3597 11.68 2139 7.34 577 2.01 1079 3.31 485 1.70 1463 4.84
Total 4757 15.44 6474 22.21 5307 18.49 6470 19.84 5723 20.10 5860 19.39
Seed & seed
treatment 4277 13.89 4264 14.63 4781 16.66 4833 14.82 4494 15.79 4489 14.86
Manure & Fertilizers 4213 13.68 3684 12.64 6250 21.78 6925 21.24 5073 17.82 5369 17.77
Weedicides 898 2.91 813 2.79 459 1.60 738 2.26 452 1.59 661 2.19
Insecticides 805 2.61 344 1.18 344 1.20 1260 3.87 1000 3.51 853 2.82
Interest @ 7% for
half the period of
crop
530 1.72 501 1.72 494 1.72 561 1.72 490 1.72 520 1.72
Total variable cost 30799 100.00 29144 100.00 28700 100.00 32606 100.00 28467 100.00 30217 100.00
Returns
Main 51000
49593
51920
48459
48384
50657
By product 986
780
650
520
645
580
Total 51986
50373
52570
48978
49028
51237
ROVC 21187
21228
23869
16372
20561
21019
Benefit-cost ratio 1.69
1.73
1.83
1.50
1.72
1.70
* Except diesel

39
3.2.6 Wheat
The physical input use in wheat cultivation on the sample farms have been shown in Table
3.2.11. It is quite obvious from the table that overall 124.53 human labour hours per hectare
were estimated to be have been used while raising wheat crop. The category wise analysis
revealed that highest (133.58 hrs.) number of labour hours were spent on marginal farms
while lowest (112.92 hrs.) on the large farms. Thus, human labour use declined with increase
in farm size in wheat crop. The tractor use was 20.13 hours in overall scenario while on
medium farms it was 22.87 hours which was highest among various farm categories and
17.88 hours on marginal farms which was lowest. The average combine harvester hours were
2.33 hours per hectare for harvesting in overall while on marginal farms combine harvesting
hours were highest (2.69 hrs.) and lowest (1.89 hrs.) on large farms. The irrigation hours
worked out on the basis of electric motor/ submersible pump use were 54.14 hours in overall
scenario while on marginal farms these were highest (58.75 hrs.) and on semi-medium farms
lowest (53.48 hrs.). Diesel engine and generator were used as additional source of irrigation
by some of the respondents and their use was estimated at 5.43 and 1.07 hours respectively,
in an overall scenario. The diesel engine use for irrigation on various farm size categories was
higher as compared to generator use for irrigating wheat crop. The diesel engine use was
maximum (8.05 hrs.) on marginal farms and generator use (1.58 hrs.) on semi-medium farms.
The total diesel consumption in wheat crop on the sample farms in overall scenario was
144.13 litres constituting 75.14 litres from owned and 68.99 litres from hired sources. The
farm category-wise analysis revealed that total diesel use in wheat cultivation on semi-
medium farms was 147.52 litres which was highest as compared to 129.39 litres on marginal
farms which was lowest. On large farms, the diesel consumption from owned sources was
97.18 litres which was maximum on all the farm size categories while on marginal farms
diesel consumption was 35.46 litres and it was minimum level of diesel consumption from
owned sources. The diesel consumption through hired sources was 93.93 litres per hectare on
marginal farms which was highest among all the farm categories while lowest (48.19 ltrs.)
diesel consumption was on large farms. The average yield obtained on the sample farms in
overall scenario was 44.62 quintals per hectare while wheat grain yield was highest (45.71
qtls.) on large farms and lowest (43.17 qtls.) on marginal farms.

40
Table 3.2.11: Physical input use in wheat cultivation on sample farms, Punjab, 2012-13
(Hours/ha)
Particulars Marginal Small Semi medium Medium Large Overall
Human Labour 133.58 127.47 121.12 120.01 112.92 124.53
Machine use (Tractor) 17.88 18.96 21.01 22.87 22.52 20.13
Combine harvester 2.69 2.48 2.32 2.32 1.89 2.33
Irrigation (Electric
motor/Submersible) 58.75 56.90 53.48 56.69 54.46 54.14
Diesel engine 8.05 3.17 5.13 6.82 4.21 5.43
Generator 0.77 0.69 1.58 1.48 0.81 1.07
Use of diesel (litre)
Owned 35.46 62.21 77.66 86.97 97.18 75.14
Hired 93.93 72.89 69.86 50.35 48.19 68.99
Total 129.39 135.10 147.52 137.32 145.37 144.13
Seed (Kg) 108.64 107.00 105.79 107.20 107.29 107.16
Manure & Fertilizers (Kg)
Urea 252.27 289.79 266.46 288.14 301.25 280.02
DAP 132.95 139.17 137.29 141.95 138.75 138.10
MOP 1.14 1.04 1.04 2.12 - 1.06
Zinc 0.91 0.83 0.63 1.27 0.63 0.85
Other 0.05 - 0.08 0.59 2.88 0.73
FYM (qtl) 20.45 10.00 21.25 6.99 16.25 14.92
Weedicides (No.) 0.55 0.63 0.65 0.81 0.70 0.67
Insecticides (No.) 1.53 1.67 1.73 1.68 1.92 1.71
Yield (Qtl./ha)
Main 43.17 44.81 45.50 43.76 45.71 44.62
By product 33.82 35.25 33.00 33.54 32.65 33.65

41
The cost-return structure of wheat cultivation has been given in Table 3.2.12. The results
shown in the table reveals that in overall, share of human labour in total variable cost was
19.10 per cent. The category-wise analysis revealed that on medium farms the share of
human labour in total variable cost was 19.91 per cent which was highest while on marginal
farms this share was 18.19 per cent, which was lowest among different farm categories. The
proportion of hired machine charges (Excluding diesel) in total variable cost was 14.60 per
cent in an overall scenario and this proportion declined with farm size with maximum
(23.79%) on marginal farms and minimum (10.97%) on large farm category. The relative
share of diesel use in total variable cost was found to be 26.28 per cent with 13.7 per cent
share from owned machinery and 12.58 per cent from hired machine use. The farm category
wise analysis revealed that share of diesel consumption in total variable cost was highest
(27.52%) on large farms and lowest (22.39%) on marginal farm category. This shows that
farmers on marginal farms were using diesel judiciously as compared to their counterparts
from other farm categories. In overall, total variable cost on the sample farms was worked out
at Rs. 25542 per hectare while farm category wise analysis revealed that variable cost was
highest (Rs.26909) on marginal farms and lowest (Rs. 24538) on medium farm category. The
returns over variable cost (ROVC) in wheat cultivation were estimated at Rs. 39806 per
hectare in overall scenario and Rs.40330 on large farms which were highest among farm
categories and Rs. 35422 on marginal farms which were lowest. Overall, benefit-cost (B:C)
ratio was 2.56 in wheat cultivation while it was 2.64 on large farms, which was highest and
2.32 on marginal farms which was lowest among various farm categories.

42
Table 3.2.12: cost-return structure of wheat cultivation on sample farms, Punjab, 2012-13
(Rs/ha)
Particulars Marginal Small Semi medium Medium Large Overall
Value percent Value percent Value percent Value percent Value percent Value percent
Human Labour 4894 18.19 4927 19.37 4725 18.85 4885 19.91 4618 18.77 4879 19.10
Machine use
Hired Machine Charges* 6402 23.79 3828 15.05 3332 13.29 2846 11.60 2699 10.97 3728 14.60
Use of diesel
Owned 1651 6.14 2897 11.39 3617 14.43 4050 16.51 4526 18.40 3499 13.70
Hired 4374 16.26 3394 13.34 3254 12.98 2345 9.56 2244 9.12 3213 12.58
Total 6026 22.39 6292 24.73 6871 27.41 6395 26.06 6770 27.52 6712 26.28
Seed 2580 9.59 2610 10.26 2722 10.86 2693 10.98 2743 11.15 2671 10.46
Manure & Fertilizers 4804 17.85 5067 19.92 4959 19.78 5180 21.11 5136 20.88 5032 19.70
Weedicides 764 2.84 957 3.76 803 3.20 924 3.77 863 3.51 864 3.38
Insecticides 978 3.63 1321 5.19 1228 4.90 1192 4.86 1347 5.47 1217 4.76
Interest @ 7% for half
the period of crop 463 1.72 438 1.72 431 1.72 422 1.72 423 1.72 439 1.72
Total variable cost 26909 100.00 25438 100.00 25071 100.00 24538 100.00 24599 100.00 25542 100.00
Gross returns
Main 55471
57584
58462
55471
57584
58462
By product 6860
7335
6882
6860
7335
6882
Total 62331
64919
65344
62331
64919
65344
ROVC 35422
38496
39090
37793
40330
39806
Benefit-cost ratio 2.32
2.55
2.61
2.54
2.64
2.56
* Except diesel

43
3.2.7 Sunflower
The physical input use in sunflower cultivation on the sample farms have been given in Table
3.2.13. A perusal of the table reveals that overall 218.48 human labour hours per hectare were
estimated to have been used in overall situation on the sample farms in sunflower cultivation
while farm category wise analysis revealed that 225.21 human labour hours were spent on
medium farms and 203.44 hours on large farm categories. The tractor use in various farm
operations worked out to be 18.95 hours in overall scenario while a minimum of 17.92 hours
tractor use was estimated on medium and 19.72 on large farm category. Also, combine
harvester was used to harvest sunflower crop and 2.5 hours per hectare were spent on the
sample farms on this particular operation. For irrigating sunflower crop, electric motor/
submersible pumps were used for 82.36 hours per hectare on the sample farms while on
medium farm category these hours were 84.17 and 81.25 on large farm category. In overall,
generator was also used for 5.64 hours for irrigation purpose as a supplementary source of
irrigation while on medium farm category generator use was 6 hours and 5.63 hours on large
farms. The total consumption of diesel for various farm operations in sunflower crop was
estimated at 175.73 litres constituting 147.05 litres from owned sources and 28.68 litres from
hired machine use. The farm category-wise diesel consumption varied from 174.46 litres on
medium farms to 182.83 litres on large farms. In overall situation, the sunflower grain yield
estimated on the sample farms was 17.11 quintals per hectare while on large farms, yield
obtained was 17.81 quintals and on medium farms 16.85 quintals.

44
Table 3.2.13: Physical input use of sunflower cultivation, sample farmers, Punjab, 2012-13
(Hours/ha)
Particulars Medium Large Overall
Human Labour 225.21 203.44 218.48
Machine use (Tractor) 17.92 19.72 18.95
Combine harvester 2.50 2.50 2.50
Electric motor/Submersible 84.17 81.25 82.36
Diesel engine - - -
Generator 6.00 5.63 5.64
Use of diesel (litre)
Owned 143.39 155.31 147.05
Hired 31.07 27.52 28.68
Total 174.46 182.83 175.73
Seed (kg.) 4.17 4.38 4.29
Seed treatment - 0.63 0.36
Manure & Fertilisers (Kg.)
Urea 250.00 292.50 285.71
DAP 83.33 125.00 107.14
Weedicides (No.) 0.67 0.25 0.43
Insecticides (No.) 2.33 2.00 2.14
Yield (qtl/ ha) 16.85 17.81 17.11
The cost-return structure of sunflower cultivation has been depicted in Table 3.2.14. It is
quite obvious from the table that the relative share of human labour use in sunflower
cultivation was estimated at 28.13 per cent of total variable cost while on medium category
farms, the proportionate share of human labour was 29.17 per cent and 26.39 per cent on
large farms. The relative share of hired machine charges (Except diesel) in total variable cost
was 5.45 per cent in overall situation while this share was 5.24 per cent on medium and 5.51
per cent on large farm categories. The share of diesel use in total variable cost in sunflower

45
cultivation was 29.32 per cent constituting 24.54 per cent from owned sources and 4.79 per
cent from hired one. The category wise analysis revealed that on medium farms share of
diesel consumed on various farm operations in sunflower cultivation was 28.93 per cent and
on large farms this share was 30.65 per cent. The total variable cost was worked out at Rs.
27907 per hectare in overall scenario and Rs 28045 on medium and Rs. 27779 on large farm
categories. The returns over variable cost (ROVC) in sunflower cultivation worked out to be
Rs.16322 per hectare while on medium farms the returns were Rs.15597 and on large farms
Rs.17868 per hectare. In overall, benefit-cost (B:C) ratio was 1.58 in sunflower cultivation
while on medium farms this ratio was 1.56 and 1.64 on large farm category.
Table 3.2.14: Cost- return structure of sunflower cultivation on sample farmers, Punjab, 2012-13
(Rs/ha)
Particulars Medium Large Overall
Value Percent Value Percent Value Percent
Human Labour 8182 29.17 7331 26.39 7851 28.13
Machine use
Hired Machine
Charges* 1470 5.24 1531 5.51 1521 5.45
Use of diesel
Owned 6668 23.77 7233 26.04 6848 24.54
Hired 1447 5.16 1282 4.61 1336 4.79
Total 8115 28.93 8514 30.65 8184 29.32
Seed & seed
treatment 2217 7.90 2031 7.31 2196 7.87
Manure &
Fertilizers 3350 11.95 3688 13.27 3514 12.59
Weedicides 230 0.82 388 1.39 321 1.15
Insecticides 4000 14.26 3819 13.75 3839 13.76
Interest @ 7% for
half the period of
crop 482 1.72 478 1.72 480 1.72
Total variable cost 28045 100.00 27779 100.00 27907 100.00
Gross returns 43642
45647
44229
ROVC 15597
17868
16322
Benefit-cost ratio 1.56
1.64
1.58
* Except diesel

46
3.3 Sources and frequency of diesel purchase
3.3.1 Sources of diesel purchase
The sources of diesel purchase and distance of petrol pump from the farmers house have been
given in Table 3.3.1. A perusal of the table reveals that about 95 per cent of the respondent
farmers purchased diesel from the private petrol pumps and about five per cent from co-
operative society. The category-wise distribution shows that all the marginal farmers, nearly
98 per cent of the small and semi-medium, about 91 per cent of the medium category and 90
per cent of the large farmers purchased diesel from private petrol pumps. As far as distance of
the petrol pump from the farmer’s house is concerned, about 95 per cent of the respondents
reported location of the petrol pump with-in 5 Km. and about four per cent with-in 10 Km
and just one per cent beyond 10 Km. of their house.
Table 3.3.1: Source of diesel purchase and distance of petrol pump from farmer’s house, Punjab, 2012-13
Number
Source of diesel
purchase Marginal Small Semi- medium Medium Large Overall
Co-operative society - 1
(1.89)
1
(1.82)
5
(8.77)
6
(10.00)
13
(4.91)
Private petrol pump 40
(100.00)
52
(98.11)
54
(98.18)
52
(91.23)
54
(90.00)
252
(95.09)
Distance of petrol pump from house:
i)With-in the village - - - - - -
ii)With-in 5Km. 39
(97.50)
52
(98.11)
52
(94.55)
53
(92.98)
58
(96.67)
254
(95.55)
iii) With-in 10Km. 1
(2.50)
1
(1.89)
3
(5.45
3
(5.26)
2
(3.33)
10
(3.77)
iv) Beyond 10Km. - - - 1
(1.75)
- 1
(0.38) Figures in parentheses are percentages of total
3.3.2 Frequency and quantity of diesel purchase
The frequency and one-time quantity of diesel purchase have been given in Table 3.3.2. It is
quite obvious from the table that frequency of diesel purchase by about 61per cent of the
respondents was seasonal while 39 per cent purchased diesel on monthly basis. Mostly,
marginal (92.50%) and small (58.49%) farmers purchased diesel on monthly basis while
medium (96.49%), semi-medium (72.73%) and large (70%) farmers purchased on seasonal
basis. One time diesel purchase by 50.57 per cent of the respondents was 50 litres while 8.68
per cent purchased 100 litres to 150 litres, 28.30 per cent 200 litres and 12.45 per cent

47
purchased diesel more than 200 litres at one time. Mostly marginal (95%) small (84.91%) and
semi-medium (50.91%) farmers purchased 50 litres diesel at one time while medium
(64.91%) and large (73.33%) category farmers purchased 200 litres or more than that at one
time depending upon their requirement.
Table 3.3.2: Frequency and one-time quantity of diesel purchase on the sample farms, Punjab, 2012-13
Number
Frequency of diesel
purchase Marginal Small Semi- medium Medium Large Overall
Monthly 37
(92.50)
31
(58.49)
15
(27.27)
2
(3.51)
18
(30.00)
103
(38.77)
Seasonal 3
(7.50)
22
(41.51)
40
(72.73)
55
(96.49)
42
(70.00)
162
(61.13)
Quantity of diesel purchase (one-time):
i)50 litres 38
(95.00)
45
(84.91)
28
(50.91)
12
(21.05)
11
(18.33)
134
(50.57)
ii)100 litres. - 2
(2.77)
8
(14.55)
7
(12.28)
5
(8.33)
22
(8.30)
iii) 150 litres. - - - 1
(1.75)
- 1
(0.38)
iv) 200 litres - 3
(5.66)
16
(29.09)
30
(52.63)
26
(43.33)
75
(28.30)
v) > 200 litres 2
(5.00)
3
(5.66)
3
(5.45)
7
(12.28)
18
(30.00)
33
(12.45)
Figures in parentheses are percentages of total

48
3.4 Diesel and power subsidy withdrawal impact
This section deals with the impact of withdrawal of diesel as well as power subsidy to the
agricultural sector in the Punjab state. Simulations using changing diesel prices have been
undertaken to see the resultant change in the cost of cultivation/ production of various crops
while keeping change in prices of other inputs and output level at the same level (cetris
paribus). Also, diesel price hike coefficient (Δ cost of production/Δ diesel price) has been
worked out to see the likely impact of minor change in the diesel price on cost of production.
3.4.1 Paddy
The changing diesel prices and its impact on cost of production of paddy have been shown in
Table 3.4.1. A perusal of the table reveals the impact of hike in diesel price as on 1st June,
2014 and with zero diesel subsidy on this date. This increase in diesel price resulted in
pushing up cost of cultivation as well as cost of production of paddy. In an overall scenario,
the cost of production of paddy was Rs. 494 per quintal at I (base) level (1st February, 2013)
which increased to Rs. 517 per quintal at II (current) level (1st June, 2014) and to Rs. 528 III
(proposed) level (Zero subsidy), respectively. The diesel price hike coefficient was worked
out at 2.53 showing that with one rupee increase in diesel price, the cost of production of
paddy increased by 2.53 rupees. The farm category-wise analysis revealed that the impact of
diesel price hike was more on large (2.97), semi-medium (2.64) and medium (2.48) farms as
compared to marginal (2.29) and small (2.36) farm categories.
3.4.2 Basmati
Table 3.4.2 shows the changing diesel prices and its impact on cost of production of basmati
on the sample farms. A perusal of the table reveals that with hike in diesel price, the cost of
cultivation/ production of basmati increased showing the impact of hike in diesel price as on
1st June, 2014 as well as with zero diesel subsidy. In overall, the cost of production of basmati
was Rs. 890 per quintal at I (base) level (1st February, 2013) which increased to Rs. 921 at II
(current) level (1st June, 2014) and further Rs.936 at III (proposed) level (Zero subsidy). The
diesel price hike coefficient was worked out to be 3.36 showing that with one rupee increase
in diesel price, the cost of production of basmati increased by 3.36 rupees. The farm category
wise analysis revealed that the impact of diesel price hike was more on marginal (3.56), semi-
medium (3.30) and small (3.20) farms as compared to large (2.93) and medium (2.87) farm
categories.

49
Table 3.4.1: Changing diesel prices and its impact on (Simulations- cetris paribus) cost of production of paddy in Punjab, 2012-13 (Rs./ ha)
Particulars Marginal Small Semi-
medium
Medium Large Overall
I (Base)
1st Feb, 2013
Cost of cultivation (Excluding diesel) 25328 24154 23249 25158 22228 23467
Cost of cultivation (Including diesel @ Rs.46.57
per litre)
32084 30532 31047 32629 31019 30835
Yield (qtl/ ha) 63.47 62.32 63.42 64.58 63.49 62.47
Cost of production (Rs/ qtl) 505 490 490 505 489 494
Gross returns 82384 80580 81748 82662 81267 80461
ROVC 50300 50048 50701 50033 50248 49626
II (Current)
1st June, 2014
Cost of cultivation (Including diesel @ Rs. 55.91
per litre)
33440 32381 32610 34126 32784 32313
Yield (qtl/ ha) 63.47 62.32 63.42 64.58 63.49 62.47
Cost of production (Rs/ qtl) 527 520 514 528 516 517
Gross returns 82384 80580 81748 82662 81267 80461
ROVC 48944 48199 49138 48536 48483 48148
III(Proposed)
Zero subsidy
On 1st June, 2014
Cost of cultivation (Including diesel @ Rs. 60.32
per litre)
34080 33030 33349 34834 33617 33011
Yield(qtl/ ha) 63.47 62.32 63.42 64.58 63.49 62.47
Cost of production (Rs/ qtl) 537 530 526 539 529 528
Gross returns 82384 80580 81748 82662 81267 80461
ROVC 48304 47550 48399 47828 47650 47450
Diesel price hike coefficient
(Δ cost of production/Δ diesel price)
2.29 2.36 2.64 2.48 2.97 2.53

50
Table 3.4.2: Changing diesel prices and its impact on (Simulations- cetris paribus) cost of production of basmati in Punjab, 2012-13 (Rs./ ha)
Particulars Marginal Small Semi-
medium
Medium Large Overall
I (Base)
1st Feb, 2013
Cost of cultivation (Excluding diesel) 27488 27016 26533 26222 28927 27447
Cost of cultivation (Including diesel @ Rs.46.57
per litre)
33723 32730 32227 31600 34229 33296
Yield (qtl/ ha) 37.66 38.38 37 39.42 38.79 37.42
Cost of production (Rs/ qtl) 895 853 871 802 882 890
Gross returns 95645 96792 87953 93934 91570 90194
ROVC 61922 64062 55726 62334 57341 56898
II (Current)
1st June, 2014
Cost of cultivation (Including diesel @ Rs.
55.91 per litre)
34974 33877 33370 32556 35292 34468
Yield (qtl/ ha) 37.66 38.38 37 39.42 38.79 37.42
Cost of production (Rs/ qtl) 929 883 902 826 910 921
Gross returns 92859 96792 71008 102293 91570 90194
ROVC 57885 62915 37639 69737 56279 55727
III(Proposed)
Zero subsidy
On 1st June,
2014
Cost of cultivation (Including diesel @ Rs.
60.32 per litre)
35564 34418 33909 33056 35794 35021
Yield(qtl/ ha) 37.66 38.38 37 39.42 38.79 37.42
Cost of production (Rs/ qtl) 944 897 916 839 923 936
Gross returns 92859 96792 71008 102293 91570 90194
ROVC 57295 62374 37099 69238 55776 55173
Diesel price hike coefficient
(Δ cost of production/Δ diesel price)
3.56 3.20 3.30 2.87 2.93 3.36

51
3.4.3 Cotton
Table 3.4.3 shows the changing diesel prices and its impact on cost of production of cotton
crop on the sample farms. A perusal of the table reveals that the increase in diesel price
resulted in increasing the cost of cultivation and production of cotton crop on the sample
farms. In overall, the cost of production of cotton was Rs. 2859 per quintal at I (base) level
(1st February, 2013) which increased to Rs. 2927 at II (current) level (1
st June, 2014) due to
increase in diesel price and Rs. 2959 at III (proposed) level if there was complete withdrawal
of diesel subsidy. The diesel price hike coefficient was worked out at 7.31 revealing that with
one rupee increase in diesel price, the resultant cost of production of cotton increased by 7.31
rupees. The impact of diesel price hike was more pronounced on the large (8.11) and medium
(7.96) farms as compared to marginal (7.10), semi-medium (6.97) and small (6.50) farm
categories. Thus, diesel price hike impact would be more on large and medium category
farmers as compared to marginal, semi-medium and small farmers.
3.4.4 Sugarcane
The changing diesel prices and its impact on cost of production of sugarcane have been
shown in Table 3.4.4. It is clear from the table that with the hike in diesel prices, the resultant
cost of cultivation as well as cost of production of sugarcane also enhanced. In an overall
scenario, the cost of production of sugarcane was Rs. 125 per quintal at I (base) level (1st
February, 2013) which increased to Rs. 127 at II (current) level (1st June, 2014) and further
enhanced to Rs. 128 per quintal at III (proposed) level of complete withdrawal of diesel
subsidy. The diesel price hike coefficient was worked out at 0.24 showing that with one rupee
increase in diesel price, the cost of production of sugarcane increased by 0.24 rupees. The
farm category-wise analysis showed that the impact of diesel price hike in case of sugarcane
crop was almost similar on marginal (0.24), small (0.23), semi-medium (0.24), medium
(0.25) and large (0.23) farms categories. Thus impact of diesel prce hike would be almost
similar on all farm categories.

52
Table 3.4.3: Changing diesel prices and its impact on (Simulations- cetris paribus) cost of production of cotton in Punjab, 2012-13 (Rs./ ha)
Particulars Marginal Small Semi-medium Medium Large Overall
I (Base)
1st Feb, 2013
Cost of cultivation (Excluding diesel) 40664 41316 40376 41158 43527 41604
Cost of cultivation (Including diesel @
Rs.46.57 per litre)
46271 46414 45806 47141 49663 47225
Yield (qtl/ ha) 16.96 16.84 16.72 16.14 16.25 16.52
Cost of production (Rs/ qtl) 2728 2756 2740 2921 3056 2859
Gross returns 76320 74130 72890 72120 71472 72108
ROVC 30049 27716 27084 24979 21809 24883
II (Current)
1st June, 2014
Cost of cultivation (Including diesel @
Rs. 55.91 per litre)
47398 47436 46896 48342 50894 48353
Yield(qtl/ ha) 16.96 16.84 16.72 16.14 16.25 16.52
Cost of production (Rs/ qtl) 2795 2817 2805 2995 3132 2927
Gross returns 76320 74130 72890 72120 71472 72108
ROVC 28922 26694 25994 23778 20578 23755
III(Proposed)
Zero subsidy
On 1st June,
2014
Cost of cultivation (Including diesel @
Rs. 60.32 per litre)
47929 47919 47410 48909 51475 48885
Yield(qtl/ ha) 16.96 16.84 16.72 16.14 16.25 16.52
Cost of production (Rs/ qtl) 2826 2846 2836 3030 3168 2959
Gross returns 76320 74130 72890 72120 71472 72108
ROVC 28391 26211 25480 23211 19997 23223
Diesel price hike coefficient
(Δ cost of production/Δ diesel price)
7.10 6.50 6.97 7.96 8.11 7.31

53
Table 3.4.4: Changing diesel prices and its impact on (Simulations- cetris paribus) cost of production of sugarcane in Punjab, 2012-13 (Rs./ ha)
Particulars Marginal Small Semi-medium Medium Large Overall
I (Base)
1st Feb, 2013
Cost of cultivation (Excluding diesel) 89503 90731 90480 95378 94399 94758
Cost of cultivation (Including diesel @
Rs.46.57 per litre)
98842 99975 99898 105303 103723 104012
Yield (qtl/ ha) 820.83 850.5 840.27 859.04 858.13 832.29
Cost of production (Rs/ qtl) 120 118 119 123 121 125
Gross returns 211624 218750 215823 221019 220603 214270
ROVC 112782 118775 115925 115716 116880 110258
II (current)
1st June, 2014
Cost of cultivation (Including diesel @
Rs. 55.91 per litre)
100714 101828 101787 107294 105594 105869
Yield (qtl/ ha) 820.83 850.5 840.27 859.04 858.13 832.29
Cost of production (Rs/ qtl) 123 120 121 125 123 127
Gross returns 211624 218750 215823 221019 220603 214270
ROVC 110910 116922 114036 113725 115009 108401
III(Proposed)
Zero subsidy
On 1st June,
2014
Cost of cultivation (Including diesel @
Rs. 60.32 per litre)
101599 102703 102679 108234 106477 106745
Yield(qtl/ ha) 820.83 850.5 840.27 859.04 858.13 832.29
Cost of production (Rs/ qtl) 124 121 122 126 124 128
Gross returns 211624 218750 215823 221019 220603 214270
ROVC 110025 116047 113144 112785 114126 107525
Diesel price hike coefficient
(Δ cost of production/Δ diesel price)
0.24 0.23 0.24 0.25 0.23 0.24

54
3.4.5 Maize
Table 3.4.5 reveals the changing diesel prices and its impact on cost of production of maize
on the sample farms. A perusal of the table reveals that with hike in diesel price, the cost of
cultivation/ production of maize increased showing the impact of hike in diesel price on this
crop. In overall scenario, the cost of production of maize was Rs. 714 per quintal at I (base)
level (1st February, 2013) which increased to Rs. 742 at II (current) level (1
st June, 2014) and
further Rs.756 at III (proposed) level with total abolition of diesel subsidy. The diesel price
hike coefficient for maize crop was worked out to be 3.03 showing that with one rupee
increase in diesel price, the cost of production of maize increased by 3.03 rupees. The farm
category-wise analysis showed that the impact of diesel price hike in case of maize crop was
more on small (3.41), medium (3.47) and large (3.06) farms as compared to semi-medium
(2.66) and marginal (2.20) farm categories.
3.4.6 Wheat
The impact of changing diesel prices on cost of production of wheat on the sample farms
have been shown on Table 3.4.6. It is quite obvious from the table that with hike in diesel
price, the cost of cultivation/ production of wheat increased. The cost of production of wheat
in overall was Rs. 572 per quintal at I (base) level (1st February, 2013) which increased to Rs.
603 at II (current) level (1st June, 2014) and further Rs.618 at III (proposed) level with no
diesel subsidy. The diesel price hike coefficient for wheat crop was worked out at 3.29
showing that with one rupee increase in diesel price, the cost of production of wheat would
increase by 3.29 rupees. The farm category-wise analysis showed that the impact of diesel
price hike in case of wheat crop was more on semi-medium (3.30), large (3.24) and medium
(3.19) farms as compared to marginal (3.05) and small (3.07) farm categories.
3.4.7 Sunflower
Table 3.4.7 shows the impact of changing diesel prices on cost of production of sunflower
crop. It is quite obvious from the table that with hike in diesel price, have direct impact on
cost of cultivation/ production of sunflower crop. The cost of production of sunflower was
Rs. 1631 per quintal at I (base) level (1st February, 2013) which increased to Rs. 1729 at II
(current) level (1st June, 2014) and further Rs.1775 at III (proposed) level with no diesel
subsidy. The diesel price hike coefficient was 10.45 in overall scenario while on medium
farms it was 10.53 and 10.45 on large farm category.

55
Table 3.4.5: Changing diesel prices and its impact on (Simulations- cetris paribus) cost of production of maize in Punjab, 2012-13
(Rs./ ha)
Particulars Marginal Small Semi-
medium
Medium Large Overall
I (Base)
1st Feb, 2013
Cost of cultivation (Excluding diesel) 25960 22558 23300 26023 22644 24255
Cost of cultivation (Including diesel @
Rs.46.57 per litre)
30799 29144 28700 32606 28467 30217
Yield (qtl/ ha) 42.5 41.5 43.63 40.79 40.83 42.32
Cost of production (Rs/ qtl) 725 702 658 799 697 714
Gross returns 51986 50373 52570 48978 49028 51237
ROVC 21187 21229 23870 16372 20561 21020
II (current)
1st June, 2014
Cost of cultivation (Including diesel @ Rs.
55.91 per litre)
31199 30467 29783 33926 29635 31413
Yield(qtl/ ha) 42.5 41.5 43.63 40.79 40.83 42.32
Cost of production (Rs/ qtl) 734 734 683 832 726 742
Gross returns 51986 50373 52570 48978 49028 51237
ROVC 20787 19906 22787 15052 19393 19824
III(Proposed)
Zero subsidy
On 1st June,
2014
Cost of cultivation (Including diesel @ Rs.
60.32 per litre)
31612 31090 30294 34549 30187 31978
Yield(qtl/ ha) 42.5 41.5 43.63 40.79 40.83 42.32
Cost of production (Rs/ qtl) 744 749 694 847 739 756
Gross returns 51986 50373 52570 48978 49028 51237
ROVC 20374 19283 22276 14429 18841 19259
Diesel price hike coefficient
(Δ cost of production/Δ diesel price)
2.20 3.41 2.66 3.47 3.06 3.03

56
Table 3.4.6: Changing diesel prices and its impact on (Simulations-cetris paribus) cost of production of wheat in Punjab, 2012-13 (Rs./ ha)
Particulars Marginal Small Semi-
medium
Medium Large Overall
I (Base)
1st Feb, 2013
Cost of cultivation (Excluding diesel) 20779 19037 18080 18030 17711 18713
Cost of cultivation (Including diesel @
Rs.46.57 per litre)
26909 25438 25071 24538 24599 25542
Yield (qtl/ ha) 43.17 44.81 45.5 43.76 45.71 44.62
Cost of production (Rs/ qtl) 623 568 551 561 538 572
Gross returns 62331 64919 65344 62331 64919 65344
ROVC 35422 39481 40273 37793 40320 39802
II (current)
1st June, 2014
Cost of cultivation (Including diesel @ Rs.
55.91 per litre)
28140 26723 26472 25842 25980 26912
Yield(qtl/ ha) 43.17 44.81 45.5 43.76 45.71 44.62
Cost of production (Rs/ qtl) 652 596 582 591 568 603
Gross returns 62331 64919 65344 62331 64919 65344
ROVC 34191 38196 38872 36489 38939 38432
III(Proposed)
Zero subsidy
On 1st June,
2014
Cost of cultivation (Including diesel @ Rs.
60.32 per litre)
28721 27329 27134 26458 26633 27559
Yield(qtl/ ha) 43.17 44.81 45.5 43.76 45.71 44.62
Cost of production (Rs/ qtl) 665 610 596 605 583 618
Gross returns 62331 64919 65344 62331 64919 65344
ROVC 33610 37590 38210 35873 38286 37785
Diesel price hike coefficient
(Δ cost of production/Δ diesel price)
3.05 3.07 3.30 3.19 3.24 3.29

57
Table 3.4.7: Changing diesel prices and its impact on (Simulations-cetris paribus) cost of production of sunflower in Punjab, 2012-13 (Rs./ ha)
Particulars Medium Large Overall
I (Base)
1st Feb, 2013
Cost of cultivation (Excluding diesel) 19789 19117 19579
Cost of cultivation (Including diesel @ Rs.46.57 per litre) 28045 27779 27907
Yield (qtl/ ha) 16.85 17.81 17.11
Cost of production (Rs/ qtl) 1664 1560 1631
Gross returns 43642 45647 44229
ROVC 15597 17868 16322
II (current)
1st June, 2014
Cost of cultivation (Including diesel @ Rs. 55.91 per litre) 29714 29518 29576
Yield(qtl/ ha) 16.85 17.81 17.11
Cost of production (Rs/ qtl) 1763 1657 1729
Gross returns 43642 45647 44229
ROVC 13928 16129 14653
III(Proposed)
Zero subsidy
On 1st June,
2014
Cost of cultivation (Including diesel @ Rs. 60.32 per litre) 30497 30338 30364
Yield(qtl/ ha) 16.85 17.81 17.11
Cost of production (Rs/ qtl) 1810 1703 1775
Gross returns 43642 45647 44229
ROVC 13145 15309 13865
Diesel price hike coefficient (Δ cost of production/Δ diesel price) 10.53 10.45 10.45

58
3.5 Impact of diesel and power subsidy withdrawal:
The impact of withdrawal of subsidies on diesel, power individually and in aggregate has
been given in Table 3.4.8, 3.4.9 and 3.4.10. A perusal of Table 3.4.8 revealed that due to
withdrawal of diesel subsidy, the cost of production of sunflower increased by 8.81 per cent
followed by 7.90 per cent in case of wheat, 7.06 per cent in paddy, 5.83 per cent in maize,
5.18 per cent in basmati, 3.52 per cent in cotton and 2.63 per cent in sugarcane. The increase
in cost of production of different crops according to various farm size categories due to
withdrawal of diesel subsidy did not show any specific trend of increase or decline. However,
there was significant impact of withdrawal of diesel subsidy in terms of increased cost of
production of different crops as well as under various farm categories.
The electricity supply to farm sector in Punjab is free. The impact of withdrawal of power
subsidy was envisaged to see its impact on cost of production of different crops. Table 3.4.9
reveals the impact of power subsidy withdrawal on important crops in Punjab. The major
impact of power subsidy withdrawal was seen on increase in cost of production of paddy
(25.30%) due to more number of irrigations applied to this crop followed by Basmati
(21.24%), sunflower (9.07%), wheat (6.64%), maize (3.50%), sugarcane (2.63%) and cotton
(1.75%). The impact of power subsidy withdrawal was more on semi-medium, medium and
large farm categories as compared to marginal and small farms.
The impact of diesel and power subsidy withdrawal on cost of production of major crops in
Punjab has been given in Table 3.4.10. A perusal of the table reveals that the cost of
production of paddy increase by 32.35 per cent due to withdrawal of both diesel and power
subsidy. The increase in cost of production of basmati was 26.42 per cent followed by
sunflower (17.88%), wheat (14.55%), maize (9.33%), sugarcane (5.97%) and cotton (5.26%).
The farm category-wise analysis revealed that increase in cost of production of major crops
was more pronounced on semi-medium, medium and large categories as compared to
marginal and small farms. Thus, the impact of power and diesel subsidy withdrawal would be
more on large and medium farmers as compared to marginal and small farmers.

59
Table 3.4.8: Impact of diesel subsidy withdrawal on cost of production, important crops, Punjab, 2012-13 (Rs/qtl)
Crops Marginal Small Semi
medium
Medium Large Overall Marginal Small Semi
medium
Medium Large Overall
With subsidy Without subsidy
Paddy 505 490 490 505 489 494 537
(6.22)
530
(8.18)
526
(7.41)
539
(6.76)
529
(8.37)
528
(7.06)*
Basmati 895 853 871 802 882 890 944
(5.46)
897
(5.16)
916
(5.22)
839
(4.61)
923
(4.57)
936
(5.18)
Cotton 2728 2756 2740 2921 3056 2859 2826
(3.58)
2846
(3.24)
2836
(3.50)
3030
(3.75)
3168
(3.65)
2959
(3.52)
Sugarcane 120 118 119 123 121 125 124
(2.79)
121
(2.73)
122
(2.78)
126
(2.78)
124
(2.65)
128
(2.63)
Maize 725 702 658 799 697 714 744
(2.64)
749
(6.68)
694
(5.55)
847
(5.96)
739
(6.04)
756
(5.83)
Wheat 623 568 551 561 538 572 665
(6.73)
610
(7.43)
596
(8.23)
605
(7.83)
583
(8.27)
618
(7.90)
Sunflower - - - 1664 1560 1631 - - - 1810
(8.74)
1703
(9.21)
1775
(8.81)
*Figures in parentheses indicate per cent increase in cost of production due to withdrawal of diesel subsidy

60
Table 3.4.9: Impact of power subsidy withdrawal on cost of production, important crops, Punjab, 2012-13 (Rs/qtl)
Crops Marginal Small Semi
medium
Medium Large Overall Marginal Small Semi
medium
Medium Large Overall
With subsidy Without subsidy
Paddy 505 490 490 505 489 494 606
(20.00)
606
(23.67)
618
(26.12)
630
(24.75)
618
(26.38)
619*
(25.30)
Basmati 895 853 871 802 882 890 1032
(15.31)
1034
(21.22)
1074
(23.31)
1001
(24.81)
1097
(24.38)
1079
(21.24)
Cotton 2728 2756 2740 2921 3056 2859 2765
(1.36)
2804
(1.74)
2790
(1.82)
2973
(1.78)
3115
(1.93)
2909
(1.75)
Sugarcane 120 118 119 123 121 125 124
(3.33)
122
(3.39)
124
(4.20)
128
(4.07)
126
(4.13)
126
(3.28)
Maize 725 702 658 799 697 714 744
(2.62)
724
(3.13)
684
(3.95)
824
(3.13)
728
(4.45)
739
(3.50)
Wheat 623 568 551 561 538 572 655
(5.14)
604
(6.34)
588
(6.72)
601
(7.13)
577
(7.25)
610
(6.64)
Sunflower - - - 1664 1560 1631 - - - 1818
(9.25)
1708
(9.49)
1779
(9.07)
*Figures in parentheses indicate per cent increase in cost of production due to withdrawal of power subsidy

61
Table 3.4.10: Impact of diesel & power subsidy withdrawal on cost of production, important crops, Punjab, 2012-13 (Rs/qtl)
Crops
Marginal Small Semi
medium
Medium Large Overall Marginal Small Semi
medium
Medium Large Overall
With diesel and power subsidy Without diesel and power subsidy
Paddy 505 490 490 505 489 494 637
(26.23)
646
(31.85)
654
(33.53)
664
(31.51)
659
(34.75)
654
(32.35)*
Basmati 895 853 871 802 882 890 1081
(20.77)
1078
(26.38)
1119
(28.53)
1038
(29.42)
1137
(28.95)
1125
(26.42)
Cotton 2728 2756 2740 2921 3056 2859 2863
(4.94)
2893
(4.98)
2886
(5.33)
3083
(5.53)
3226
(5.58)
3009
(5.26)
Sugarcane 120 118 119 123 121 125 127
(6.13)
125
(6.11)
127
(6.98)
131
(6.84)
129
(6.78)
129
(5.97)
Maize 725 702 658 799 697 714 763
(5.26)
771
(9.82)
721
(9.50)
872
(9.09)
770
(10.49)
781
(9.33)
Wheat 623 568 551 561 538 572 697
(11.87)
646
(13.77)
633
(14.94)
645
(14.95)
621
(15.52)
655
(14.55)
Sunflower - - - 1664 1560 1631 - - - 1964
(18.00)
1852
(18.70)
1923
(17.88)
*Figures in parentheses indicate per cent increase in cost of production due to withdrawal of diesel and power subsidy

62
3.6 Conclusions & policy implications
The above discussion brings us to the conclusion regarding change in cost of cultivation/
production of important crops in Punjab worked out after taking in to account the withdrawal
of diesel and power subsidies and bringing out specific policy implications affecting the state
agriculture due to withdrawal of diesel and power subsidy. It was found out from simulations
regarding change in diesel prices keeping prices of all other inputs at constant level (cetris-
paribus) the cost of production of paddy increased by 7.06 per cent with the withdrawal of
diesel subsidy. Similarly, the increase in cost of production of basmati was 5.18 per cent;
while in other crops it was 3.52 per cent in cotton, 2.63 per cent in sugarcane, 5.83 per cent in
maize, 7.90 per cent in wheat and 8.81 per cent in sunflower. The diesel price hike coefficient
showed that with one rupee increase in diesel price, the resultant cost of production of paddy
increased by Rs.2.53; while in other crops such as basmati, increase in cost of production was
by Rs. 3.36, in cotton by Rs.7.31, in sugarcane by Rs. 0.24, in maize by Rs. 3.03, in wheat by
Rs.3.29 and in case of sunflower by Rs. 10.45. The increase in cost of production of different
crops under various farm categories due to withdrawal of diesel subsidy did not show any
specific trend of increase or decline according to size of the farm category. The major impact
of power subsidy withdrawal was seen on increase in cost of production of paddy (25.30%)
due to more number of irrigations applied to this crop followed by Basmati (21.24%),
sunflower (9.07%), wheat (6.64%), maize (3.50%), sugarcane (3.28%) and cotton (1.75%).
The impact of power subsidy withdrawal was more on semi-medium, medium and large farm
categories as compared to marginal and small farms. In aggregate the cost of production of
paddy increased by 32.35 per cent due to withdrawal of both diesel and power subsidy.
Similarly, the increase in cost of production of basmati was by 25.42 per cent followed by
sunflower (17.88%), wheat (14.55%), maize (9.33%), sugarcane (5.97%) and cotton (5.26%).
The farm category-wise analysis showed that the impact of power and diesel subsidy
withdrawal would be more on large and medium farmers as compared to marginal and small
farmers.
The major policy issues drawn from the discussion is that Punjab government should
emphasize the union government to increase the minimum support price of paddy and wheat,
which are the crops for which state farmers get assured price, in commensurate with the
diesel price hike coefficient. For other crops also, MSP should be enhanced in proportion to
the diesel price hike coefficient, for which MSP is announced but is not actually
implemented. In case, power subsidy is withdrawn by the state government, farmers

63
especially marginal and small one’s should be compensated according to the electricity usage
bill generated for irrigating various crops on their farms. Thus, for keeping marginal and
small farmers in farming business, subsidies especially power subsidy should not be
withdrawn, however, their form can be changed for the benefit of these farmers in general
and farming community in particular.

64
CHAPTER-IV
SUMMARY
The diesel retail prices continue to be regulated by the government of India since early
1970’s and hence contributed in a major way towards the build up of fuel subsidies over the
years. Government of India has recently taken a number of measures to reform its fuel
subsidy system. In June 2010, petrol pricing was liberalized and the intention to liberalize
diesel prices announced. In its 2012-13 budget speech, the government stated its intention to
limit all central subsidies (including those on fuels) to less than 2 percent of GDP in 2012-13,
and reducing them to less than 1.75 percent of GDP over three years. In January 2013, the
government announced that Oil Marketing Companies (OMCs) would have greater flexibility
in setting diesel prices and that bulk users of diesel would pay unsubsidized prices. (IMF,
2013).
Oil Marketing Companies (OMCs) are increasing per litre diesel prices by Rs. 0.5 per month
from January, 2013 onwards with some exceptions. Since then, the diesel prices had risen by
a cumulative Rs 10.12 per litre in 16 instalments and the diesel subsidy is likely to be
completely removed with automatic deregulation of fuel in next few months if the rupee
continue to strengthen and monthly price hikes continue (Daily Post, 2014,). Therefore, there
is a need to assess the likely impact of recent energy price policy changes on the Indian
agriculture. Punjab agriculture, being on forefront in terms of diesel/energy consumption may
hit hard due to these diesel oil policy changes resulting into the increase of cost of
agricultural production. Keeping this in view, the present study has been undertaken to
estimate the use of diesel in crop production and analyse the likely impact of diesel/energy
price policy on the cost-profitability relationship of major crops in Punjab. The study was
undertaken with the objectives, to study the status of electricity and diesel use for various
crop-production-activities in the state and to examine the impact of squeezing diesel
subsidy/enhancing diesel price on the cost of agricultural production and profitability.
To meet the specific objectives of the study, at first stage of sampling six districts namely
Hoshiarpur, Amritsar, Jalandhar, Ludhiana, Bathinda and Fazilika represented all the major
agro-climatic regions of the state were selected purposively. From each of the selected
district, two blocks were selected randomly. Thus, overall twelve blocks from the sample
districts were selected. From each selected block a cluster of villages was selected randomly
for the farm household survey. Finally from each of the selected village cluster, 25 cultivators

65
comprising 5 cultivators representing each of different categories as per standard national
level definition of operational holdings were selected randomly. Thus, overall from the state,
total sample of 300 farmer households comprising 60 farmers each of marginal, small, semi-
medium, medium and large categories forms the basis for the present enquiry. To work out
the components of cost of cultivation of selected crops, data on various aspects of fixed and
variable costs were collected on an especially prepared schedule for important crops in
Punjab. Simple tabular analysis was conducted to analyse the results. Simulations by
changing diesel prices were undertaken to work out the cost of production/ cultivation of
various crops by keeping prices of all other inputs at constant level as at the time of data
collection and just varying diesel prices only in order to see the impact of diesel subsidy
withdrawal on cost of production of crops and also worked out ‘diesel price hike coefficient’.
Similarly, the impact of power subsidy withdrawal on cost of production of major crops in
Punjab was also investigated by calculating the cost of the electricity consumed for irrigating
various crops and adding it to the total variable cost.
The socio-economic characters of the sample respondents revealed that there were about 40
per cent adult males in the families of respondent farmers followed by about 35 per cent adult
females and 25 per cent minors. The farm category-wise analysis revealed that relative
proportion of adult males as compared to adult females was more among marginal, small and
semi-medium categories as compared other farm categories. About 38 per cent of the family
heads among sample households were more than 50 years old while about 35 per cent were
aged between 36-50 years and remaining 27 per cent were quite young and aged up to 35
years. As far as education level of the respondents was concerned, nearly fifty per cent of the
respondents were educated up to matric level followed by secondary, primary, graduation and
post- graduation level.
The operational holding size per farm was 5.62 hectares with land owned being 3.61 hectares;
land leased-in 2.13 hectares and land leased-out 0.12 hectares. The whole area under
cultivation was irrigated with average rental value of land leased-in being Rs. 68,180 and that
of land leased-out being Rs. 71,430 per hectare. Electric motor, submersible pump, diesel
engine, generator and canals were the various sources of irrigation on the sample farms. The
number of submersible pumps per farm in an overall scenario were highest (0.76) followed
by generator (0.27) electric motor (0.23) and diesel engine (0.17). The total income from
farming, dairy farming, service, business and other sources was Rs.8,01,364 per farm. The
relative share of farming in the total income was 99.20 per cent followed by minor share from

66
dairy farming, service sector, business and other sources. The category-wise analysis reveals
that the relative share of farming in total income was lowest on marginal farms and highest
on the large farms.
The average number of tractors per farm was 0.79 with 43.94 H.P. and present value
being Rs.1,94,106. The category-wise analysis reveals that the numbers of tractors per
farm were more on large farms as compared to other farm categories and all the
respondents on medium and large farms owned at least one tractor The average number of
tractor drawn implements was 5.70 on large, 4.20 on medium, 3.70 on semi-medium, 1.32
on small, 0.18 on marginal and 2.89 in an overall scenario. Therefore, the present value of
tractor drawn implements was more on large farms due to their higher number as
compared to other farm categories.
Cropping pattern and cropping intensity on the sample farms revealed that during kharif
season paddy was the major crop occupying 2.32 hectares (18.83% of gross cropped area)
of the operational holding in overall scenario followed by Bt cotton, basmati, sugarcane,
maize, guara, fodder and vegetables. During rabi season wheat was the major crop sown
on 4.58 hectares (37.20 % of the gross cropped area) in overall scenario followed by
fodder, potato and other minor crops. The crops sown during zaid season were; potato,
sunflower, spring maize, vegetables and mentha. The percentage share of zaid season
crops was 8.51 per cent of the gross cropped area on the sample farms. The cropping
intensity was 219.24 per cent in an overall scenario with highest on large farms
(222.81%) and lowest on marginal (206.84%) farms.
The cost-return structure of paddy cultivation revealed that human labour use per hectare of
paddy cultivation worked out to be 313.85 hours in an overall scenario while category-wise
analysis revealed that highest number of human labour hours were spent on medium farms
followed by marginal farms which were lowest. In case of machine labour (tractor), overall
13.14 hours were utilized in various field operations while combine harvesting hours for
paddy crop were 1.77 per hectare. The irrigation hours using electric motor/ submersible
pump were 255.97 per hectare. Diesel engine use in irrigating paddy crop was more on
marginal farms while generator use was more on large farms. Similarly, diesel consumption
per hectare on owned and hired machinery taken together was 155.50 litres in paddy
cultivation. The proportionate share of diesel consumption in total variable cost was 23.49
per cent in an overall scenario while its share was lowest on small farms and highest on large

67
farms. The returns over variable cost (ROVC) in paddy cultivation were about Rs.49627 in an
overall scenario being highest (Rs. 50702) on semi-medium farms and lowest (Rs. 50034) on
medium farms.
In case of basmati crop, 462.47 human labour hours were spent on various farm related
operations per hectare while these were highest on small farms and lowest on medium farms
category. The tractor use on sample farms was estimated at 16.22 hours per hectare while
combine harvester use was 0.97 hours. The total irrigation hours using electric motor/
submersible pump in basmati cultivation were 230.83 hours per hectare. Diesel engine and
generator hours utilized for irrigating basmati crop were estimated at 34.37 hours and 0.84
hours, respectively. The diesel consumption per hectare including owned and hired
machinery was 123.41 litres in overall scenario. The category-wise analysis revealed that
diesel consumption per hectare was highest on marginal (131.59 ltrs.) farms and lowest on
medium (111.34 ltrs.) farms. The relative share of diesel consumption in total variable cost
was found to be 17.26 per cent. The returns over variable cost (ROVC) in basmati cultivation
were about Rs.56898 in an overall situation while it being highest (Rs.64061) on small farms
and lowest (Rs.55725) on semi-medium farms.
In case of cotton crop, 547.95 human labour hours were utilized while raising this crop while
according to farm category, highest number of labour hours were spent on large farms and
lowest on the marginal farms. The tractor use was 25.15 hours per hectare for various farm
operations in cotton cultivation. The irrigation hours estimated on the use of electric motor/
submersible pump were 27.03 hours while the total diesel consumption on the sample farms
in overall scenario was 118.64 litres. The relative share of diesel use was 11.70 per cent of
total variable cost constituting 8.99 per cent from owned sources and 2.71 per cent from hired
one’s. The returns over variable cost (ROVC) from cotton cultivation were Rs. 24883 per
hectare with highest (Rs.30048) on marginal farms and lowest (Rs.21809) on large farms.
In case of sugarcane crop, 1122.92 human labour hours per hectare were spent on various
cultivation related operations in an overall situation. The tractor hours spent on various farm
operations were 22.23 per hectare. For irrigating sugarcane crop, 138.06 hours were spent
while using electric motor/ submersible pump. Also, 192 litres of diesel was consumed per
hectare in sugarcane cultivation with more on medium farms and less on small farms. The
relative share of diesel use in total variable cost was found to be 8.60 per cent with 7.91 per
cent from owned sources and 0.69 per cent from hired machinery. The returns over variable

68
cost (ROVC) were Rs.110258 per hectare in sugarcane cultivation being Rs.118775 on small
farms, which were highest among farm categories and Rs. 112783 on marginal farms, which
were lowest.
In case of maize crop, 311.84 human labour hours were used while raising the crop on the
sample farms. The tractor use for various farm related operations was 11.19 hours while
combine harvester use was 1.29 hours in maize cultivation. The irrigation hours estimated on
the use of electric motor/ submersible pump were 33.88 hours. The total diesel consumption
was 125.83 litres in maize cultivation constituting 94.41 litres from owned sources and 31.42
litres from hired machinery. The relative share of diesel use was 19.39 per cent of total
variable cost in overall scenario. The returns over variable cost (ROVC) were Rs.21019 per
hectare from maize cultivation while farm category-wise analysis showed that returns were
highest (Rs.23869) on semi-medium farm category and lowest (Rs.16372) on medium farms.
In wheat crop, 124.53 human labour hours per hectare were utilized to raise this crop on the
sample farms. The tractor use was 20.13 hours for undertaking various field operations while
for harvesting, by using combine harvester, 2.33 hours per hectare were spent. The irrigation
hours worked out on the basis of electric motor/ submersible pump use were 54.14 hours in
an overall scenario. The total diesel consumption in wheat crop on the sample farms was
144.13 litres. The relative share of diesel use in total variable cost was 26.28 per cent with
13.70 per cent share from owned machinery and 12.58 per cent from hired machine use. In
overall scenario, the returns over variable cost (ROVC) were Rs.39806 per hectare in wheat
cultivation and about Rs.40330 on large farms which were highest among farm categories
and Rs. 35422 on marginal farms which were lowest.
In overall, 218.48 human labour hours were estimated to be used per hectare in sunflower
cultivation on the sample farms. The tractor use in various farm operations worked out to be
18.95 hours. Also, combine harvester was used to harvest sunflower crop and 2.5 hours per
hectare were spent on this particular operation. For irrigating sunflower crop, electric motor
and submersible pumps were used and in overall, 82.36 hours were spent in irrigating one
hectare of sunflower crop. The total consumption of diesel for various farm operations in
sunflower crop was estimated at 175.73 litres. The share of diesel use in total variable cost in
sunflower cultivation was 29.32 per cent. The returns over variable cost (ROVC) in
sunflower cultivation worked out to be Rs.16322 per hectare while on medium farms the
returns were Rs.15597 and Rs.17868 per hectare on large farms.

69
The source of diesel purchase showed that about 95 per cent of the respondent farmers
purchased diesel from the private petrol pumps and about five per cent from co-operative
societies. The distance of the petrol pump from the farmer’s house was with-in 5 Km as
reported by 95 per cent of the respondents. Mostly farmers purchased diesel seasonally
(61.13%) and one time purchase of diesel was about 50 litres as reported by about fifty per
cent of the respondents.
The changing diesel prices and its impact on cost of production of paddy, basmati, cotton,
sugarcane, maize, wheat and sunflower was seen at I (base) level (1st February, 2013),
secondly at II (current) level (1st June, 2014) and thirdly at III (proposed) level with zero
diesel subsidy. The cost of production of paddy increased from Rs. 494 per quintal at I level
to Rs. 517 and Rs. 528 per quintal at II and III level, respectively. The diesel price hike
coefficient was worked out at 2.53 showing that with one rupee increase in diesel price, the
cost of production of paddy increased by 2.53 rupees. In basmati crop, cost of production
increased from Rs. 890 per quintal at I level to Rs. 921 at II and further Rs.936 at III level
and the diesel price hike coefficient was worked out at 3.36. In cotton crop, the cost of
production was estimated at Rs. 2859 per quintal at I level which increased to Rs. 2967 at II
level and Rs.2959 at III level if there was complete withdrawal of diesel subsidy. The diesel
price hike coefficient was worked out at 7.31 in cotton crop. The cost of production of
sugarcane worked out to be Rs. 125 per quintal at I level which increased to Rs. 127 at II
level and further to Rs. 128 per quintal at III level. The diesel price hike coefficient was
estimated at 0.24 showing that with one rupee increase in diesel price, the cost of production
of sugarcane increased by 0.24 rupees. Similarly, the cost of production of maize was Rs. 714
at I level which increased to Rs. 742 and Rs. 756 at II and III level, respectively with the total
abolition of diesel subsidy and also, diesel price hike coefficient was worked out to be 3.03
for maize crop. In case of wheat crop, the cost of production increased from Rs. 572 per
quintal at I level to Rs. 603 at II level and further Rs.618 at III level. The diesel price hike
coefficient for wheat crop was worked out at 3.29 showing that with one rupee increase in
diesel price the cost of production of wheat increases by 3.29 rupees. Lastly, the cost of
production of sunflower worked out at Rs. 1631 per quintal at I level which increased to Rs.
1729 and Rs.1775 at II and III level, respectively while the diesel price hike coefficient was
worked out to be 10.45.
It was found out that due to withdrawal of diesel subsidy, the cost of production of sunflower
increased by 8.81 per cent followed by 7.90 per cent in case of wheat, 7.06 per cent in paddy,

70
5.83 per cent in maize, 5.18 per cent in basmati, 3.52 per cent in cotton and 2.63 per cent in
sugarcane. The increase in cost of production of different crops according to various farm
size categories due to withdrawal of diesel subsidy did not show any specific trend of
increase or decline.
The major impact of power subsidy withdrawal was seen on increase in cost of production of
paddy (25.30%) due to more number of irrigations applied to this crop followed by Basmati
(21.24%), sunflower (9.07%), wheat (6.64%), maize (3.50%), sugarcane (2.63%) and cotton
(1.75%). The impact of power subsidy withdrawal was more on semi-medium, medium and
large farm categories as compared to marginal and small farms.
Further, the impact of both diesel and power subsidy withdrawal on cost of production of
major crops in Punjab revealed that the cost of production of paddy increase by 32.35 per
cent due to withdrawal of both diesel and power subsidy. The increase in cost of production
of basmati was 26.42 per cent followed by sunflower (17.88%), wheat (14.55%), maize
(9.33%), sugarcane (5.97%) and cotton (5.26%). The farm category-wise analysis revealed
that increase in cost of production of major crops was more pronounced on semi-medium,
medium and large categories as compared to marginal and small farms. Thus, the impact of
power and diesel subsidy withdrawal was more on large and medium farmers as compared to
marginal and small farmers.
The major policy issue drawn was to increase the minimum support price of crops in
commensurate with the diesel price hike coefficient. For keeping marginal and small farmers
of the Punjab state in farming business, power subsidy should not be withdrawn, however, its
form can be changed for the benefit of these farmers.
71
References
Anonymous (2013) PSERC-Tariff Order PSPCL, Punjab State Electricity Regulatory
Commission, Chandigarh.
Anonymous (2012) Agriculture at a Glance, Information Serivce, Department of Agriculture,
Punjab, Chandigarh.
Anonymous (2014) Losses on Sale of Diesel Dips to New Low, Daily Post (News Paper),
New Delhi, June 2, 2014.
Arze Del Granado, J, D Coady and R Gillingham (2012) The Unequal Benefits of Fuel
Subsidies: A Review of Evidence for Developing Countries, World Development,
40 (11): pp 2234-48.
Girish Kumar Jha, Suresh Pal and Alka Singh (2012)a Changing Energy-use Pattern and the
Demand Projection for Indian Agriculture, Agricultural Economics Research Review,
Vol. 25 (1) : pp 61-68
Girish Kumar Jha, Suresh Pal and Alka Singh (2012)b Energy Requirement in Agricultural
Sector: Research Brief, Division of Agricultural Economics, Indian Agricultural
Research Institute, New Delhi - 110 012
Grace Communication Foundation (2014) Energy and Agriculture, available at
http://www.gracelinks.org/118/energy-and-agriculture
International Monetary Fund (2013) Energy Subsidy Reform: Lessons and Implications,
Washington DC.
M Dinesh Kumar (2007) Groundwater Management in India: Physical, Institutional and
Policy Alternatives, Sage Publications India Pvt Ltd, New Delhi.
M Dinesh Kumar, A Scott Christopher and O P Singh (2011) Inducing the Shift from Flat-
Rate or Free Agricultural Power to Metered Supply: Implications for Groundwater
Depletion and Power Sector Viability in India, Journal of Hydrology, Vol. 409 (1&2)
: pp 382-394
Ministry of Petroleum & Natural Gas (2013) All India Study on Sectoral Demand of Diesel
& Petrol, Petroleum Planning & Analysis Cell (PPAC), Ministry of Petroleum &
Natural Gas, Government of India.
NAAS (2008) Sustainable Energy for Rural India: Policy Paper 41, National Academy of
Agricultural Sciences, New Delhi.

72
O P Singh, Rakesh Singh and M K Singh (2014) Impactof Farm Sector Electricity Subsidy on
Water use Efficiency and Water Productivity in India, Indian journal of Agricultural
Economics, Vol. 69 (3) : pp 404-413
Rahul Anand, David Coady, Adil Mohommad, Vimal Thakoor, and James P Walsh (2013)
The Fiscal and Welfare Impacts of Reforming Fuel Subsidies in India: IMF Working
Paper (WP/13/128).
V K Sharma, K Singh and B S Panesar (2005) Custom Hiring of Agricultural Machinery and
its Future Scope: Status Report on Farm Mechanization in India. Department of
Agriculture and Cooperation, Ministry of Agriculture, Government of India, New
Delhi, pp 127-132.
World Bank (2001) India: Power Supply to Agriculture, South Asia Region, World Bank,
Washington DC, USA.

73
Appendix-I
Cost of production (Rs/ ha) of Paddy in Punjab with and without power subsidy, 2012-13
Particulars Marginal Small Semi
medium Medium Large Overall
With Electricity Subsidy
Cost of cultivation (excluding
electricity cost) 32084 30532 31047 32629 31019 30835
Yield(qtl/ha) 63.47 62.32 63.42 64.58 63.49 62.47
Cost of production(Rs /qtl) 505 490 490 505 489 494
Gross returns 82384 80580 81748 82662 81267 80461
ROVC 50300 50048 50701 50033 50248 49626
Without Electricity Subsidy
Electricity Cost 6348 7222 8118 8072 8248 7864
Cost of cultivation (including
electricity cost) 38432 37754 39165 40701 39267 38699
Yield(qtl/ha) 63.47 62.32 63.42 64.58 63.49 62.47
Cost of production(Rs /qtl) 606 606 618 630 618 619
Gross returns 82384 80580 81748 82662 81267 80461
ROVC 43952 42826 42583 41961 42000 41762

74
Appendix-II
Cost of production (Rs/ ha) of Basmati in Punjab with and without power subsidy, 2012-13
Particulars Marginal Small Semi
medium Medium Large Overall
With Electricity Subsidy
Cost of cultivation (excluding
electricity cost) 33723 32730 32227 31600 34229 33296
Yield(qtl/ha) 37.66 38.38 37 39.42 38.79 37.42
Cost of production(Rs /qtl) 895 853 871 802 882 890
Gross returns 95645 96792 87953 93934 91570 90194
ROVC 61922 64062 55726 62334 57341 56898
Without Electricity Subsidy
Electricity Cost 5138 6966 7522 7845 8313 7091
Cost of cultivation (including
electricity cost) 38861 39696 39749 39445 42542 40387
Yield(qtl/ha) 37.66 38.38 37 39.42 38.79 37.42
Cost of production(Rs /qtl) 1032 1034 1074 1001 1097 1079
Gross returns 95645 96792 87953 93934 91570 90194
ROVC 56784 57096 48204 54489 49028 49807

75
Appendix-III
Cost of production (Rs/ ha) of Cotton in Punjab with and without power subsidy, 2012-13
Particulars Marginal Small Semi
medium Medium Large Overall
With Electricity Subsidy
Cost of cultivation (excluding
electricity cost) 46271 46414 45806 47141 49663 47225
Yield(qtl/ha) 16.96 16.84 16.72 16.14 16.25 16.52
Cost of production(Rs /qtl) 2728 2756 2740 2921 3056 2859
Gross returns 76320 74130 72890 72120 71472 72108
ROVC 30049 27716 27084 24979 21809 24883
Without Electricity Subsidy
Electricity Cost 616 809 848 845 952 830
Cost of cultivation (including
electricity cost) 46887 47223 46654 47986 50615 48055
Yield(qtl/ha) 16.96 16.84 16.72 16.14 16.25 16.52
Cost of production(Rs /qtl) 2765 2804 2790 2973 3115 2909
Gross returns 76320 74130 72890 72120 71472 72108
ROVC 29433 26907 26236 24134 20857 24053

76
Appendix-IV
Cost of production (Rs/ ha) of Sugarcane in Punjab with and without power subsidy, 2012-13
Particulars Marginal Small Semi
medium Medium Large Overall
With Electricity Subsidy
Cost of cultivation (excluding
electricity cost) 98842 99975 99898 105303 103723 104012
Yield(qtl/ha) 820.83 850.5 840.27 859.04 858.13 832.29
Cost of production(Rs /qtl) 120 118 119 123 121 122
Gross returns 211624 218750 215823 221019 220603 214270
ROVC 112782 118775 115925 115716 116880 110258
Without Electricity Subsidy
Electricity Cost 3270 3879 4314 4311 4740 4241
Cost of cultivation (including
electricity cost) 102112 103854 104212 109614 108463 108253
Yield(qtl/ha) 820.83 850.5 840.27 859.04 858.13 832.29
Cost of production(Rs /qtl) 124 122 124 128 126 126
Gross returns 211624 218750 215823 221019 220603 214270
ROVC 109512 114896 111611 111405 112140 106017

77
Appendix-V
Cost of production (Rs/ ha) of Maize in Punjab with and without power subsidy, 2012-13
Particulars Marginal Small Semi
medium Medium Large Overall
With Electricity Subsidy
Cost of cultivation (excluding
electricity cost) 30799 29144 28700 32606 28467 30217
Yield(qtl/ha) 42.5 41.5 43.63 40.79 40.83 42.32
Cost of production(Rs /qtl) 725 702 658 799 697 714
Gross returns 51986 50373 52570 48978 49028 51237
ROVC 21187 21229 23870 16372 20561 21020
Without Electricity Subsidy
Electricity Cost 817 882 1155 1015 1257 1041
Cost of cultivation (including
electricity cost) 31616 30026 29855 33621 29724 31258
Yield(qtl/ha) 42.5 41.5 43.63 40.79 40.83 42.32
Cost of production(Rs /qtl) 744 724 684 824 728 739
Gross returns 51986 50373 52570 48978 49028 51237
ROVC 20370 20347 22715 15357 19304 19979

78
Appendix-VI
Cost of production (Rs/ ha) of Wheat in Punjab with and without power subsidy, 2012-13
Particulars Marginal Small Semi
medium Medium Large Overall
With Electricity Subsidy
Cost of cultivation (excluding
electricity cost) 26909 25438 25071 24538 24599 25542
Yield(qtl/ha) 43.17 44.81 45.5 43.76 45.71 44.62
Cost of production(Rs /qtl) 623 568 551 561 538 572
Gross returns 62331 64919 65344 62331 64919 65344
ROVC 35422 39481 40273 37793 40320 39802
Without Electricity Subsidy
Electricity Cost 1381 1605 1675 1748 1767 1663
Cost of cultivation (including
electricity cost) 28290 27043 26746 26286 26366 27205
Yield(qtl/ha) 43.17 44.81 45.5 43.76 45.71 44.62
Cost of production(Rs /qtl) 655 604 588 601 577 610
Gross returns 62331 64919 65344 62331 64919 65344
ROVC 34041 37876 38598 36045 38553 38139

79
Appendix-VII
Cost of production (Rs/ ha) of Sunflower in Punjab with and without power subsidy, 2012-13
Particulars Medium Large Overall
With Electricity Subsidy
Cost of cultivation (excluding electricity
cost) 28045 27779 27907
Yield(qtl/ha) 16.85 17.81 17.11
Cost of production(Rs /qtl) 1664 1560 1631
Gross returns 43642 45647 44229
ROVC 15597 17868 16322
Without Electricity Subsidy
Electricity Cost 2595 2636 2530
Cost of cultivation (including electricity
cost) 30640 30415 30437
Yield(qtl/ha) 16.85 17.81 17.11
Cost of production(Rs /qtl) 1818 1708 1779
Gross returns 43642 45647 44229
ROVC 13002 15232 13792

80
Annexure VIII: Peer Reviewer’s Comments on the Draft Report “Impact of Diesel/
Power Subsidy withdrawal on Production Cost of Important Crops in Punjab” submitted by AERC, Punjab Agricultural University, Ludhiana
1. Title of the draft report examined: ‘’Impact of Diesel/ Power Subsidy withdrawal
on Production Cost of Important Crops in Punjab’’
2. Date of receipt of the Draft report: 27 February 2015.
3. Date of dispatch of the comments: 30 March 2015.
4. Comments on the Objectives of the study:
The authors have addressed all the three objectives set for the analyses.
5. Comments on Research Methodology:
The sample size and crops included for analysis are adequate. All categories of
farmers have been covered. However, Ch-1 largely focuses on diesel related issues
while the study relates to diesel as well as power. Hence, there is a need to maintain
a balance. In particular, issues related to power subsidy may be highlighted by
citing some literature.
6. Comments on Analysis:
The report is comprehensive and results are presented well. However, following
comments are offered to strengthen the report
(i) The analysis of the impact of escalating prices of diesel on cost of production and
net returns is carried out for paddy, basmati, cotton, sugarcane, maize, wheat and
sunflower at three price levels of diesel called different synthetic situations by the
authors.
On the other hand, impact of withdrawal of power subsidy on cost and net returns
from cultivation of above mentioned crops is analysed at one level only. For
maintaining uniformity in results, the impact of withdrawal of power subsidy on cost
and returns may also be analysed at three levels of diesel price. At the end, a
summary table providing percentage change in cost and returns after withdrawal of
diesel and power subsidy should be prepared.
(ii) There are minor typing errors like bye product for by product. There is a need to
make corrections.
The quality of the report is good and therefore, recommended for finalization after
incorporation of above points.

81
Annexure IX: ACTION TAKEN ON THE PEER REVIEWER’S COMMENTS BY
AERC, LUDHIANA
1. Comments on Research Methodology: Suggestion incorporated
2. Comments on the Analysis:
As far as simulations regarding changing diesel prices are concerned, these were
carried out to work out ‘Diesel price hike coefficient’ which is one of the major issues
often raised by the farmers as well as policy planners whenever there is change in diesel
price.
However, power subsidy withdrawal scenario was kept separate and discussed the
case with power subsidy and without power subsidy only. It’s likely withdrawal impact on
cost - returns from various crops has been appended (I to VII).
Impact of withdrawal of diesel and power subsidy on cost of production of major
crops in totality as desired has already been summarised in Table 3.4.10.
Other suggested corrections have been incorporated.
(D.K.Grover)
AERC, Ludhiana